Recensione breve del Portatile Lenovo ThinkPad T470s (7300U, FHD)
| SD Card Reader | |
| average JPG Copy Test (av. of 3 runs) | |
| Lenovo ThinkPad T470s-20HGS00V00 | |
| Lenovo ThinkPad T470-20HD002HGE | |
| Dell Latitude 7480 | |
| Lenovo ThinkPad T470s-20HF0012US | |
| Lenovo ThinkPad X1 Carbon 2017-20HQS03P00 | |
| maximum AS SSD Seq Read Test (1GB) | |
| Dell Latitude 7480 | |
| Lenovo ThinkPad T470s-20HF0012US | |
| Lenovo ThinkPad T470s-20HGS00V00 | |
| Lenovo ThinkPad T470-20HD002HGE | |
| Lenovo ThinkPad X1 Carbon 2017-20HQS03P00 | |
| |||||||||||||||||||||||||
Distribuzione della luminosità: 88 %
Al centro con la batteria: 271.6 cd/m²
Contrasto: 1132:1 (Nero: 0.24 cd/m²)
ΔE ColorChecker Calman: 6.1 | ∀{0.5-29.43 Ø4.73}
ΔE Greyscale Calman: 3.4 | ∀{0.09-98 Ø4.97}
60% sRGB (Argyll 1.6.3 3D)
38% AdobeRGB 1998 (Argyll 1.6.3 3D)
41.72% AdobeRGB 1998 (Argyll 3D)
60.3% sRGB (Argyll 3D)
40.35% Display P3 (Argyll 3D)
Gamma: 2.12
CCT: 6077 K
| Lenovo ThinkPad T470s-20HF0012US LEN40A9 (R140NWF5 R1), IPS, 14", 1920x1080 | Lenovo ThinkPad T470s-20HGS00V00 B140QAN01.5, IPS, 14", 2560x1440 | Dell Latitude 7480 LG Philips LGD0557, IPS, 14", 1920x1080 | Lenovo ThinkPad T470-20HD002HGE N140HCA-EAB, IPS, 14", 1920x1080 | Lenovo ThinkPad X1 Carbon 2017-20HQS03P00 B140HAN03_1, IPS, 14", 1920x1080 | |
|---|---|---|---|---|---|
| Display | 65% | 58% | 3% | 48% | |
| Display P3 Coverage (%) | 40.35 | 69 71% | 65.4 62% | 41.6 3% | 61.4 52% |
| sRGB Coverage (%) | 60.3 | 95.1 58% | 92.3 53% | 61.9 3% | 85.9 42% |
| AdobeRGB 1998 Coverage (%) | 41.72 | 69.6 67% | 65.8 58% | 43.06 3% | 62.4 50% |
| Response Times | -7% | -4% | -10% | -6% | |
| Response Time Grey 50% / Grey 80% * (ms) | 40.8 ? | 46.4 ? -14% | 40.8 ? -0% | 41.6 ? -2% | 41.6 ? -2% |
| Response Time Black / White * (ms) | 28.8 ? | 28.8 ? -0% | 31.2 ? -8% | 34 ? -18% | 31.6 ? -10% |
| PWM Frequency (Hz) | 219.3 ? | ||||
| Screen | 7% | 29% | -3% | 12% | |
| Brightness middle (cd/m²) | 271.6 | 327 20% | 344 27% | 306 13% | 311 15% |
| Brightness (cd/m²) | 264 | 311 18% | 321 22% | 287 9% | 288 9% |
| Brightness Distribution (%) | 88 | 88 0% | 85 -3% | 88 0% | 85 -3% |
| Black Level * (cd/m²) | 0.24 | 0.25 -4% | 0.32 -33% | 0.3 -25% | 0.24 -0% |
| Contrast (:1) | 1132 | 1308 16% | 1075 -5% | 1020 -10% | 1296 14% |
| Colorchecker dE 2000 * | 6.1 | 6.1 -0% | 2.6 57% | 6.2 -2% | 5.5 10% |
| Colorchecker dE 2000 max. * | 28.6 | 12.2 57% | 7.8 73% | 13.6 52% | 9 69% |
| Greyscale dE 2000 * | 3.4 | 8.8 -159% | 2.6 24% | 5.8 -71% | 6.2 -82% |
| Gamma | 2.12 104% | 2.18 101% | 2.28 96% | 2.04 108% | 2.02 109% |
| CCT | 6077 107% | 6172 105% | 7050 92% | 6277 104% | 5950 109% |
| Color Space (Percent of AdobeRGB 1998) (%) | 38 | 61.56 62% | 65.82 73% | 39.62 4% | 55.96 47% |
| Color Space (Percent of sRGB) (%) | 60 | 94.88 58% | 92.27 54% | 61.44 2% | 85.77 43% |
| Media totale (Programma / Settaggio) | 22% /
17% | 28% /
30% | -3% /
-3% | 18% /
17% |
* ... Meglio usare valori piccoli
Tempi di risposta del Display
| ↔ Tempi di risposta dal Nero al Bianco | ||
|---|---|---|
| 28.8 ms ... aumenta ↗ e diminuisce ↘ combinato | ↗ 14.8 ms Incremento | 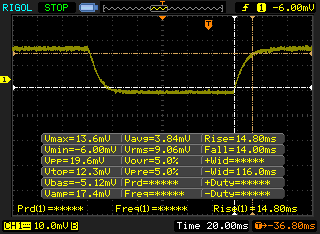 |
| ↘ 14 ms Calo | ||
| Lo schermo mostra tempi di risposta relativamente lenti nei nostri tests e potrebbe essere troppo lento per i gamers. In confronto, tutti i dispositivi di test variano da 0.1 (minimo) a 240 (massimo) ms. » 76 % di tutti i dispositivi è migliore. Questo significa che i tempi di risposta rilevati sono peggiori rispetto alla media di tutti i dispositivi testati (19.9 ms). | ||
| ↔ Tempo di risposta dal 50% Grigio all'80% Grigio | ||
| 40.8 ms ... aumenta ↗ e diminuisce ↘ combinato | ↗ 22.8 ms Incremento | 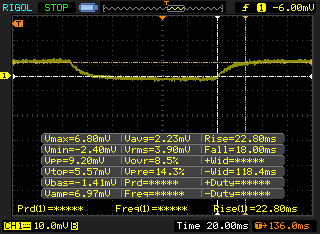 |
| ↘ 18 ms Calo | ||
| Lo schermo mostra tempi di risposta lenti nei nostri tests e sarà insoddisfacente per i gamers. In confronto, tutti i dispositivi di test variano da 0.165 (minimo) a 636 (massimo) ms. » 64 % di tutti i dispositivi è migliore. Questo significa che i tempi di risposta rilevati sono peggiori rispetto alla media di tutti i dispositivi testati (31.1 ms). | ||
Sfarfallio dello schermo / PWM (Pulse-Width Modulation)
| flickering dello schermo / PWM rilevato | 219.3 Hz | ≤ 99 % settaggio luminosita' | 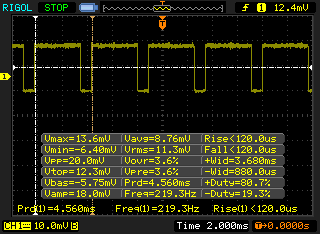 |
Il display sfarfalla a 219.3 Hz (Probabilmente a causa dell'uso di PWM) Flickering rilevato ad una luminosita' di 99 % o inferiore. Non dovrebbe verificarsi flickering o PWM sopra questo valore di luminosita'. La frequenza di 219.3 Hz è relativamente bassa, quindi gli utenti sensibili potrebbero notare il flickering ed accusare stanchezza agli occhi a questo livello di luminosità e a livelli inferiori. In confronto: 52 % di tutti i dispositivi testati non utilizza PWM per ridurre la luminosita' del display. Se è rilevato PWM, una media di 7794 (minimo: 5 - massimo: 343500) Hz è stata rilevata. | |||
| wPrime 2.10 - 1024m | |
| Dell Latitude 7480 | |
| Lenovo ThinkPad T470s-20HF0012US | |
| Lenovo ThinkPad T470s-20HGS00V00 | |
* ... Meglio usare valori piccoli
| PCMark 8 Home Score Accelerated v2 | 3987 punti | |
| PCMark 8 Creative Score Accelerated v2 | 4910 punti | |
| PCMark 8 Work Score Accelerated v2 | 4999 punti | |
Aiuto | ||
| Lenovo ThinkPad T470s-20HF0012US Samsung PM961 MZVLW256HEHP | Lenovo ThinkPad T470s-20HGS00V00 Samsung SSD PM961 1TB M.2 PCIe 3.0 x4 NVMe (MZVLW1T0) | Dell Latitude 7480 Intel SSDSCKKF256H6 | Lenovo ThinkPad T470-20HD002HGE Samsung PM961 NVMe MZVLW512HMJP | Lenovo ThinkPad X1 Carbon 2017-20HQS03P00 Samsung PM961 NVMe MZVLW512HMJP | |
|---|---|---|---|---|---|
| CrystalDiskMark 3.0 | 12% | -56% | -10% | 10% | |
| Read Seq (MB/s) | 1399 | 1760 26% | 486.5 -65% | 1155 -17% | 1827 31% |
| Write Seq (MB/s) | 1213 | 1666 37% | 418.6 -65% | 1076 -11% | 1383 14% |
| Read 512 (MB/s) | 831 | 832 0% | 354.3 -57% | 811 -2% | 814 -2% |
| Write 512 (MB/s) | 856 | 1064 24% | 306.8 -64% | 862 1% | 1098 28% |
| Read 4k (MB/s) | 60.7 | 53.2 -12% | 29.25 -52% | 55.5 -9% | 61 0% |
| Write 4k (MB/s) | 159.2 | 167.4 5% | 90.5 -43% | 134.6 -15% | 172.2 8% |
| Read 4k QD32 (MB/s) | 580 | 630 9% | 280.2 -52% | 496.2 -14% | 601 4% |
| Write 4k QD32 (MB/s) | 499.4 | 533 7% | 252.8 -49% | 425.4 -15% | 495.6 -1% |

| 3DMark | |
| 1280x720 Cloud Gate Standard Graphics | |
| Lenovo ThinkPad T470s-20HGS00V00 | |
| Lenovo ThinkPad X1 Carbon 2017-20HQS03P00 | |
| Lenovo ThinkPad T470s-20HF0012US | |
| Dell Latitude 7480 | |
| Lenovo ThinkPad T470-20HD002HGE | |
| 1920x1080 Fire Strike Graphics | |
| Lenovo ThinkPad T470s-20HGS00V00 | |
| Lenovo ThinkPad X1 Carbon 2017-20HQS03P00 | |
| Lenovo ThinkPad T470s-20HF0012US | |
| Dell Latitude 7480 | |
| Lenovo ThinkPad T470-20HD002HGE | |
| 1920x1080 Ice Storm Extreme Graphics | |
| Dell Latitude 7480 | |
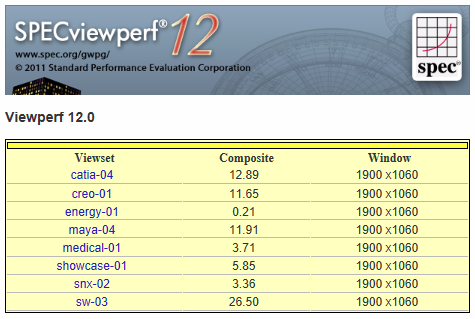
| 3DMark 06 Standard Score | 9671 punti | |
| 3DMark 11 Performance | 1741 punti | |
| 3DMark Ice Storm Standard Score | 67756 punti | |
| 3DMark Cloud Gate Standard Score | 6945 punti | |
| 3DMark Fire Strike Score | 971 punti | |
Aiuto | ||
| basso | medio | alto | ultra | |
|---|---|---|---|---|
| BioShock Infinite (2013) | 54.6 | 31.7 | 26 | 8.2 |
Rumorosità
| Idle |
| 27.8 / 27.8 / 27.8 dB(A) |
| Sotto carico |
| 34.8 / 42 dB(A) |
 | ||
30 dB silenzioso 40 dB(A) udibile 50 dB(A) rumoroso |
||
min: | ||
| Lenovo ThinkPad T470s-20HF0012US HD Graphics 620, i5-7300U, Samsung PM961 MZVLW256HEHP | Lenovo ThinkPad T470s-20HGS00V00 HD Graphics 620, i7-7600U, Samsung SSD PM961 1TB M.2 PCIe 3.0 x4 NVMe (MZVLW1T0) | Dell Latitude 7480 HD Graphics 620, i7-7600U, Intel SSDSCKKF256H6 | Lenovo ThinkPad T470-20HD002HGE HD Graphics 620, i5-7200U, Samsung PM961 NVMe MZVLW512HMJP | Lenovo ThinkPad X1 Carbon 2017-20HQS03P00 HD Graphics 620, i7-7500U, Samsung PM961 NVMe MZVLW512HMJP | |
|---|---|---|---|---|---|
| Noise | -4% | 6% | 3% | -4% | |
| off /ambiente * (dB) | 27.8 | 28.9 -4% | 28 -1% | 29.3 -5% | |
| Idle Minimum * (dB) | 27.8 | 28.9 -4% | 28.6 -3% | 28 -1% | 29.3 -5% |
| Idle Average * (dB) | 27.8 | 28.9 -4% | 28.6 -3% | 28 -1% | 29.3 -5% |
| Idle Maximum * (dB) | 27.8 | 30.1 -8% | 28.6 -3% | 29.4 -6% | 32.2 -16% |
| Load Average * (dB) | 34.8 | 39.2 -13% | 30.2 13% | 31.4 10% | 34.3 1% |
| Witcher 3 ultra * (dB) | 42 | ||||
| Load Maximum * (dB) | 42 | 39.2 7% | 31.2 26% | 34.6 18% | 39.3 6% |
* ... Meglio usare valori piccoli
(-) La temperatura massima sul lato superiore è di 45.4 °C / 114 F, rispetto alla media di 34.3 °C / 94 F, che varia da 21.2 a 62.5 °C per questa classe Office.
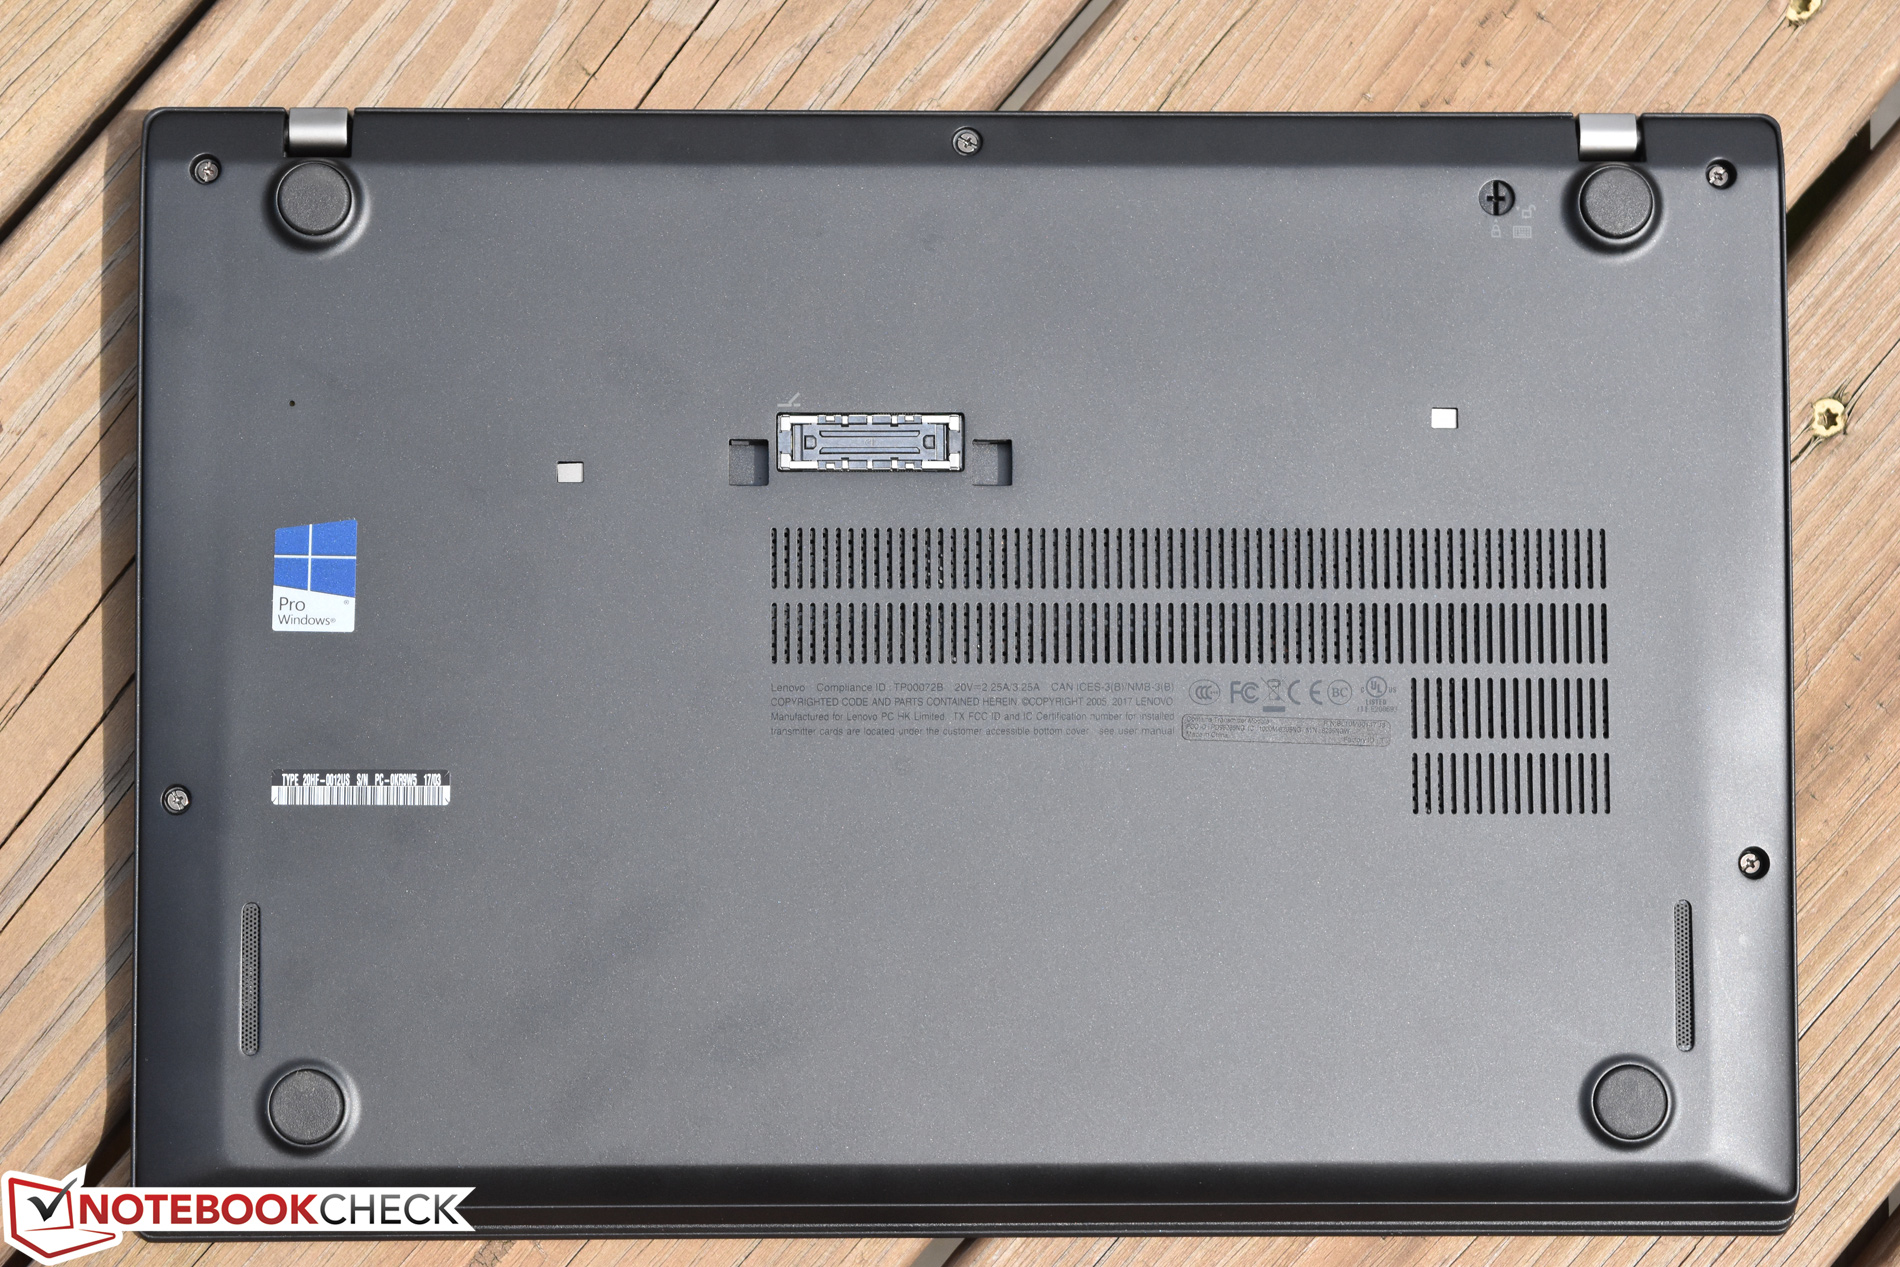
(-) Il lato inferiore si riscalda fino ad un massimo di 51.2 °C / 124 F, rispetto alla media di 36.8 °C / 98 F
(+) In idle, la temperatura media del lato superiore è di 24 °C / 75 F, rispetto alla media deld ispositivo di 29.5 °C / 85 F.
(+) I poggiapolsi e il touchpad raggiungono la temperatura massima della pelle (33.8 °C / 92.8 F) e quindi non sono caldi.
(-) La temperatura media della zona del palmo della mano di dispositivi simili e'stata di 27.5 °C / 81.5 F (-6.3 °C / -11.3 F).
Lenovo ThinkPad T470s-20HF0012US analisi audio
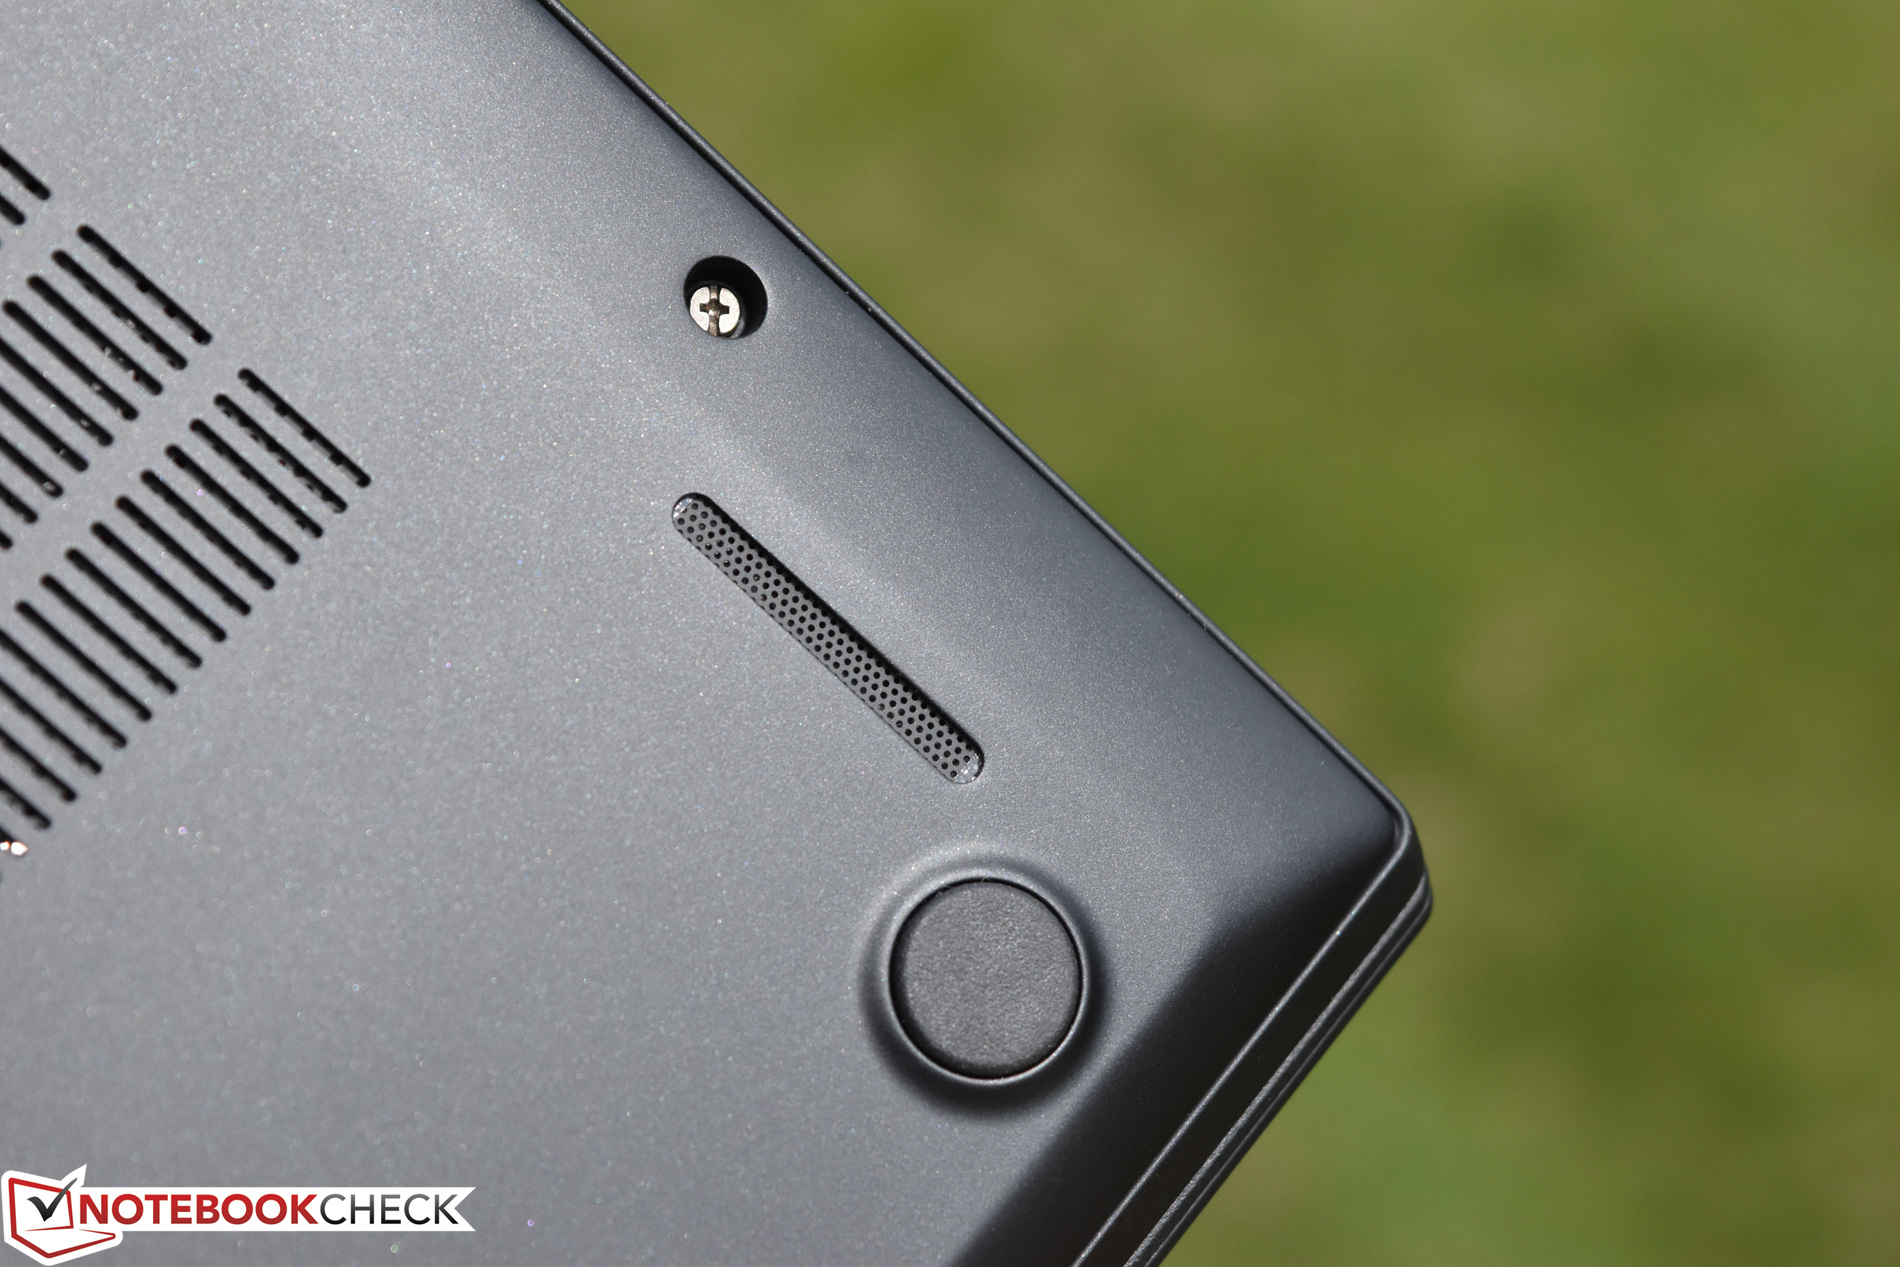
(±) | potenza degli altiparlanti media ma buona (72 dB)
Bassi 100 - 315 Hz
(-) | quasi nessun basso - in media 15.3% inferiori alla media
(±) | la linearità dei bassi è media (14.1% delta rispetto alla precedente frequenza)
Medi 400 - 2000 Hz
(+) | medi bilanciati - solo only 3.2% rispetto alla media
(±) | linearità dei medi adeguata (11% delta rispetto alla precedente frequenza)
Alti 2 - 16 kHz
(+) | Alti bilanciati - appena 4.4% dalla media
(±) | la linearità degli alti è media (12.5% delta rispetto alla precedente frequenza)
Nel complesso 100 - 16.000 Hz
(±) | la linearità complessiva del suono è media (24.8% di differenza rispetto alla media
Rispetto alla stessa classe
» 73% di tutti i dispositivi testati in questa classe è stato migliore, 7% simile, 20% peggiore
» Il migliore ha avuto un delta di 7%, medio di 21%, peggiore di 53%
Rispetto a tutti i dispositivi testati
» 76% di tutti i dispositivi testati in questa classe è stato migliore, 5% similare, 19% peggiore
» Il migliore ha avuto un delta di 4%, medio di 24%, peggiore di 134%
Dell Latitude 7480 analisi audio
(±) | potenza degli altiparlanti media ma buona (75 dB)
Bassi 100 - 315 Hz
(±) | bassi ridotti - in media 11.9% inferiori alla media
(±) | la linearità dei bassi è media (10.6% delta rispetto alla precedente frequenza)
Medi 400 - 2000 Hz
(+) | medi bilanciati - solo only 3.8% rispetto alla media
(±) | linearità dei medi adeguata (7.8% delta rispetto alla precedente frequenza)
Alti 2 - 16 kHz
(±) | alti elevati - circa 6.6% superiori alla media
(+) | alti lineari (6.3% delta rispetto alla precedente frequenza)
Nel complesso 100 - 16.000 Hz
(±) | la linearità complessiva del suono è media (23.2% di differenza rispetto alla media
Rispetto alla stessa classe
» 65% di tutti i dispositivi testati in questa classe è stato migliore, 8% simile, 28% peggiore
» Il migliore ha avuto un delta di 7%, medio di 21%, peggiore di 53%
Rispetto a tutti i dispositivi testati
» 69% di tutti i dispositivi testati in questa classe è stato migliore, 5% similare, 25% peggiore
» Il migliore ha avuto un delta di 4%, medio di 24%, peggiore di 134%
| Off / Standby | |
| Idle | |
| Sotto carico |
|
Leggenda:
min: | |
| Lenovo ThinkPad T470s-20HF0012US i5-7300U, HD Graphics 620, Samsung PM961 MZVLW256HEHP, IPS, 1920x1080, 14" | Lenovo ThinkPad T470s-20HGS00V00 i7-7600U, HD Graphics 620, Samsung SSD PM961 1TB M.2 PCIe 3.0 x4 NVMe (MZVLW1T0), IPS, 2560x1440, 14" | Dell Latitude 7480 i7-7600U, HD Graphics 620, Intel SSDSCKKF256H6, IPS, 1920x1080, 14" | Lenovo ThinkPad T470-20HD002HGE i5-7200U, HD Graphics 620, Samsung PM961 NVMe MZVLW512HMJP, IPS, 1920x1080, 14" | Lenovo ThinkPad X1 Carbon 2017-20HQS03P00 i7-7500U, HD Graphics 620, Samsung PM961 NVMe MZVLW512HMJP, IPS, 1920x1080, 14" | |
|---|---|---|---|---|---|
| Power Consumption | -15% | 16% | 19% | -3% | |
| Idle Minimum * (Watt) | 4.8 | 4.64 3% | 4.32 10% | 3.21 33% | 3.84 20% |
| Idle Average * (Watt) | 6.6 | 8.93 -35% | 6.27 5% | 6.15 7% | 6.3 5% |
| Idle Maximum * (Watt) | 7 | 9.12 -30% | 6.35 9% | 6.82 3% | 8.6 -23% |
| Load Average * (Watt) | 39.2 | 42.2 -8% | 29.82 24% | 28.5 27% | 41.9 -7% |
| Load Maximum * (Watt) | 44.8 | 47.3 -6% | 30.64 32% | 34.5 23% | 48.7 -9% |
* ... Meglio usare valori piccoli
| Lenovo ThinkPad T470s-20HF0012US i5-7300U, HD Graphics 620, 51 Wh | Lenovo ThinkPad T470s-20HGS00V00 i7-7600U, HD Graphics 620, 51 Wh | Dell Latitude 7480 i7-7600U, HD Graphics 620, 60 Wh | Lenovo ThinkPad T470-20HD002HGE i5-7200U, HD Graphics 620, 48 Wh | Lenovo ThinkPad X1 Carbon 2017-20HQS03P00 i7-7500U, HD Graphics 620, 57 Wh | |
|---|---|---|---|---|---|
| Autonomia della batteria | -28% | 35% | -24% | -6% | |
| Reader / Idle (h) | 17.7 | 13.1 -26% | 27.7 56% | 20.9 18% | |
| WiFi v1.3 (h) | 8.1 | 7 -14% | 12 48% | 7.3 -10% | 8.3 2% |
| Load (h) | 2.9 | 1.6 -45% | 2.9 0% | 1.8 -38% | 1.8 -38% |
Pro
Contro
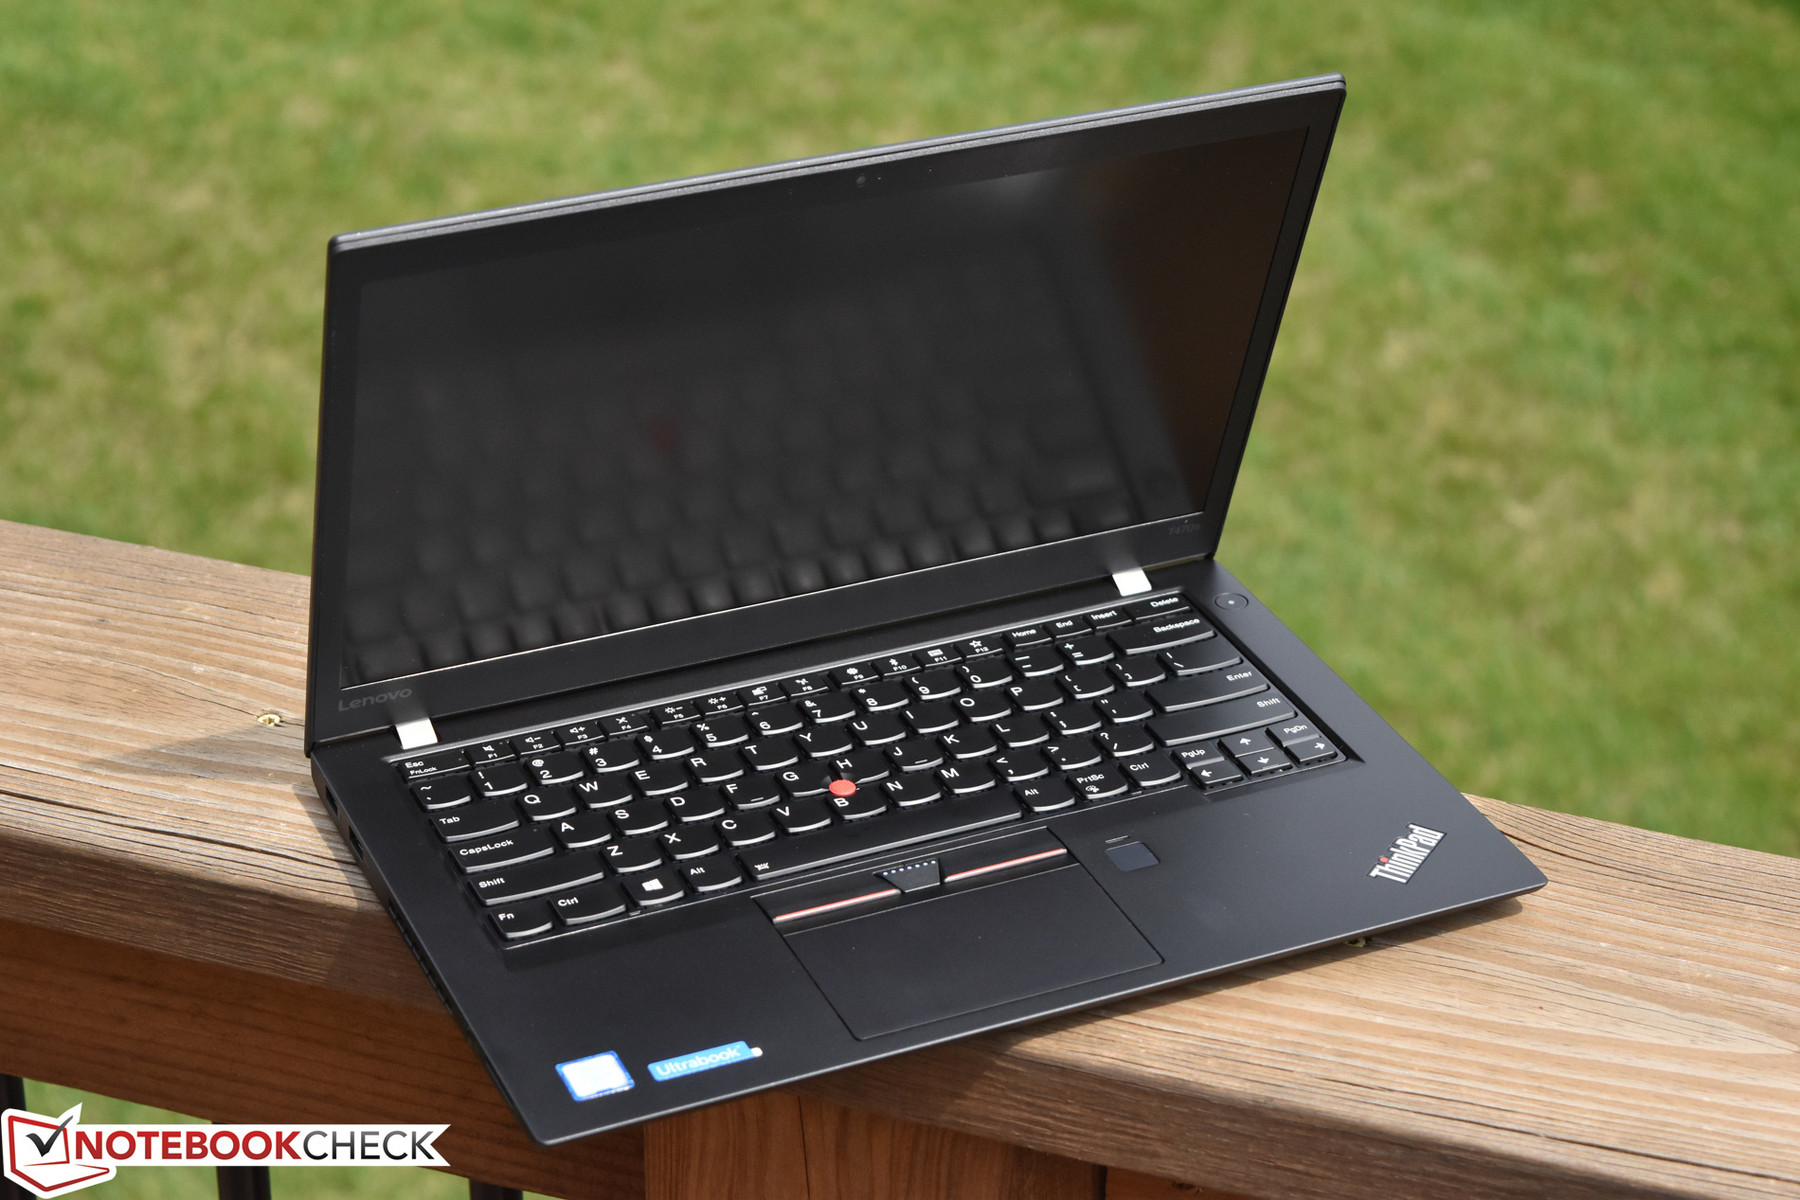
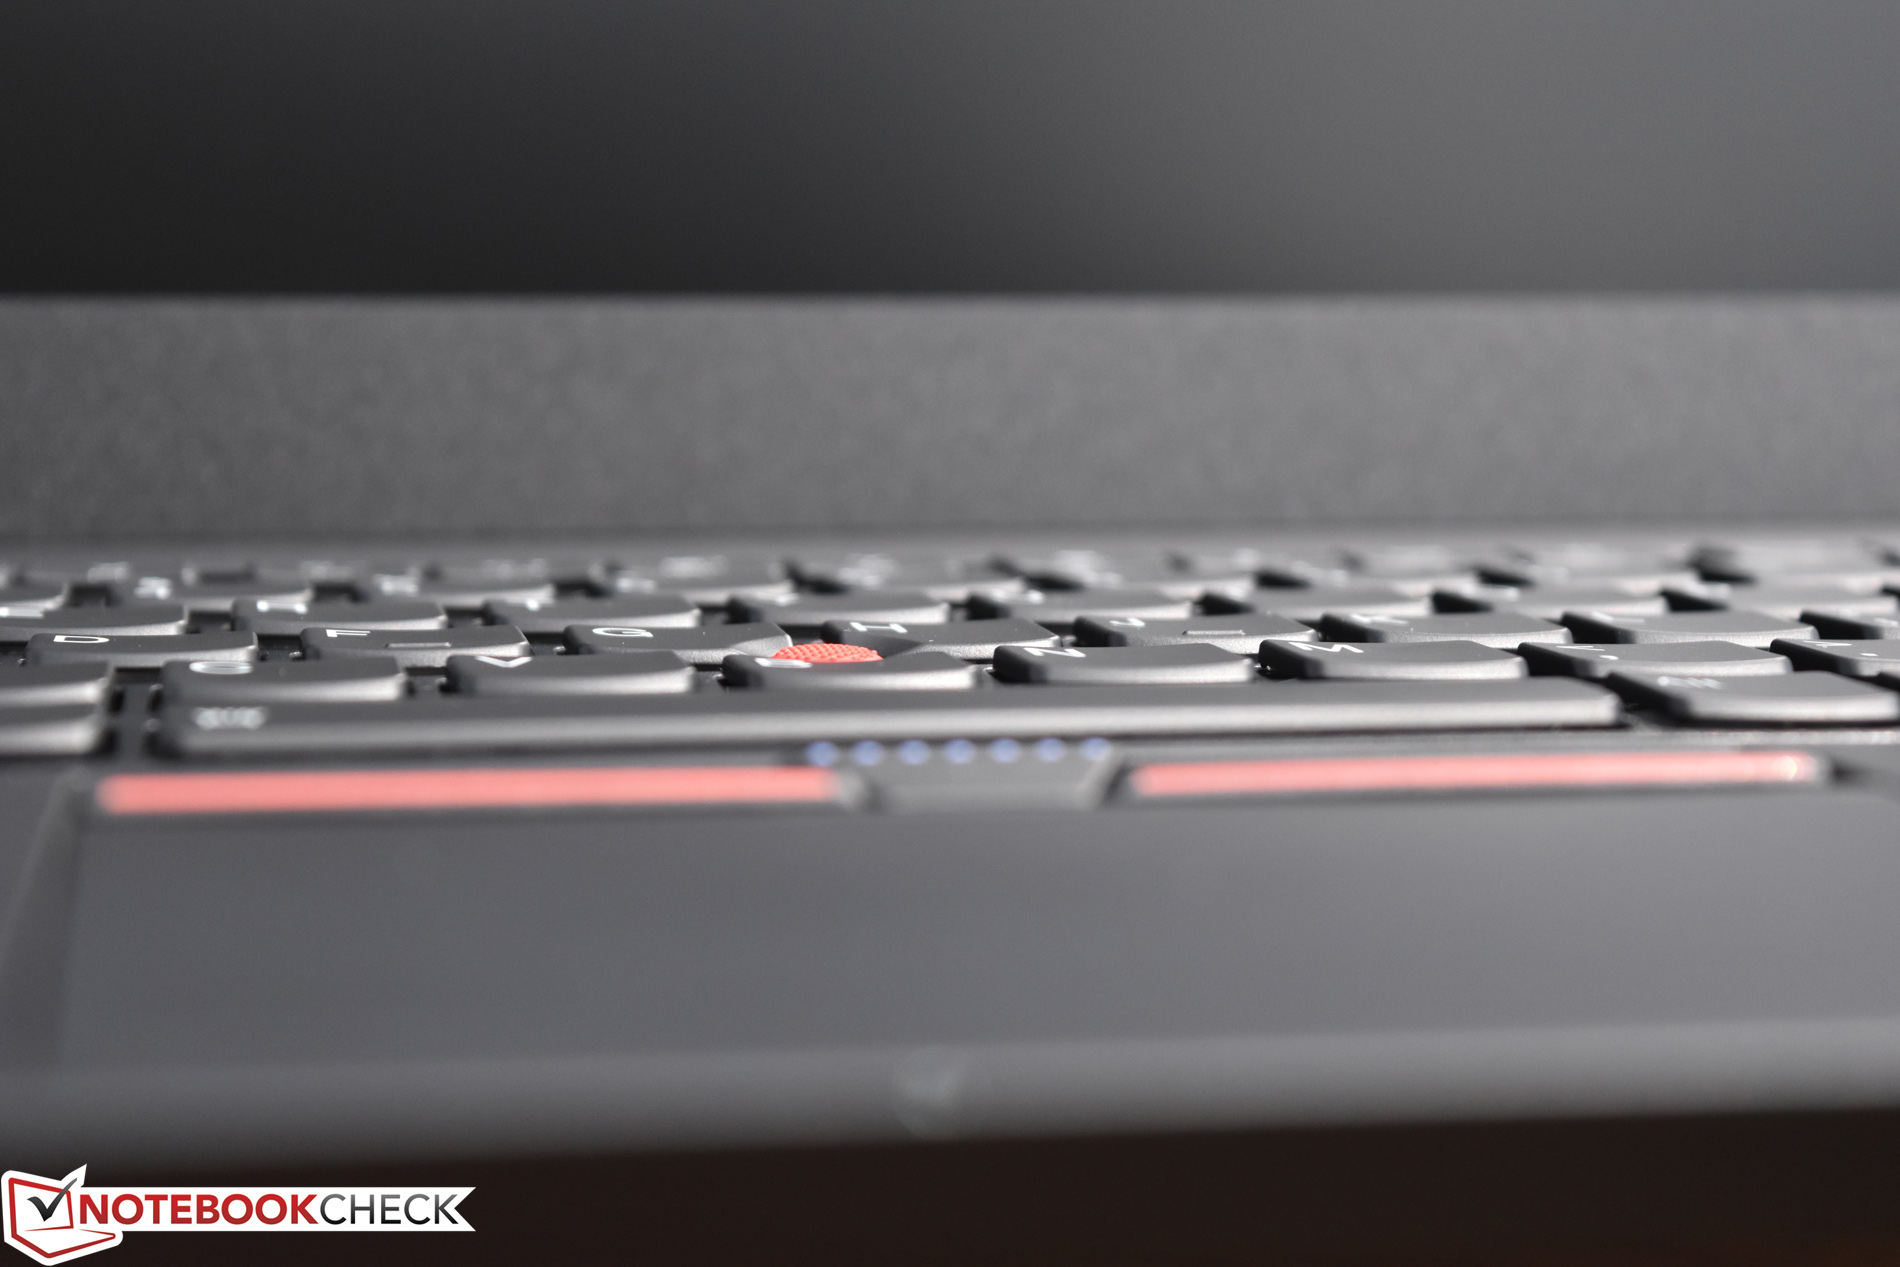
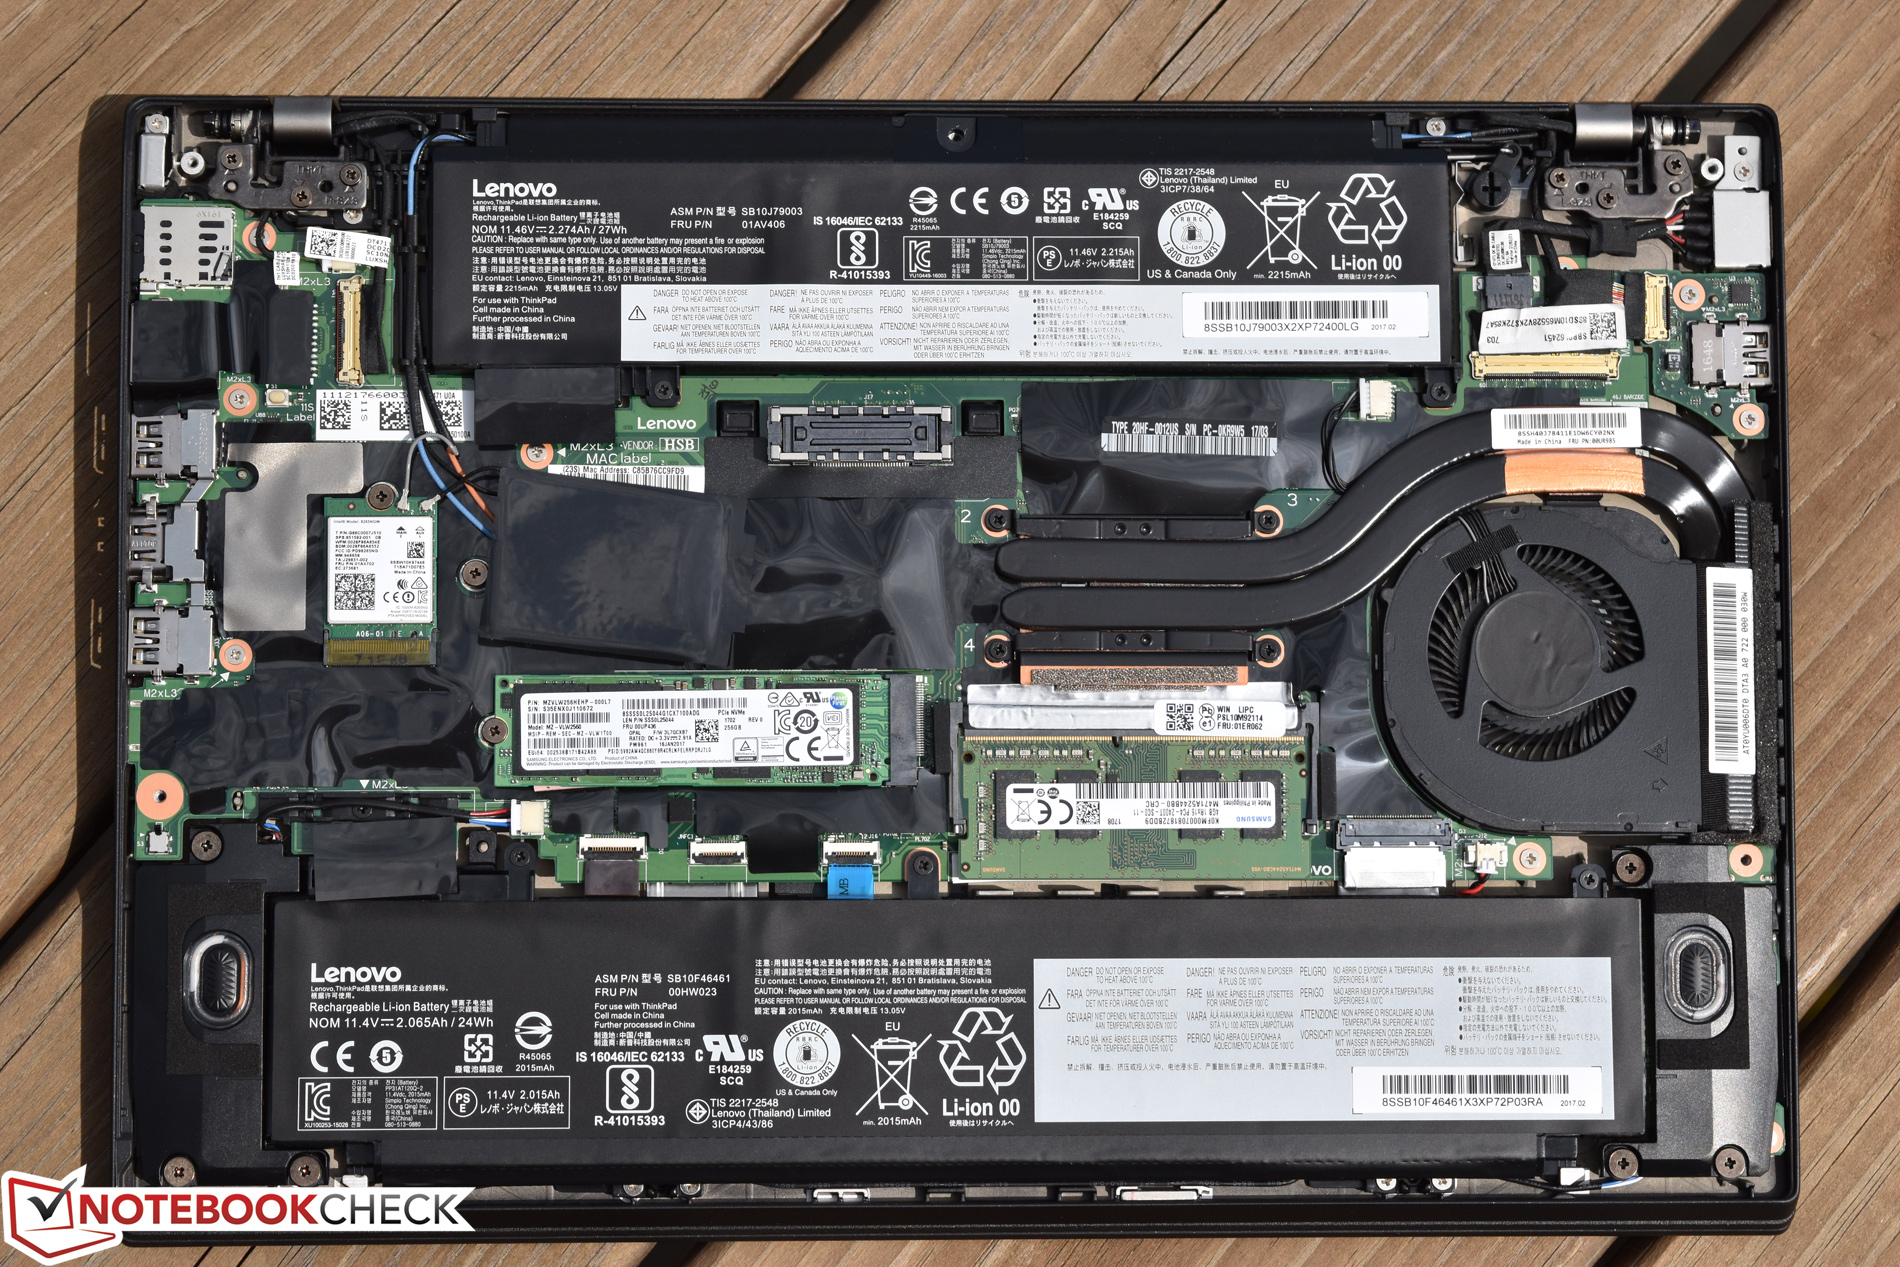
With a featherweight build that’s equal parts portable and durable (thanks to high-end magnesium and carbon fiber hybrid construction), terrific battery life, and excellent input devices for which the ThinkPad brand has long been known, the Lenovo ThinkPad T470s FHD already ought to have the attention of business professionals looking for their next daily driver. But pile onto that the blazing application performance (made possible by a very fast Samsung NVMe SSD), solid CPU performance from the Core i5 chip, and easy maintenance, and this is a difficult device to turn down.
Negatives? Yes, there are a few. For starters, the screen isn’t nearly as impressive as that of many competitors, and a considerable step down from the WQHD model not only in terms of resolution but also brightness, contrast, and color reproduction. We detected PWM at all brightness levels except maximum, which is a disappointment for a ThinkPad. And finally, the device does heat up very quickly, soon reaching bothersome case temperatures (under load), especially while in use on the lap.
Apart from the unfortunate PWM flicker, pedestrian display quality, and a bit of unwelcomed heat during heavier workloads, the Lenovo ThinkPad T470s FHD is an excellent choice.
If the user doesn’t mind a slightly lower (but still very good) battery runtime and a higher price, we’d strongly recommend taking a look at the T470s WQHD model we recently reviewed, as its display not only features better brightness and color but also does not resort to PWM to manage brightness reductions. However, the Core i5 CPU we reviewed in today’s configuration seems like a more rational investment considering the excellent performance and relative stability versus the i7 of the WQHD configuration we evaluated. The Dell Latitude 7480 is also a terrific choice—or, if budget permits, the ThinkPad X1 Carbon. But apart from the display issues, provided the user doesn’t mind a bit of heat during heavier workloads, the T470s FHD is an immediate contender for one of the best 14-inch business notebooks on the market today.
Lenovo ThinkPad T470s-20HF0012US
- 05/13/2017 v6 (old)
Steve Schardein
Price comparison
