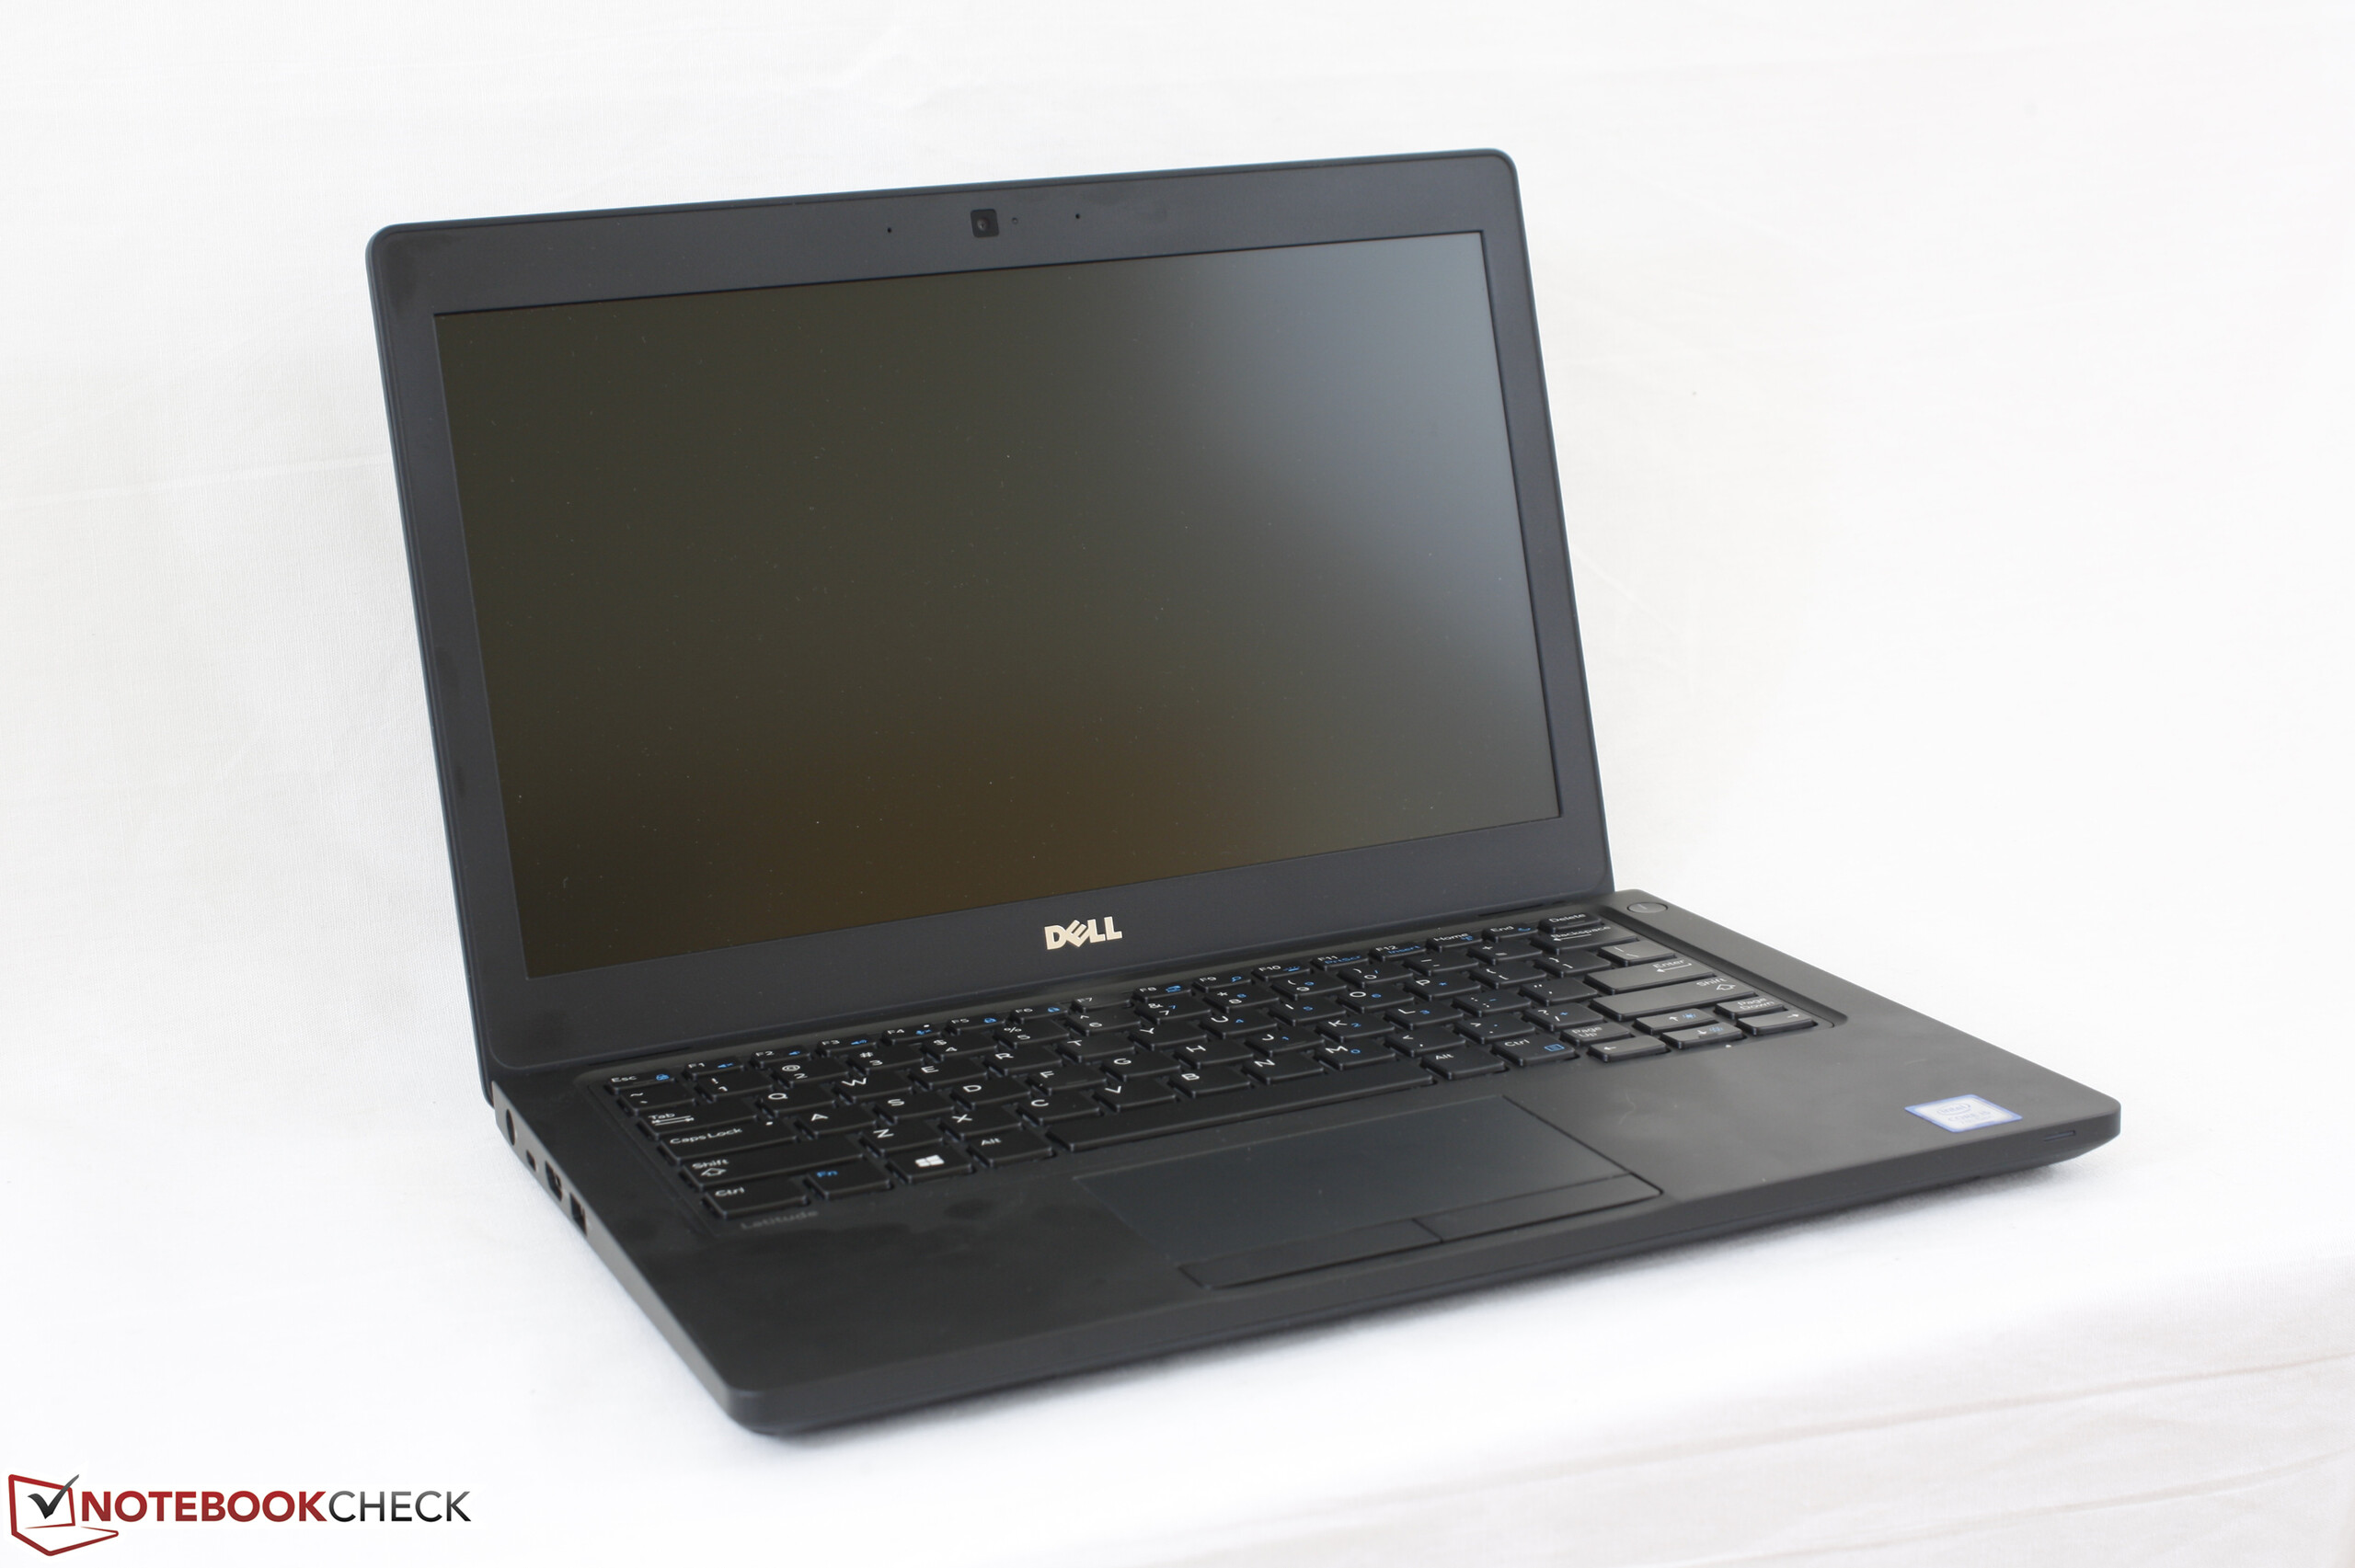
Recensione breve del Portatile Dell Latitude 5280 (7200U, HD)

| SD Card Reader | |
| average JPG Copy Test (av. of 3 runs) | |
| Lenovo ThinkPad X270-20HMS00T00 | |
| HP EliteBook 725 G4 | |
| Dell Latitude 5280 | |
| maximum AS SSD Seq Read Test (1GB) | |
| Dell Latitude 5280 | |
| Lenovo ThinkPad X270-20HMS00T00 | |
| HP EliteBook 725 G4 | |
| Networking | |
| iperf3 transmit AX12 | |
| Lenovo ThinkPad X270-20HMS00T00 | |
| Dell Latitude 5289 | |
| Dell Latitude 5280 | |
| iperf3 receive AX12 | |
| Lenovo ThinkPad X270-20HMS00T00 | |
| Dell Latitude 5280 | |
| Dell Latitude 5289 | |
| |||||||||||||||||||||||||
Distribuzione della luminosità: 90 %
Al centro con la batteria: 251.8 cd/m²
Contrasto: 336:1 (Nero: 0.75 cd/m²)
ΔE ColorChecker Calman: 11.3 | ∀{0.5-29.43 Ø4.72}
ΔE Greyscale Calman: 13.2 | ∀{0.09-98 Ø4.97}
59.2% sRGB (Argyll 1.6.3 3D)
37.6% AdobeRGB 1998 (Argyll 1.6.3 3D)
40.67% AdobeRGB 1998 (Argyll 3D)
59.2% sRGB (Argyll 3D)
39.34% Display P3 (Argyll 3D)
Gamma: 2.05
CCT: 14912 K
| Dell Latitude 5280 TN LED, 12.5", 1366x768 | Dell Latitude 5289 BOE NV12N51, IPS LED, 12.5", 1920x1080 | Lenovo ThinkPad X270-20HMS00T00 Innolux N125HCE-GN1, IPS LED, 12.5", 1920x1080 | HP EliteBook 725 G4 AU Optronics, IPS, 12.5", 1920x1080 | Dell Latitude 12 E5270 BOE05F4, TN, 12.5", 1366x768 | |
|---|---|---|---|---|---|
| Display | 9% | 12% | 24% | -1% | |
| Display P3 Coverage (%) | 39.34 | 42.79 9% | 44.6 13% 44.6 13% | 49.16 25% | 39.06 -1% |
| sRGB Coverage (%) | 59.2 | 64.3 9% | 65.9 11% 65.9 11% | 72.3 22% | 58.7 -1% |
| AdobeRGB 1998 Coverage (%) | 40.67 | 44.21 9% | 46.11 13% 46.11 13% | 50.8 25% | 40.36 -1% |
| Response Times | -17% | -14% | -8% | -6% | |
| Response Time Grey 50% / Grey 80% * (ms) | 42 ? | 42 ? -0% | 40.8 ? 3% | 47 ? -12% | 45.2 ? -8% |
| Response Time Black / White * (ms) | 23.2 ? | 31 ? -34% | 30.4 ? -31% | 24 ? -3% | 24 ? -3% |
| PWM Frequency (Hz) | 531 ? | 26040 ? | 1000 ? | ||
| Screen | 55% | 49% | 81% | 9% | |
| Brightness middle (cd/m²) | 251.8 | 336 33% | 283 12% | 329 31% | 161 -36% |
| Brightness (cd/m²) | 246 | 320 30% | 281 14% | 310 26% | 152 -38% |
| Brightness Distribution (%) | 90 | 90 0% | 94 4% | 88 -2% | 90 0% |
| Black Level * (cd/m²) | 0.75 | 0.34 55% | 0.25 67% | 0.19 75% | 0.29 61% |
| Contrast (:1) | 336 | 988 194% | 1132 237% | 1732 415% | 555 65% |
| Colorchecker dE 2000 * | 11.3 | 3.45 69% | 6.1 46% | 2.69 76% | 10.31 9% |
| Colorchecker dE 2000 max. * | 23.1 | 7.95 66% | 15.4 33% | 4.47 81% | 18.58 20% |
| Greyscale dE 2000 * | 13.2 | 1.68 87% | 6 55% | 4.23 68% | 11.3 14% |
| Gamma | 2.05 107% | 2.49 88% | 2.05 107% | 2.21 100% | 2.57 86% |
| CCT | 14912 44% | 6782 96% | 6832 95% | 6011 108% | 13574 48% |
| Color Space (Percent of AdobeRGB 1998) (%) | 37.6 | 41 9% | 42.26 12% | 46 22% | 37.32 -1% |
| Color Space (Percent of sRGB) (%) | 59.2 | 64 8% | 65.43 11% | 72 22% | 58.82 -1% |
| Media totale (Programma / Settaggio) | 16% /
36% | 16% /
30% | 32% /
58% | 1% /
5% |
* ... Meglio usare valori piccoli
Tempi di risposta del Display
| ↔ Tempi di risposta dal Nero al Bianco | ||
|---|---|---|
| 23.2 ms ... aumenta ↗ e diminuisce ↘ combinato | ↗ 17.2 ms Incremento | 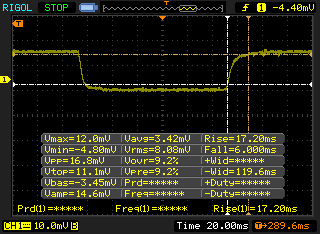 |
| ↘ 6 ms Calo | ||
| Lo schermo mostra buoni tempi di risposta durante i nostri tests, ma potrebbe essere troppo lento per i gamers competitivi. In confronto, tutti i dispositivi di test variano da 0.1 (minimo) a 240 (massimo) ms. » 53 % di tutti i dispositivi è migliore. Questo significa che i tempi di risposta rilevati sono peggiori rispetto alla media di tutti i dispositivi testati (19.8 ms). | ||
| ↔ Tempo di risposta dal 50% Grigio all'80% Grigio | ||
| 42 ms ... aumenta ↗ e diminuisce ↘ combinato | ↗ 21.2 ms Incremento | 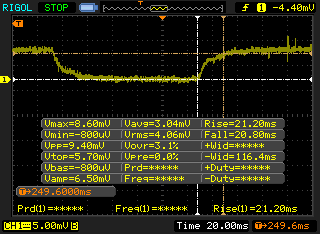 |
| ↘ 20.8 ms Calo | ||
| Lo schermo mostra tempi di risposta lenti nei nostri tests e sarà insoddisfacente per i gamers. In confronto, tutti i dispositivi di test variano da 0.165 (minimo) a 636 (massimo) ms. » 67 % di tutti i dispositivi è migliore. Questo significa che i tempi di risposta rilevati sono peggiori rispetto alla media di tutti i dispositivi testati (31 ms). | ||
Sfarfallio dello schermo / PWM (Pulse-Width Modulation)
| flickering dello schermo / PWM non rilevato | 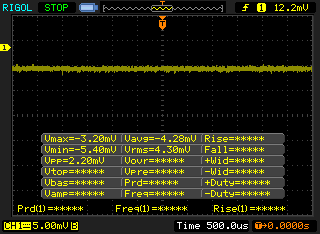 | ||
In confronto: 52 % di tutti i dispositivi testati non utilizza PWM per ridurre la luminosita' del display. Se è rilevato PWM, una media di 7769 (minimo: 5 - massimo: 343500) Hz è stata rilevata. | |||
| wPrime 2.10 - 1024m | |
| Lenovo Thinkpad 13-20J1001BUS | |
| Dell Latitude E7470 N001LE747014EMEA | |
| Dell Latitude 7280 | |
| HP EliteBook 725 G4 | |
| Dell Latitude 5580 | |
| Dell Latitude 5280 | |
| Lenovo ThinkPad T470s-20HF0012US | |
* ... Meglio usare valori piccoli
| PCMark 8 | |
| Home Score Accelerated v2 | |
| Lenovo ThinkPad X270-20HMS00T00 | |
| Dell Latitude 5289 | |
| Dell Latitude 5280 | |
| Dell Latitude 12 E5270 | |
| HP EliteBook 725 G4 | |
| Work Score Accelerated v2 | |
| Dell Latitude 5289 | |
| Lenovo ThinkPad X270-20HMS00T00 | |
| Dell Latitude 5280 | |
| Dell Latitude 12 E5270 | |
| HP EliteBook 725 G4 | |
| Creative Score Accelerated v2 | |
| Dell Latitude 5280 | |
| Dell Latitude 12 E5270 | |
| HP EliteBook 725 G4 | |
| PCMark 8 Home Score Accelerated v2 | 3409 punti | |
| PCMark 8 Creative Score Accelerated v2 | 3928 punti | |
| PCMark 8 Work Score Accelerated v2 | 4365 punti | |
Aiuto | ||
| Dell Latitude 5280 Toshiba MQ01ACF050 | Dell Latitude 5289 SanDisk X400 256GB, SATA (SD8SB8U-256G) | Lenovo ThinkPad X270-20HMS00T00 Toshiba NVMe THNSF5512GPUK | HP EliteBook 725 G4 Samsung PM961 MZVLW256HEHP | Dell Latitude 12 E5270 Seagate ST500LM021-1KJ15 | |
|---|---|---|---|---|---|
| CrystalDiskMark 3.0 | 9086% | 18752% | 6641% | -1% | |
| Read Seq (MB/s) | 107.5 | 423.7 294% | 1190 1007% | 1963 1726% | 113.8 6% |
| Write Seq (MB/s) | 95.3 | 406.4 326% | 985 934% | 1409 1378% | 108.5 14% |
| Read 512 (MB/s) | 31.13 | 260.8 738% | 858 2656% | 949 2949% | 24.9 -20% |
| Write 512 (MB/s) | 45.49 | 255.6 462% | 528 1061% | 890 1856% | 51.9 14% |
| Read 4k (MB/s) | 0.357 | 22.73 6267% | 35.27 9780% | 29.75 8233% | 0.398 11% |
| Write 4k (MB/s) | 0.827 | 27.92 3276% | 124.5 14954% | 47.35 5626% | 0.654 -21% |
| Read 4k QD32 (MB/s) | 0.737 | 306.2 41447% | 495.3 67105% | 139.7 18855% | 0.798 8% |
| Write 4k QD32 (MB/s) | 0.795 | 158.8 19875% | 418.3 52516% | 100.2 12504% | 0.636 -20% |

| 3DMark 11 | |
| 1280x720 Performance GPU | |
| Intel Skull Canyon NUC6i7KYK | |
| Dell Latitude 7480 | |
| Acer Swift 3 SF314-51-731X | |
| Dell Latitude 5280 | |
| Dell Latitude 5580 | |
| Dell XPS 13 9365-4537 2-in-1 | |
| Lenovo Yoga 900S-12ISK-80ML | |
| 1280x720 Performance Combined | |
| Intel Skull Canyon NUC6i7KYK | |
| Dell Latitude 7480 | |
| Acer Swift 3 SF314-51-731X | |
| Dell XPS 13 9365-4537 2-in-1 | |
| Dell Latitude 5280 | |
| Dell Latitude 5580 | |
| Lenovo Yoga 900S-12ISK-80ML | |
| 3DMark | |
| 1280x720 Cloud Gate Standard Graphics | |
| Intel Skull Canyon NUC6i7KYK | |
| Dell Latitude 7480 | |
| Acer Swift 3 SF314-51-731X | |
| Dell Latitude 5280 | |
| Dell Latitude 5580 | |
| Lenovo Yoga 900S-12ISK-80ML | |
| 1920x1080 Fire Strike Graphics | |
| Intel Skull Canyon NUC6i7KYK | |
| Dell Latitude 7480 | |
| Dell Latitude 5280 | |
| Dell Latitude 5580 | |
| Lenovo Yoga 900S-12ISK-80ML | |
| 1920x1080 Ice Storm Extreme Graphics | |
| Intel Skull Canyon NUC6i7KYK | |
| Dell Latitude 7480 | |
| Dell Latitude 5280 | |
| Dell Latitude 5580 | |
| Lenovo Yoga 900S-12ISK-80ML | |
| 3DMark 11 Performance | 1378 punti | |
| 3DMark Ice Storm Standard Score | 49846 punti | |
| 3DMark Cloud Gate Standard Score | 5281 punti | |
| 3DMark Fire Strike Score | 633 punti | |
Aiuto | ||
| basso | medio | alto | ultra | |
|---|---|---|---|---|
| BioShock Infinite (2013) | 29.9 | 20.9 | 18 | |
| Rise of the Tomb Raider (2016) | 14 |
Rumorosità
| Idle |
| 32.6 / 32.7 / 32.7 dB(A) |
| HDD |
| 33 dB(A) |
| Sotto carico |
| 33.4 / 37 dB(A) |
 | ||
30 dB silenzioso 40 dB(A) udibile 50 dB(A) rumoroso |
||
min: | ||
| Dell Latitude 5280 HD Graphics 620, i5-7200U, Toshiba MQ01ACF050 | Dell Latitude 5289 HD Graphics 620, i5-7300U, SanDisk X400 256GB, SATA (SD8SB8U-256G) | Lenovo ThinkPad X270-20HMS00T00 HD Graphics 620, i5-7200U, Toshiba NVMe THNSF5512GPUK | HP EliteBook 725 G4 Radeon R7 (Bristol Ridge), PRO A12-9800B, Samsung PM961 MZVLW256HEHP | Dell Latitude 12 E5270 HD Graphics 520, 6300U, Seagate ST500LM021-1KJ15 | |
|---|---|---|---|---|---|
| Noise | 1% | 3% | 4% | -1% | |
| off /ambiente * (dB) | 27.6 | 30.5 -11% | 29 -5% | 30.4 -10% | 29.2 -6% |
| Idle Minimum * (dB) | 32.6 | 30.5 6% | 29 11% | 30.4 7% | 32.9 -1% |
| Idle Average * (dB) | 32.7 | 30.5 7% | 29 11% | 30.4 7% | 32.9 -1% |
| Idle Maximum * (dB) | 32.7 | 30.5 7% | 30.4 7% | 30.4 7% | 32.9 -1% |
| Load Average * (dB) | 33.4 | 36 -8% | 34.1 -2% | 31.7 5% | 33.7 -1% |
| Load Maximum * (dB) | 37 | 34.6 6% | 37.6 -2% | 34.4 7% | 34.9 6% |
* ... Meglio usare valori piccoli
(-) La temperatura massima sul lato superiore è di 48.4 °C / 119 F, rispetto alla media di 35.9 °C / 97 F, che varia da 21.4 a 59 °C per questa classe Subnotebook.
(-) Il lato inferiore si riscalda fino ad un massimo di 49.2 °C / 121 F, rispetto alla media di 39.2 °C / 103 F
(+) In idle, la temperatura media del lato superiore è di 25 °C / 77 F, rispetto alla media deld ispositivo di 30.8 °C / 87 F.
(+) I poggiapolsi e il touchpad sono piu' freddi della temperatura della pelle con un massimo di 28.4 °C / 83.1 F e sono quindi freddi al tatto.
(±) La temperatura media della zona del palmo della mano di dispositivi simili e'stata di 28.2 °C / 82.8 F (-0.2 °C / -0.3 F).
Dell Latitude 5280 analisi audio
(±) | potenza degli altiparlanti media ma buona (81.1 dB)
Bassi 100 - 315 Hz
(-) | quasi nessun basso - in media 20.2% inferiori alla media
(±) | la linearità dei bassi è media (12.4% delta rispetto alla precedente frequenza)
Medi 400 - 2000 Hz
(+) | medi bilanciati - solo only 4% rispetto alla media
(±) | linearità dei medi adeguata (9.5% delta rispetto alla precedente frequenza)
Alti 2 - 16 kHz
(±) | alti elevati - circa 5.8% superiori alla media
(±) | la linearità degli alti è media (9.8% delta rispetto alla precedente frequenza)
Nel complesso 100 - 16.000 Hz
(±) | la linearità complessiva del suono è media (25.4% di differenza rispetto alla media
Rispetto alla stessa classe
» 85% di tutti i dispositivi testati in questa classe è stato migliore, 3% simile, 11% peggiore
» Il migliore ha avuto un delta di 5%, medio di 18%, peggiore di 53%
Rispetto a tutti i dispositivi testati
» 78% di tutti i dispositivi testati in questa classe è stato migliore, 5% similare, 17% peggiore
» Il migliore ha avuto un delta di 4%, medio di 24%, peggiore di 134%
Apple MacBook 12 (Early 2016) 1.1 GHz analisi audio
(+) | gli altoparlanti sono relativamente potenti (83.6 dB)
Bassi 100 - 315 Hz
(±) | bassi ridotti - in media 11.3% inferiori alla media
(±) | la linearità dei bassi è media (14.2% delta rispetto alla precedente frequenza)
Medi 400 - 2000 Hz
(+) | medi bilanciati - solo only 2.4% rispetto alla media
(+) | medi lineari (5.5% delta rispetto alla precedente frequenza)
Alti 2 - 16 kHz
(+) | Alti bilanciati - appena 2% dalla media
(+) | alti lineari (4.5% delta rispetto alla precedente frequenza)
Nel complesso 100 - 16.000 Hz
(+) | suono nel complesso lineare (10.2% differenza dalla media)
Rispetto alla stessa classe
» 7% di tutti i dispositivi testati in questa classe è stato migliore, 2% simile, 91% peggiore
» Il migliore ha avuto un delta di 5%, medio di 18%, peggiore di 53%
Rispetto a tutti i dispositivi testati
» 5% di tutti i dispositivi testati in questa classe è stato migliore, 1% similare, 94% peggiore
» Il migliore ha avuto un delta di 4%, medio di 24%, peggiore di 134%
| Off / Standby | |
| Idle | |
| Sotto carico |
|
Leggenda:
min: | |
| Dell Latitude 5280 i5-7200U, HD Graphics 620, Toshiba MQ01ACF050, TN LED, 1366x768, 12.5" | Dell Latitude 5289 i5-7300U, HD Graphics 620, SanDisk X400 256GB, SATA (SD8SB8U-256G), IPS LED, 1920x1080, 12.5" | Lenovo ThinkPad X270-20HMS00T00 i5-7200U, HD Graphics 620, Toshiba NVMe THNSF5512GPUK, IPS LED, 1920x1080, 12.5" | HP EliteBook 725 G4 PRO A12-9800B, Radeon R7 (Bristol Ridge), Samsung PM961 MZVLW256HEHP, IPS, 1920x1080, 12.5" | Dell Latitude 12 E5270 6300U, HD Graphics 520, Seagate ST500LM021-1KJ15, TN, 1366x768, 12.5" | |
|---|---|---|---|---|---|
| Power Consumption | 12% | -1% | 0% | 2% | |
| Idle Minimum * (Watt) | 5.7 | 2.7 53% | 3.5 39% | 4.5 21% | 3.9 32% |
| Idle Average * (Watt) | 6.9 | 5.1 26% | 5.8 16% | 6.3 9% | 6 13% |
| Idle Maximum * (Watt) | 7.1 | 7.6 -7% | 7.6 -7% | 8.3 -17% | 6.6 7% |
| Load Average * (Watt) | 28.3 | 33 -17% | 33.2 -17% | 27.6 2% | 28.9 -2% |
| Load Maximum * (Watt) | 30.2 | 29 4% | 40.4 -34% | 34.5 -14% | 41.7 -38% |
* ... Meglio usare valori piccoli
| Dell Latitude 5280 i5-7200U, HD Graphics 620, 51 Wh | Dell Latitude 5289 i5-7300U, HD Graphics 620, 60 Wh | Lenovo ThinkPad X270-20HMS00T00 i5-7200U, HD Graphics 620, 46 Wh | HP EliteBook 725 G4 PRO A12-9800B, Radeon R7 (Bristol Ridge), 49 Wh | Dell Latitude 12 E5270 6300U, HD Graphics 520, 47 Wh | |
|---|---|---|---|---|---|
| Autonomia della batteria | 36% | -22% | -22% | -18% | |
| Reader / Idle (h) | 18.5 | 28.8 56% | 17.1 -8% | 11.7 -37% | 12.9 -30% |
| WiFi v1.3 (h) | 7.8 | 11.8 51% | 5.4 -31% | 6.3 -19% | 6.6 -15% |
| Load (h) | 2.3 | 2.3 0% | 1.7 -26% | 2.1 -9% | 2.1 -9% |
Pro
Contro
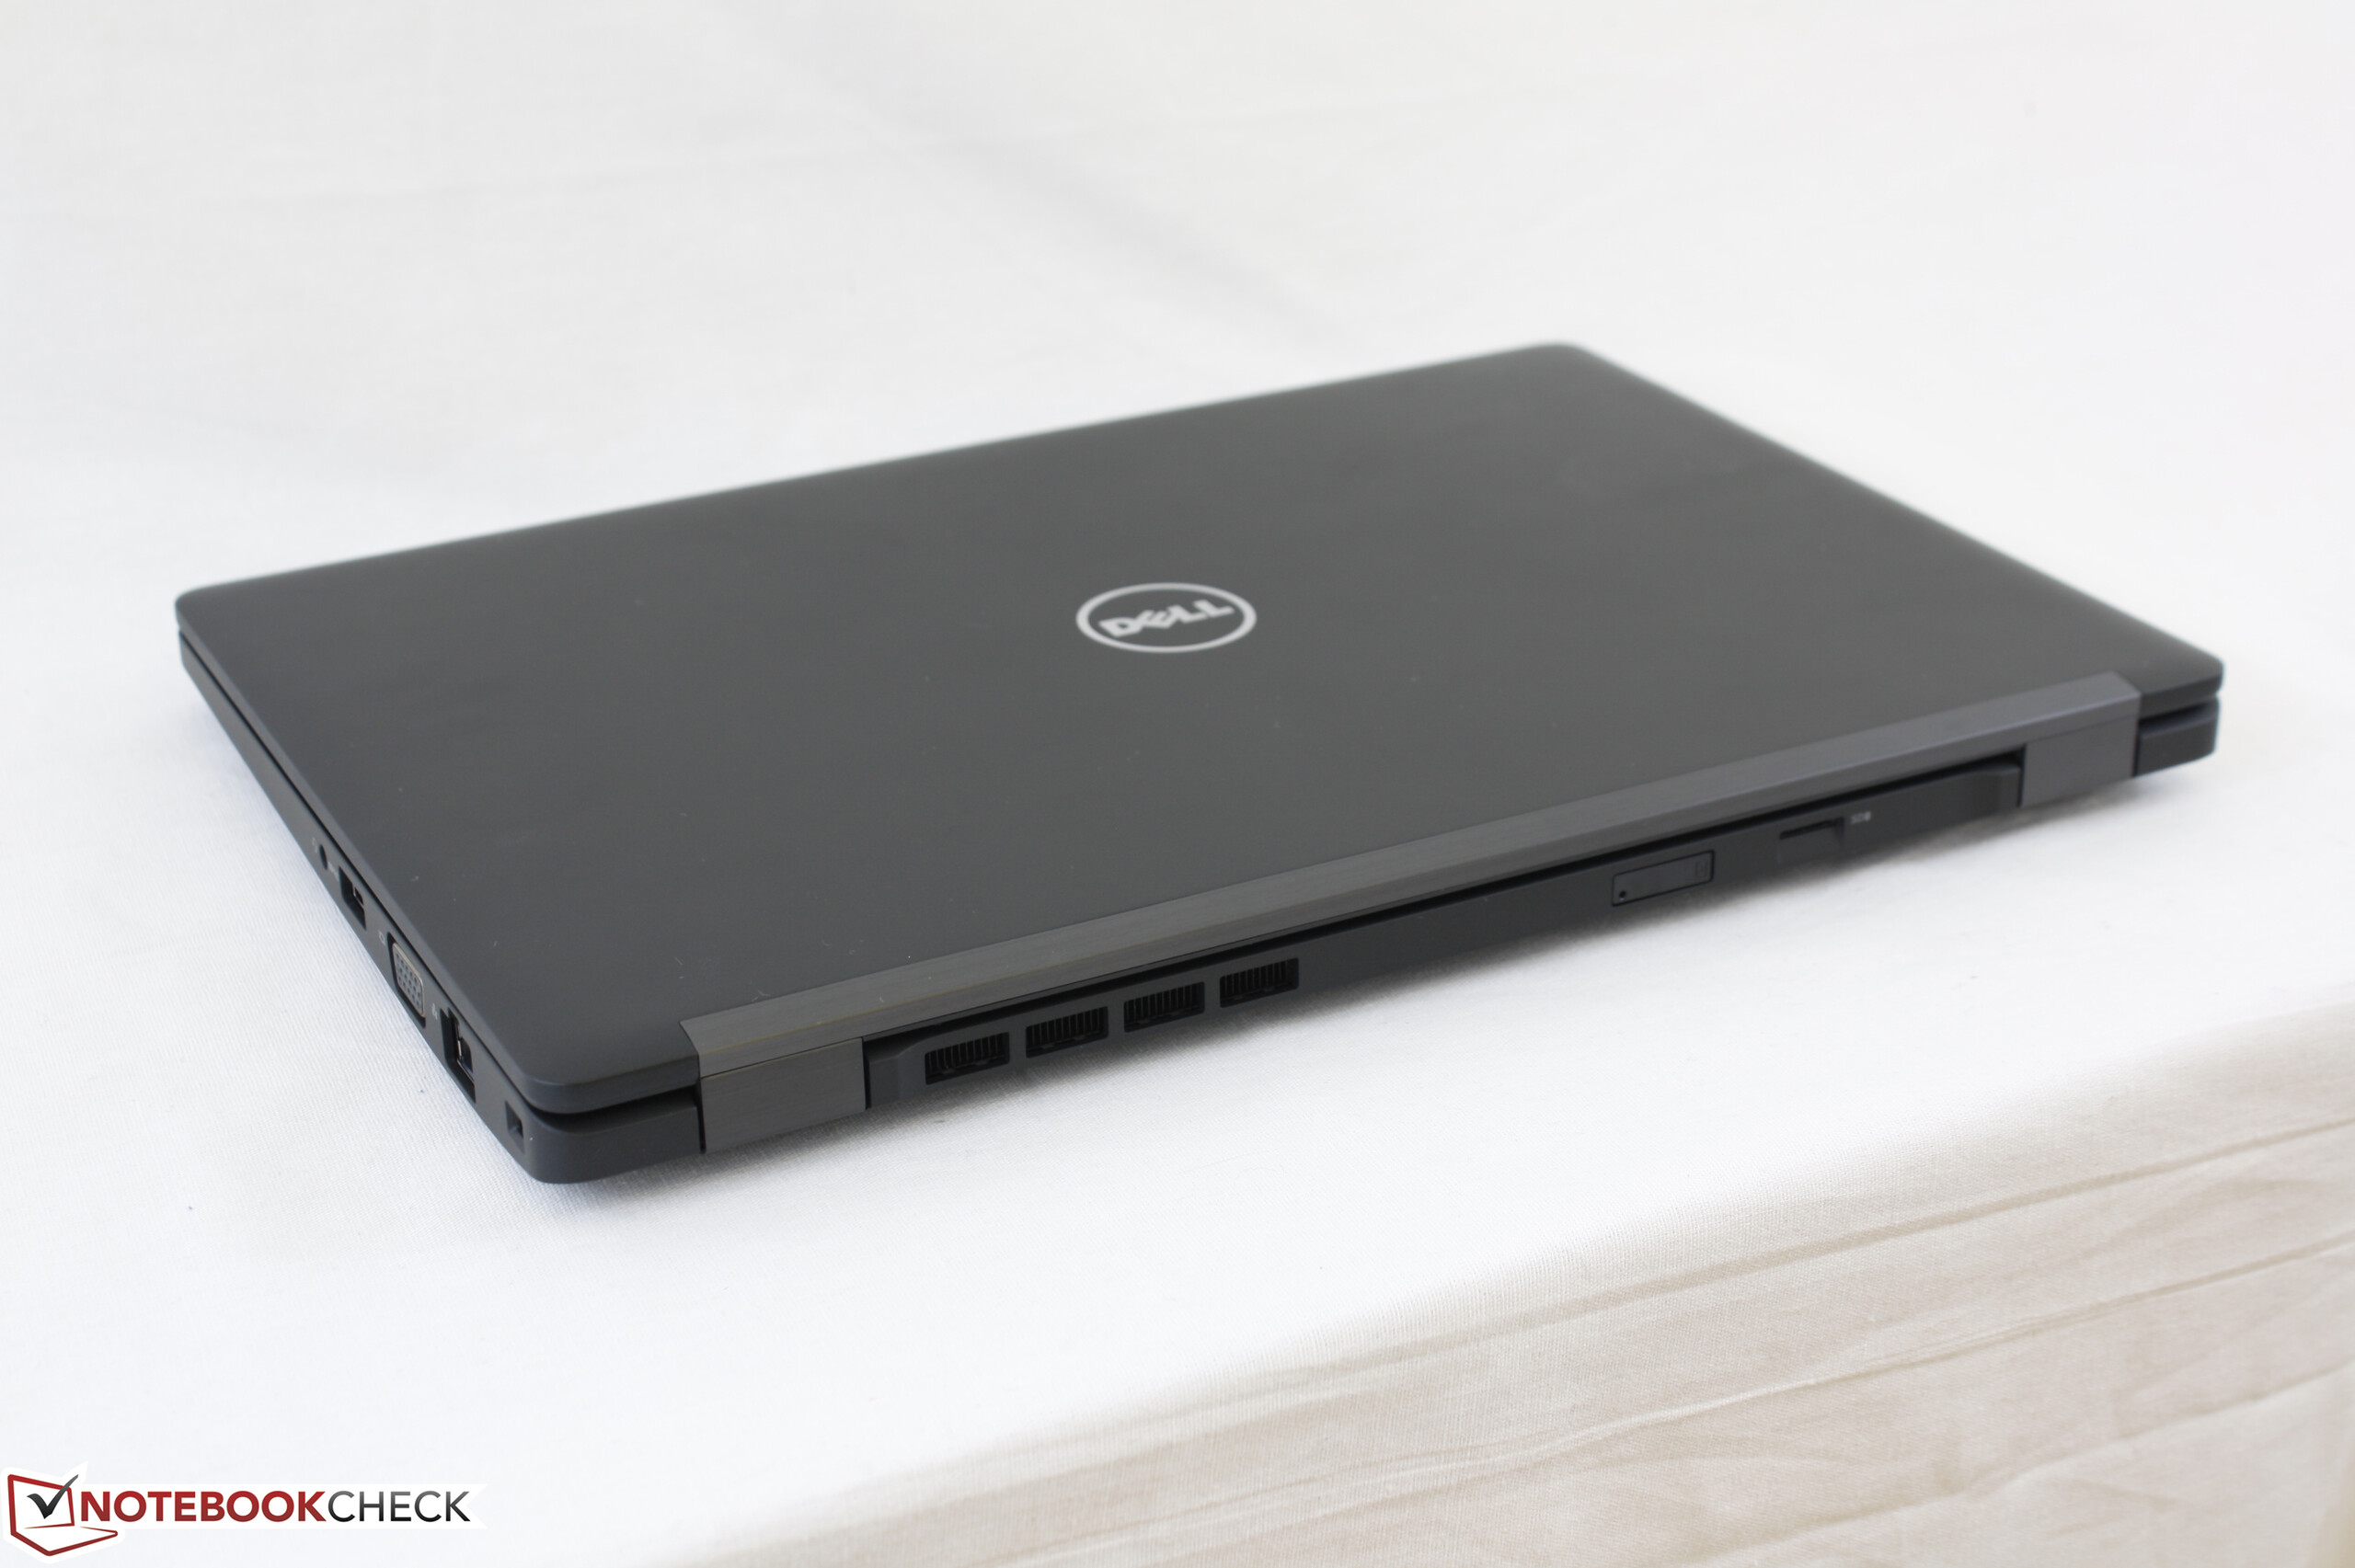
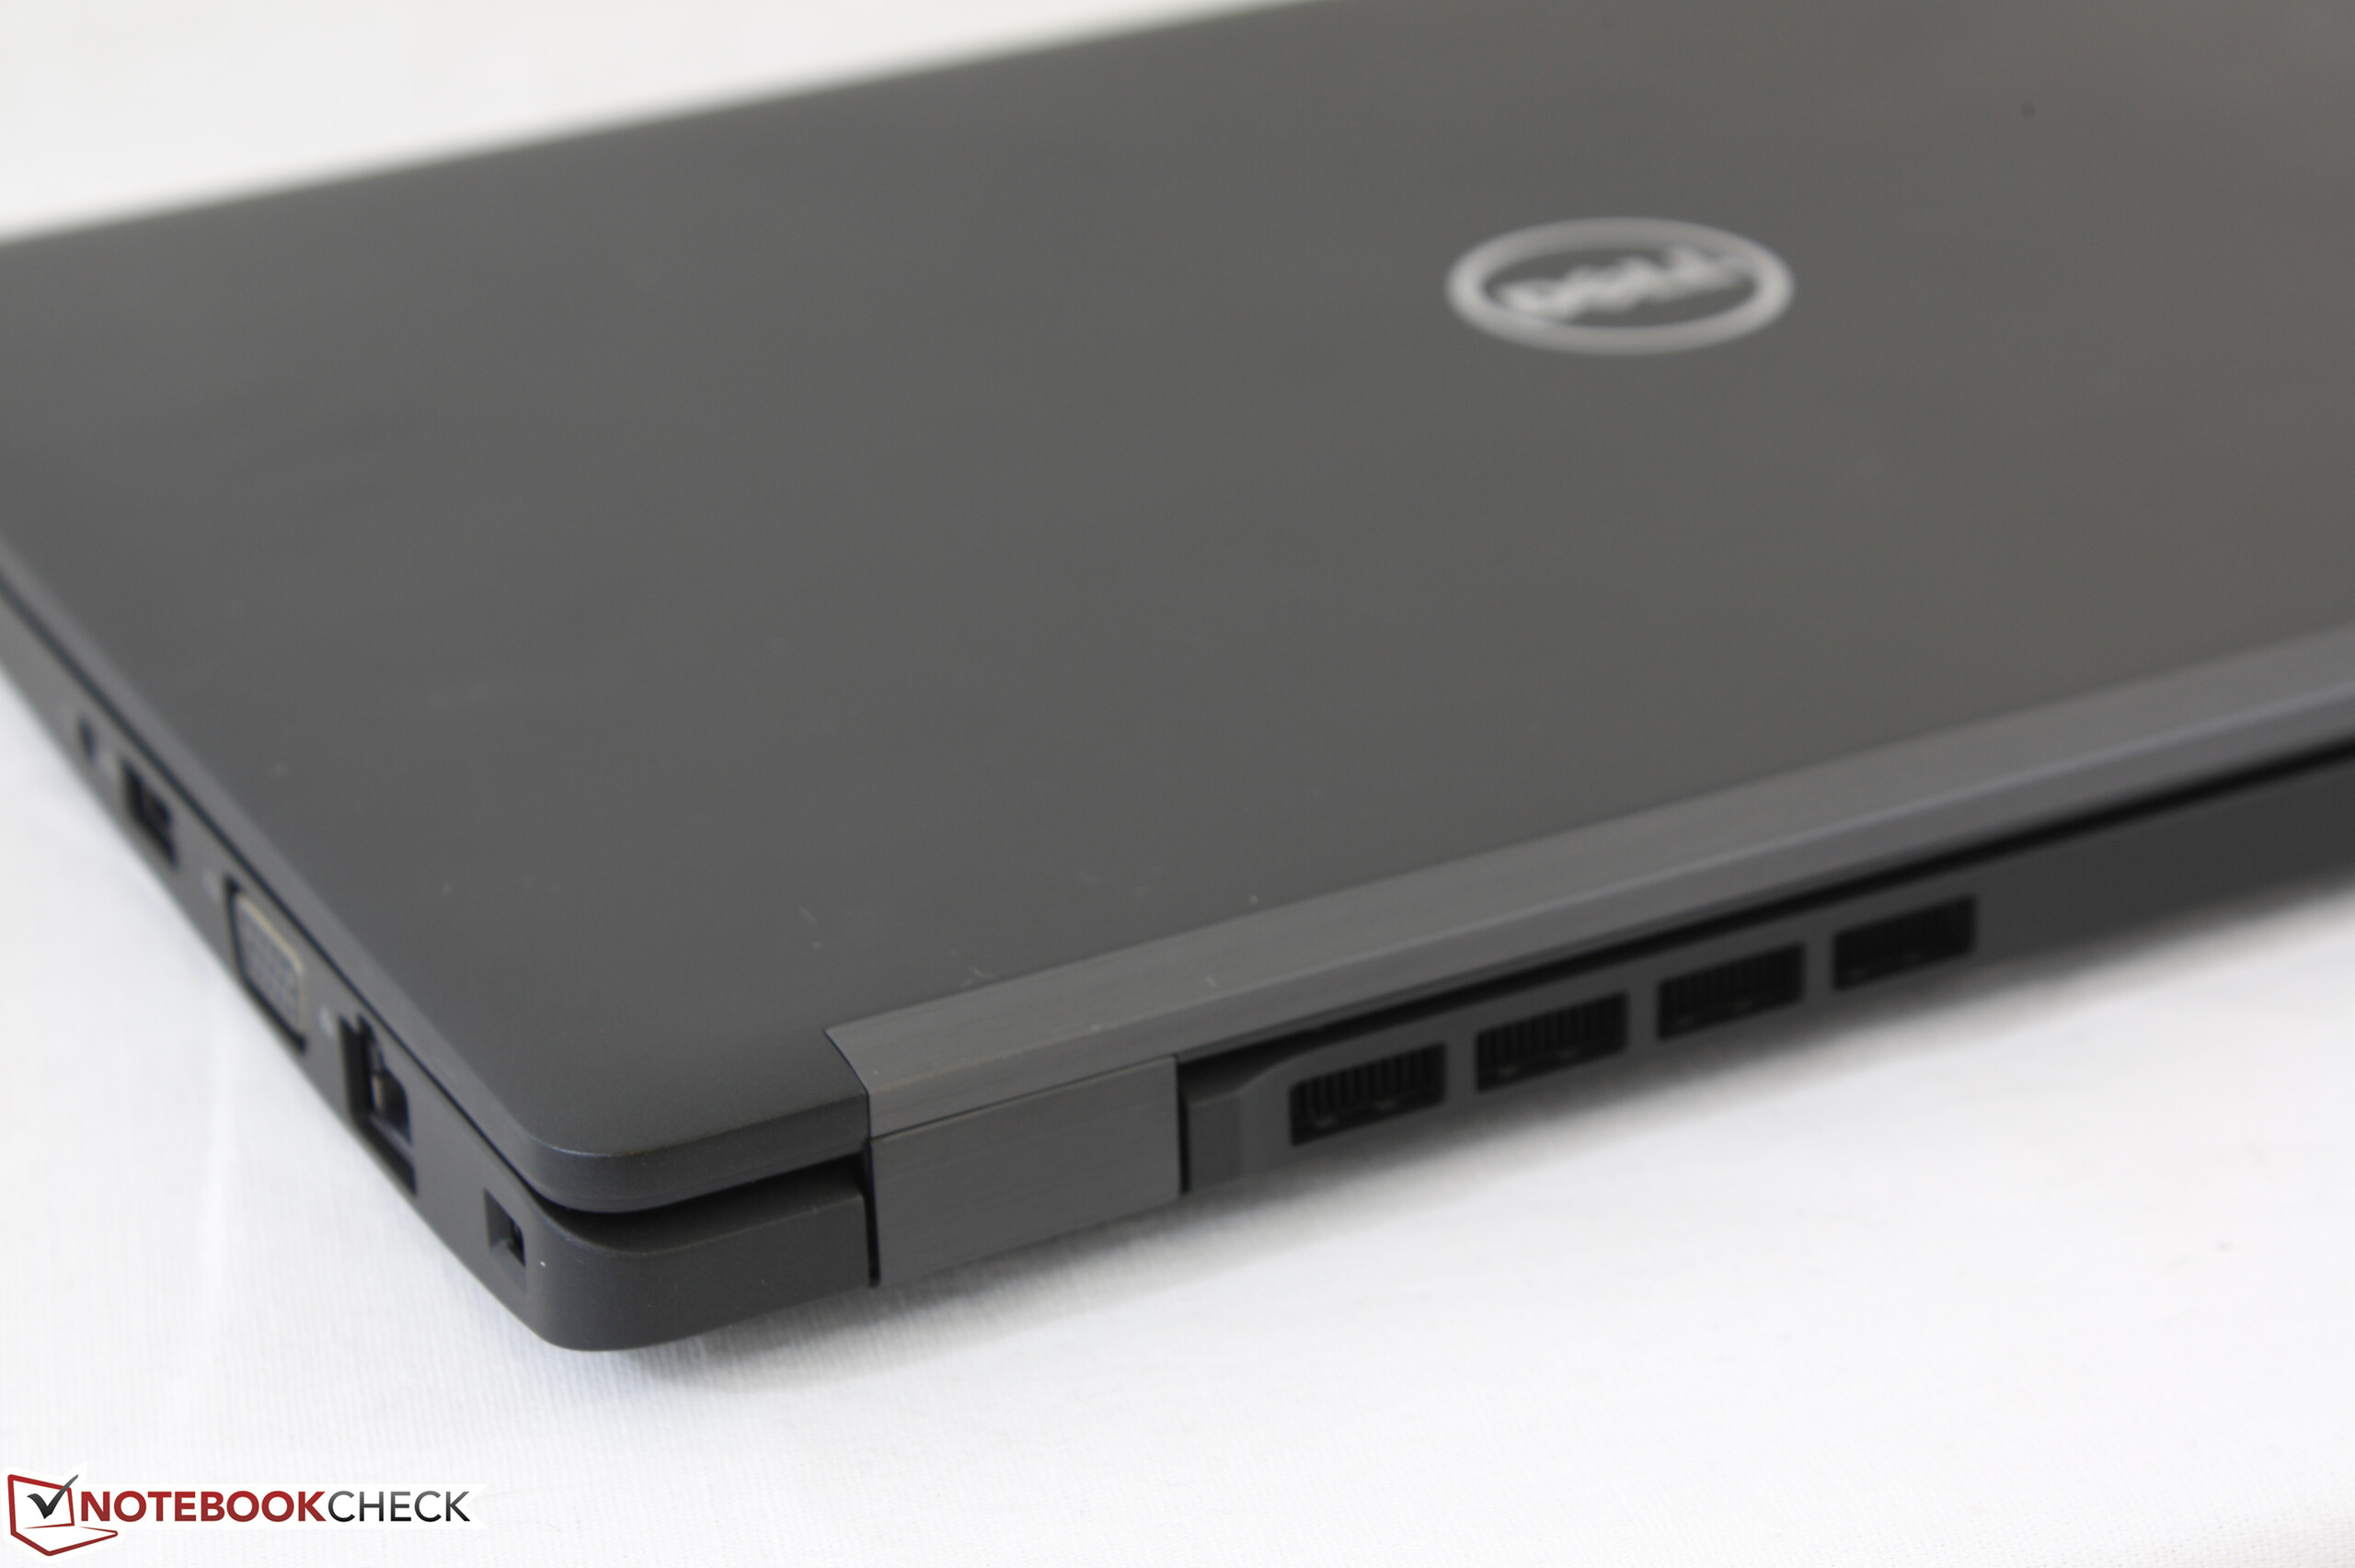
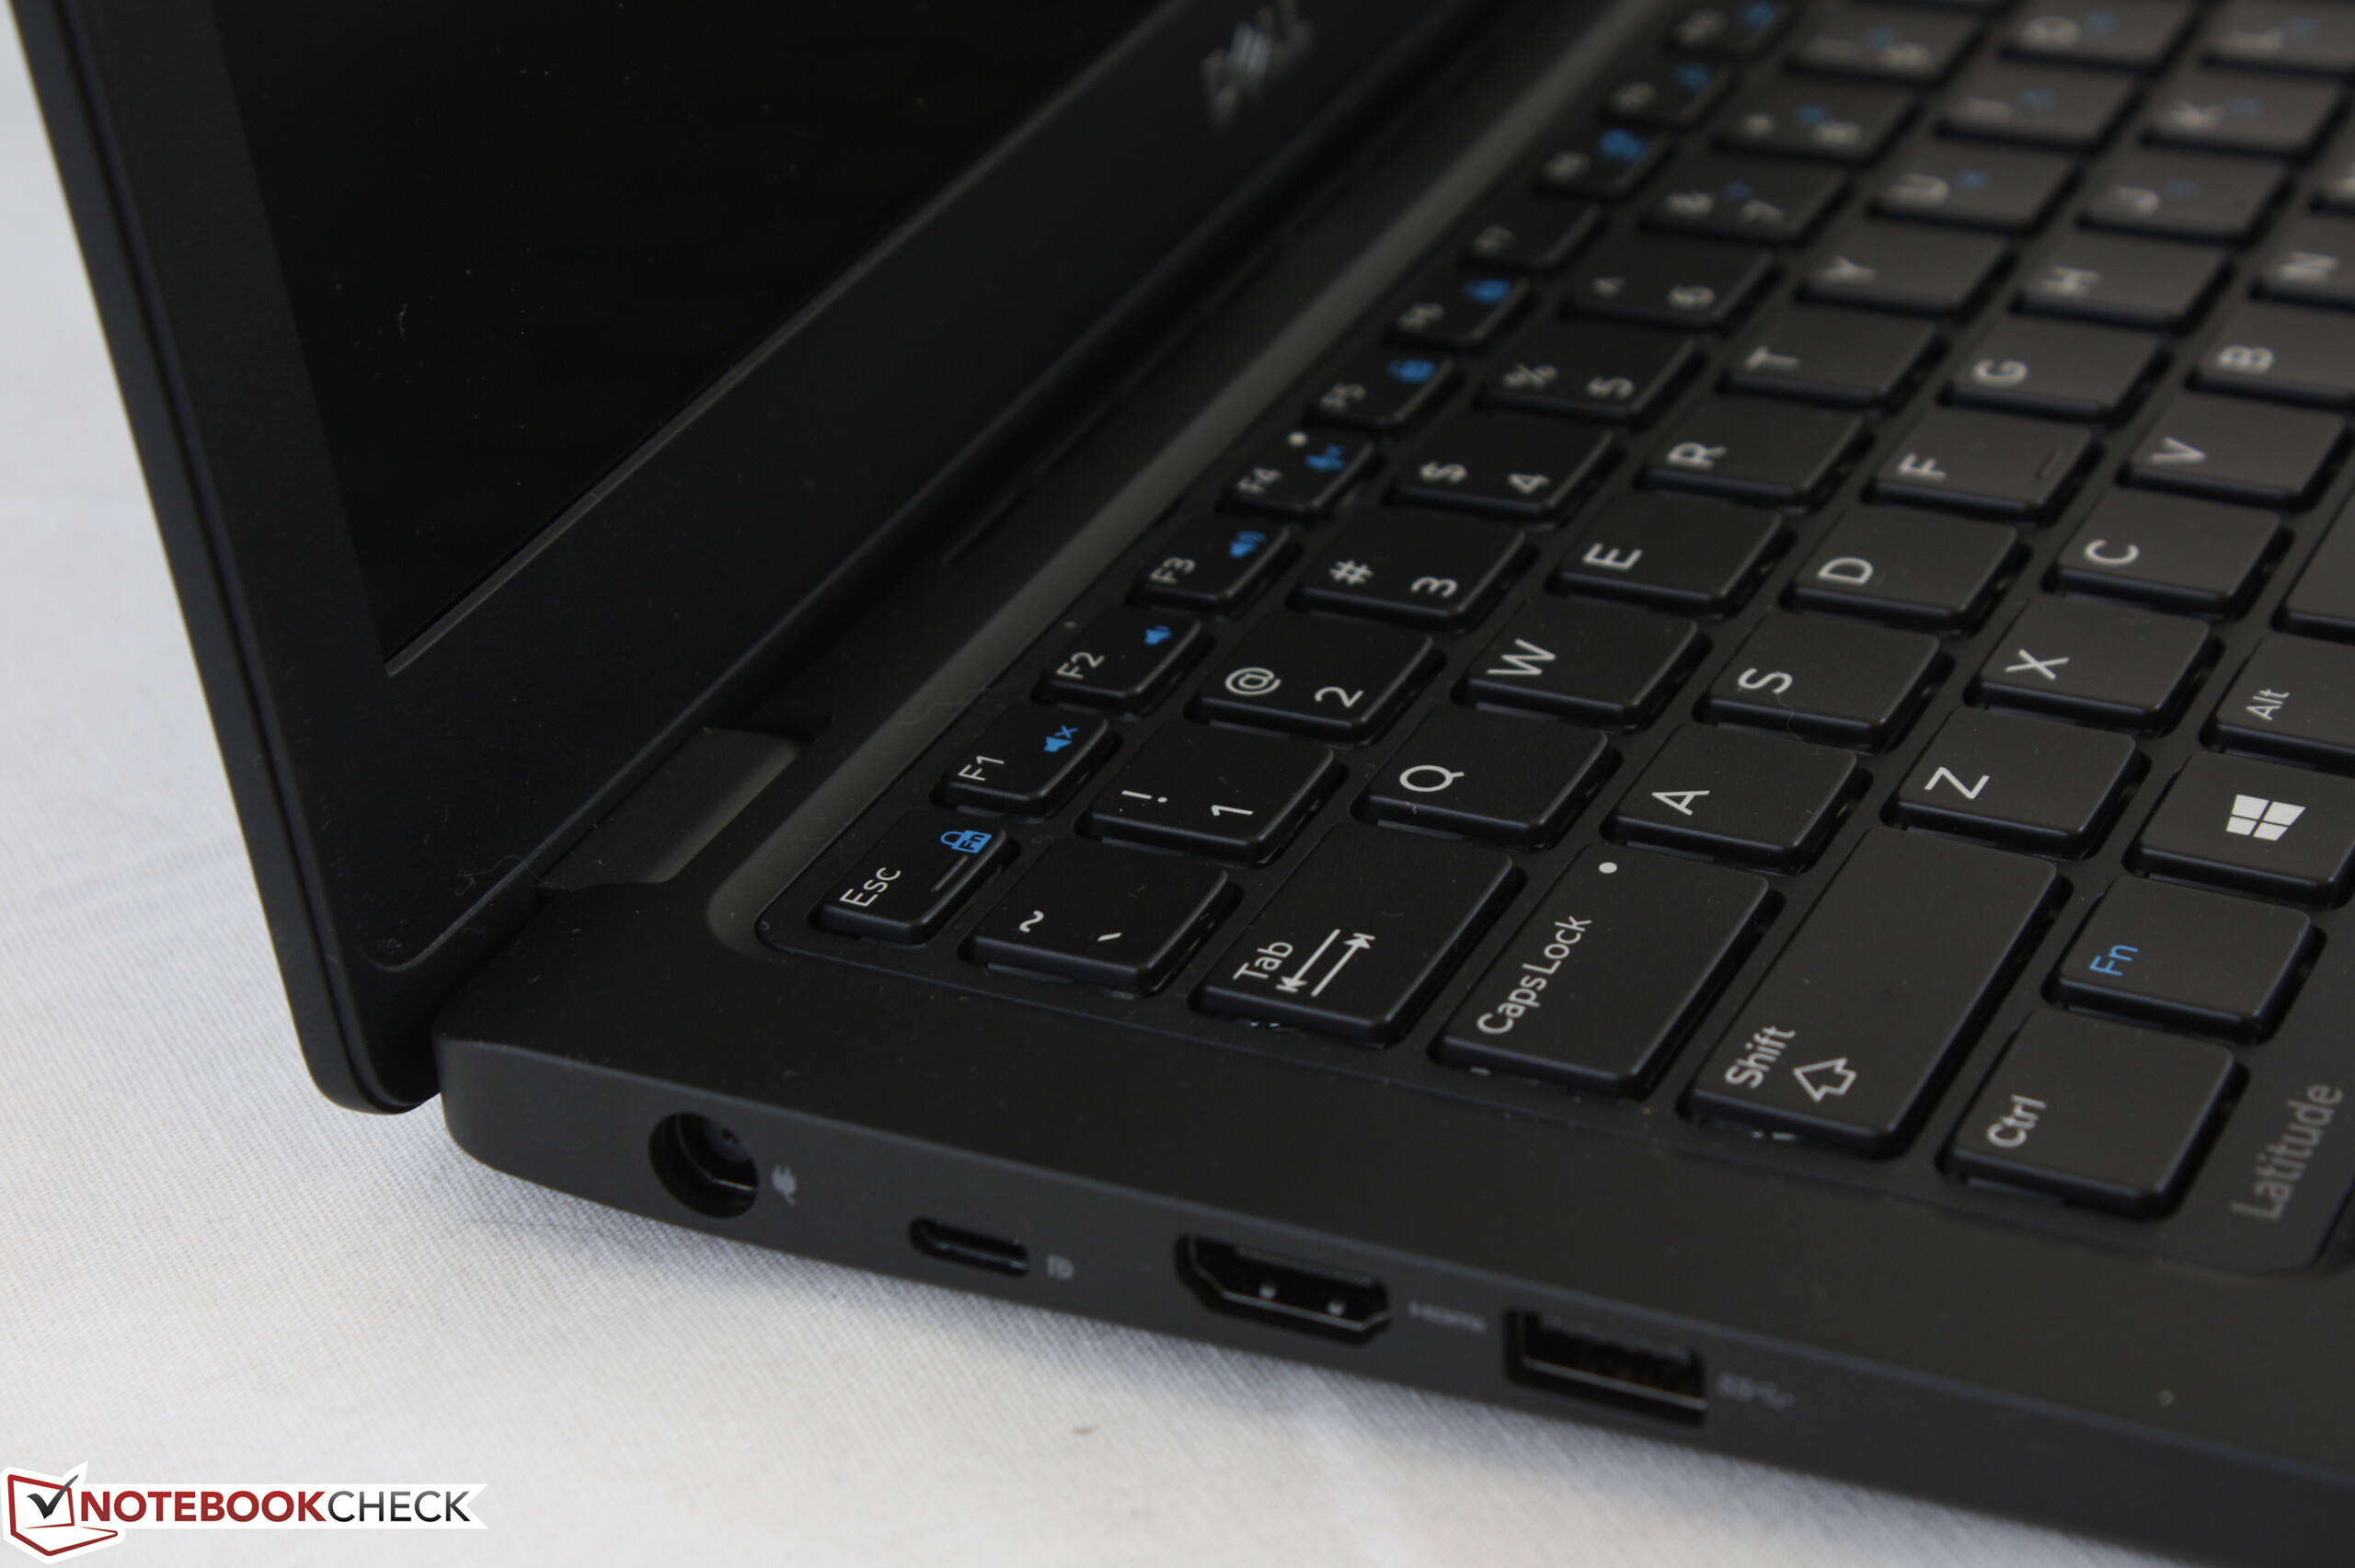
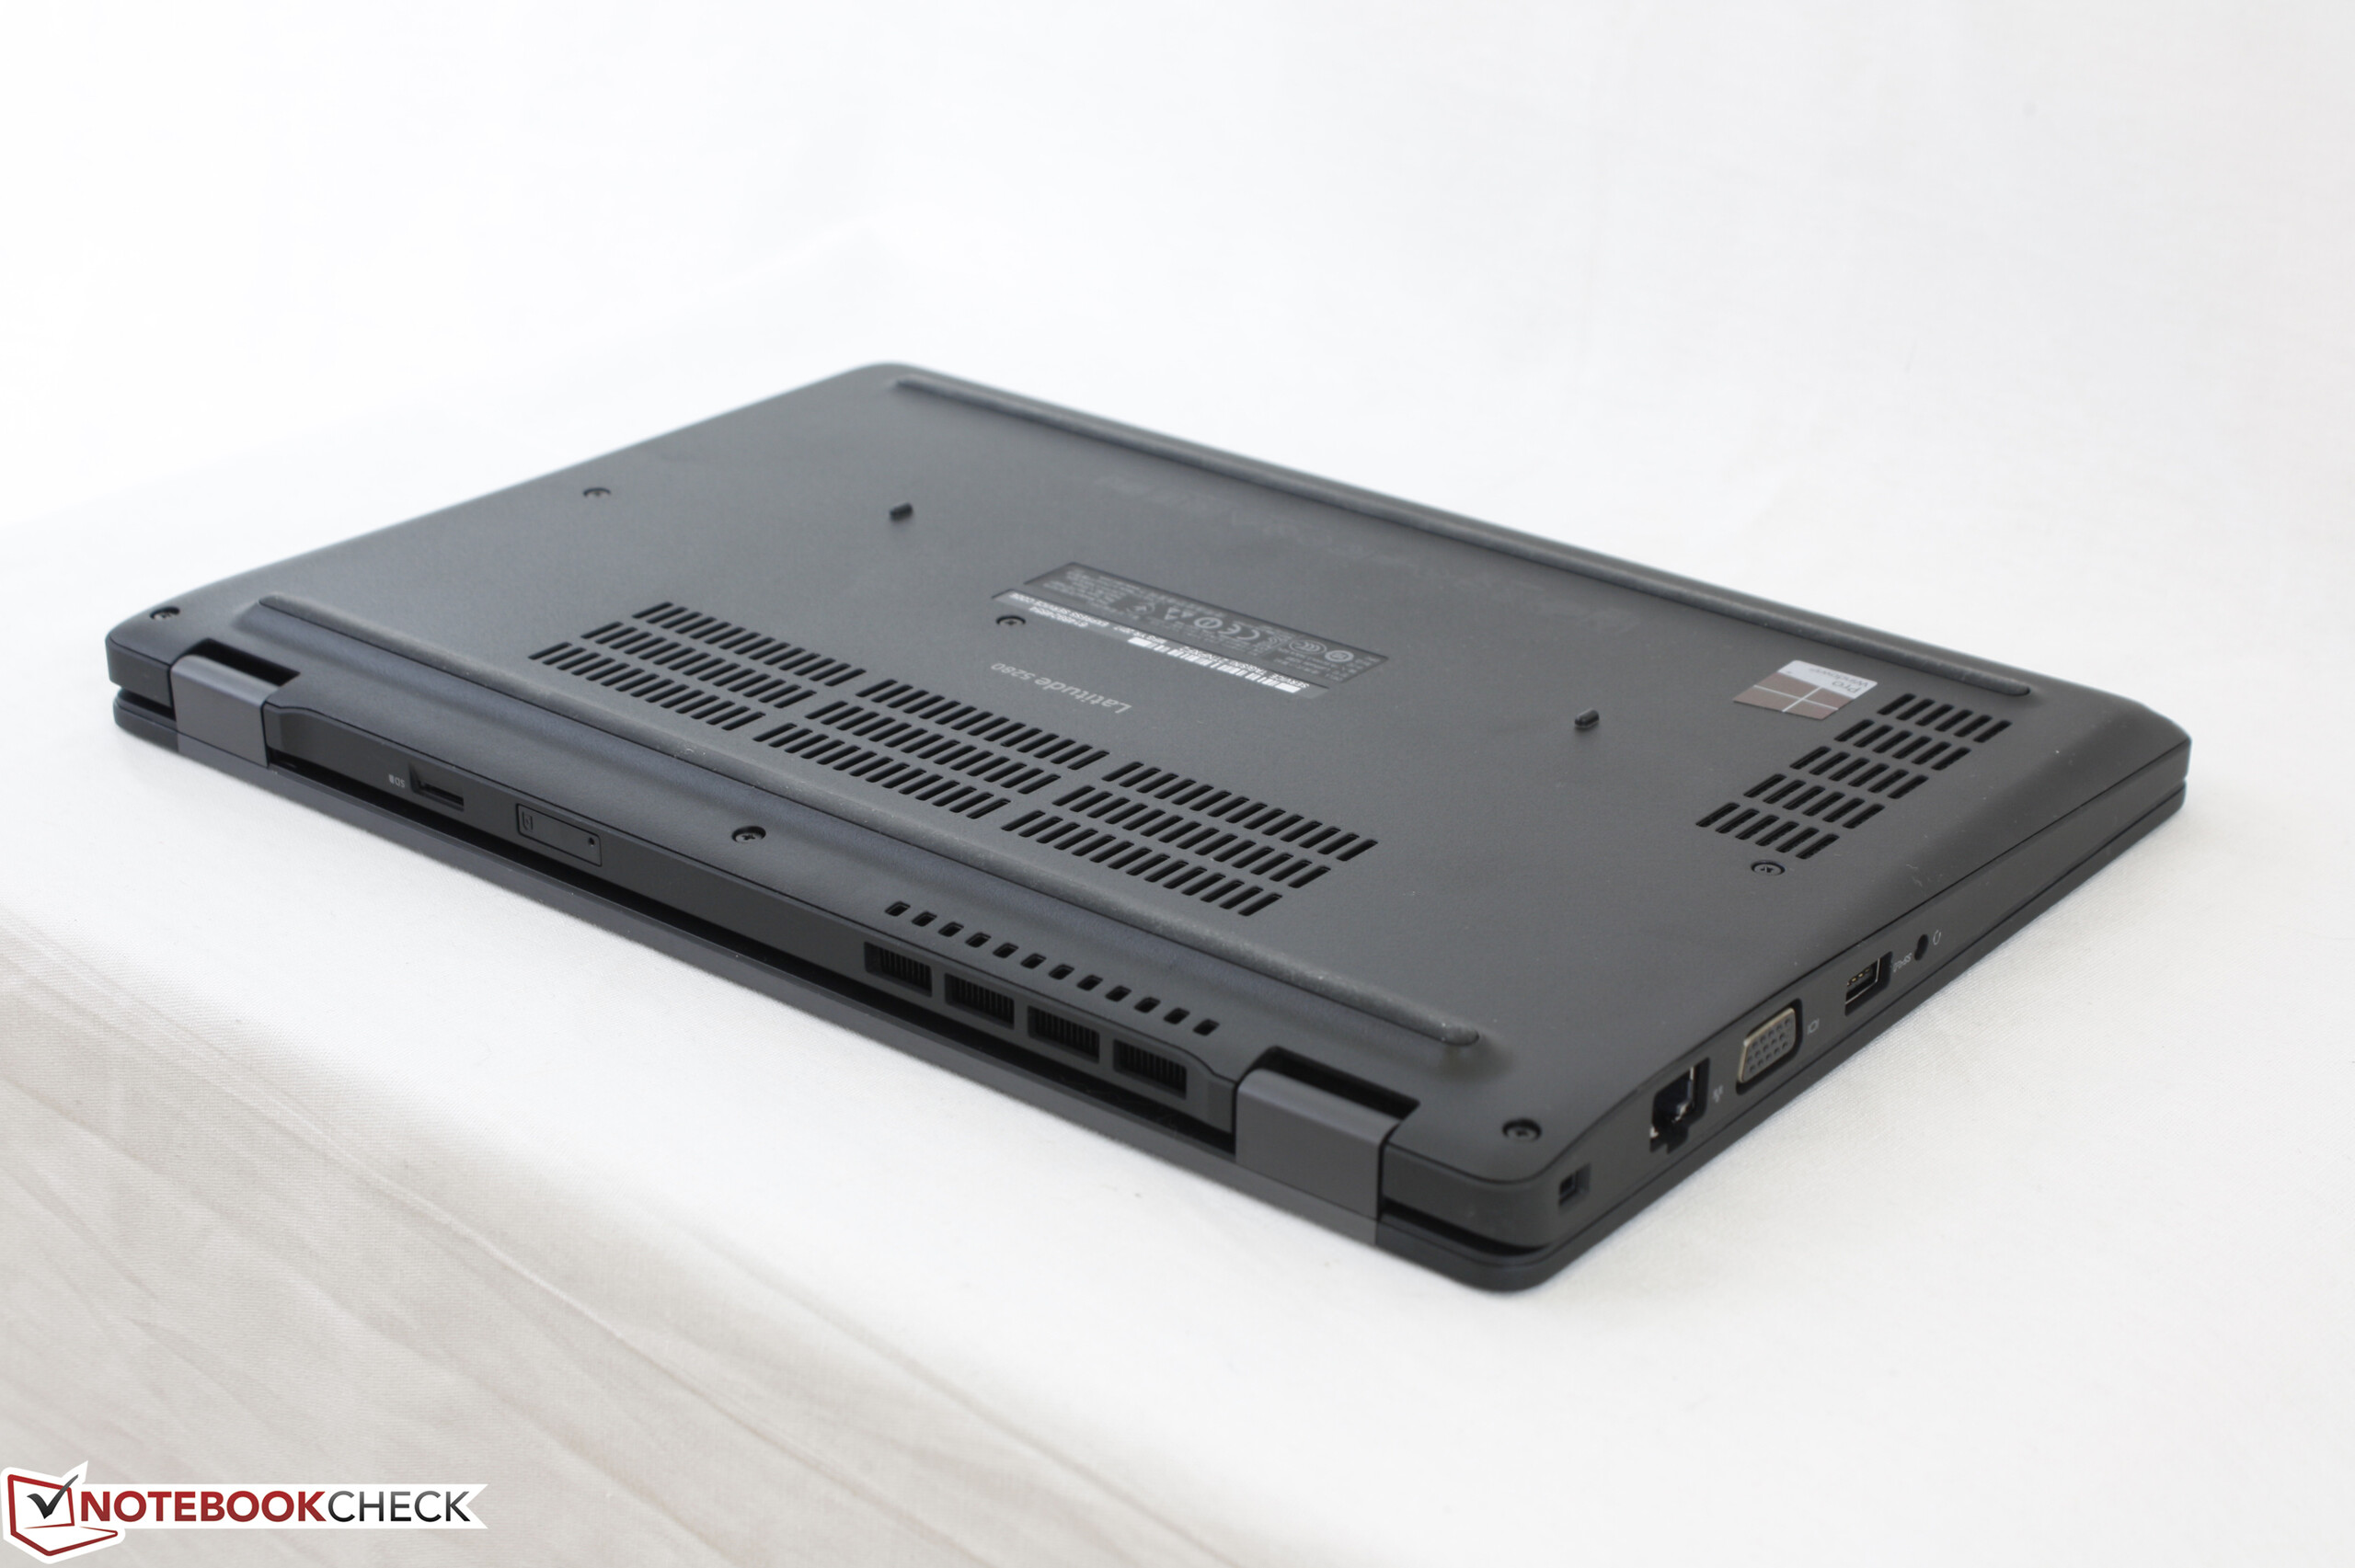
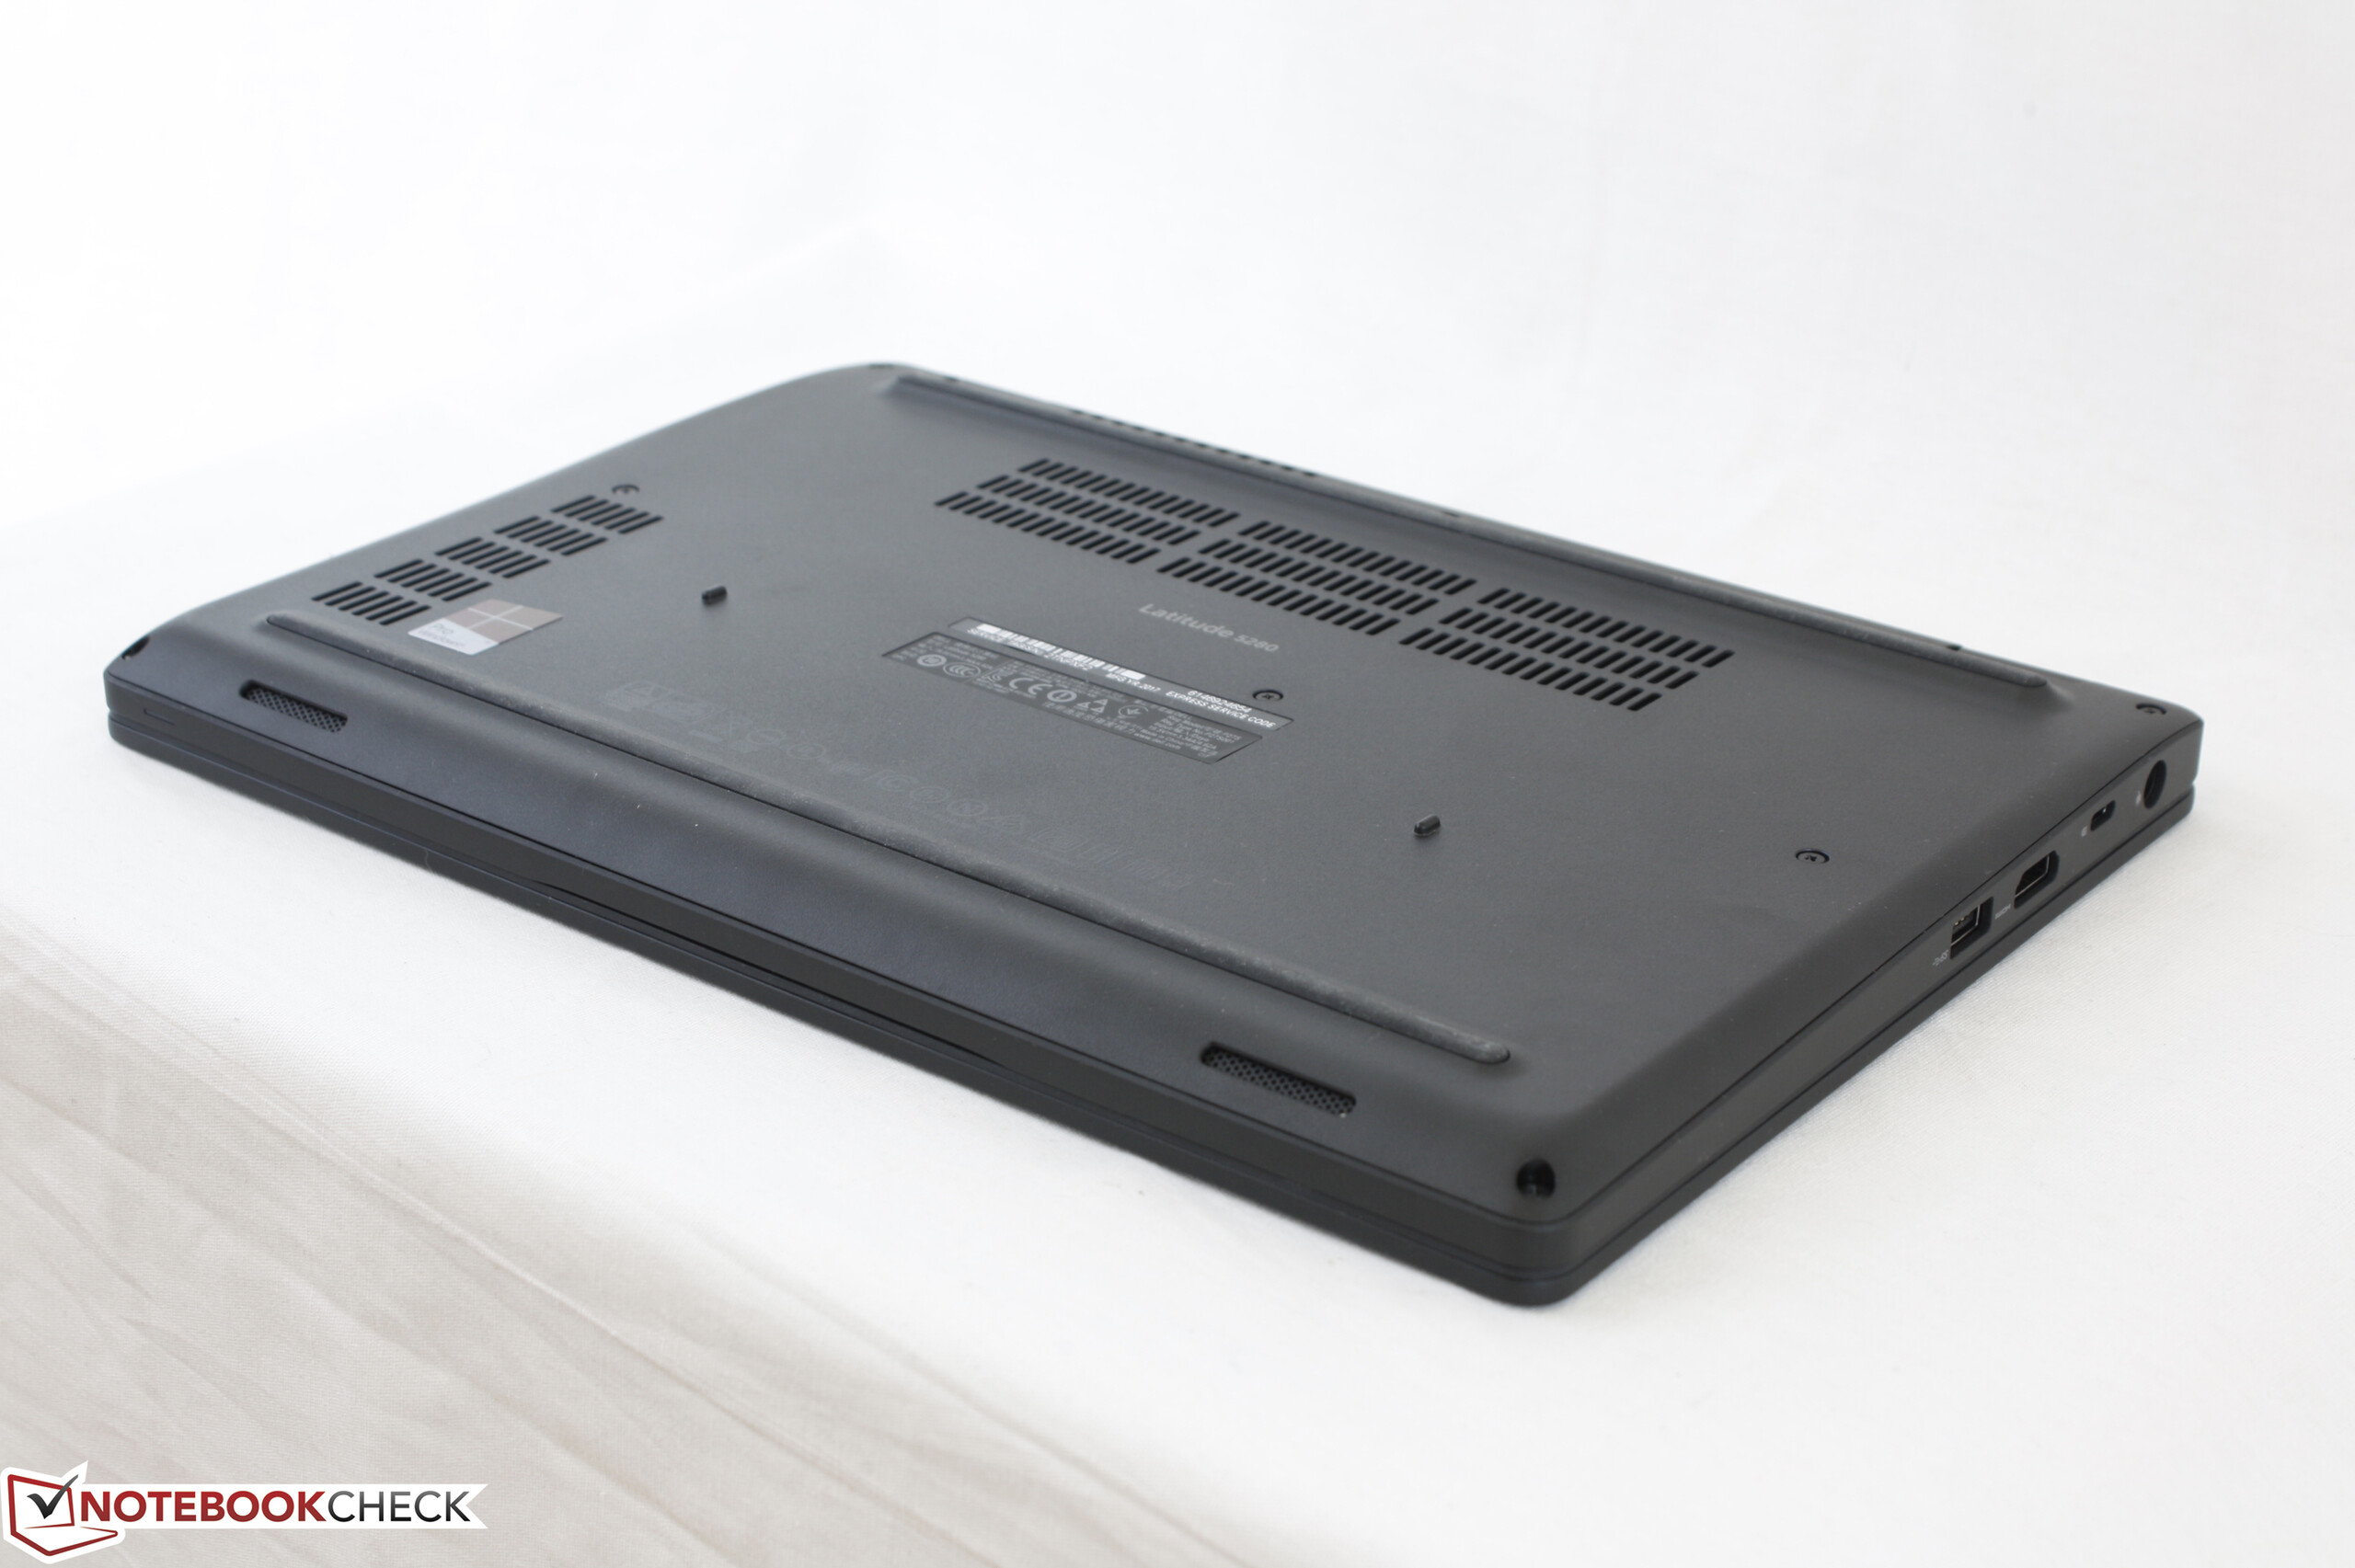
Un punto di forza della maggioranza dei portatili business è la capacità di collegarsi facilmente alle docking stations o a batterie secondarie. Ora che le serie 5280/5480/5580 hanno abbandonato la E-Port, la Thunderbolt 3 diventa sempre più criciale per supportare features aggiuntive. Il Latitude 5280 sfortunatamente non ha nessuna delle due e di conseguenza è meno versatile del5480 e del 5580 sebbene sia più piccolo e più portatile. In aggiunta, la ventola è sempre attiva cosa che troviamo inutile per un portatile che monta solo processori U-class.
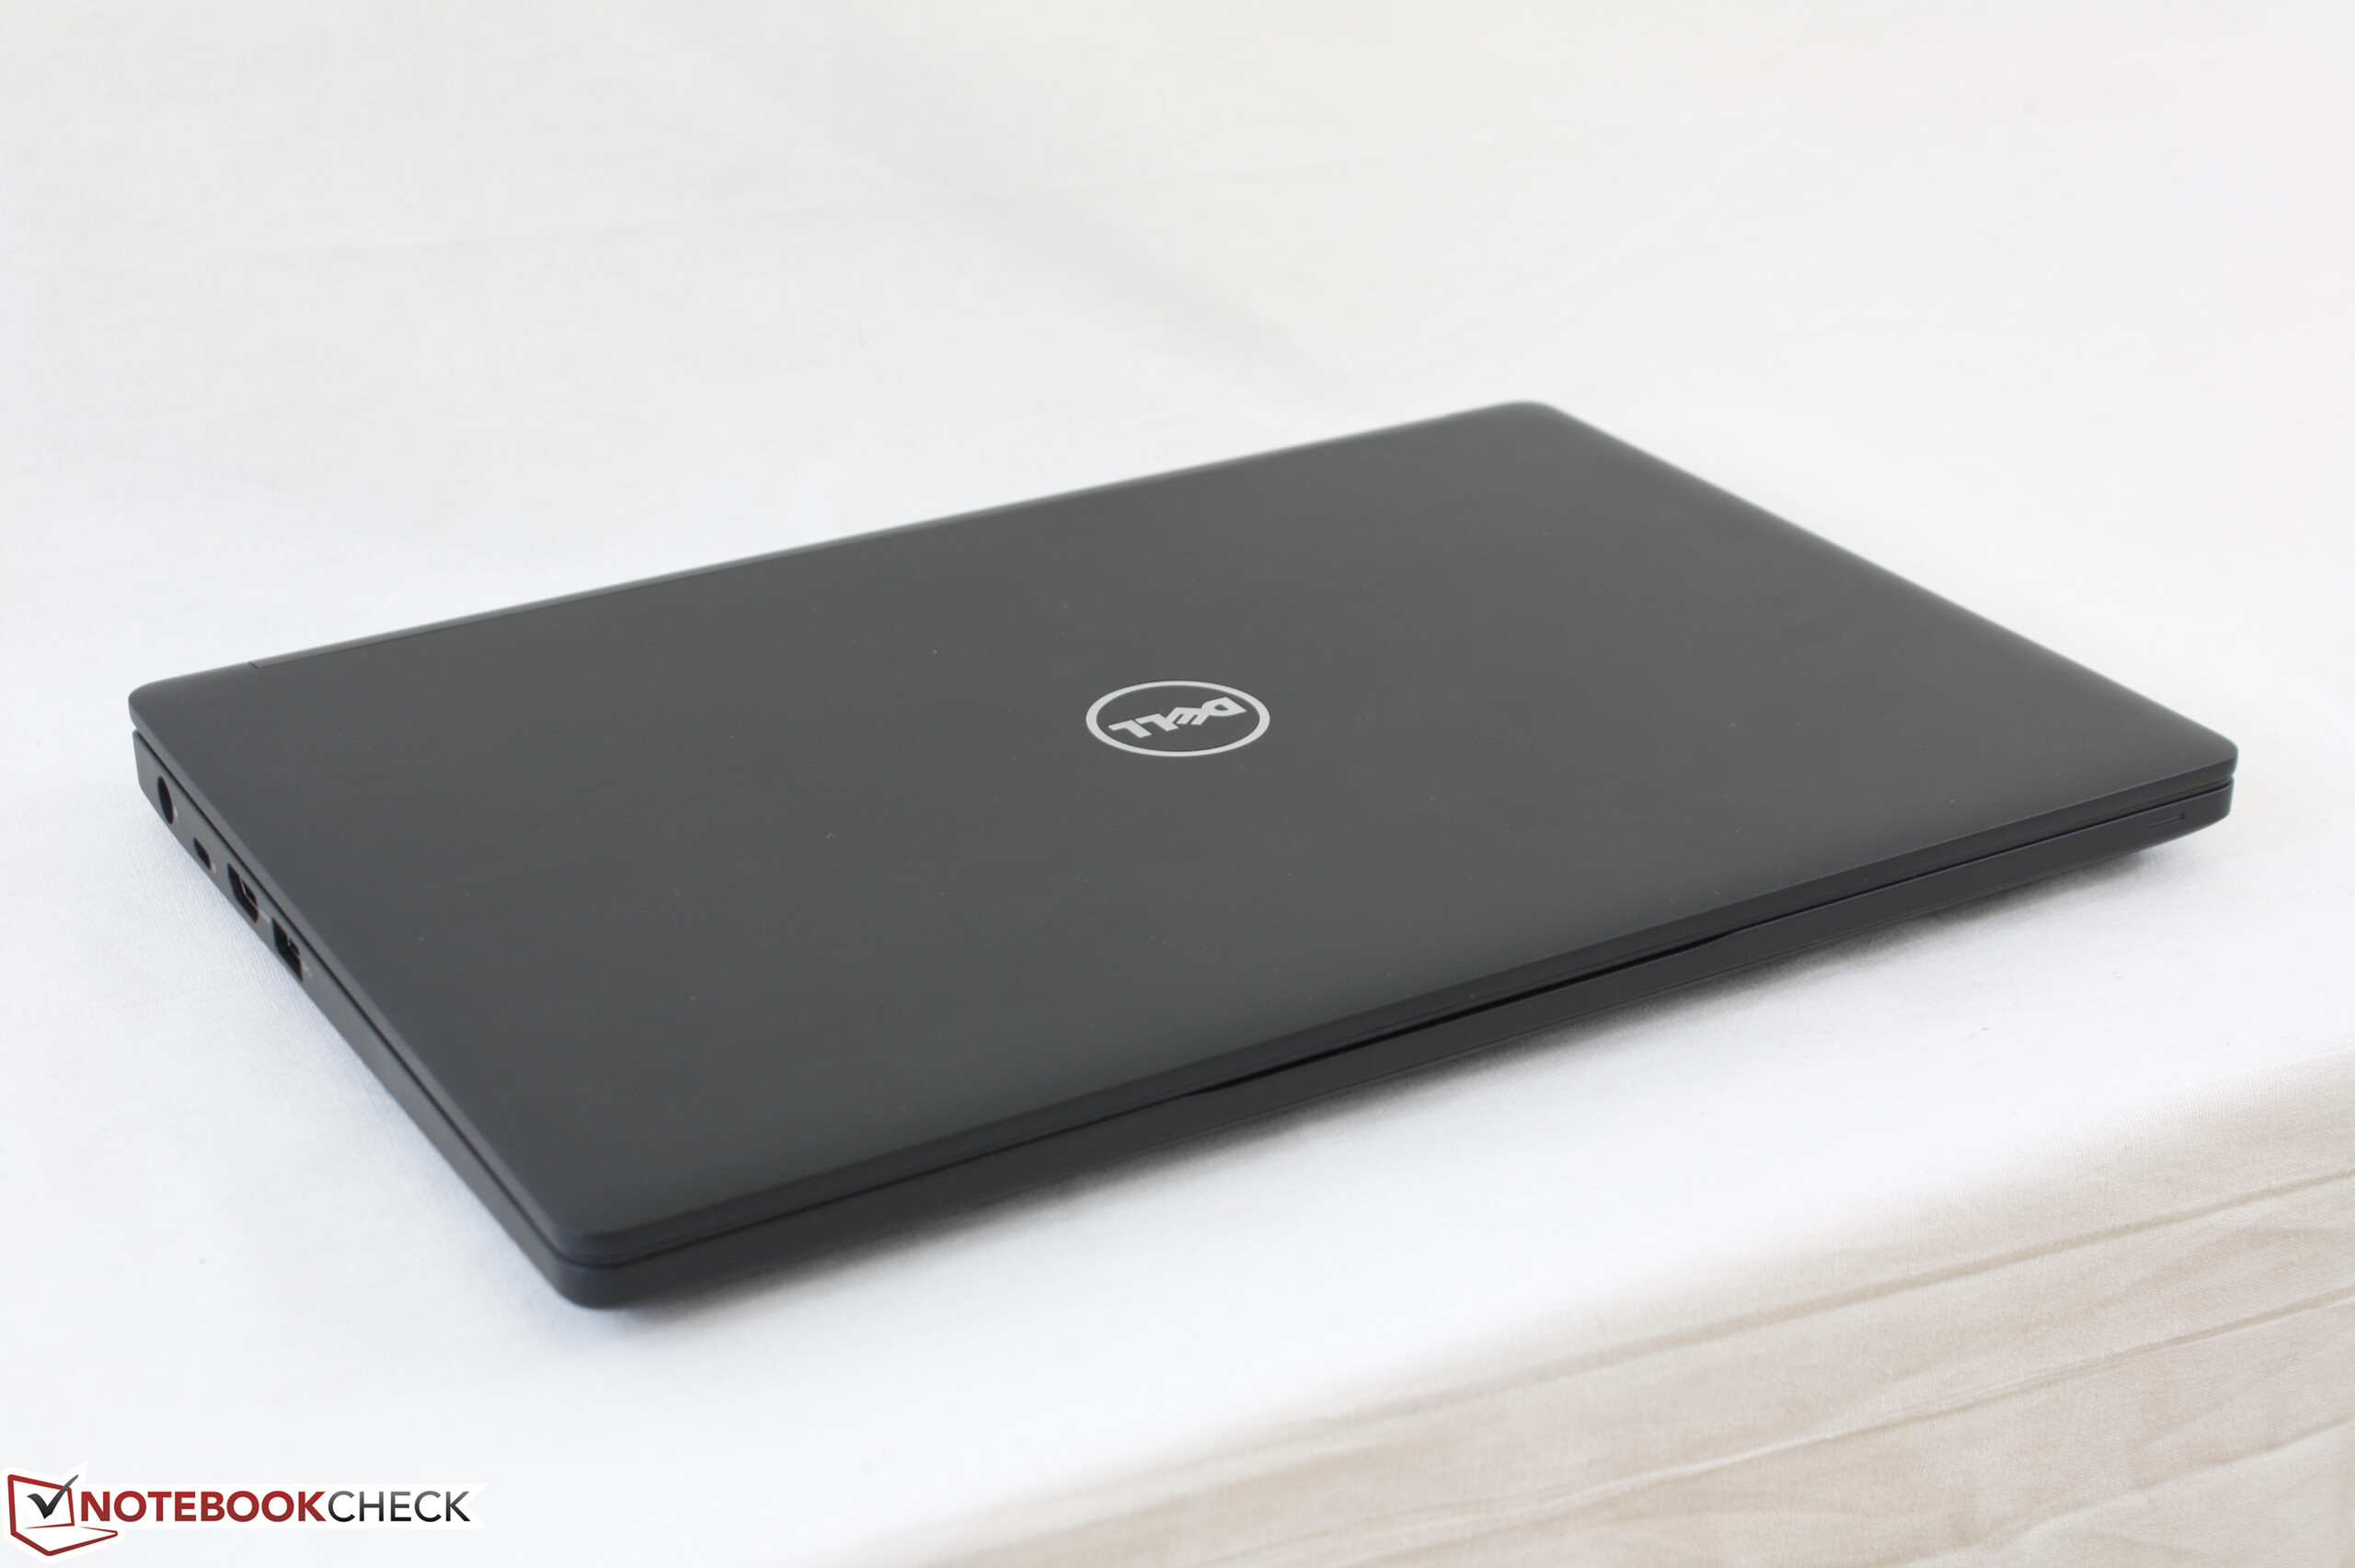
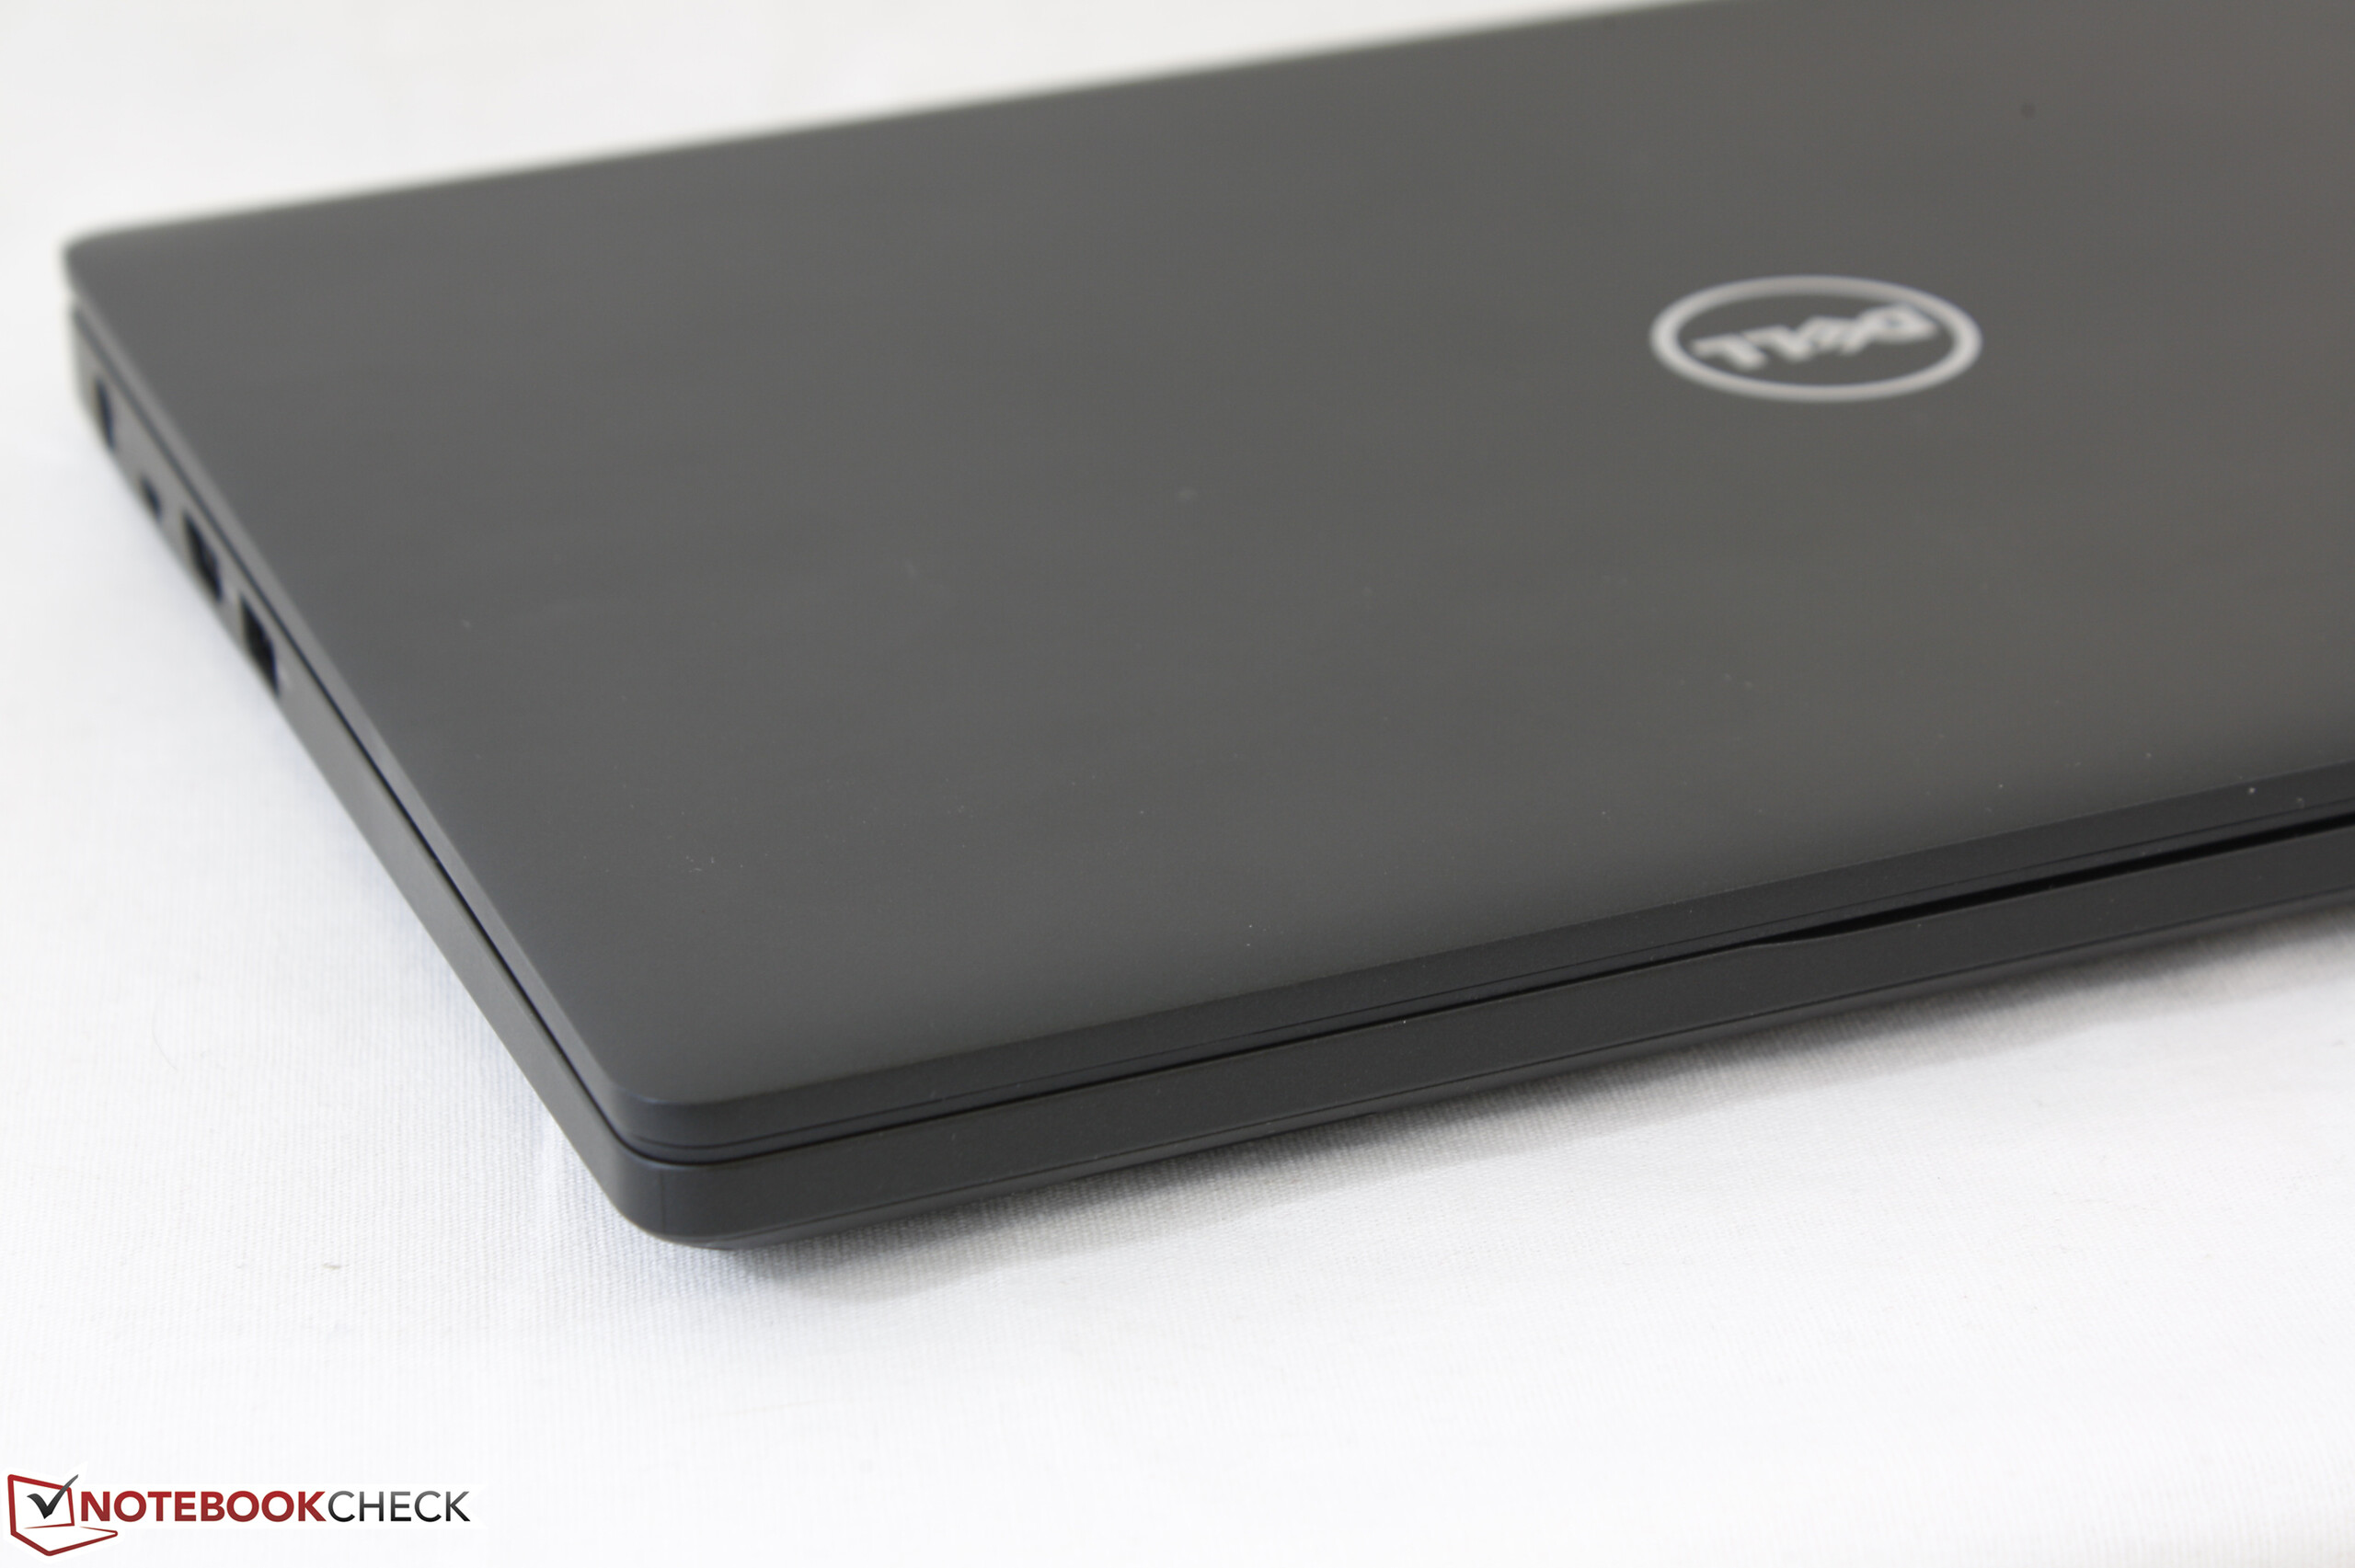
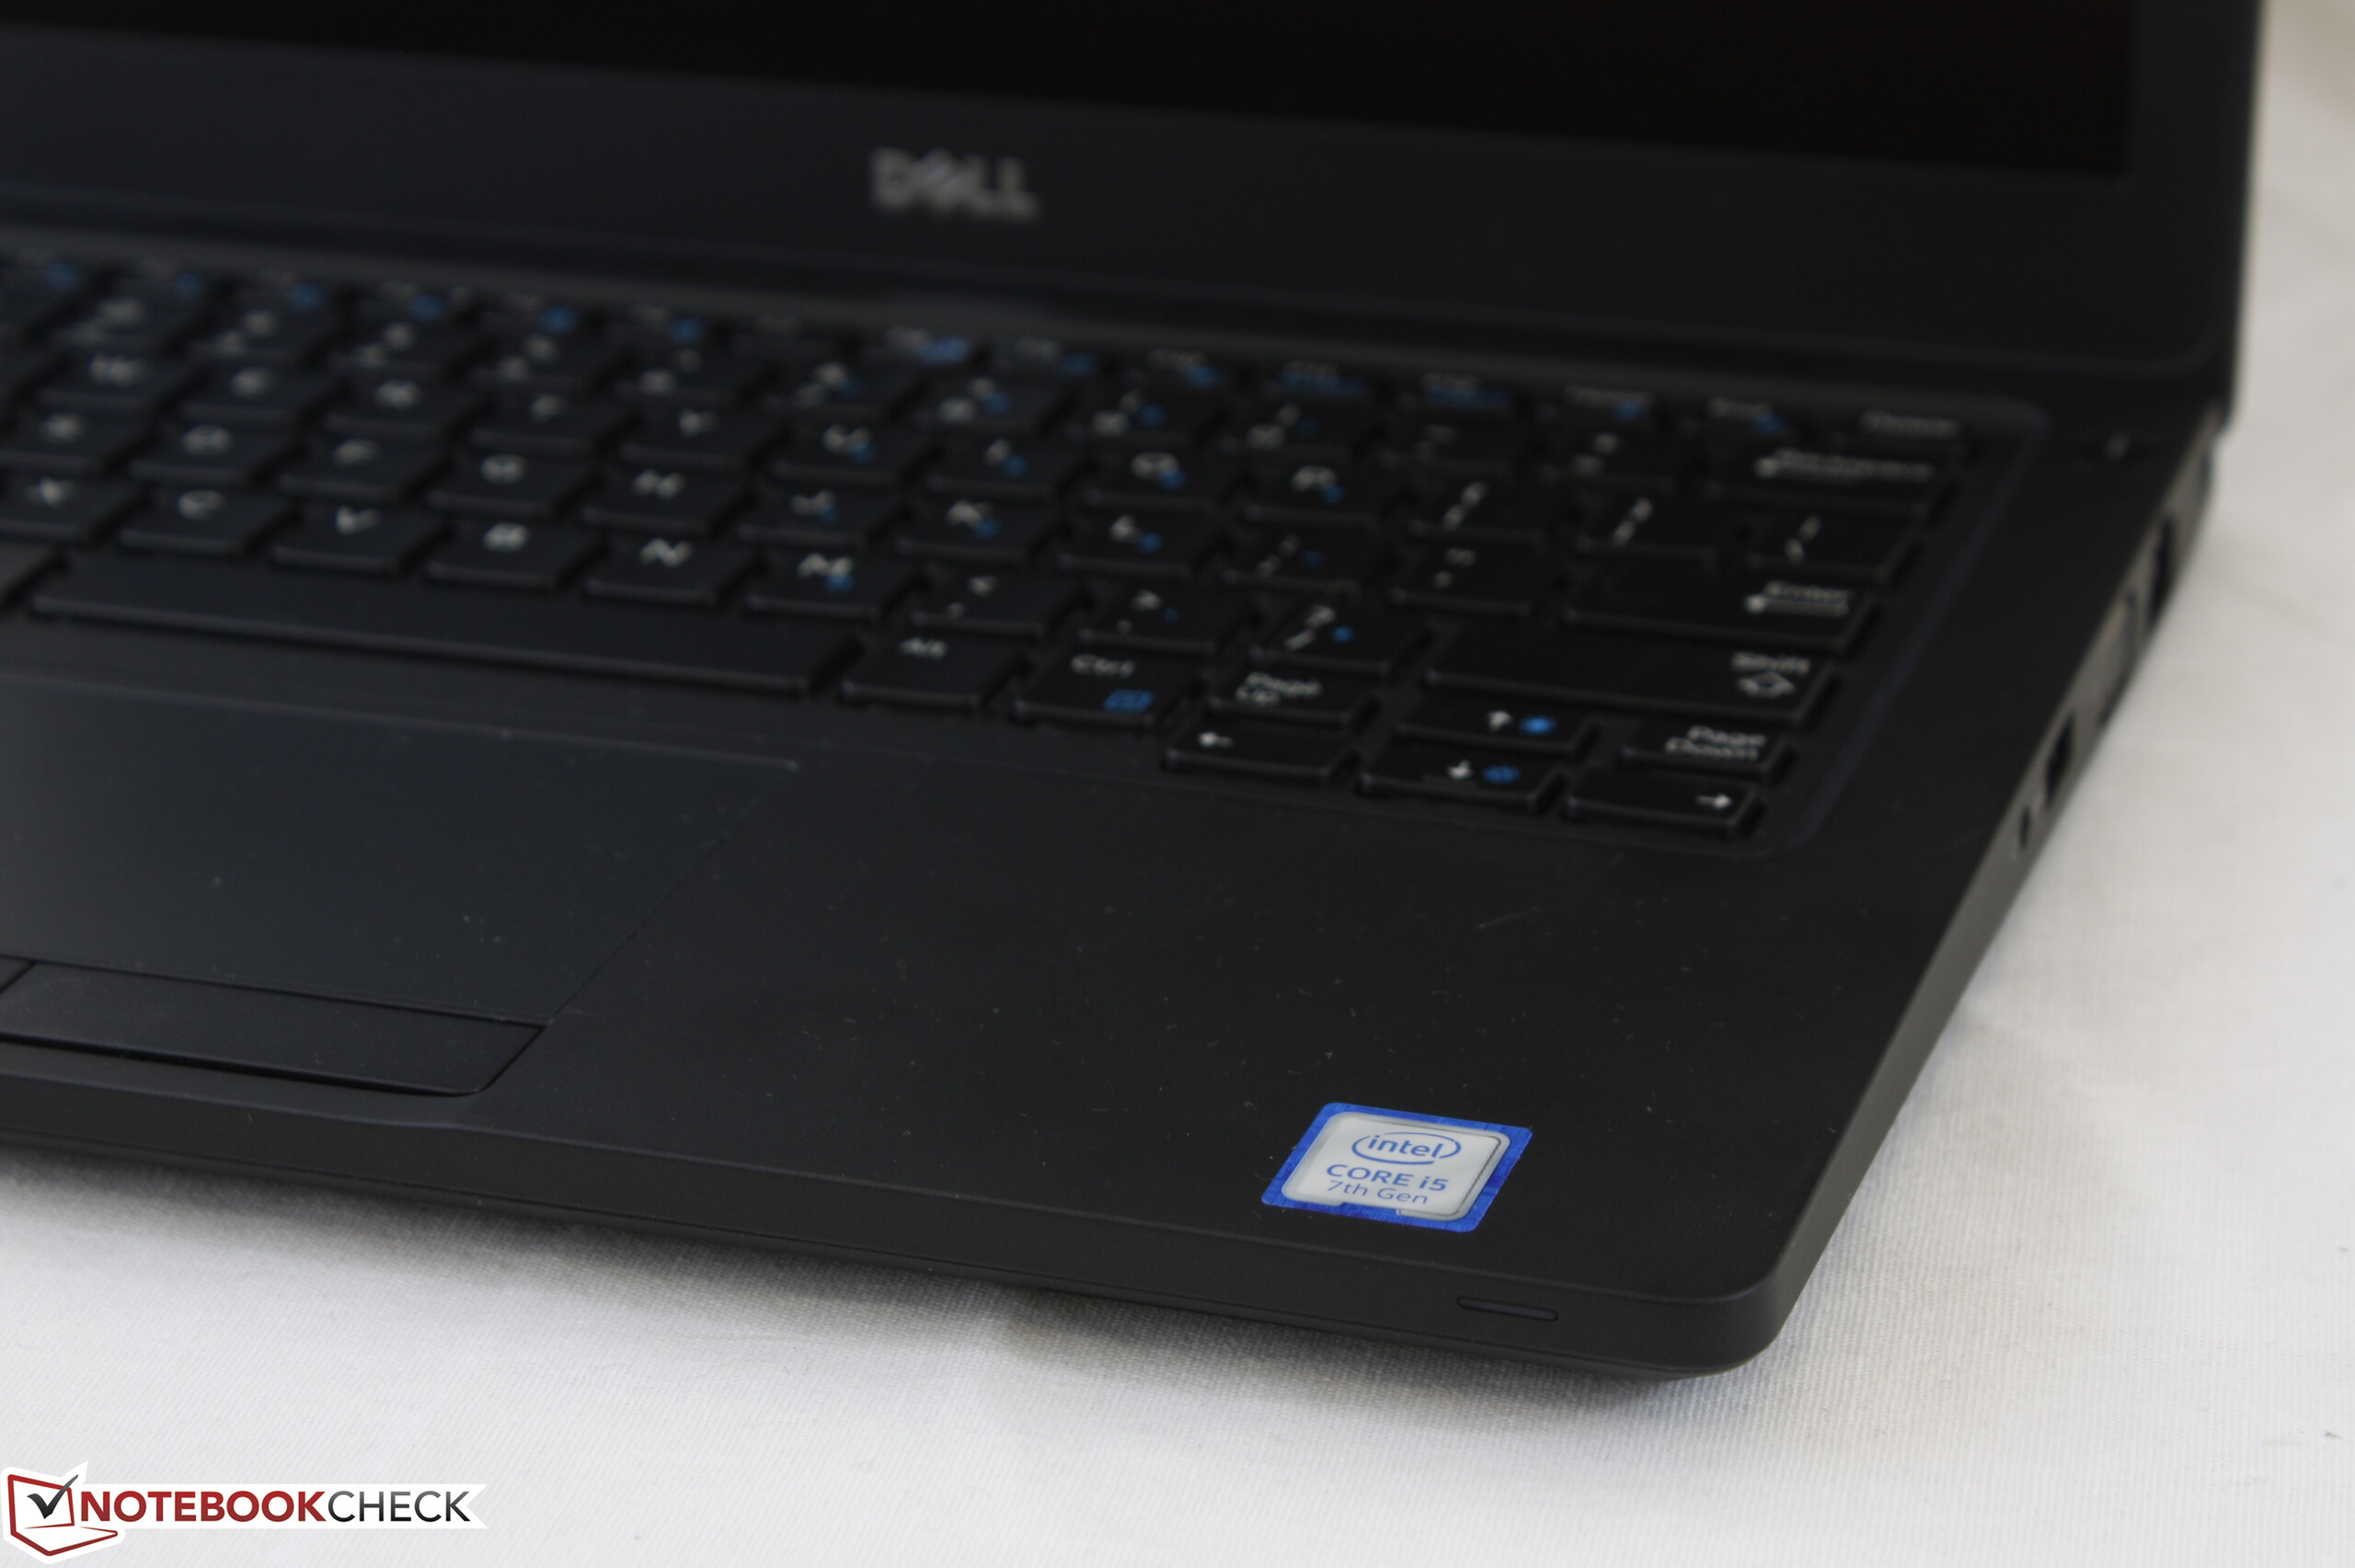
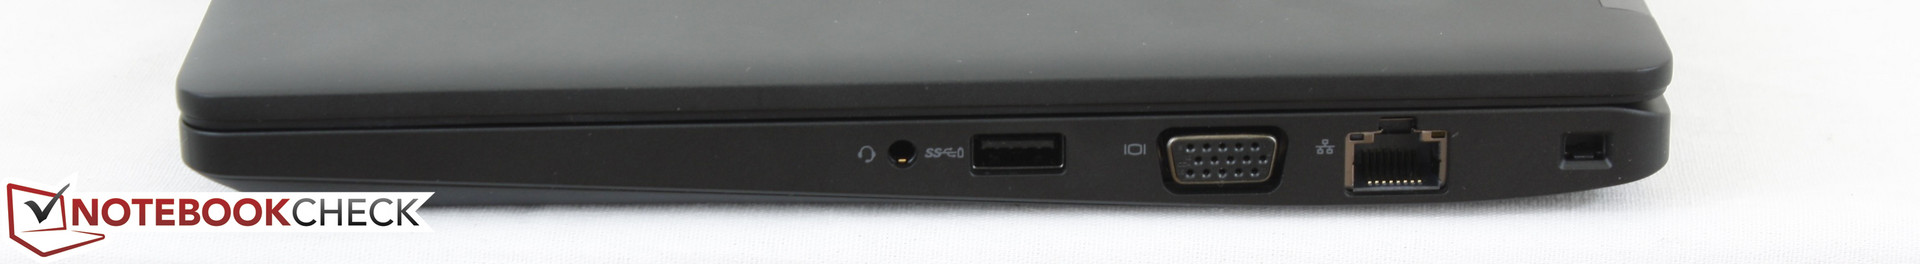
Se questi svantaggi non sono importati, tuttavia, allora il 5280 eccelle in molti settori. La sua porta USB Type-C fornisce l'output a monitors esterni DisplayPort ed il nuovo chassis è più leggero rispetto all'E5270 senza essere particolarmente fragile. Le autonomie sono eccellenti con la batteria di fascia media e la presenza di uscite VGA ed HDMI dovrebbe essere utile in università e per le conferenze. Le prestazioni della CPU in particolare sono impressionanti in quanto il processore riesce a mantenere la massima velocità Turbo Boost anche con carichi elevati.
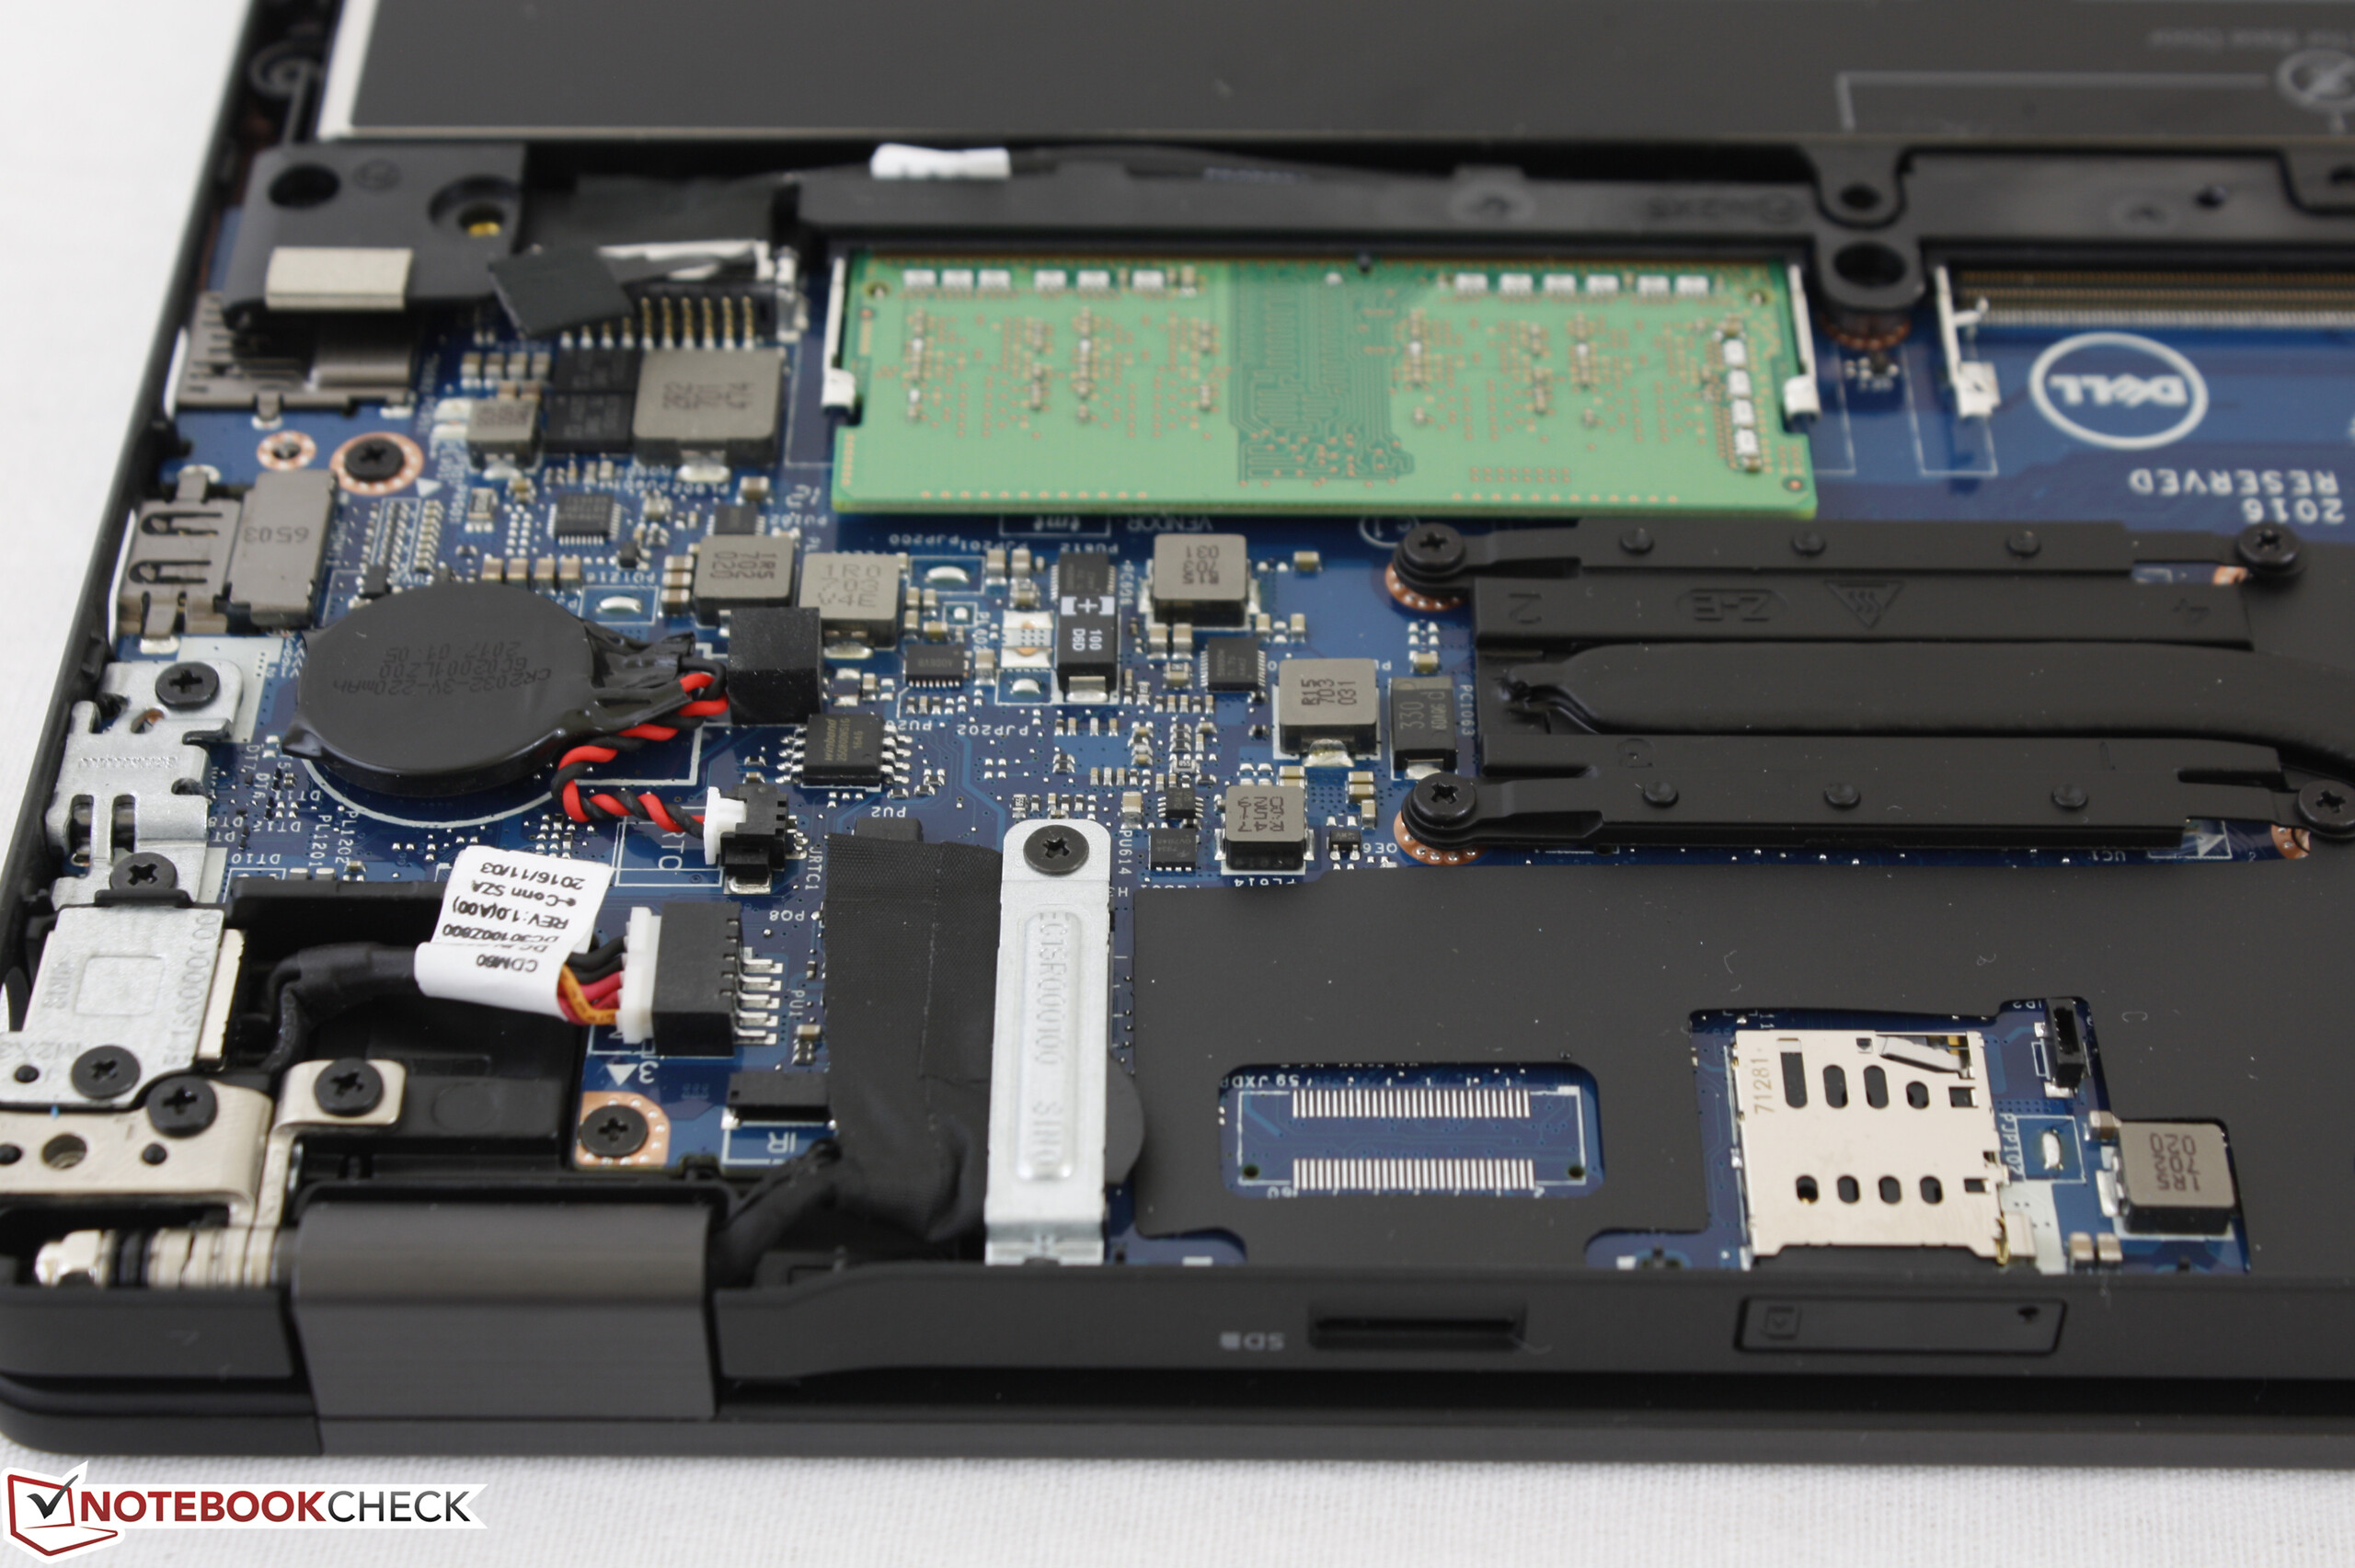
Raccomandiamo vivamente di evitare il display 768p a favore del più luminoso 1080p con SSDs più veloci. Il vantaggio di risoluzione e luminosità renderà il portatile più comodo da usare ed assolutamente valido come investimento se il sistema sarà usato spesso senza monitors esterni.
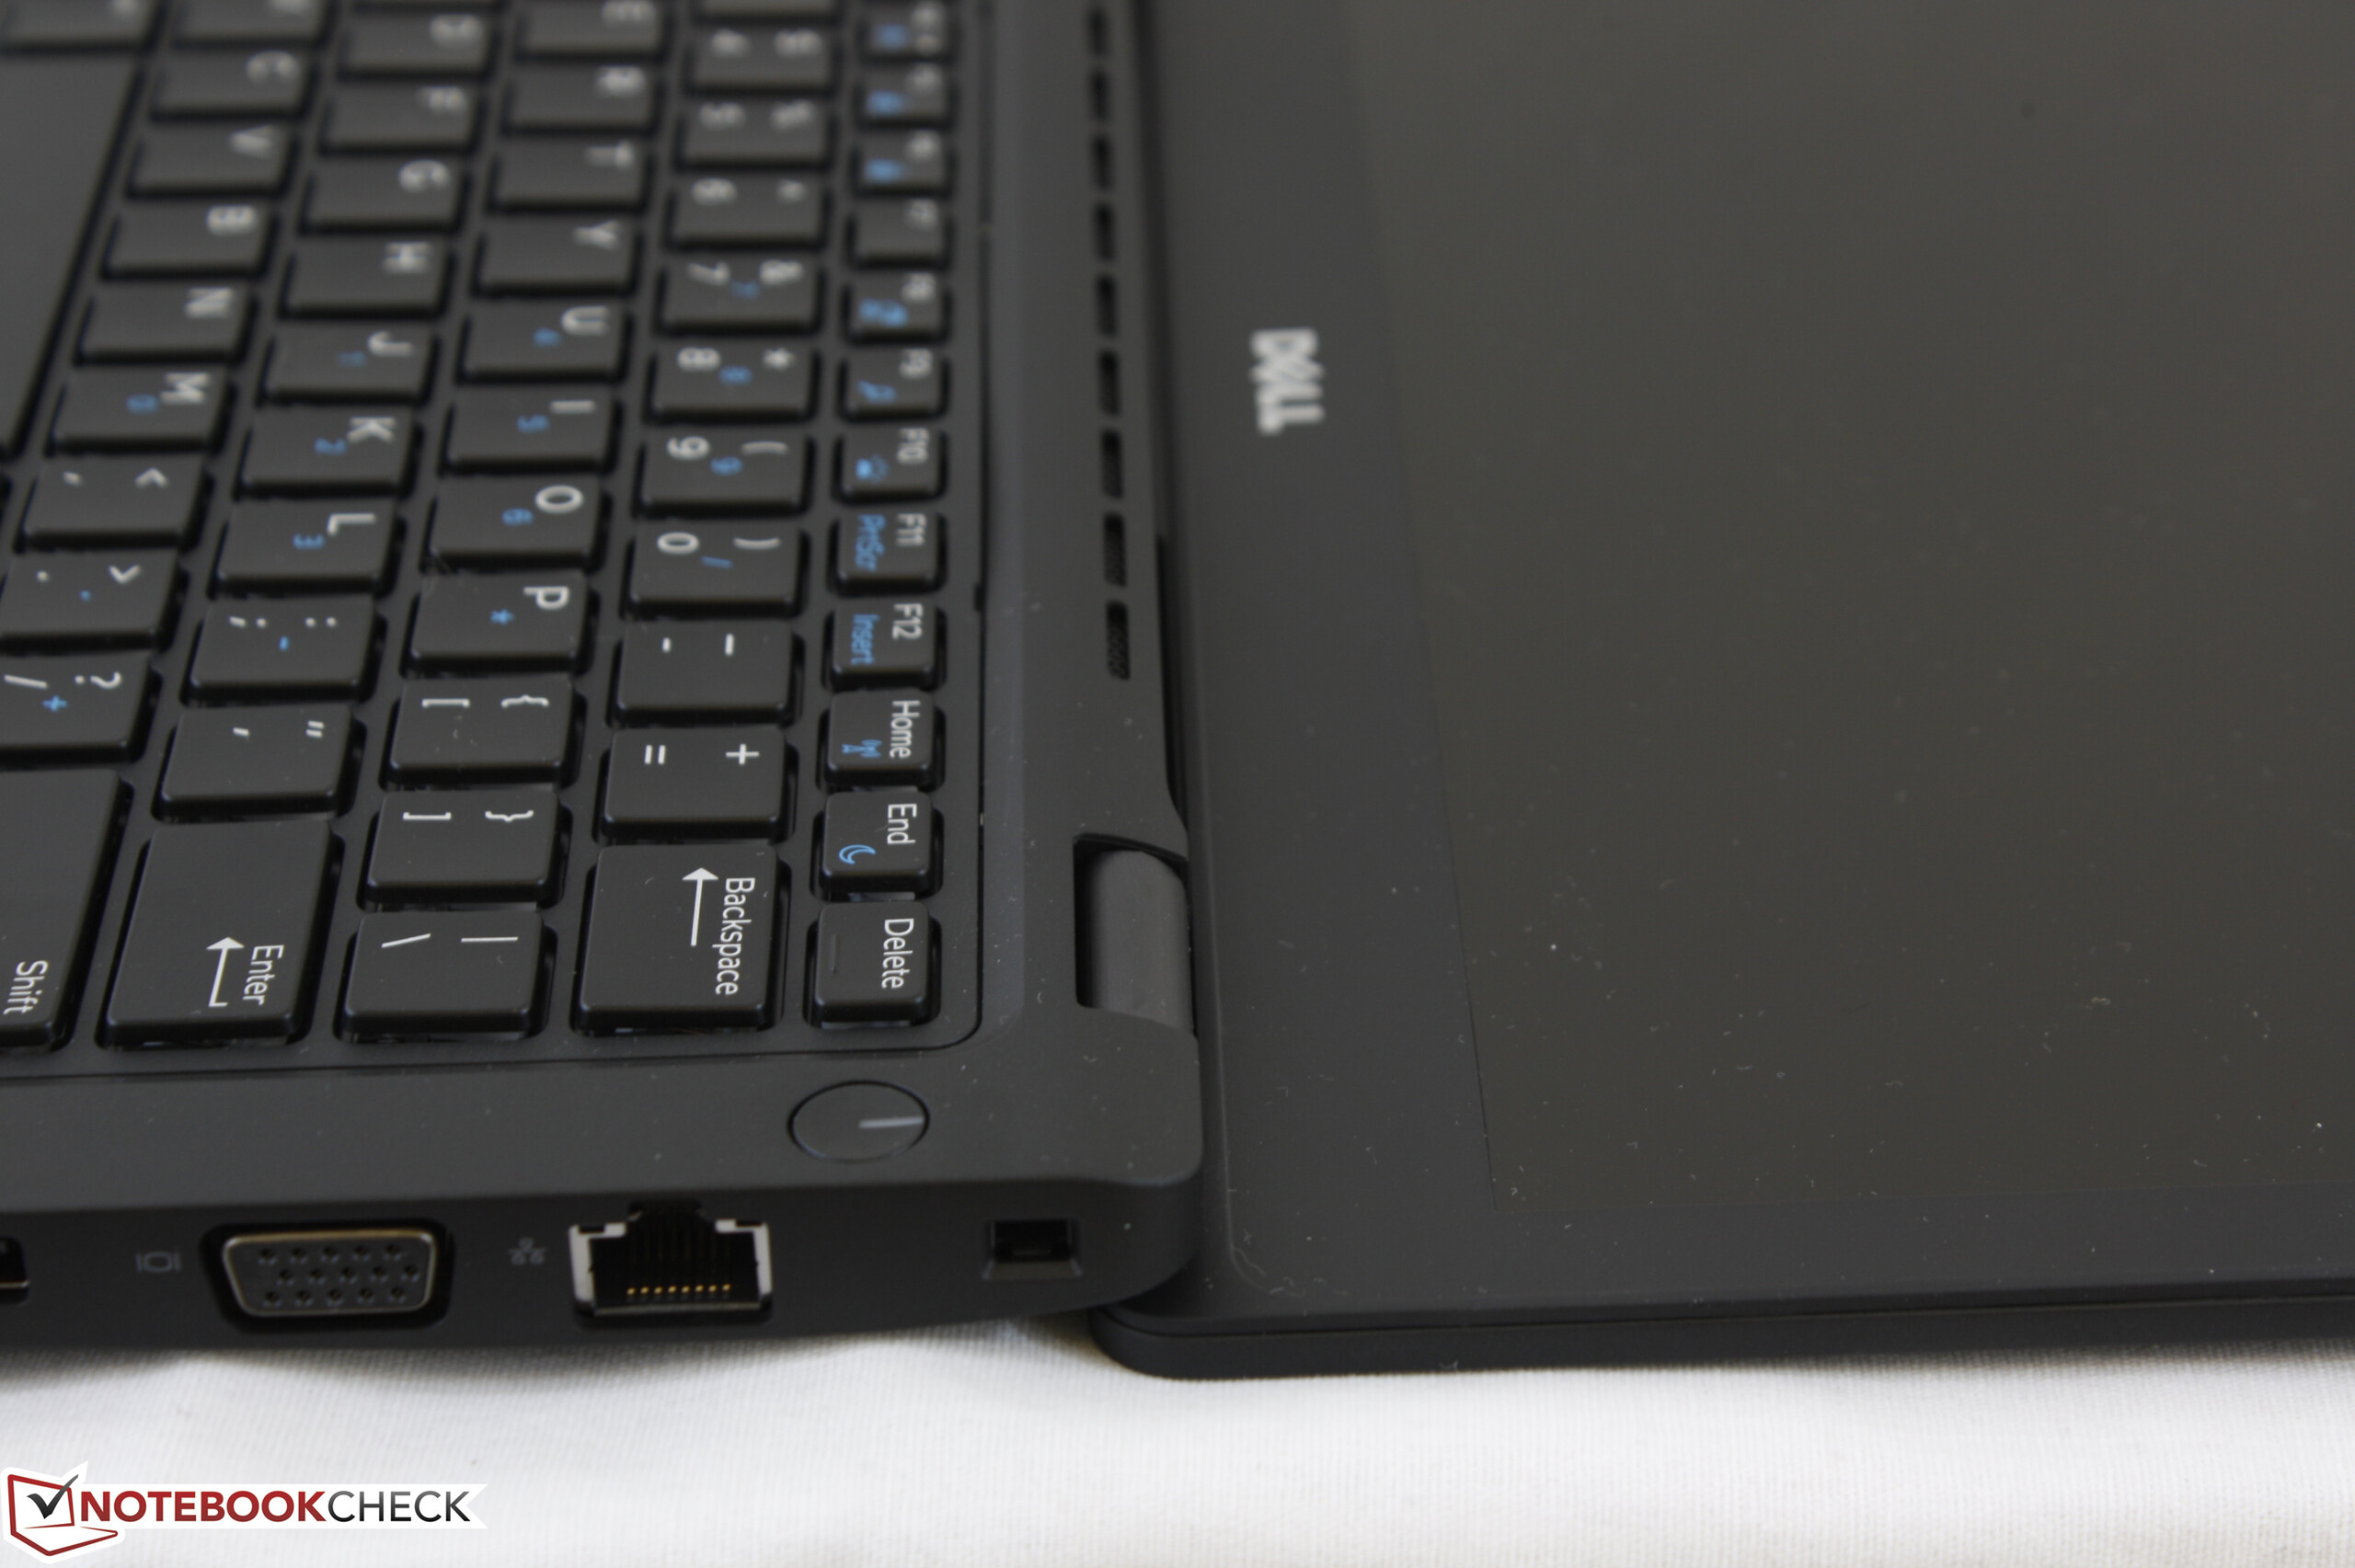
La tastiera in parte spugnosa potrebbe richiedere un po' di pratica e gli utenti con mani grandi tenderanno ad evitarla per lunghe sedute di scrittura. Il 5280 è più adatto a chi sta spesso in giro rispetto ad un utilizzo fisso a casa o in ufficio.
Nota: Si tratta di una recensione breve, con alcune sezioni non tradotte, per la versione completa guarda qui.
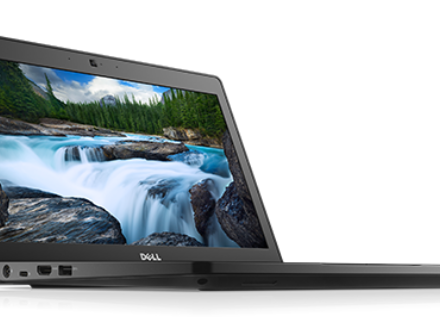
Dell Latitude 5280
- 05/27/2017 v6 (old)
Allen Ngo
Price comparison
