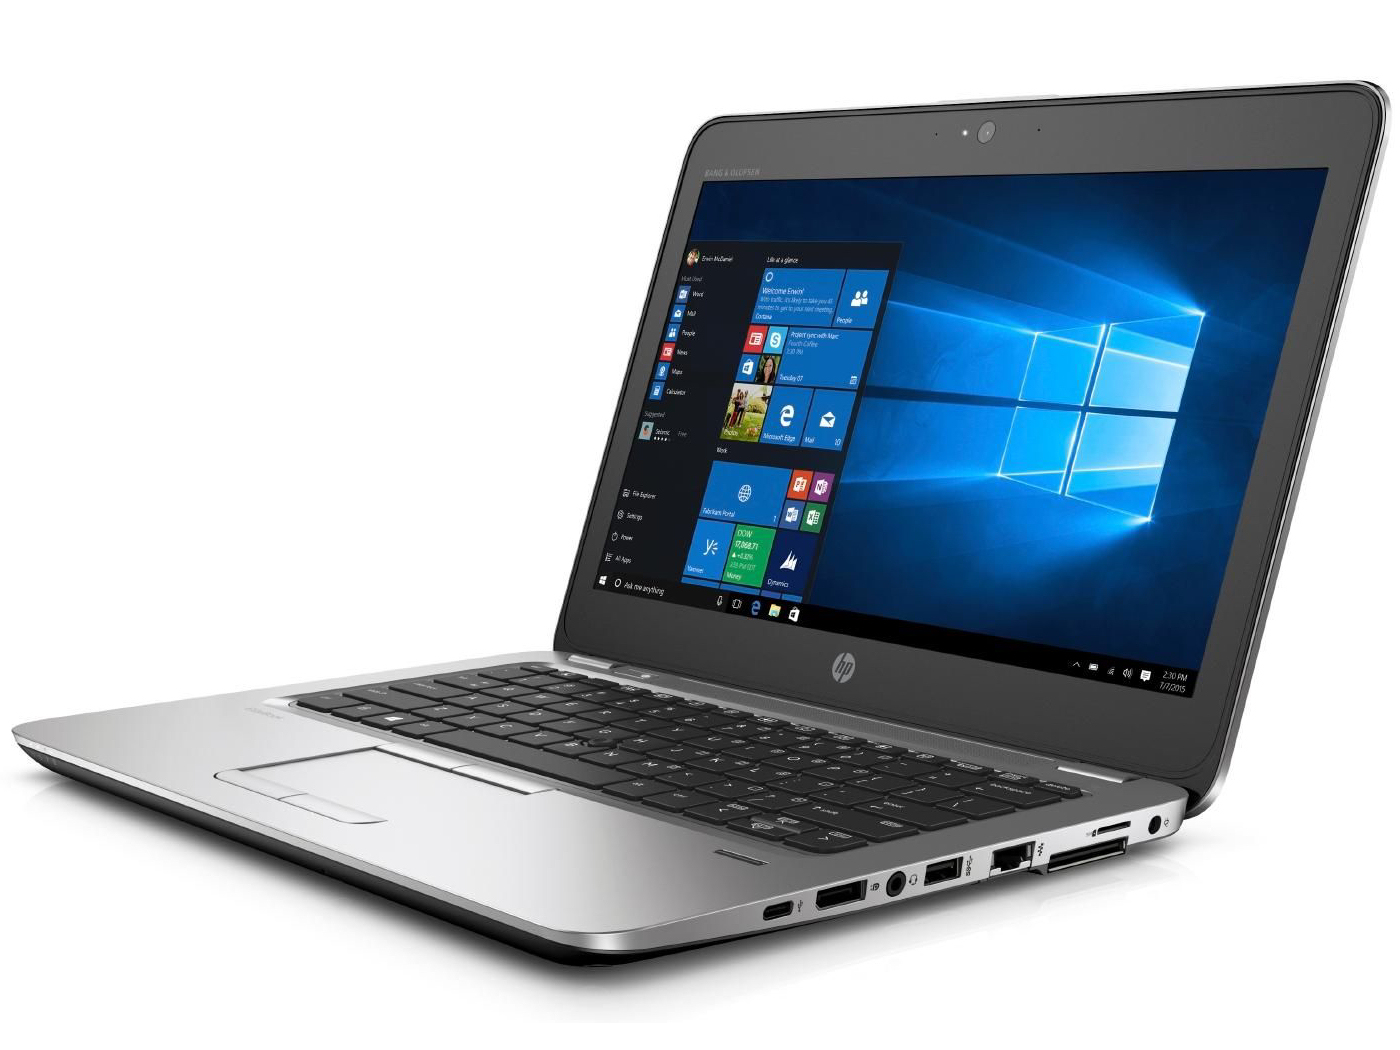
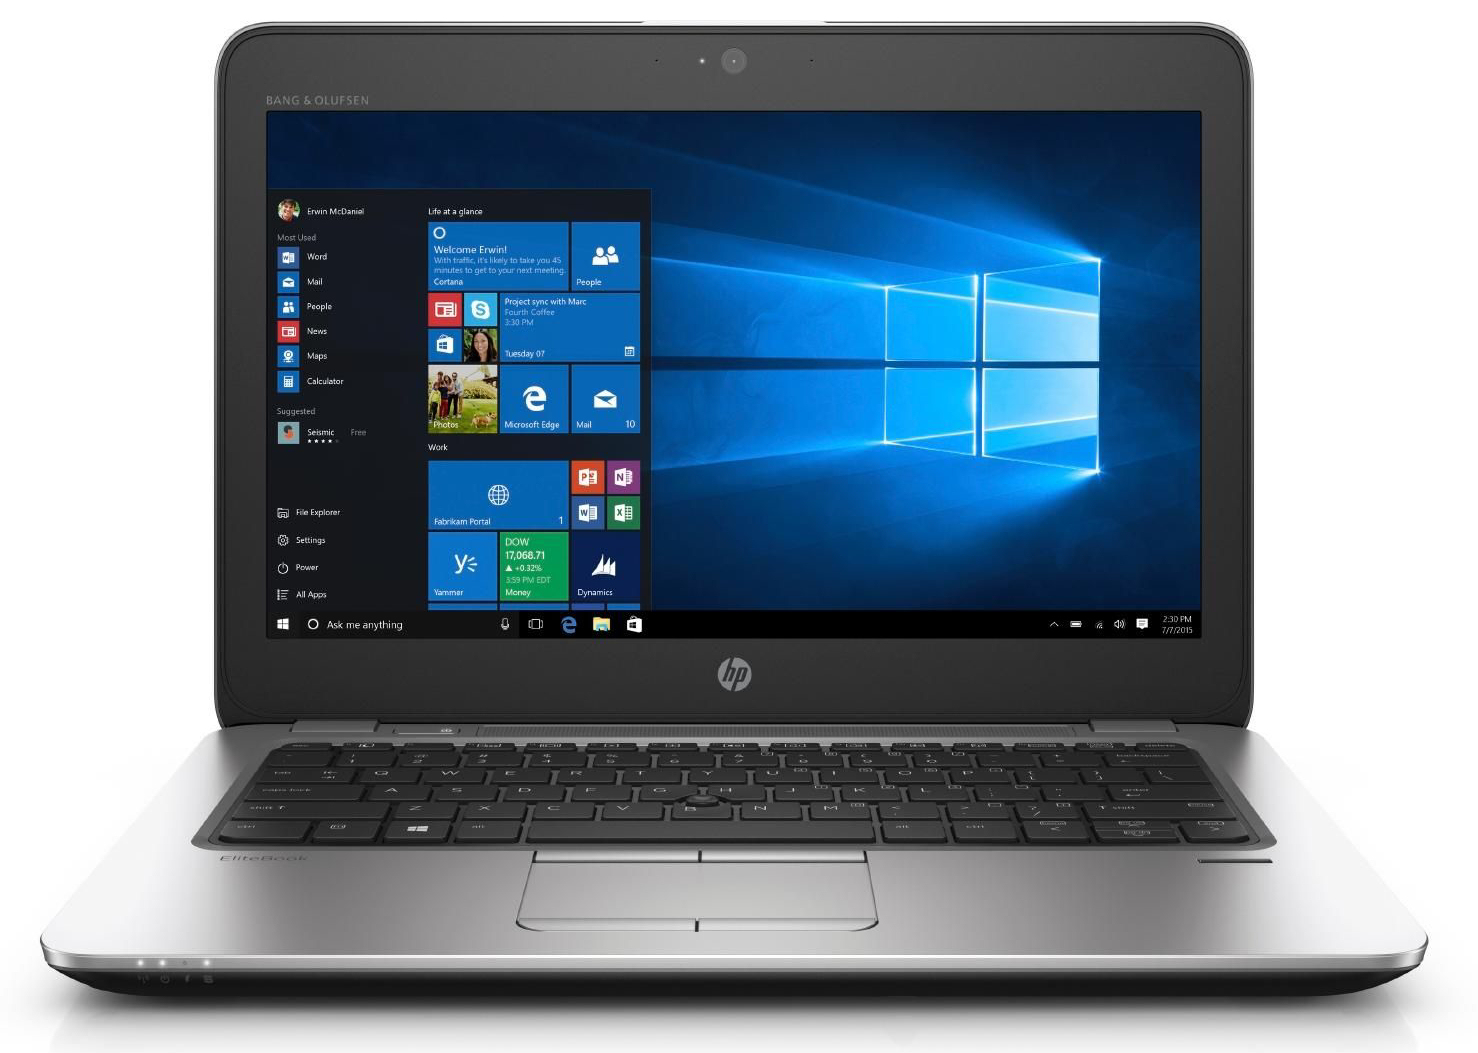
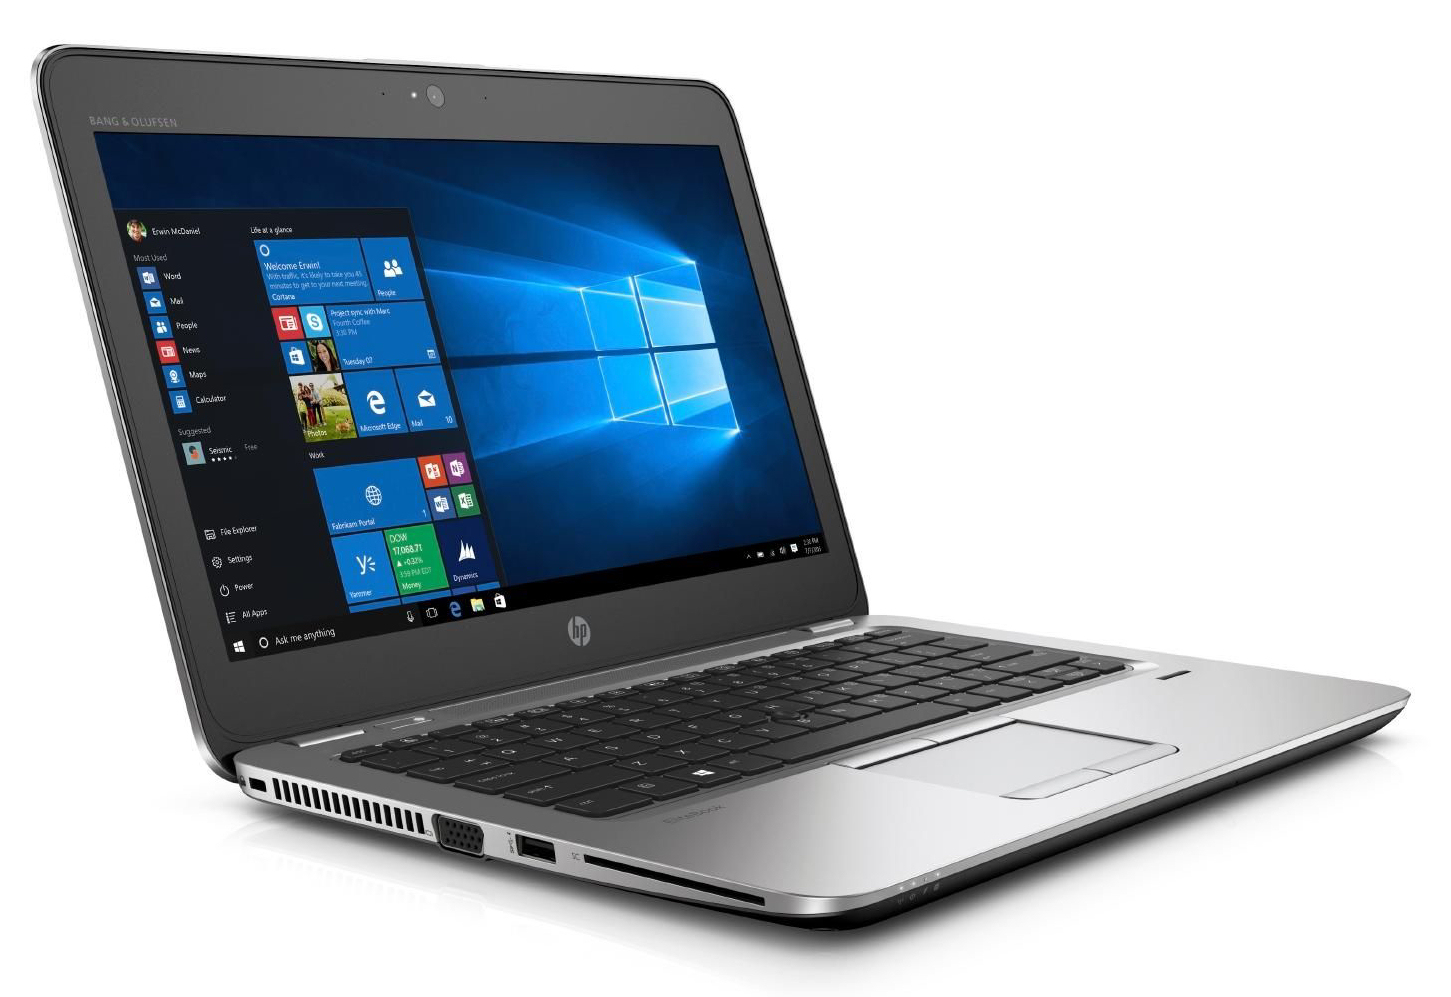
Recensione breve del Portatile HP EliteBook 725 G4 (A12-9800B, Full-HD)
| SD Card Reader | |
| average JPG Copy Test (av. of 3 runs) | |
| Dell Latitude 12 E7270 | |
| HP EliteBook 820 G4 Z2V72ET | |
| Toshiba Portege Z30-C-138 | |
| Lenovo ThinkPad X260-20F6007RGE | |
| HP EliteBook 725 G4 | |
| HP EliteBook 725 G3-P4T48EA | |
| maximum AS SSD Seq Read Test (1GB) | |
| Dell Latitude 12 E7270 | |
| HP EliteBook 820 G4 Z2V72ET | |
| Toshiba Portege Z30-C-138 | |
| Lenovo ThinkPad X260-20F6007RGE | |
| HP EliteBook 725 G3-P4T48EA | |
| HP EliteBook 725 G4 | |
| Networking | |
| iperf3 transmit AX12 | |
| Apple MacBook Pro 13 2016 (2.9 GHz) | |
| HP EliteBook 725 G4 | |
| HP EliteBook 820 G4 Z2V72ET (jseb) | |
| iperf3 receive AX12 | |
| Apple MacBook Pro 13 2016 (2.9 GHz) | |
| HP EliteBook 725 G4 | |
| HP EliteBook 820 G4 Z2V72ET (jseb) | |
| |||||||||||||||||||||||||
Distribuzione della luminosità: 88 %
Al centro con la batteria: 329 cd/m²
Contrasto: 1732:1 (Nero: 0.19 cd/m²)
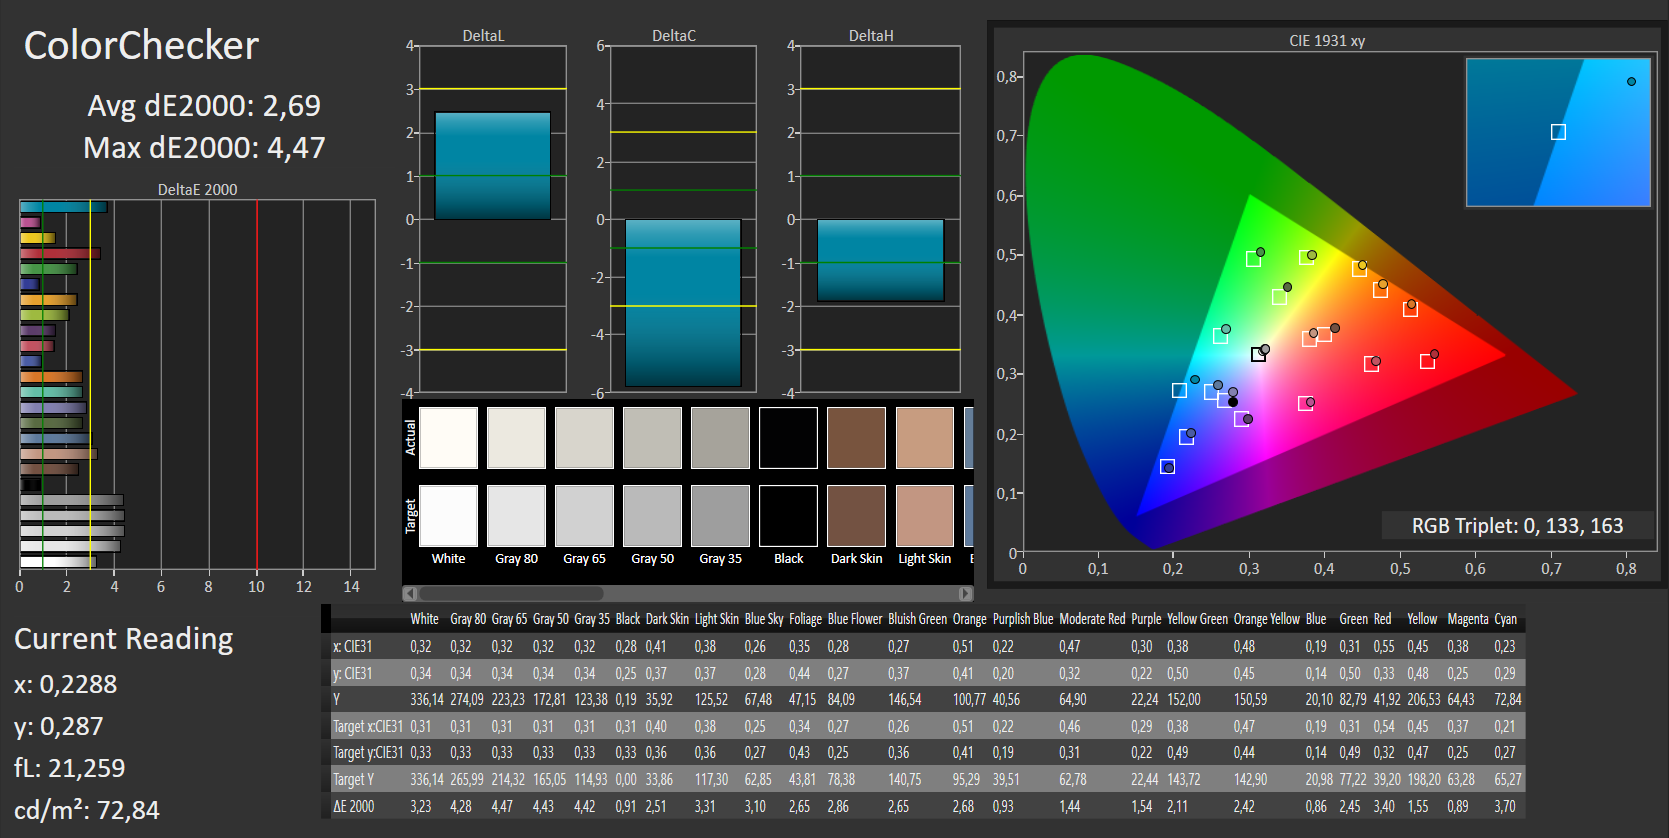
ΔE ColorChecker Calman: 2.69 | ∀{0.5-29.43 Ø4.72}
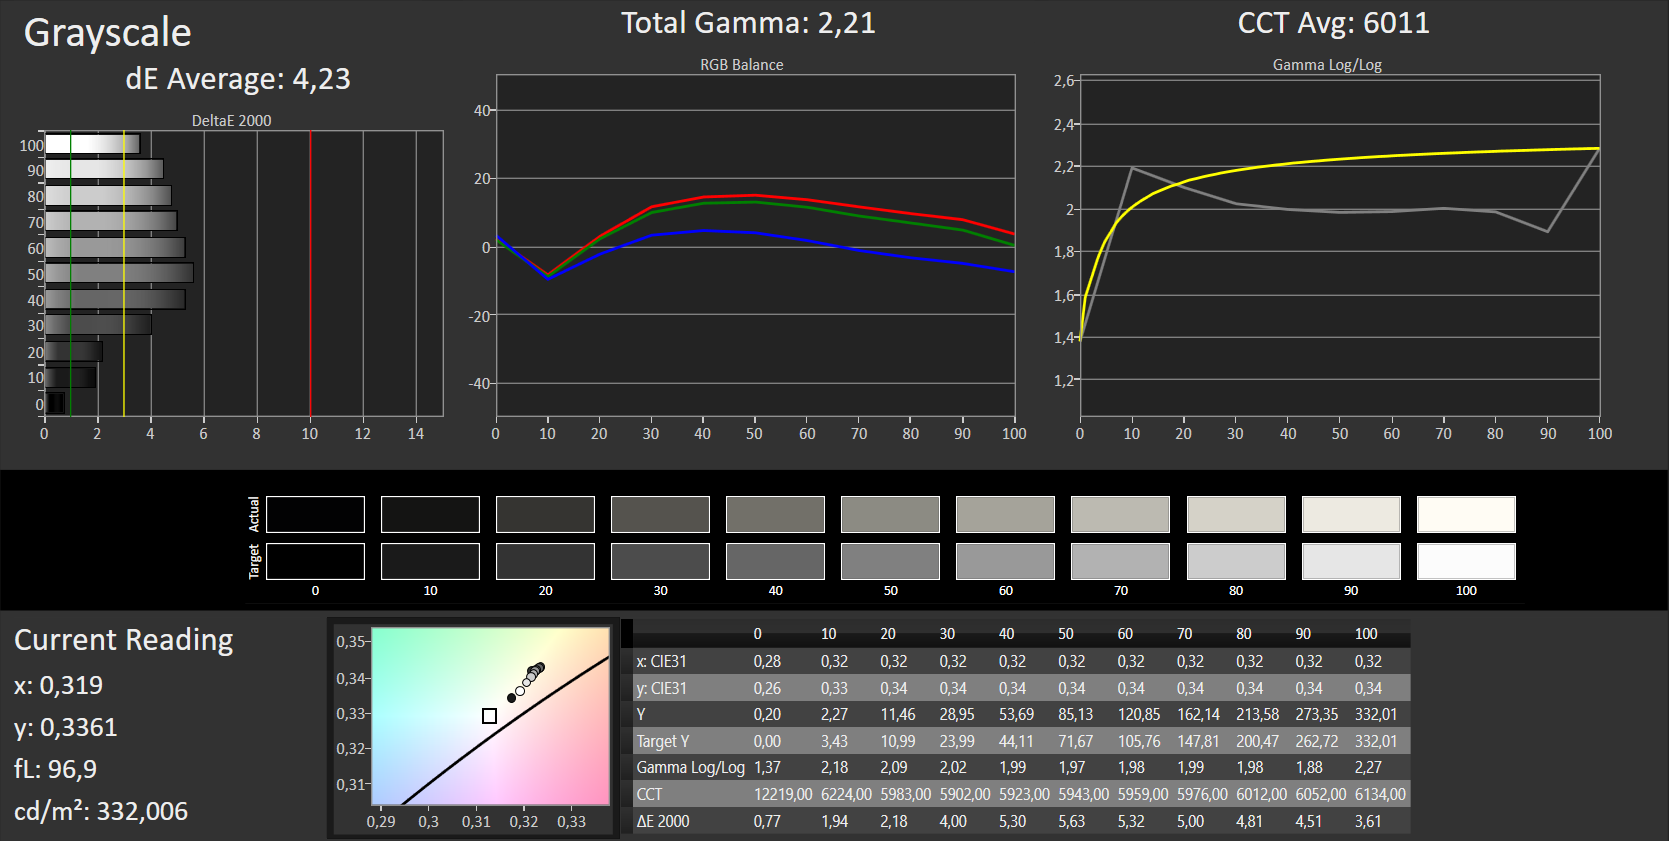
ΔE Greyscale Calman: 4.23 | ∀{0.09-98 Ø4.97}
72% sRGB (Argyll 1.6.3 3D)
46% AdobeRGB 1998 (Argyll 1.6.3 3D)
50.8% AdobeRGB 1998 (Argyll 3D)
72.3% sRGB (Argyll 3D)
49.16% Display P3 (Argyll 3D)
Gamma: 2.21
CCT: 6011 K
| HP EliteBook 725 G4 IPS, 1920x1080, 12.5" | HP EliteBook 725 G3-P4T48EA TN LED, 1366x768, 12.5" | HP EliteBook 820 G4 Z2V72ET IPS, 1920x1080, 12.5" | Toshiba Portege Z30-C-138 IPS, 1920x1080, 13.3" | Dell Latitude 12 E7270 IPS LED, 1920x1080, 12.5" | Lenovo ThinkPad X260-20F6007RGE IPS, 1920x1080, 12.5" | |
|---|---|---|---|---|---|---|
| Display | -3% | -9% | 37% | -19% | -9% | |
| Display P3 Coverage (%) | 49.16 | 47.15 -4% | 44.45 -10% | 67.9 38% | 39.7 -19% | 44.71 -9% |
| sRGB Coverage (%) | 72.3 | 71 -2% | 65.5 -9% | 98 36% | 59.2 -18% | 66.1 -9% |
| AdobeRGB 1998 Coverage (%) | 50.8 | 48.71 -4% | 46.04 -9% | 69.8 37% | 41.07 -19% | 46.23 -9% |
| Response Times | -3% | 9% | -3% | -1% | 9% | |
| Response Time Grey 50% / Grey 80% * (ms) | 47 ? | 50 ? -6% | 35 ? 26% | 42 ? 11% | 38.4 ? 18% | 32.8 ? 30% |
| Response Time Black / White * (ms) | 24 ? | 24 ? -0% | 26 ? -8% | 28 ? -17% | 28.8 ? -20% | 27.2 ? -13% |
| PWM Frequency (Hz) | 217 ? | |||||
| Screen | -85% | -56% | -29% | -73% | -49% | |
| Brightness middle (cd/m²) | 329 | 241 -27% | 326 -1% | 300 -9% | 353 7% | 337 2% |
| Brightness (cd/m²) | 310 | 240 -23% | 304 -2% | 280 -10% | 334 8% | 322 4% |
| Brightness Distribution (%) | 88 | 83 -6% | 81 -8% | 87 -1% | 91 3% | 91 3% |
| Black Level * (cd/m²) | 0.19 | 0.54 -184% | 0.29 -53% | 0.31 -63% | 0.47 -147% | 0.32 -68% |
| Contrast (:1) | 1732 | 446 -74% | 1124 -35% | 968 -44% | 751 -57% | 1053 -39% |
| Colorchecker dE 2000 * | 2.69 | 8.04 -199% | 6.49 -141% | 4.9 -82% | 7.79 -190% | 5.71 -112% |
| Colorchecker dE 2000 max. * | 4.47 | 13.9 -211% | 15.95 -257% | 8.91 -99% | 15.19 -240% | 15.39 -244% |
| Greyscale dE 2000 * | 4.23 | 9.52 -125% | 6.16 -46% | 6.69 -58% | 7.38 -74% | 5.15 -22% |
| Gamma | 2.21 100% | 2.42 91% | 2.32 95% | 2.33 94% | 2.43 91% | 2.38 92% |
| CCT | 6011 108% | 11362 57% | 7575 86% | 6487 100% | 6158 106% | 6881 94% |
| Color Space (Percent of AdobeRGB 1998) (%) | 46 | 45.03 -2% | 42 -9% | 63 37% | 37.72 -18% | 42.38 -8% |
| Color Space (Percent of sRGB) (%) | 72 | 71.12 -1% | 65 -10% | 98 36% | 58.87 -18% | 65.62 -9% |
| Media totale (Programma / Settaggio) | -30% /
-58% | -19% /
-38% | 2% /
-13% | -31% /
-52% | -16% /
-34% |
* ... Meglio usare valori piccoli
Sfarfallio dello schermo / PWM (Pulse-Width Modulation)
| flickering dello schermo / PWM non rilevato | ||
In confronto: 52 % di tutti i dispositivi testati non utilizza PWM per ridurre la luminosita' del display. Se è rilevato PWM, una media di 7769 (minimo: 5 - massimo: 343500) Hz è stata rilevata. | ||
Tempi di risposta del Display
| ↔ Tempi di risposta dal Nero al Bianco | ||
|---|---|---|
| 24 ms ... aumenta ↗ e diminuisce ↘ combinato | ↗ 14 ms Incremento | 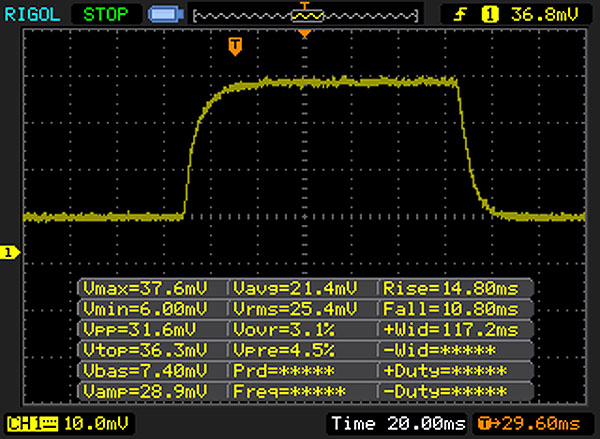 |
| ↘ 10 ms Calo | ||
| Lo schermo mostra buoni tempi di risposta durante i nostri tests, ma potrebbe essere troppo lento per i gamers competitivi. In confronto, tutti i dispositivi di test variano da 0.1 (minimo) a 240 (massimo) ms. » 54 % di tutti i dispositivi è migliore. Questo significa che i tempi di risposta rilevati sono peggiori rispetto alla media di tutti i dispositivi testati (19.8 ms). | ||
| ↔ Tempo di risposta dal 50% Grigio all'80% Grigio | ||
| 47 ms ... aumenta ↗ e diminuisce ↘ combinato | ↗ 27 ms Incremento | 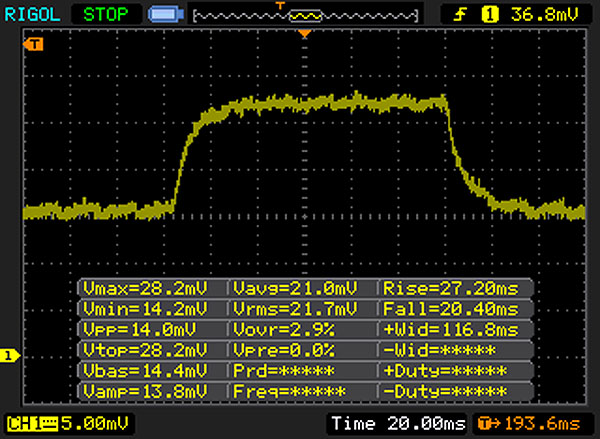 |
| ↘ 20 ms Calo | ||
| Lo schermo mostra tempi di risposta lenti nei nostri tests e sarà insoddisfacente per i gamers. In confronto, tutti i dispositivi di test variano da 0.165 (minimo) a 636 (massimo) ms. » 81 % di tutti i dispositivi è migliore. Questo significa che i tempi di risposta rilevati sono peggiori rispetto alla media di tutti i dispositivi testati (31 ms). | ||
| Cinebench R11.5 | |
| CPU Multi 64Bit | |
| HP EliteBook 820 G4 Z2V72ET | |
| Lenovo ThinkPad X260-20F6007RGE | |
| Dell Latitude 12 E7270 | |
| HP EliteBook 725 G4 | |
| Apple MacBook 12 (Early 2016) 1.1 GHz | |
| Apple MacBook 12 (Early 2016) 1.1 GHz | |
| HP EliteBook 725 G3-P4T48EA | |
| CPU Single 64Bit | |
| HP EliteBook 820 G4 Z2V72ET | |
| Lenovo ThinkPad X260-20F6007RGE | |
| Dell Latitude 12 E7270 | |
| Apple MacBook 12 (Early 2016) 1.1 GHz | |
| Apple MacBook 12 (Early 2016) 1.1 GHz | |
| HP EliteBook 725 G4 | |
| HP EliteBook 725 G3-P4T48EA | |
| Cinebench R10 | |
| Rendering Multiple CPUs 32Bit | |
| HP EliteBook 820 G4 Z2V72ET | |
| Lenovo ThinkPad X260-20F6007RGE | |
| Apple MacBook 12 (Early 2016) 1.1 GHz | |
| HP EliteBook 725 G4 | |
| HP EliteBook 725 G3-P4T48EA | |
| Rendering Single 32Bit | |
| HP EliteBook 820 G4 Z2V72ET | |
| Lenovo ThinkPad X260-20F6007RGE | |
| Apple MacBook 12 (Early 2016) 1.1 GHz | |
| HP EliteBook 725 G4 | |
| HP EliteBook 725 G3-P4T48EA | |
| Geekbench 3 | |
| 32 Bit Single-Core Score | |
| HP EliteBook 820 G4 Z2V72ET | |
| Lenovo ThinkPad X260-20F6007RGE | |
| HP EliteBook 725 G4 | |
| HP EliteBook 725 G3-P4T48EA | |
| 32 Bit Multi-Core Score | |
| HP EliteBook 820 G4 Z2V72ET | |
| Lenovo ThinkPad X260-20F6007RGE | |
| HP EliteBook 725 G4 | |
| HP EliteBook 725 G3-P4T48EA | |
| Geekbench 4.0 | |
| 64 Bit Single-Core Score | |
| HP EliteBook 820 G4 Z2V72ET | |
| Apple MacBook Pro 13 2016 (2.9 GHz) | |
| HP EliteBook 725 G4 | |
| 64 Bit Multi-Core Score | |
| HP EliteBook 820 G4 Z2V72ET | |
| Apple MacBook Pro 13 2016 (2.9 GHz) | |
| HP EliteBook 725 G4 | |
| JetStream 1.1 - 1.1 Total | |
| HP EliteBook 820 G4 Z2V72ET | |
| Apple MacBook Pro 13 2016 (2.9 GHz) | |
| Apple MacBook Pro 13 2016 (2.9 GHz) | |
| Toshiba Portege Z30-C-138 | |
| Lenovo ThinkPad X260-20F6007RGE | |
| Dell Latitude 12 E7270 | |
| Apple MacBook 12 (Early 2016) 1.1 GHz | |
| Apple MacBook 12 (Early 2016) 1.1 GHz | |
| HP EliteBook 725 G4 | |
| HP EliteBook 725 G3-P4T48EA | |
| HP EliteBook 725 G3-P4T48EA | |
| PCMark 7 Score | 4143 punti | |
| PCMark 8 Home Score Accelerated v2 | 2665 punti | |
| PCMark 8 Creative Score Accelerated v2 | 3313 punti | |
| PCMark 8 Work Score Accelerated v2 | 3885 punti | |
Aiuto | ||
| PCMark 8 | |
| Home Score Accelerated v2 | |
| Apple MacBook Pro 13 2016 (2.9 GHz) | |
| HP EliteBook 820 G4 Z2V72ET | |
| Dell Latitude 12 E7270 | |
| Lenovo ThinkPad X260-20F6007RGE | |
| Toshiba Portege Z30-C-138 | |
| HP EliteBook 725 G3-P4T48EA | |
| HP EliteBook 725 G4 | |
| Apple MacBook 12 (Early 2016) 1.1 GHz | |
| Work Score Accelerated v2 | |
| HP EliteBook 820 G4 Z2V72ET | |
| Dell Latitude 12 E7270 | |
| Lenovo ThinkPad X260-20F6007RGE | |
| Apple MacBook Pro 13 2016 (2.9 GHz) | |
| HP EliteBook 725 G4 | |
| HP EliteBook 725 G3-P4T48EA | |
| Apple MacBook 12 (Early 2016) 1.1 GHz | |

| HP EliteBook 725 G4 Samsung PM961 MZVLW256HEHP | HP EliteBook 725 G3-P4T48EA Hitachi Travelstar Z7K500 HTS725050A7E630 | HP EliteBook 820 G4 Z2V72ET Samsung PM951 NVMe MZVLV512 | Toshiba Portege Z30-C-138 Toshiba HG6 THNSNJ512G8NY | Dell Latitude 12 E7270 Liteon L8H-256V2G | Lenovo ThinkPad X260-20F6007RGE Liteonit LCH-512V2S | |
|---|---|---|---|---|---|---|
| CrystalDiskMark 3.0 | -96% | 101% | -8% | 26% | 12% | |
| Read Seq (MB/s) | 1963 | 125.3 -94% | 1315 -33% | 518 -74% | 498.4 -75% | 499.6 -75% |
| Write Seq (MB/s) | 1409 | 124.3 -91% | 594 -58% | 423.3 -70% | 286.7 -80% | 403 -71% |
| Read 512 (MB/s) | 949 | 40.95 -96% | 661 -30% | 414.8 -56% | 322.9 -66% | |
| Write 512 (MB/s) | 890 | 57.6 -94% | 594 -33% | 379.9 -57% | 372.4 -58% | |
| Read 4k (MB/s) | 29.75 | 0.495 -98% | 42.87 44% | 21.17 -29% | 24.89 -16% | 27.22 -9% |
| Write 4k (MB/s) | 47.35 | 1.13 -98% | 151.6 220% | 86.3 82% | 88 86% | 83.6 77% |
| Read 4k QD32 (MB/s) | 139.7 | 1.129 -99% | 568 307% | 227.3 63% | 280.5 101% | 316.5 127% |
| Write 4k QD32 (MB/s) | 100.2 | 1.133 -99% | 491.7 391% | 174.7 74% | 241.9 141% | 273.1 173% |
| 3DMark 06 Standard Score | 5635 punti | |
| 3DMark 11 Performance | 1753 punti | |
| 3DMark Ice Storm Standard Score | 39764 punti | |
| 3DMark Cloud Gate Standard Score | 3955 punti | |
| 3DMark Fire Strike Score | 866 punti | |
| 3DMark Fire Strike Extreme Score | 442 punti | |
| 3DMark Time Spy Score | 338 punti | |
Aiuto | ||
| 3DMark 11 - 1280x720 Performance GPU | |
| Apple MacBook Pro 13 2016 (2.9 GHz) | |
| HP EliteBook 725 G4 | |
| HP EliteBook 725 G4 | |
| HP 15-ba077ng | |
| HP EliteBook 725 G3-P4T48EA | |
| HP EliteBook 725 G3-P4T48EA | |
| HP EliteBook 820 G4 Z2V72ET | |
| Toshiba Portege Z30-C-138 | |
| Dell Latitude 12 E7270 | |
| Lenovo ThinkPad X260-20F6007RGE | |
| Apple MacBook 12 (Early 2016) 1.1 GHz | |
| 3DMark | |
| 1280x720 Cloud Gate Standard Graphics | |
| Apple MacBook Pro 13 2016 (2.9 GHz) | |
| HP 15-ba077ng | |
| HP EliteBook 820 G4 Z2V72ET | |
| Lenovo ThinkPad X260-20F6007RGE | |
| Dell Latitude 12 E7270 | |
| Apple MacBook 12 (Early 2016) 1.1 GHz | |
| HP EliteBook 725 G4 | |
| HP EliteBook 725 G3-P4T48EA | |
| 1920x1080 Fire Strike Graphics | |
| Apple MacBook Pro 13 2016 (2.9 GHz) | |
| HP EliteBook 725 G4 | |
| HP EliteBook 725 G4 | |
| HP 15-ba077ng | |
| HP EliteBook 725 G3-P4T48EA | |
| HP EliteBook 725 G3-P4T48EA | |
| HP EliteBook 820 G4 Z2V72ET | |
| Lenovo ThinkPad X260-20F6007RGE | |
| Dell Latitude 12 E7270 | |
| Apple MacBook 12 (Early 2016) 1.1 GHz | |
| basso | medio | alto | ultra | |
|---|---|---|---|---|
| Tomb Raider (2013) | 54.9 | 29.8 | 20.9 | 10.7 |
| BioShock Infinite (2013) | 46.8 | 35.8 | 22.7 | 7.8 |
| Battlefield 4 (2013) | 28.7 | 20.7 | 13.7 | 5.1 |
| Middle-earth: Shadow of Mordor (2014) | 21.7 | 14.7 | ||
| The Witcher 3 (2015) | 14 | 9.2 | ||
| Batman: Arkham Knight (2015) | 12 | 11 | ||
| Just Cause 3 (2015) | 16 | 13.2 | ||
| The Division (2016) | 17.4 | 10.6 | ||
| Mirror's Edge Catalyst (2016) | 16.9 | 11.7 | ||
| Dishonored 2 (2016) | 11 | 8.8 | ||
| Resident Evil 7 (2017) | 31.9 | 12.2 | ||
| For Honor (2017) | 20.6 | 7.1 | ||
| Ghost Recon Wildlands (2017) | 11.9 | 5.3 |
| BioShock Infinite - 1280x720 Very Low Preset | |
| Apple MacBook Pro 13 2016 (2.9 GHz) | |
| HP EliteBook 725 G4 | |
| HP EliteBook 725 G4 | |
| HP 15-ba077ng | |
| Toshiba Portege Z30-C-138 | |
| Toshiba Portege Z30-C-138 | |
| HP EliteBook 725 G3-P4T48EA | |
| HP EliteBook 820 G4 Z2V72ET | |
| Dell Latitude 12 E7270 | |
| Lenovo ThinkPad X260-20F6007RGE | |
Rumorosità
| Idle |
| 30.4 / 30.4 / 30.4 dB(A) |
| Sotto carico |
| 31.7 / 34.4 dB(A) |
 | ||
30 dB silenzioso 40 dB(A) udibile 50 dB(A) rumoroso |
||
min: | ||
| HP EliteBook 725 G4 PRO A12-9800B, Radeon R7 (Bristol Ridge) | HP EliteBook 725 G3-P4T48EA Pro A10-8700B, Radeon R6 (Carrizo) | HP EliteBook 820 G4 Z2V72ET i7-7500U, HD Graphics 620 | Toshiba Portege Z30-C-138 6500U, HD Graphics 520 | Dell Latitude 12 E7270 6300U, HD Graphics 520 | Lenovo ThinkPad X260-20F6007RGE 6500U, HD Graphics 520 | |
|---|---|---|---|---|---|---|
| Noise | -5% | -2% | -13% | 2% | -0% | |
| off /ambiente * (dB) | 30.4 | 28.9 5% | 30.7 -1% | 31.2 -3% | 28.9 5% | 29 5% |
| Idle Minimum * (dB) | 30.4 | 30.5 -0% | 30.7 -1% | 31.2 -3% | 28.9 5% | 29 5% |
| Idle Average * (dB) | 30.4 | 30.5 -0% | 30.7 -1% | 31.2 -3% | 28.9 5% | 29 5% |
| Idle Maximum * (dB) | 30.4 | 30.5 -0% | 30.7 -1% | 31.2 -3% | 28.9 5% | 29 5% |
| Load Average * (dB) | 31.7 | 38.2 -21% | 35.3 -11% | 43.3 -37% | 31.3 1% | 35.1 -11% |
| Load Maximum * (dB) | 34.4 | 38.4 -12% | 33.7 2% | 43.3 -26% | 37.6 -9% | 37.8 -10% |
* ... Meglio usare valori piccoli
(+) La temperatura massima sul lato superiore è di 36.5 °C / 98 F, rispetto alla media di 35.9 °C / 97 F, che varia da 21.4 a 59 °C per questa classe Subnotebook.
(+) Il lato inferiore si riscalda fino ad un massimo di 34.1 °C / 93 F, rispetto alla media di 39.2 °C / 103 F
(+) In idle, la temperatura media del lato superiore è di 23.5 °C / 74 F, rispetto alla media deld ispositivo di 30.8 °C / 87 F.
(+) I poggiapolsi e il touchpad sono piu' freddi della temperatura della pelle con un massimo di 26.7 °C / 80.1 F e sono quindi freddi al tatto.
(±) La temperatura media della zona del palmo della mano di dispositivi simili e'stata di 28.2 °C / 82.8 F (+1.5 °C / 2.7 F).
| HP EliteBook 725 G4 PRO A12-9800B, Radeon R7 (Bristol Ridge) | HP EliteBook 725 G3-P4T48EA Pro A10-8700B, Radeon R6 (Carrizo) | HP EliteBook 820 G4 Z2V72ET i7-7500U, HD Graphics 620 | Toshiba Portege Z30-C-138 6500U, HD Graphics 520 | Dell Latitude 12 E7270 6300U, HD Graphics 520 | Lenovo ThinkPad X260-20F6007RGE 6500U, HD Graphics 520 | |
|---|---|---|---|---|---|---|
| Heat | -38% | -7% | -4% | -35% | -35% | |
| Maximum Upper Side * (°C) | 36.5 | 42.8 -17% | 37 -1% | 40.6 -11% | 44.3 -21% | 47.5 -30% |
| Maximum Bottom * (°C) | 34.1 | 54.3 -59% | 38.9 -14% | 37 -9% | 52.6 -54% | 43.6 -28% |
| Idle Upper Side * (°C) | 24.8 | 33.2 -34% | 26.3 -6% | 24.5 1% | 32.3 -30% | 34.9 -41% |
| Idle Bottom * (°C) | 25.8 | 36.5 -41% | 27 -5% | 24.9 3% | 35.1 -36% | 35.9 -39% |
* ... Meglio usare valori piccoli
HP EliteBook 725 G4 analisi audio
(-) | altoparlanti non molto potenti (66 dB)
Bassi 100 - 315 Hz
(-) | quasi nessun basso - in media 27.3% inferiori alla media
(±) | la linearità dei bassi è media (8.2% delta rispetto alla precedente frequenza)
Medi 400 - 2000 Hz
(+) | medi bilanciati - solo only 2.2% rispetto alla media
(±) | linearità dei medi adeguata (7.6% delta rispetto alla precedente frequenza)
Alti 2 - 16 kHz
(+) | Alti bilanciati - appena 2.5% dalla media
(+) | alti lineari (5.1% delta rispetto alla precedente frequenza)
Nel complesso 100 - 16.000 Hz
(±) | la linearità complessiva del suono è media (22.3% di differenza rispetto alla media
Rispetto alla stessa classe
» 76% di tutti i dispositivi testati in questa classe è stato migliore, 5% simile, 19% peggiore
» Il migliore ha avuto un delta di 5%, medio di 18%, peggiore di 53%
Rispetto a tutti i dispositivi testati
» 65% di tutti i dispositivi testati in questa classe è stato migliore, 6% similare, 29% peggiore
» Il migliore ha avuto un delta di 4%, medio di 24%, peggiore di 134%
Apple MacBook 12 (Early 2016) 1.1 GHz analisi audio
(+) | gli altoparlanti sono relativamente potenti (83.6 dB)
Bassi 100 - 315 Hz
(±) | bassi ridotti - in media 11.3% inferiori alla media
(±) | la linearità dei bassi è media (14.2% delta rispetto alla precedente frequenza)
Medi 400 - 2000 Hz
(+) | medi bilanciati - solo only 2.4% rispetto alla media
(+) | medi lineari (5.5% delta rispetto alla precedente frequenza)
Alti 2 - 16 kHz
(+) | Alti bilanciati - appena 2% dalla media
(+) | alti lineari (4.5% delta rispetto alla precedente frequenza)
Nel complesso 100 - 16.000 Hz
(+) | suono nel complesso lineare (10.2% differenza dalla media)
Rispetto alla stessa classe
» 7% di tutti i dispositivi testati in questa classe è stato migliore, 2% simile, 91% peggiore
» Il migliore ha avuto un delta di 5%, medio di 18%, peggiore di 53%
Rispetto a tutti i dispositivi testati
» 5% di tutti i dispositivi testati in questa classe è stato migliore, 1% similare, 94% peggiore
» Il migliore ha avuto un delta di 4%, medio di 24%, peggiore di 134%
| Off / Standby | |
| Idle | |
| Sotto carico |
|
Leggenda:
min: | |
| HP EliteBook 725 G4 PRO A12-9800B, Radeon R7 (Bristol Ridge) | HP EliteBook 725 G3-P4T48EA Pro A10-8700B, Radeon R6 (Carrizo) | HP EliteBook 820 G4 Z2V72ET i7-7500U, HD Graphics 620 | Toshiba Portege Z30-C-138 6500U, HD Graphics 520 | Dell Latitude 12 E7270 6300U, HD Graphics 520 | Lenovo ThinkPad X260-20F6007RGE 6500U, HD Graphics 520 | |
|---|---|---|---|---|---|---|
| Power Consumption | -35% | 19% | -11% | 7% | 5% | |
| Idle Minimum * (Watt) | 4.5 | 5.4 -20% | 2.7 40% | 3.2 29% | 3.8 16% | 3.5 22% |
| Idle Average * (Watt) | 6.3 | 7.5 -19% | 4.8 24% | 7.8 -24% | 6.7 -6% | 5.5 13% |
| Idle Maximum * (Watt) | 8.3 | 13 -57% | 6.6 20% | 8.7 -5% | 7.2 13% | 6.7 19% |
| Load Average * (Watt) | 27.6 | 41.2 -49% | 28.5 -3% | 42.2 -53% | 27.2 1% | 28.9 -5% |
| Load Maximum * (Watt) | 34.5 | 44.7 -30% | 29 16% | 35.7 -3% | 30.2 12% | 42.1 -22% |
* ... Meglio usare valori piccoli
| HP EliteBook 725 G4 PRO A12-9800B, Radeon R7 (Bristol Ridge), 49 Wh | HP EliteBook 725 G3-P4T48EA Pro A10-8700B, Radeon R6 (Carrizo), 44 Wh | HP EliteBook 820 G4 Z2V72ET i7-7500U, HD Graphics 620, 49 Wh | Toshiba Portege Z30-C-138 6500U, HD Graphics 520, 52 Wh | Dell Latitude 12 E7270 6300U, HD Graphics 520, 55 Wh | Lenovo ThinkPad X260-20F6007RGE 6500U, HD Graphics 520, 46 Wh | Apple MacBook Pro 13 2016 (2.9 GHz) 6267U, Iris Graphics 550, 49.2 Wh | Apple MacBook 12 (Early 2016) 1.1 GHz 6Y30, HD Graphics 515, 41.4 Wh | |
|---|---|---|---|---|---|---|---|---|
| Autonomia della batteria | -26% | 65% | -8% | 36% | 19% | 14% | 56% | |
| Reader / Idle (h) | 11.7 | 9.2 -21% | 22.4 91% | 17.5 50% | 15.9 36% | |||
| H.264 (h) | 5.7 | 4.3 -25% | 8.9 56% | 7.8 37% | 8.1 42% | 8.5 49% | ||
| WiFi v1.3 (h) | 6.3 | 4.7 -25% | 9.4 49% | 5.8 -8% | 8.5 35% | 8.4 33% | 9.4 49% | 8.4 33% |
| Load (h) | 2.1 | 1.4 -33% | 3.4 62% | 2.6 24% | 1.5 -29% | 1.1 -48% | 3.9 86% |
Pro
Contro
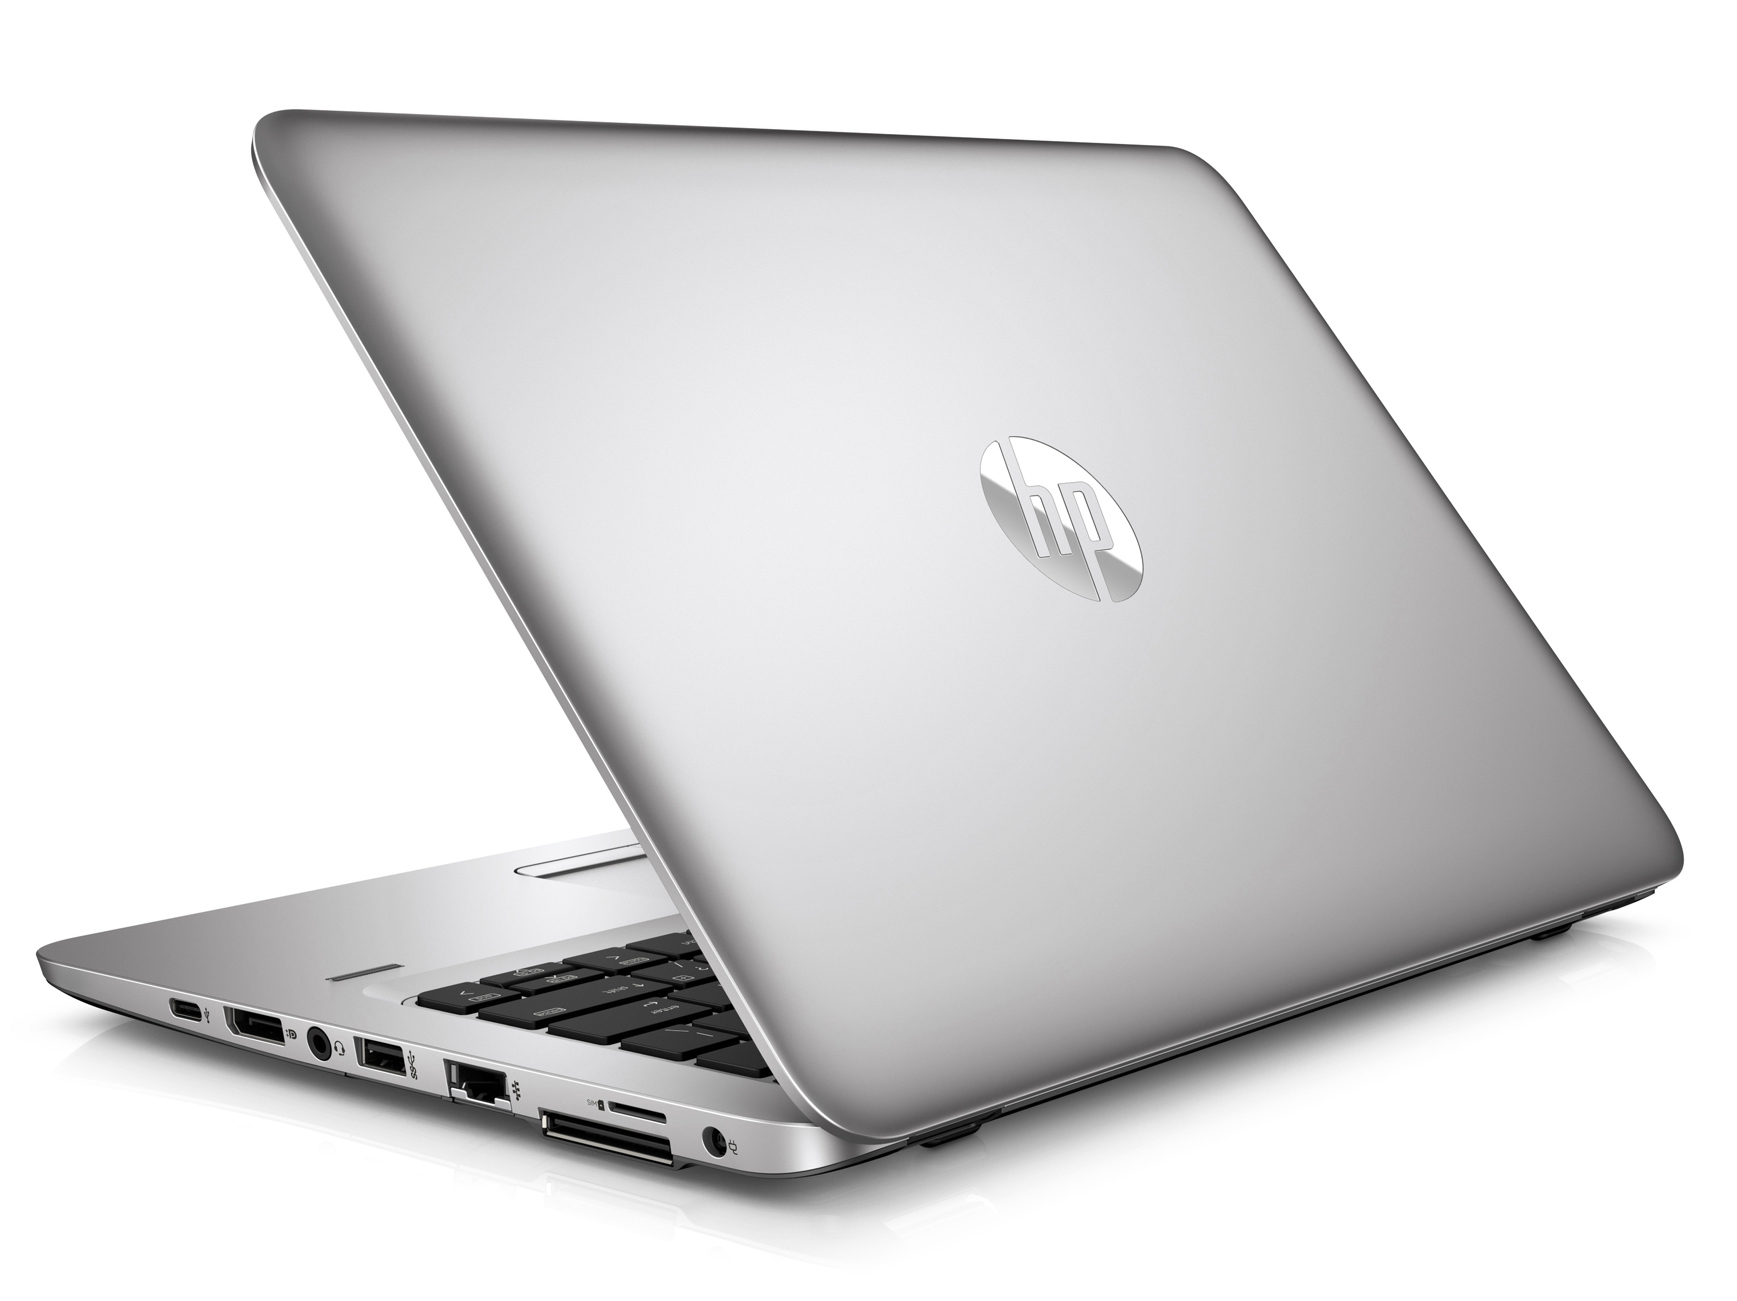
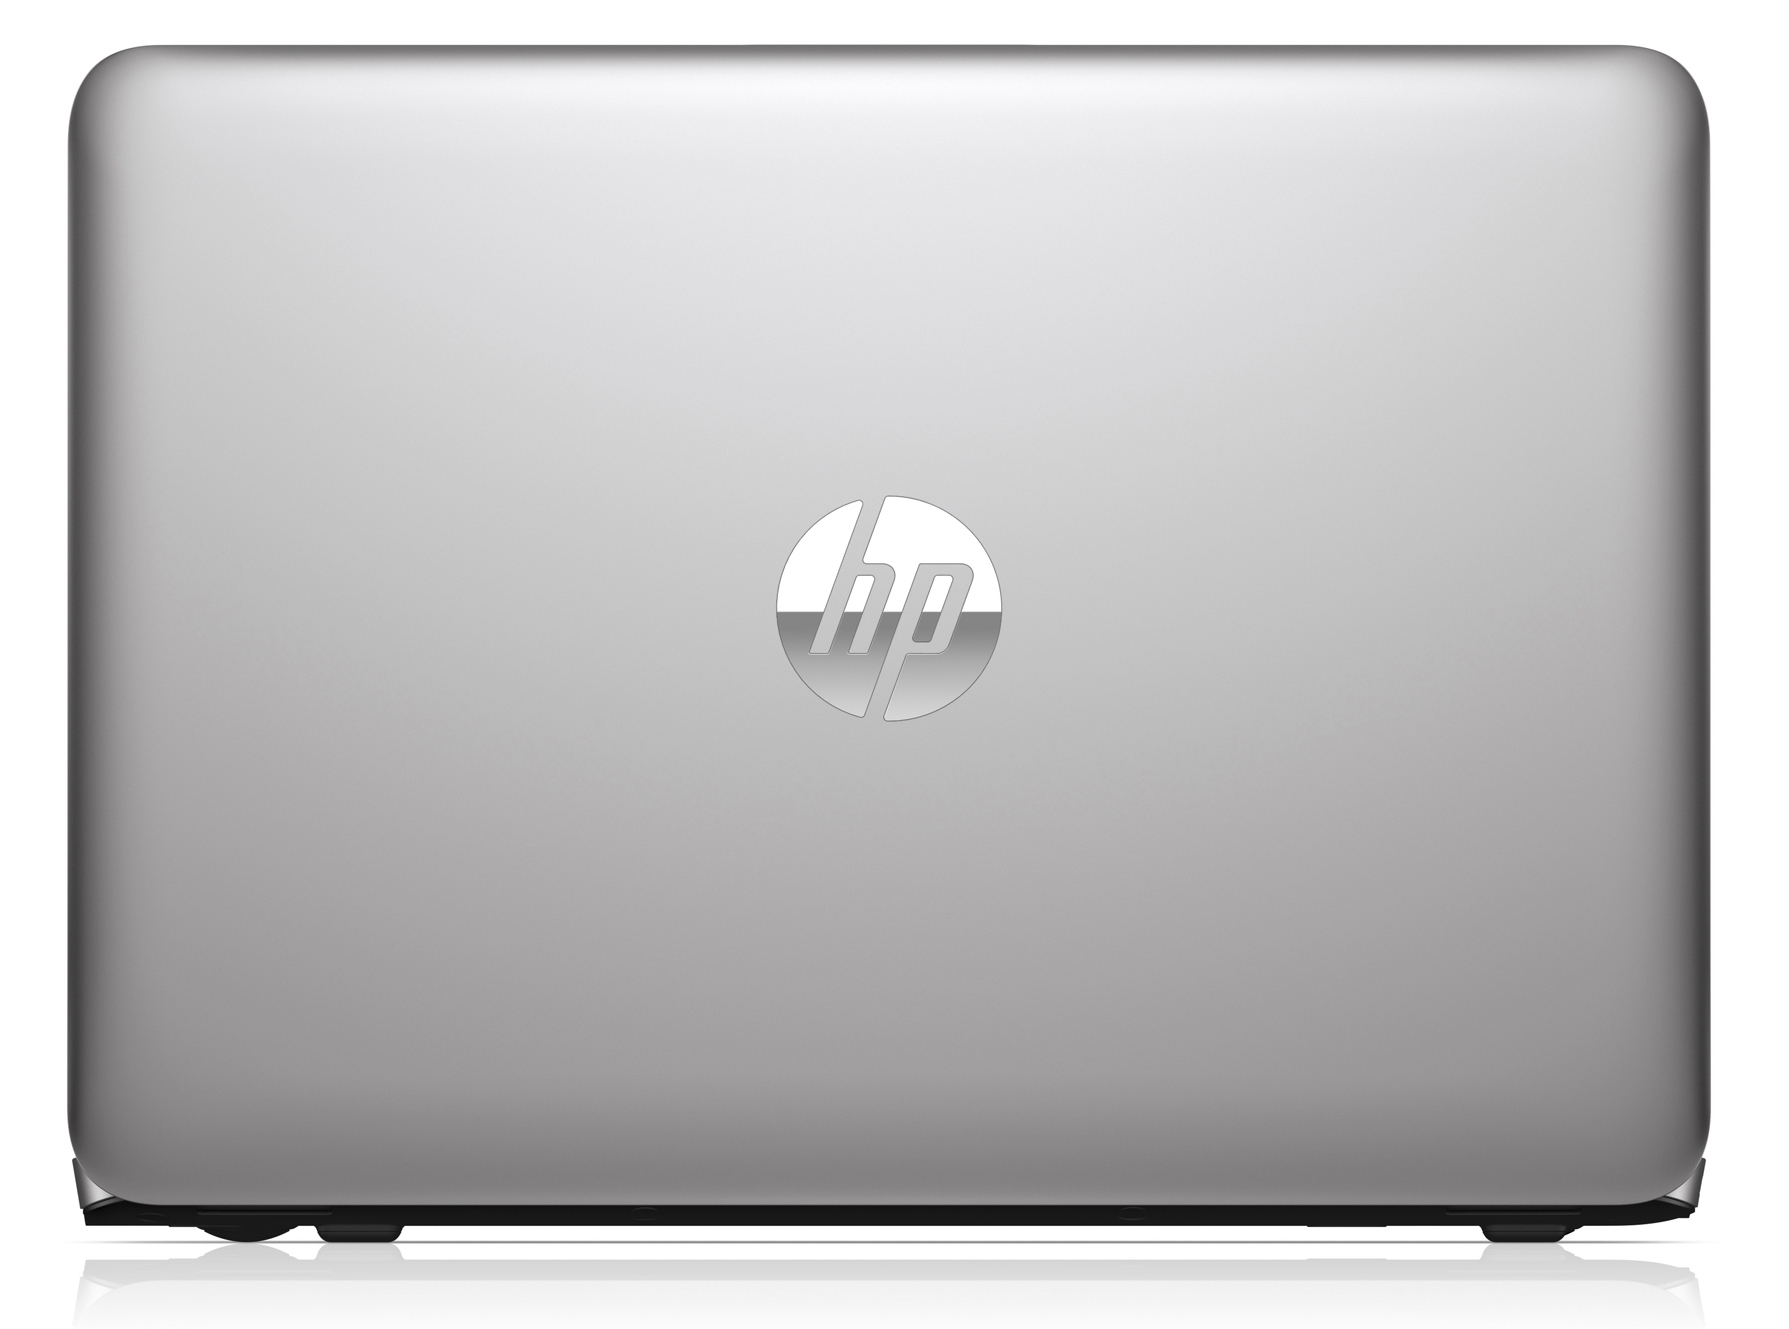
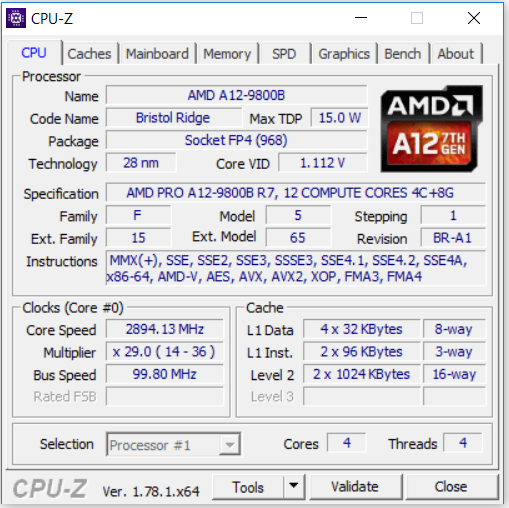
L'Elitebook 725 G4 è la versione per così dire "a buon mercato" dell'Elitebook 820 G4. I dispositivi dall'esterno sono simili. Il 725 G4 ha inoltre un casing di alta qualità e una buona tastiera. La differenza di prezzo tra i due dispositivi è dovuto alla meno costosa APU (ma più debole) AMD.
La parte CPU dell'APU installata qui è nettamente inferiore al processore Intel installato nel modello gemello. Tuttavia, l'APU ha abbastanza potenza di calcolo per le applicazioni da ufficio ed Internet. In cambio, l'AMD GPU è superiore alla sua controparte Intel.
L'Elitebook 725 G4 è fatto per gli utenti che danno minore importanza alle perfomance della CPU e alla durata della batteria.
Il laptop difficilmente si riscalda sotto il carico massimo e di solito funziona silenziosamente, senza far rumore. Tuttavia, questo si conclude non appena la ventola inizia a girare. Essa produce un sibilo tranquillo - proprio come la ventola nel modello gemello basato su Intel. Questo non dovrebbe accadere in dispositivi di questa fascia di prezzo. Tanto più che i predecessori 725 G3 e l'820 G3 hanno mostrato un rumore simile.
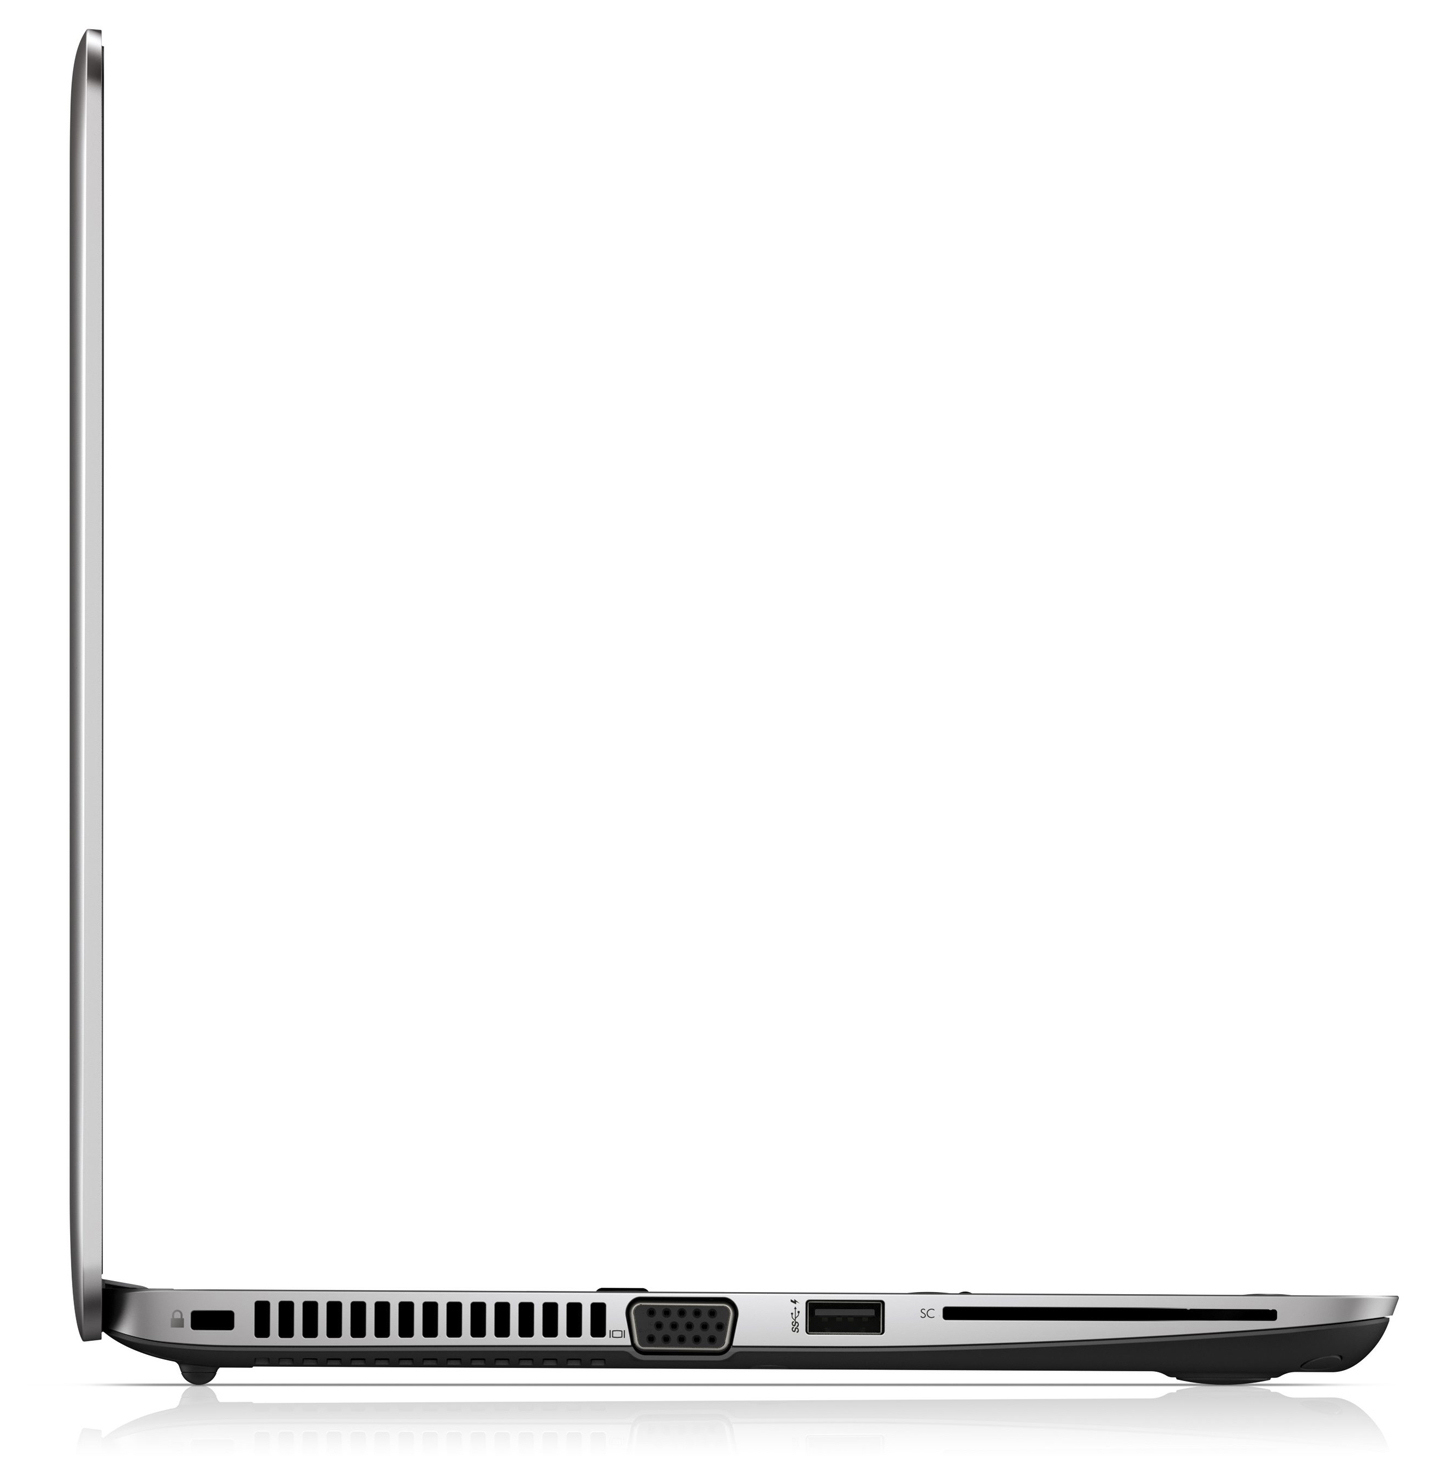
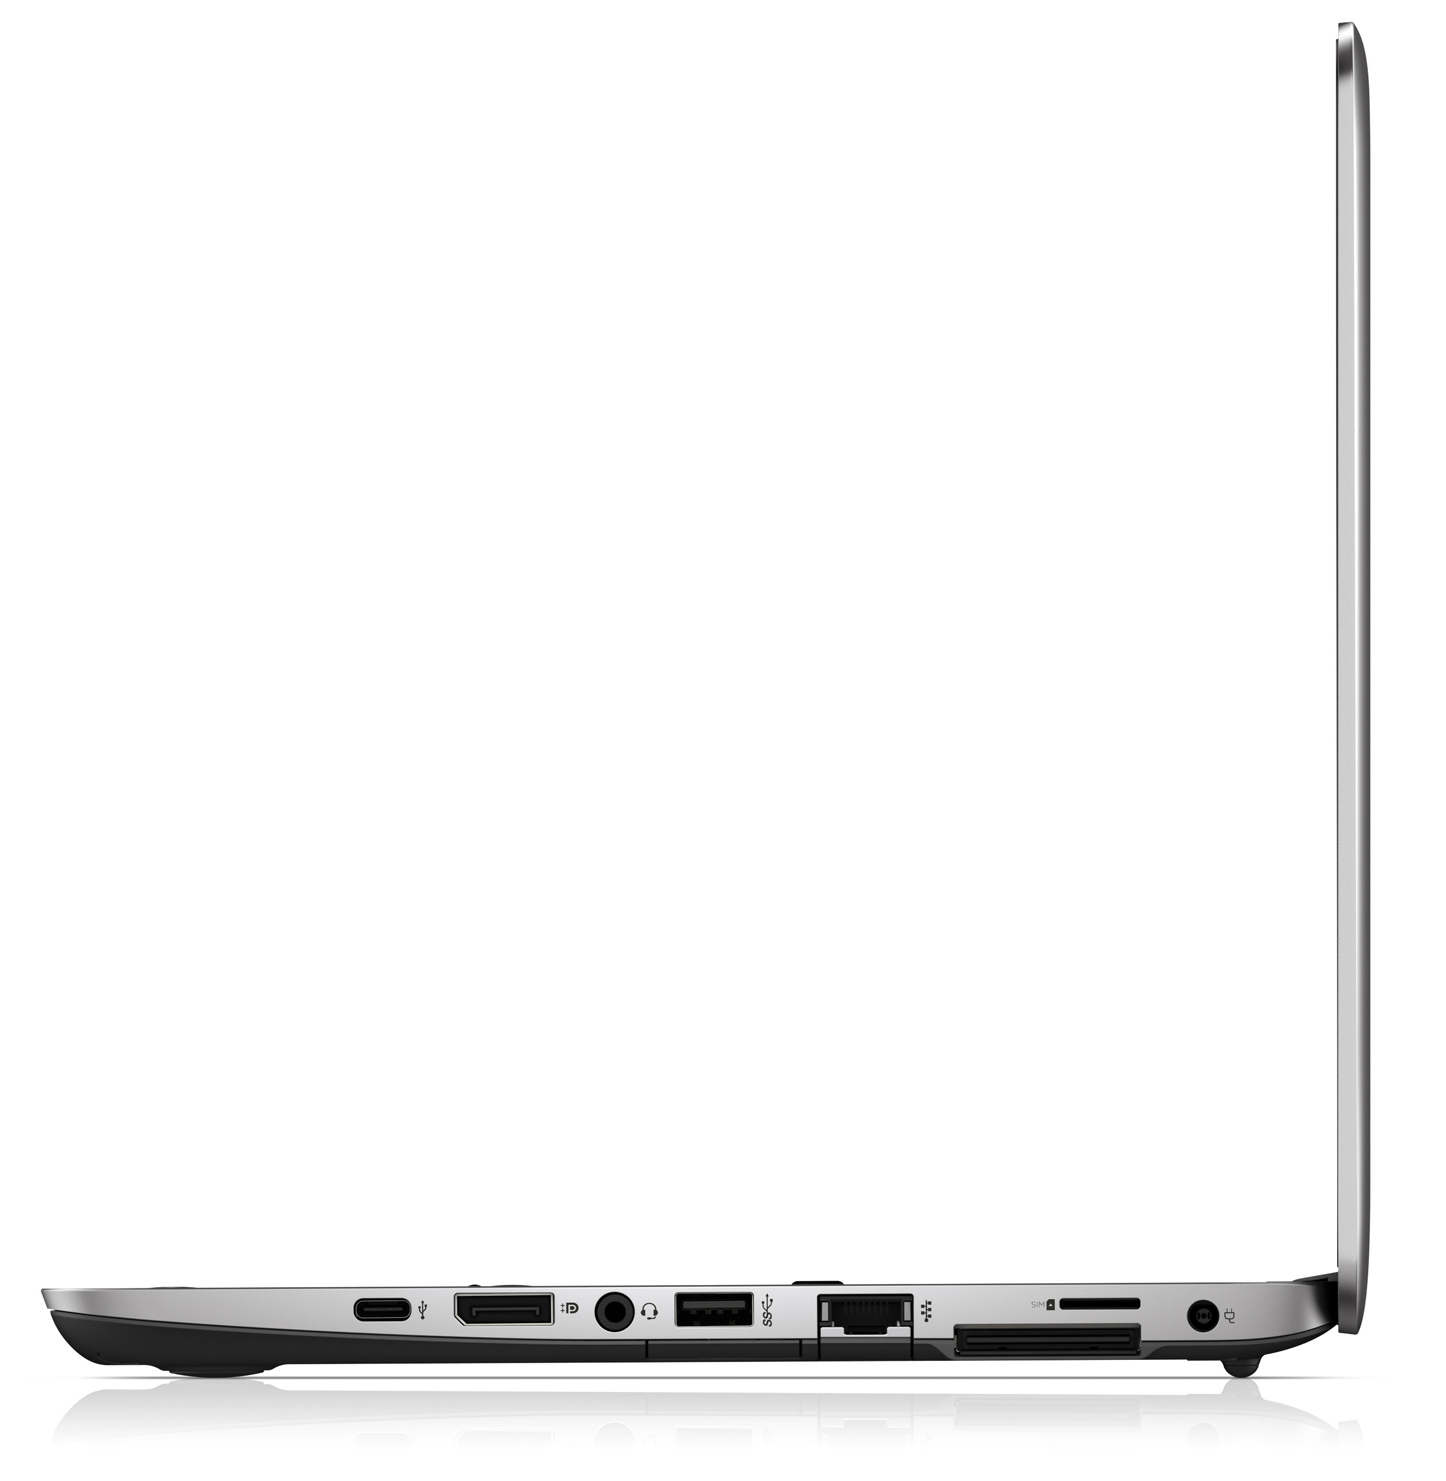
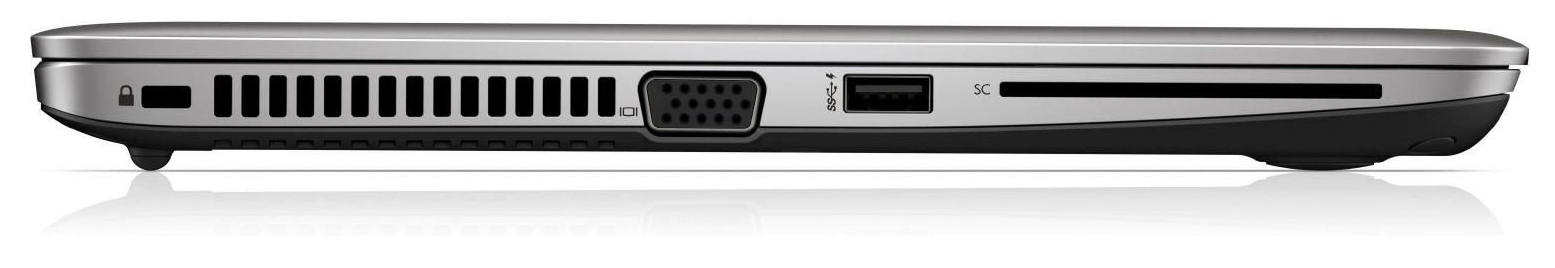
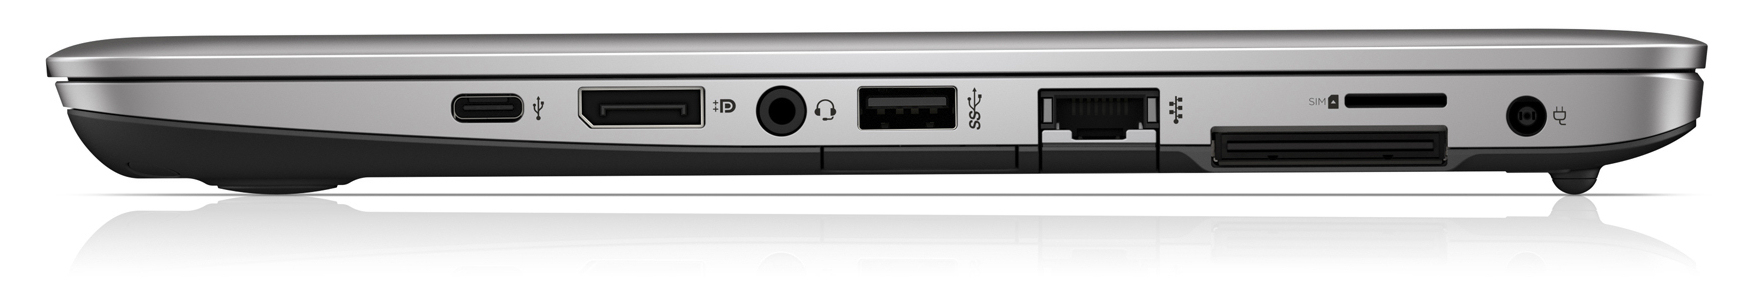
Un rapidissimo NVMe SSD garantisce un sistema scattante. La sostituzione del SSD sarà possibile rimuovendo il vassoio di base del laptop. HP fornisce l'Elitebook con un pannello IPS complessivamente convincente. È un modello luminoso, ad alto contrasto, angolo di visione stabile che presenta una buona riproduzione dei colori.
Inoltre, il nostro modello di test ospita un modem LTE. Così, l'accesso a Internet o alla rete aziendale è assicurata. Anche la durata della batteria del laptop è buona. Tuttavia, il dispositivo è qui chiaramente in ritardo dietro il suo modello gemello, e gli utenti che dipendono dalla massima durata della batteria dovrebbero optare per l'Elite 820 G4. Una garanzia di tre anni completa il pacchetto.
Nota: si tratta di una recensione breve, con alcune sezioni non tradotte, per la versione integrale in inglese guardate qui.
HP EliteBook 725 G4
- 03/20/2017 v6 (old)
Sascha Mölck