Recensione breve del Portatile Lenovo ThinkPad X270 (Core i5, Full HD)
| SD Card Reader | |
| average JPG Copy Test (av. of 3 runs) | |
| HP EliteBook 820 G4 Z2V72ET | |
| Dell Latitude 7280 | |
| Lenovo ThinkPad X270-20HMS00T00 | |
| maximum AS SSD Seq Read Test (1GB) | |
| Dell Latitude 7280 | |
| Lenovo ThinkPad X270-20HMS00T00 | |
| HP EliteBook 820 G4 Z2V72ET | |
| Networking | |
| iperf3 transmit AX12 | |
| Dell Latitude 7280 | |
| Lenovo ThinkPad X270-20HMS00T00 | |
| HP EliteBook 820 G4 Z2V72ET (jseb) | |
| iperf3 receive AX12 | |
| Lenovo ThinkPad X270-20HMS00T00 | |
| Dell Latitude 7280 | |
| HP EliteBook 820 G4 Z2V72ET (jseb) | |
| |||||||||||||||||||||||||
Distribuzione della luminosità: 94 %
Al centro con la batteria: 282 cd/m²
Contrasto: 1132:1 (Nero: 0.25 cd/m²)
ΔE ColorChecker Calman: 6.1 | ∀{0.5-29.43 Ø4.73}
ΔE Greyscale Calman: 6 | ∀{0.09-98 Ø4.97}
65.43% sRGB (Argyll 1.6.3 3D)
42.26% AdobeRGB 1998 (Argyll 1.6.3 3D)
46.11% AdobeRGB 1998 (Argyll 3D)
65.9% sRGB (Argyll 3D)
44.6% Display P3 (Argyll 3D)
Gamma: 2.05
CCT: 6832 K
| Lenovo ThinkPad X270-20HMS00T00 Innolux N125HCE-GN1, , 1920x1080, 12.5" | Dell Latitude 7280 AUO236D , , 1920x1080, 12.5" | HP EliteBook 820 G4 Z2V72ET Chi Mei, , 1920x1080, 12.5" | Lenovo ThinkPad X1 Carbon 2017-20HQS03P00 B140HAN03_1, , 1920x1080, 14" | Dell XPS 13 9360 FHD i5 Sharp SHP1449 LQ133M1, , 1920x1080, 13.3" | Lenovo ThinkPad X260-20F6007RGE Lenovo N125HCE-GN1, , 1920x1080, 12.5" | |
|---|---|---|---|---|---|---|
| Display | -0% | -0% | 34% | 10% | 0% | |
| Display P3 Coverage (%) | 44.6 44.6 | 44.41 0% | 44.45 0% | 61.4 38% | 48.94 10% | 44.71 0% |
| sRGB Coverage (%) | 65.9 65.9 | 65.4 -1% | 65.5 -1% | 85.9 30% | 73.3 11% | 66.1 0% |
| AdobeRGB 1998 Coverage (%) | 46.11 46.11 | 45.9 0% | 46.04 0% | 62.4 35% | 50.5 10% | 46.23 0% |
| Response Times | 9% | 14% | -3% | 6% | 16% | |
| Response Time Grey 50% / Grey 80% * (ms) | 40.8 ? | 32.4 ? 21% | 35 ? 14% | 41.6 ? -2% | 32.8 ? 20% | 32.8 ? 20% |
| Response Time Black / White * (ms) | 30.4 ? | 31.2 ? -3% | 26 ? 14% | 31.6 ? -4% | 33.2 ? -9% | 27.2 ? 11% |
| PWM Frequency (Hz) | 26040 ? | |||||
| Screen | -5% | -2% | 13% | 16% | 2% | |
| Brightness middle (cd/m²) | 283 | 310.4 10% | 326 15% | 311 10% | 351.2 24% | 337 19% |
| Brightness (cd/m²) | 281 | 301 7% | 304 8% | 288 2% | 325 16% | 322 15% |
| Brightness Distribution (%) | 94 | 88 -6% | 81 -14% | 85 -10% | 89 -5% | 91 -3% |
| Black Level * (cd/m²) | 0.25 | 0.32 -28% | 0.29 -16% | 0.24 4% | 0.195 22% | 0.32 -28% |
| Contrast (:1) | 1132 | 970 -14% | 1124 -1% | 1296 14% | 1801 59% | 1053 -7% |
| Colorchecker dE 2000 * | 6.1 | 5.9 3% | 6.49 -6% | 5.5 10% | 7.4 -21% | 5.71 6% |
| Colorchecker dE 2000 max. * | 15.4 | 21 -36% | 15.95 -4% | 9 42% | 9.08 41% | 15.39 -0% |
| Greyscale dE 2000 * | 6 | 5.1 15% | 6.16 -3% | 6.2 -3% | 6.71 -12% | 5.15 14% |
| Gamma | 2.05 107% | 2.33 94% | 2.32 95% | 2.02 109% | 2.74 80% | 2.38 92% |
| CCT | 6832 95% | 6816 95% | 7575 86% | 5950 109% | 7222 90% | 6881 94% |
| Color Space (Percent of AdobeRGB 1998) (%) | 42.26 | 42 -1% | 42 -1% | 55.96 32% | 50.48 19% | 42.38 0% |
| Color Space (Percent of sRGB) (%) | 65.43 | 65 -1% | 65 -1% | 85.77 31% | 73.31 12% | 65.62 0% |
| Media totale (Programma / Settaggio) | 1% /
-2% | 4% /
0% | 15% /
15% | 11% /
13% | 6% /
3% |
* ... Meglio usare valori piccoli
Tempi di risposta del Display
| ↔ Tempi di risposta dal Nero al Bianco | ||
|---|---|---|
| 30.4 ms ... aumenta ↗ e diminuisce ↘ combinato | ↗ 16.4 ms Incremento | 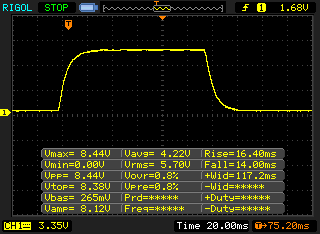 |
| ↘ 14 ms Calo | ||
| Lo schermo mostra tempi di risposta lenti nei nostri tests e sarà insoddisfacente per i gamers. In confronto, tutti i dispositivi di test variano da 0.1 (minimo) a 240 (massimo) ms. » 82 % di tutti i dispositivi è migliore. Questo significa che i tempi di risposta rilevati sono peggiori rispetto alla media di tutti i dispositivi testati (19.9 ms). | ||
| ↔ Tempo di risposta dal 50% Grigio all'80% Grigio | ||
| 40.8 ms ... aumenta ↗ e diminuisce ↘ combinato | ↗ 21.2 ms Incremento | 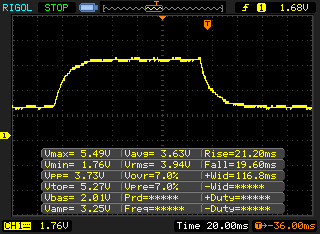 |
| ↘ 19.6 ms Calo | ||
| Lo schermo mostra tempi di risposta lenti nei nostri tests e sarà insoddisfacente per i gamers. In confronto, tutti i dispositivi di test variano da 0.165 (minimo) a 636 (massimo) ms. » 64 % di tutti i dispositivi è migliore. Questo significa che i tempi di risposta rilevati sono peggiori rispetto alla media di tutti i dispositivi testati (31.1 ms). | ||
Sfarfallio dello schermo / PWM (Pulse-Width Modulation)
| flickering dello schermo / PWM rilevato | 26040 Hz | ≤ 50 % settaggio luminosita' | 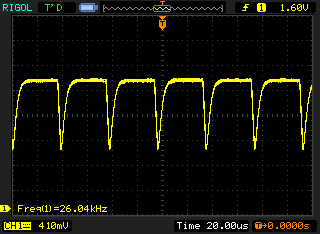 |
Il display sfarfalla a 26040 Hz (Probabilmente a causa dell'uso di PWM) Flickering rilevato ad una luminosita' di 50 % o inferiore. Non dovrebbe verificarsi flickering o PWM sopra questo valore di luminosita'. La frequenza di 26040 Hz è abbastanza alta, quindi la maggioranza degli utenti sensibili al PWM non dovrebbero notare alcun flickering. In confronto: 52 % di tutti i dispositivi testati non utilizza PWM per ridurre la luminosita' del display. Se è rilevato PWM, una media di 7801 (minimo: 5 - massimo: 343500) Hz è stata rilevata. | |||
| PCMark 8 Home Score Accelerated v2 | 3575 punti | |
| PCMark 8 Work Score Accelerated v2 | 4660 punti | |
Aiuto | ||
| Lenovo ThinkPad X270-20HMS00T00 Toshiba NVMe THNSF5512GPUK | Dell Latitude 7280 SanDisk X400 M.2 2280 256GB | HP EliteBook 820 G4 Z2V72ET Samsung PM951 NVMe MZVLV512 | Lenovo ThinkPad X1 Carbon 2017-20HQS03P00 Samsung PM961 NVMe MZVLW512HMJP | Dell XPS 13 9360 FHD i5 Toshiba NVMe THNSN5256GPUK | Lenovo ThinkPad X260-20F6007RGE Liteonit LCH-512V2S | |
|---|---|---|---|---|---|---|
| CrystalDiskMark 3.0 | -45% | 5% | 43% | -12% | -42% | |
| Read Seq (MB/s) | 1190 | 470.8 -60% | 1315 11% | 1827 54% | 1233 4% | 499.6 -58% |
| Write Seq (MB/s) | 985 | 477.4 -52% | 594 -40% | 1383 40% | 733 -26% | 403 -59% |
| Read 512 (MB/s) | 858 | 370.1 -57% | 661 -23% | 814 -5% | 1036 21% | 322.9 -62% |
| Write 512 (MB/s) | 528 | 323.2 -39% | 594 13% | 1098 108% | 439.9 -17% | 372.4 -29% |
| Read 4k (MB/s) | 35.27 | 30.23 -14% | 42.87 22% | 61 73% | 29.31 -17% | 27.22 -23% |
| Write 4k (MB/s) | 124.5 | 59.5 -52% | 151.6 22% | 172.2 38% | 116.9 -6% | 83.6 -33% |
| Read 4k QD32 (MB/s) | 495.3 | 344.4 -30% | 568 15% | 601 21% | 479.2 -3% | 316.5 -36% |
| Write 4k QD32 (MB/s) | 418.3 | 183 -56% | 491.7 18% | 495.6 18% | 218.3 -48% | 273.1 -35% |

| 3DMark 11 Performance | 1543 punti | |
| 3DMark Cloud Gate Standard Score | 5519 punti | |
| 3DMark Fire Strike Score | 739 punti | |
Aiuto | ||
| basso | medio | alto | ultra | |
|---|---|---|---|---|
| BioShock Infinite (2013) | 42.8 | 25.3 | 20.8 | 6.5 |
| Rise of the Tomb Raider (2016) | 19.1 | |||
| Civilization 6 (2016) | 30.7 | 10.3 |
Rumorosità
| Idle |
| 29 / 29 / 30.4 dB(A) |
| Sotto carico |
| 34.1 / 37.6 dB(A) |
 | ||
30 dB silenzioso 40 dB(A) udibile 50 dB(A) rumoroso |
||
min: | ||
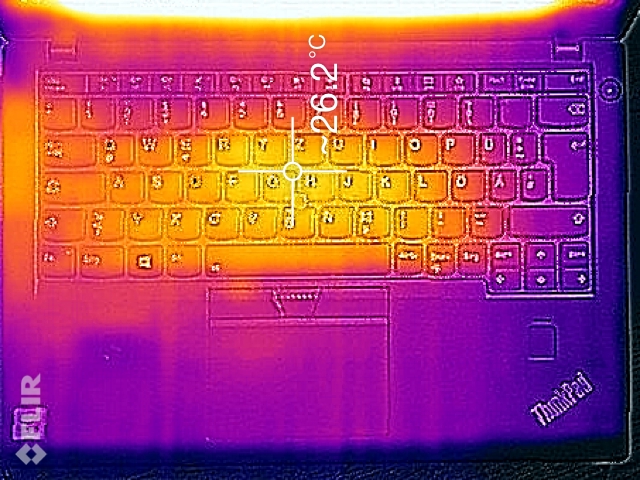
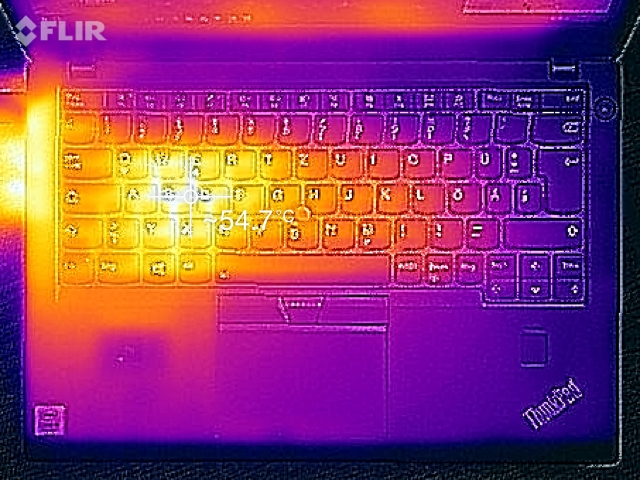
(-) La temperatura massima sul lato superiore è di 52.9 °C / 127 F, rispetto alla media di 34.3 °C / 94 F, che varia da 21.2 a 62.5 °C per questa classe Office.
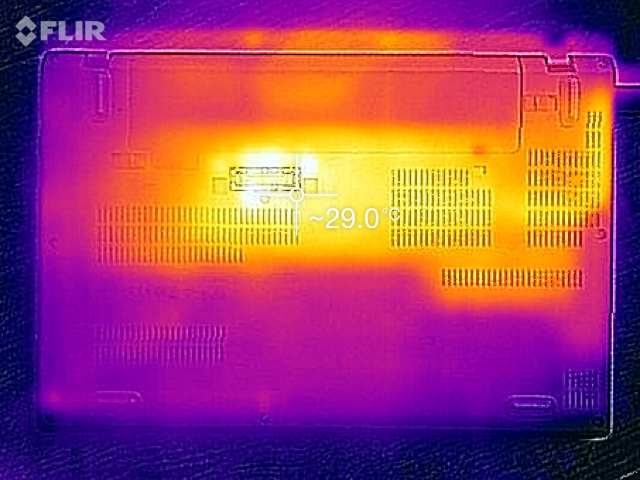
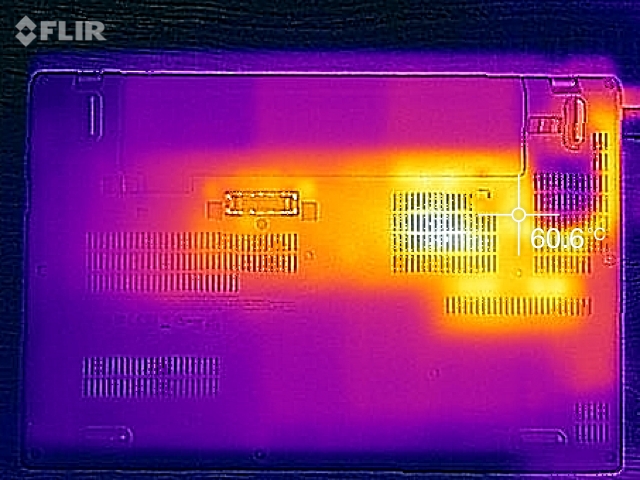
(-) Il lato inferiore si riscalda fino ad un massimo di 57.8 °C / 136 F, rispetto alla media di 36.8 °C / 98 F
(+) In idle, la temperatura media del lato superiore è di 24.1 °C / 75 F, rispetto alla media deld ispositivo di 29.5 °C / 85 F.
(±) I poggiapolsi e il touchpad possono diventare molto caldi al tatto con un massimo di 38.5 °C / 101.3 F.
(-) La temperatura media della zona del palmo della mano di dispositivi simili e'stata di 27.5 °C / 81.5 F (-11 °C / -19.8 F).
Lenovo ThinkPad X270-20HMS00T00 analisi audio
(-) | altoparlanti non molto potenti (66.8 dB)
Bassi 100 - 315 Hz
(-) | quasi nessun basso - in media 18.8% inferiori alla media
(±) | la linearità dei bassi è media (11.1% delta rispetto alla precedente frequenza)
Medi 400 - 2000 Hz
(+) | medi bilanciati - solo only 1.5% rispetto alla media
(+) | medi lineari (5.4% delta rispetto alla precedente frequenza)
Alti 2 - 16 kHz
(+) | Alti bilanciati - appena 3.1% dalla media
(+) | alti lineari (6.4% delta rispetto alla precedente frequenza)
Nel complesso 100 - 16.000 Hz
(±) | la linearità complessiva del suono è media (22.3% di differenza rispetto alla media
Rispetto alla stessa classe
» 59% di tutti i dispositivi testati in questa classe è stato migliore, 9% simile, 33% peggiore
» Il migliore ha avuto un delta di 7%, medio di 21%, peggiore di 53%
Rispetto a tutti i dispositivi testati
» 65% di tutti i dispositivi testati in questa classe è stato migliore, 6% similare, 29% peggiore
» Il migliore ha avuto un delta di 4%, medio di 24%, peggiore di 134%
Apple MacBook 12 (Early 2016) 1.1 GHz analisi audio
(+) | gli altoparlanti sono relativamente potenti (83.6 dB)
Bassi 100 - 315 Hz
(±) | bassi ridotti - in media 11.3% inferiori alla media
(±) | la linearità dei bassi è media (14.2% delta rispetto alla precedente frequenza)
Medi 400 - 2000 Hz
(+) | medi bilanciati - solo only 2.4% rispetto alla media
(+) | medi lineari (5.5% delta rispetto alla precedente frequenza)
Alti 2 - 16 kHz
(+) | Alti bilanciati - appena 2% dalla media
(+) | alti lineari (4.5% delta rispetto alla precedente frequenza)
Nel complesso 100 - 16.000 Hz
(+) | suono nel complesso lineare (10.2% differenza dalla media)
Rispetto alla stessa classe
» 7% di tutti i dispositivi testati in questa classe è stato migliore, 2% simile, 91% peggiore
» Il migliore ha avuto un delta di 5%, medio di 18%, peggiore di 53%
Rispetto a tutti i dispositivi testati
» 5% di tutti i dispositivi testati in questa classe è stato migliore, 1% similare, 94% peggiore
» Il migliore ha avuto un delta di 4%, medio di 24%, peggiore di 134%
| Off / Standby | |
| Idle | |
| Sotto carico |
|
Leggenda:
min: | |
| Lenovo ThinkPad X270-20HMS00T00 i5-7200U, HD Graphics 620, Toshiba NVMe THNSF5512GPUK, IPS LED, 1920x1080, 12.5" | Dell Latitude 7280 i7-7600U, HD Graphics 620, SanDisk X400 M.2 2280 256GB, IPS, 1920x1080, 12.5" | HP EliteBook 820 G4 Z2V72ET i7-7500U, HD Graphics 620, Samsung PM951 NVMe MZVLV512, IPS, 1920x1080, 12.5" | Lenovo ThinkPad X1 Carbon 2017-20HQS03P00 i7-7500U, HD Graphics 620, Samsung PM961 NVMe MZVLW512HMJP, IPS, 1920x1080, 14" | Dell XPS 13 9360 FHD i5 i5-7200U, HD Graphics 620, Toshiba NVMe THNSN5256GPUK, IPS, 1920x1080, 13.3" | Lenovo ThinkPad X260-20F6007RGE 6500U, HD Graphics 520, Liteonit LCH-512V2S, IPS, 1920x1080, 12.5" | |
|---|---|---|---|---|---|---|
| Power Consumption | 11% | 19% | -16% | 21% | 5% | |
| Idle Minimum * (Watt) | 3.5 | 4.28 -22% | 2.7 23% | 3.84 -10% | 4.1 -17% | 3.5 -0% |
| Idle Average * (Watt) | 5.8 | 5.11 12% | 4.8 17% | 6.3 -9% | 4.2 28% | 5.5 5% |
| Idle Maximum * (Watt) | 7.6 | 5.49 28% | 6.6 13% | 8.6 -13% | 5.1 33% | 6.7 12% |
| Load Average * (Watt) | 33.2 | 29.83 10% | 28.5 14% | 41.9 -26% | 22.1 33% | 28.9 13% |
| Load Maximum * (Watt) | 40.4 | 30.05 26% | 29 28% | 48.7 -21% | 29.4 27% | 42.1 -4% |
* ... Meglio usare valori piccoli
| Lenovo ThinkPad X270-20HMS00T00 i5-7200U, HD Graphics 620, 46 Wh | Dell Latitude 7280 i7-7600U, HD Graphics 620, 60 Wh | HP EliteBook 820 G4 Z2V72ET i7-7500U, HD Graphics 620, 49 Wh | Lenovo ThinkPad X1 Carbon 2017-20HQS03P00 i7-7500U, HD Graphics 620, 57 Wh | Dell XPS 13 9360 FHD i5 i5-7200U, HD Graphics 620, 60 Wh | Lenovo ThinkPad X260-20F6007RGE 6500U, HD Graphics 520, 46 Wh | |
|---|---|---|---|---|---|---|
| Autonomia della batteria | 74% | 59% | 39% | 63% | 13% | |
| Reader / Idle (h) | 17.1 | 25.9 51% | 22.4 31% | 20.9 22% | 21.6 26% | 15.9 -7% |
| H.264 (h) | 6.8 | 8.9 31% | 11.9 75% | 7.8 15% | ||
| WiFi v1.3 (h) | 5.4 | 11.4 111% | 9.4 74% | 8.3 54% | 11.3 109% | 8.4 56% |
| Load (h) | 1.7 | 2.7 59% | 3.4 100% | 1.8 6% | 2.6 53% | 1.5 -12% |
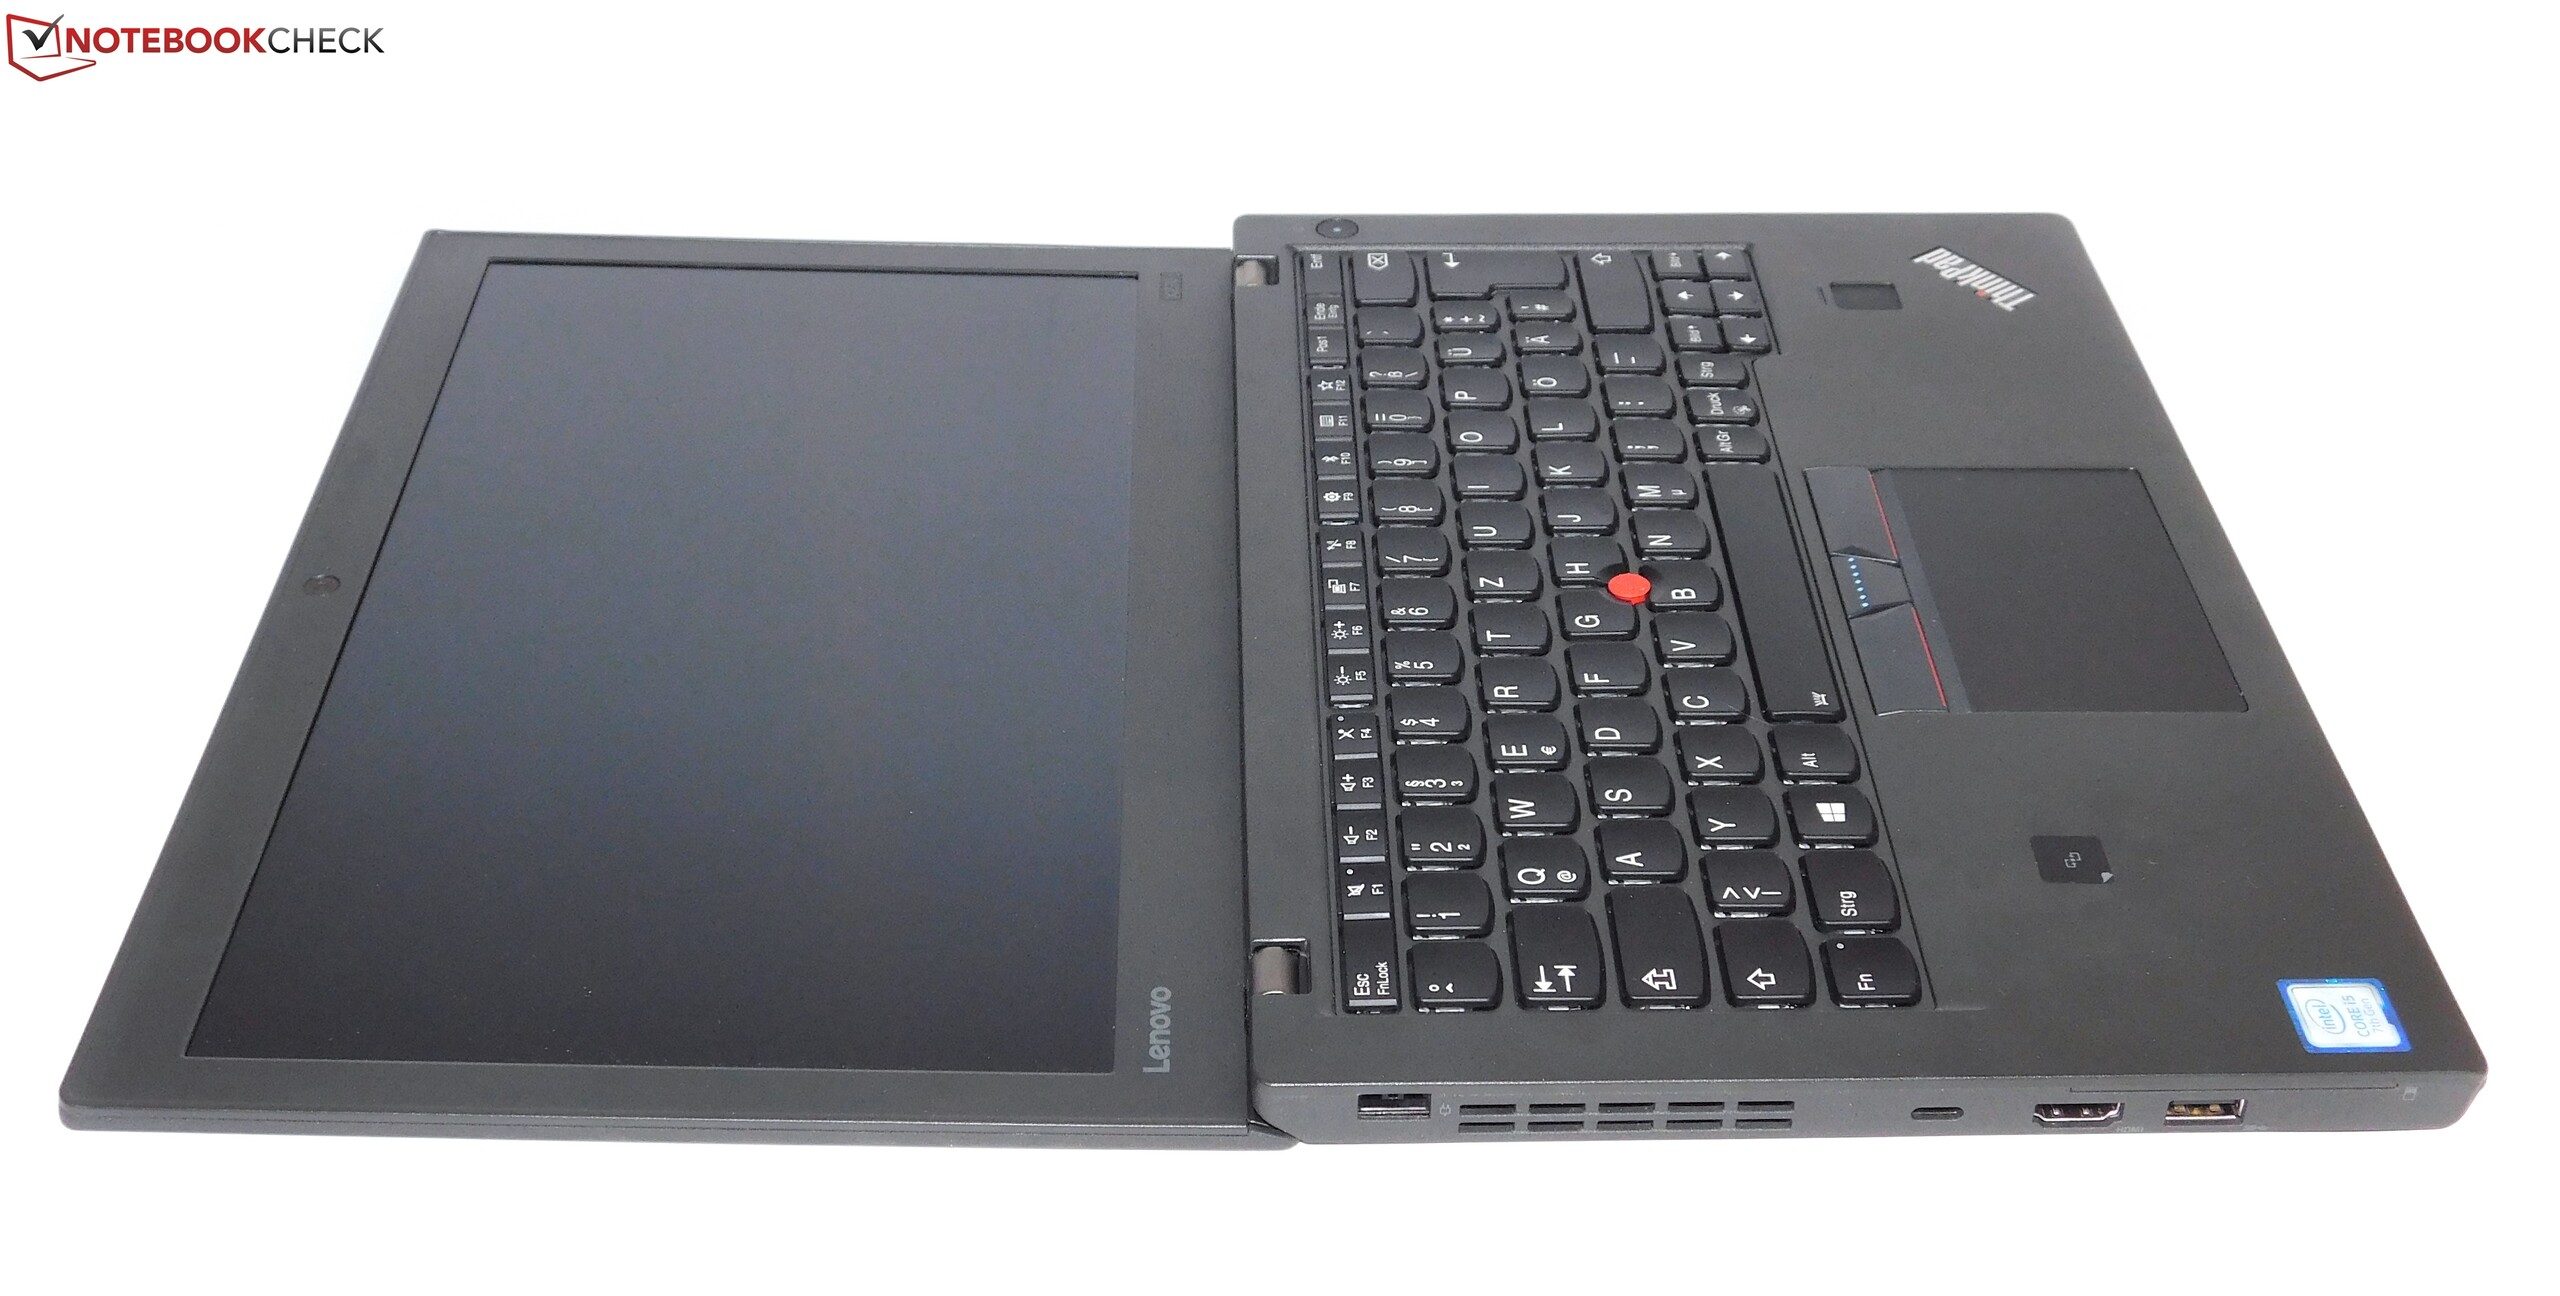
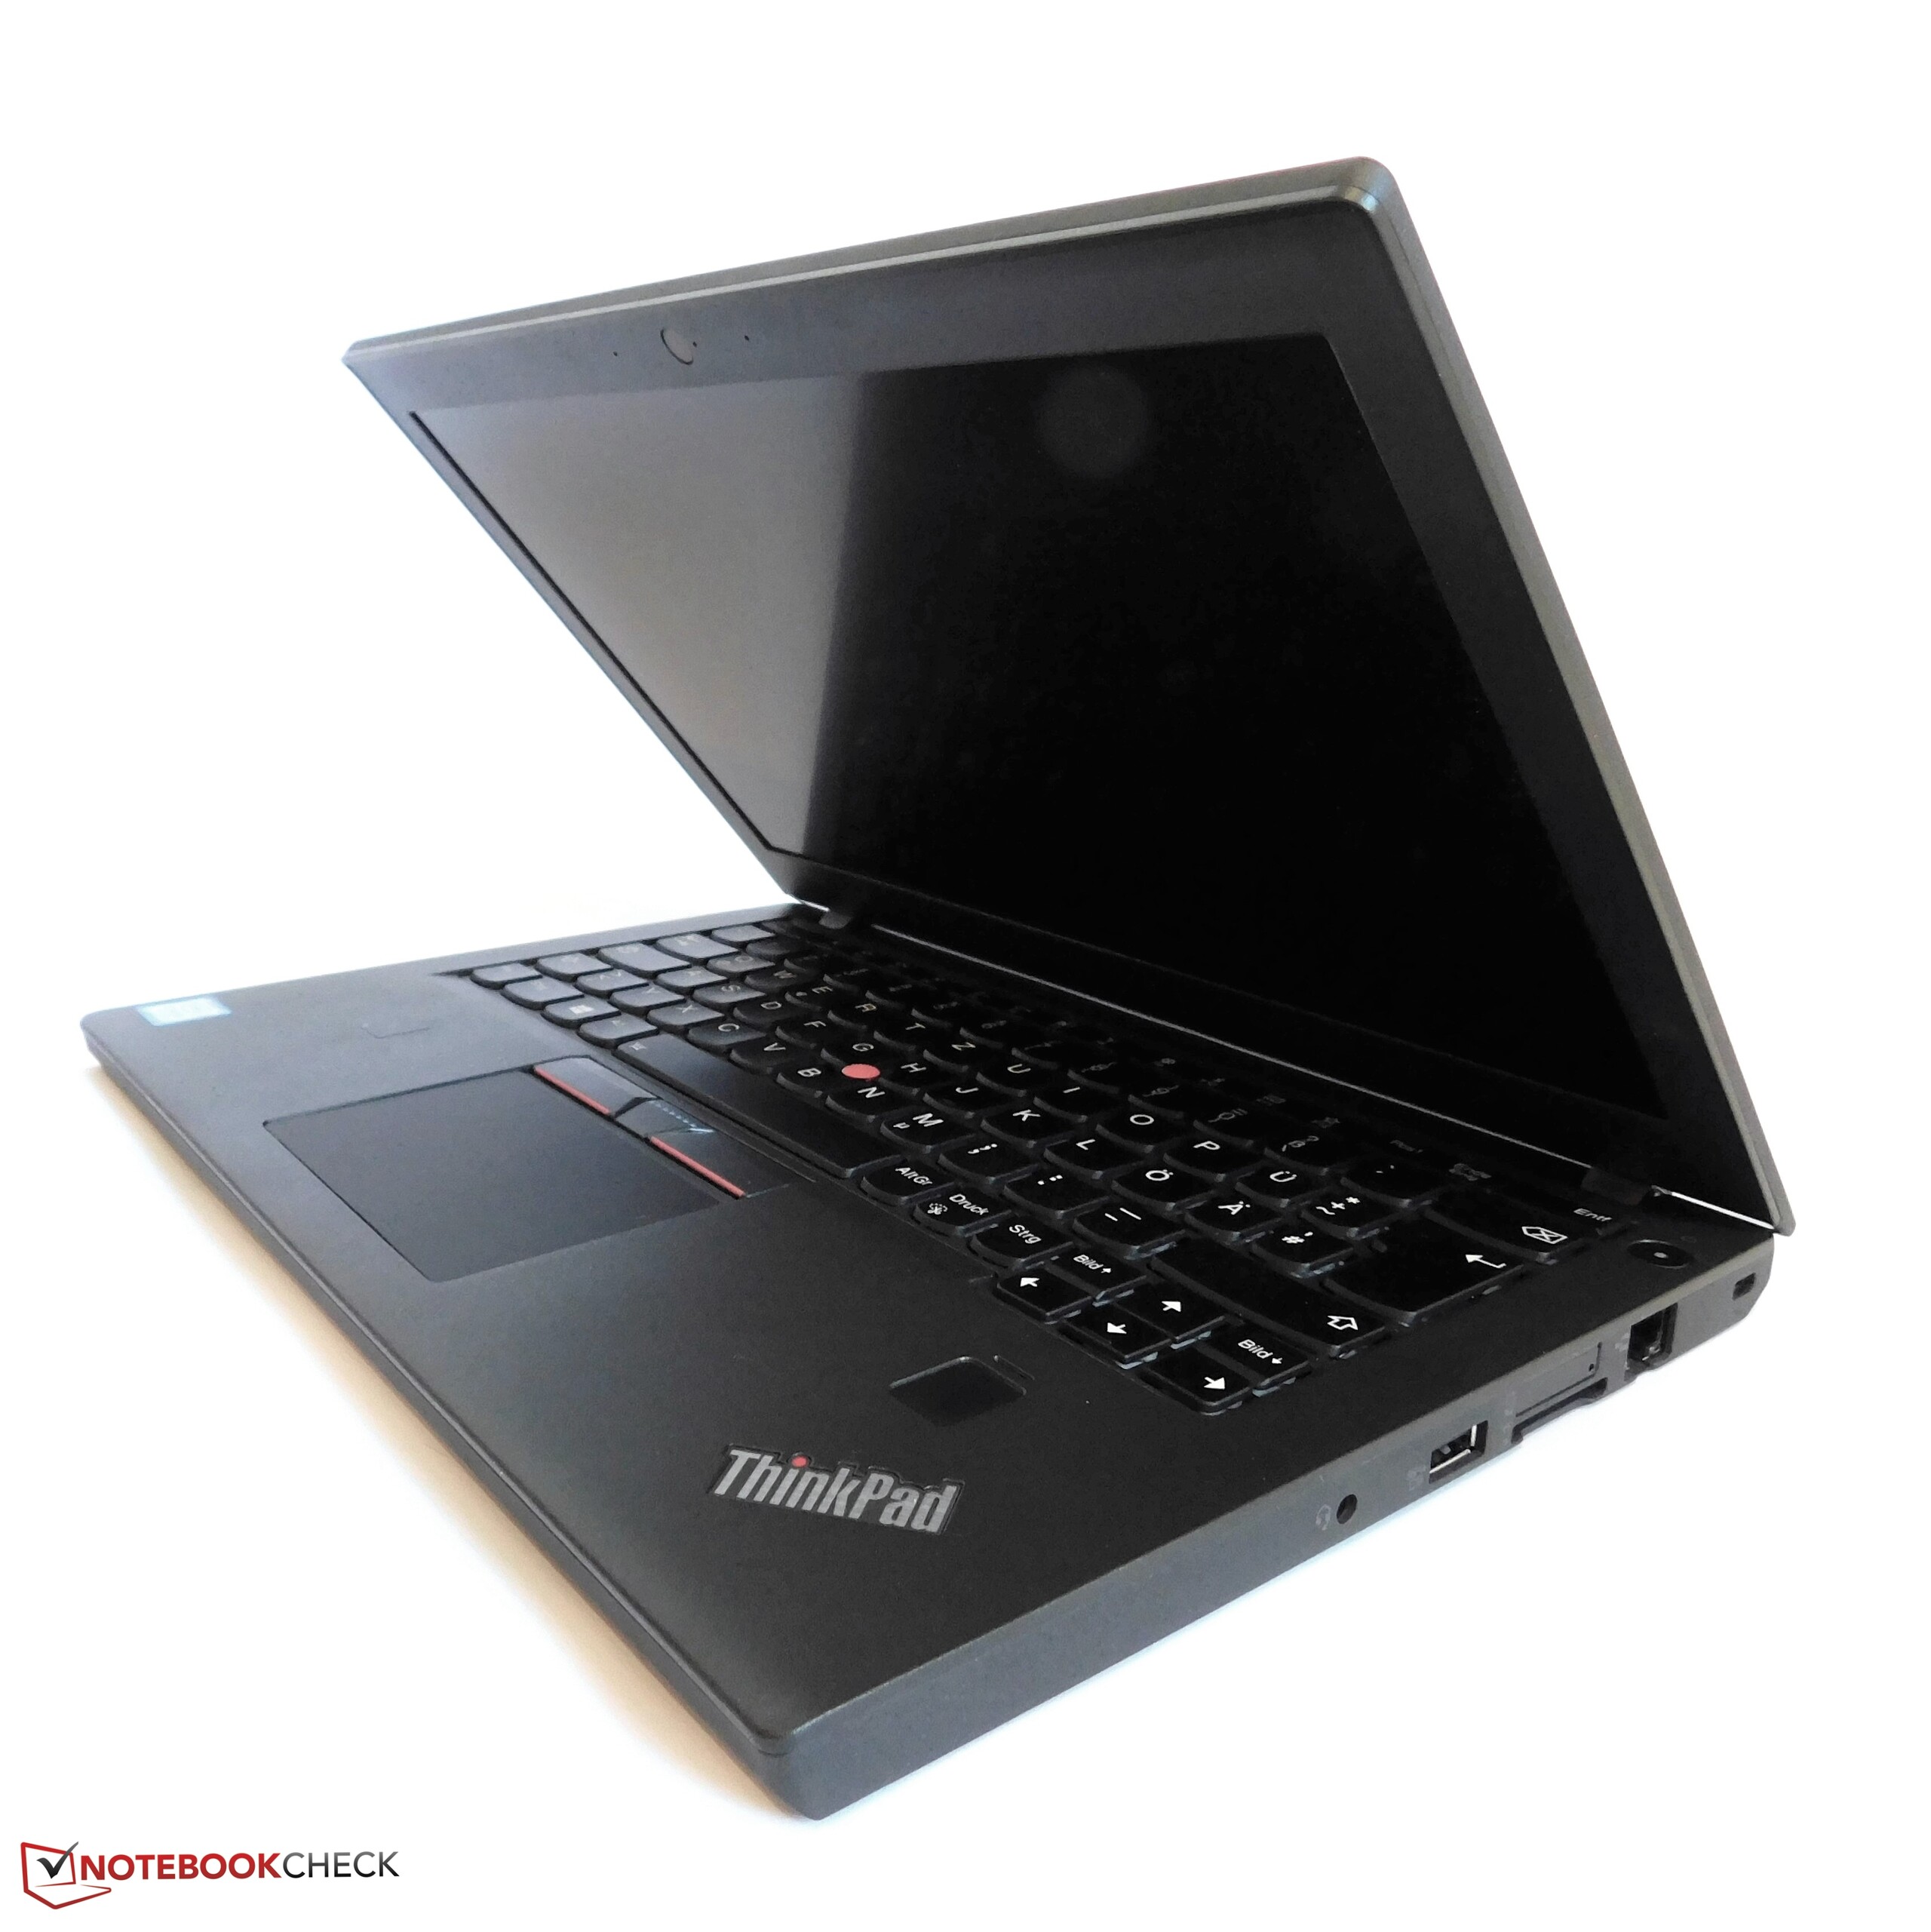
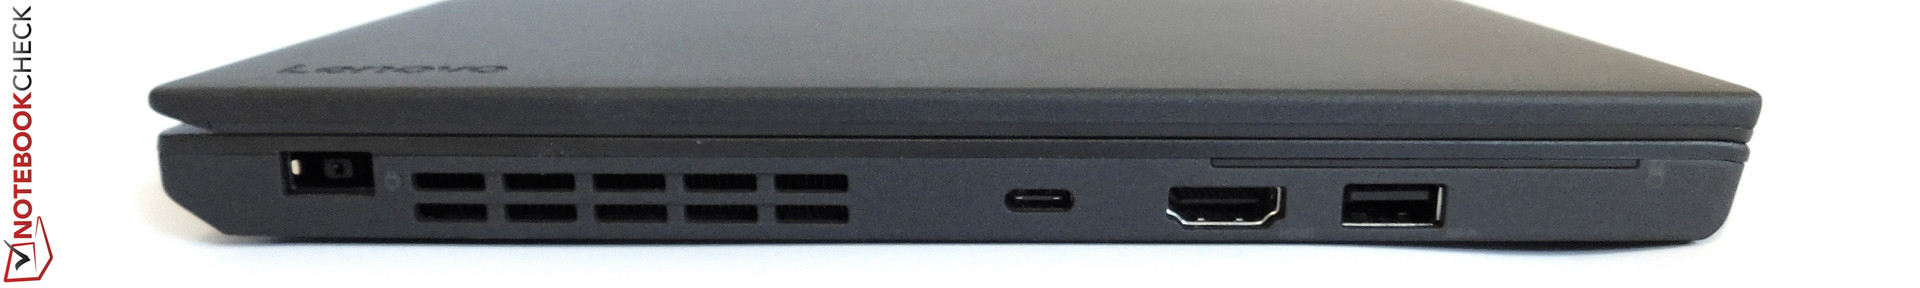
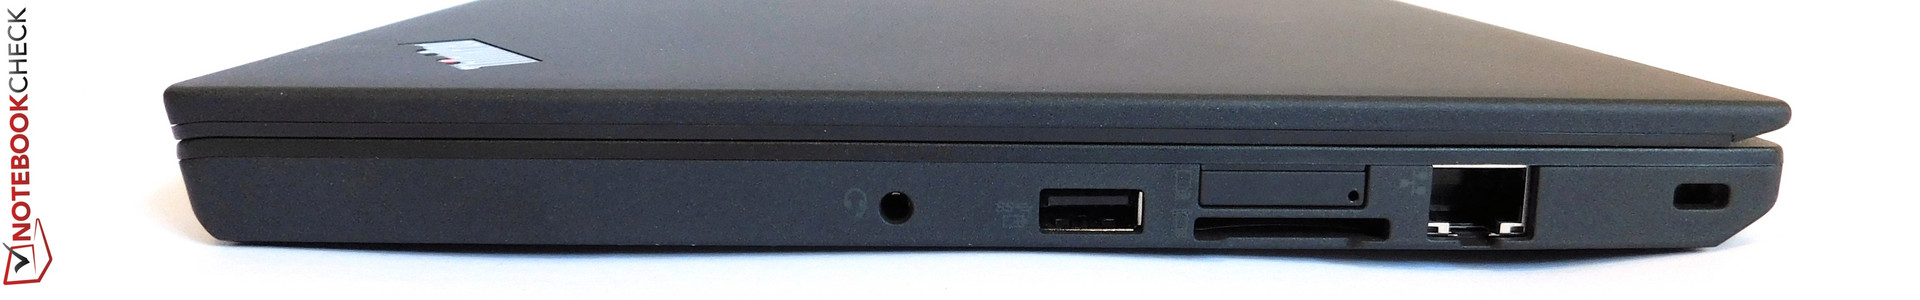
Questa è la quarta volta che Lenovo ha riutilizzato lo stesso case. Come sempre con ThinkPad, ottimi dispositivi input, così come le feature PowerBridge - che non ha praticamente concorrenti reali - sono uno standard. Considerando le sue dimensioni, l'X270 ha molte porte, il che lo rende flessibile nell'utilizzo. Le piccole dimensioni ne rendono facile e comodo l'utilizzo. In questo senso, non vi sono differenze rispetto ai suoi predecessori - dopo tutto è fondamentalmente lo stesso dispositivo.
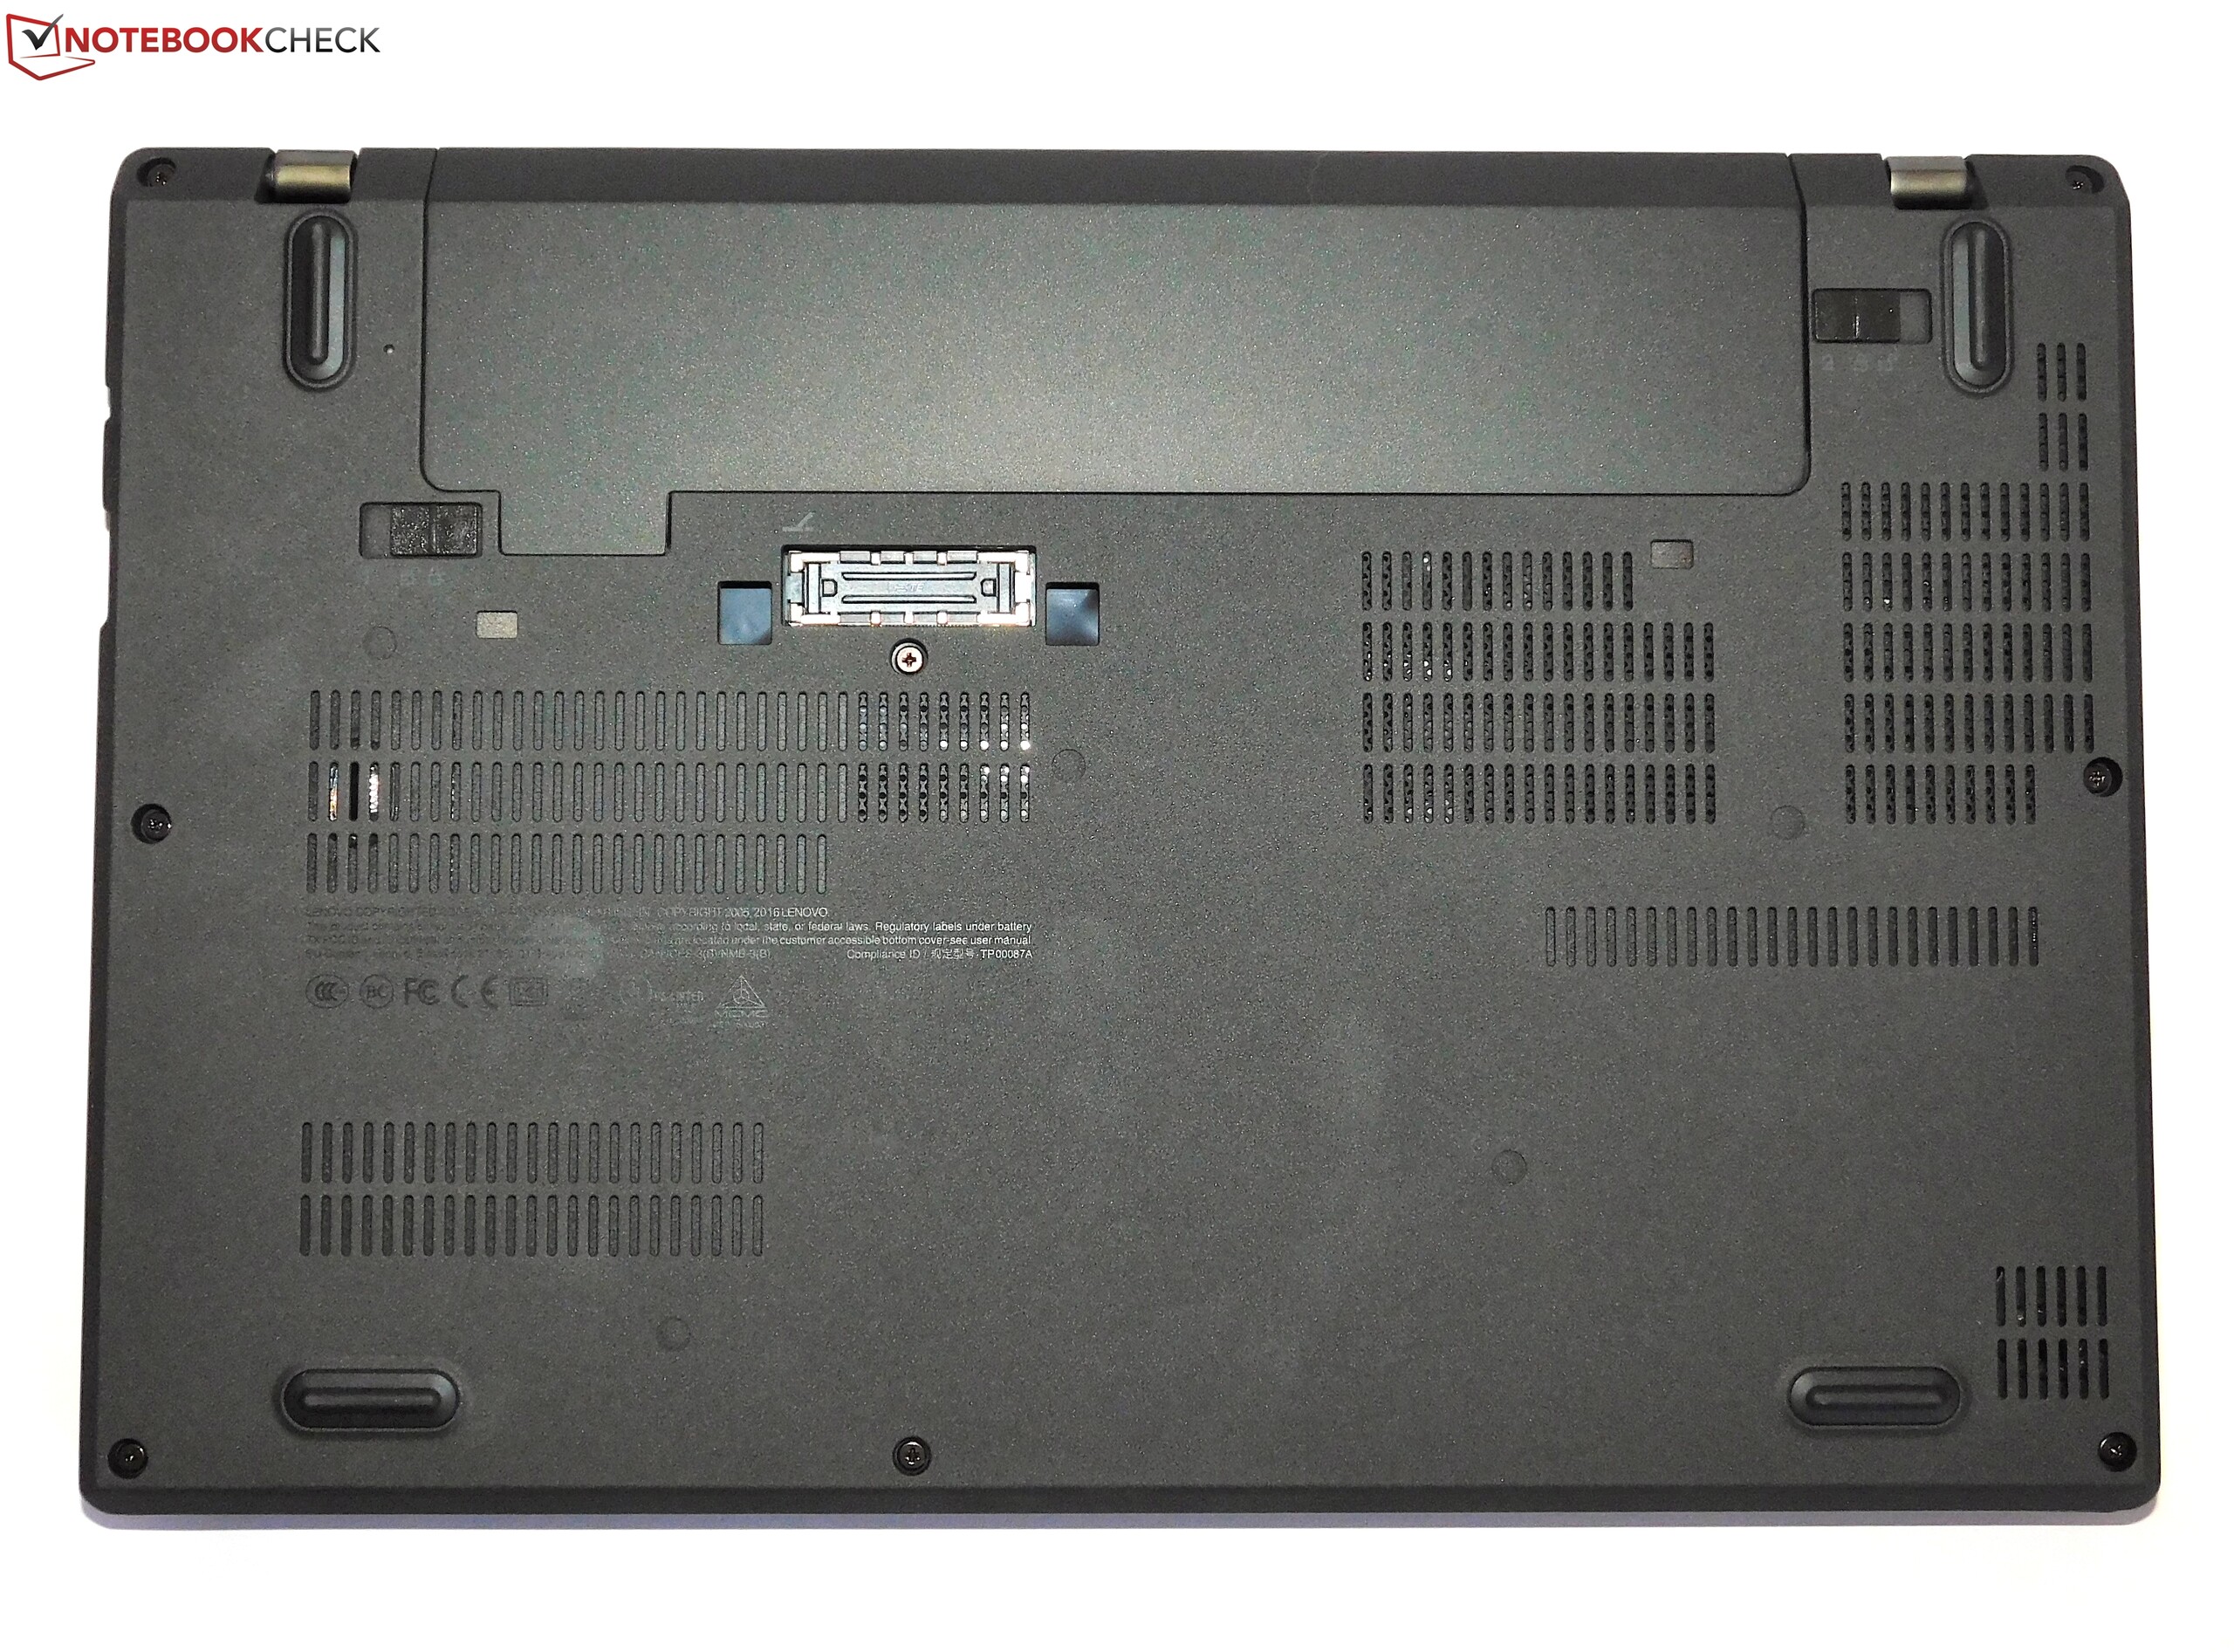
Purtroppo, Lenovo ha commesso errori in alcune parti del X270. Innanzitutto, il sistema di raffreddamento: è un po' allarmante che un dispositivo dotato di un processore ULV raggiunga i 60° C (140 ° F) di temperatura in superficie - nonostante la spesso fastidiosa ventola di raffreddamento in funzione. Un altro aspetto negativo è il display full HD, che è significativamente più scuro rispetto al suo predecessore, con una bassa copertura colore. I punti deboli nella costruzione sono simili a quelli delle versioni precedenti. Il design di manutenzione era già un problema per l'X260: non è uno scherzo aprire il la cover. Sorprendentemente, le batterie esterne a 3 celle più piccole del computer offrono anche la durata della batteria più breve rispetto al suo predecessore.
ThinkPad serie x2xx Lenovo ha urgente bisogno di un restyling. A causa dei tanti piccoli problemi, non possiamo consigliare l'X270.
Se non si ha assolutamente bisogno di un notebook compatto che ha una flessibilità di configurazione della batteria (PowerBridge), davvero non possiamo consigliare il ThinkPad X270. Questo non solo a causa dei vari problemi sopra descritti - anche se solo quelli sarebbero sufficienti per noi, consigliamo di dare un'occhiata ai diretti concorrenti HP EliteBook 820 G4 e Dell Latitude 7280. In generale, è difficile trovare motivi per l'acquisto della X270, a meno che non sia necessario il PowerBridge e alcune features che sono particolarmente importanti per le grandi imprese (smart card, docking port, Ethernet). Il Dell XPS 13 e il maggiore concorrente in-house di Lenovo, il ThinkPad X1 Carbon, per esempio, sono modelli che offrono maggiore qualità e un display più grande, pur essendo molto portabili. Ciò chiama in causa l'intera esistenza dei subnotebook. Un argomento potrebbe essere il prezzo - anche se i classici subnotebook da 12 pollici non sono realmente a basso costo.
Nota: si tratta di una recensione breve, con alcune sezioni non tradotte, per la versione integrale in inglese guardate qui.
Pro
Contro
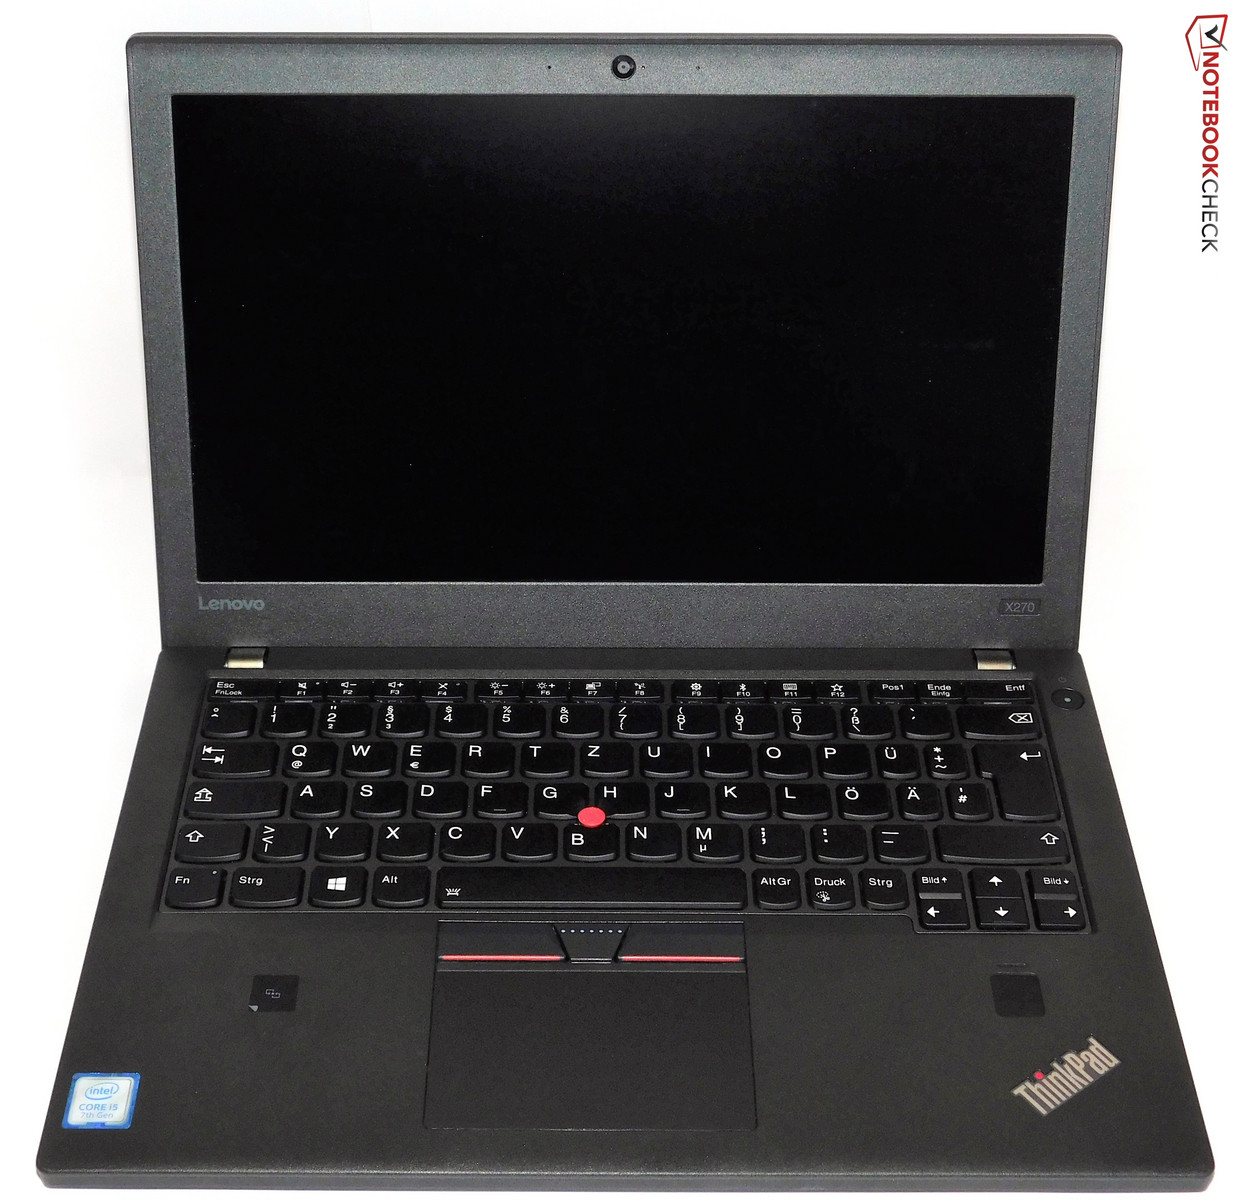
This is the fourth time Lenovo has reused the same case. As always with ThinkPads, the great input devices, as well as the PowerBridge feature – which basically has not real competitors - are definite pros. Considering its size, the X270 has a lot of ports, which means that it is very flexible to use. The small size also means that it is easy and comfortable to handle. In this respect, there are no differences to its predecessors – after all it is basically the same device.
Unfortunately, Lenovo did mess up in some areas of the X270. First of all, the cooling system: It is a little alarming that a device equipped with a ULV processor reaches 60°C (140°F) surface temperature - despite the cooling fan running annoyingly often. Another downside is the full HD display, which is significantly darker than its predecessor's, with a similar low color space coverage. The weaknesses in manufacturing are also similar to those of the previous versions. The maintenance design was already an issue for the X260: it is no fun to open the BaseCover. Surprisingly, the computer's smaller external 3-cell batteries also offer shorter battery life than that of its predecessor.
Lenovo's ThinkPad X2xx series urgently needs a makeover. Due to the many little problems, we cannot recommend the X270.
If you do not absolutely need a compact notebook which has a flexible battery configuration (PowerBridge), we cannot really recommend the ThinkPad X270. This is not just because of the various problems described above – although those alone would suffice for us to recommend taking a look at the direct competitors HP EliteBook 820 G4 and Dell Latitude 7280. General, it is difficult to find reasons for buying the X270, unless you need the PowerBridge and some features that are particularly important for big companies (smart card, docking port, Ethernet). The Dell XPS 13 and Lenovo’s largest in-house competitor, the ThinkPad X1 Carbon, for example, are models that offer higher quality and a bigger display, while still being very portable. That calls into question the whole existence of subnotebooks. One argument might be the price – although the classic 12-inch subnotebooks are not really low-cost either.
Lenovo ThinkPad X270-20HMS00T00
- 03/29/2017 v6 (old)
Benjamin Herzig