Recensione breve del portatile Dell Latitude 5480 (7600U, FHD)
| SD Card Reader | |
| average JPG Copy Test (av. of 3 runs) | |
| Dell Latitude 5480 | |
| HP ProBook 440 G4-Y8B51EA | |
| Acer TravelMate P648-M-757N | |
| Toshiba Tecra Z40-C-106 | |
| Lenovo ThinkPad T460s-20F9003SGE | |
| maximum AS SSD Seq Read Test (1GB) | |
| Dell Latitude 5480 | |
| HP ProBook 440 G4-Y8B51EA | |
| Lenovo ThinkPad T460s-20F9003SGE | |
| Toshiba Tecra Z40-C-106 | |
| Networking | |
| iperf3 transmit AX12 | |
| HP Spectre x360 15-bl002xx | |
| Dell Latitude 5480 | |
| iperf3 receive AX12 | |
| Dell Latitude 5480 | |
| HP Spectre x360 15-bl002xx | |
| |||||||||||||||||||||||||
Distribuzione della luminosità: 90 %
Al centro con la batteria: 215.9 cd/m²
Contrasto: 981:1 (Nero: 0.22 cd/m²)
ΔE ColorChecker Calman: 5.1 | ∀{0.5-29.43 Ø4.72}
ΔE Greyscale Calman: 4 | ∀{0.09-98 Ø4.97}
61.15% sRGB (Argyll 1.6.3 3D)
41.96% AdobeRGB 1998 (Argyll 1.6.3 3D)
41.96% AdobeRGB 1998 (Argyll 3D)
61.2% sRGB (Argyll 3D)
40.62% Display P3 (Argyll 3D)
Gamma: 2.41
CCT: 6856 K
| Dell Latitude 5480 LG Philips LGD0553, IPS, 14", 1920x1080 | Dell Latitude 14 E5470 LP140WF3, AH-IPS, WLED, 14", 1920x1080 | Lenovo ThinkPad T460s-20F9003SGE N140HCE-EAA, LEN40A9, IPS, 14", 1920x1080 | HP ProBook 440 G4-Y8B51EA AUO1E3D, TN, 14", 1920x1080 | Lenovo ThinkPad X1 Carbon 20FB-005XUS IPS, 14", 1920x1080 | Acer TravelMate P648-M-757N AU Optronics B140HAN02.1, IPS, 14", 1920x1080 | Toshiba Tecra Z40-C-106 Toshiba TOS508F, IPS, 14", 1920x1080 | |
|---|---|---|---|---|---|---|---|
| Display | 49% | 2% | -7% | 42% | -13% | 48% | |
| Display P3 Coverage (%) | 40.62 | 64.8 60% | 41.65 3% | 37.6 -7% | 58.9 45% | 35.53 -13% | 64.8 60% |
| sRGB Coverage (%) | 61.2 | 84.8 39% | 61.6 1% | 56.6 -8% | 83.1 36% | 53.3 -13% | 84.4 38% |
| AdobeRGB 1998 Coverage (%) | 41.96 | 62 48% | 43.14 3% | 38.85 -7% | 60.3 44% | 36.72 -12% | 61.7 47% |
| Response Times | -9% | -20% | -12% | -25% | -15% | 3% | |
| Response Time Grey 50% / Grey 80% * (ms) | 32.8 ? | 39 ? -19% | 42 ? -28% | 43.2 ? -32% | 47.2 ? -44% | 44 ? -34% | 32.8 ? -0% |
| Response Time Black / White * (ms) | 26.4 ? | 26 ? 2% | 29.2 ? -11% | 24.4 ? 8% | 27.6 ? -5% | 25 ? 5% | 25.2 ? 5% |
| PWM Frequency (Hz) | |||||||
| Screen | 6% | -8% | -40% | 24% | 13% | 5% | |
| Brightness middle (cd/m²) | 215.9 | 323 50% | 226 5% | 216 0% | 321.7 49% | 254 18% | 269 25% |
| Brightness (cd/m²) | 205 | 316 54% | 211 3% | 203 -1% | 301 47% | 243 19% | 257 25% |
| Brightness Distribution (%) | 90 | 79 -12% | 89 -1% | 83 -8% | 89 -1% | 90 0% | 86 -4% |
| Black Level * (cd/m²) | 0.22 | 0.57 -159% | 0.22 -0% | 0.47 -114% | 0.294 -34% | 0.19 14% | 0.52 -136% |
| Contrast (:1) | 981 | 567 -42% | 1027 5% | 460 -53% | 1094 12% | 1337 36% | 517 -47% |
| Colorchecker dE 2000 * | 5.1 | 3.68 28% | 6.44 -26% | 8.98 -76% | 3.96 22% | 4.93 3% | 3.45 32% |
| Colorchecker dE 2000 max. * | 15.6 | 8.33 47% | 17.18 -10% | 14.07 10% | 6.69 57% | 10.14 35% | 9.34 40% |
| Greyscale dE 2000 * | 4 | 2.99 25% | 5.87 -47% | 9.61 -140% | 3.15 21% | 2.71 32% | 2.28 43% |
| Gamma | 2.41 91% | 2.49 88% | 2.37 93% | 2.63 84% | 2.34 94% | 2.36 93% | 2.38 92% |
| CCT | 6856 95% | 6572 99% | 6856 95% | 11265 58% | 7082 92% | 6914 94% | 6230 104% |
| Color Space (Percent of AdobeRGB 1998) (%) | 41.96 | 55 31% | 39.58 -6% | 35.9 -14% | 53.8 28% | 34 -19% | 55.24 32% |
| Color Space (Percent of sRGB) (%) | 61.15 | 85 39% | 61.15 0% | 56.7 -7% | 82.7 35% | 53 -13% | 84.32 38% |
| Media totale (Programma / Settaggio) | 15% /
13% | -9% /
-7% | -20% /
-30% | 14% /
21% | -5% /
4% | 19% /
13% |
* ... Meglio usare valori piccoli
Tempi di risposta del Display
| ↔ Tempi di risposta dal Nero al Bianco | ||
|---|---|---|
| 26.4 ms ... aumenta ↗ e diminuisce ↘ combinato | ↗ 5.2 ms Incremento | 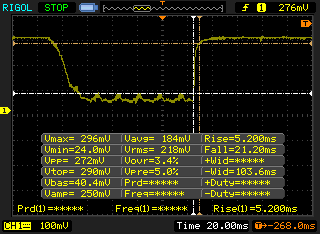 |
| ↘ 21.2 ms Calo | ||
| Lo schermo mostra tempi di risposta relativamente lenti nei nostri tests e potrebbe essere troppo lento per i gamers. In confronto, tutti i dispositivi di test variano da 0.1 (minimo) a 240 (massimo) ms. » 66 % di tutti i dispositivi è migliore. Questo significa che i tempi di risposta rilevati sono peggiori rispetto alla media di tutti i dispositivi testati (19.8 ms). | ||
| ↔ Tempo di risposta dal 50% Grigio all'80% Grigio | ||
| 32.8 ms ... aumenta ↗ e diminuisce ↘ combinato | ↗ 14 ms Incremento | 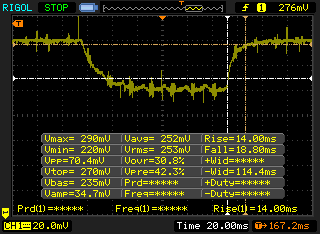 |
| ↘ 18.8 ms Calo | ||
| Lo schermo mostra tempi di risposta lenti nei nostri tests e sarà insoddisfacente per i gamers. In confronto, tutti i dispositivi di test variano da 0.165 (minimo) a 636 (massimo) ms. » 44 % di tutti i dispositivi è migliore. Questo significa che i tempi di risposta rilevati sono simili alla media di tutti i dispositivi testati (31 ms). | ||
Sfarfallio dello schermo / PWM (Pulse-Width Modulation)
| flickering dello schermo / PWM non rilevato | 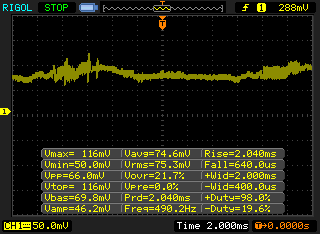 | ||
In confronto: 52 % di tutti i dispositivi testati non utilizza PWM per ridurre la luminosita' del display. Se è rilevato PWM, una media di 7778 (minimo: 5 - massimo: 343500) Hz è stata rilevata. | |||
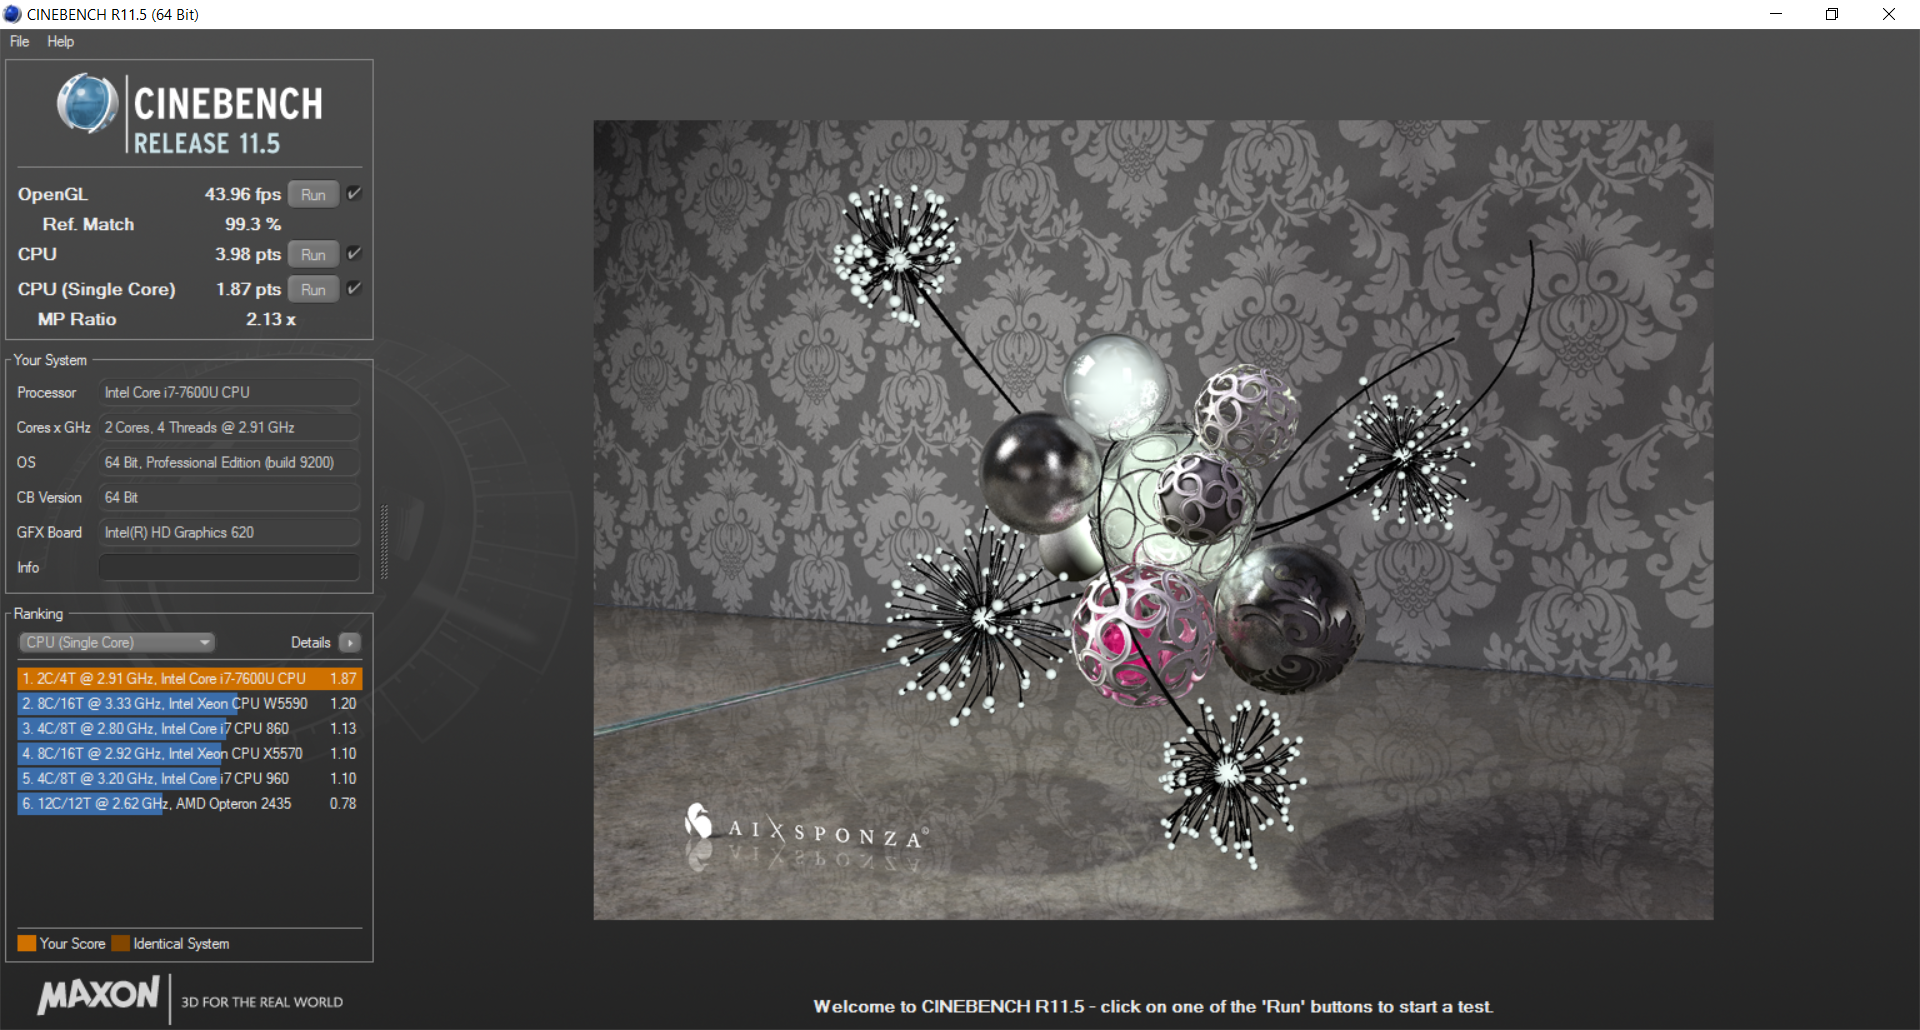
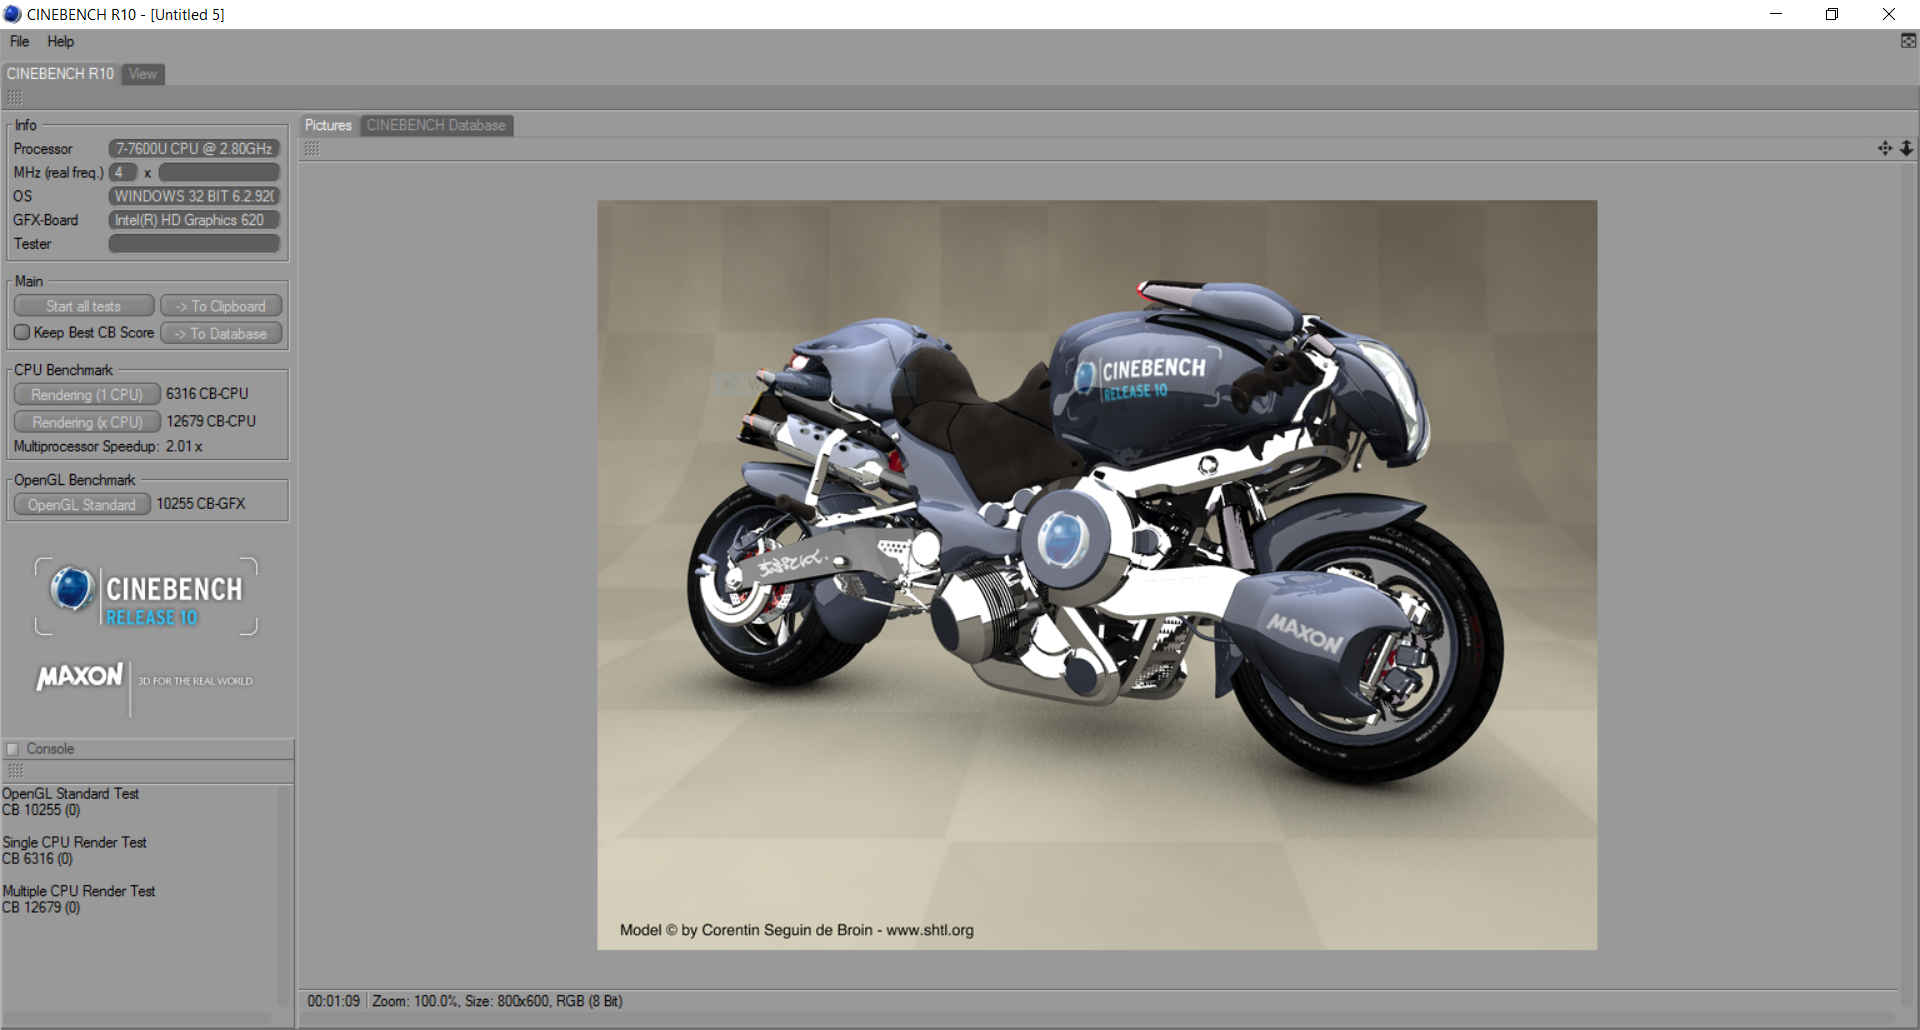
| Cinebench R10 | |
| Rendering Single 32Bit | |
| Dell Latitude 5480 | |
| HP ProBook 440 G4-Y8B51EA | |
| Dell Latitude 14 E5470 | |
| Lenovo ThinkPad X1 Carbon 20FB-005XUS | |
| Acer TravelMate P648-M-757N | |
| Rendering Multiple CPUs 32Bit | |
| Dell Latitude 14 E5470 | |
| Dell Latitude 5480 | |
| HP ProBook 440 G4-Y8B51EA | |
| Acer TravelMate P648-M-757N | |
| Lenovo ThinkPad X1 Carbon 20FB-005XUS | |
| wPrime 2.10 - 1024m | |
| Lenovo ThinkPad X1 Carbon 20FB-005XUS | |
| Dell Latitude 5480 | |
* ... Meglio usare valori piccoli
| PCMark 8 Home Score Accelerated v2 | 3913 punti | |
| PCMark 8 Creative Score Accelerated v2 | 4923 punti | |
| PCMark 8 Work Score Accelerated v2 | 4992 punti | |
Aiuto | ||
| Dell Latitude 5480 Toshiba SG5 256GB THNSNK256GVN8 | Dell Latitude 14 E5470 Micron SSD 1100 (MTFDDAV256TBN) | Lenovo ThinkPad T460s-20F9003SGE Samsung CM871 MZ7LF192HCGS | HP ProBook 440 G4-Y8B51EA SanDisk SD8SNAT256G1002 | Lenovo ThinkPad X1 Carbon 20FB-005XUS Samsung SM951 MZVPV256 m.2 | Acer TravelMate P648-M-757N Lite-On CV1-8B256 | Toshiba Tecra Z40-C-106 Toshiba HG6 THNSNJ256G8NY | |
|---|---|---|---|---|---|---|---|
| CrystalDiskMark 3.0 | -7% | -52% | -11% | 177% | 6% | 3% | |
| Read Seq (MB/s) | 469.4 | 465.4 -1% | 446.5 -5% | 491.2 5% | 1720 266% | 531 13% | 521 11% |
| Write Seq (MB/s) | 264.8 | 363.1 37% | 171.1 -35% | 322.2 22% | 1263 377% | 358.8 35% | 444.5 68% |
| Read 512 (MB/s) | 408.1 | 338.4 -17% | 259.2 -36% | 310.1 -24% | 1223 200% | 384.8 -6% | 420.2 3% |
| Write 512 (MB/s) | 265.5 | 246.1 -7% | 167.2 -37% | 276 4% | 1249 370% | 363 37% | 421 59% |
| Read 4k (MB/s) | 24.66 | 25.83 5% | 5.78 -77% | 19.57 -21% | 49.65 101% | 31.3 27% | 20.32 -18% |
| Write 4k (MB/s) | 114.8 | 80.3 -30% | 35.47 -69% | 77.8 -32% | 123 7% | 80.3 -30% | 79.6 -31% |
| Read 4k QD32 (MB/s) | 380.3 | 246.1 -35% | 94.9 -75% | 146.3 -62% | 464.6 22% | 239.4 -37% | 229 -40% |
| Write 4k QD32 (MB/s) | 207.2 | 197.7 -5% | 36.43 -82% | 241.4 17% | 354.7 71% | 225.3 9% | 153.6 -26% |

| 3DMark 11 Performance | 1845 punti | |
| 3DMark Ice Storm Standard Score | 67522 punti | |
| 3DMark Cloud Gate Standard Score | 6916 punti | |
| 3DMark Fire Strike Score | 952 punti | |
| 3DMark Fire Strike Extreme Score | 444 punti | |
Aiuto | ||
| Tomb Raider | |
| 1024x768 Low Preset (ordina per valore) | |
| Dell Latitude 5480 | |
| Lenovo ThinkPad T460s-20F9003SGE | |
| HP ProBook 440 G4-Y8B51EA | |
| Acer TravelMate P648-M-757N | |
| 1366x768 Normal Preset AA:FX AF:4x (ordina per valore) | |
| Dell Latitude 5480 | |
| Lenovo ThinkPad T460s-20F9003SGE | |
| HP ProBook 440 G4-Y8B51EA | |
| Acer TravelMate P648-M-757N | |
| 1366x768 High Preset AA:FX AF:8x (ordina per valore) | |
| Dell Latitude 5480 | |
| Lenovo ThinkPad T460s-20F9003SGE | |
| HP ProBook 440 G4-Y8B51EA | |
| Acer TravelMate P648-M-757N | |
| 1920x1080 Ultra Preset AA:FX AF:16x (ordina per valore) | |
| Dell Latitude 5480 | |
| HP ProBook 440 G4-Y8B51EA | |
| Acer TravelMate P648-M-757N | |
| basso | medio | alto | ultra | |
|---|---|---|---|---|
| Anno 2070 (2011) | 88.9 | 49.7 | 30.3 | 13.8 |
| Tomb Raider (2013) | 86.2 | 45.1 | 28.6 | 13.2 |
Rumorosità
| Idle |
| 29.6 / 29.6 / 29.6 dB(A) |
| Sotto carico |
| 42 / 47.1 dB(A) |
 | ||
30 dB silenzioso 40 dB(A) udibile 50 dB(A) rumoroso |
||
min: | ||
| Dell Latitude 5480 HD Graphics 620, i7-7600U, Toshiba SG5 256GB THNSNK256GVN8 | Acer TravelMate P648-M-757N HD Graphics 520, 6500U, Lite-On CV1-8B256 | Lenovo ThinkPad T460s-20F9003SGE HD Graphics 520, 6200U, Samsung CM871 MZ7LF192HCGS | HP ProBook 440 G4-Y8B51EA GeForce 930MX, i7-7500U, SanDisk SD8SNAT256G1002 | Lenovo ThinkPad X1 Carbon 20FB-005XUS HD Graphics 520, 6300U, Samsung SM951 MZVPV256 m.2 | Toshiba Tecra Z40-C-106 HD Graphics 520, 6200U, Toshiba HG6 THNSNJ256G8NY | Dell Latitude 14 E5470 HD Graphics 530, 6440HQ, Micron SSD 1100 (MTFDDAV256TBN) | |
|---|---|---|---|---|---|---|---|
| Noise | 7% | 10% | 7% | 10% | 8% | 9% | |
| Idle Minimum * (dB) | 29.6 | 31.2 -5% | 29.1 2% | 29 2% | 28.8 3% | 29.8 -1% | 30.3 -2% |
| Idle Average * (dB) | 29.6 | 31.2 -5% | 29.1 2% | 29 2% | 28.9 2% | 29.8 -1% | 30.3 -2% |
| Idle Maximum * (dB) | 29.6 | 31.6 -7% | 29.1 2% | 29 2% | 28.9 2% | 29.8 -1% | 30.3 -2% |
| Load Average * (dB) | 42 | 33.3 21% | 32.3 23% | 37.4 11% | 35 17% | 32.6 22% | 31.6 25% |
| Load Maximum * (dB) | 47.1 | 32.4 31% | 36.6 22% | 39 17% | 35.8 24% | 37.2 21% | 35 26% |
| off /ambiente * (dB) | 31.2 | 29.1 | 29 | 28.8 | 29 | 30.3 |
* ... Meglio usare valori piccoli
(+) La temperatura massima sul lato superiore è di 36.4 °C / 98 F, rispetto alla media di 34.3 °C / 94 F, che varia da 21.2 a 62.5 °C per questa classe Office.
(±) Il lato inferiore si riscalda fino ad un massimo di 45 °C / 113 F, rispetto alla media di 36.8 °C / 98 F
(+) In idle, la temperatura media del lato superiore è di 24 °C / 75 F, rispetto alla media deld ispositivo di 29.5 °C / 85 F.
(+) I poggiapolsi e il touchpad sono piu' freddi della temperatura della pelle con un massimo di 24.8 °C / 76.6 F e sono quindi freddi al tatto.
(+) La temperatura media della zona del palmo della mano di dispositivi simili e'stata di 27.5 °C / 81.5 F (+2.7 °C / 4.9 F).
Dell Latitude 5480 analisi audio
(±) | potenza degli altiparlanti media ma buona (80.5 dB)
Bassi 100 - 315 Hz
(±) | bassi ridotti - in media 8.7% inferiori alla media
(±) | la linearità dei bassi è media (10.1% delta rispetto alla precedente frequenza)
Medi 400 - 2000 Hz
(+) | medi bilanciati - solo only 3.6% rispetto alla media
(±) | linearità dei medi adeguata (7.8% delta rispetto alla precedente frequenza)
Alti 2 - 16 kHz
(±) | alti elevati - circa 5.7% superiori alla media
(±) | la linearità degli alti è media (9.2% delta rispetto alla precedente frequenza)
Nel complesso 100 - 16.000 Hz
(±) | la linearità complessiva del suono è media (15.6% di differenza rispetto alla media
Rispetto alla stessa classe
» 16% di tutti i dispositivi testati in questa classe è stato migliore, 4% simile, 80% peggiore
» Il migliore ha avuto un delta di 7%, medio di 21%, peggiore di 53%
Rispetto a tutti i dispositivi testati
» 23% di tutti i dispositivi testati in questa classe è stato migliore, 5% similare, 72% peggiore
» Il migliore ha avuto un delta di 4%, medio di 24%, peggiore di 134%
Apple MacBook 12 (Early 2016) 1.1 GHz analisi audio
(+) | gli altoparlanti sono relativamente potenti (83.6 dB)
Bassi 100 - 315 Hz
(±) | bassi ridotti - in media 11.3% inferiori alla media
(±) | la linearità dei bassi è media (14.2% delta rispetto alla precedente frequenza)
Medi 400 - 2000 Hz
(+) | medi bilanciati - solo only 2.4% rispetto alla media
(+) | medi lineari (5.5% delta rispetto alla precedente frequenza)
Alti 2 - 16 kHz
(+) | Alti bilanciati - appena 2% dalla media
(+) | alti lineari (4.5% delta rispetto alla precedente frequenza)
Nel complesso 100 - 16.000 Hz
(+) | suono nel complesso lineare (10.2% differenza dalla media)
Rispetto alla stessa classe
» 7% di tutti i dispositivi testati in questa classe è stato migliore, 2% simile, 91% peggiore
» Il migliore ha avuto un delta di 5%, medio di 18%, peggiore di 53%
Rispetto a tutti i dispositivi testati
» 5% di tutti i dispositivi testati in questa classe è stato migliore, 1% similare, 94% peggiore
» Il migliore ha avuto un delta di 4%, medio di 24%, peggiore di 134%
| Off / Standby | |
| Idle | |
| Sotto carico |
|
Leggenda:
min: | |
| Dell Latitude 5480 i7-7600U, HD Graphics 620, Toshiba SG5 256GB THNSNK256GVN8, IPS, 1920x1080, 14" | Acer TravelMate P648-M-757N 6500U, HD Graphics 520, Lite-On CV1-8B256, IPS, 1920x1080, 14" | Lenovo ThinkPad T460s-20F9003SGE 6200U, HD Graphics 520, Samsung CM871 MZ7LF192HCGS, IPS, 1920x1080, 14" | HP ProBook 440 G4-Y8B51EA i7-7500U, GeForce 930MX, SanDisk SD8SNAT256G1002, TN, 1920x1080, 14" | Lenovo ThinkPad X1 Carbon 20FB-005XUS 6300U, HD Graphics 520, Samsung SM951 MZVPV256 m.2, IPS, 1920x1080, 14" | Toshiba Tecra Z40-C-106 6200U, HD Graphics 520, Toshiba HG6 THNSNJ256G8NY, IPS, 1920x1080, 14" | Dell Latitude 14 E5470 6440HQ, HD Graphics 530, Micron SSD 1100 (MTFDDAV256TBN), AH-IPS, WLED, 1920x1080, 14" | |
|---|---|---|---|---|---|---|---|
| Power Consumption | -14% | 11% | -4% | -9% | 5% | -19% | |
| Idle Minimum * (Watt) | 6.64 | 5.3 20% | 3.7 44% | 3 55% | 7.6 -14% | 4.3 35% | 4.1 38% |
| Idle Average * (Watt) | 6.67 | 9.3 -39% | 6.8 -2% | 5.4 19% | 9 -35% | 7.6 -14% | 8.1 -21% |
| Idle Maximum * (Watt) | 7.78 | 11.5 -48% | 7.3 6% | 6.3 19% | 9.6 -23% | 8.3 -7% | 11.4 -47% |
| Load Average * (Watt) | 30.83 | 30.8 -0% | 26.3 15% | 37.5 -22% | 24.5 21% | 26.8 13% | 33.5 -9% |
| Load Maximum * (Watt) | 31.7 | 32 -1% | 34.6 -9% | 61.1 -93% | 30.3 4% | 32.6 -3% | 49 -55% |
* ... Meglio usare valori piccoli
| Dell Latitude 5480 i7-7600U, HD Graphics 620, 68 Wh | Acer TravelMate P648-M-757N 6500U, HD Graphics 520, 54 Wh | Lenovo ThinkPad T460s-20F9003SGE 6200U, HD Graphics 520, 49 Wh | HP ProBook 440 G4-Y8B51EA i7-7500U, GeForce 930MX, 48 Wh | Lenovo ThinkPad X1 Carbon 20FB-005XUS 6300U, HD Graphics 520, 52 Wh | Toshiba Tecra Z40-C-106 6200U, HD Graphics 520, 64 Wh | Dell Latitude 14 E5470 6440HQ, HD Graphics 530, 62 Wh | |
|---|---|---|---|---|---|---|---|
| Autonomia della batteria | -34% | -42% | -30% | -42% | -24% | -47% | |
| Reader / Idle (h) | 24.1 | 18.1 -25% | 15.3 -37% | 18.1 -25% | 12.9 -46% | 17.4 -28% | 15.2 -37% |
| WiFi v1.3 (h) | 16.1 | 9.1 -43% | 6.6 -59% | 6.9 -57% | 6.9 -57% | 9 -44% | 7.2 -55% |
| Load (h) | 2.7 | 1.8 -33% | 1.9 -30% | 2.5 -7% | 2.1 -22% | 2.7 0% | 1.4 -48% |
Pro
Contro
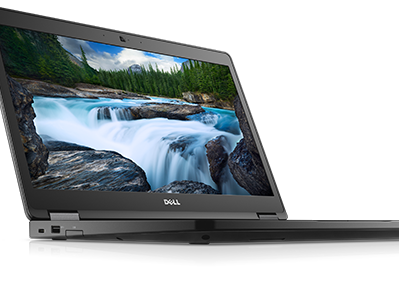
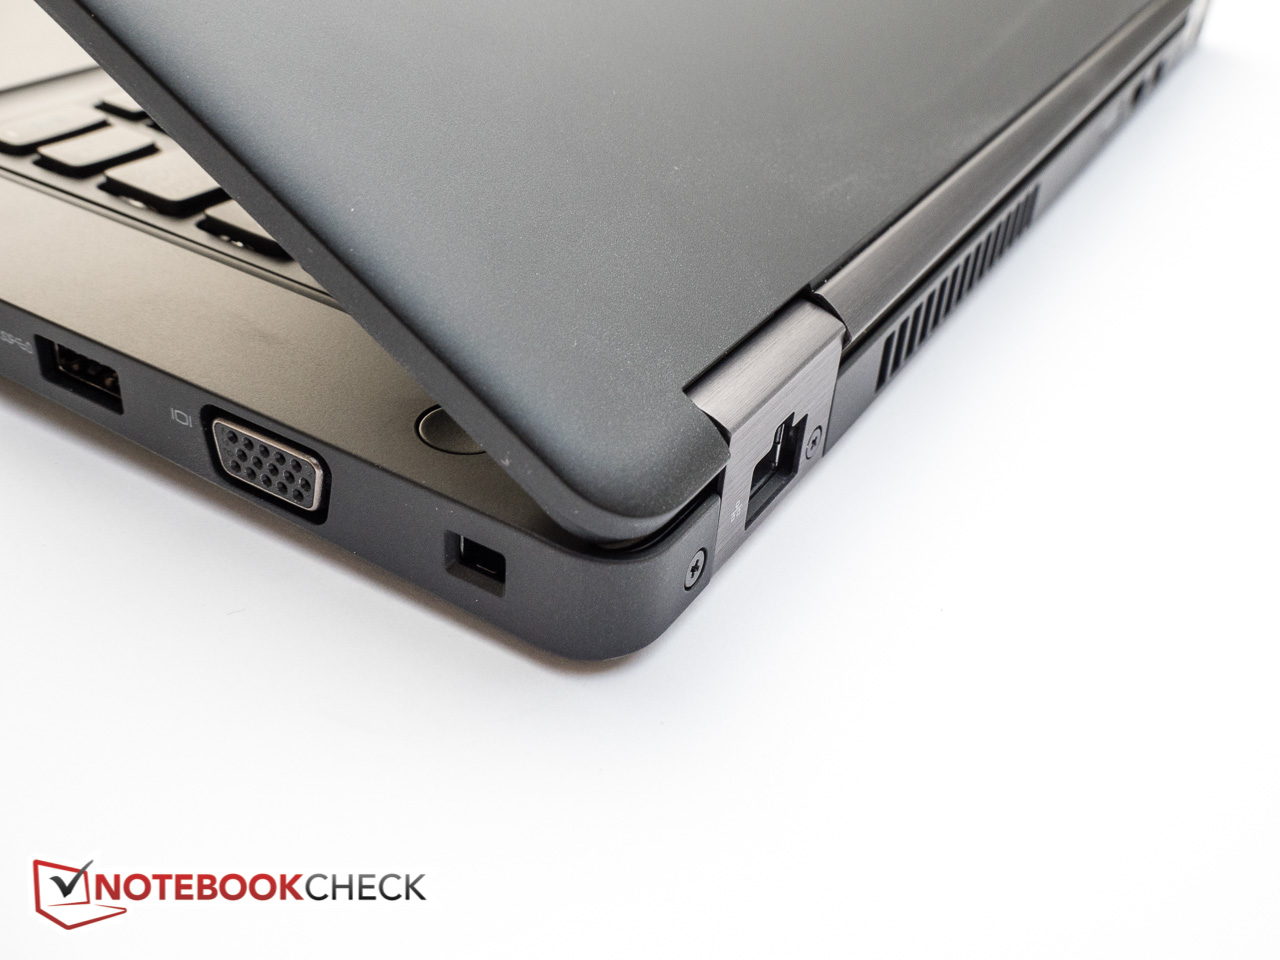
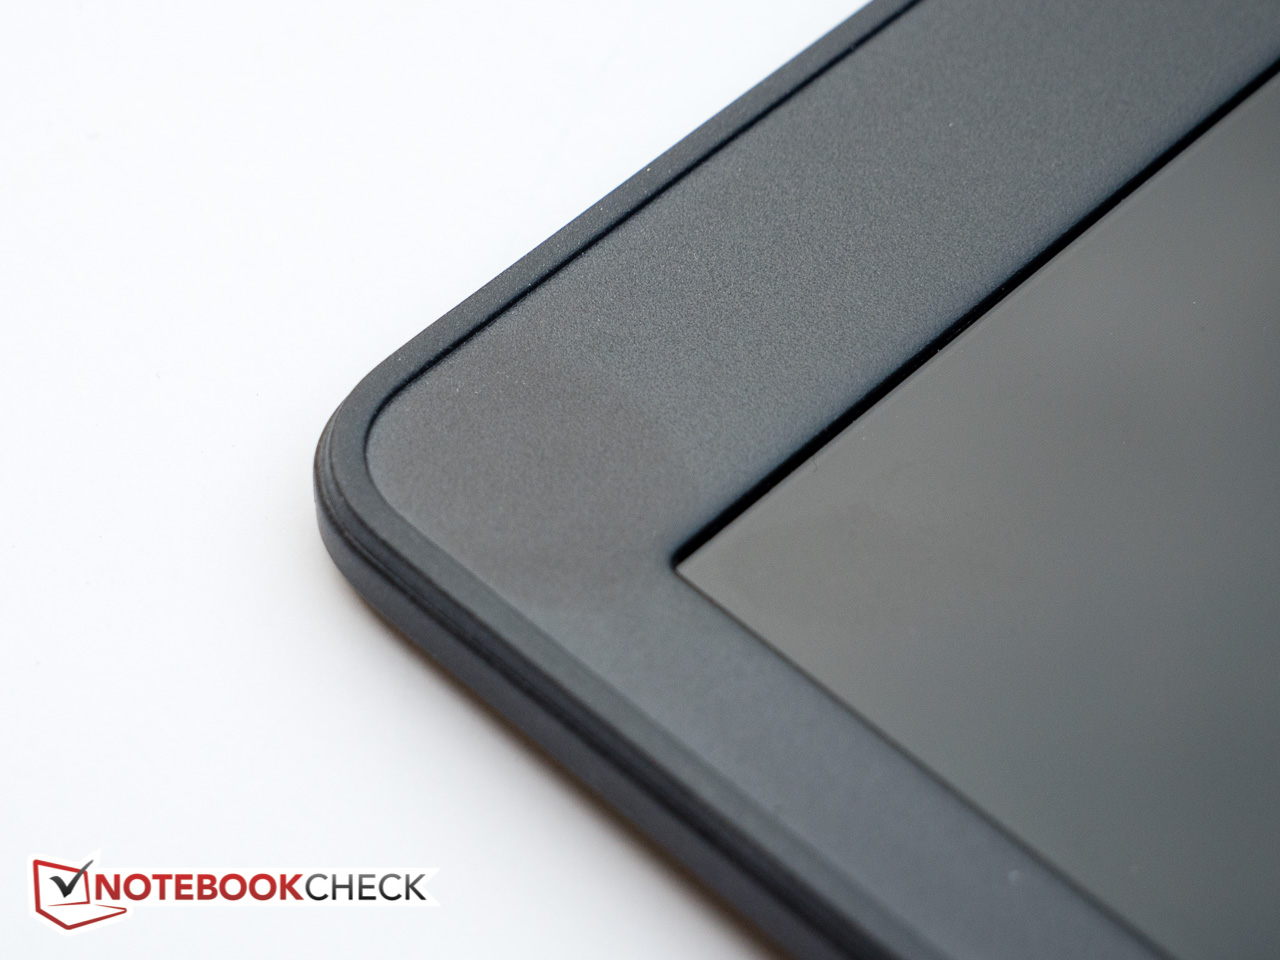
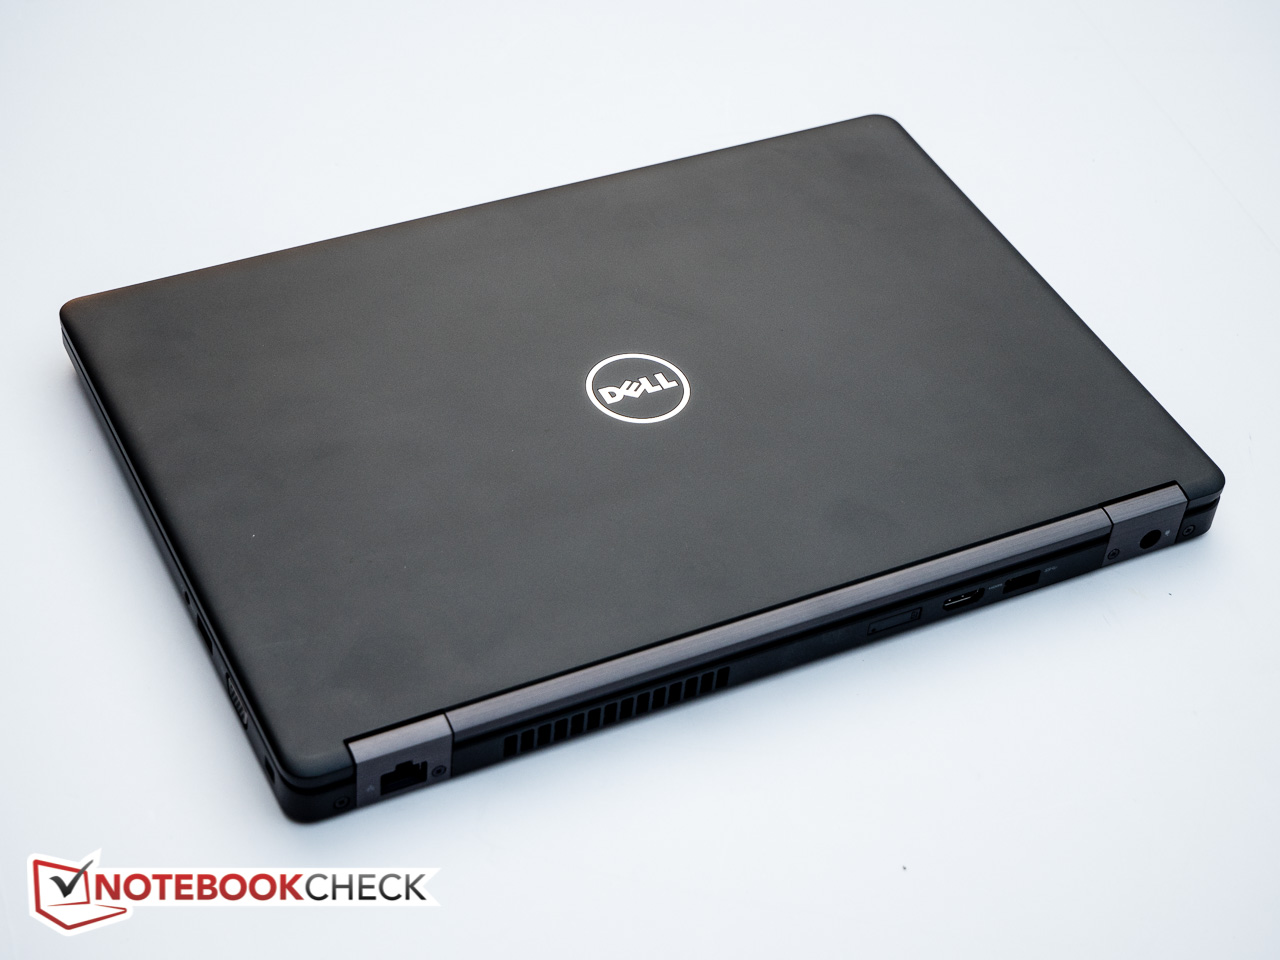
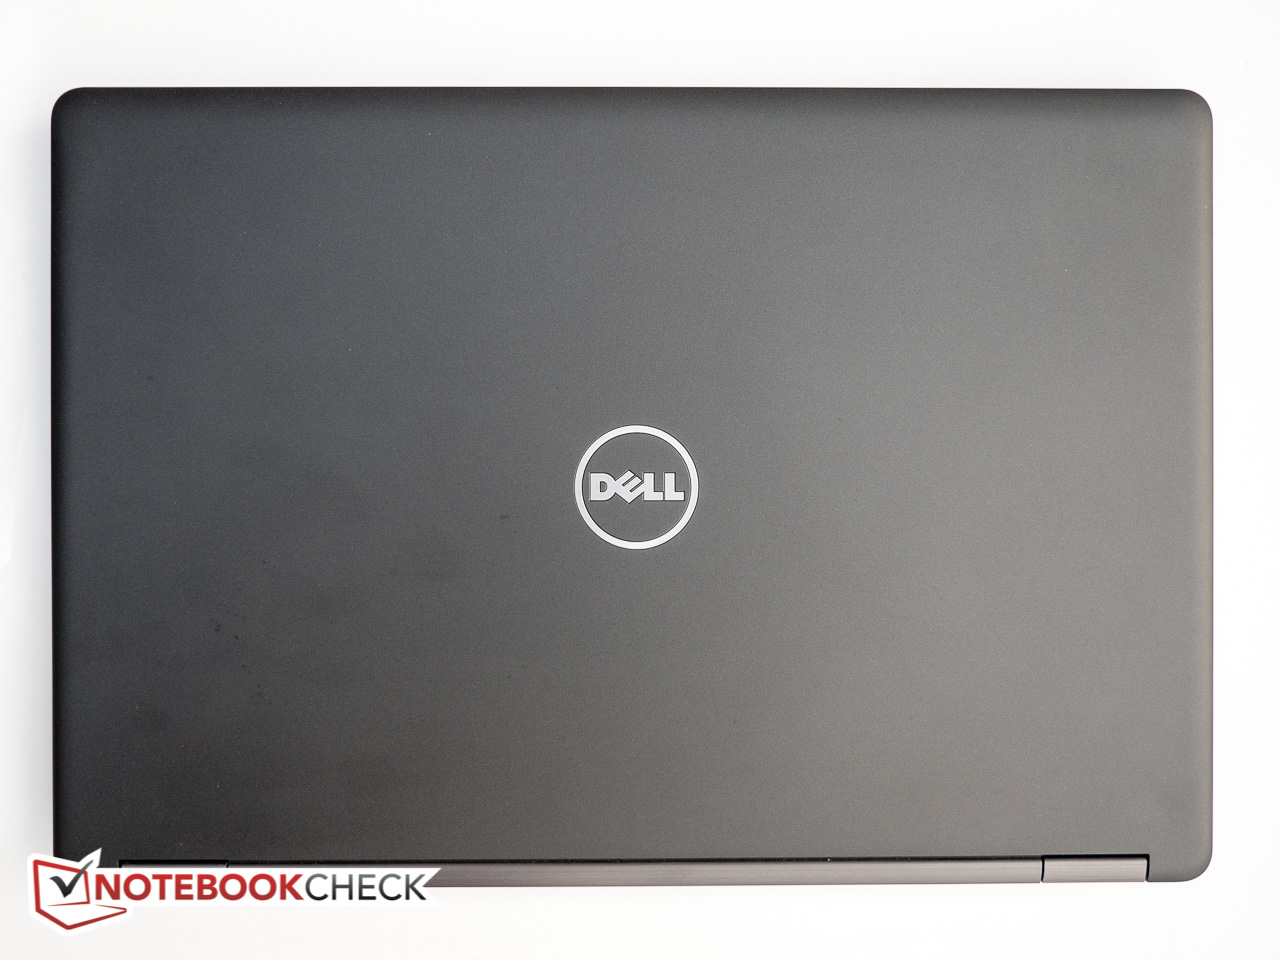
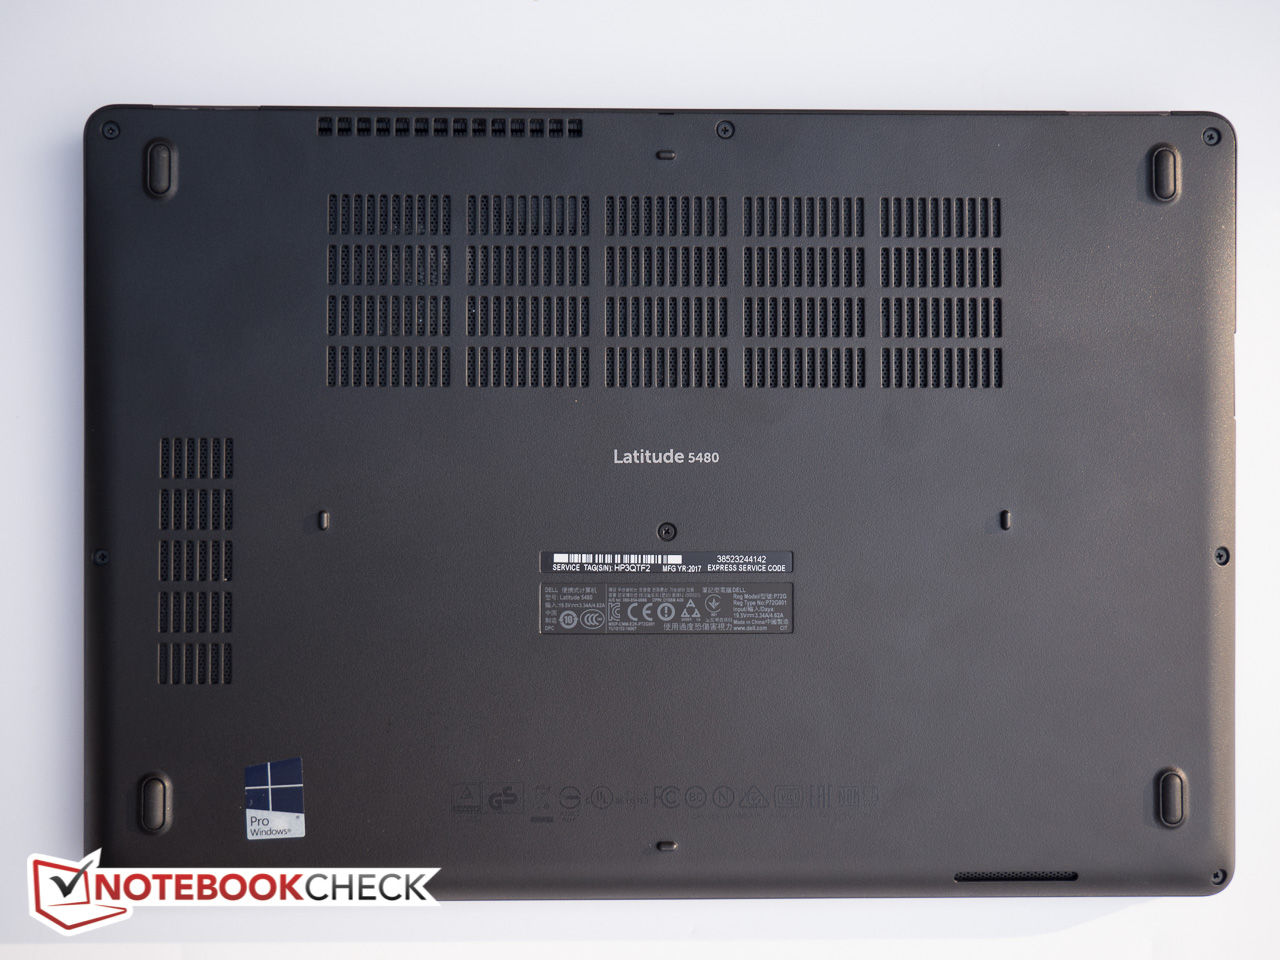
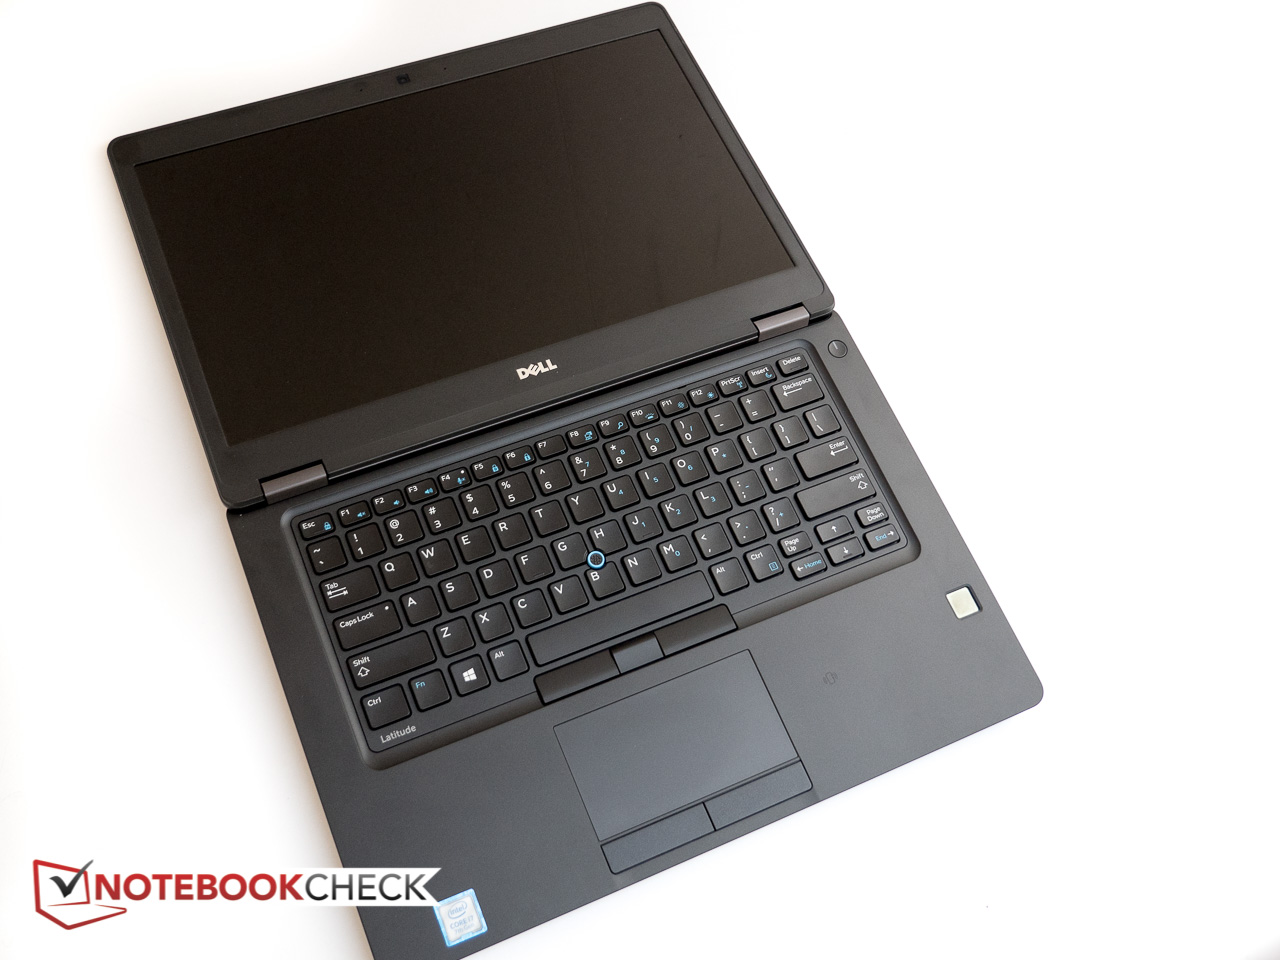
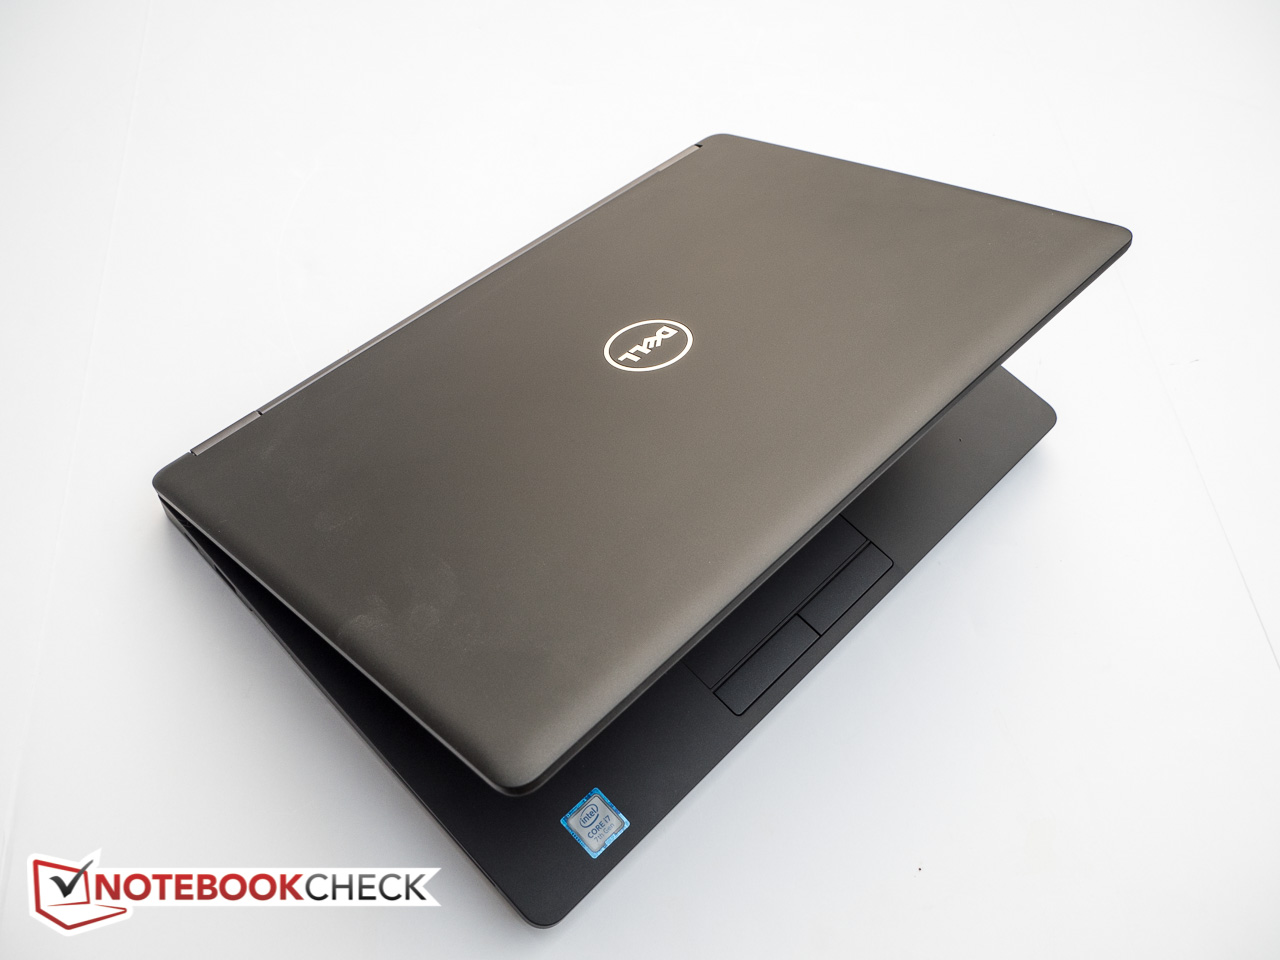
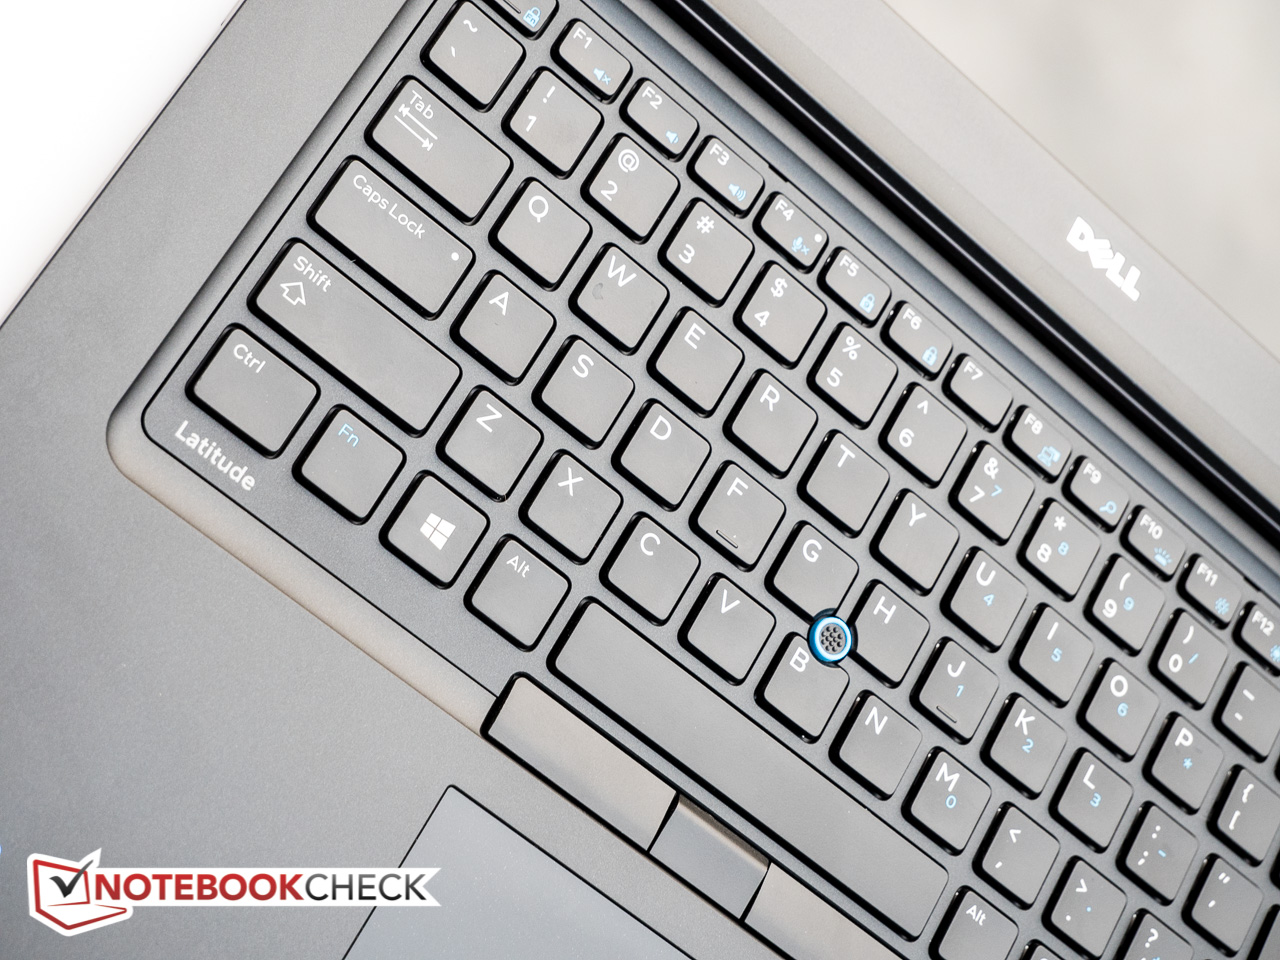
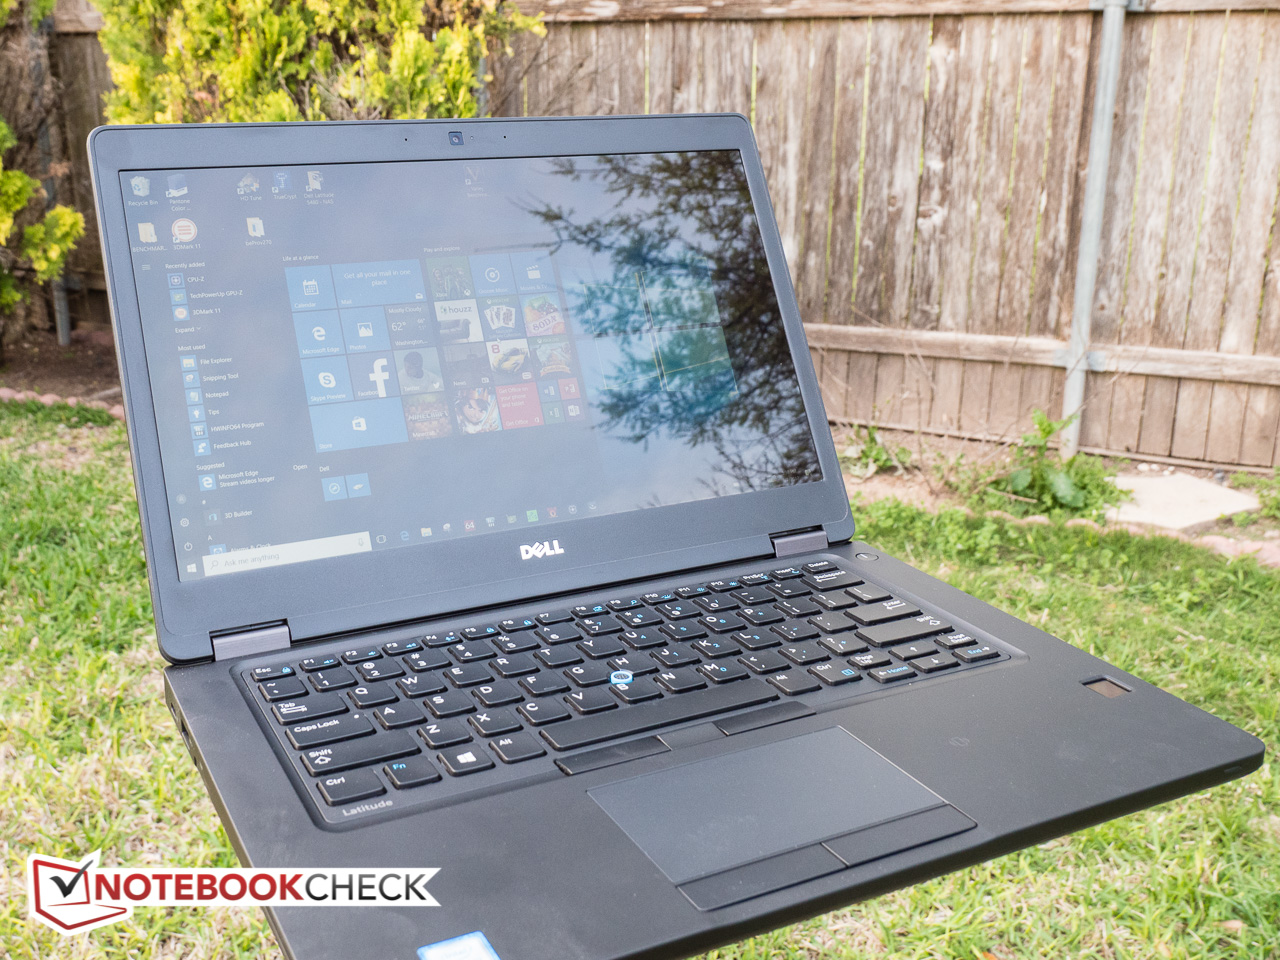
Nulla è molto cambiato in apparenza: con il suo design sobrio e l'esterno liscio e nero,il Dell da 14" Latitude 5480 somiglia ancora un po' come al predecessore Latitude 14 E5470. L'high-end Kaby Lake i7 CPU dual-core offre perfomance eccezionali sufficienti per le varie attività di business. La GPU 3D integrata offre potenza moderata; gli utenti che richiedono una migliore elaborazione grafica possono scegliere il modello Latitude dotato di una GPU Nvidia GeForce 930MX dedicata. La qualità costruttiva è elevata anche con alcune lacune e indulgenze, la tastiera, sebbene flessibile nel mezzo è un po' troppo pronunciata per i nostri gusti. I dispositivi di input - tra cui il touchscreen - lavorano bene e dattilografi probabilmente trovano piacevole la tastiera nell'utilizzo. Però gli utenti Pointstick provenienti da un Thinkpad potrebbero non essere particolarmente colpiti dal design dei pulsanti del mouse.
Una delle principali differenze - e un grande passo indietro anche nella nostra recensione - è il nuovo pannello del display. Anche se offre un migliore contrasto, la gamma di colore e la luminosità in particolare - il nuovo pannello è del 35% più scuro - hanno preso un colpo importante. In positivo, la durata della batteria che ha compiuto un grande balzo in avanti, superando la competizione in modo semplice e con un margine consistente.
La durata della batteria del Latitude 5480 è seconda a nessuno - 16 ore di navigazione WLAN dovrebbero essere sufficienti anche per gli utenti esigenti. Saremmo felici di scambiare un paio d'ore di tempo di esecuzione per un display più luminoso.
Nota: si tratta di una recensione breve, con alcune sezioni non tradotte, per la versione integrale in inglese guardate qui.
Dell Latitude 5480
- 04/18/2017 v6 (old)
Bernhard Pechlaner
Price comparison
