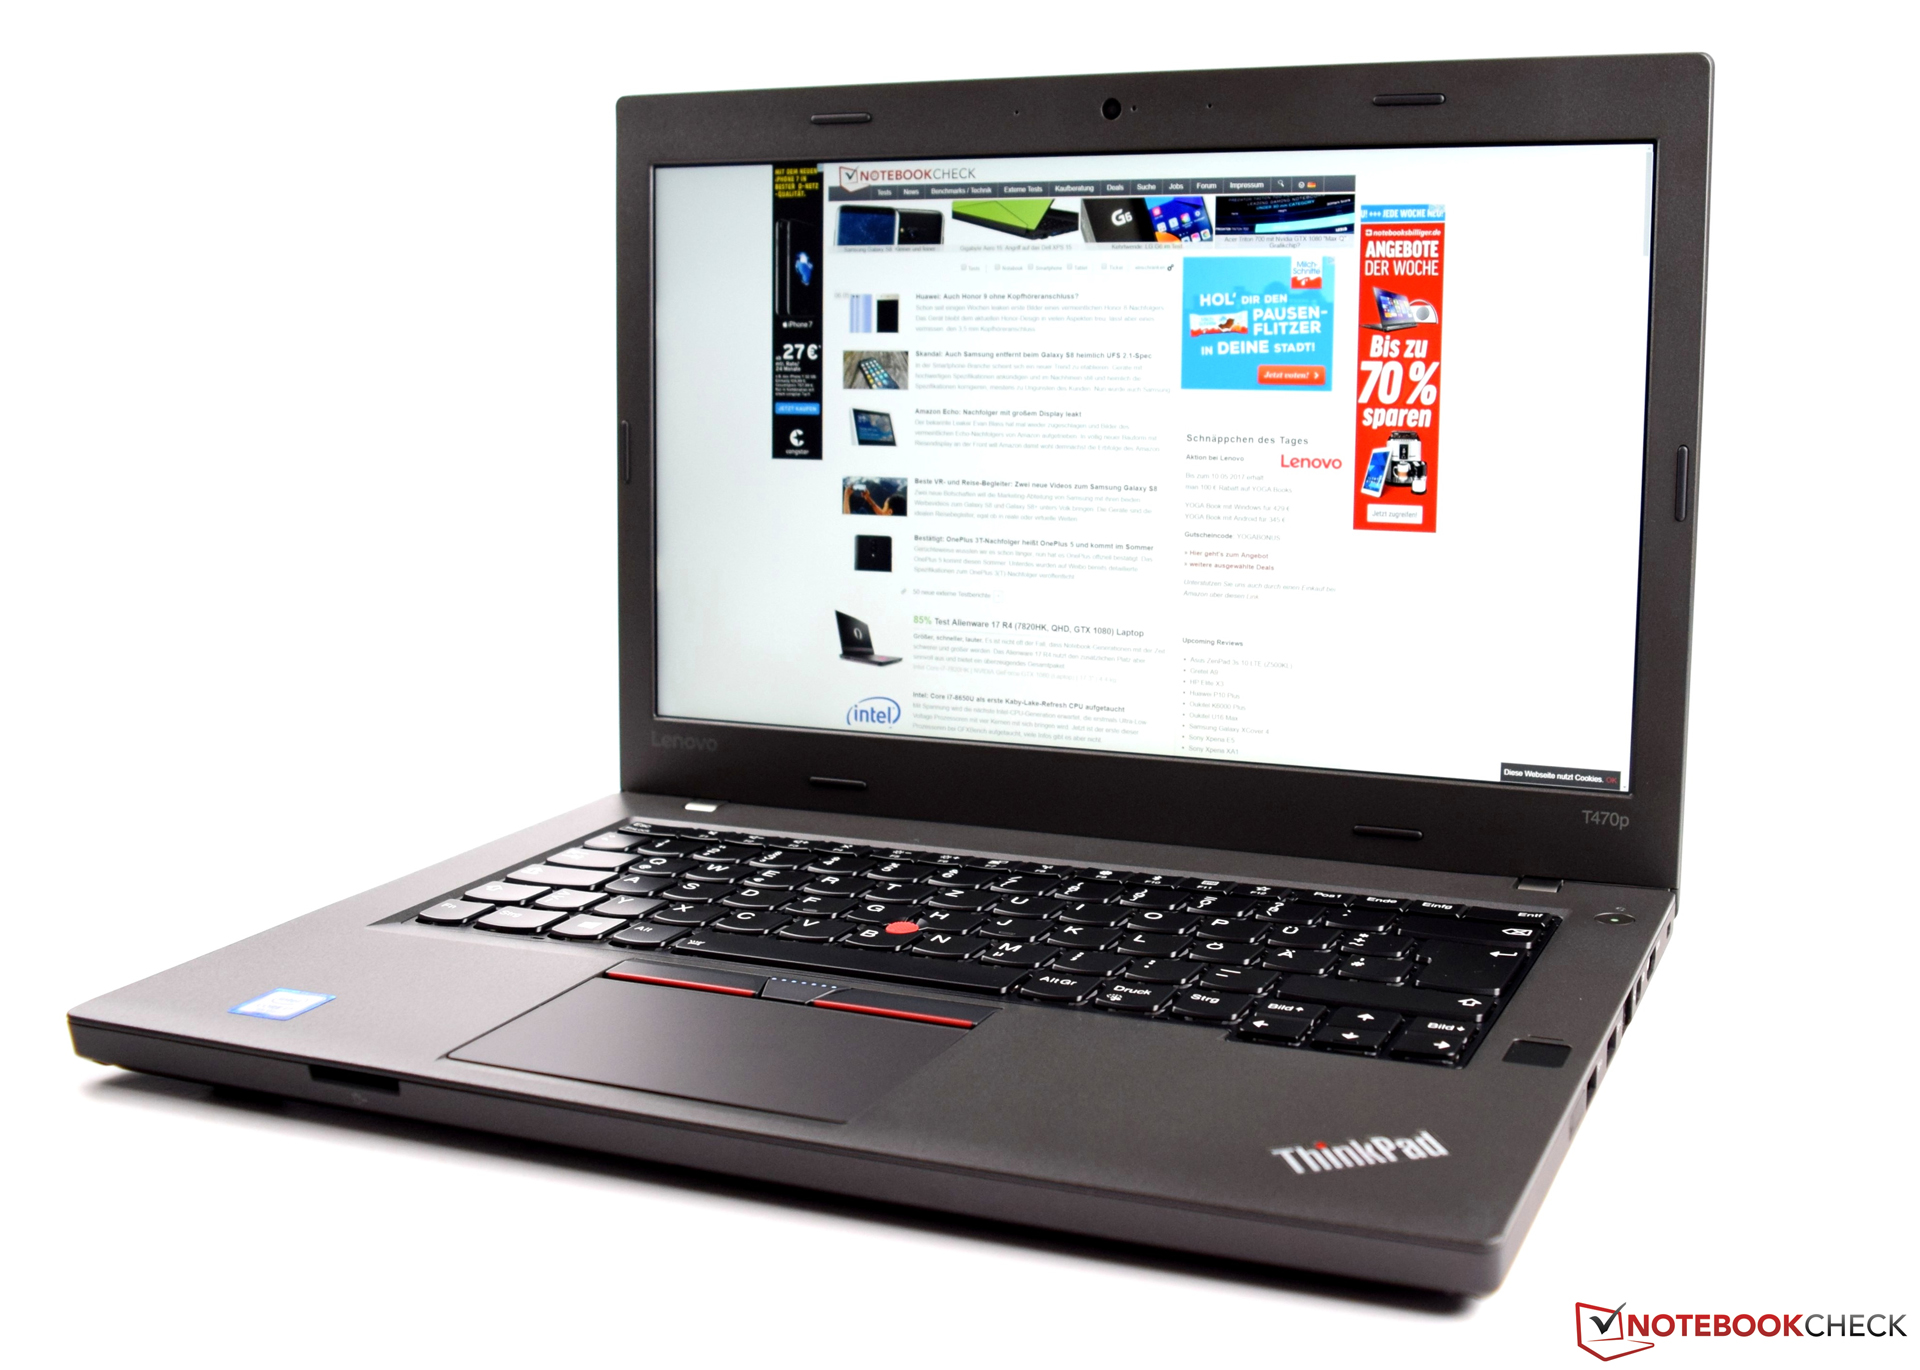
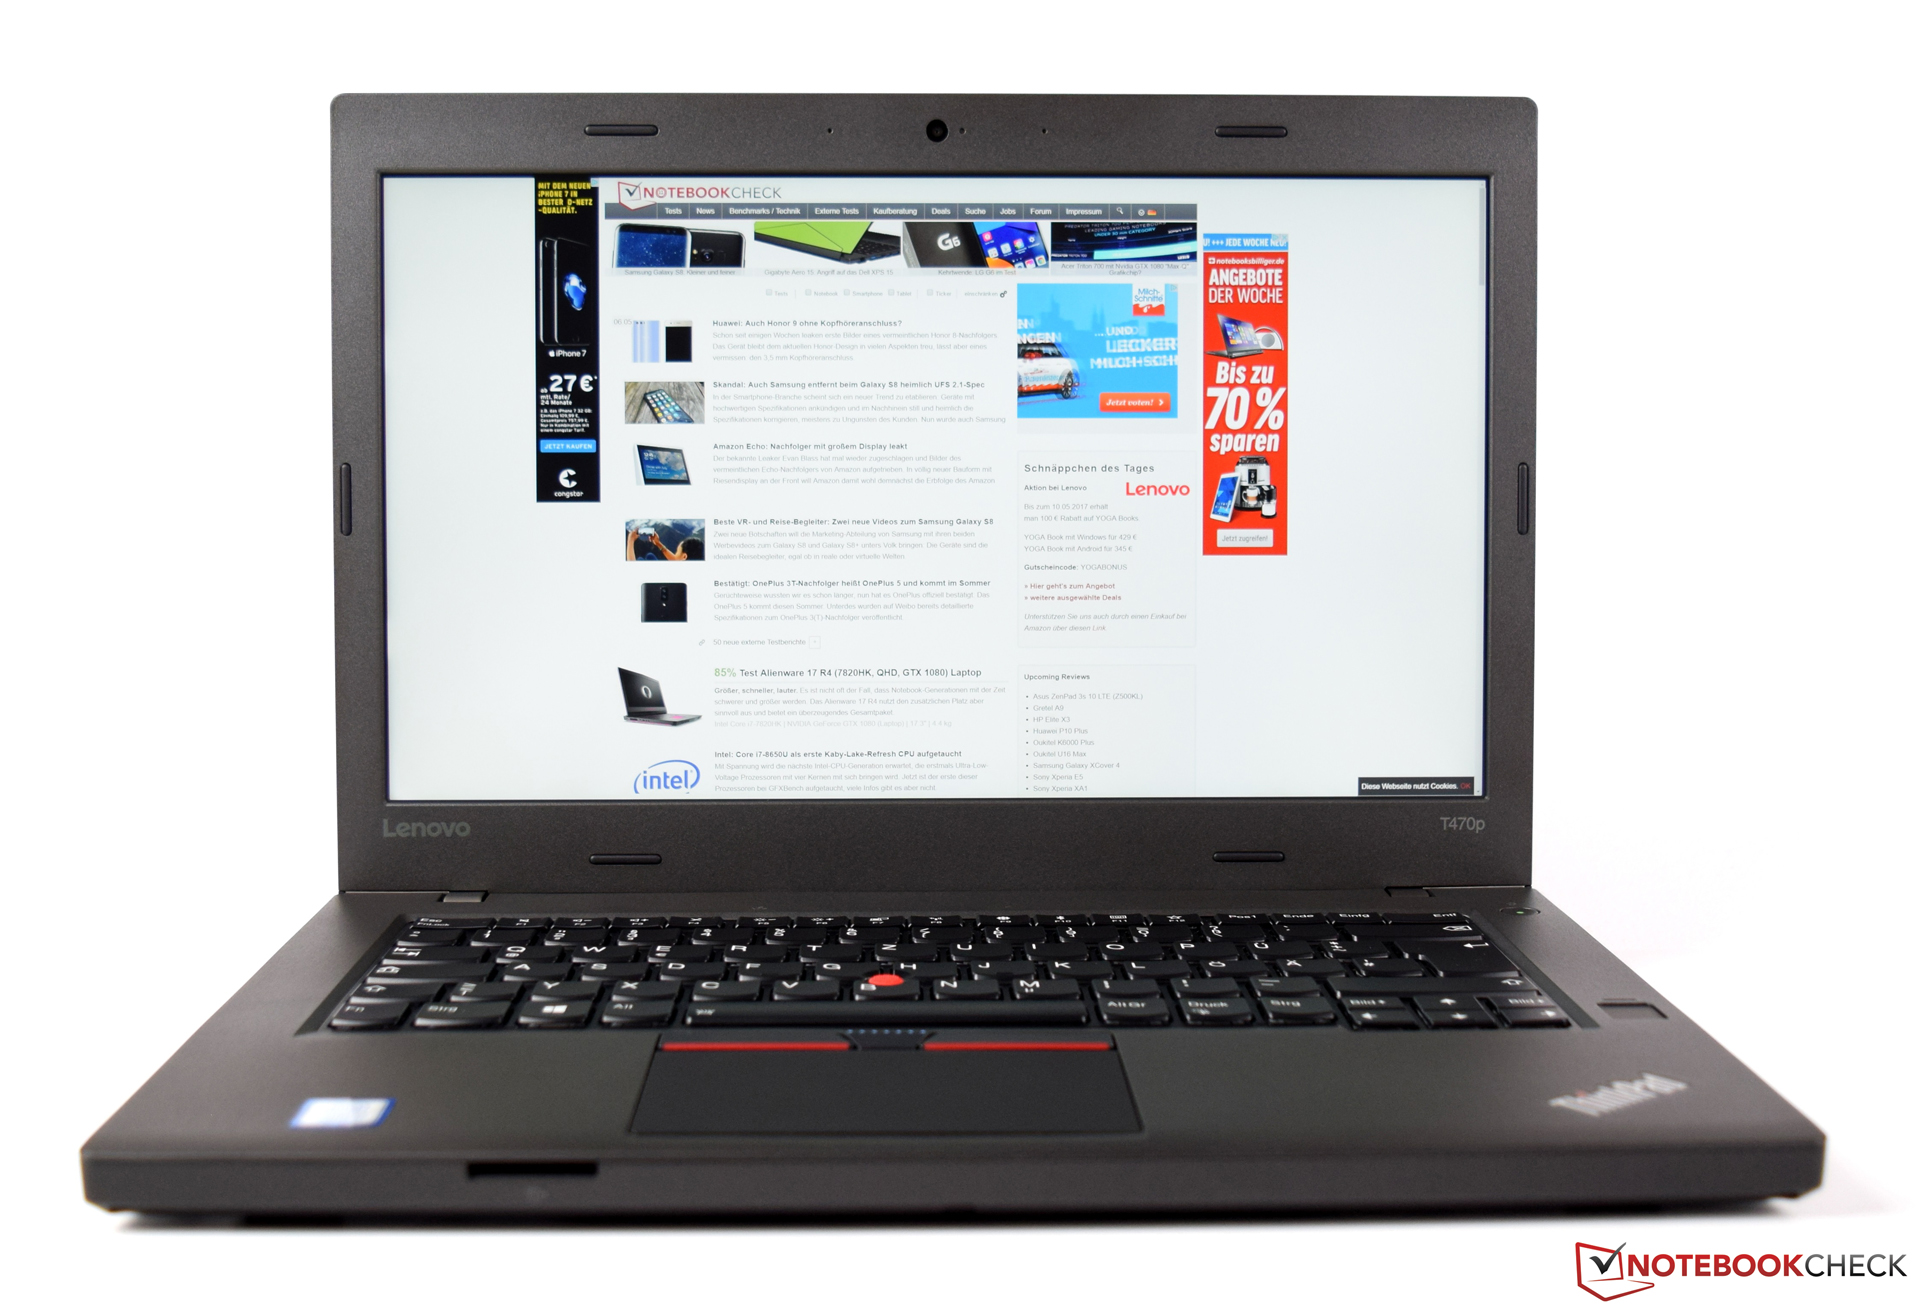
Recensione breve del Portatile Lenovo ThinkPad T470p (Core i7, GeForce 940MX)
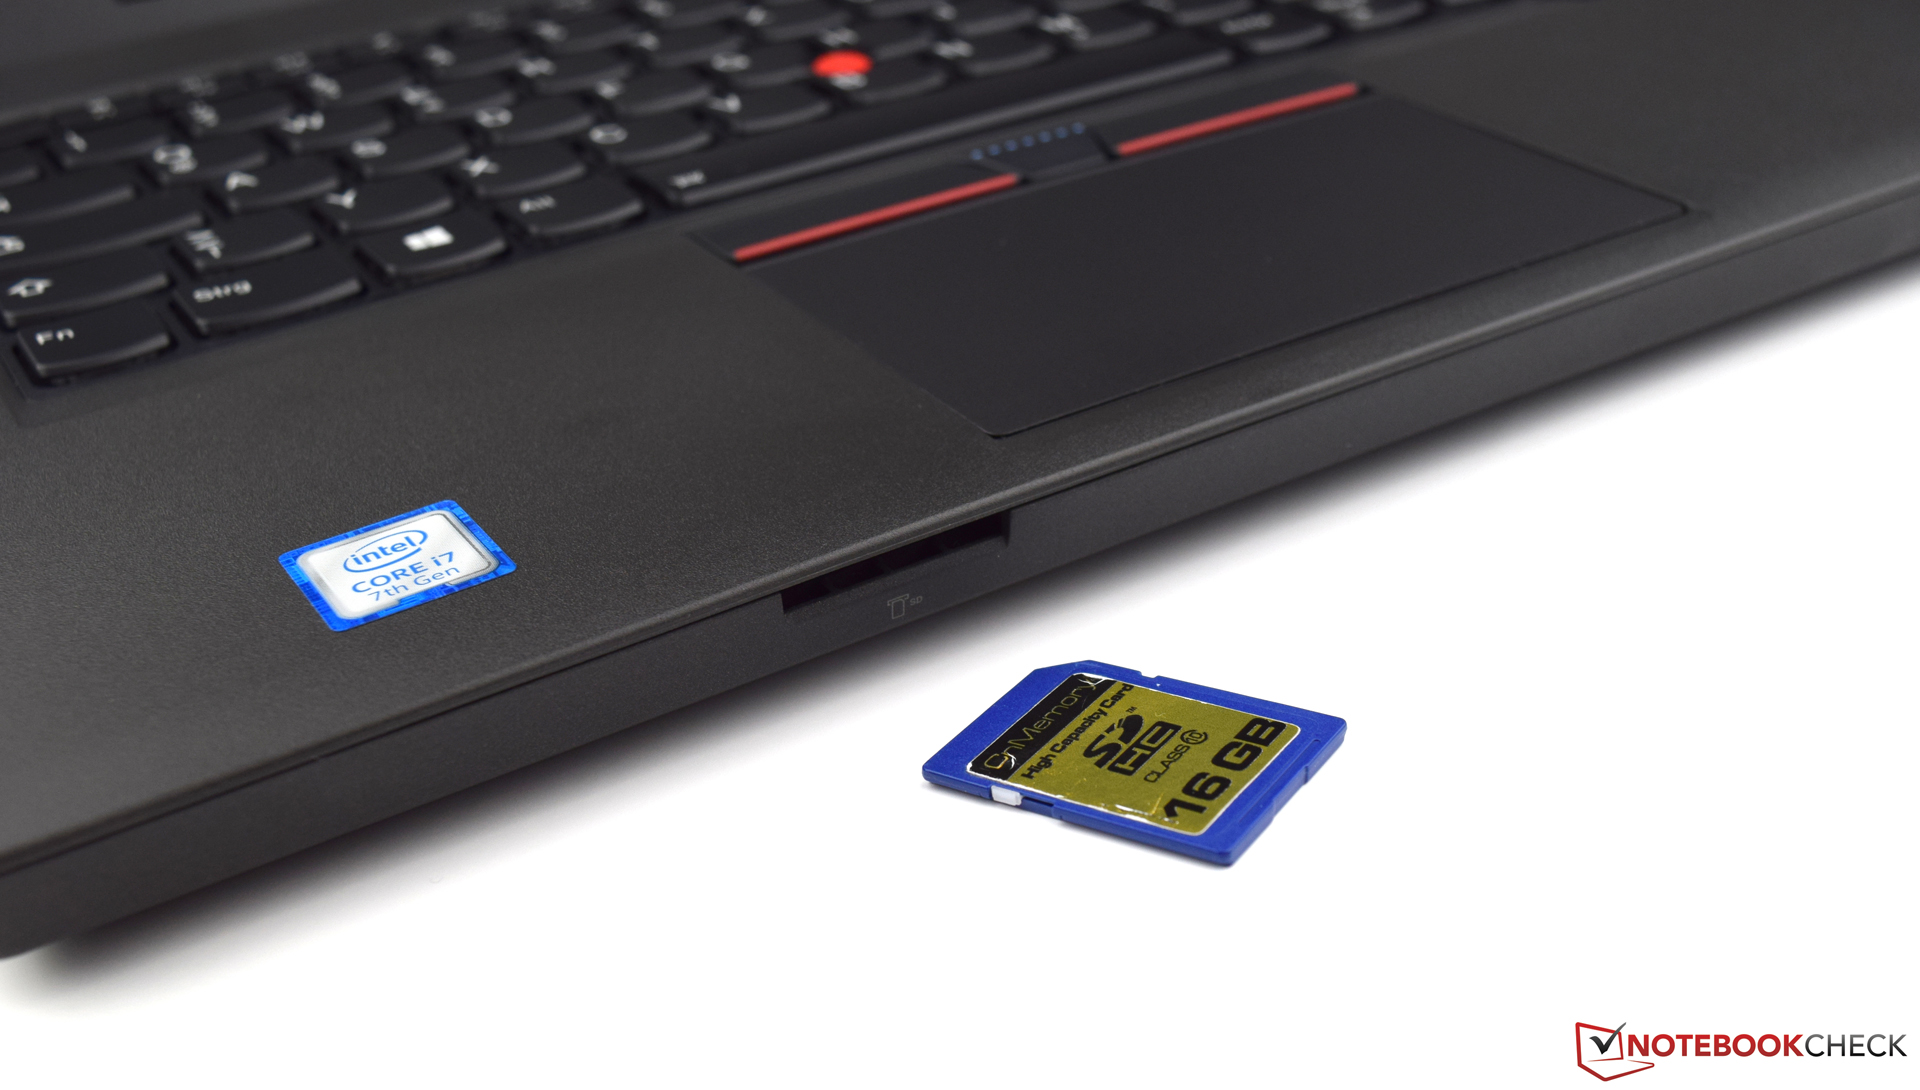
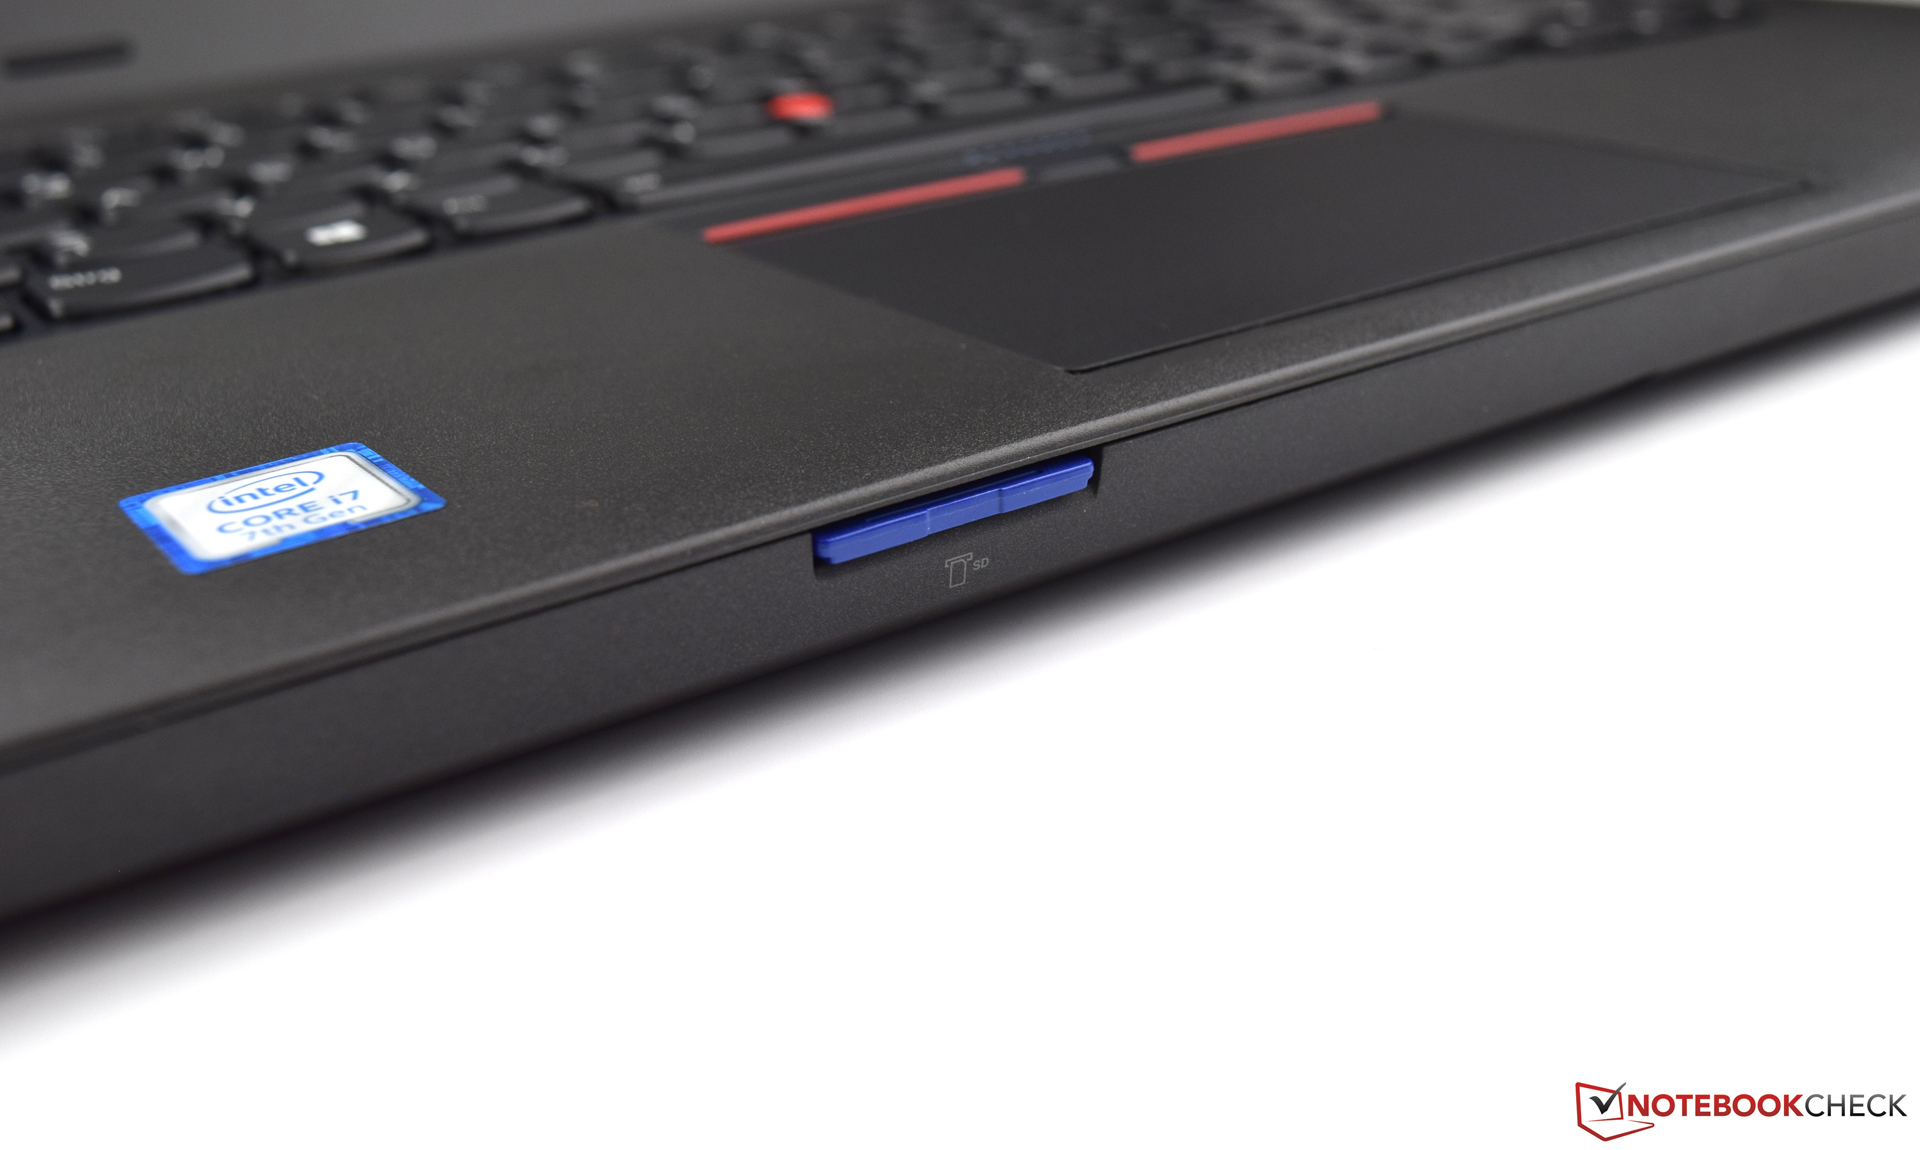
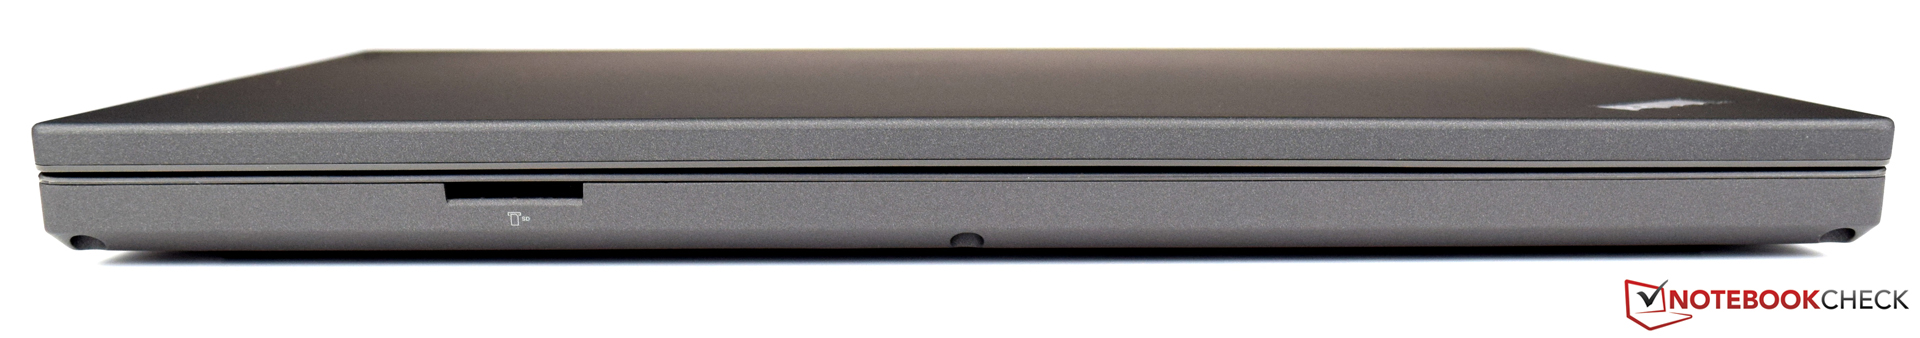
| SD Card Reader | |
| average JPG Copy Test (av. of 3 runs) | |
| Dell Latitude 14 E5470 | |
| Dell Latitude 5480 | |
| Lenovo ThinkPad T470-20HD002HGE | |
| HP EliteBook 840 G4-Z2V49ET ABD | |
| Lenovo ThinkPad T470p-20J7S00000 | |
| Lenovo ThinkPad T460p-20FXS05500 | |
| maximum AS SSD Seq Read Test (1GB) | |
| Dell Latitude 5480 | |
| Dell Latitude 14 E5470 | |
| Lenovo ThinkPad T470-20HD002HGE | |
| Lenovo ThinkPad T470p-20J7S00000 | |
| HP EliteBook 840 G4-Z2V49ET ABD | |
| Lenovo ThinkPad T460p-20FXS05500 | |
| Networking | |
| iperf3 transmit AX12 | |
| Lenovo ThinkPad T470-20HD002HGE | |
| HP EliteBook 840 G4-Z2V49ET ABD (jseb) | |
| Lenovo ThinkPad T470p-20J7S00000 | |
| Dell Latitude 5480 | |
| Dell Latitude 14 E5470 (jseb) | |
| iperf3 receive AX12 | |
| Lenovo ThinkPad T470-20HD002HGE | |
| Dell Latitude 5480 | |
| Dell Latitude 14 E5470 (jseb) | |
| HP EliteBook 840 G4-Z2V49ET ABD (jseb) | |
| Lenovo ThinkPad T470p-20J7S00000 | |
| |||||||||||||||||||||||||
Distribuzione della luminosità: 87 %
Al centro con la batteria: 267 cd/m²
Contrasto: 1084:1 (Nero: 0.25 cd/m²)
ΔE ColorChecker Calman: 6.68 | ∀{0.5-29.43 Ø4.73}
ΔE Greyscale Calman: 9.21 | ∀{0.09-98 Ø4.97}
94.72% sRGB (Argyll 1.6.3 3D)
61.49% AdobeRGB 1998 (Argyll 1.6.3 3D)
69.5% AdobeRGB 1998 (Argyll 3D)
94.9% sRGB (Argyll 3D)
69.3% Display P3 (Argyll 3D)
Gamma: 2.42
CCT: 6018 K
| Lenovo ThinkPad T470p-20J7S00000 IPS, 2560x1440, 14" | Lenovo ThinkPad T460p-20FXS05500 IPS-Panel, 2560x1440, 14" | Dell Latitude 14 E5470 AH-IPS, WLED, 1920x1080, 14" | Dell Latitude 5480 IPS, 1920x1080, 14" | HP EliteBook 840 G4-Z2V49ET ABD TN, 1920x1080, 14" | Lenovo ThinkPad T470-20HD002HGE IPS, 1920x1080, 14" | |
|---|---|---|---|---|---|---|
| Display | -1% | -9% | -39% | -17% | -38% | |
| Display P3 Coverage (%) | 69.3 | 66.9 -3% | 64.8 -6% | 40.62 -41% | 55.8 -19% | 41.6 -40% |
| sRGB Coverage (%) | 94.9 | 96.5 2% | 84.8 -11% | 61.2 -36% | 80.7 -15% | 61.9 -35% |
| AdobeRGB 1998 Coverage (%) | 69.5 | 68.8 -1% | 62 -11% | 41.96 -40% | 57.7 -17% | 43.06 -38% |
| Response Times | 17% | 15% | 20% | 20% | -3% | |
| Response Time Grey 50% / Grey 80% * (ms) | 52.8 ? | 38.4 ? 27% | 39 ? 26% | 32.8 ? 38% | 39 ? 26% | 41.6 ? 21% |
| Response Time Black / White * (ms) | 26.8 ? | 24.8 ? 7% | 26 ? 3% | 26.4 ? 1% | 23 ? 14% | 34 ? -27% |
| PWM Frequency (Hz) | 220 | |||||
| Screen | 11% | -2% | -4% | -35% | -4% | |
| Brightness middle (cd/m²) | 271 | 290 7% | 323 19% | 215.9 -20% | 346 28% | 306 13% |
| Brightness (cd/m²) | 266 | 280 5% | 316 19% | 205 -23% | 317 19% | 287 8% |
| Brightness Distribution (%) | 87 | 93 7% | 79 -9% | 90 3% | 86 -1% | 88 1% |
| Black Level * (cd/m²) | 0.25 | 0.31 -24% | 0.57 -128% | 0.22 12% | 0.86 -244% | 0.3 -20% |
| Contrast (:1) | 1084 | 935 -14% | 567 -48% | 981 -10% | 402 -63% | 1020 -6% |
| Colorchecker dE 2000 * | 6.68 | 3.88 42% | 3.68 45% | 5.1 24% | 8.64 -29% | 6.2 7% |
| Colorchecker dE 2000 max. * | 12.96 | 8.19 37% | 8.33 36% | 15.6 -20% | 13.58 -5% | 13.6 -5% |
| Greyscale dE 2000 * | 9.21 | 5.47 41% | 2.99 68% | 4 57% | 11.24 -22% | 5.8 37% |
| Gamma | 2.42 91% | 2.33 94% | 2.49 88% | 2.41 91% | 2.62 84% | 2.04 108% |
| CCT | 6018 108% | 6469 100% | 6572 99% | 6856 95% | 12530 52% | 6277 104% |
| Color Space (Percent of AdobeRGB 1998) (%) | 61.49 | 63.3 3% | 55 -11% | 41.96 -32% | 52 -15% | 39.62 -36% |
| Color Space (Percent of sRGB) (%) | 94.72 | 96.64 2% | 85 -10% | 61.15 -35% | 80 -16% | 61.44 -35% |
| Media totale (Programma / Settaggio) | 9% /
9% | 1% /
-1% | -8% /
-8% | -11% /
-24% | -15% /
-10% |
* ... Meglio usare valori piccoli
Tempi di risposta del Display
| ↔ Tempi di risposta dal Nero al Bianco | ||
|---|---|---|
| 26.8 ms ... aumenta ↗ e diminuisce ↘ combinato | ↗ 6.4 ms Incremento | 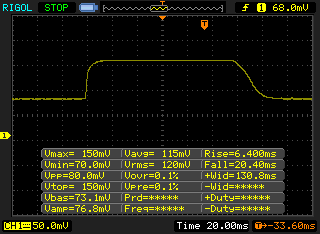 |
| ↘ 20.4 ms Calo | ||
| Lo schermo mostra tempi di risposta relativamente lenti nei nostri tests e potrebbe essere troppo lento per i gamers. In confronto, tutti i dispositivi di test variano da 0.1 (minimo) a 240 (massimo) ms. » 67 % di tutti i dispositivi è migliore. Questo significa che i tempi di risposta rilevati sono peggiori rispetto alla media di tutti i dispositivi testati (19.9 ms). | ||
| ↔ Tempo di risposta dal 50% Grigio all'80% Grigio | ||
| 52.8 ms ... aumenta ↗ e diminuisce ↘ combinato | ↗ 19.6 ms Incremento | 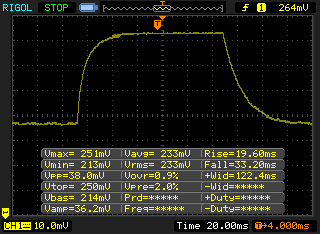 |
| ↘ 33.2 ms Calo | ||
| Lo schermo mostra tempi di risposta lenti nei nostri tests e sarà insoddisfacente per i gamers. In confronto, tutti i dispositivi di test variano da 0.165 (minimo) a 636 (massimo) ms. » 89 % di tutti i dispositivi è migliore. Questo significa che i tempi di risposta rilevati sono peggiori rispetto alla media di tutti i dispositivi testati (31.1 ms). | ||
Sfarfallio dello schermo / PWM (Pulse-Width Modulation)
| flickering dello schermo / PWM non rilevato | ||
In confronto: 52 % di tutti i dispositivi testati non utilizza PWM per ridurre la luminosita' del display. Se è rilevato PWM, una media di 7798 (minimo: 5 - massimo: 343500) Hz è stata rilevata. | ||
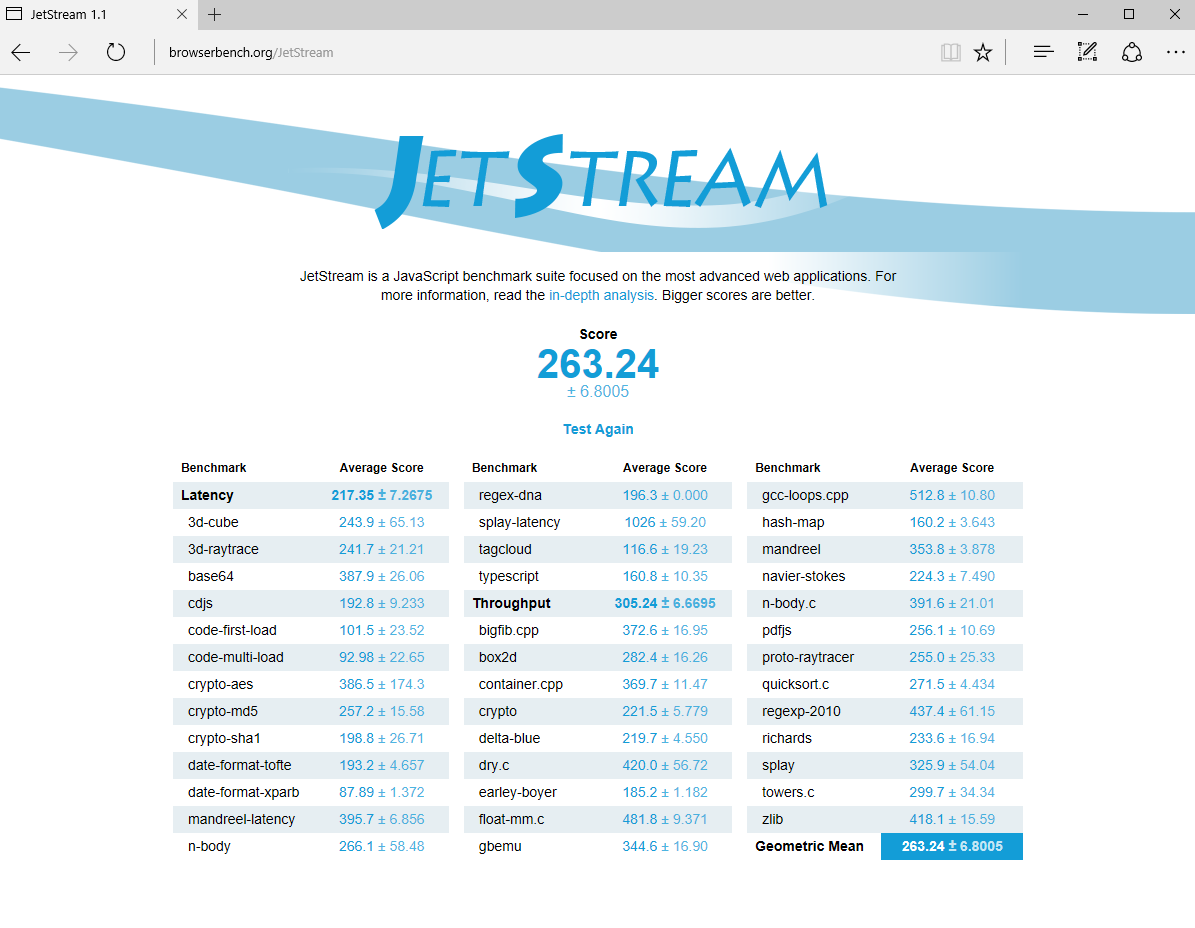
| JetStream 1.1 - 1.1 Total | |
| Lenovo ThinkPad T470p-20J7S00000 | |
| Lenovo ThinkPad T460p-20FXS05500 | |
| Dell Latitude 14 E5470 | |
| Lenovo ThinkPad T470-20HD002HGE | |
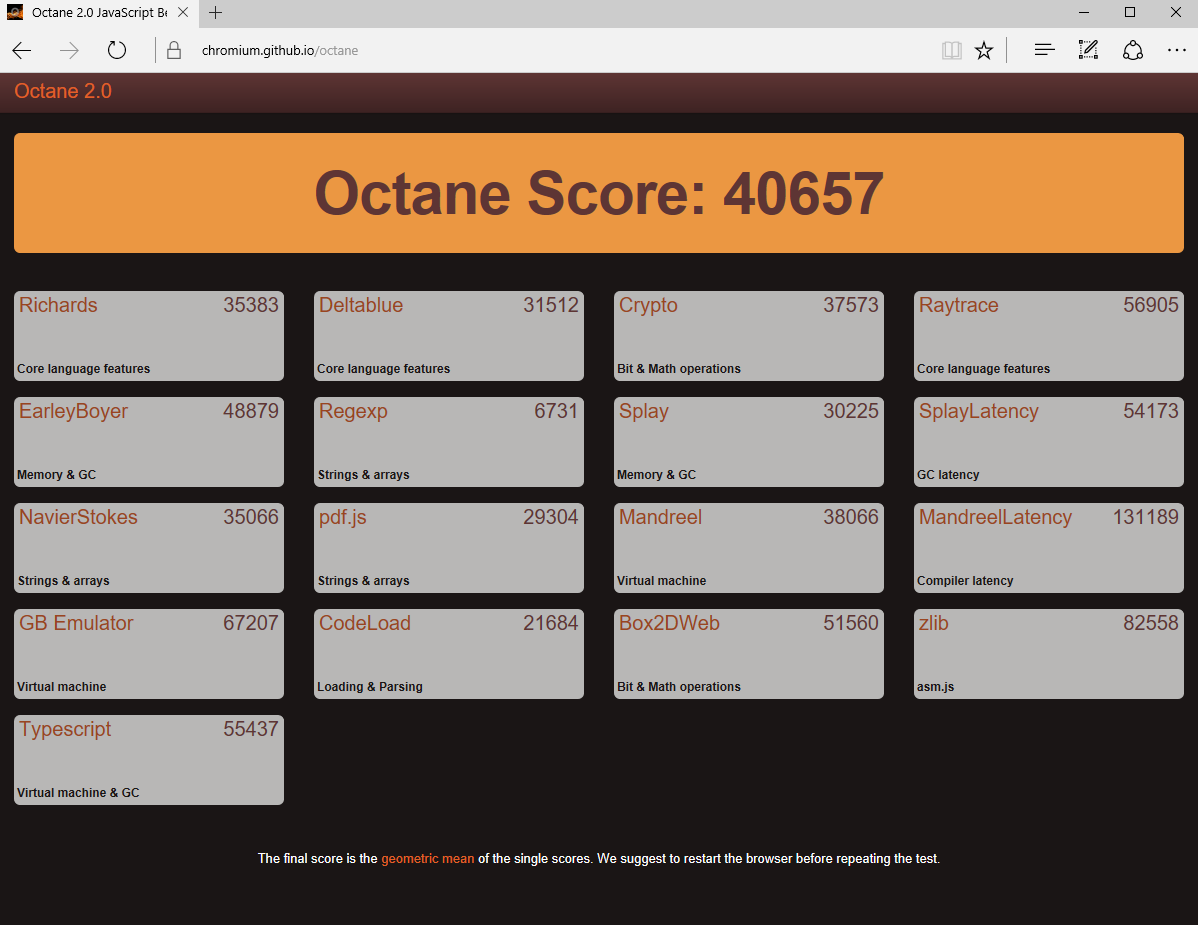
| Octane V2 - Total Score | |
| Lenovo ThinkPad T470p-20J7S00000 | |
| Lenovo ThinkPad T460p-20FXS05500 | |
| Dell Latitude 14 E5470 | |
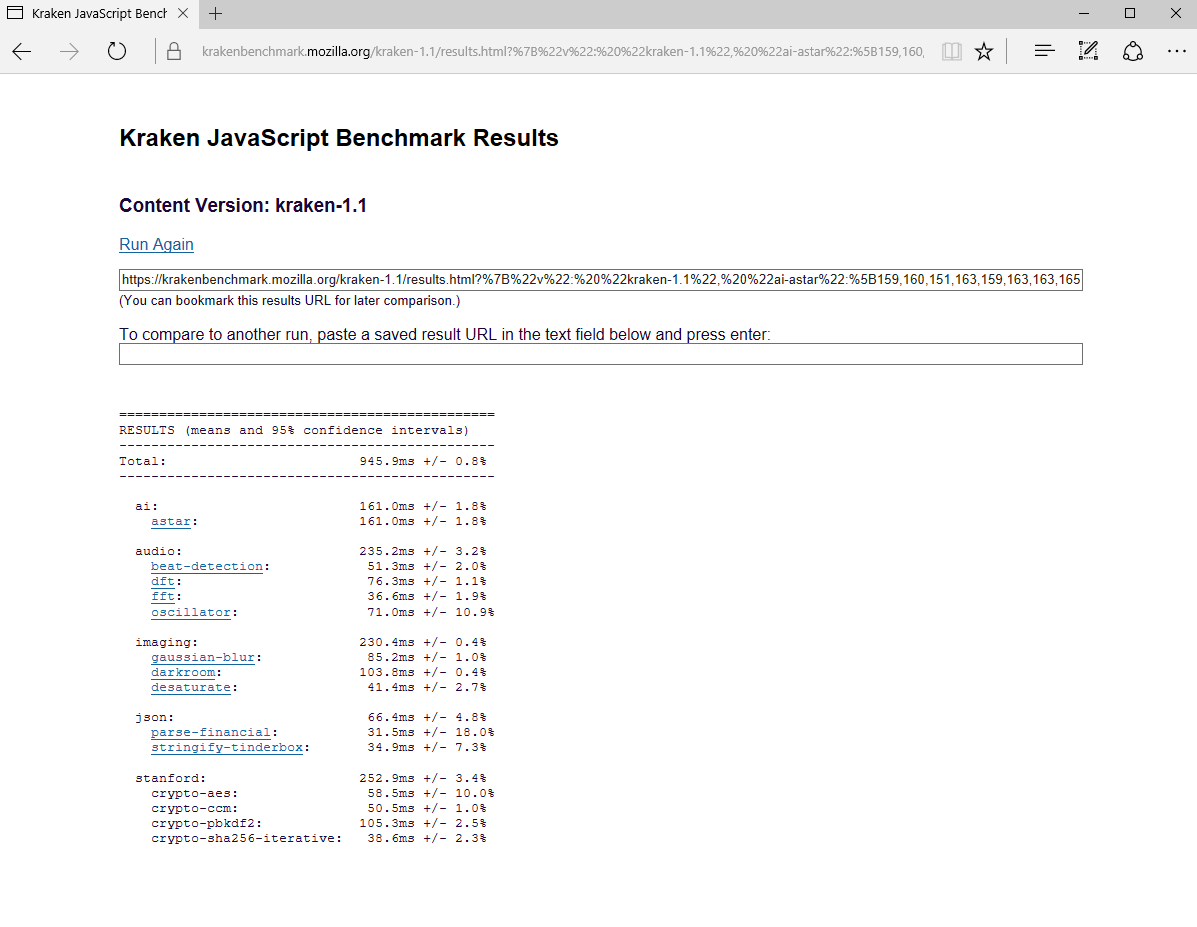
| Mozilla Kraken 1.1 - Total | |
| Lenovo ThinkPad T470-20HD002HGE | |
| Dell Latitude 14 E5470 | |
| Lenovo ThinkPad T460p-20FXS05500 | |
| Lenovo ThinkPad T470p-20J7S00000 | |
* ... Meglio usare valori piccoli
| PCMark 7 Score | 5766 punti | |
| PCMark 8 Home Score Accelerated v2 | 3650 punti | |
| PCMark 8 Creative Score Accelerated v2 | 4883 punti | |
| PCMark 8 Work Score Accelerated v2 | 4654 punti | |
Aiuto | ||
| Lenovo ThinkPad T470p-20J7S00000 Samsung PM961 NVMe MZVLW512HMJP | Lenovo ThinkPad T460p-20FXS05500 Samsung SSD PM871 MZ7LN512HCHP | Dell Latitude 14 E5470 Micron SSD 1100 (MTFDDAV256TBN) | Dell Latitude 5480 Toshiba SG5 256GB THNSNK256GVN8 | HP EliteBook 840 G4-Z2V49ET ABD Samsung PM961 MZVLW256HEHP | Lenovo ThinkPad T470-20HD002HGE Samsung PM961 NVMe MZVLW512HMJP | |
|---|---|---|---|---|---|---|
| CrystalDiskMark 3.0 | -49% | -60% | -55% | 8% | -6% | |
| Read Seq (MB/s) | 1088 | 502 -54% | 465.4 -57% | 469.4 -57% | 1819 67% | 1155 6% |
| Write Seq (MB/s) | 1023 | 442 -57% | 363.1 -65% | 264.8 -74% | 1263 23% | 1076 5% |
| Read 512 (MB/s) | 731 | 411.4 -44% | 338.4 -54% | 408.1 -44% | 922 26% | 811 11% |
| Write 512 (MB/s) | 798 | 414.3 -48% | 246.1 -69% | 265.5 -67% | 804 1% | 862 8% |
| Read 4k (MB/s) | 60.9 | 29.18 -52% | 25.83 -58% | 24.66 -60% | 61.4 1% | 55.5 -9% |
| Write 4k (MB/s) | 166.8 | 86.5 -48% | 80.3 -52% | 114.8 -31% | 157.1 -6% | 134.6 -19% |
| Read 4k QD32 (MB/s) | 652 | 358.1 -45% | 246.1 -62% | 380.3 -42% | 513 -21% | 496.2 -24% |
| Write 4k QD32 (MB/s) | 563 | 319.8 -43% | 197.7 -65% | 207.2 -63% | 410.2 -27% | 425.4 -24% |

| 3DMark 11 Performance | 3428 punti | |
| 3DMark Ice Storm Standard Score | 36216 punti | |
| 3DMark Cloud Gate Standard Score | 11802 punti | |
| 3DMark Fire Strike Score | 2253 punti | |
| 3DMark Fire Strike Extreme Score | 1089 punti | |
| 3DMark Time Spy Score | 737 punti | |
Aiuto | ||
| basso | medio | alto | ultra | |
|---|---|---|---|---|
| BioShock Infinite (2013) | 129.4 | 79.3 | 68.3 | 25.5 |
| Battlefield 4 (2013) | 98.8 | 69.1 | 48.8 | 19.8 |
| The Witcher 3 (2015) | 49.2 | 28.4 | 14.6 | |
| Rise of the Tomb Raider (2016) | 51.8 | 30.6 | 17 |
Rumorosità
| Idle |
| 29 / 29 / 29 dB(A) |
| Sotto carico |
| 35.6 / 39.7 dB(A) |
 | ||
30 dB silenzioso 40 dB(A) udibile 50 dB(A) rumoroso |
||
min: | ||
| Lenovo ThinkPad T470p-20J7S00000 i7-7700HQ, GeForce 940MX | Lenovo ThinkPad T460p-20FXS05500 6700HQ, GeForce 940MX | Dell Latitude 14 E5470 6440HQ, HD Graphics 530 | Dell Latitude 5480 i7-7600U, HD Graphics 620 | HP EliteBook 840 G4-Z2V49ET ABD i5-7200U, HD Graphics 620 | Lenovo ThinkPad T470-20HD002HGE i5-7200U, HD Graphics 620 | |
|---|---|---|---|---|---|---|
| Noise | 1% | 1% | -9% | -1% | 6% | |
| off /ambiente * (dB) | 29 | 29.2 -1% | 30.3 -4% | 31 -7% | 28 3% | |
| Idle Minimum * (dB) | 29 | 29.2 -1% | 30.3 -4% | 29.6 -2% | 31 -7% | 28 3% |
| Idle Average * (dB) | 29 | 29.2 -1% | 30.3 -4% | 29.6 -2% | 31 -7% | 28 3% |
| Idle Maximum * (dB) | 29 | 29.2 -1% | 30.3 -4% | 29.6 -2% | 31 -7% | 29.4 -1% |
| Load Average * (dB) | 35.6 | 33.5 6% | 31.6 11% | 42 -18% | 33.5 6% | 31.4 12% |
| Load Maximum * (dB) | 39.7 | 38.8 2% | 35 12% | 47.1 -19% | 33.7 15% | 34.6 13% |
* ... Meglio usare valori piccoli
(-) La temperatura massima sul lato superiore è di 50.2 °C / 122 F, rispetto alla media di 34.3 °C / 94 F, che varia da 21.2 a 62.5 °C per questa classe Office.
(-) Il lato inferiore si riscalda fino ad un massimo di 51.3 °C / 124 F, rispetto alla media di 36.8 °C / 98 F
(+) In idle, la temperatura media del lato superiore è di 25.4 °C / 78 F, rispetto alla media deld ispositivo di 29.5 °C / 85 F.
(±) I poggiapolsi e il touchpad possono diventare molto caldi al tatto con un massimo di 38.5 °C / 101.3 F.
(-) La temperatura media della zona del palmo della mano di dispositivi simili e'stata di 27.5 °C / 81.5 F (-11 °C / -19.8 F).
| Lenovo ThinkPad T470p-20J7S00000 i7-7700HQ, GeForce 940MX | Lenovo ThinkPad T460p-20FXS05500 6700HQ, GeForce 940MX | Dell Latitude 14 E5470 6440HQ, HD Graphics 530 | Dell Latitude 5480 i7-7600U, HD Graphics 620 | HP EliteBook 840 G4-Z2V49ET ABD i5-7200U, HD Graphics 620 | Lenovo ThinkPad T470-20HD002HGE i5-7200U, HD Graphics 620 | |
|---|---|---|---|---|---|---|
| Heat | -11% | -1% | 11% | 15% | 14% | |
| Maximum Upper Side * (°C) | 50.2 | 51.6 -3% | 43 14% | 36.4 27% | 37 26% | 37.2 26% |
| Maximum Bottom * (°C) | 51.3 | 55.2 -8% | 43 16% | 45 12% | 39.4 23% | 45.1 12% |
| Idle Upper Side * (°C) | 26.3 | 30.7 -17% | 31.2 -19% | 26.4 -0% | 25.9 2% | 24.4 7% |
| Idle Bottom * (°C) | 27.5 | 31.5 -15% | 31.3 -14% | 26.8 3% | 25.6 7% | 25 9% |
* ... Meglio usare valori piccoli
Lenovo ThinkPad T470p-20J7S00000 analisi audio
(+) | gli altoparlanti sono relativamente potenti (83.1 dB)
Bassi 100 - 315 Hz
(-) | quasi nessun basso - in media 18.1% inferiori alla media
(±) | la linearità dei bassi è media (14.6% delta rispetto alla precedente frequenza)
Medi 400 - 2000 Hz
(+) | medi bilanciati - solo only 4.2% rispetto alla media
(+) | medi lineari (5.9% delta rispetto alla precedente frequenza)
Alti 2 - 16 kHz
(+) | Alti bilanciati - appena 3.3% dalla media
(+) | alti lineari (6.5% delta rispetto alla precedente frequenza)
Nel complesso 100 - 16.000 Hz
(±) | la linearità complessiva del suono è media (19.6% di differenza rispetto alla media
Rispetto alla stessa classe
» 40% di tutti i dispositivi testati in questa classe è stato migliore, 8% simile, 52% peggiore
» Il migliore ha avuto un delta di 7%, medio di 21%, peggiore di 53%
Rispetto a tutti i dispositivi testati
» 49% di tutti i dispositivi testati in questa classe è stato migliore, 7% similare, 44% peggiore
» Il migliore ha avuto un delta di 4%, medio di 24%, peggiore di 134%
Apple MacBook 12 (Early 2016) 1.1 GHz analisi audio
(+) | gli altoparlanti sono relativamente potenti (83.6 dB)
Bassi 100 - 315 Hz
(±) | bassi ridotti - in media 11.3% inferiori alla media
(±) | la linearità dei bassi è media (14.2% delta rispetto alla precedente frequenza)
Medi 400 - 2000 Hz
(+) | medi bilanciati - solo only 2.4% rispetto alla media
(+) | medi lineari (5.5% delta rispetto alla precedente frequenza)
Alti 2 - 16 kHz
(+) | Alti bilanciati - appena 2% dalla media
(+) | alti lineari (4.5% delta rispetto alla precedente frequenza)
Nel complesso 100 - 16.000 Hz
(+) | suono nel complesso lineare (10.2% differenza dalla media)
Rispetto alla stessa classe
» 7% di tutti i dispositivi testati in questa classe è stato migliore, 2% simile, 91% peggiore
» Il migliore ha avuto un delta di 5%, medio di 18%, peggiore di 53%
Rispetto a tutti i dispositivi testati
» 5% di tutti i dispositivi testati in questa classe è stato migliore, 1% similare, 94% peggiore
» Il migliore ha avuto un delta di 4%, medio di 24%, peggiore di 134%
| Off / Standby | |
| Idle | |
| Sotto carico |
|
Leggenda:
min: | |
| Lenovo ThinkPad T470p-20J7S00000 i7-7700HQ, GeForce 940MX, Samsung PM961 NVMe MZVLW512HMJP, IPS, 2560x1440, 14" | Lenovo ThinkPad T460p-20FXS05500 6700HQ, GeForce 940MX, Samsung SSD PM871 MZ7LN512HCHP, IPS-Panel, 2560x1440, 14" | Dell Latitude 14 E5470 6440HQ, HD Graphics 530, Micron SSD 1100 (MTFDDAV256TBN), AH-IPS, WLED, 1920x1080, 14" | Dell Latitude 5480 i7-7600U, HD Graphics 620, Toshiba SG5 256GB THNSNK256GVN8, IPS, 1920x1080, 14" | HP EliteBook 840 G4-Z2V49ET ABD i5-7200U, HD Graphics 620, Samsung PM961 MZVLW256HEHP, TN, 1920x1080, 14" | Lenovo ThinkPad T470-20HD002HGE i5-7200U, HD Graphics 620, Samsung PM961 NVMe MZVLW512HMJP, IPS, 1920x1080, 14" | |
|---|---|---|---|---|---|---|
| Power Consumption | -22% | 1% | 7% | 29% | 29% | |
| Idle Minimum * (Watt) | 3.8 | 5 -32% | 4.1 -8% | 6.64 -75% | 2.9 24% | 3.21 16% |
| Idle Average * (Watt) | 6.5 | 9.9 -52% | 8.1 -25% | 6.67 -3% | 5.6 14% | 6.15 5% |
| Idle Maximum * (Watt) | 7.2 | 10.8 -50% | 11.4 -58% | 7.78 -8% | 8.15 -13% | 6.82 5% |
| Load Average * (Watt) | 62.5 | 52.4 16% | 33.5 46% | 30.83 51% | 30.6 51% | 28.5 54% |
| Load Maximum * (Watt) | 99.6 | 89.8 10% | 49 51% | 31.7 68% | 31 69% | 34.5 65% |
* ... Meglio usare valori piccoli
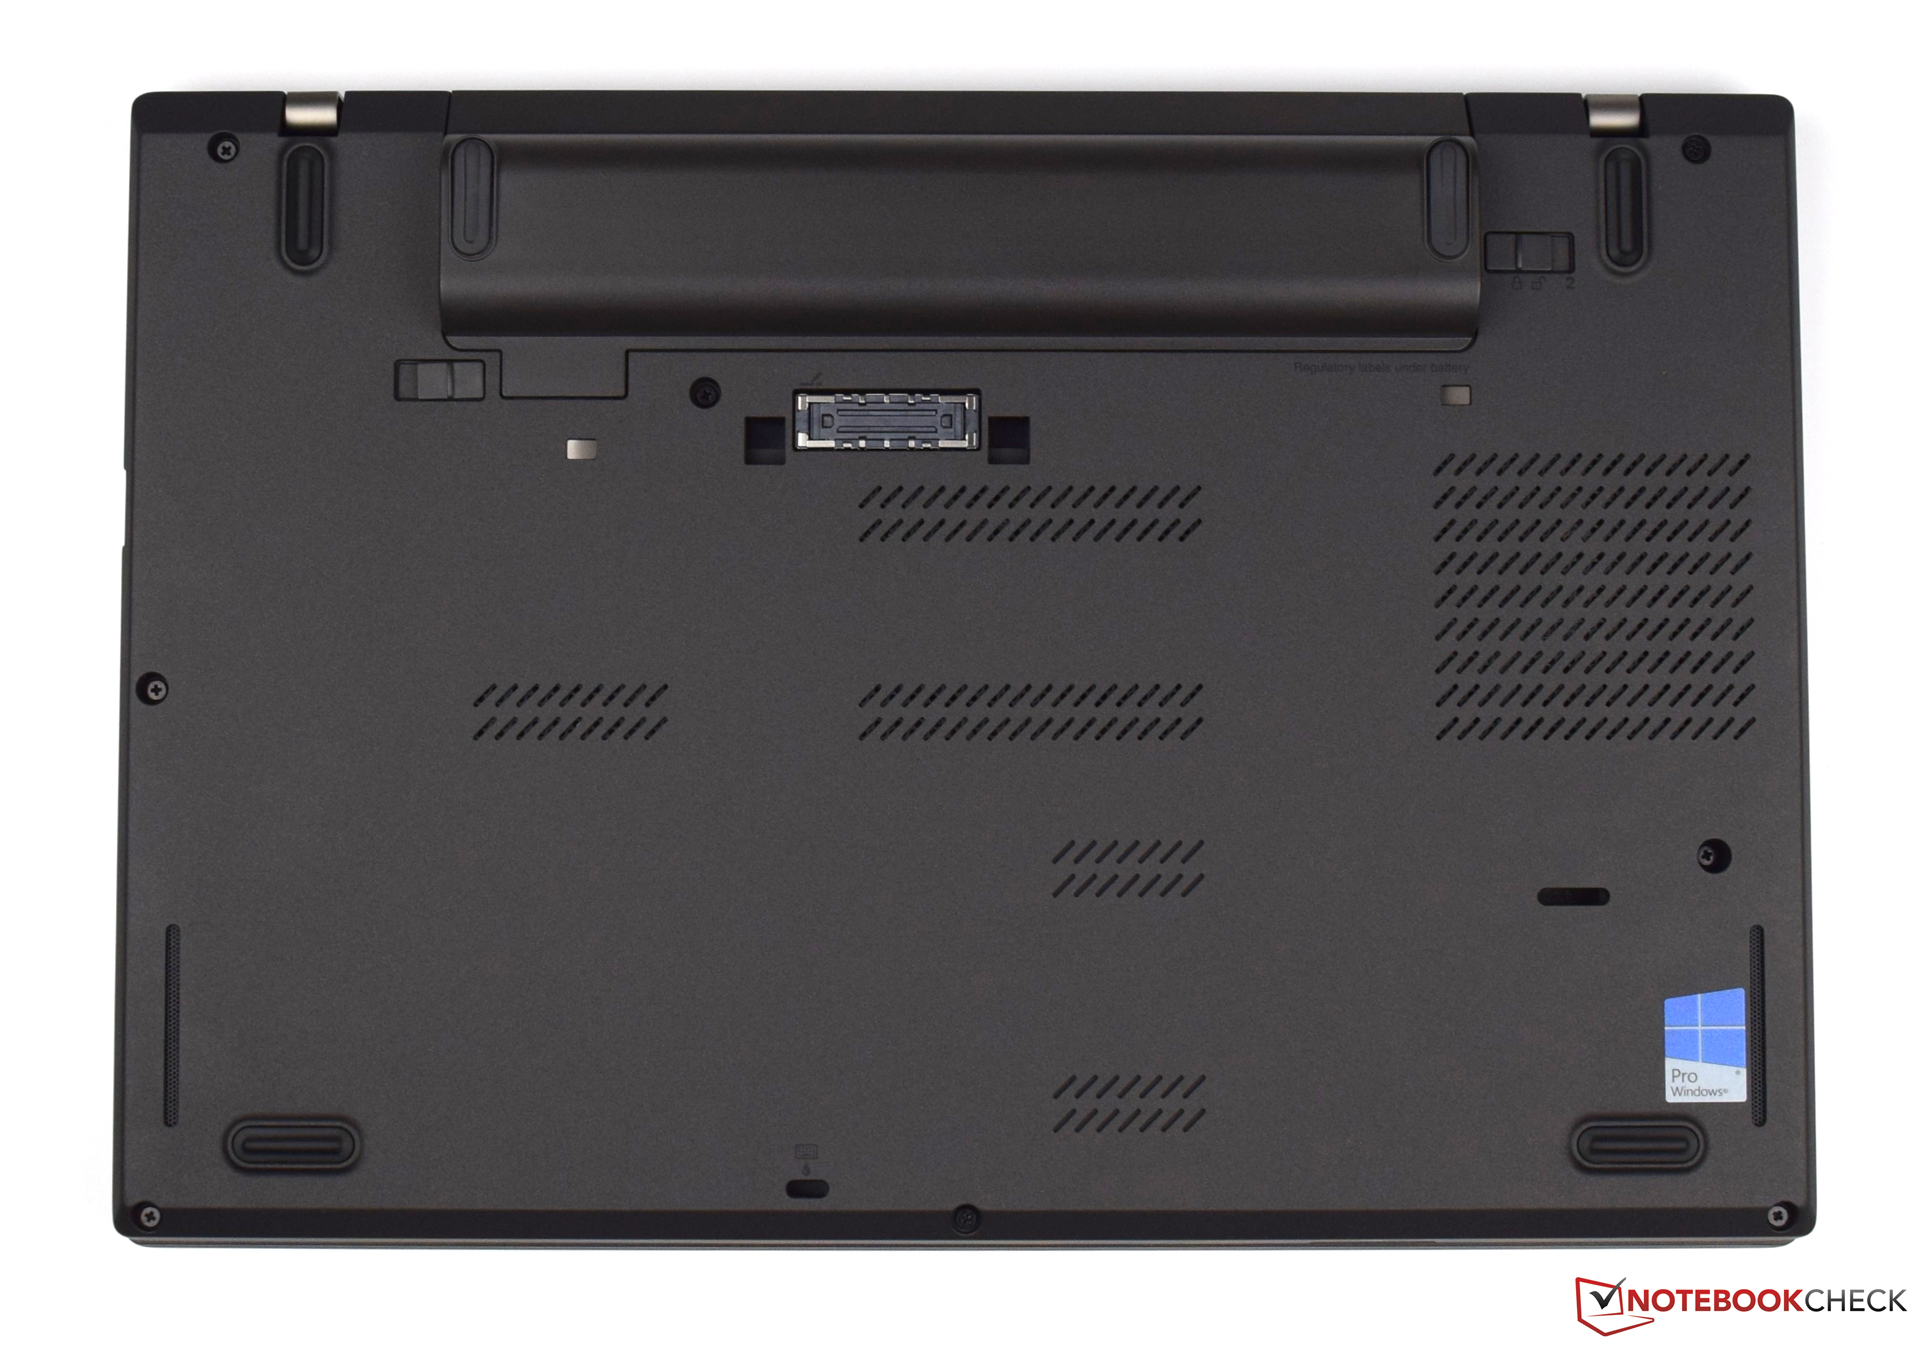
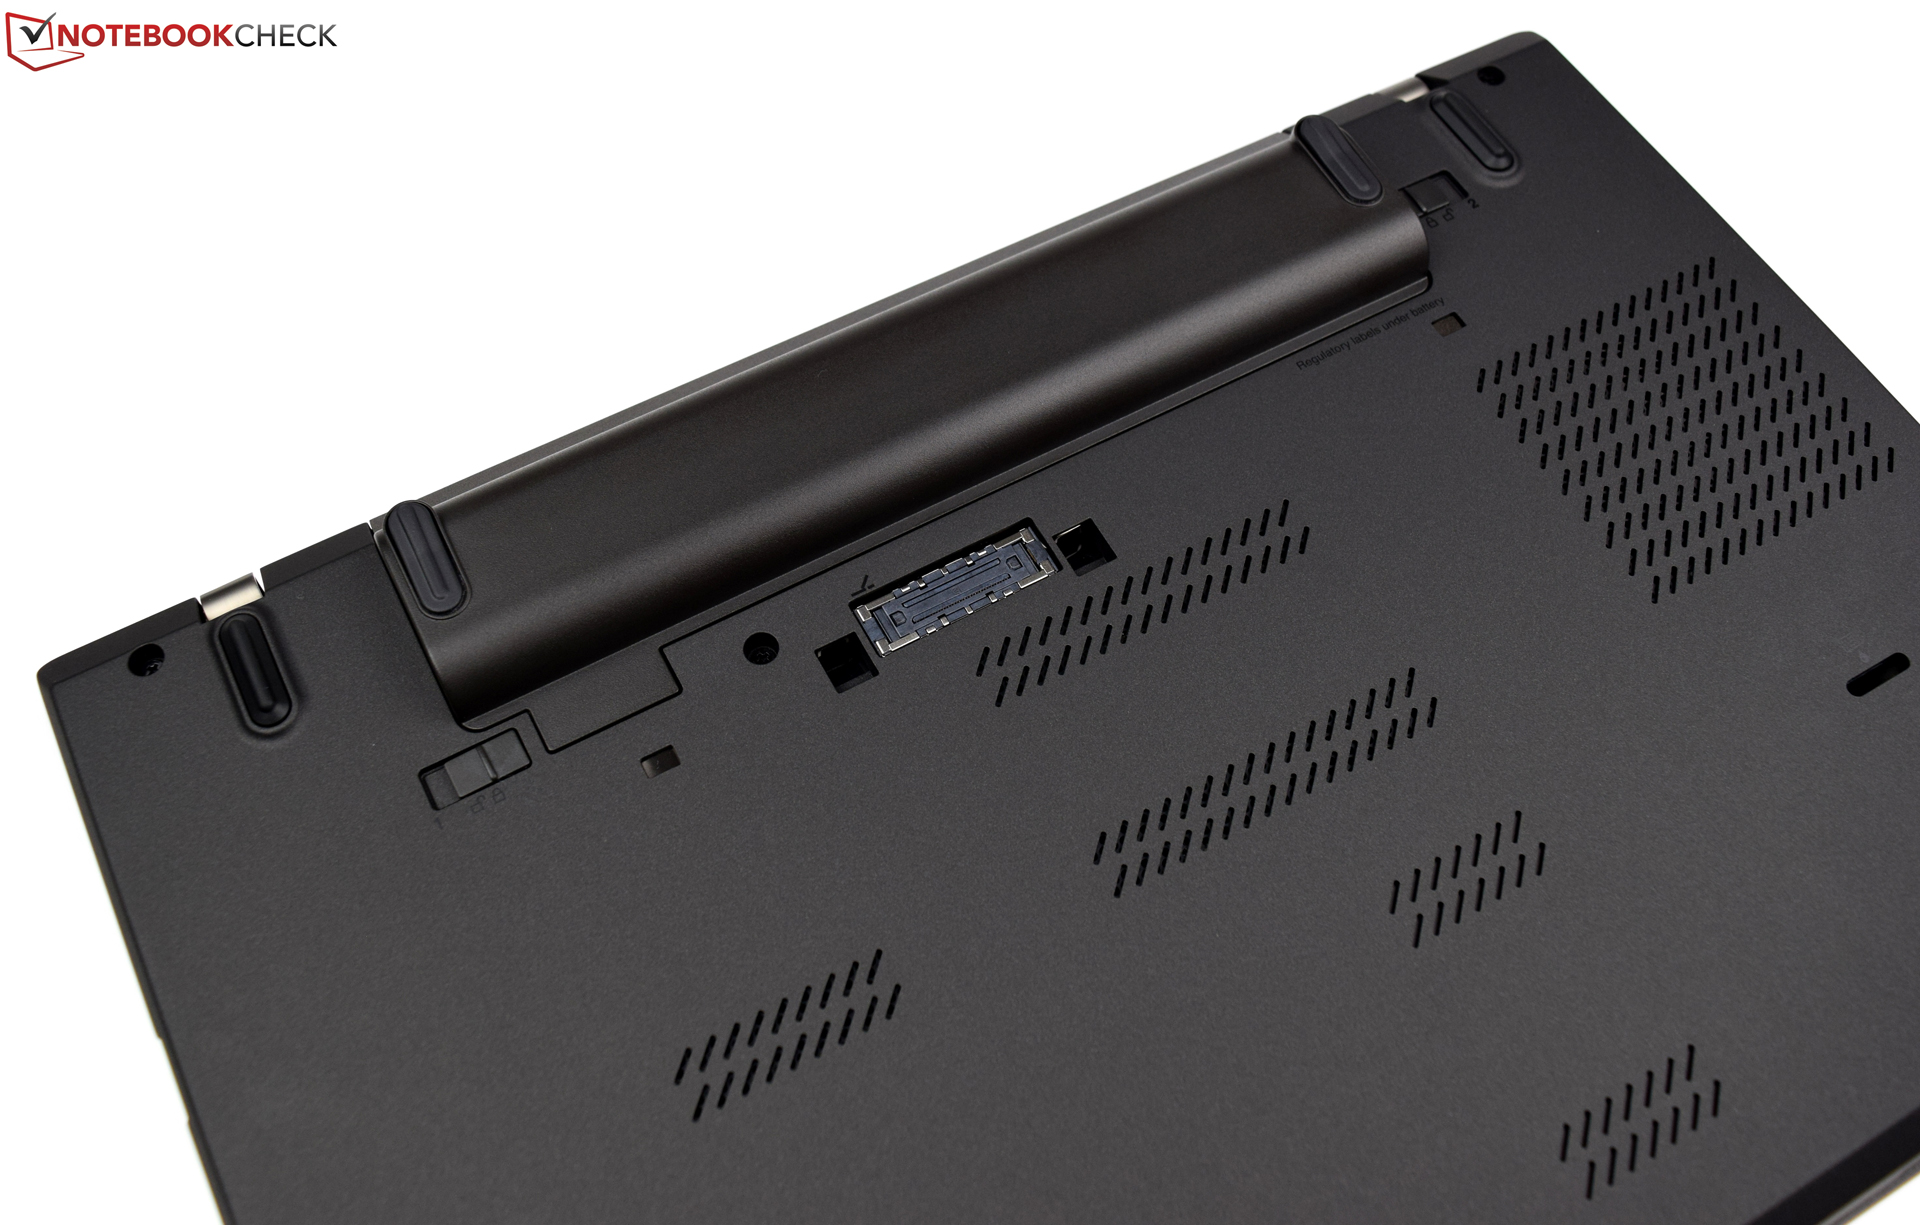
| Lenovo ThinkPad T470p-20J7S00000 i7-7700HQ, GeForce 940MX, 72 Wh | Lenovo ThinkPad T460p-20FXS05500 6700HQ, GeForce 940MX, 48 Wh | Dell Latitude 14 E5470 6440HQ, HD Graphics 530, 62 Wh | Dell Latitude 5480 i7-7600U, HD Graphics 620, 68 Wh | HP EliteBook 840 G4-Z2V49ET ABD i5-7200U, HD Graphics 620, 51 Wh | Lenovo ThinkPad T470-20HD002HGE i5-7200U, HD Graphics 620, 48 Wh | |
|---|---|---|---|---|---|---|
| Autonomia della batteria | -35% | -13% | 63% | 39% | 13% | |
| Reader / Idle (h) | 17.7 | 11 -38% | 15.2 -14% | 24.1 36% | 19.3 9% | |
| H.264 (h) | 7.6 | 6 -21% | 6.9 -9% | 9.9 30% | 10.4 37% | |
| WiFi v1.3 (h) | 10 | 5 -50% | 7.2 -28% | 16.1 61% | 9.5 -5% | 7.3 -27% |
| Load (h) | 1.4 | 1 -29% | 1.4 0% | 2.7 93% | 3.1 121% | 1.8 29% |
Pro
Contro
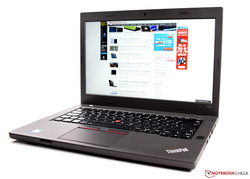
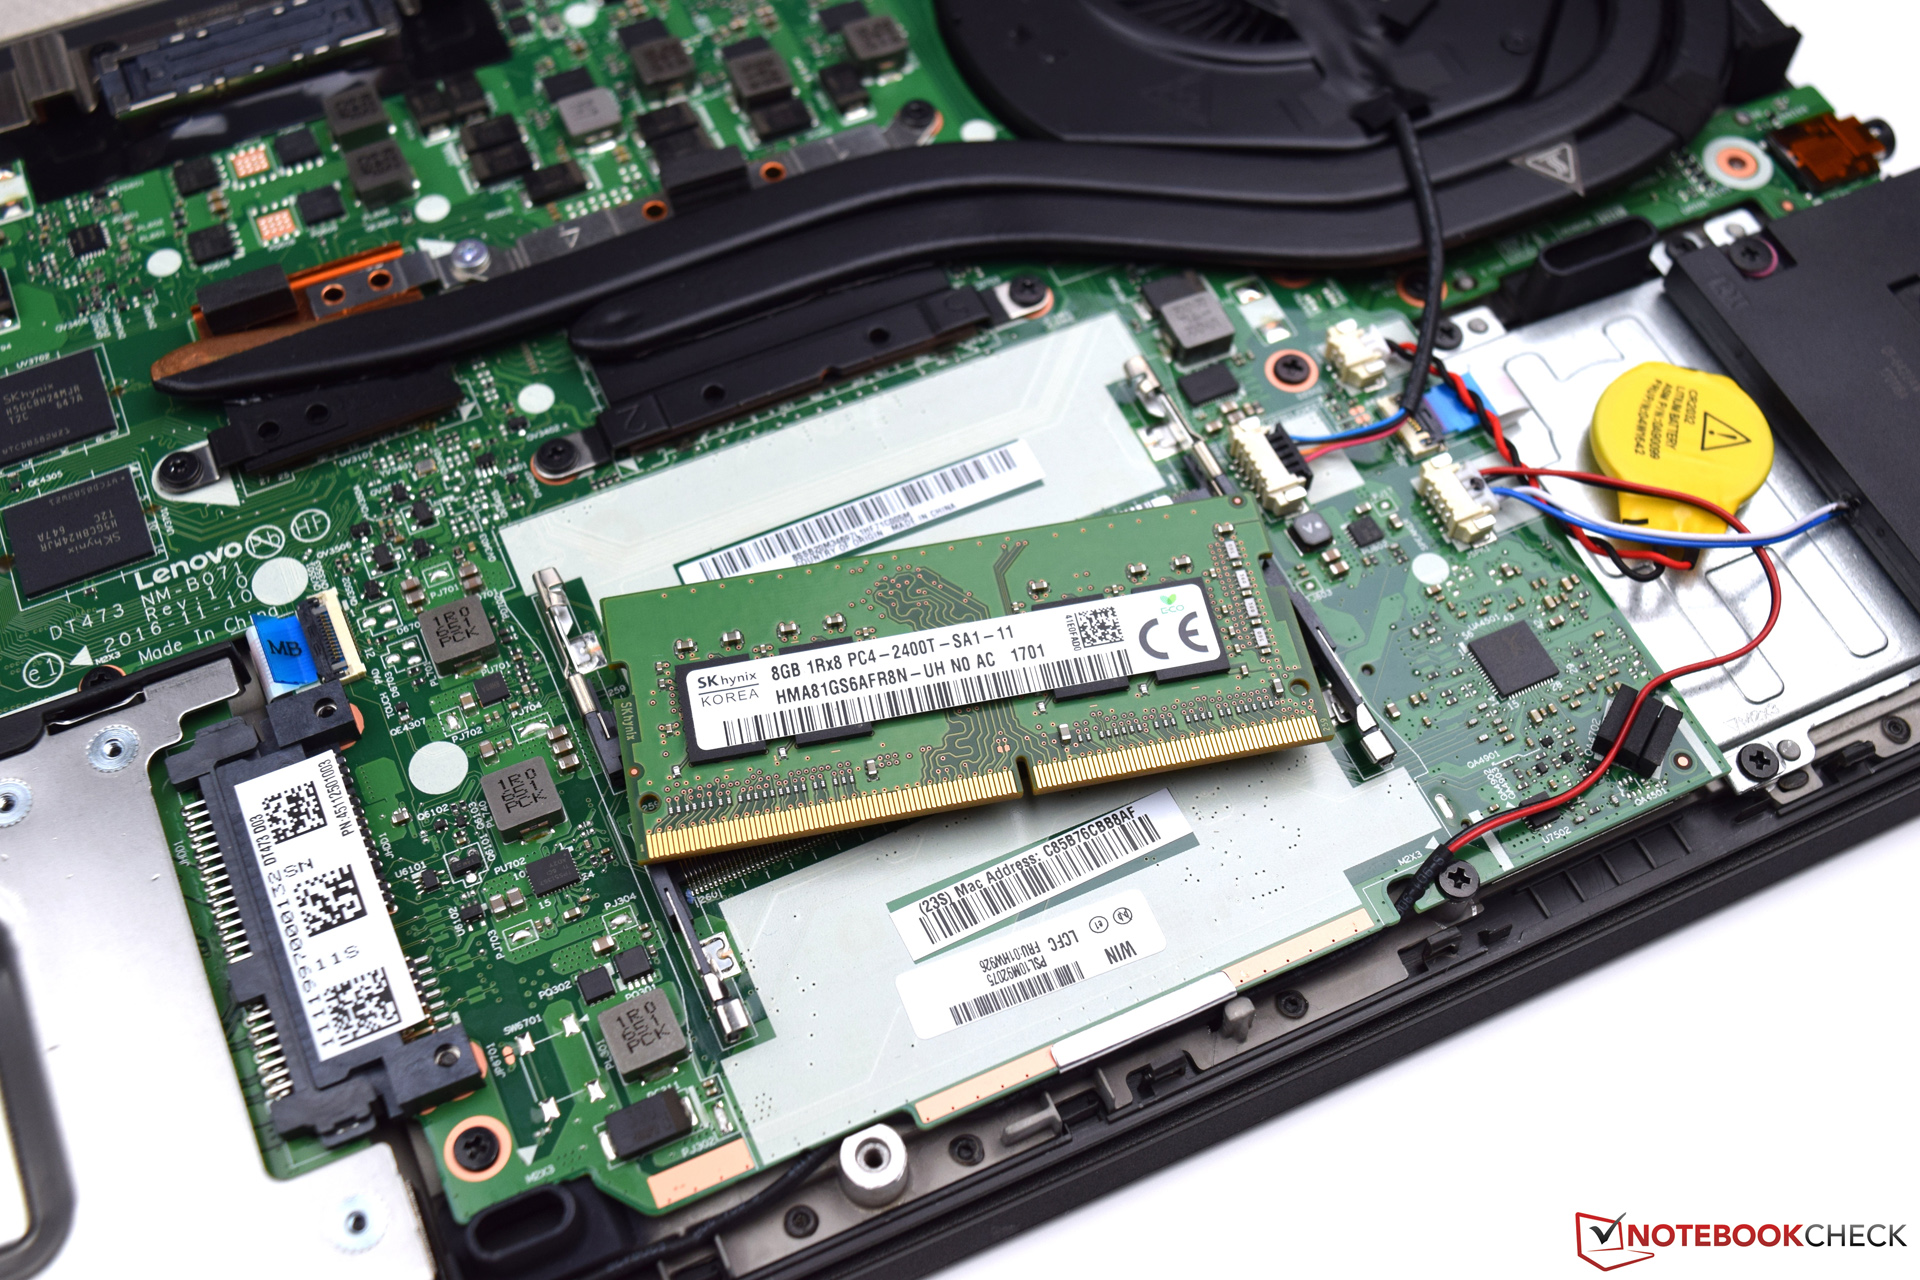
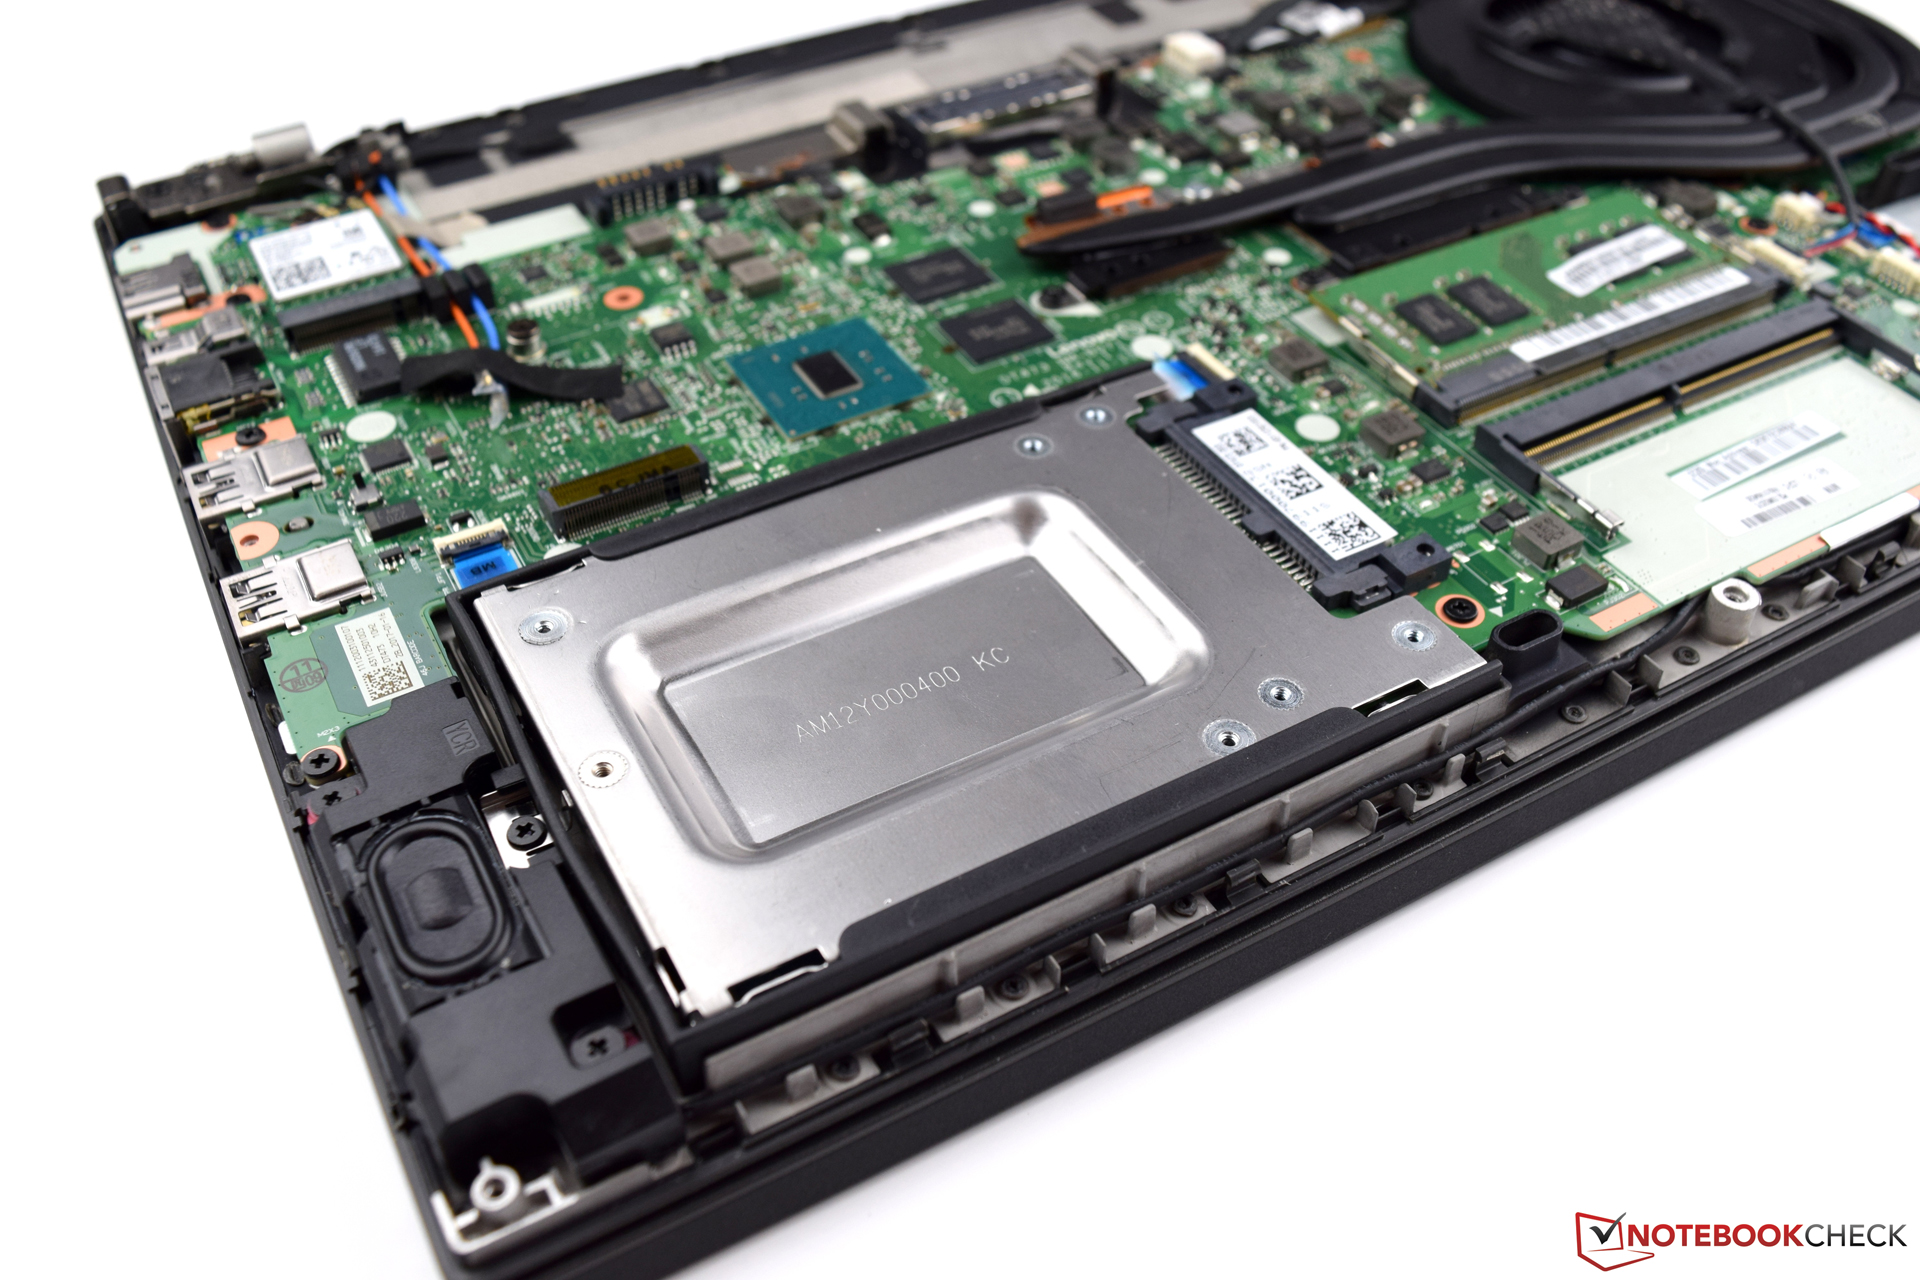
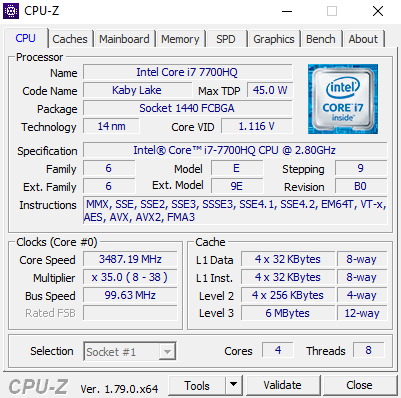
Lenovo aggiorna i suoi modelli e monta sul ThinkPad T470p una potente CPU Kaby Lake, le cui performance sono più che sufficienti per la tipologia di utilizzo. La memoria (8 GB DDR4), che non è molta ma è sufficiente, può essere aumentata se necessario. Abbiamo apprezzato tutte le altre features di sicurezza che trasformano il Lenovo ThinkPad T470p in un dispositivo business. Tuttavia il produttore fornisce anche una GPU dedicata, in grado di gestire alcuni giochi a frame rates passabili. Lo spazio di archiviazione ha prestazioni buone e contribuisce in modo significativo a rendere fluido il sistema. Tuttavia, la nota dolente resta il prezzo di 2099 Euro (~$2367) abbastanza alto per questo dispositivo. Per questa cifra potete avere un portatile business high-performance in formato 14", che comunque monta buoni dispositivi di input .
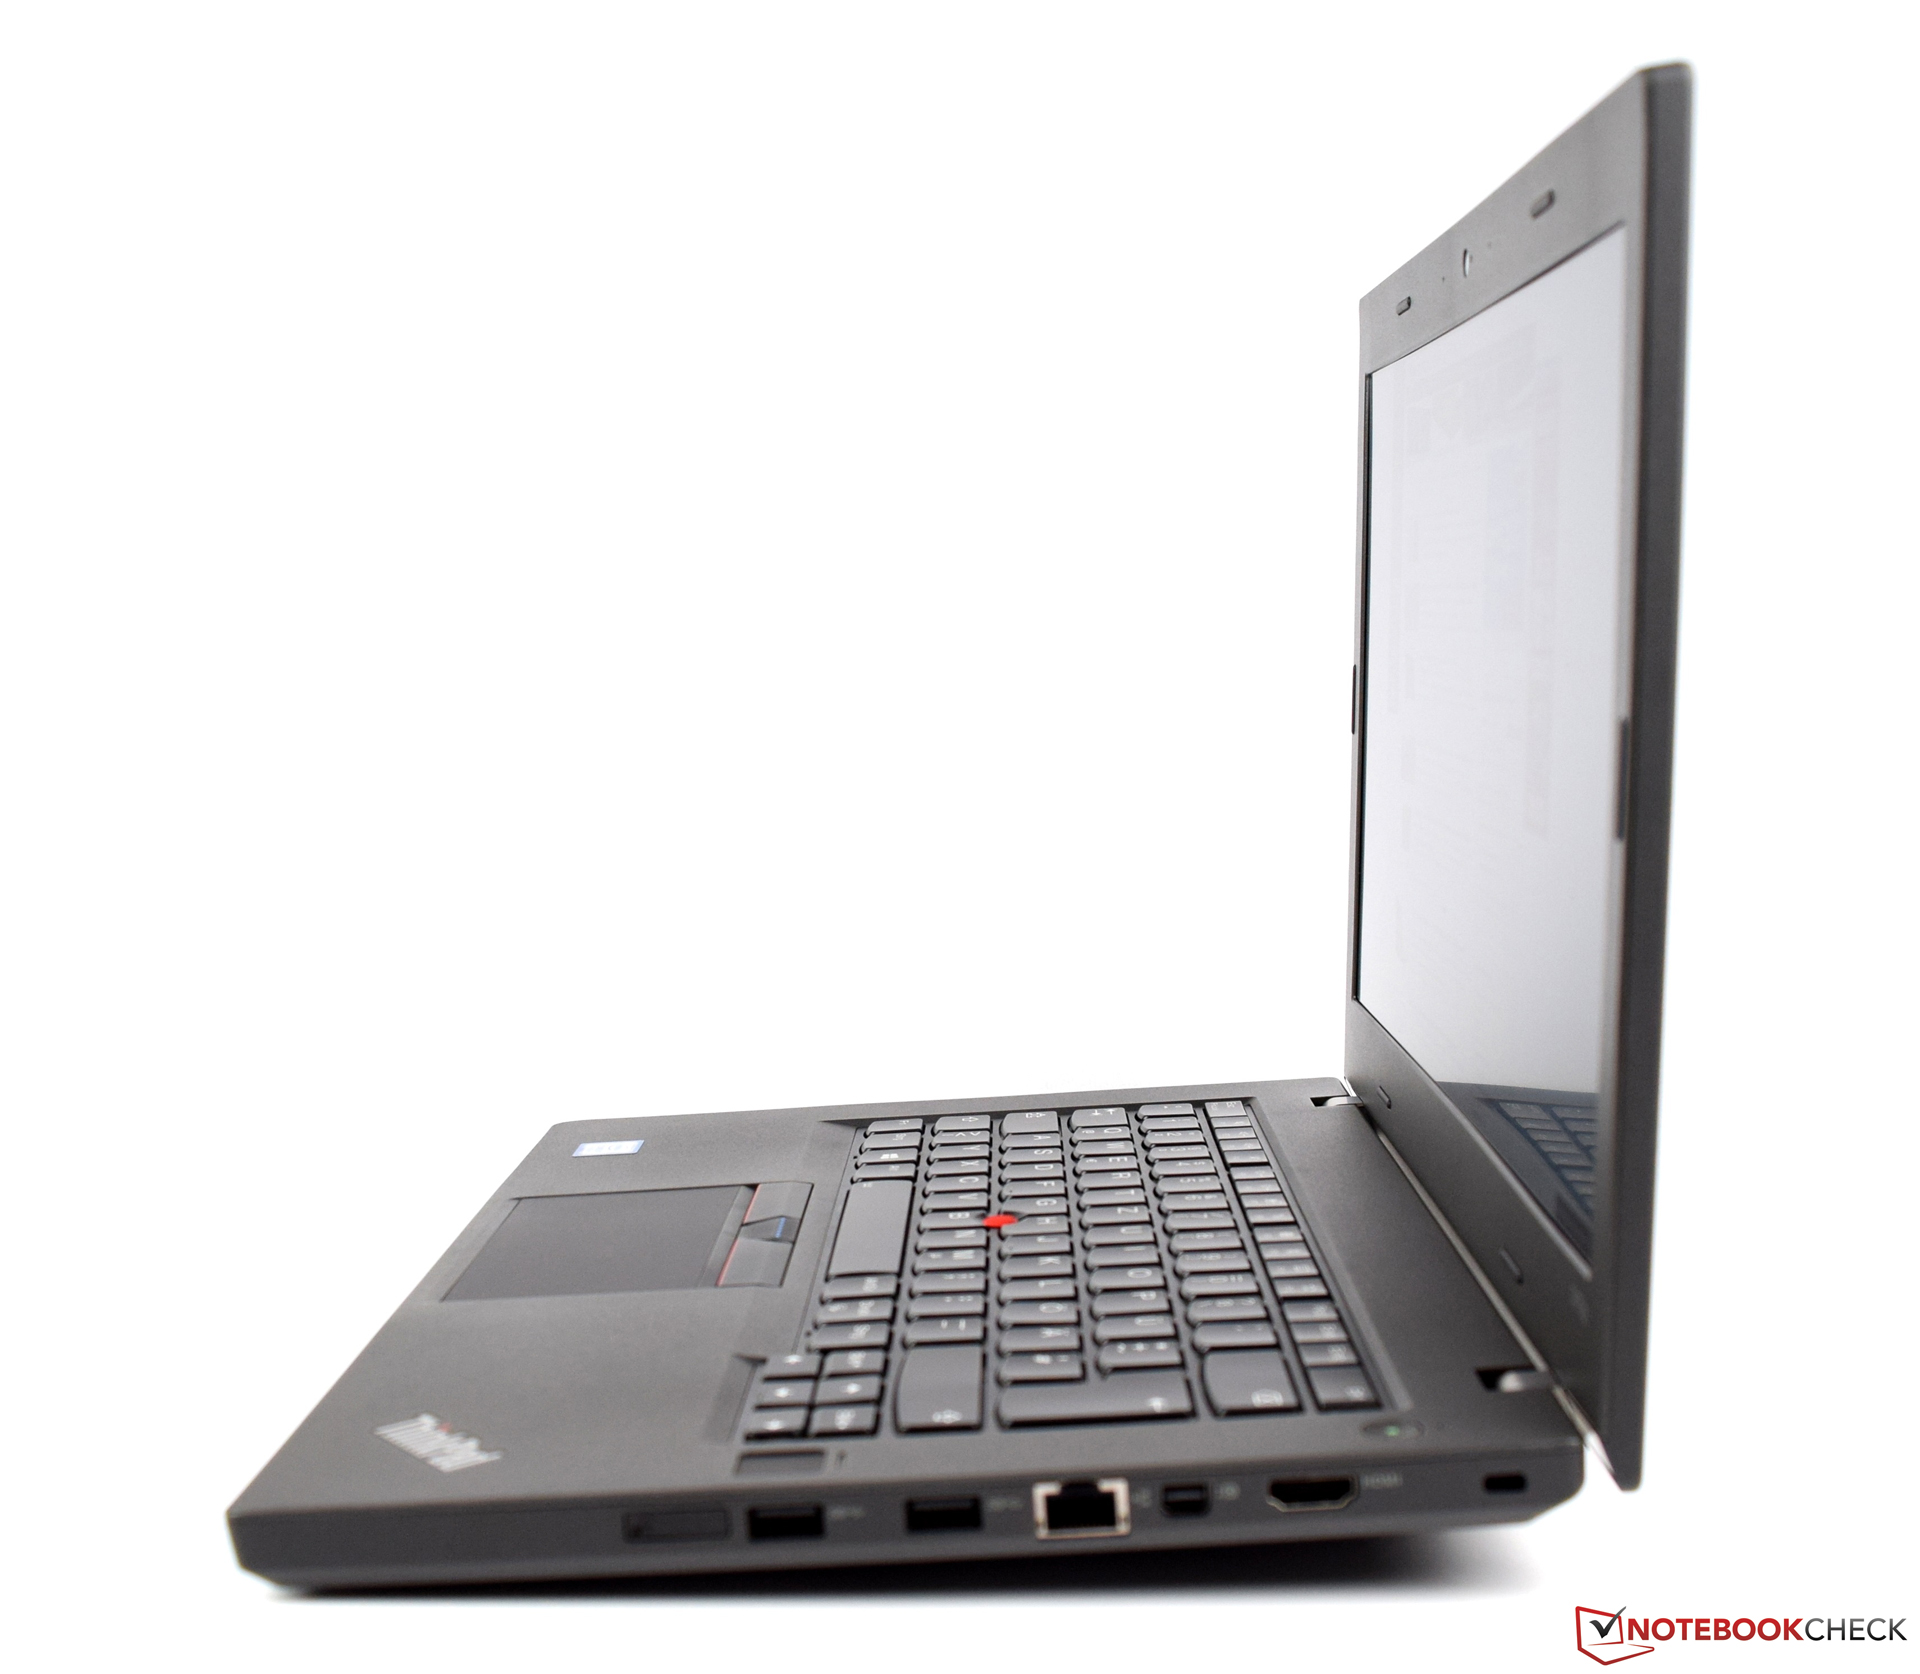
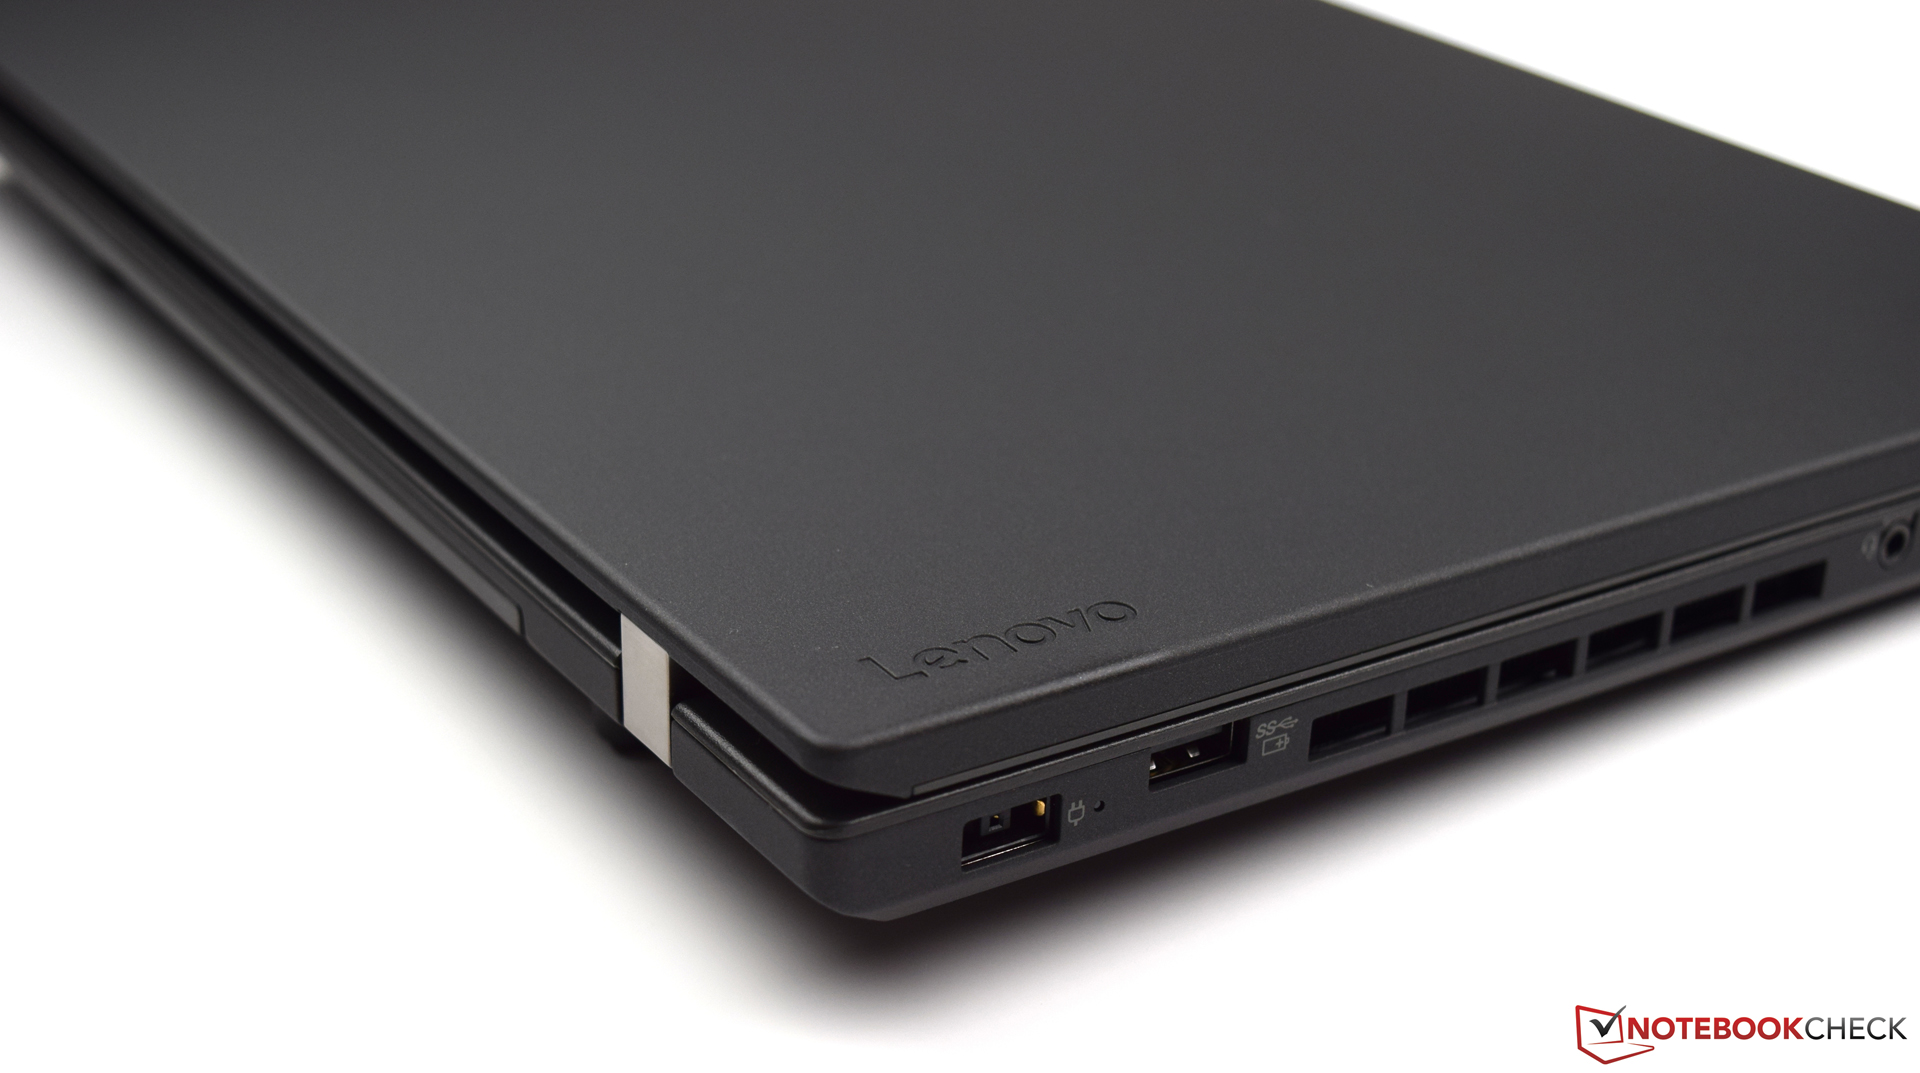
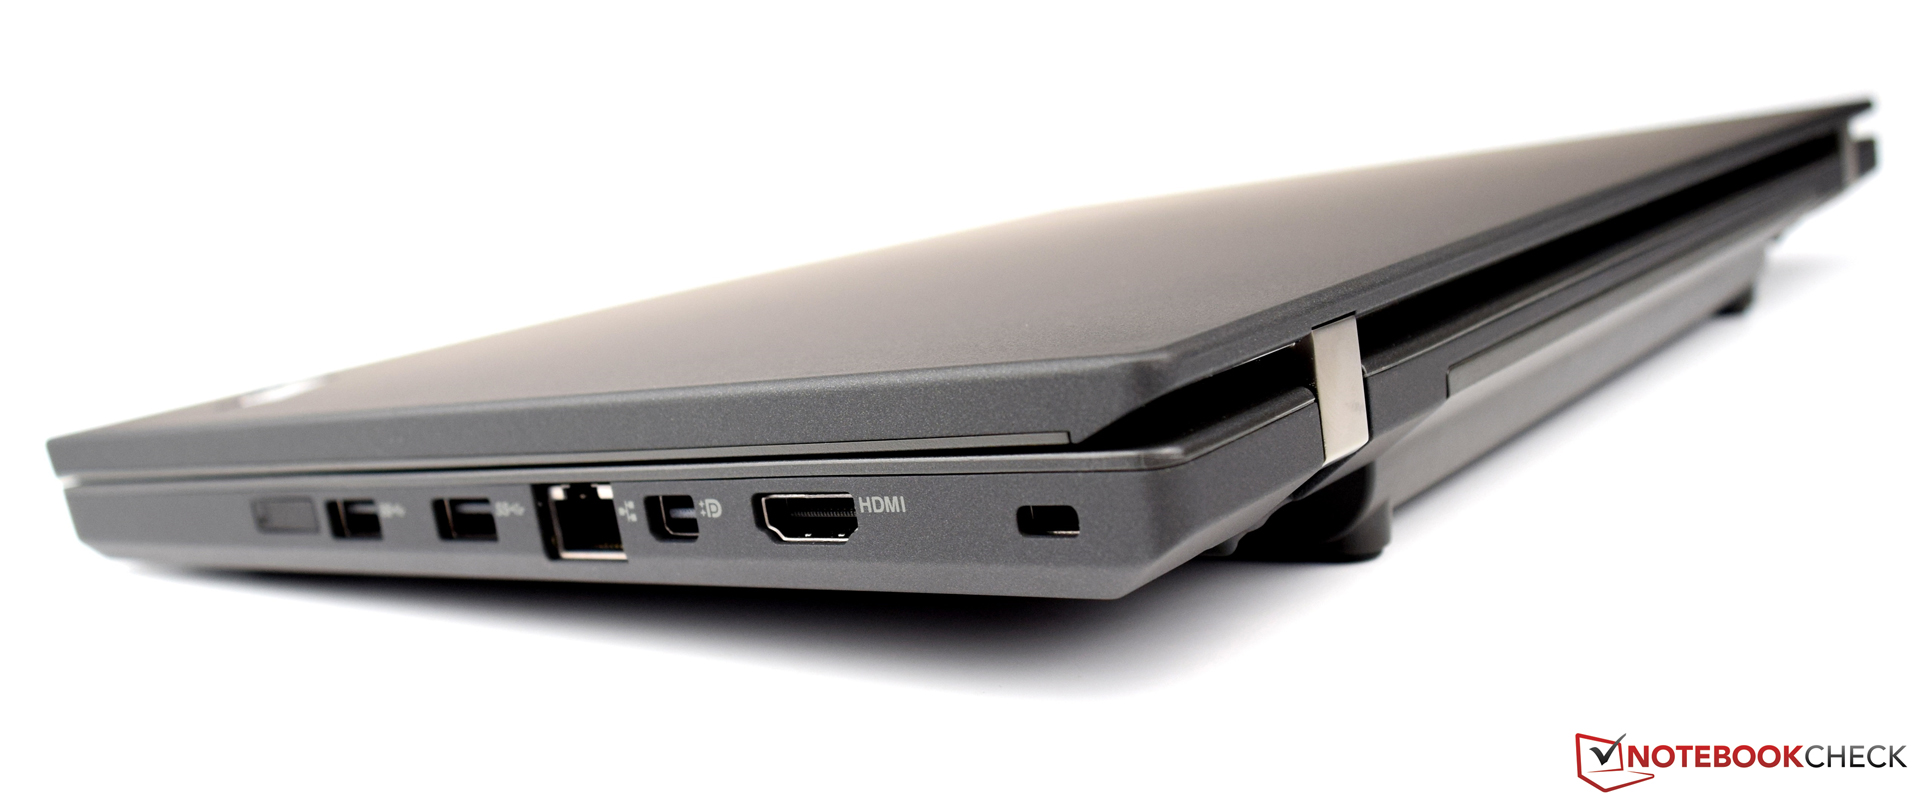
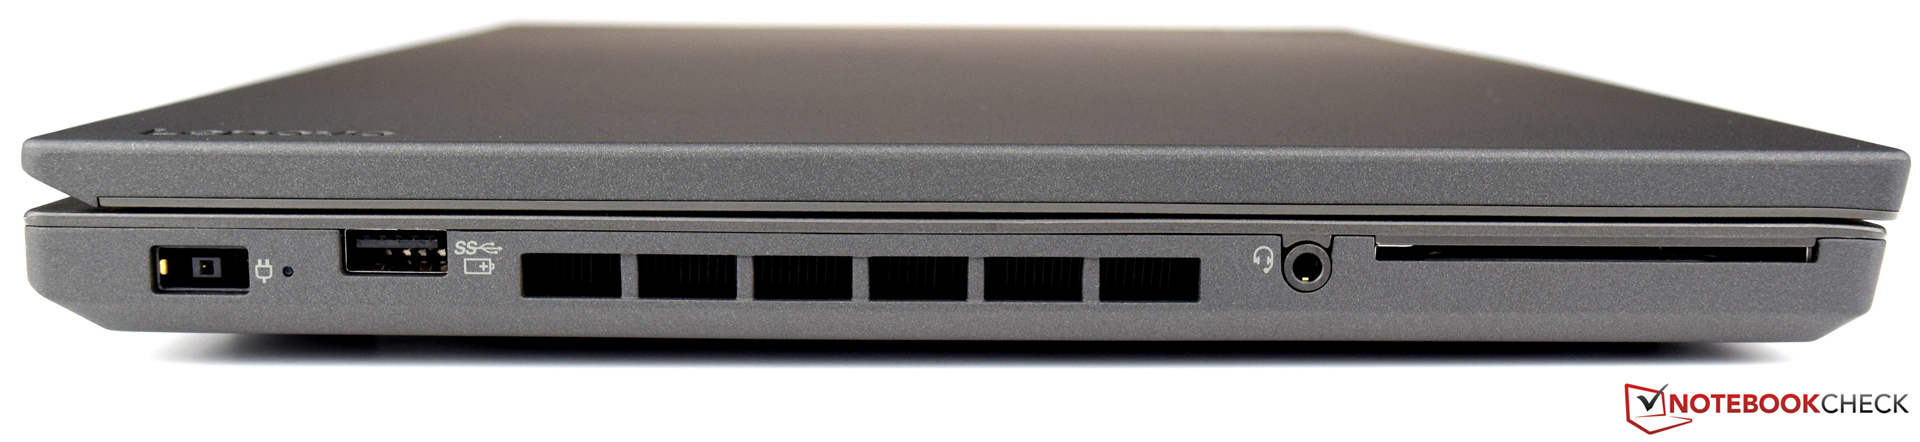
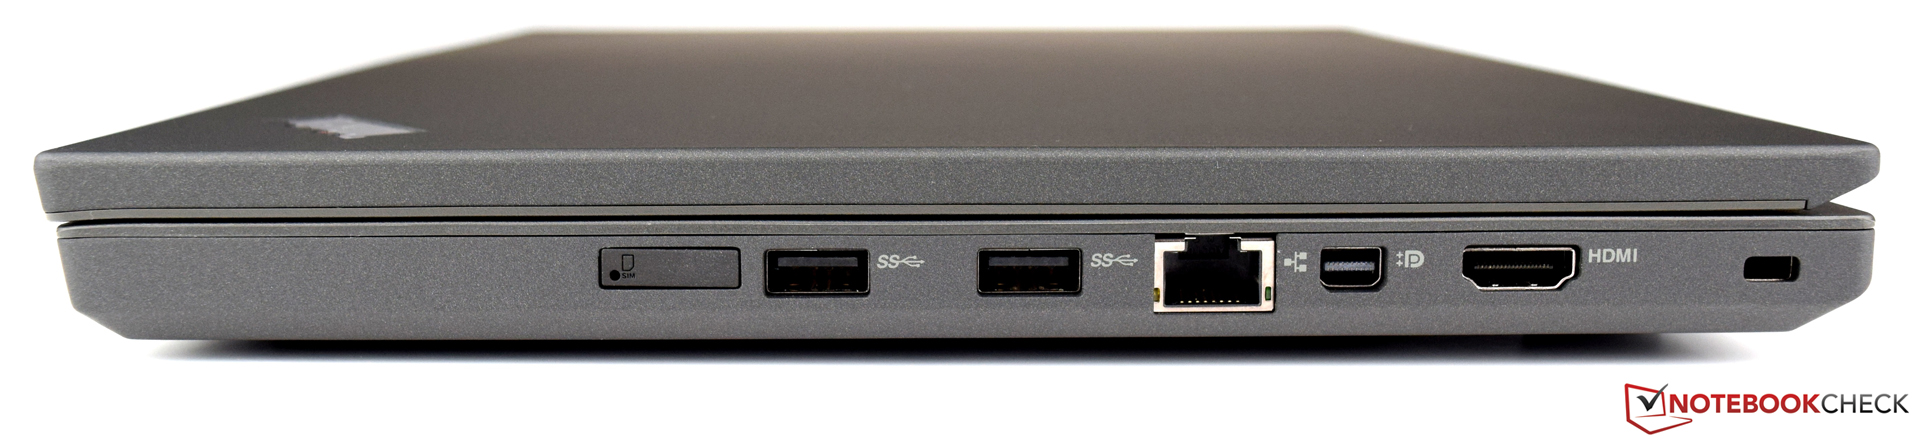
Ma il Lenovo ThinkPad T470p ha anche qualche pecca: sebbene il display offra prestazioni solide, in termini di luminosità resta sotto le attese. Non abbiamo apprezzato il fatto che Lenovo non doti il nuovo dispositivo, che si suppone debba essere usato per i prossimi anni, con moderni connettori. Per questo prezzo, dovrete avere almeno una porta USB 3.1 Type-C con supporto Thunderbolt. Infine, il sistema di raffreddamento dovrebbe essere migliorato in futuro.
Con prestazioni elevate questo 14" con quad-core T470p ha features davvero uniche al momento.
Nel complesso, il Lenovo ThinkPad T470p fa una buona impressione. Le eccellenti prestazioni di sistema e la GPU dedicata rendono il dispositivo utilizzabile in molti scenari. Oltre al lavoro da ufficio, il Lenovo ThinkPad T470p gestisce anche applicazioni multimedia molto bene, ed anche alcuni giochi possono essere usati senza alcun problema.
Nota: si tratta di una recensione breve, con alcune sezioni non tradotte, per la versione integrale in inglese guardate qui.
Lenovo ThinkPad T470p-20J7S00000
- 05/14/2017 v6 (old)
Sebastian Bade