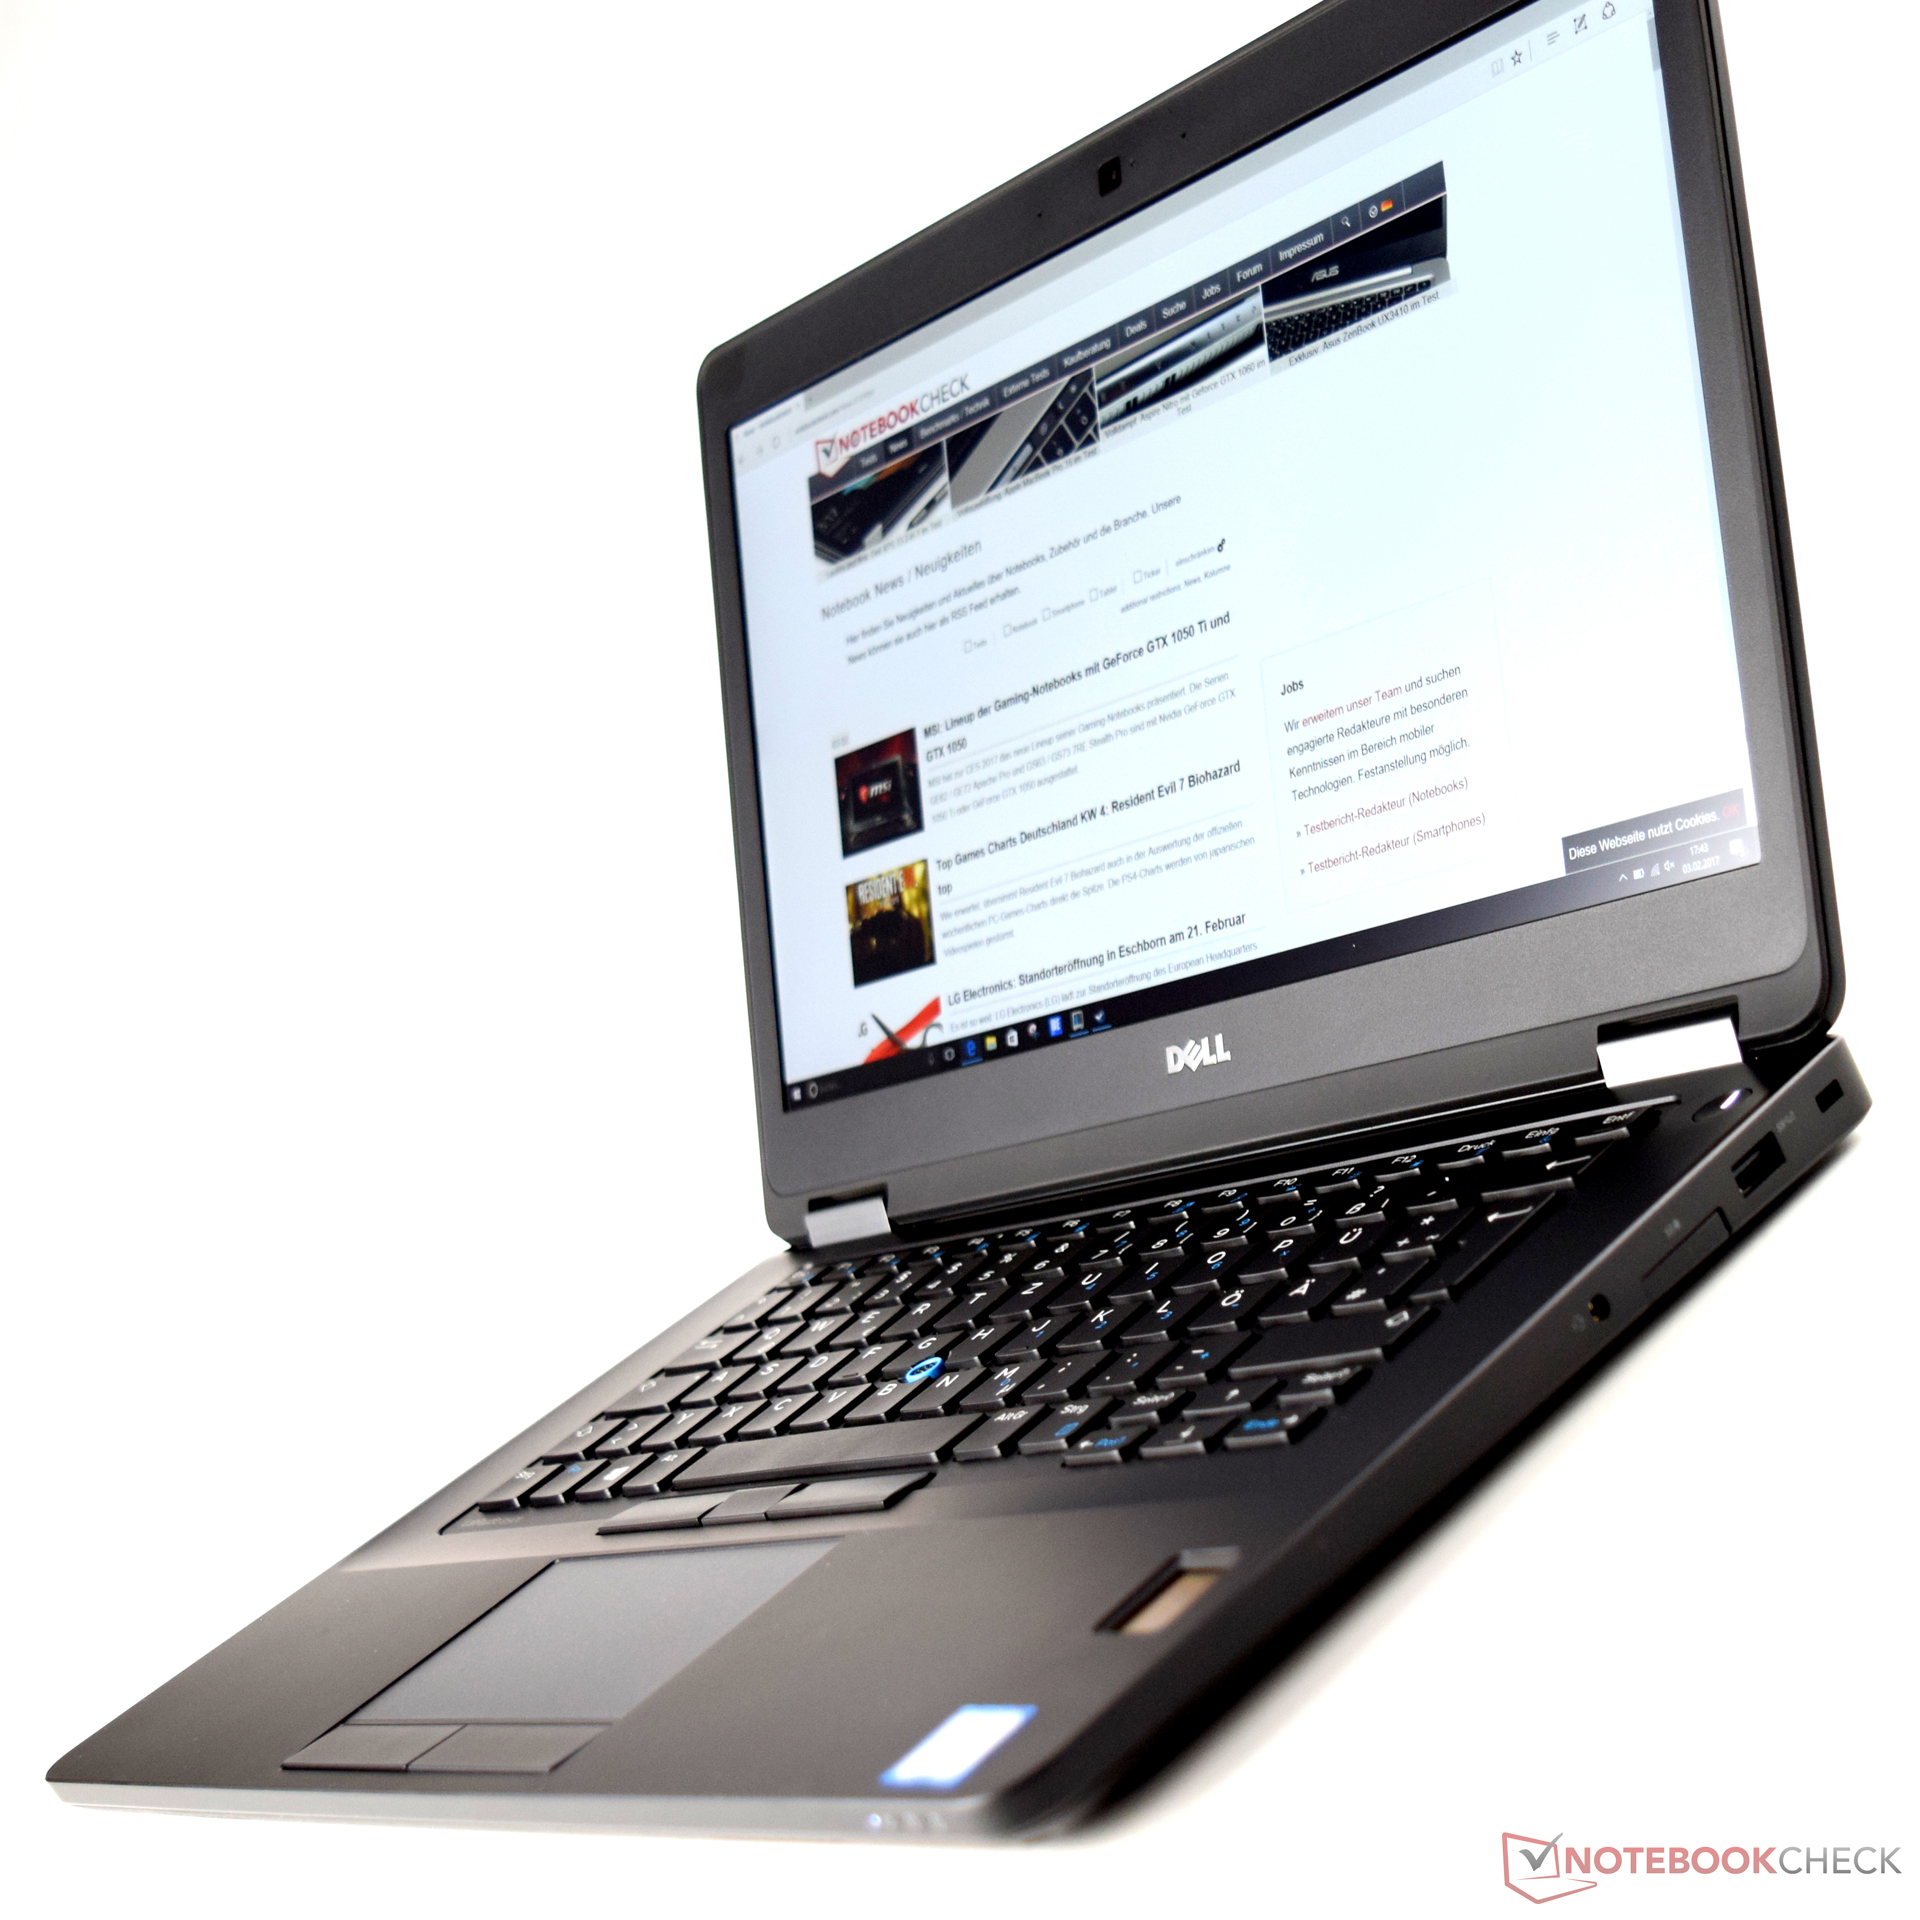
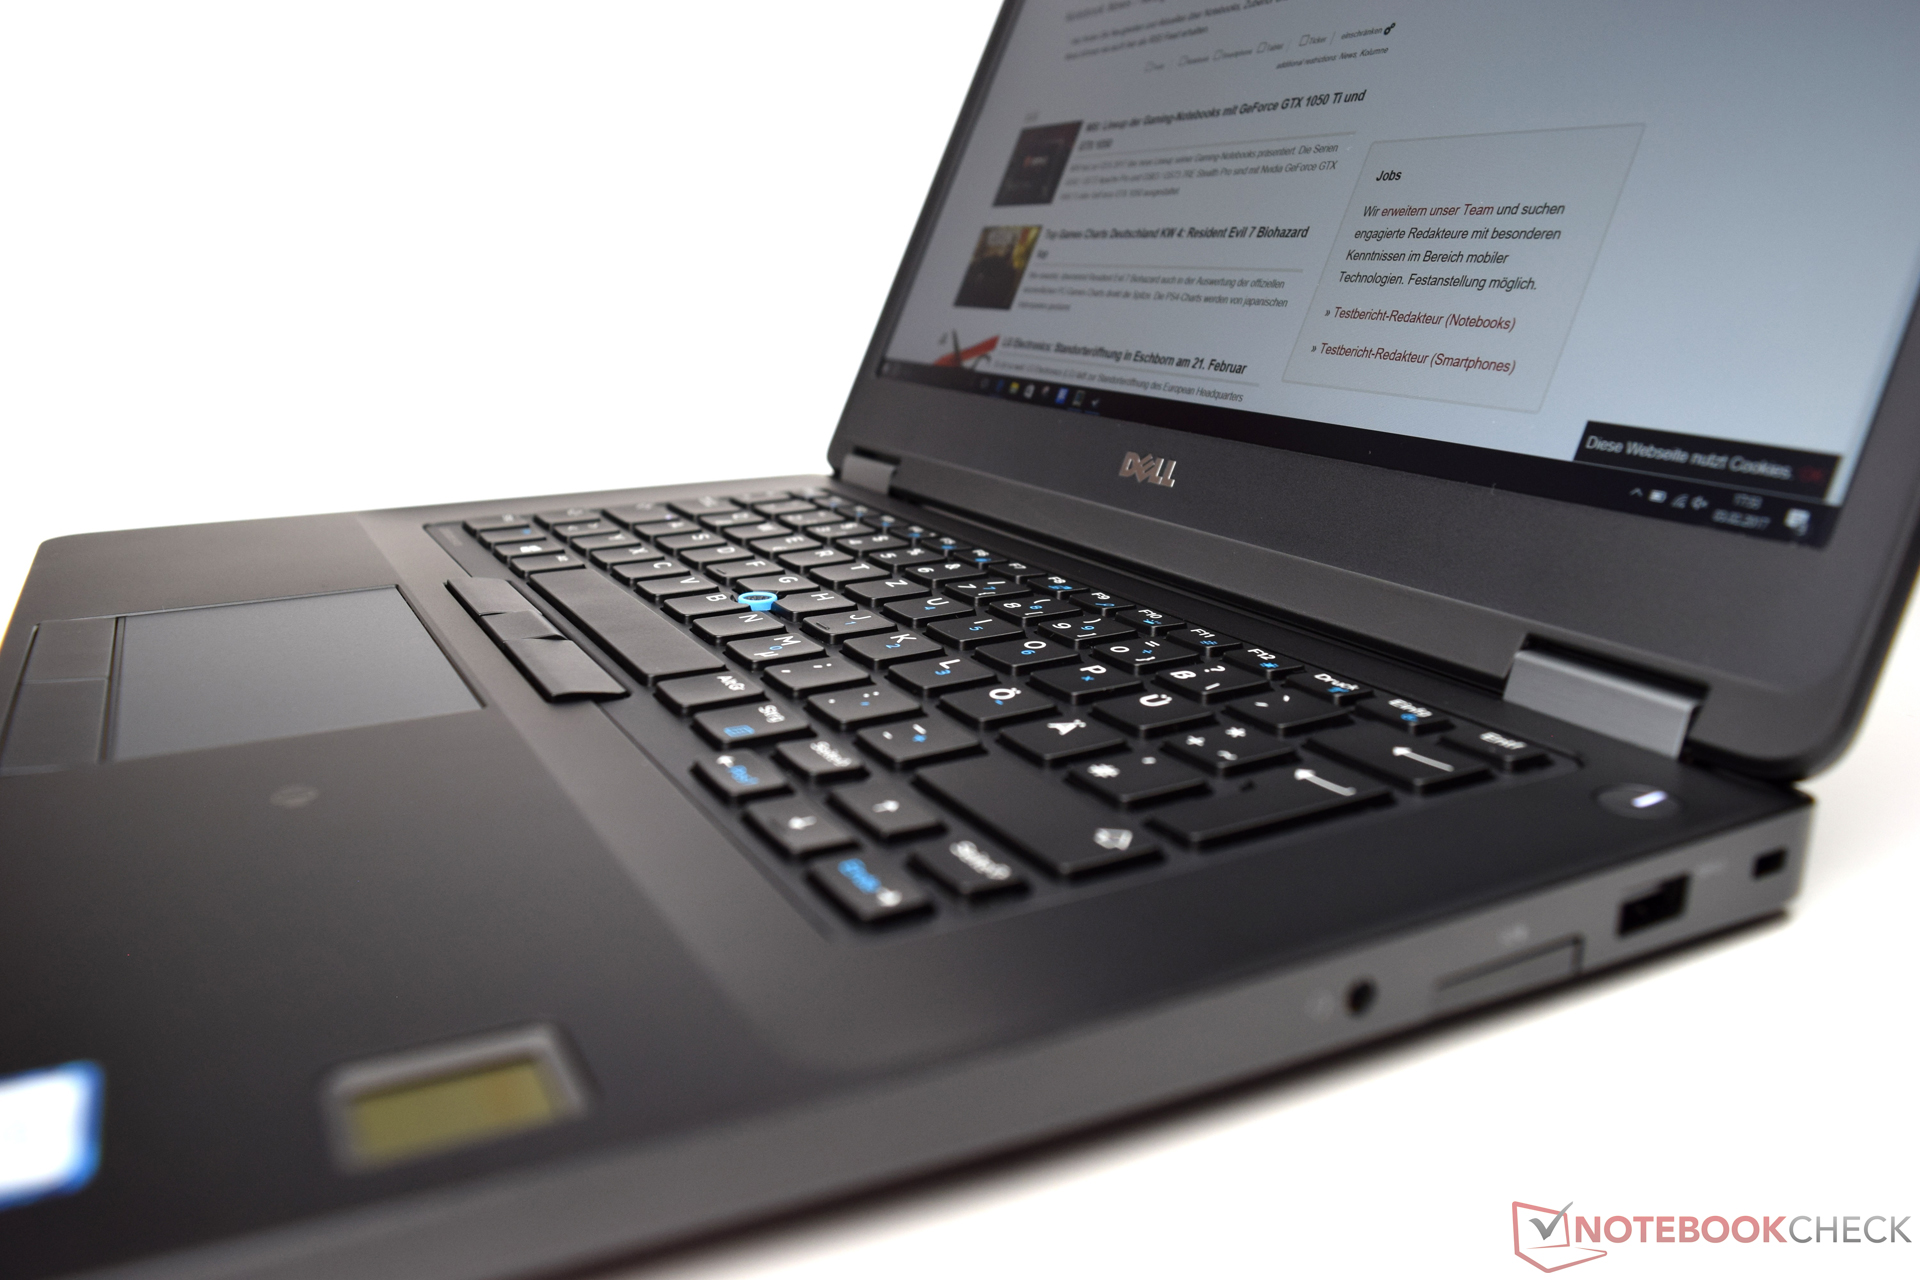
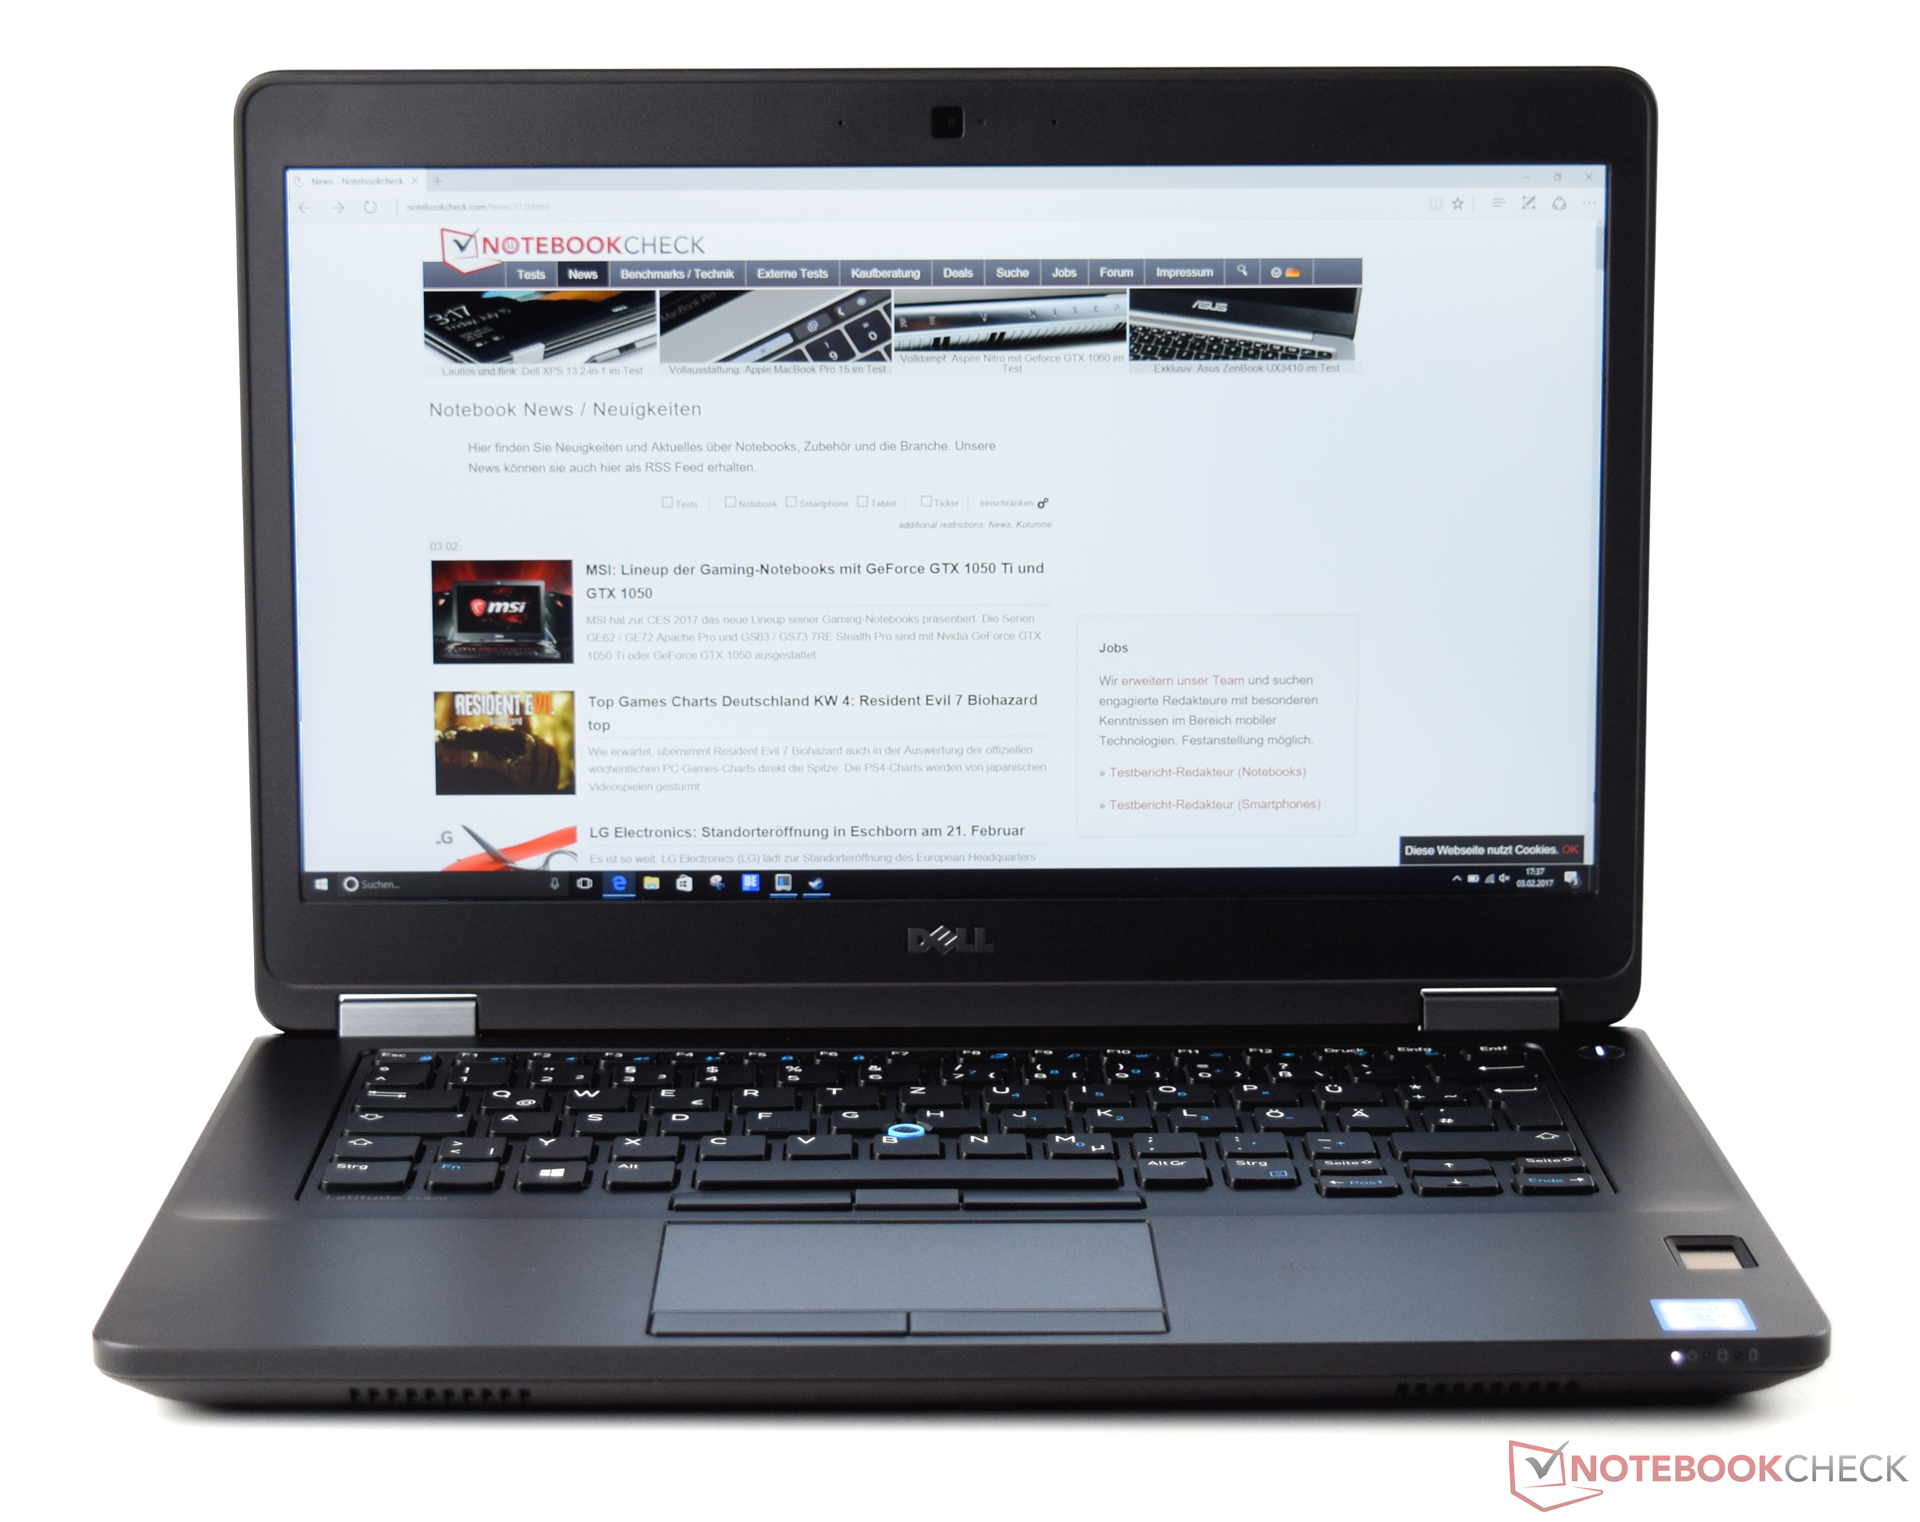
Recensione breve del portatile Dell Latitude 14 E5470 6440HQ

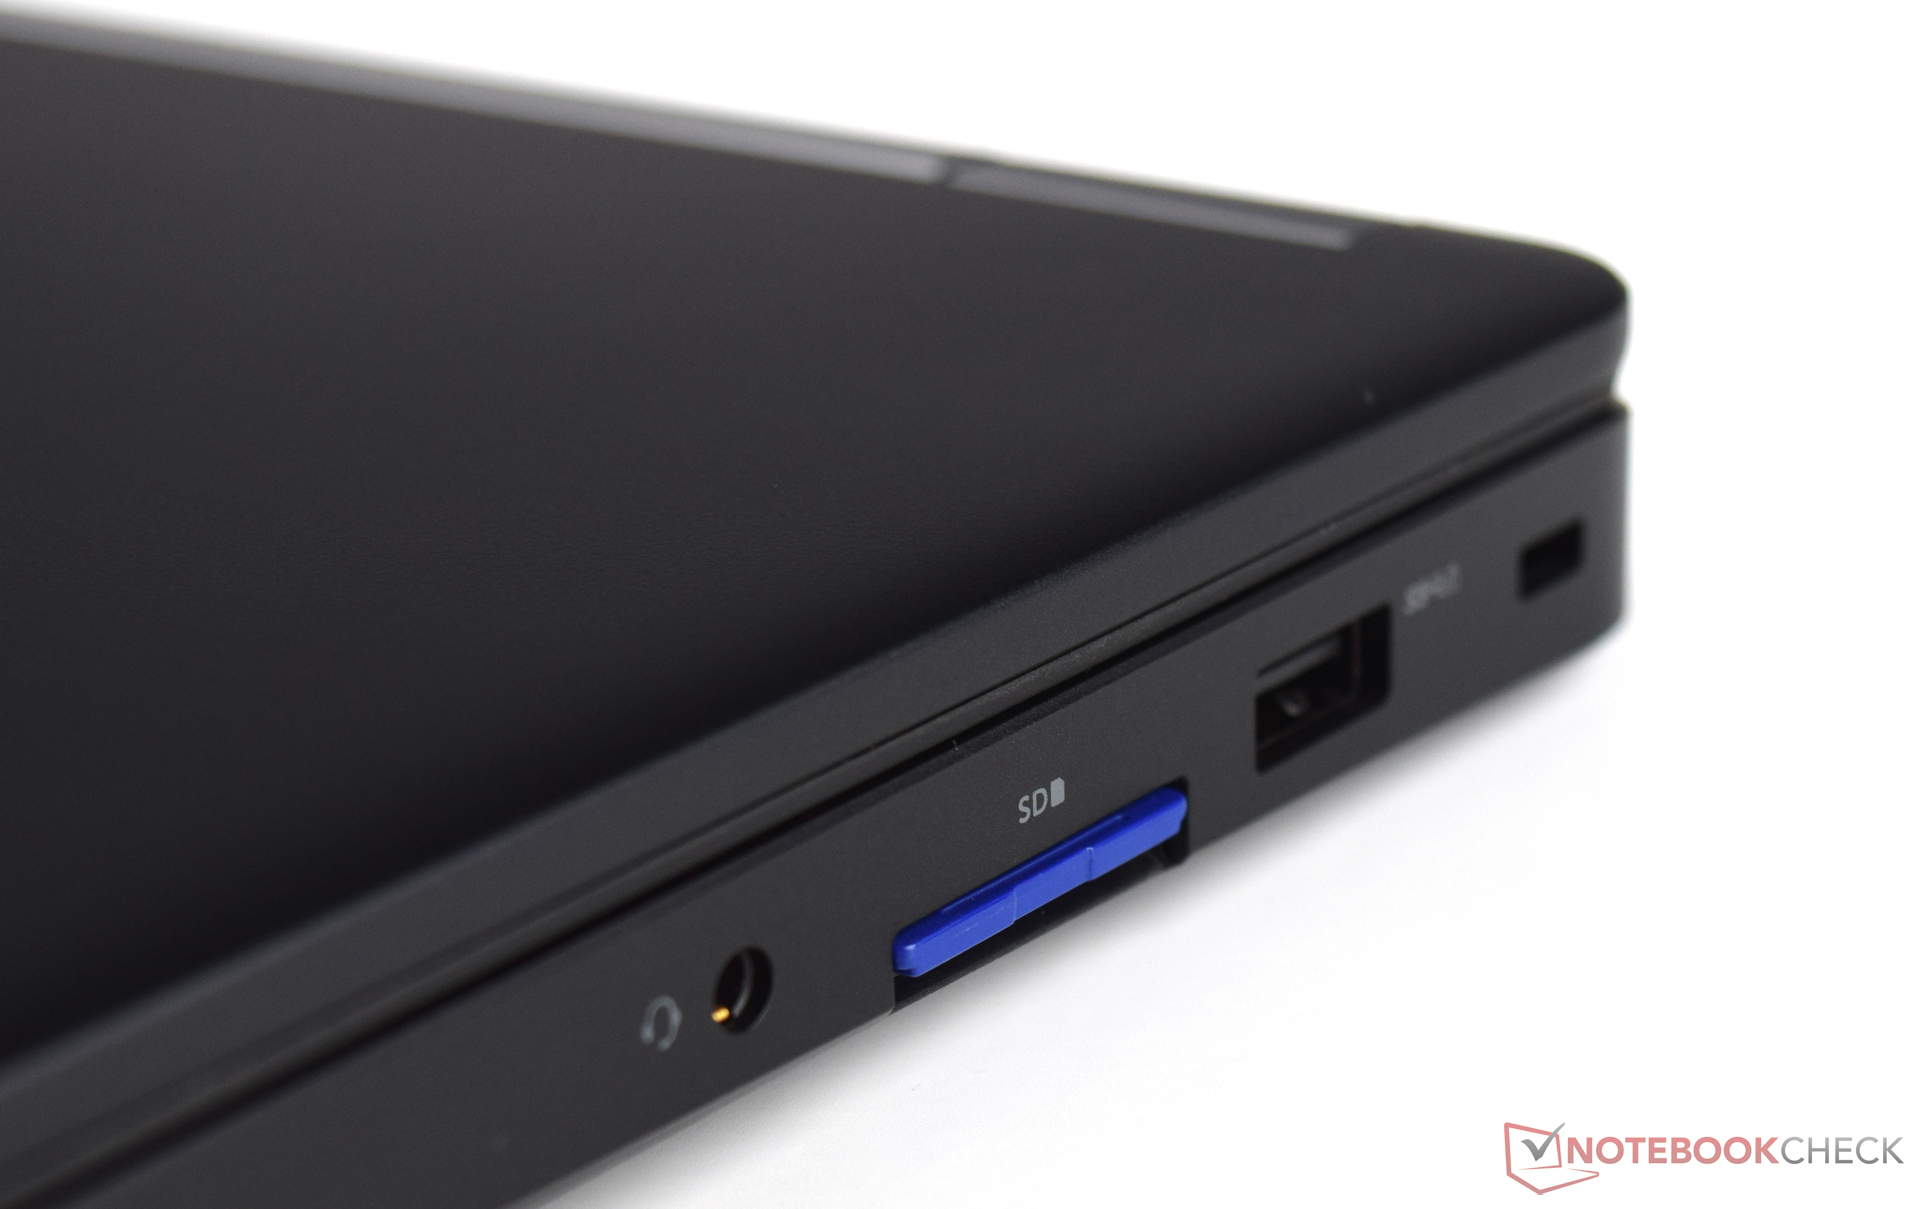
| SD Card Reader | |
| average JPG Copy Test (av. of 3 runs) | |
| Dell Latitude 14 E5470 | |
| Dell Latitude 14 E5470 | |
| HP ProBook 440 G4-Y8B51EA | |
| Acer TravelMate P648-M-757N | |
| Lenovo ThinkPad T460-20FN003LGE | |
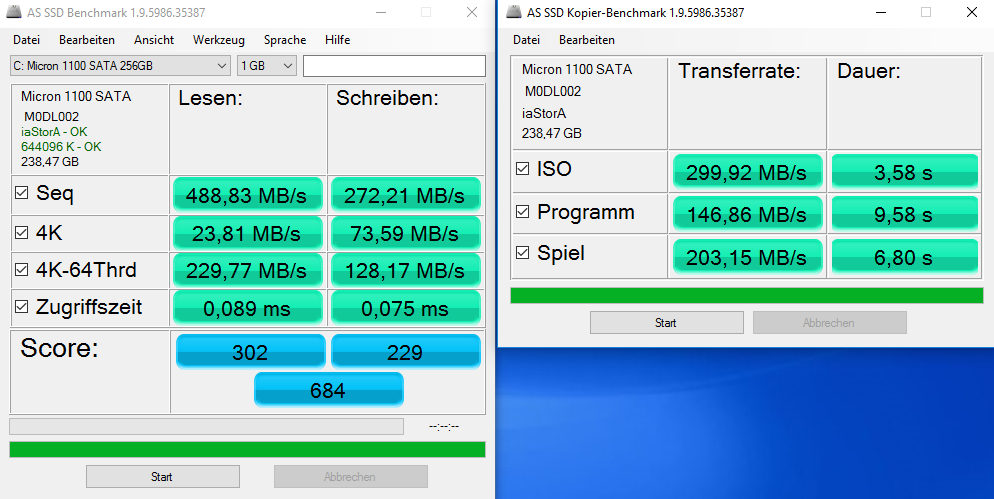
| maximum AS SSD Seq Read Test (1GB) | |
| Dell Latitude 14 E5470 | |
| Dell Latitude 14 E5470 | |
| Lenovo ThinkPad T460-20FN003LGE | |
| HP ProBook 440 G4-Y8B51EA | |
| Networking | |
| iperf3 transmit AX12 | |
| Lenovo IdeaPad 710S Plus-13IKB | |
| Dell Vostro 15-5568 | |
| Dell Latitude 14 E5470 (jseb) | |
| HP Pavilion 14-al103ng | |
| iperf3 receive AX12 | |
| Dell Latitude 14 E5470 (jseb) | |
| Lenovo IdeaPad 710S Plus-13IKB | |
| Dell Vostro 15-5568 | |
| HP Pavilion 14-al103ng | |
| |||||||||||||||||||||||||
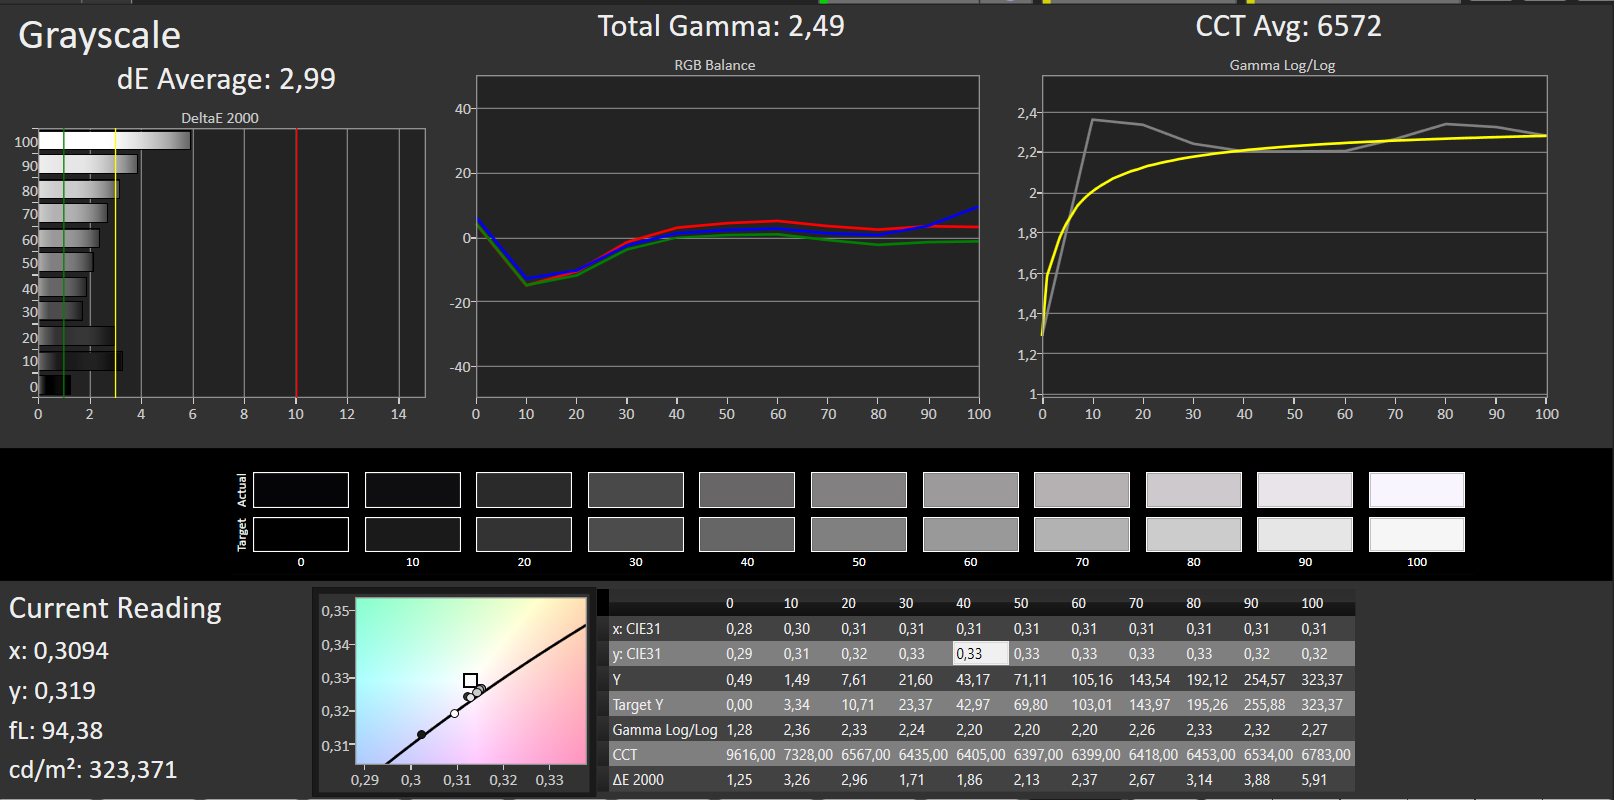
Distribuzione della luminosità: 79 %
Al centro con la batteria: 323 cd/m²
Contrasto: 567:1 (Nero: 0.57 cd/m²)
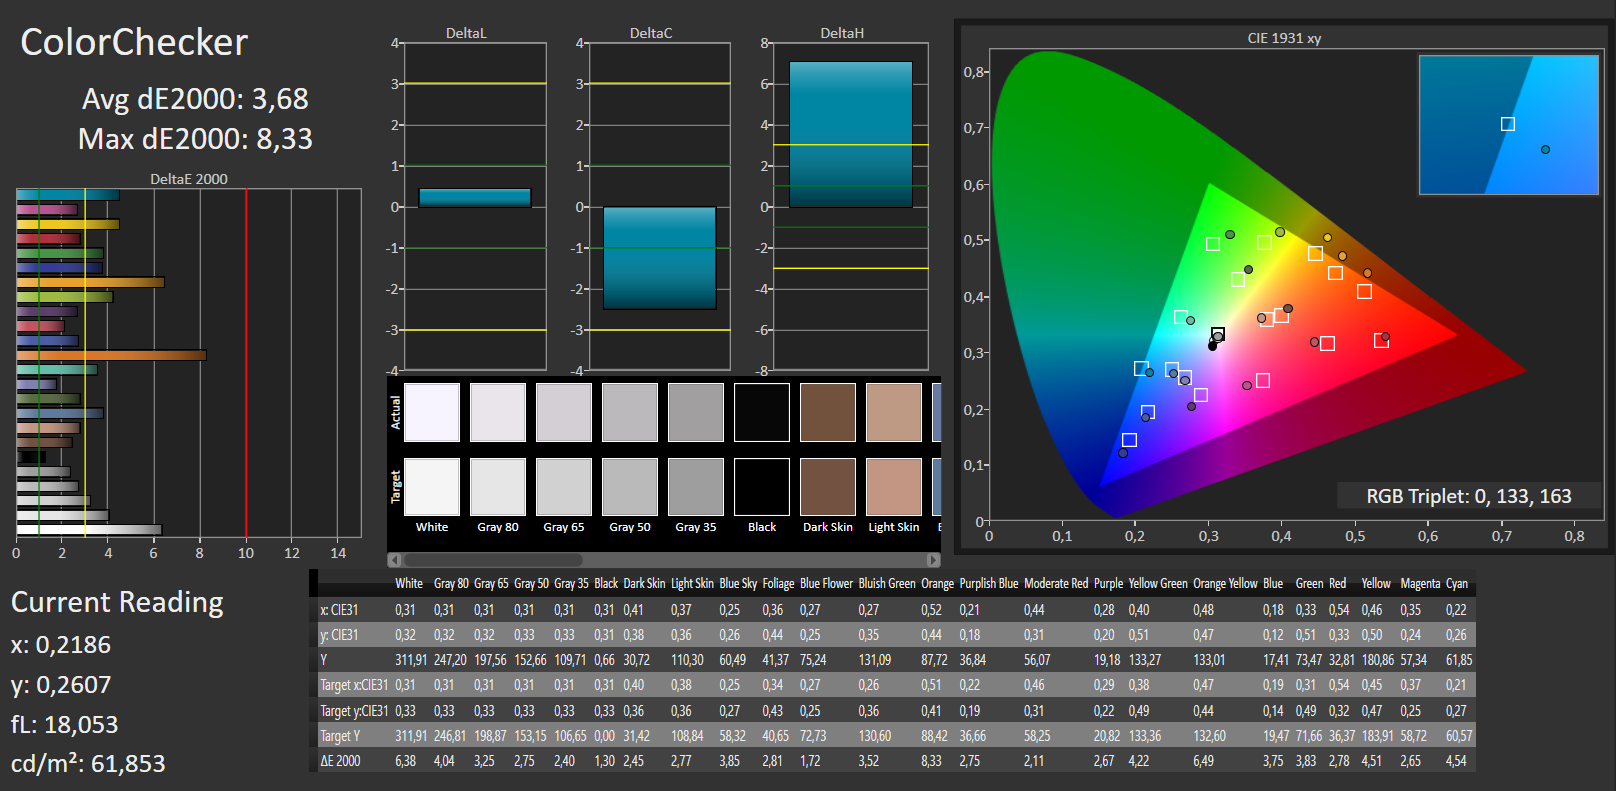
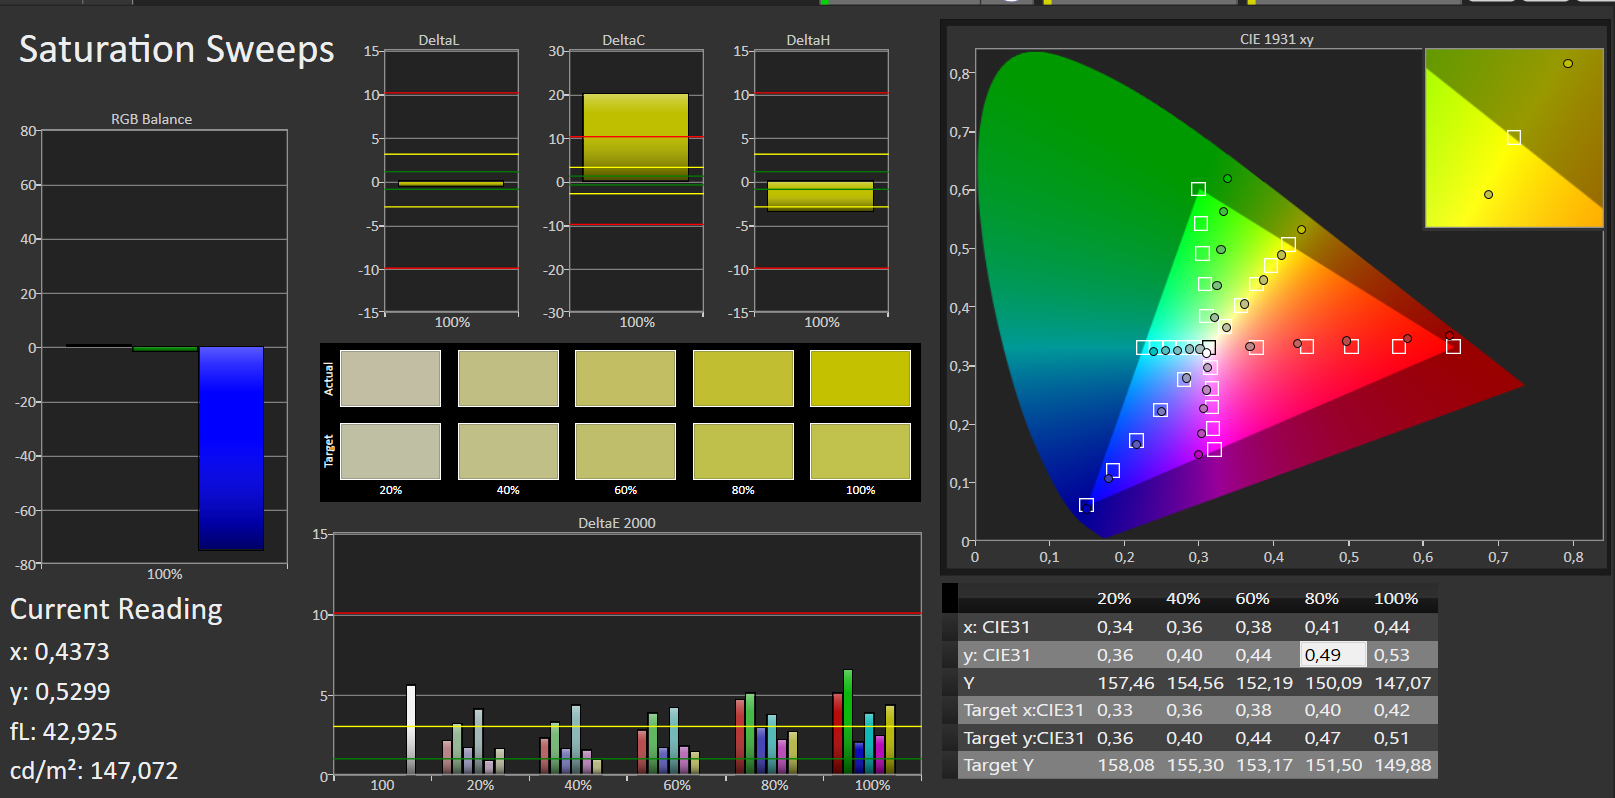
ΔE ColorChecker Calman: 3.68 | ∀{0.5-29.43 Ø4.71}
ΔE Greyscale Calman: 2.99 | ∀{0.09-98 Ø4.96}
85% sRGB (Argyll 1.6.3 3D)
55% AdobeRGB 1998 (Argyll 1.6.3 3D)
62% AdobeRGB 1998 (Argyll 3D)
84.8% sRGB (Argyll 3D)
64.8% Display P3 (Argyll 3D)
Gamma: 2.49
CCT: 6572 K
| Dell Latitude 14 E5470 LP140WF3, 1920x1080, 14" | Dell Latitude 14 E5470 LG Philips LGD04B1 140WHU, 1366x768, 14" | HP ProBook 440 G4-Y8B51EA AUO1E3D, 1920x1080, 14" | Lenovo ThinkPad T460-20FN003LGE Lenovo LEN40A9 / N140HCE-EAA, 1920x1080, 14" | Acer TravelMate P648-M-757N AU Optronics B140HAN02.1, 1920x1080, 14" | |
|---|---|---|---|---|---|
| Display | -33% | -37% | -31% | -41% | |
| Display P3 Coverage (%) | 64.8 | 40.06 -38% | 37.6 -42% | 42.09 -35% | 35.53 -45% |
| sRGB Coverage (%) | 84.8 | 60.3 -29% | 56.6 -33% | 62 -27% | 53.3 -37% |
| AdobeRGB 1998 Coverage (%) | 62 | 41.42 -33% | 38.85 -37% | 43.6 -30% | 36.72 -41% |
| Response Times | -29% | -3% | -2% | -5% | |
| Response Time Grey 50% / Grey 80% * (ms) | 39 ? | 56.8 ? -46% | 43.2 ? -11% | 42.4 ? -9% | 44 ? -13% |
| Response Time Black / White * (ms) | 26 ? | 28.8 ? -11% | 24.4 ? 6% | 24.8 ? 5% | 25 ? 4% |
| PWM Frequency (Hz) | |||||
| Screen | -73% | -57% | -35% | 5% | |
| Brightness middle (cd/m²) | 323 | 229 -29% | 216 -33% | 230 -29% | 254 -21% |
| Brightness (cd/m²) | 316 | 207 -34% | 203 -36% | 216 -32% | 243 -23% |
| Brightness Distribution (%) | 79 | 80 1% | 83 5% | 85 8% | 90 14% |
| Black Level * (cd/m²) | 0.57 | 0.69 -21% | 0.47 18% | 0.26 54% | 0.19 67% |
| Contrast (:1) | 567 | 332 -41% | 460 -19% | 885 56% | 1337 136% |
| Colorchecker dE 2000 * | 3.68 | 10.16 -176% | 8.98 -144% | 7.32 -99% | 4.93 -34% |
| Colorchecker dE 2000 max. * | 8.33 | 17.18 -106% | 14.07 -69% | 18.14 -118% | 10.14 -22% |
| Greyscale dE 2000 * | 2.99 | 10.87 -264% | 9.61 -221% | 6.98 -133% | 2.71 9% |
| Gamma | 2.49 88% | 2.41 91% | 2.63 84% | 2.5 88% | 2.36 93% |
| CCT | 6572 99% | 12881 50% | 11265 58% | 6683 97% | 6914 94% |
| Color Space (Percent of AdobeRGB 1998) (%) | 55 | 38.4 -30% | 35.9 -35% | 39.97 -27% | 34 -38% |
| Color Space (Percent of sRGB) (%) | 85 | 60.4 -29% | 56.7 -33% | 61.55 -28% | 53 -38% |
| Media totale (Programma / Settaggio) | -45% /
-59% | -32% /
-46% | -23% /
-30% | -14% /
-5% |
* ... Meglio usare valori piccoli
Tempi di risposta del Display
| ↔ Tempi di risposta dal Nero al Bianco | ||
|---|---|---|
| 26 ms ... aumenta ↗ e diminuisce ↘ combinato | ↗ 5 ms Incremento | 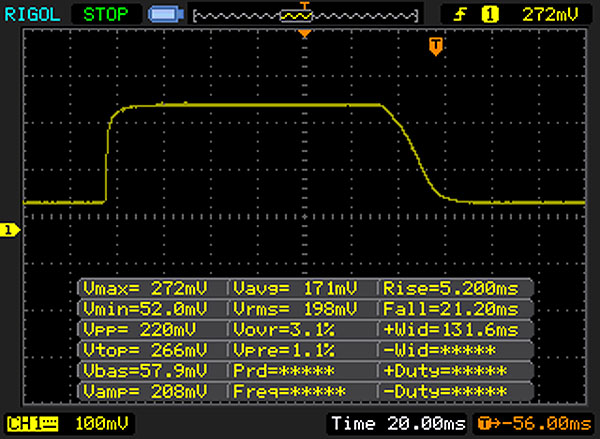 |
| ↘ 21 ms Calo | ||
| Lo schermo mostra tempi di risposta relativamente lenti nei nostri tests e potrebbe essere troppo lento per i gamers. In confronto, tutti i dispositivi di test variano da 0.1 (minimo) a 240 (massimo) ms. » 63 % di tutti i dispositivi è migliore. Questo significa che i tempi di risposta rilevati sono peggiori rispetto alla media di tutti i dispositivi testati (19.8 ms). | ||
| ↔ Tempo di risposta dal 50% Grigio all'80% Grigio | ||
| 39 ms ... aumenta ↗ e diminuisce ↘ combinato | ↗ 15 ms Incremento | 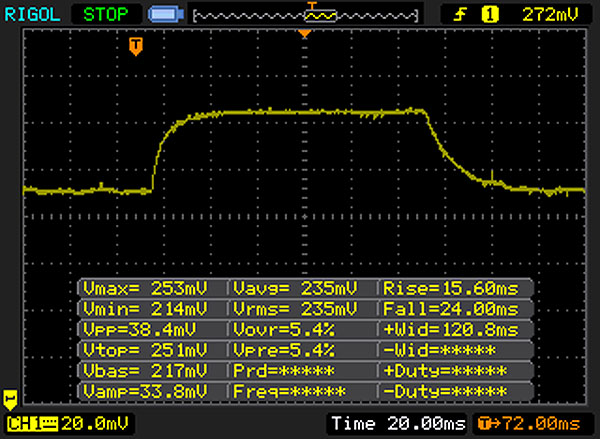 |
| ↘ 24 ms Calo | ||
| Lo schermo mostra tempi di risposta lenti nei nostri tests e sarà insoddisfacente per i gamers. In confronto, tutti i dispositivi di test variano da 0.165 (minimo) a 636 (massimo) ms. » 59 % di tutti i dispositivi è migliore. Questo significa che i tempi di risposta rilevati sono peggiori rispetto alla media di tutti i dispositivi testati (30.9 ms). | ||
Sfarfallio dello schermo / PWM (Pulse-Width Modulation)
| flickering dello schermo / PWM non rilevato | ||
In confronto: 52 % di tutti i dispositivi testati non utilizza PWM per ridurre la luminosita' del display. Se è rilevato PWM, una media di 7744 (minimo: 5 - massimo: 343500) Hz è stata rilevata. | ||
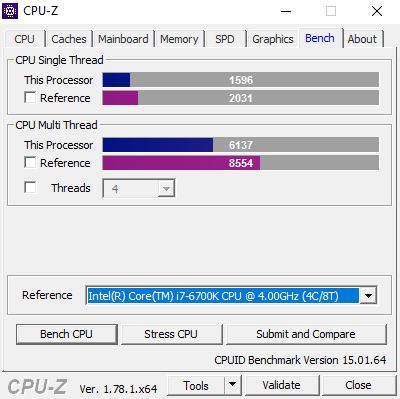
| Cinebench R11.5 | |
| CPU Multi 64Bit | |
| Dell Latitude 14 E5470 | |
| HP ProBook 440 G4-Y8B51EA | |
| Dell Latitude 14 E5470 | |
| Acer TravelMate P648-M-757N | |
| CPU Single 64Bit | |
| HP ProBook 440 G4-Y8B51EA | |
| Dell Latitude 14 E5470 | |
| Dell Latitude 14 E5470 | |
| Acer TravelMate P648-M-757N | |
| Cinebench R10 | |
| Rendering Multiple CPUs 64Bit | |
| Dell Latitude 14 E5470 | |
| Dell Latitude 14 E5470 | |
| Rendering Single CPUs 64Bit | |
| Dell Latitude 14 E5470 | |
| Dell Latitude 14 E5470 | |
| JetStream 1.1 - 1.1 Total | |
| Dell Latitude 14 E5470 | |
| HP ProBook 440 G4-Y8B51EA | |
| Lenovo ThinkPad T460-20FN003LGE | |
| Acer TravelMate P648-M-757N | |
| Octane V2 - Total Score | |
| Dell Latitude 14 E5470 | |
| HP ProBook 440 G4-Y8B51EA | |
| Dell Latitude 14 E5470 | |
| Lenovo ThinkPad T460-20FN003LGE | |
| Acer TravelMate P648-M-757N | |
| Mozilla Kraken 1.1 - Total | |
| Acer TravelMate P648-M-757N | |
| Lenovo ThinkPad T460-20FN003LGE | |
| Dell Latitude 14 E5470 | |
| Dell Latitude 14 E5470 | |
| HP ProBook 440 G4-Y8B51EA | |
* ... Meglio usare valori piccoli
| PCMark 8 | |
| Home Score Accelerated v2 | |
| HP ProBook 440 G4-Y8B51EA | |
| Acer TravelMate P648-M-757N | |
| Dell Latitude 14 E5470 | |
| Dell Latitude 14 E5470 | |
| Lenovo ThinkPad T460-20FN003LGE | |
| Work Score Accelerated v2 | |
| HP ProBook 440 G4-Y8B51EA | |
| Dell Latitude 14 E5470 | |
| Dell Latitude 14 E5470 | |
| Acer TravelMate P648-M-757N | |
| Lenovo ThinkPad T460-20FN003LGE | |
| Creative Score Accelerated v2 | |
| HP ProBook 440 G4-Y8B51EA | |
| Dell Latitude 14 E5470 | |
| Dell Latitude 14 E5470 | |
| Acer TravelMate P648-M-757N | |
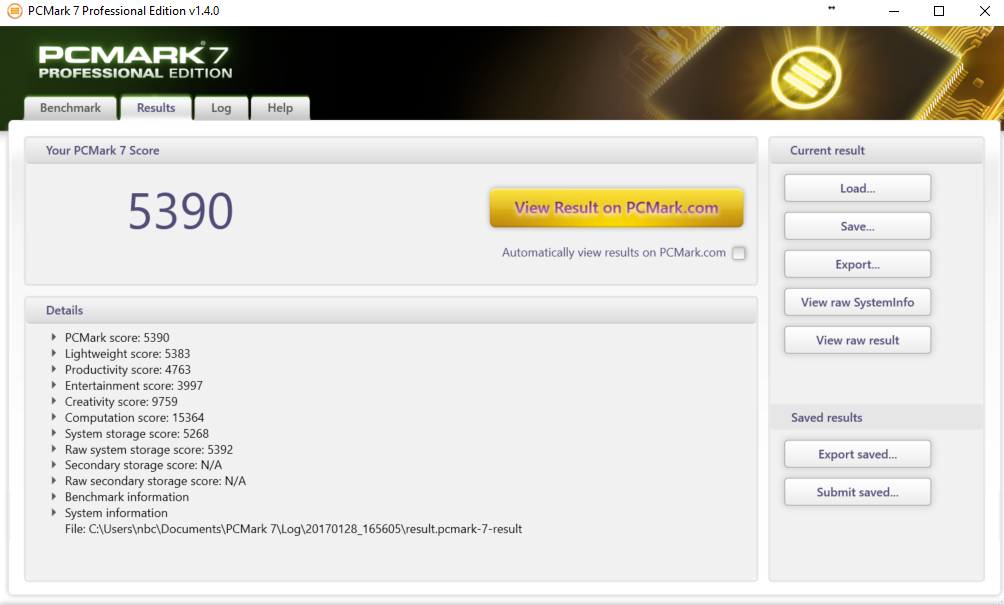
| PCMark 7 Score | 5390 punti | |
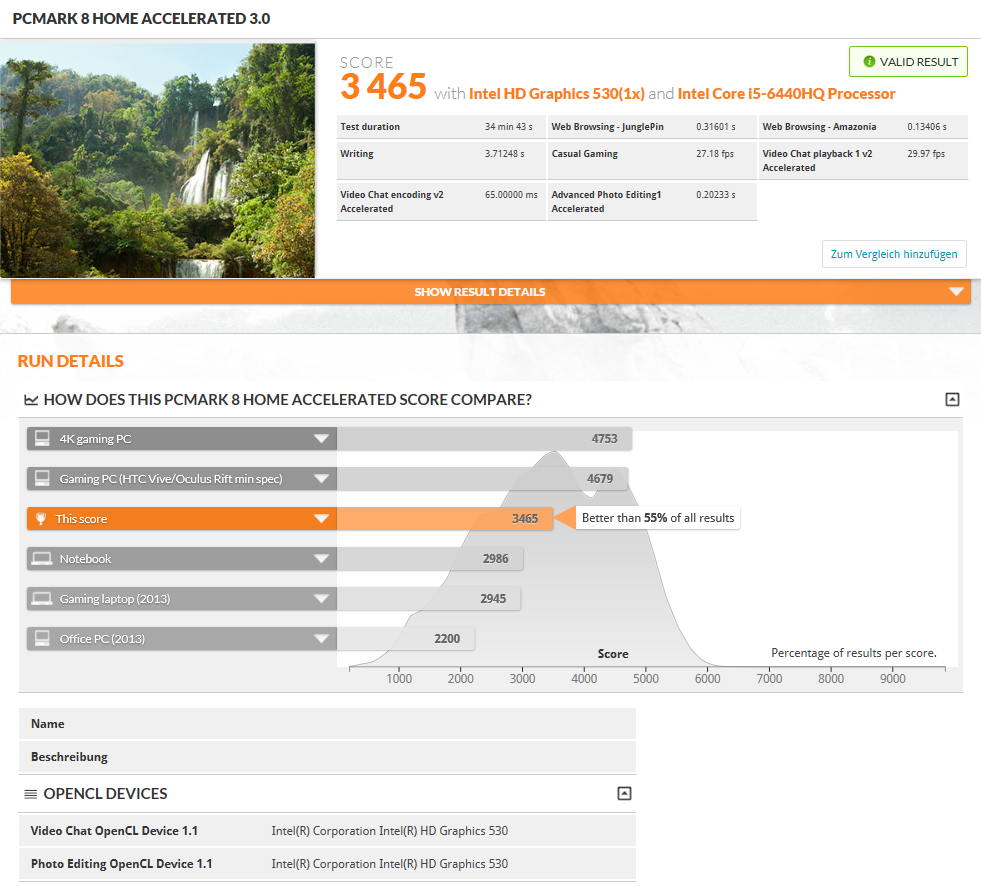
| PCMark 8 Home Score Accelerated v2 | 3465 punti | |
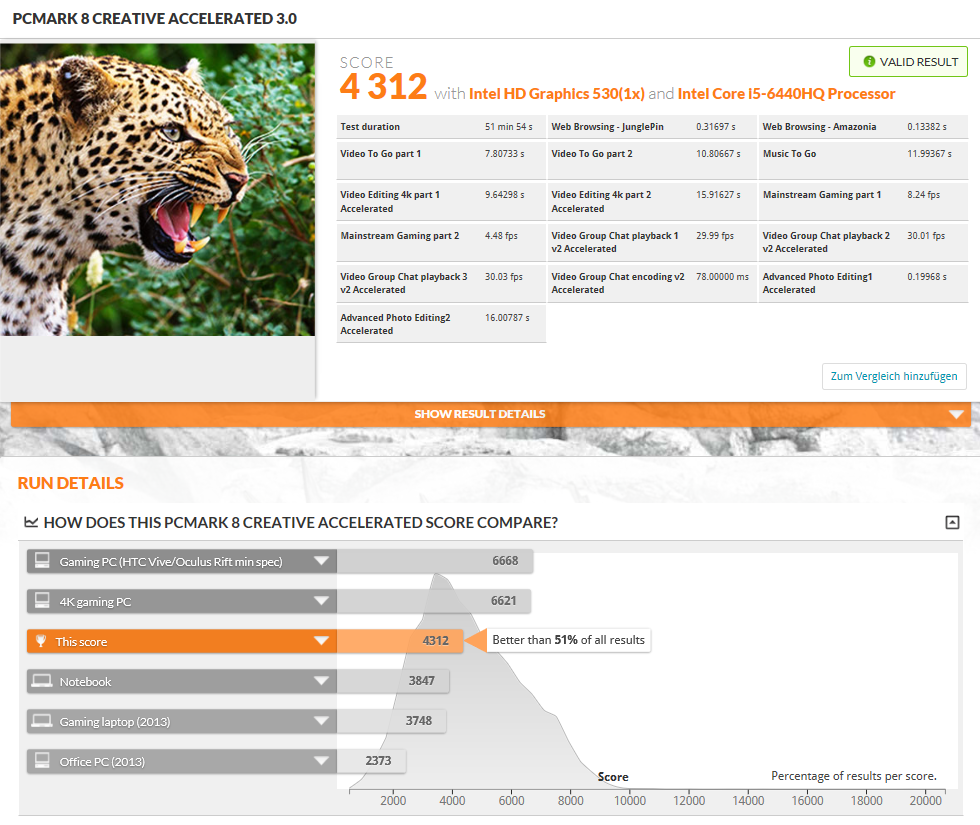
| PCMark 8 Creative Score Accelerated v2 | 4312 punti | |
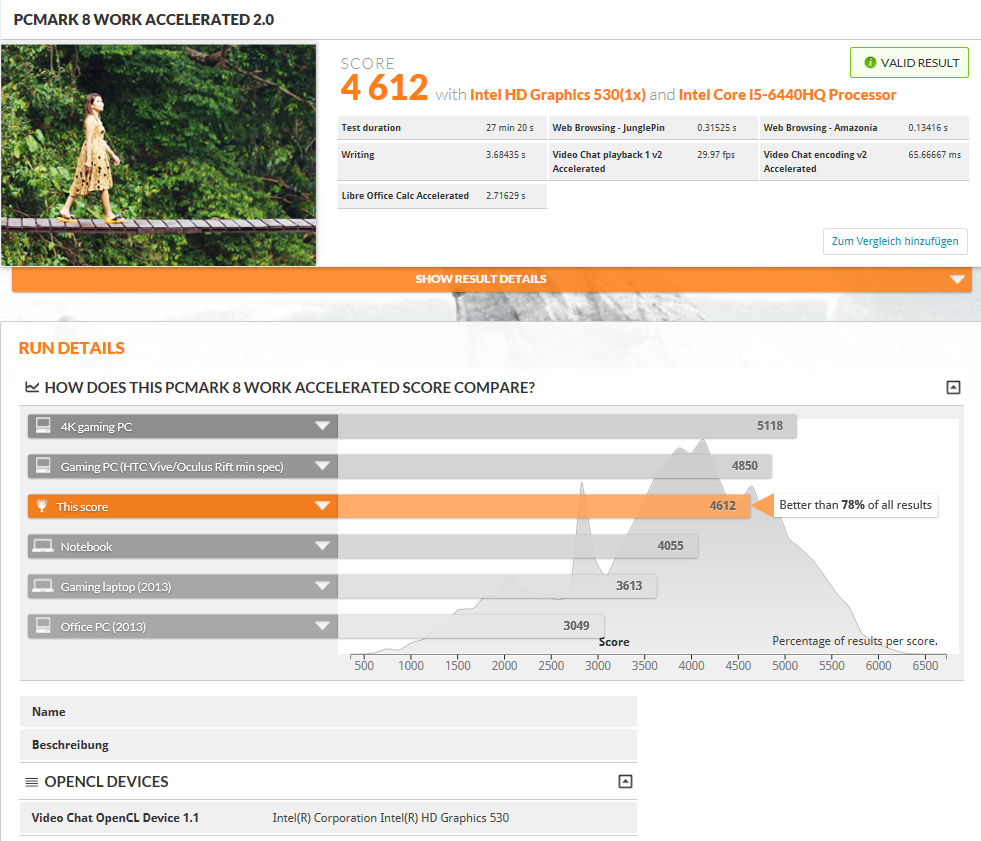
| PCMark 8 Work Score Accelerated v2 | 4612 punti | |
Aiuto | ||
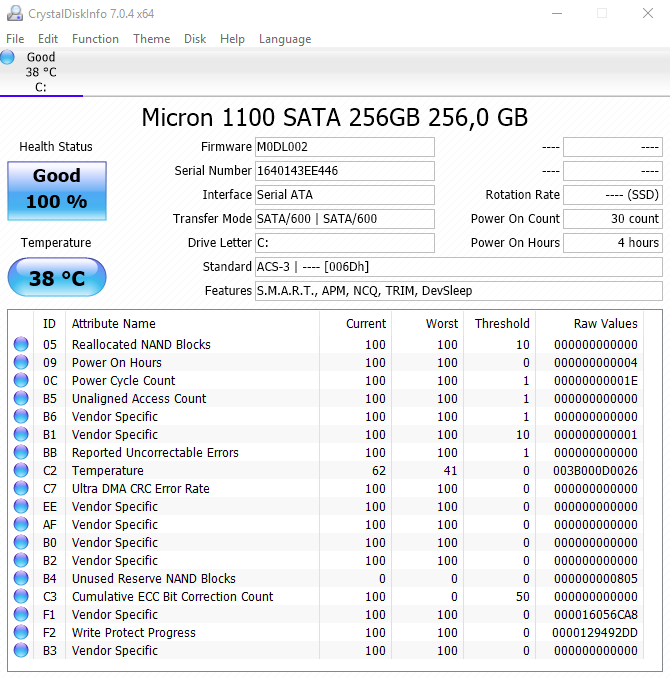
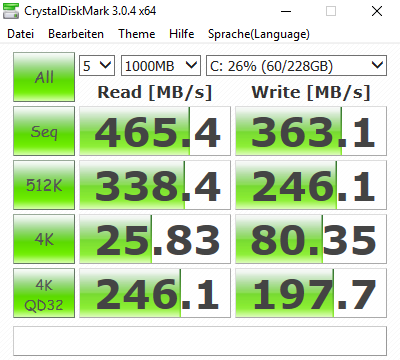
| Dell Latitude 14 E5470 Micron SSD 1100 (MTFDDAV256TBN) | Dell Latitude 14 E5470 Liteon L8H-256V2G | HP ProBook 440 G4-Y8B51EA SanDisk SD8SNAT256G1002 | Lenovo ThinkPad T460-20FN003LGE Toshiba HG6 THNSFJ256GCSU | Acer TravelMate P648-M-757N Lite-On CV1-8B256 | |
|---|---|---|---|---|---|
| CrystalDiskMark 3.0 | 12% | -6% | 6% | 13% | |
| Read Seq (MB/s) | 465.4 | 508 9% | 491.2 6% | 458.9 -1% | 531 14% |
| Write Seq (MB/s) | 363.1 | 360.6 -1% | 322.2 -11% | 394.4 9% | 358.8 -1% |
| Read 512 (MB/s) | 338.4 | 374.1 11% | 310.1 -8% | 371.3 10% | 384.8 14% |
| Write 512 (MB/s) | 246.1 | 300.2 22% | 276 12% | 232.7 -5% | 363 48% |
| Read 4k (MB/s) | 25.83 | 31.98 24% | 19.57 -24% | 21.7 -16% | 31.3 21% |
| Write 4k (MB/s) | 80.3 | 93.1 16% | 77.8 -3% | 72.9 -9% | 80.3 0% |
| Read 4k QD32 (MB/s) | 246.1 | 274.7 12% | 146.3 -41% | 369.9 50% | 239.4 -3% |
| Write 4k QD32 (MB/s) | 197.7 | 205.6 4% | 241.4 22% | 216 9% | 225.3 14% |


| 3DMark | |
| 1280x720 Cloud Gate Standard Graphics | |
| HP ProBook 440 G4-Y8B51EA | |
| Acer TravelMate P648-M-757N | |
| Dell Latitude 14 E5470 | |
| Dell Latitude 14 E5470 | |
| Lenovo ThinkPad T460-20FN003LGE | |
| 1920x1080 Fire Strike Graphics | |
| HP ProBook 440 G4-Y8B51EA | |
| Acer TravelMate P648-M-757N | |
| Dell Latitude 14 E5470 | |
| Dell Latitude 14 E5470 | |
| 3DMark 11 - 1280x720 Performance GPU | |
| HP ProBook 440 G4-Y8B51EA | |
| Dell Latitude 14 E5470 | |
| Dell Latitude 14 E5470 | |
| Acer TravelMate P648-M-757N | |
| Lenovo ThinkPad T460-20FN003LGE | |
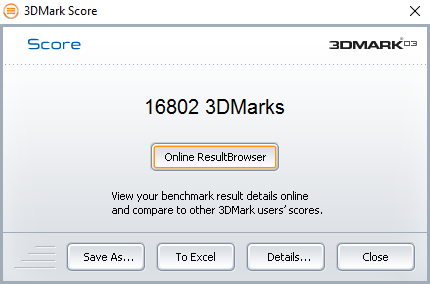
| 3DMark 03 Standard | 16802 punti | |
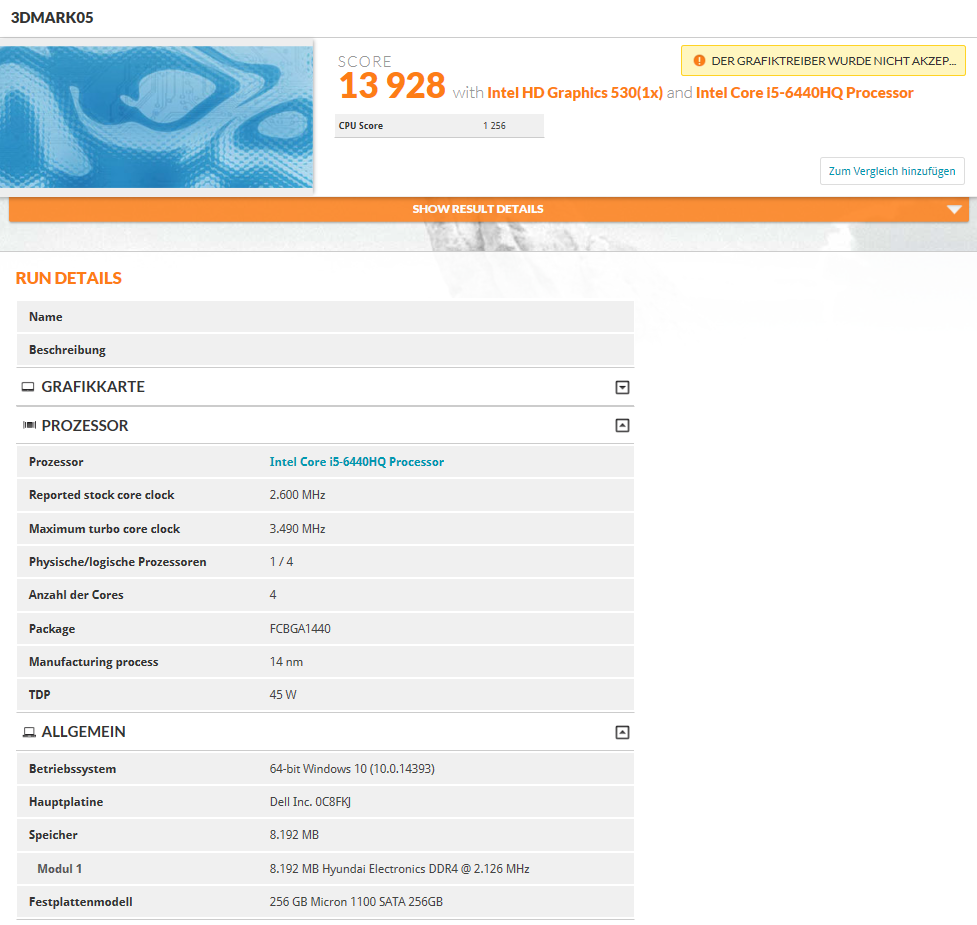
| 3DMark 05 Standard | 13920 punti | |
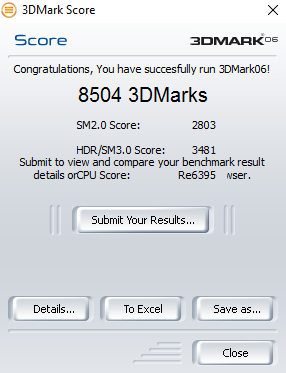
| 3DMark 06 Standard Score | 8504 punti | |
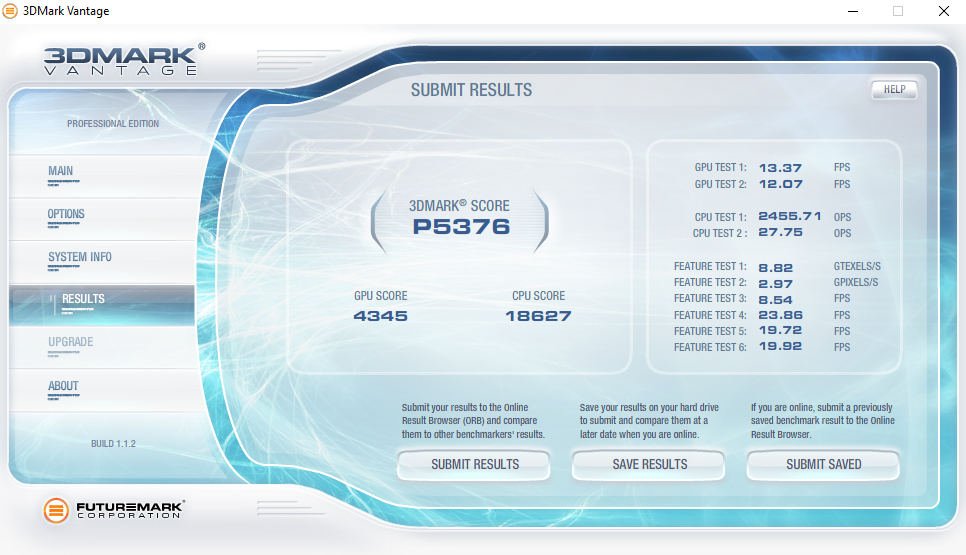
| 3DMark Vantage P Result | 5376 punti | |
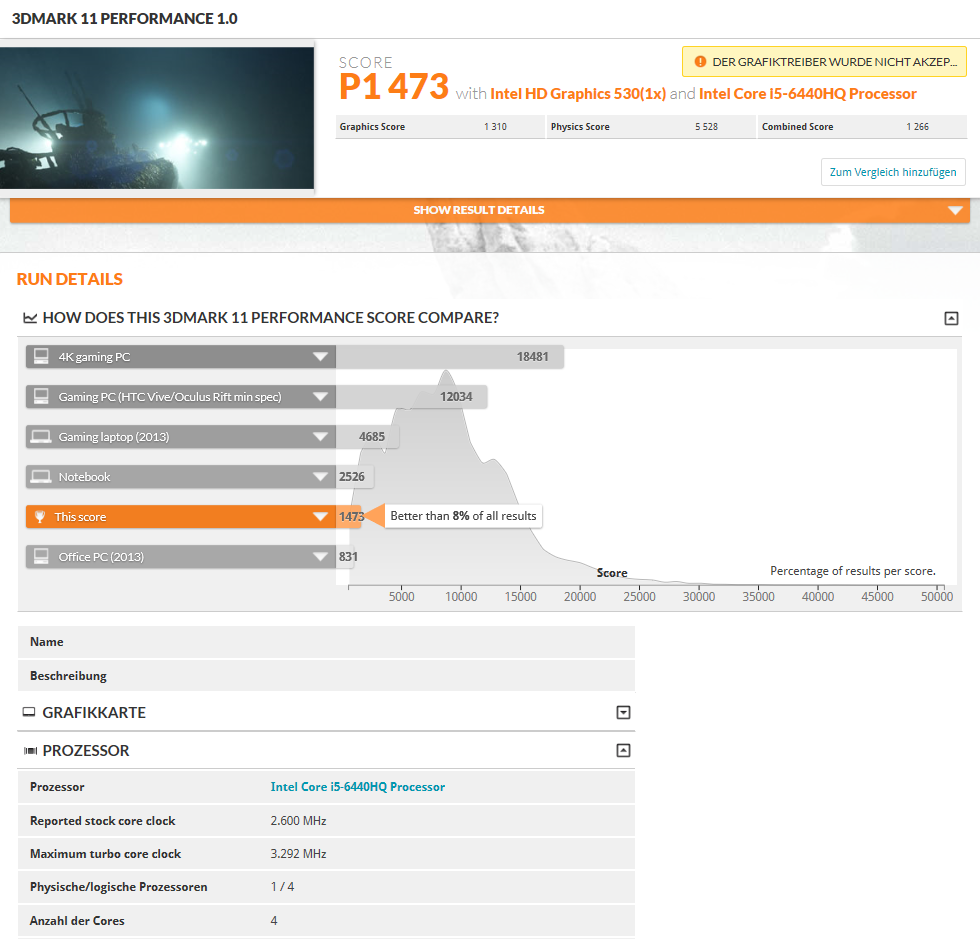
| 3DMark 11 Performance | 1473 punti | |
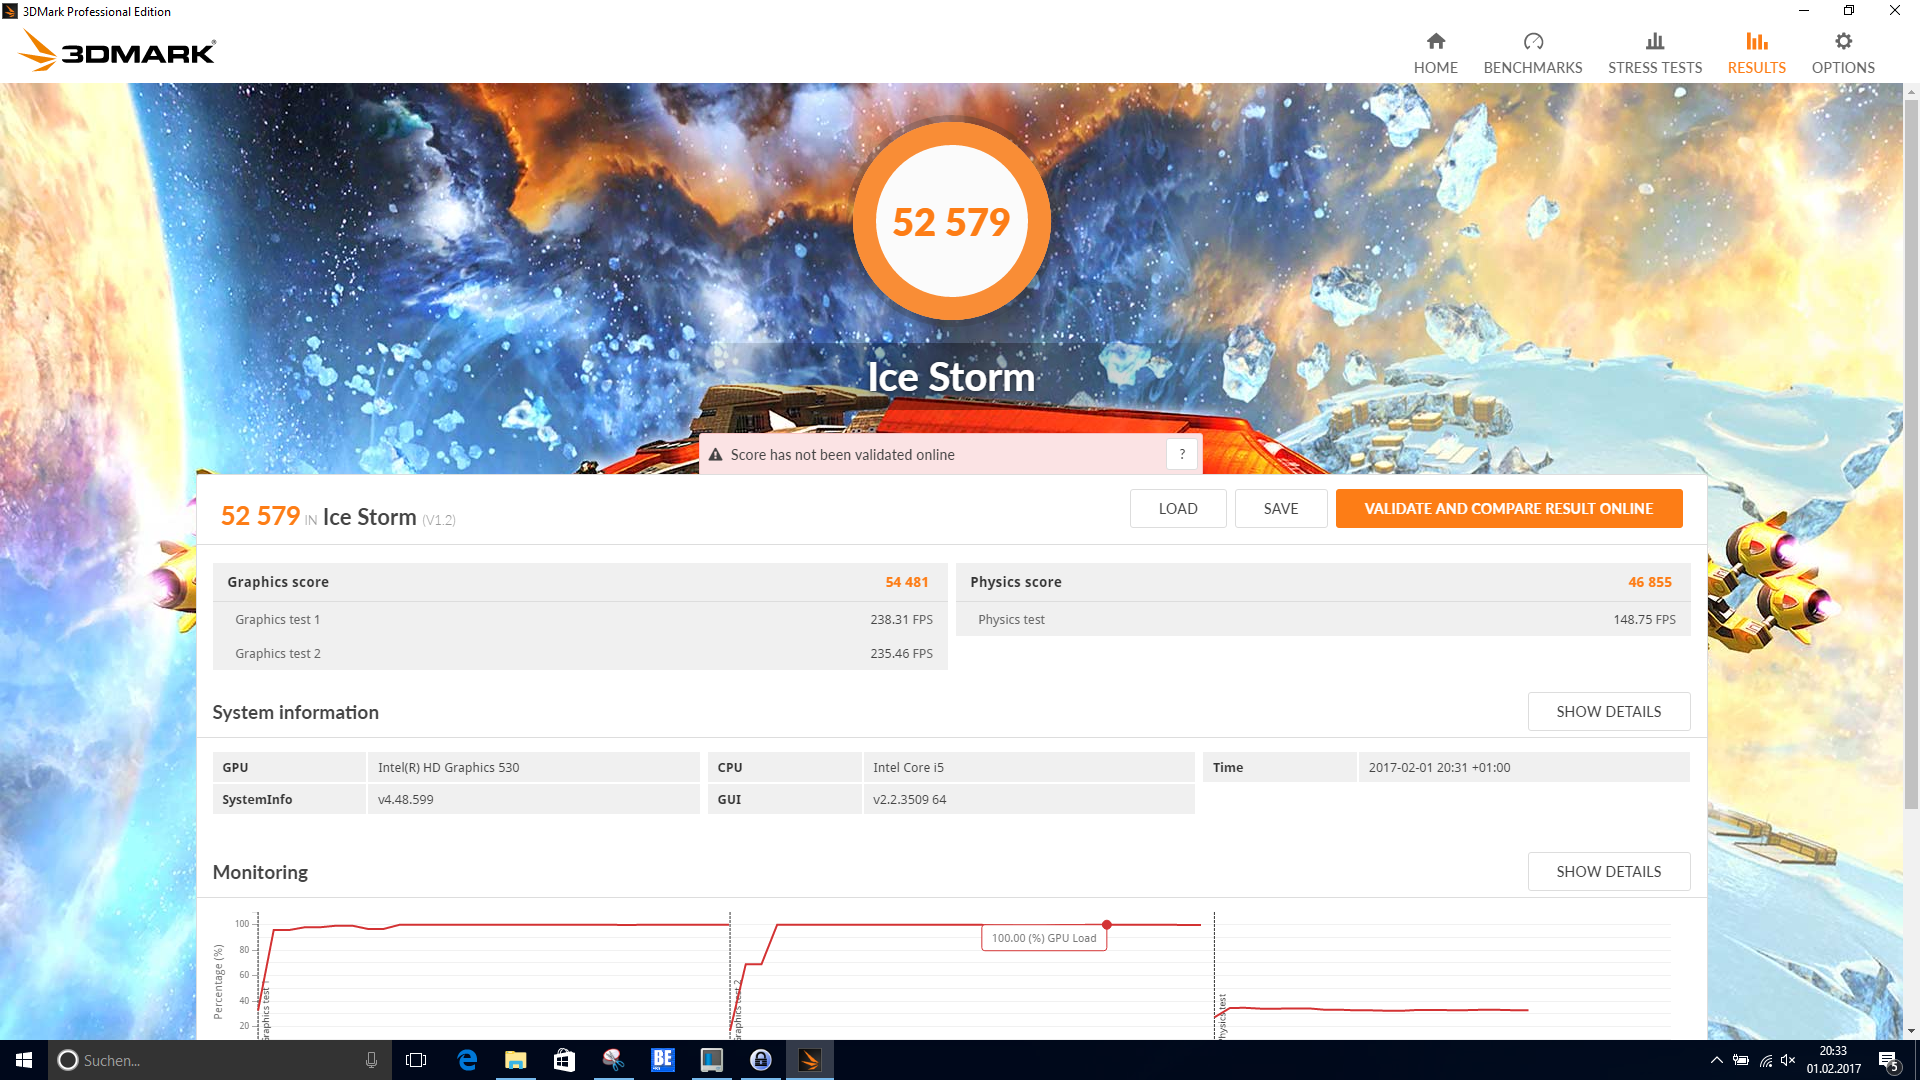
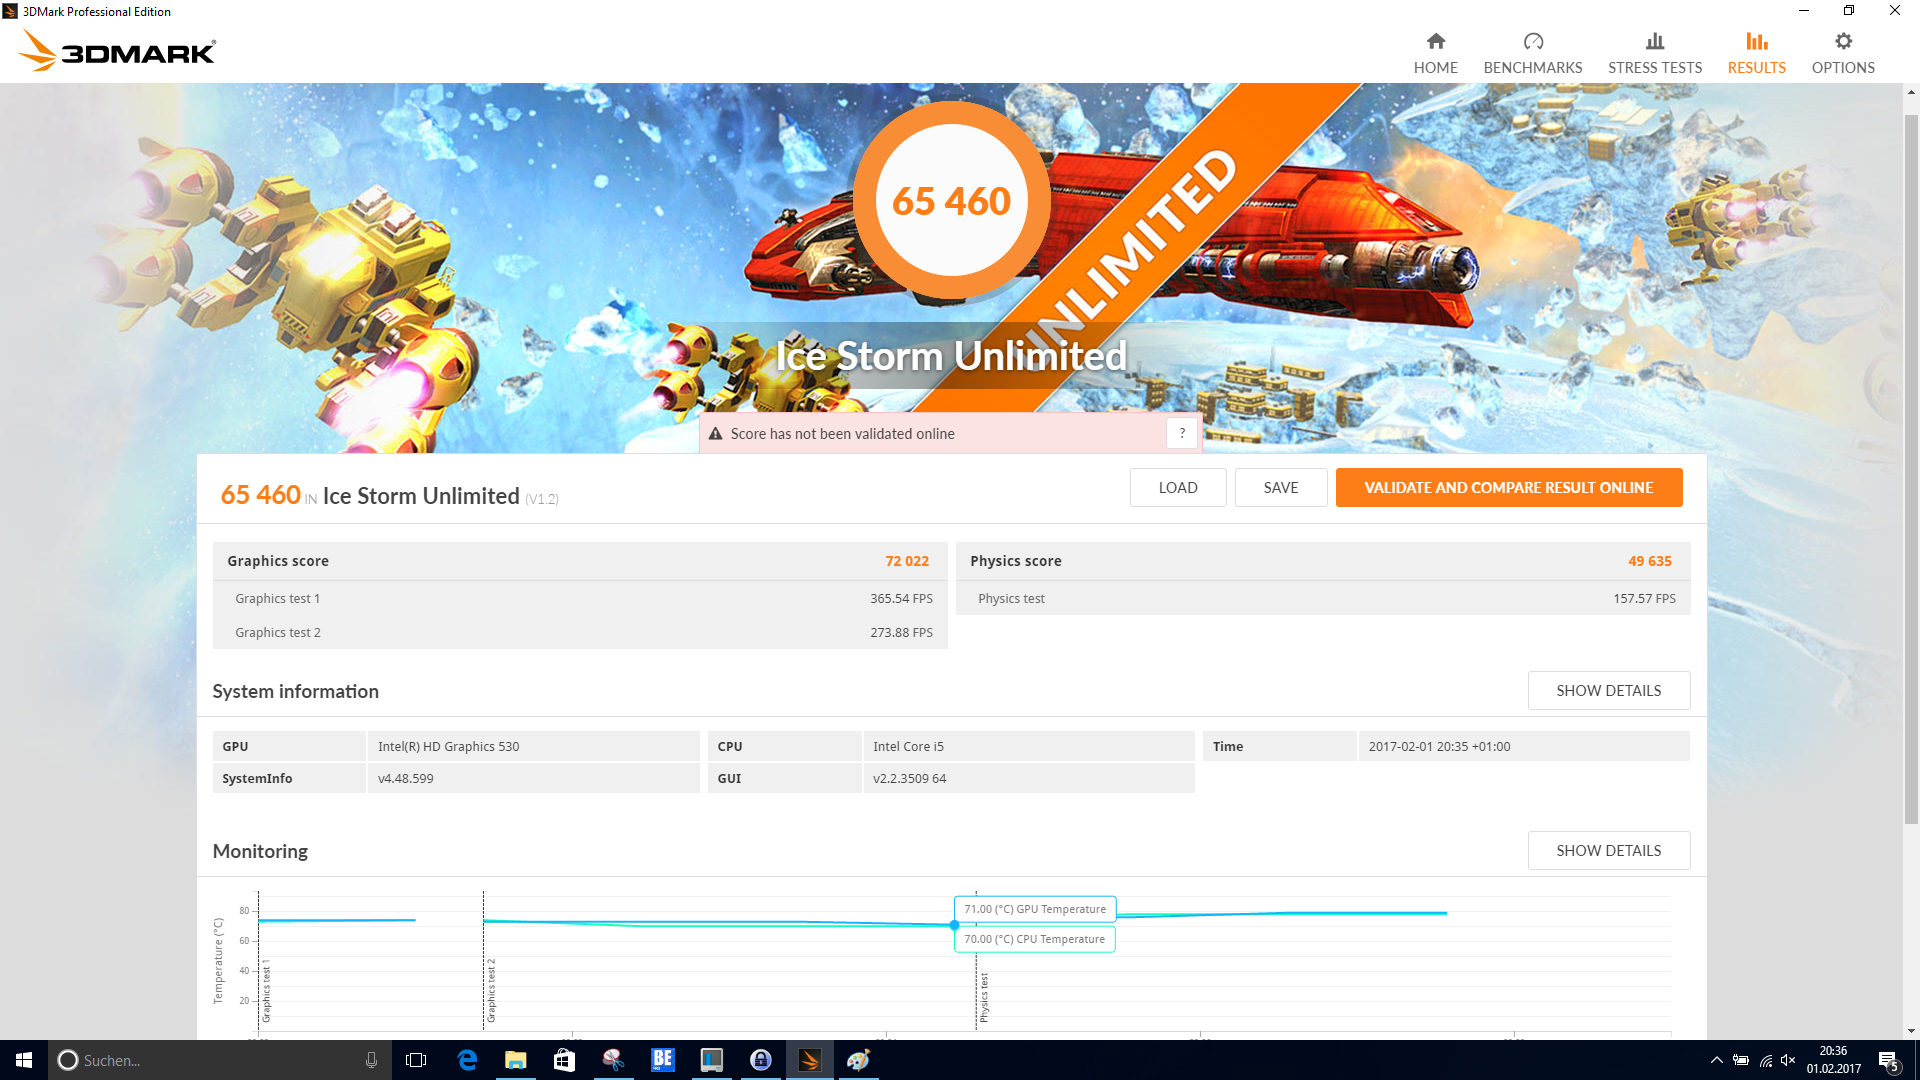
| 3DMark Ice Storm Standard Score | 52579 punti | |
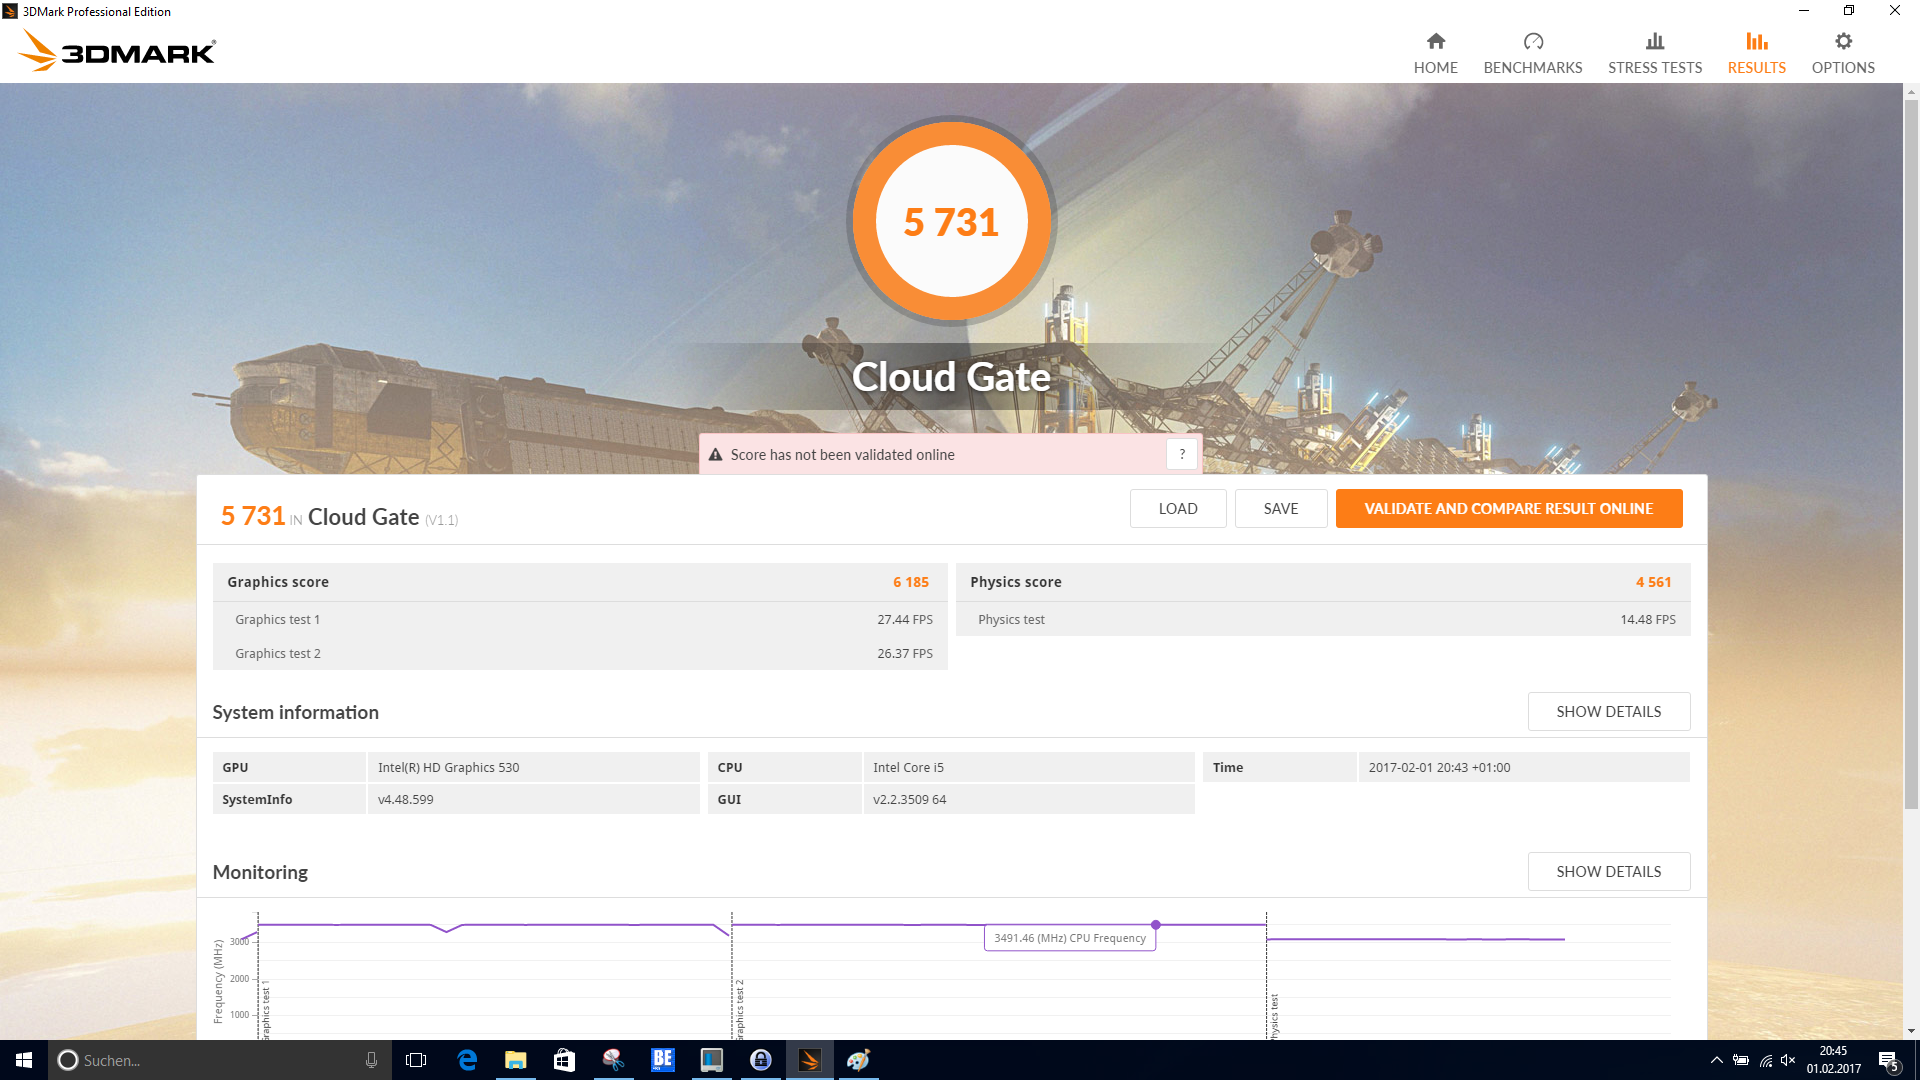
| 3DMark Cloud Gate Standard Score | 5731 punti | |
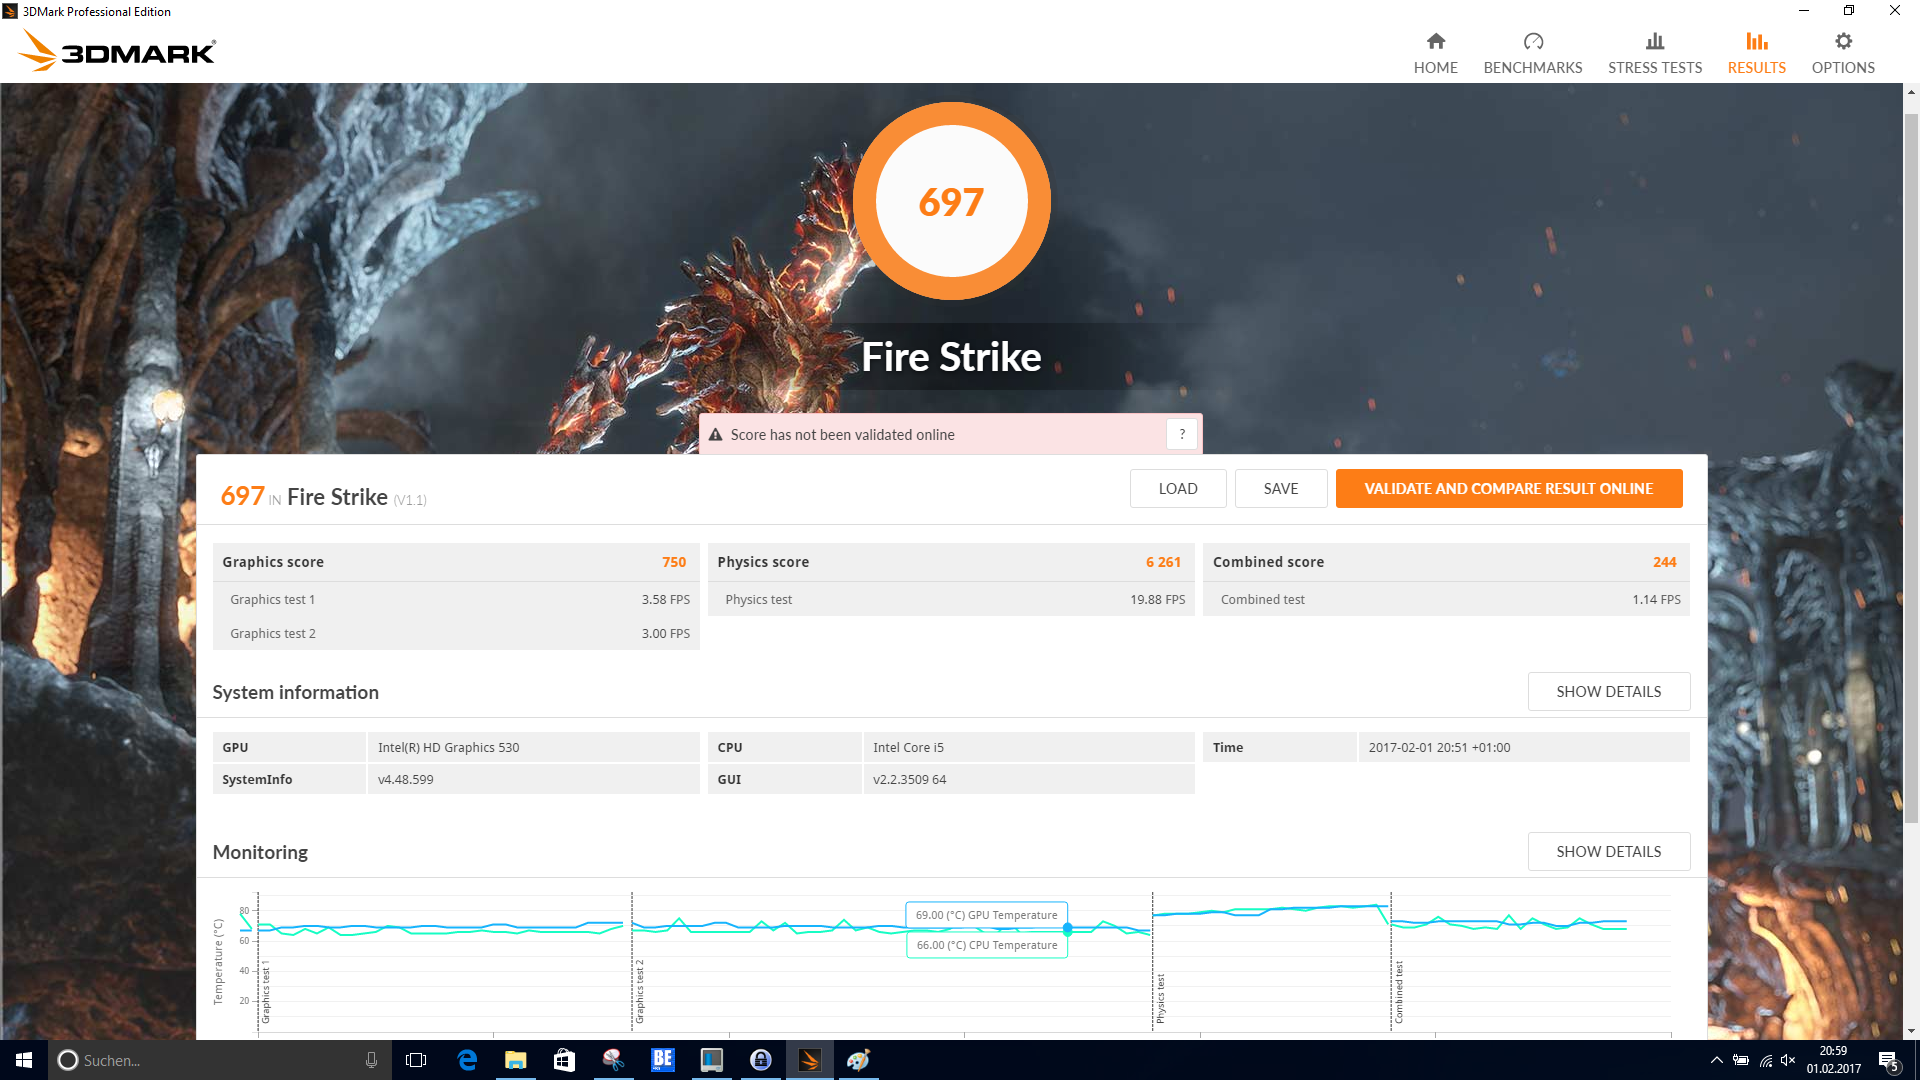
| 3DMark Fire Strike Score | 697 punti | |
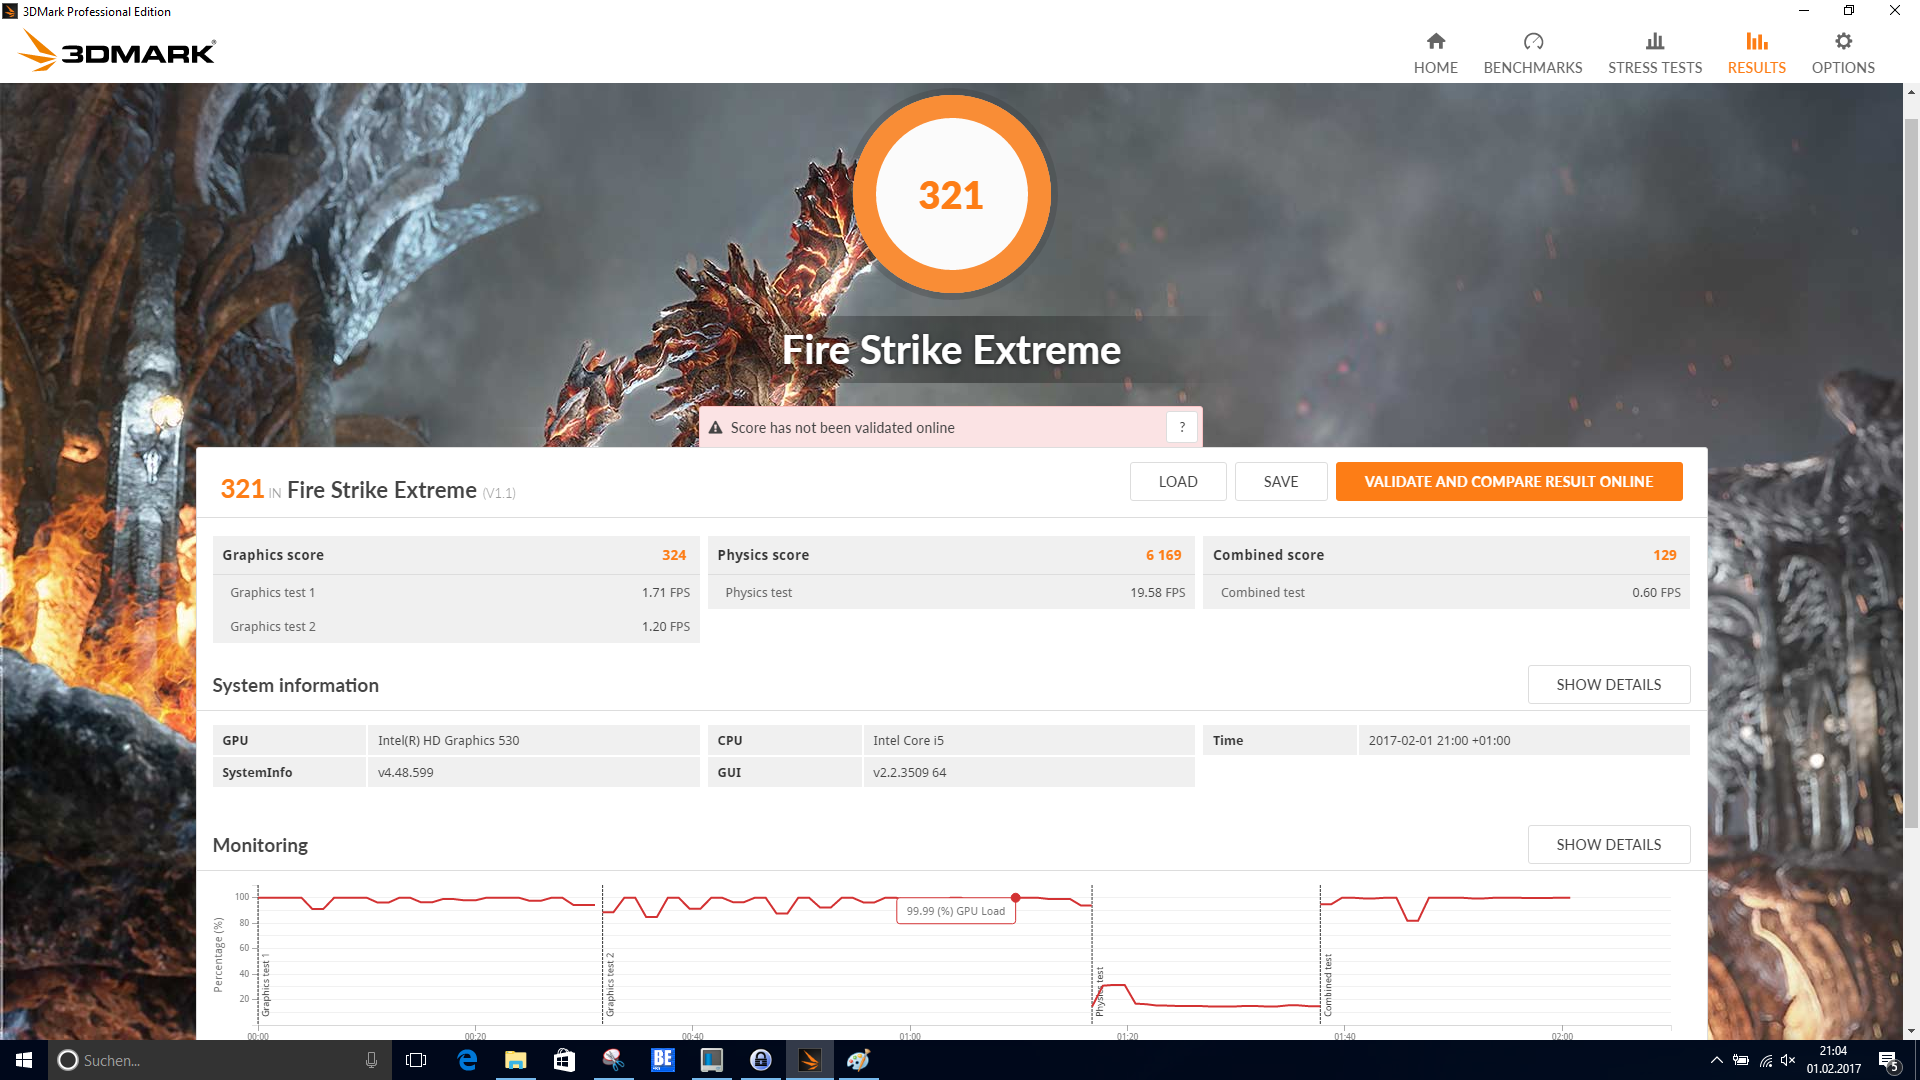
| 3DMark Fire Strike Extreme Score | 321 punti | |
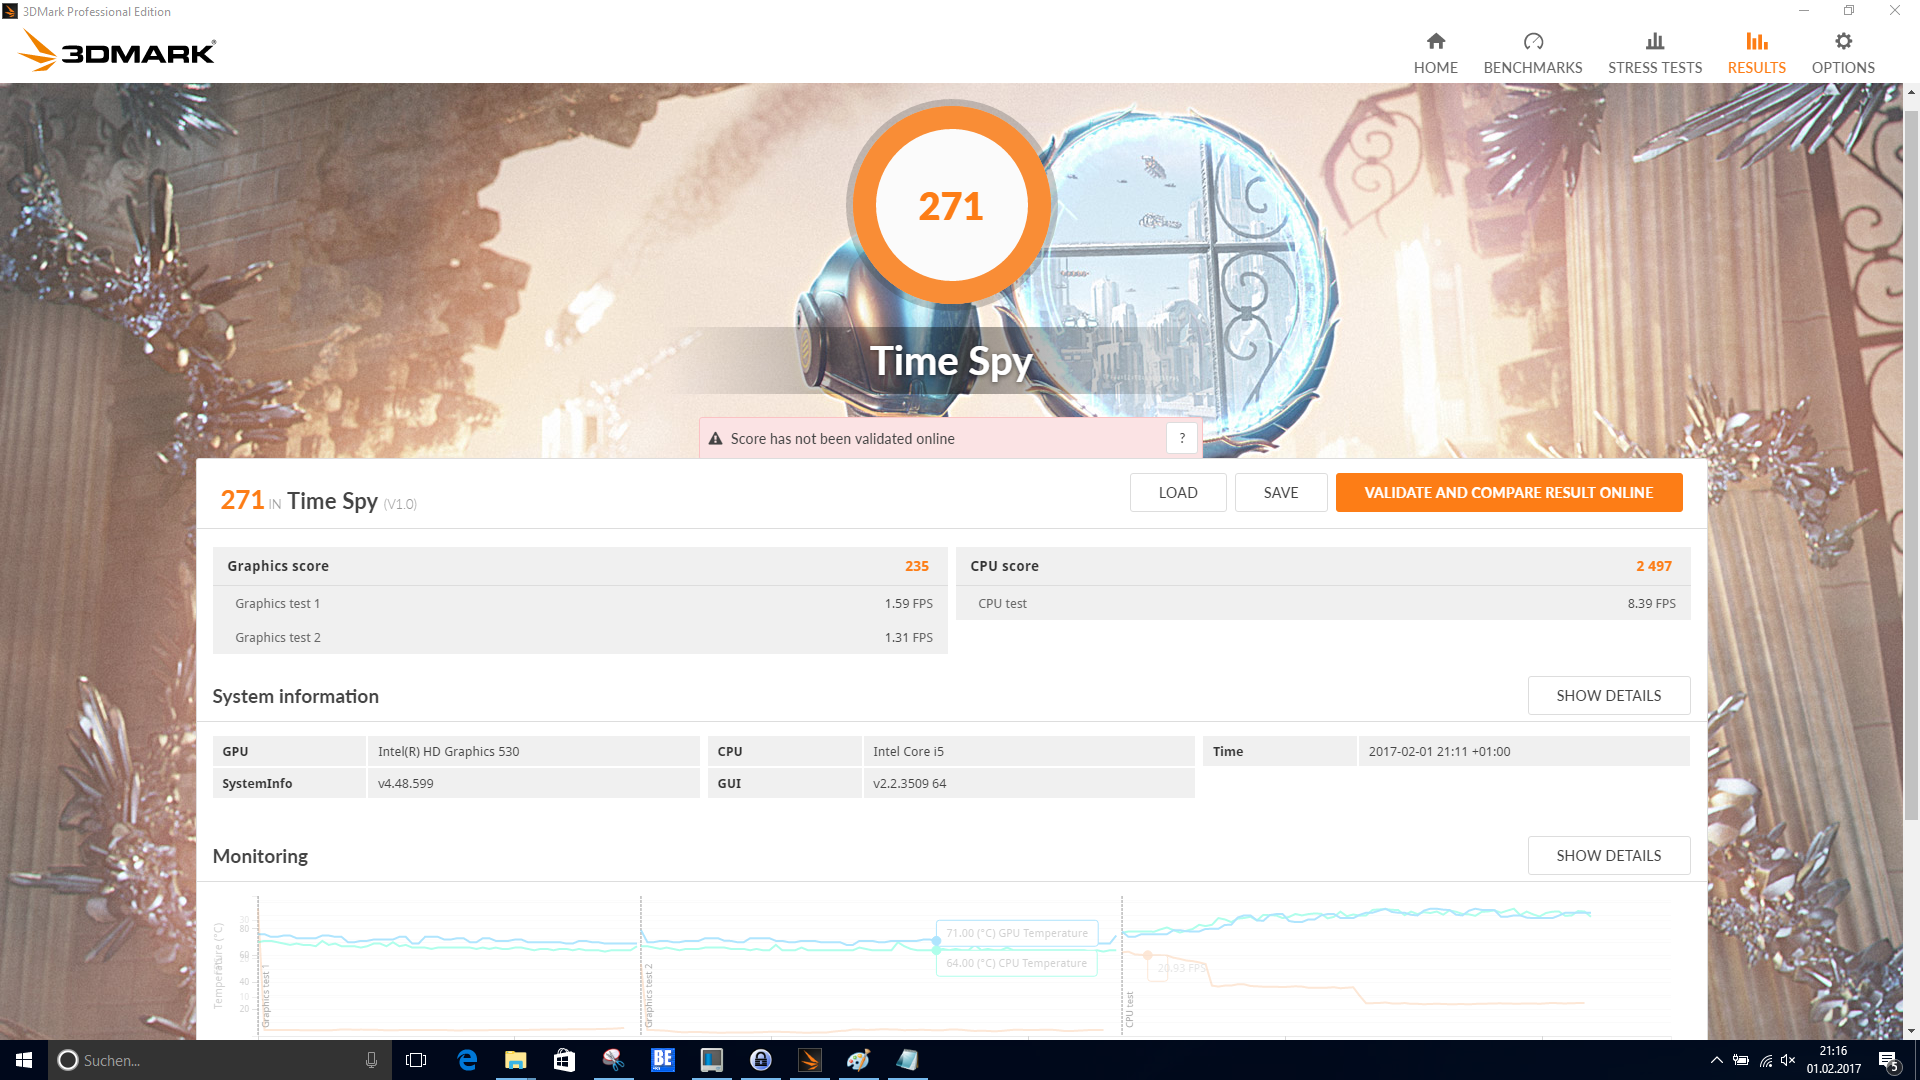
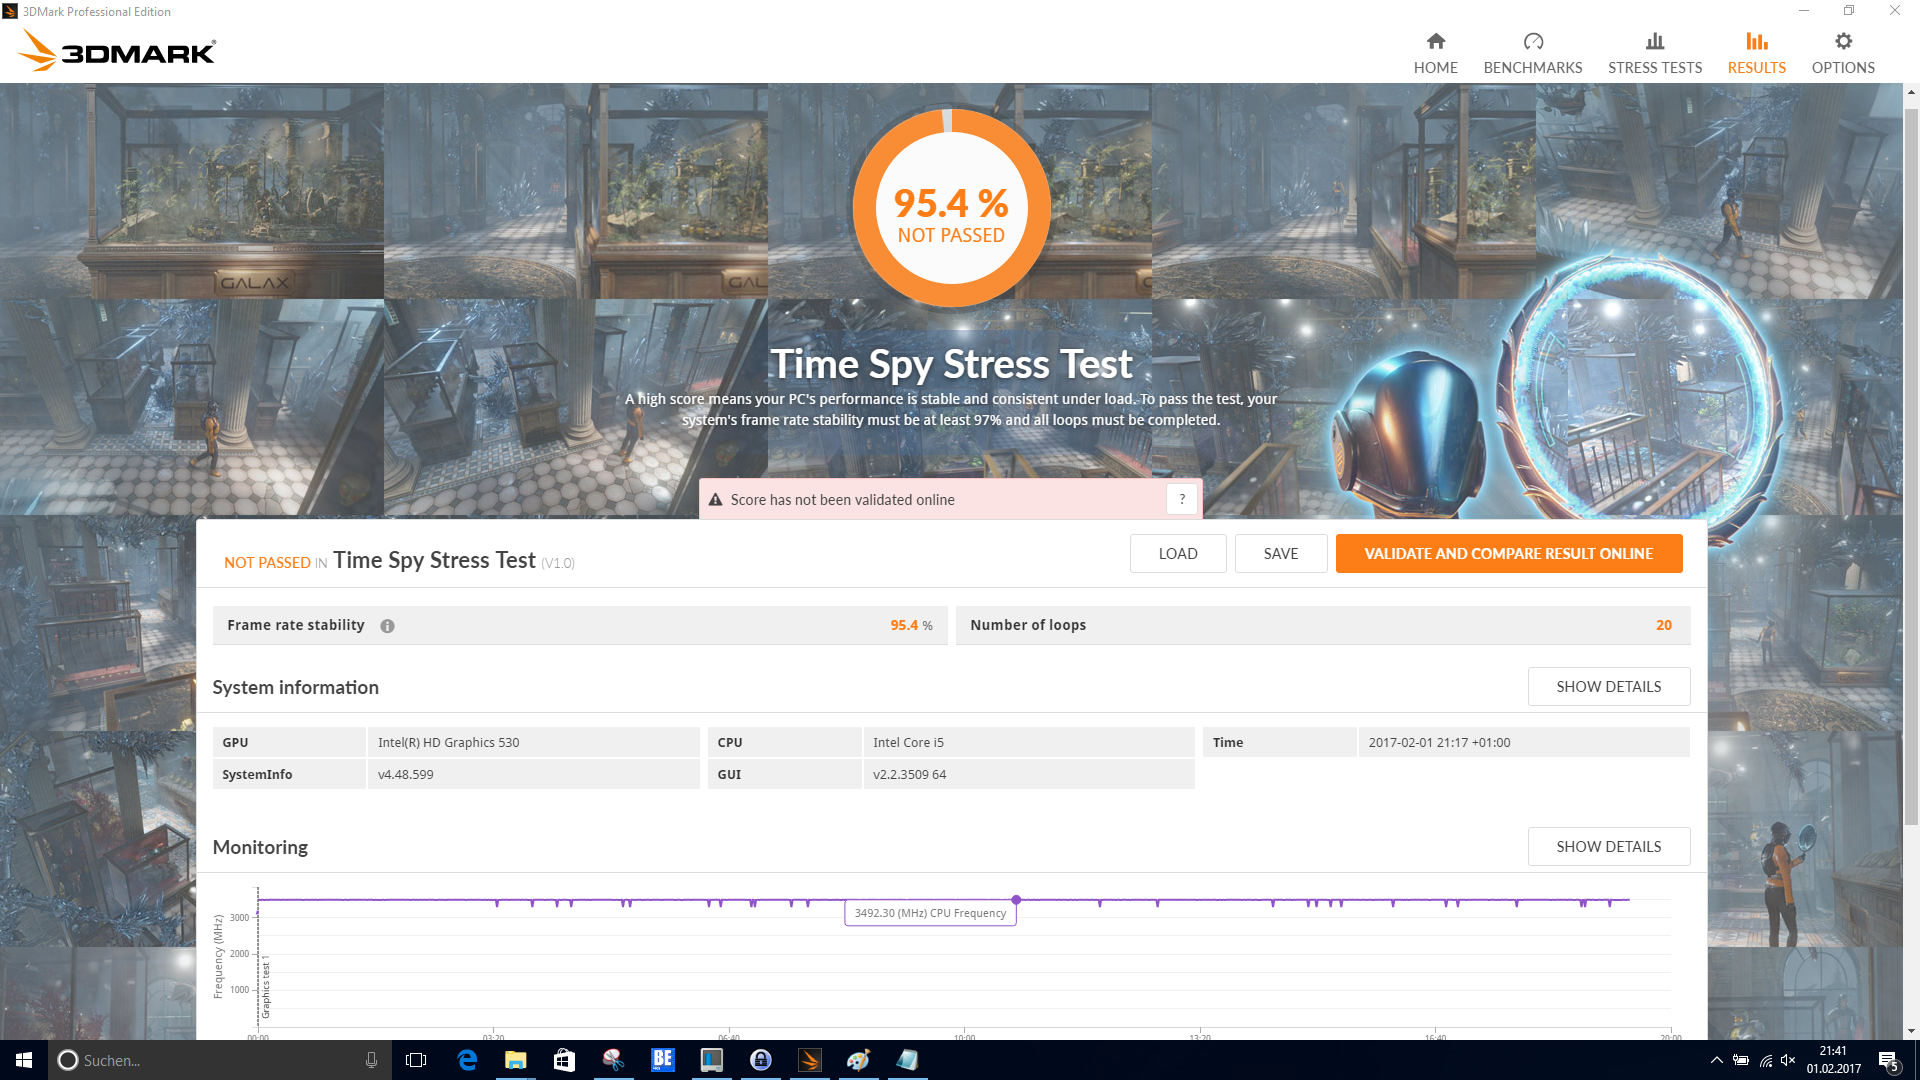
| 3DMark Time Spy Score | 271 punti | |
Aiuto | ||
| BioShock Infinite - 1366x768 Medium Preset | |
| HP ProBook 440 G4-Y8B51EA | |
| Acer TravelMate P648-M-757N | |
| Dell Latitude 14 E5470 | |
| Dell Latitude 14 E5470 | |
| Lenovo ThinkPad T460-20FN003LGE | |
| Battlefield 4 - 1366x768 Medium Preset | |
| HP ProBook 440 G4-Y8B51EA | |
| Dell Latitude 14 E5470 | |
| Acer TravelMate P648-M-757N | |
| Dell Latitude 14 E5470 | |
| Lenovo ThinkPad T460-20FN003LGE | |
| basso | medio | alto | ultra | |
|---|---|---|---|---|
| BioShock Infinite (2013) | 45.6 | 23.7 | 19.5 | 5.5 |
| Battlefield 4 (2013) | 41.2 | 27.8 | 18.3 | 4.9 |
| Rise of the Tomb Raider (2016) | 15 |
Rumorosità
| Idle |
| 30.3 / 30.3 / 30.3 dB(A) |
| Sotto carico |
| 31.6 / 35 dB(A) |
 | ||
30 dB silenzioso 40 dB(A) udibile 50 dB(A) rumoroso |
||
min: | ||
| Dell Latitude 14 E5470 6440HQ, HD Graphics 530 | Dell Latitude 14 E5470 6300U, HD Graphics 520 | HP ProBook 440 G4-Y8B51EA i7-7500U, GeForce 930MX | Lenovo ThinkPad T460-20FN003LGE 6200U, HD Graphics 520 | Acer TravelMate P648-M-757N 6500U, HD Graphics 520 | |
|---|---|---|---|---|---|
| Noise | 2% | -2% | 0% | -2% | |
| off /ambiente * (dB) | 30.3 | 29.2 4% | 29 4% | 29 4% | 31.2 -3% |
| Idle Minimum * (dB) | 30.3 | 29.2 4% | 29 4% | 29 4% | 31.2 -3% |
| Idle Average * (dB) | 30.3 | 29.2 4% | 29 4% | 29 4% | 31.2 -3% |
| Idle Maximum * (dB) | 30.3 | 29.2 4% | 29 4% | 29 4% | 31.6 -4% |
| Load Average * (dB) | 31.6 | 32.1 -2% | 37.4 -18% | 34.2 -8% | 33.3 -5% |
| Load Maximum * (dB) | 35 | 36.8 -5% | 39 -11% | 37.8 -8% | 32.4 7% |
* ... Meglio usare valori piccoli
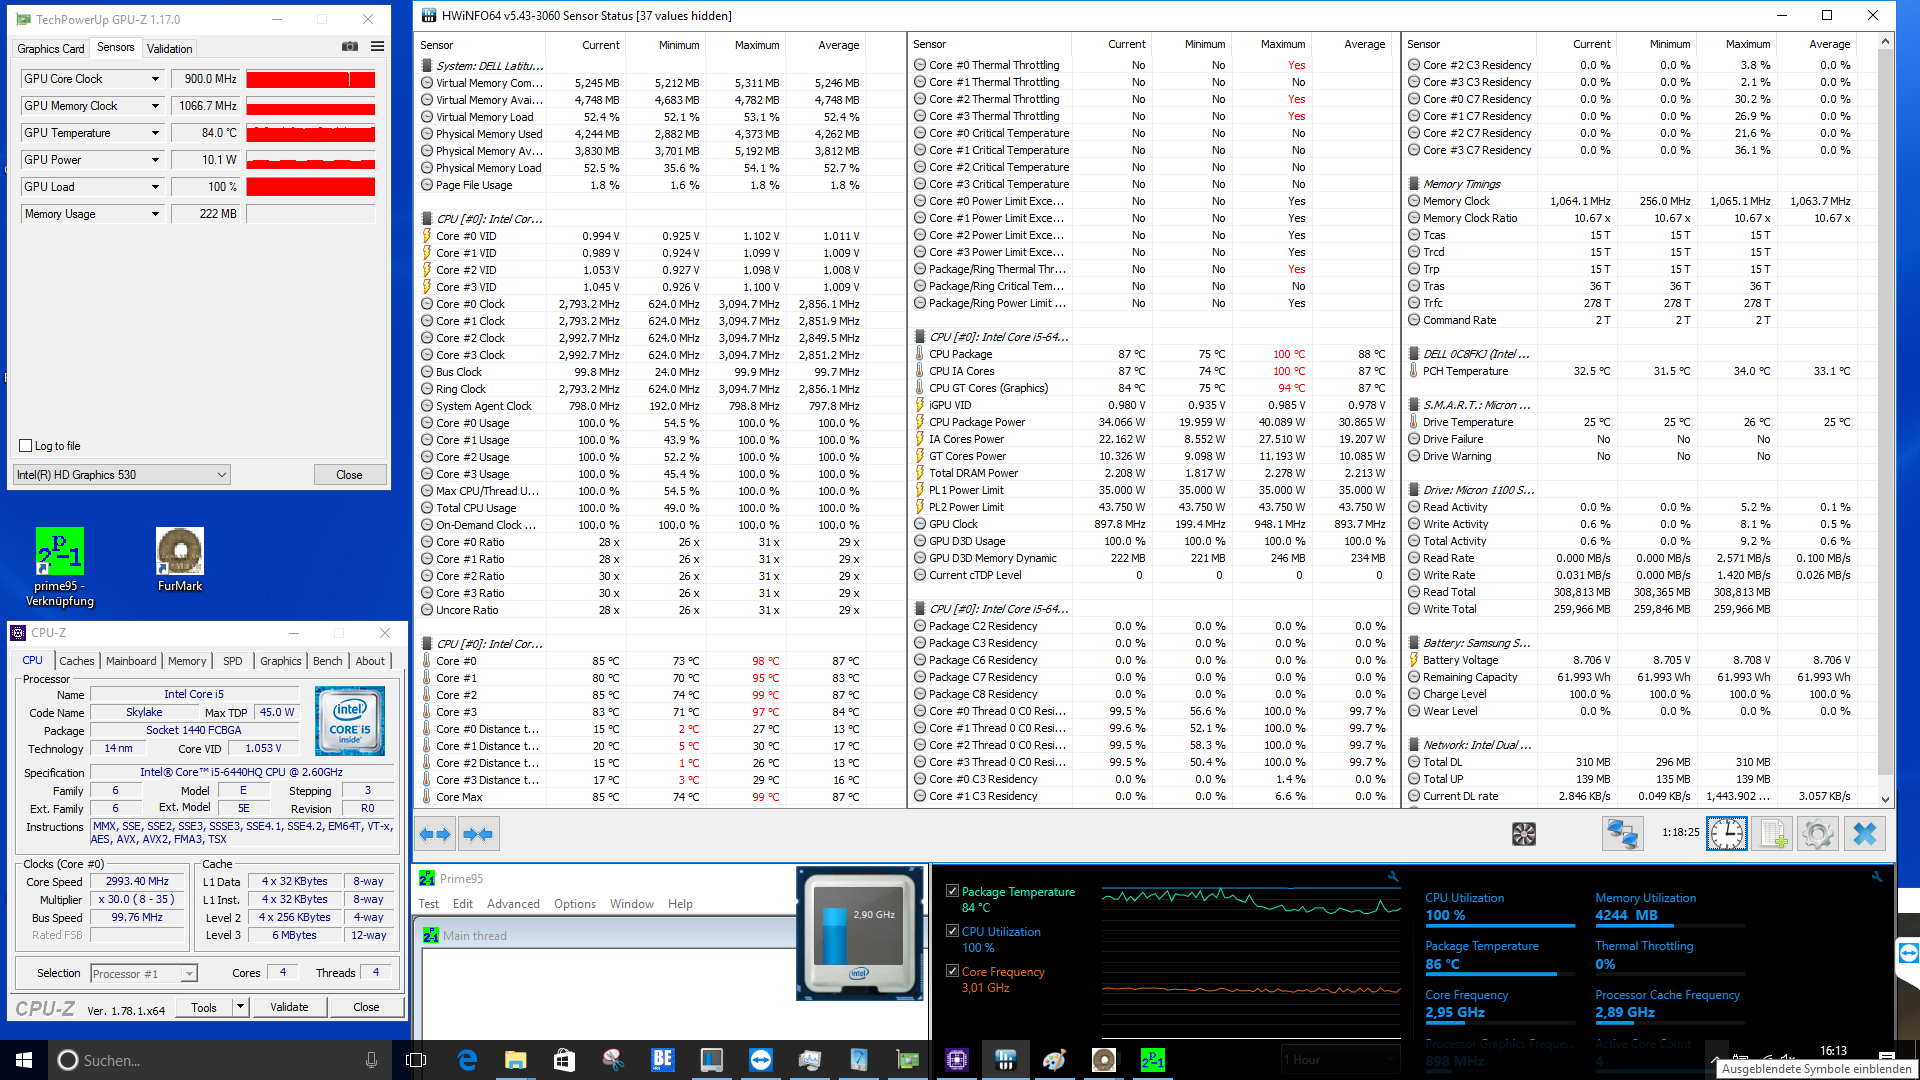
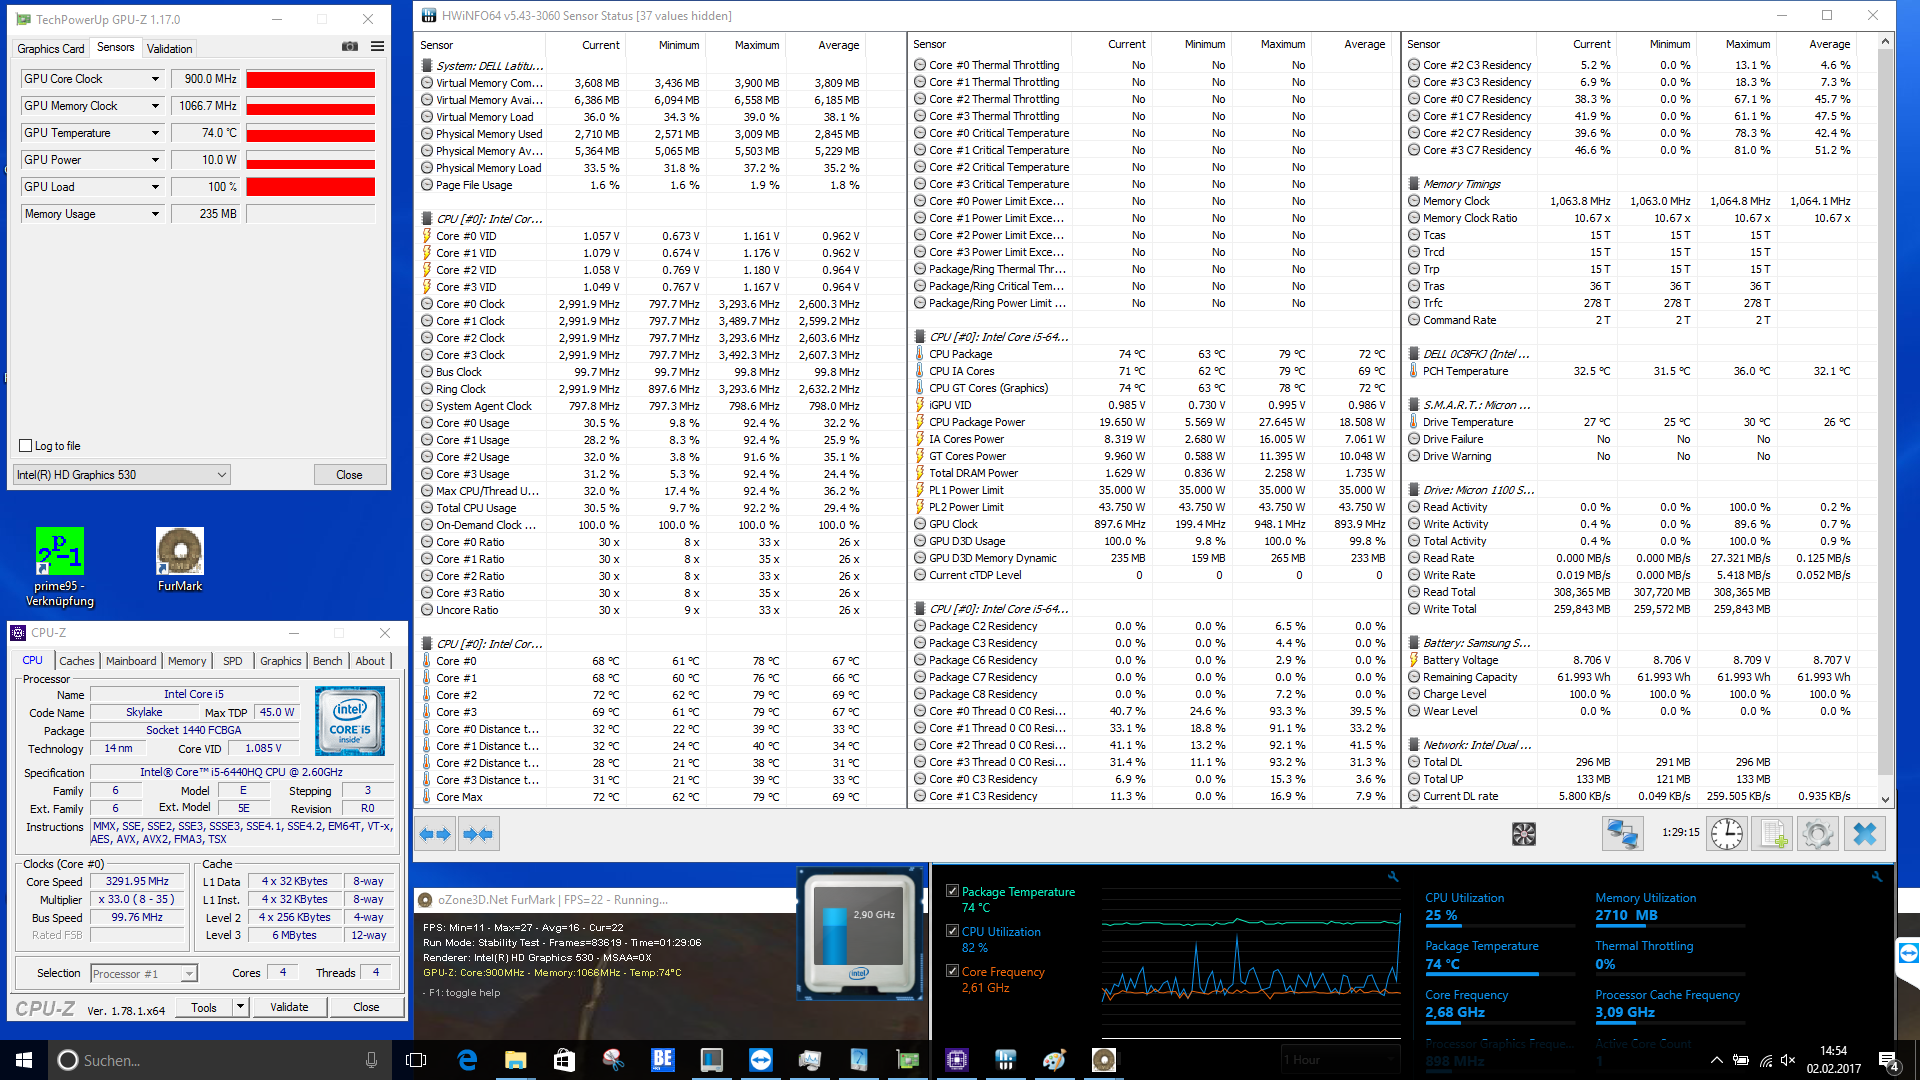
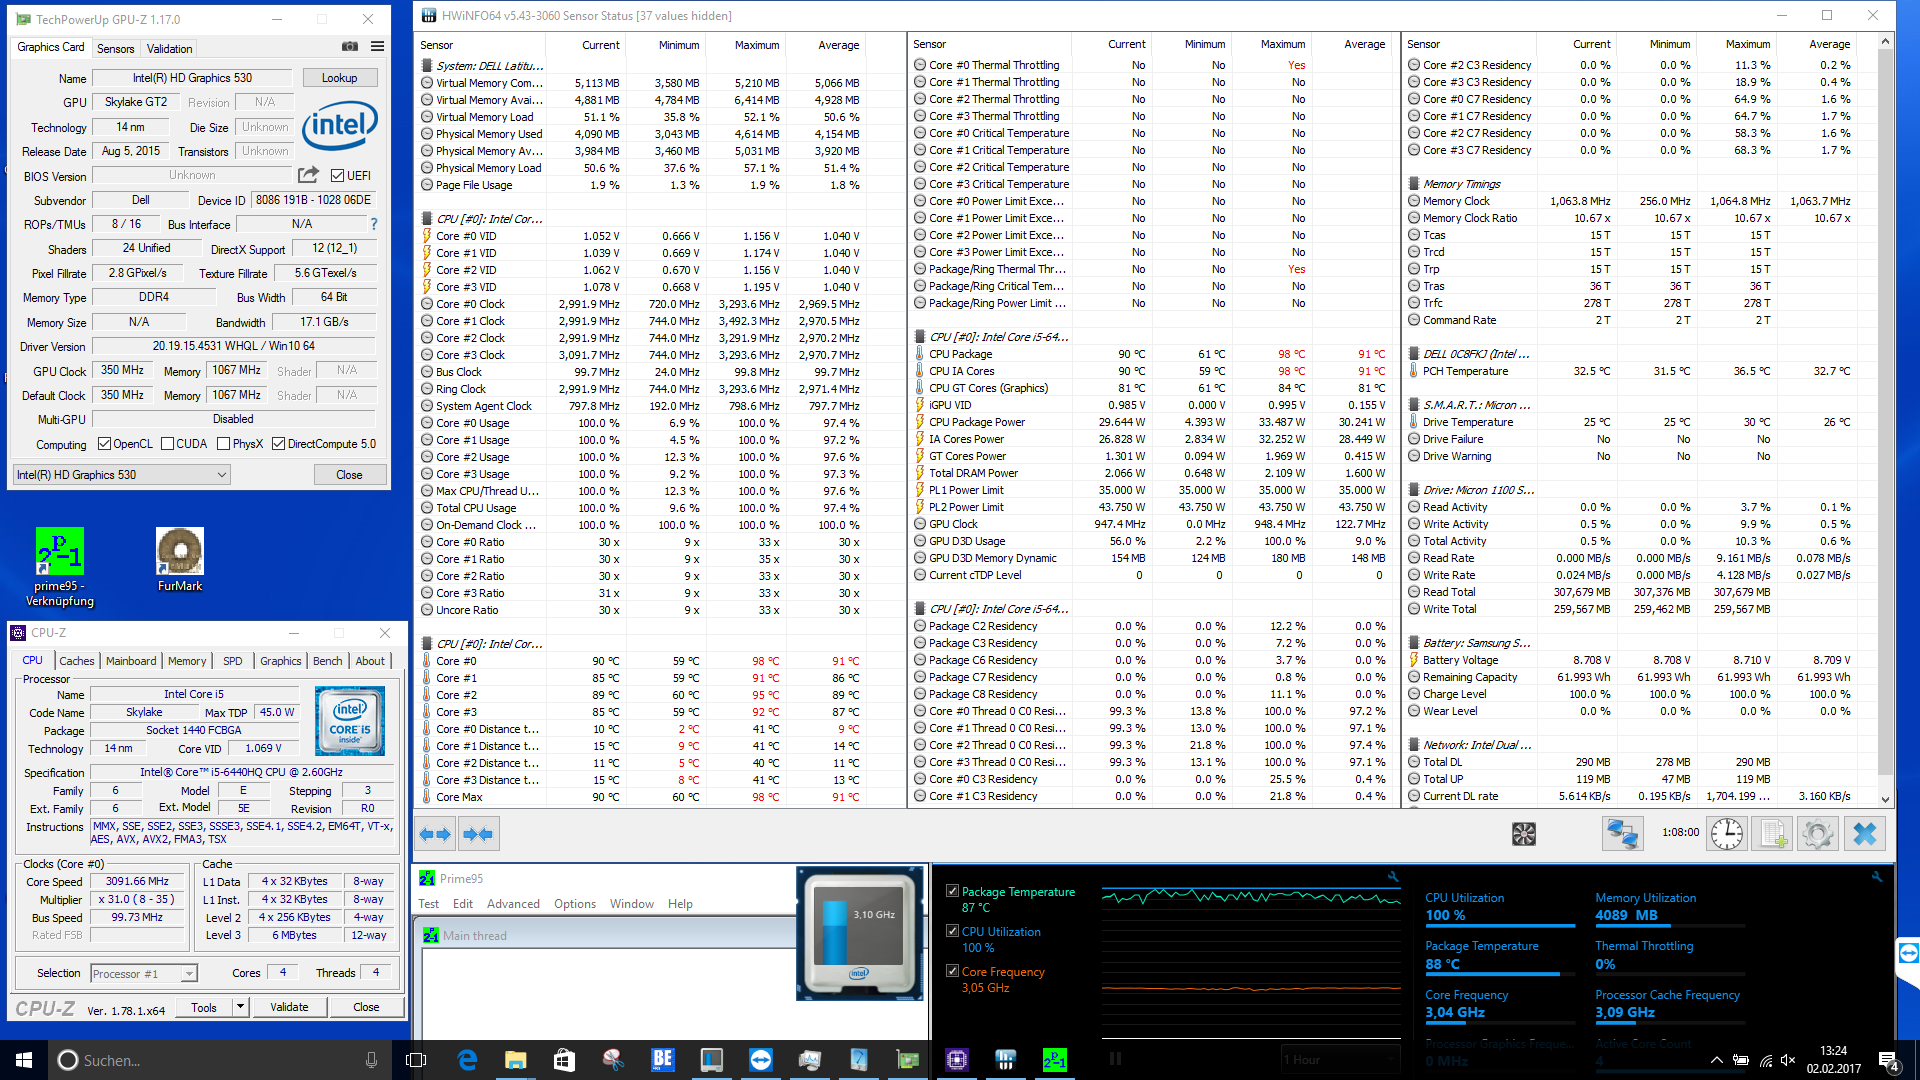
(±) La temperatura massima sul lato superiore è di 43 °C / 109 F, rispetto alla media di 34.3 °C / 94 F, che varia da 21.2 a 62.5 °C per questa classe Office.
(±) Il lato inferiore si riscalda fino ad un massimo di 43 °C / 109 F, rispetto alla media di 36.8 °C / 98 F
(+) In idle, la temperatura media del lato superiore è di 27.8 °C / 82 F, rispetto alla media deld ispositivo di 29.5 °C / 85 F.
(+) I poggiapolsi e il touchpad sono piu' freddi della temperatura della pelle con un massimo di 26.2 °C / 79.2 F e sono quindi freddi al tatto.
(±) La temperatura media della zona del palmo della mano di dispositivi simili e'stata di 27.6 °C / 81.7 F (+1.4 °C / 2.5 F).
| Dell Latitude 14 E5470 6440HQ, HD Graphics 530 | Dell Latitude 14 E5470 6300U, HD Graphics 520 | HP ProBook 440 G4-Y8B51EA i7-7500U, GeForce 930MX | Lenovo ThinkPad T460-20FN003LGE 6200U, HD Graphics 520 | Acer TravelMate P648-M-757N 6500U, HD Graphics 520 | |
|---|---|---|---|---|---|
| Heat | 7% | 8% | 5% | 7% | |
| Maximum Upper Side * (°C) | 43 | 41.5 3% | 41.5 3% | 37.3 13% | 38.5 10% |
| Maximum Bottom * (°C) | 43 | 41.4 4% | 38.1 11% | 44.3 -3% | 36.7 15% |
| Idle Upper Side * (°C) | 31.2 | 26.9 14% | 28.4 9% | 29 7% | 31.5 -1% |
| Idle Bottom * (°C) | 31.3 | 29.6 5% | 28.3 10% | 30.1 4% | 29.6 5% |
* ... Meglio usare valori piccoli
Dell Latitude 14 E5470 analisi audio
(±) | potenza degli altiparlanti media ma buona (73 dB)
Bassi 100 - 315 Hz
(-) | quasi nessun basso - in media 16.2% inferiori alla media
(+) | bassi in lineaa (4.3% delta rispetto alla precedente frequenza)
Medi 400 - 2000 Hz
(±) | medi elevati - circa 5.3% superiore alla media
(+) | medi lineari (5.2% delta rispetto alla precedente frequenza)
Alti 2 - 16 kHz
(±) | alti elevati - circa 6.8% superiori alla media
(+) | alti lineari (2.9% delta rispetto alla precedente frequenza)
Nel complesso 100 - 16.000 Hz
(±) | la linearità complessiva del suono è media (19.7% di differenza rispetto alla media
Rispetto alla stessa classe
» 41% di tutti i dispositivi testati in questa classe è stato migliore, 7% simile, 51% peggiore
» Il migliore ha avuto un delta di 7%, medio di 21%, peggiore di 53%
Rispetto a tutti i dispositivi testati
» 50% di tutti i dispositivi testati in questa classe è stato migliore, 7% similare, 43% peggiore
» Il migliore ha avuto un delta di 4%, medio di 23%, peggiore di 134%
Apple MacBook 12 (Early 2016) 1.1 GHz analisi audio
(+) | gli altoparlanti sono relativamente potenti (83.6 dB)
Bassi 100 - 315 Hz
(±) | bassi ridotti - in media 11.3% inferiori alla media
(±) | la linearità dei bassi è media (14.2% delta rispetto alla precedente frequenza)
Medi 400 - 2000 Hz
(+) | medi bilanciati - solo only 2.4% rispetto alla media
(+) | medi lineari (5.5% delta rispetto alla precedente frequenza)
Alti 2 - 16 kHz
(+) | Alti bilanciati - appena 2% dalla media
(+) | alti lineari (4.5% delta rispetto alla precedente frequenza)
Nel complesso 100 - 16.000 Hz
(+) | suono nel complesso lineare (10.2% differenza dalla media)
Rispetto alla stessa classe
» 7% di tutti i dispositivi testati in questa classe è stato migliore, 2% simile, 90% peggiore
» Il migliore ha avuto un delta di 5%, medio di 18%, peggiore di 53%
Rispetto a tutti i dispositivi testati
» 5% di tutti i dispositivi testati in questa classe è stato migliore, 1% similare, 94% peggiore
» Il migliore ha avuto un delta di 4%, medio di 23%, peggiore di 134%
| Off / Standby | |
| Idle | |
| Sotto carico |
|
Leggenda:
min: | |
| Dell Latitude 14 E5470 6440HQ, HD Graphics 530, Micron SSD 1100 (MTFDDAV256TBN) | Dell Latitude 14 E5470 6300U, HD Graphics 520, Liteon L8H-256V2G | HP ProBook 440 G4-Y8B51EA i7-7500U, GeForce 930MX, SanDisk SD8SNAT256G1002 | Lenovo ThinkPad T460-20FN003LGE 6200U, HD Graphics 520, Toshiba HG6 THNSFJ256GCSU | Acer TravelMate P648-M-757N 6500U, HD Graphics 520, Lite-On CV1-8B256 | |
|---|---|---|---|---|---|
| Power Consumption | 29% | 14% | 23% | -0% | |
| Idle Minimum * (Watt) | 4.1 | 3.5 15% | 3 27% | 3.5 15% | 5.3 -29% |
| Idle Average * (Watt) | 8.1 | 5.3 35% | 5.4 33% | 6.7 17% | 9.3 -15% |
| Idle Maximum * (Watt) | 11.4 | 6 47% | 6.3 45% | 7.3 36% | 11.5 -1% |
| Load Average * (Watt) | 33.5 | 26.3 21% | 37.5 -12% | 28.2 16% | 30.8 8% |
| Load Maximum * (Watt) | 49 | 36.6 25% | 61.1 -25% | 34.6 29% | 32 35% |
* ... Meglio usare valori piccoli
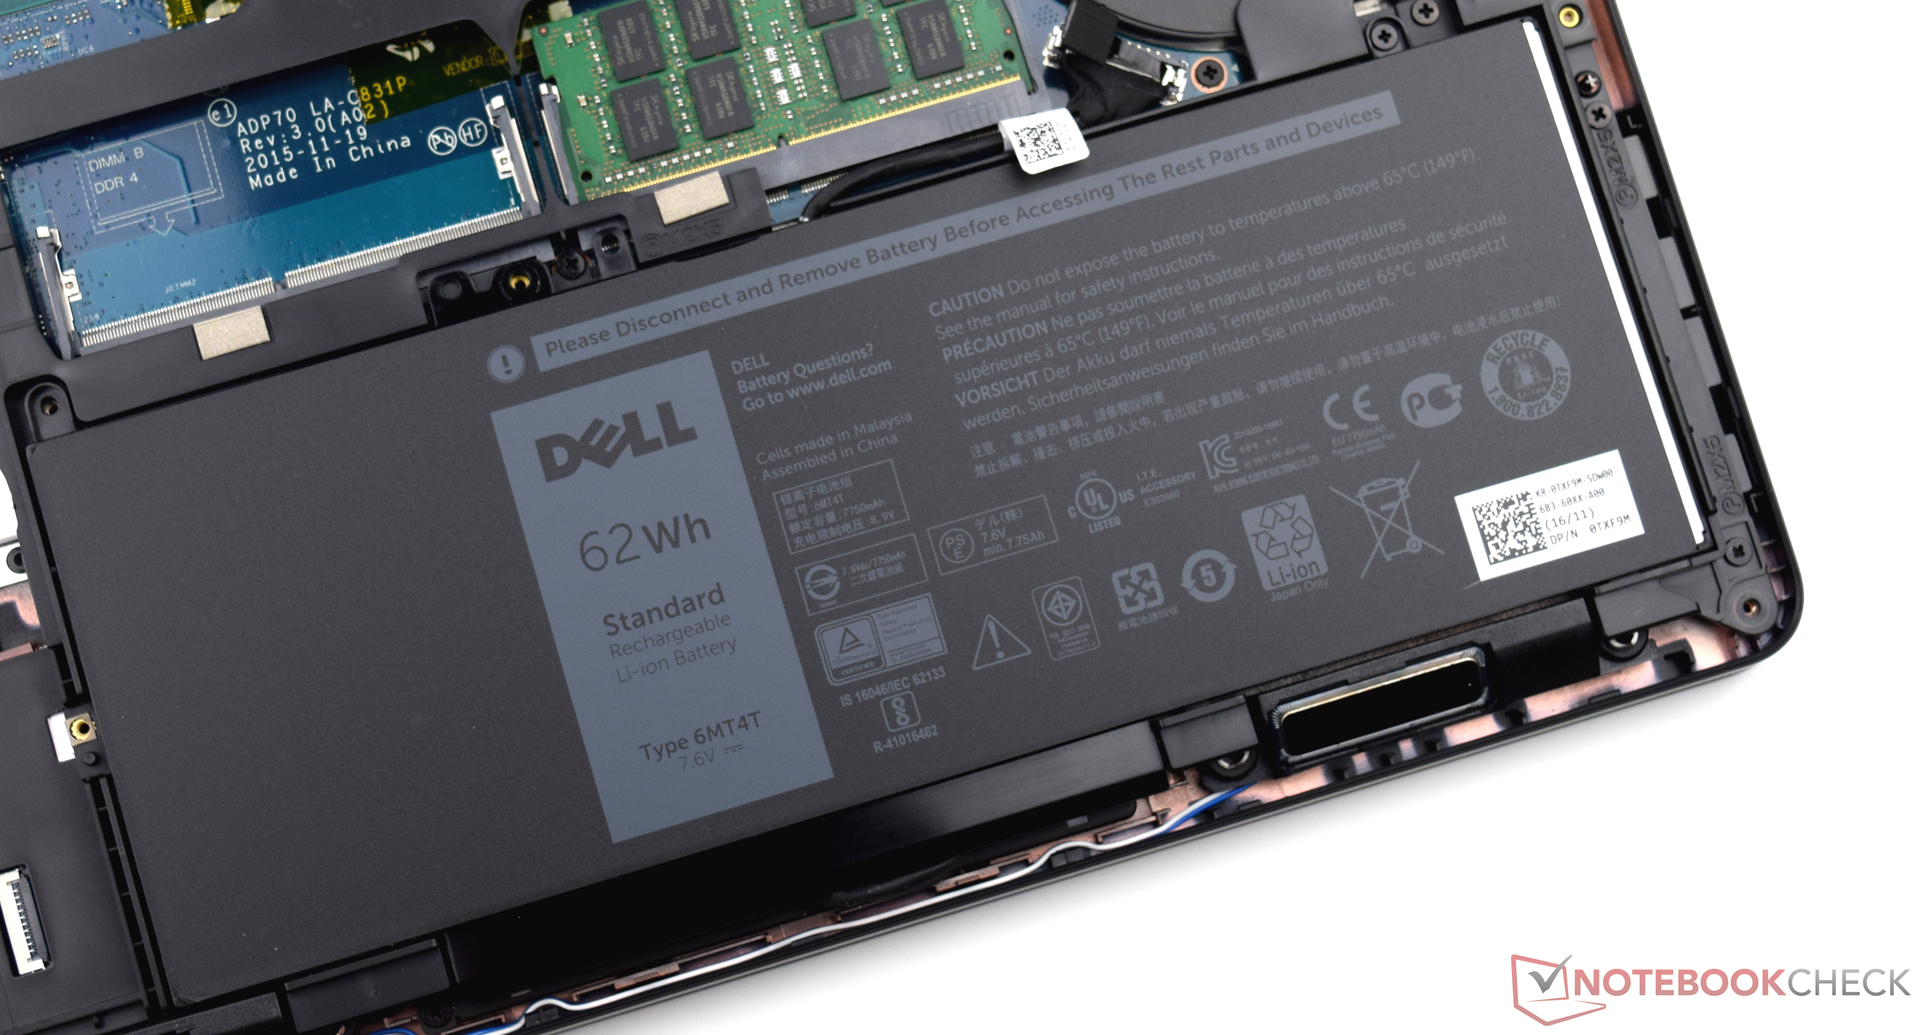

| Dell Latitude 14 E5470 6440HQ, HD Graphics 530, 62 Wh | Dell Latitude 14 E5470 6300U, HD Graphics 520, 62 Wh | HP ProBook 440 G4-Y8B51EA i7-7500U, GeForce 930MX, 48 Wh | Lenovo ThinkPad T460-20FN003LGE 6200U, HD Graphics 520, 46 Wh | Acer TravelMate P648-M-757N 6500U, HD Graphics 520, 54 Wh | |
|---|---|---|---|---|---|
| Autonomia della batteria | 65% | 33% | 5% | 27% | |
| Reader / Idle (h) | 15.2 | 21.7 43% | 18.1 19% | 15.9 5% | 18.1 19% |
| H.264 (h) | 6.9 | 10.8 57% | 9.5 38% | 8.5 23% | 9.1 32% |
| WiFi v1.3 (h) | 7.2 | 11.1 54% | 6.9 -4% | 5.6 -22% | 9.1 26% |
| Load (h) | 1.4 | 2.9 107% | 2.5 79% | 1.6 14% | 1.8 29% |
Pro
Contro
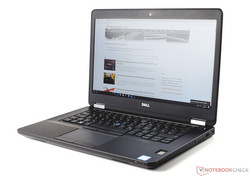
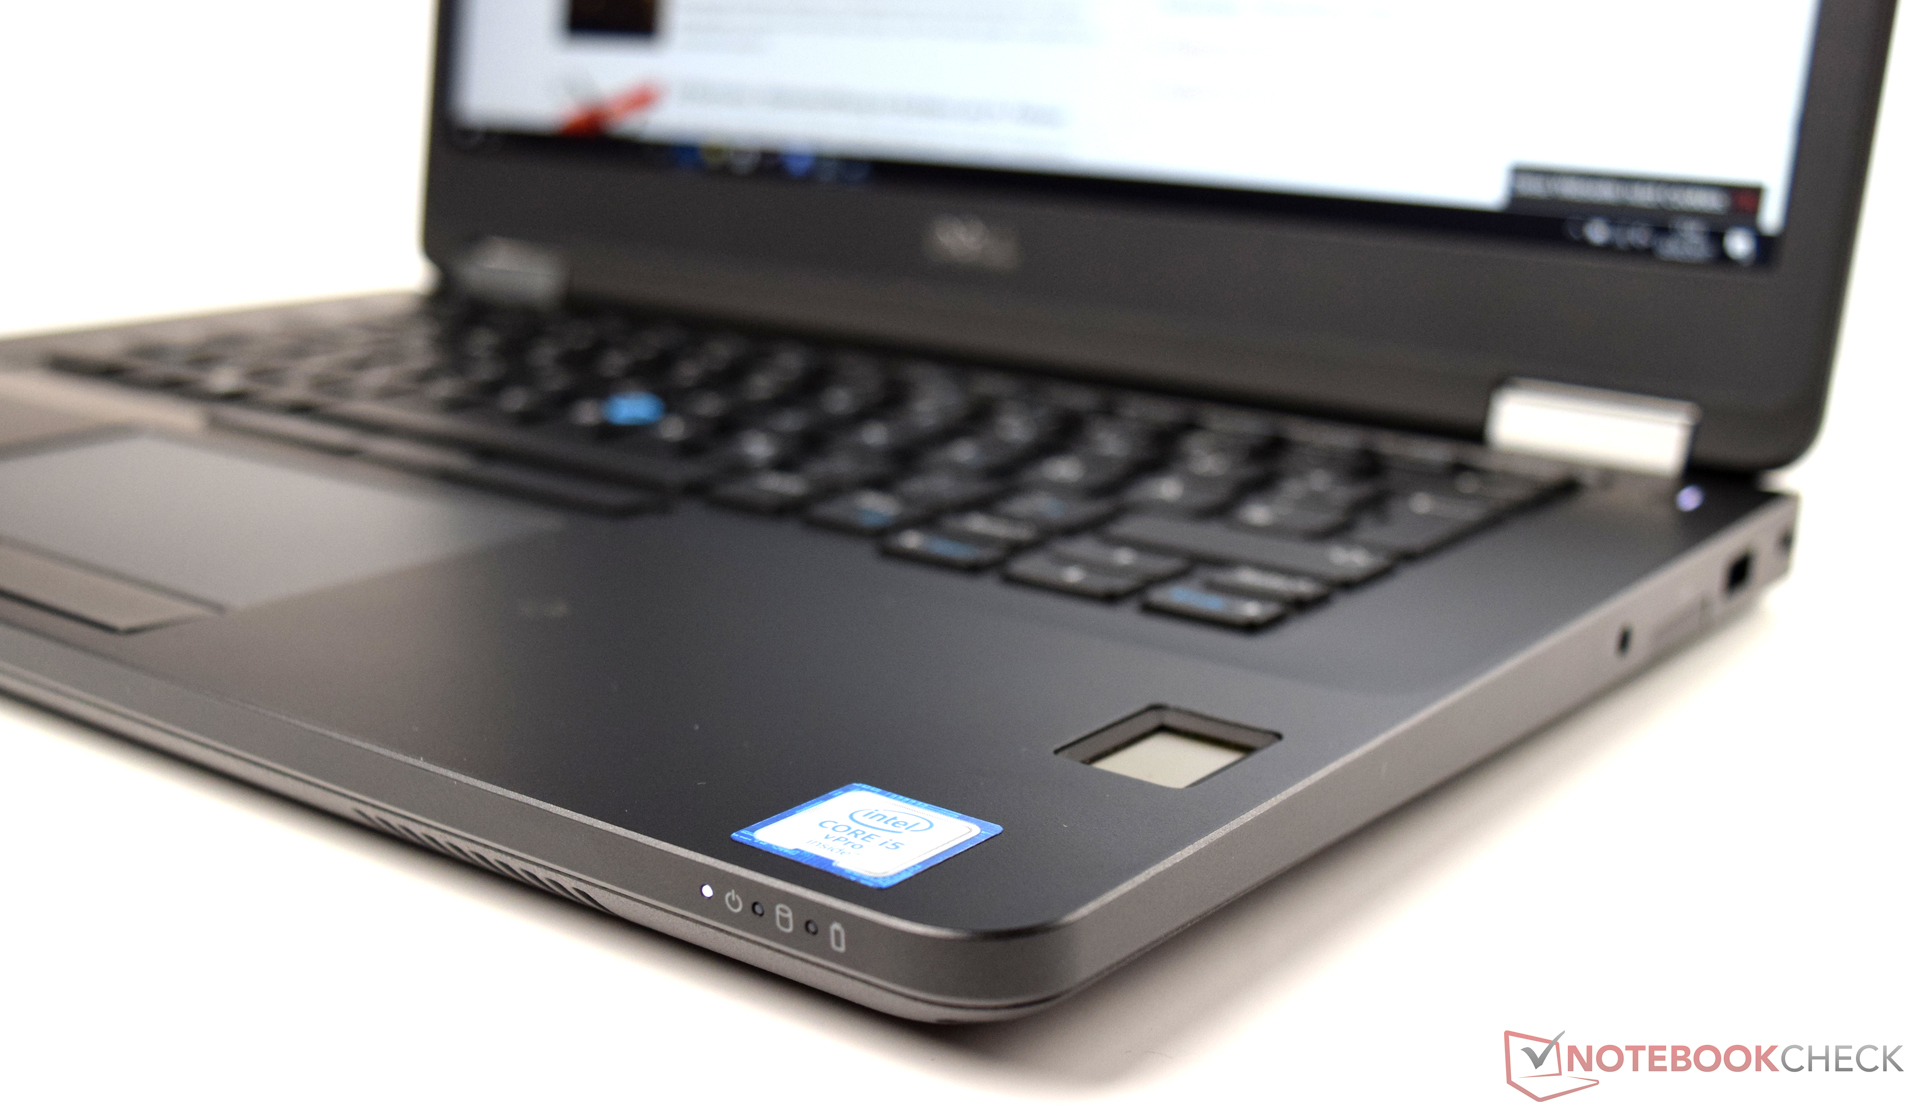
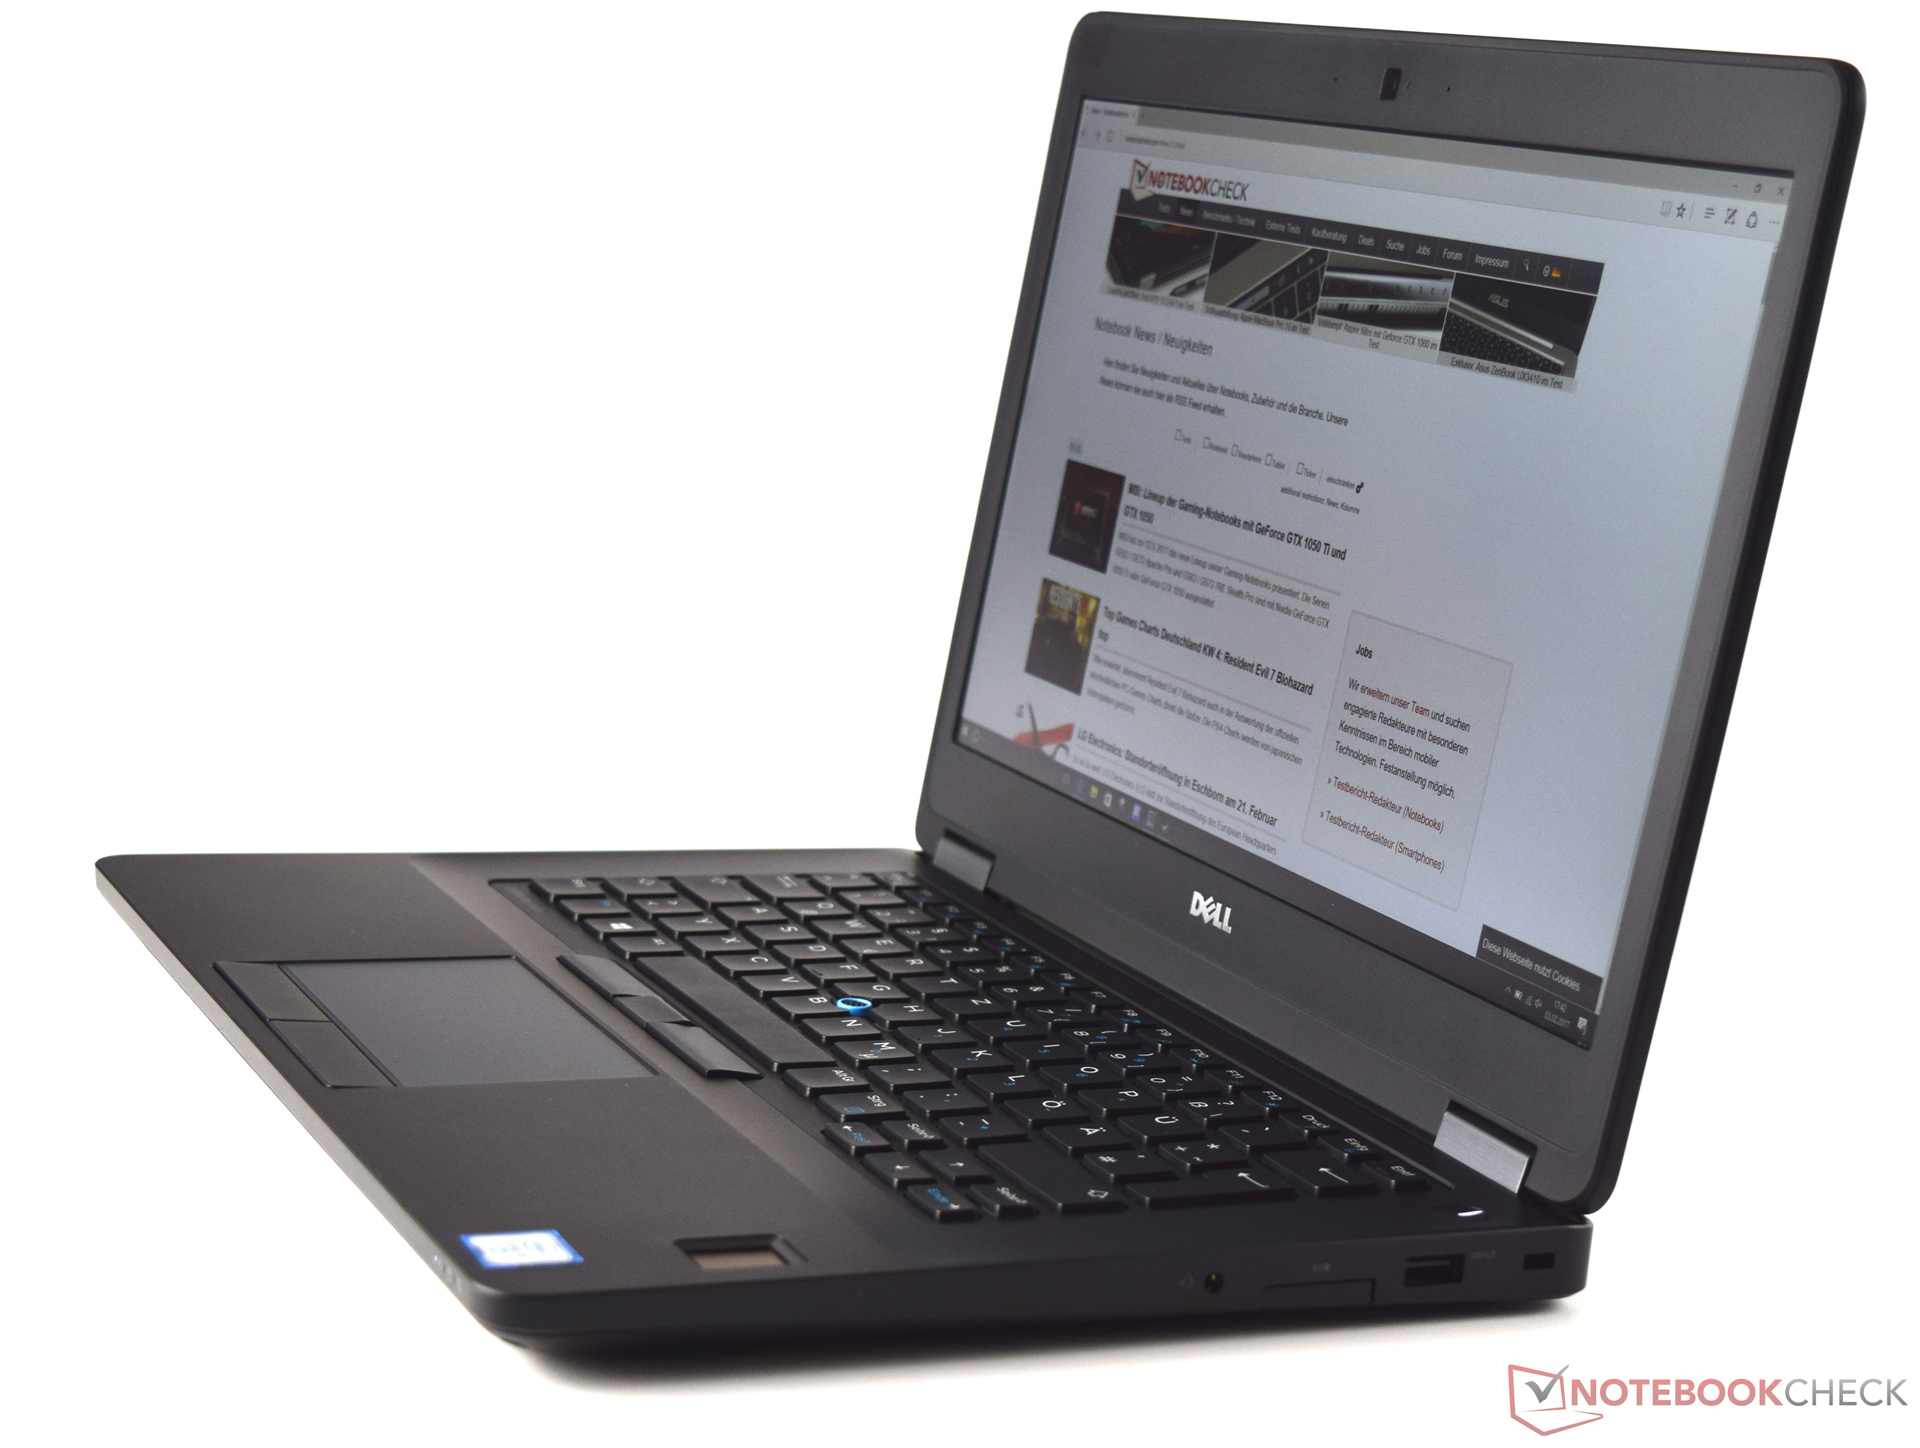
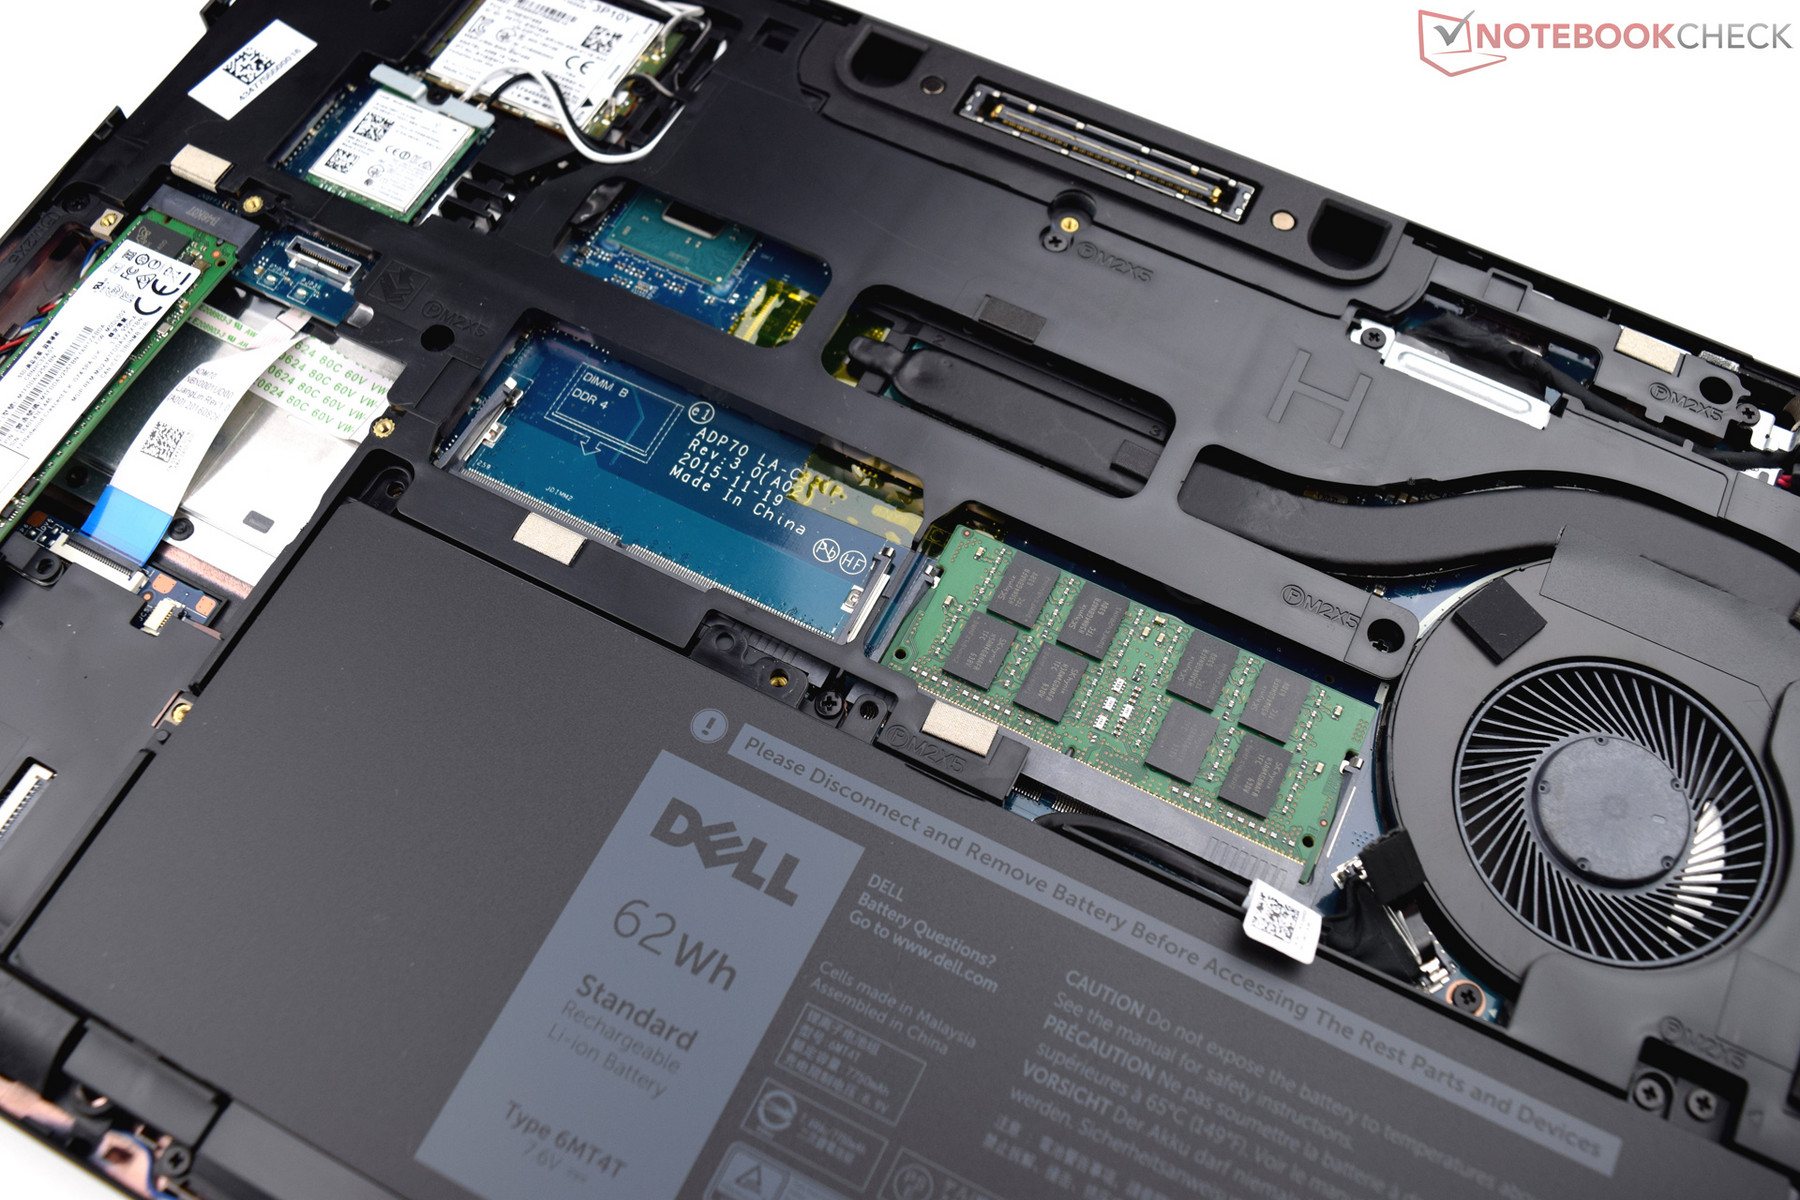
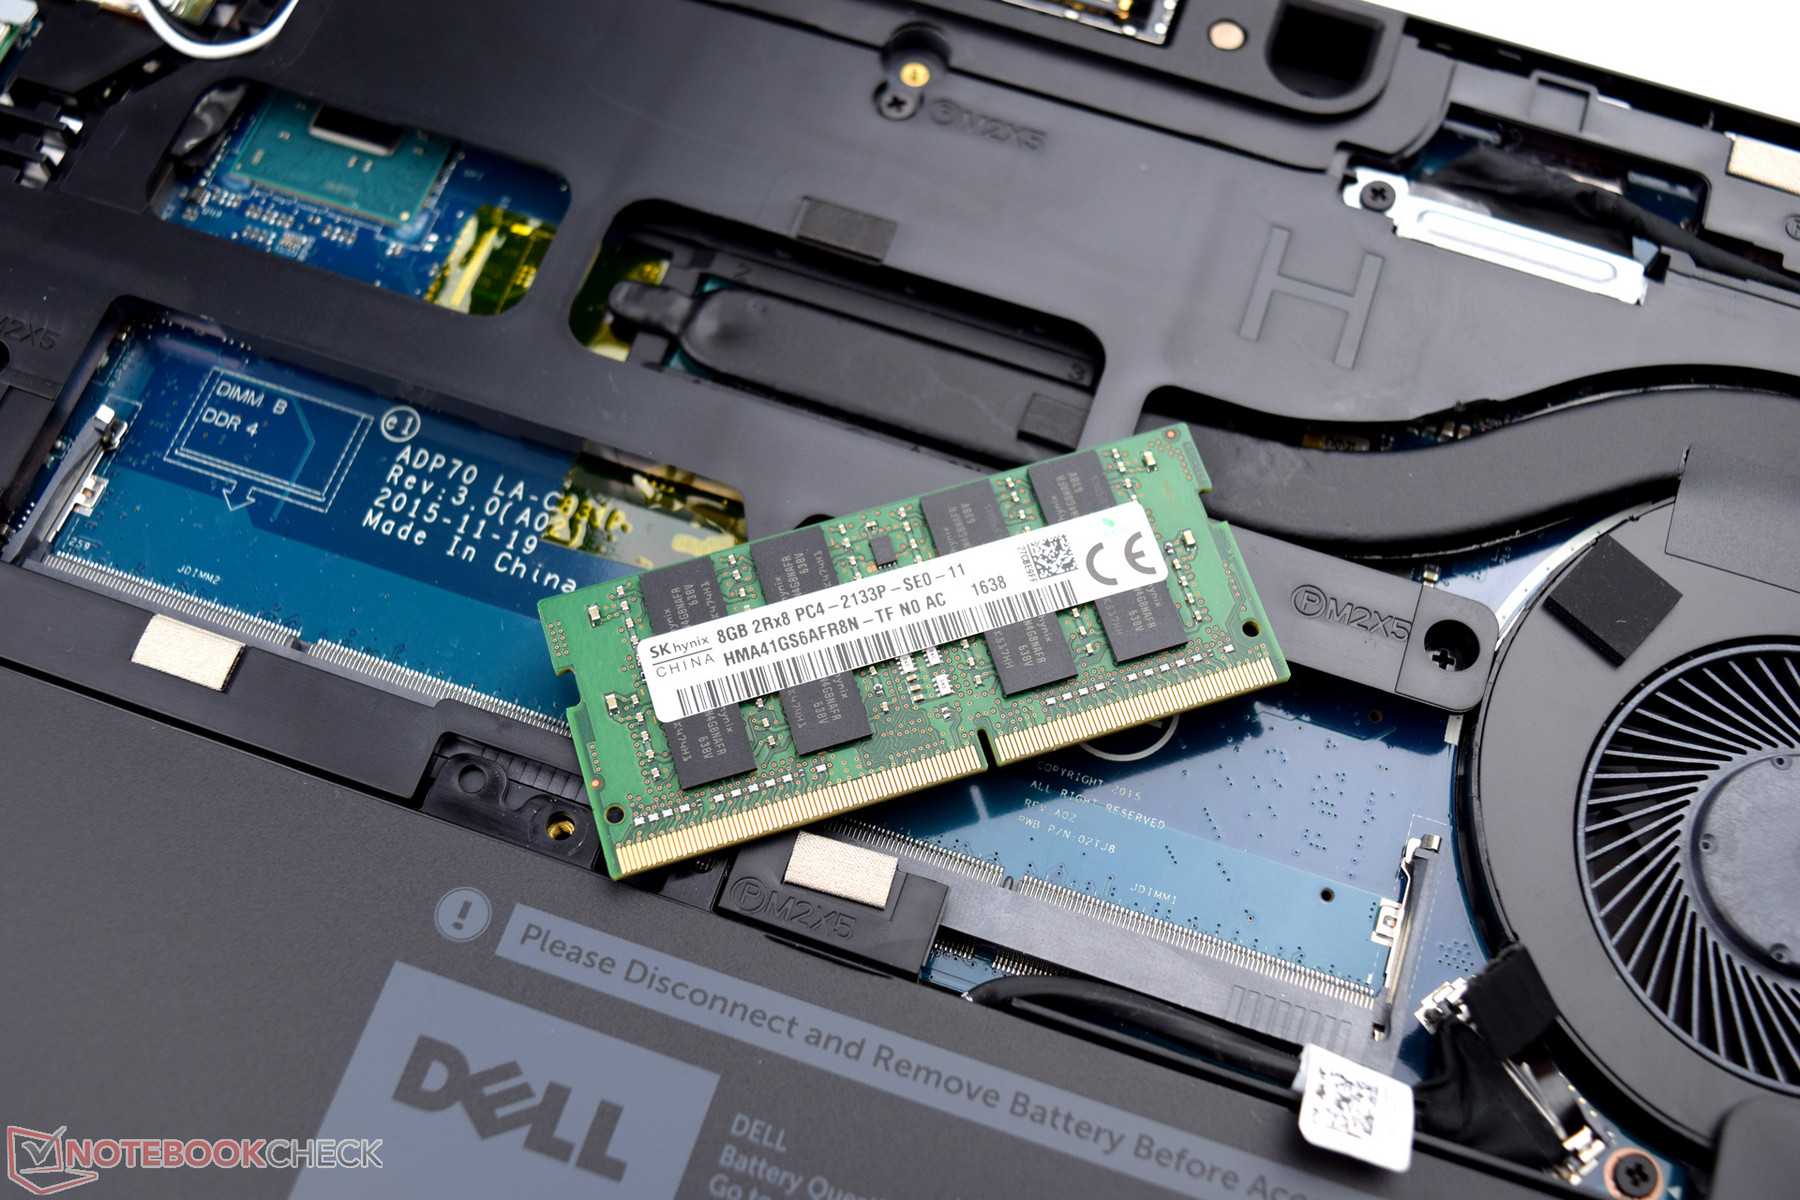
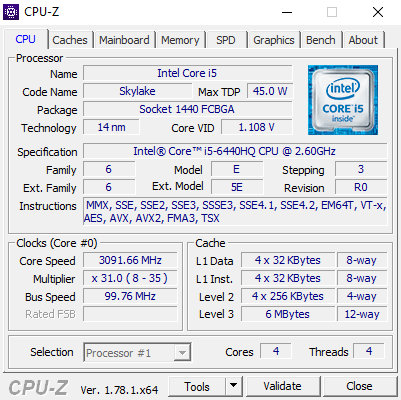
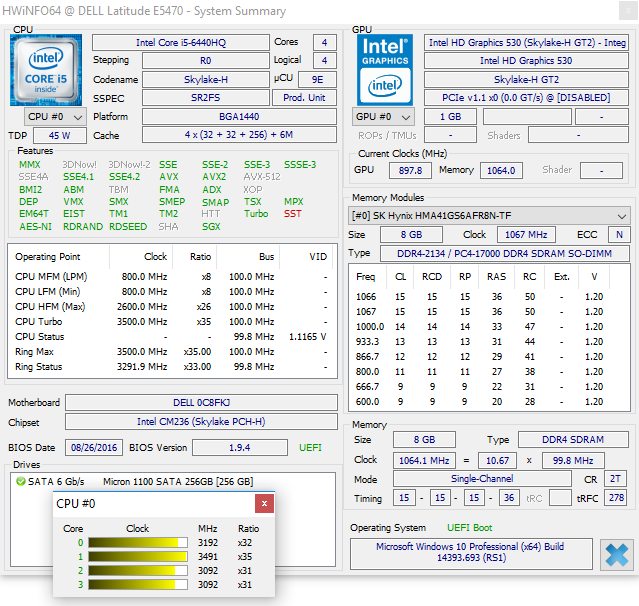
Dell presenta un portatile business ben realizzato con una buona potenza. Sebbene ci sia un processore Skylake nel Dell Latitude 14 E5470, in alcuni casi si superano i più recenti processori Kaby Lake. Quattro cores fisici sono più efficienti quando si tratta di applicazioni Multithreading. La combinazione di un potente processore, 8 GB di memoria e un SSD da 256 GB consente di avere un sistema fluido.
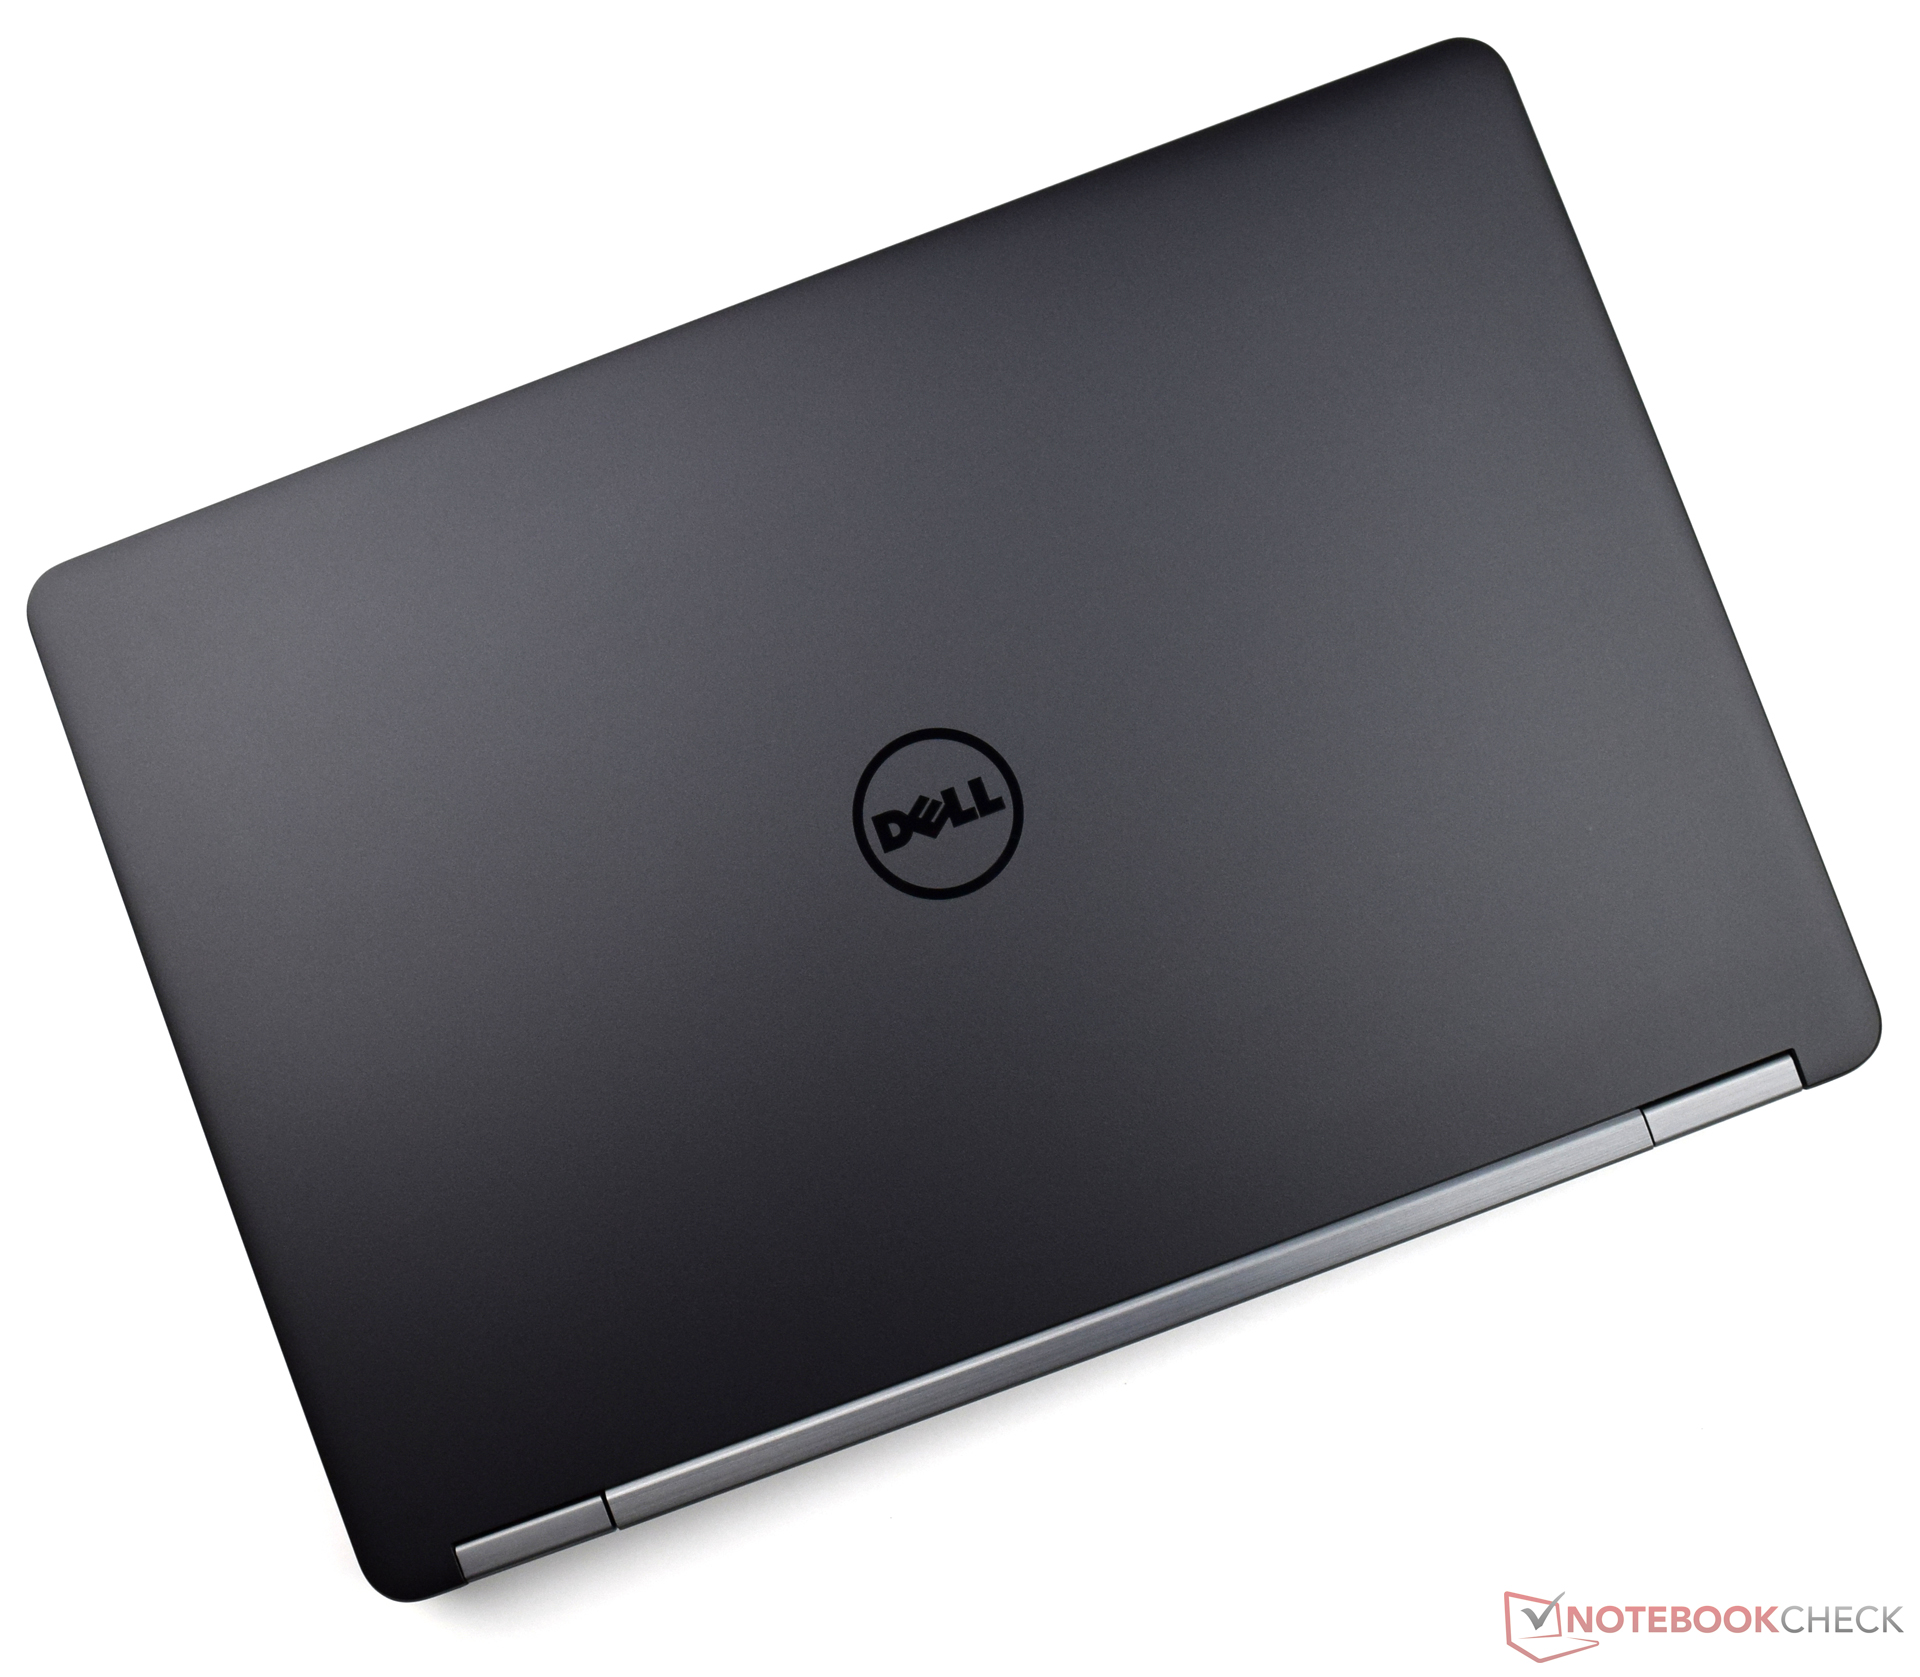
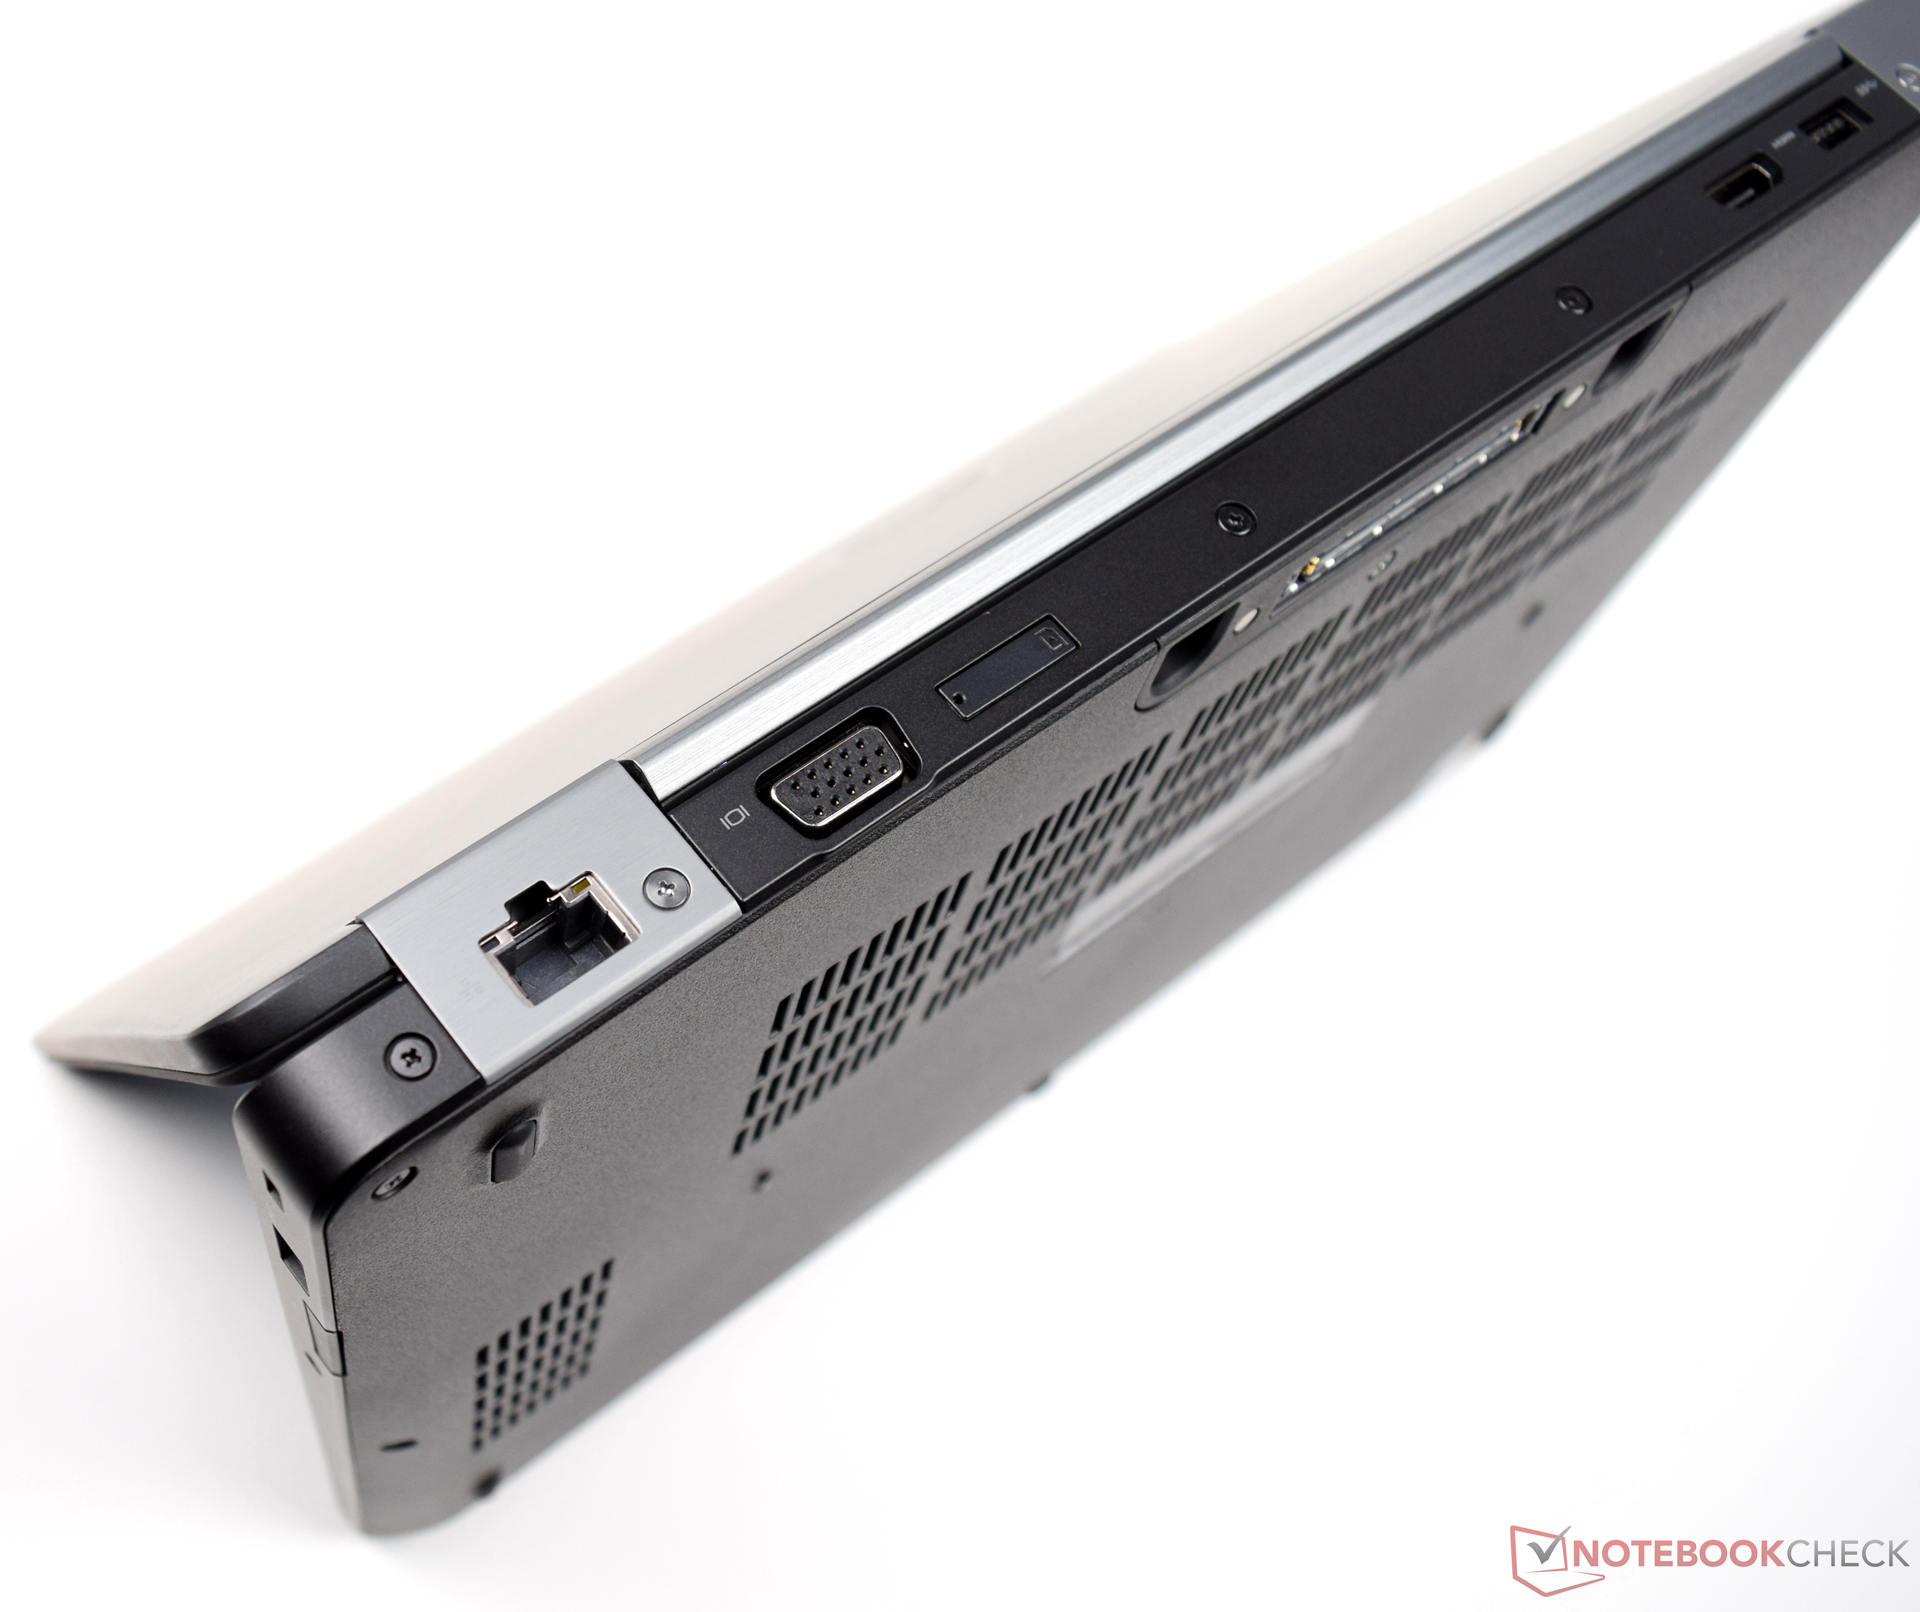
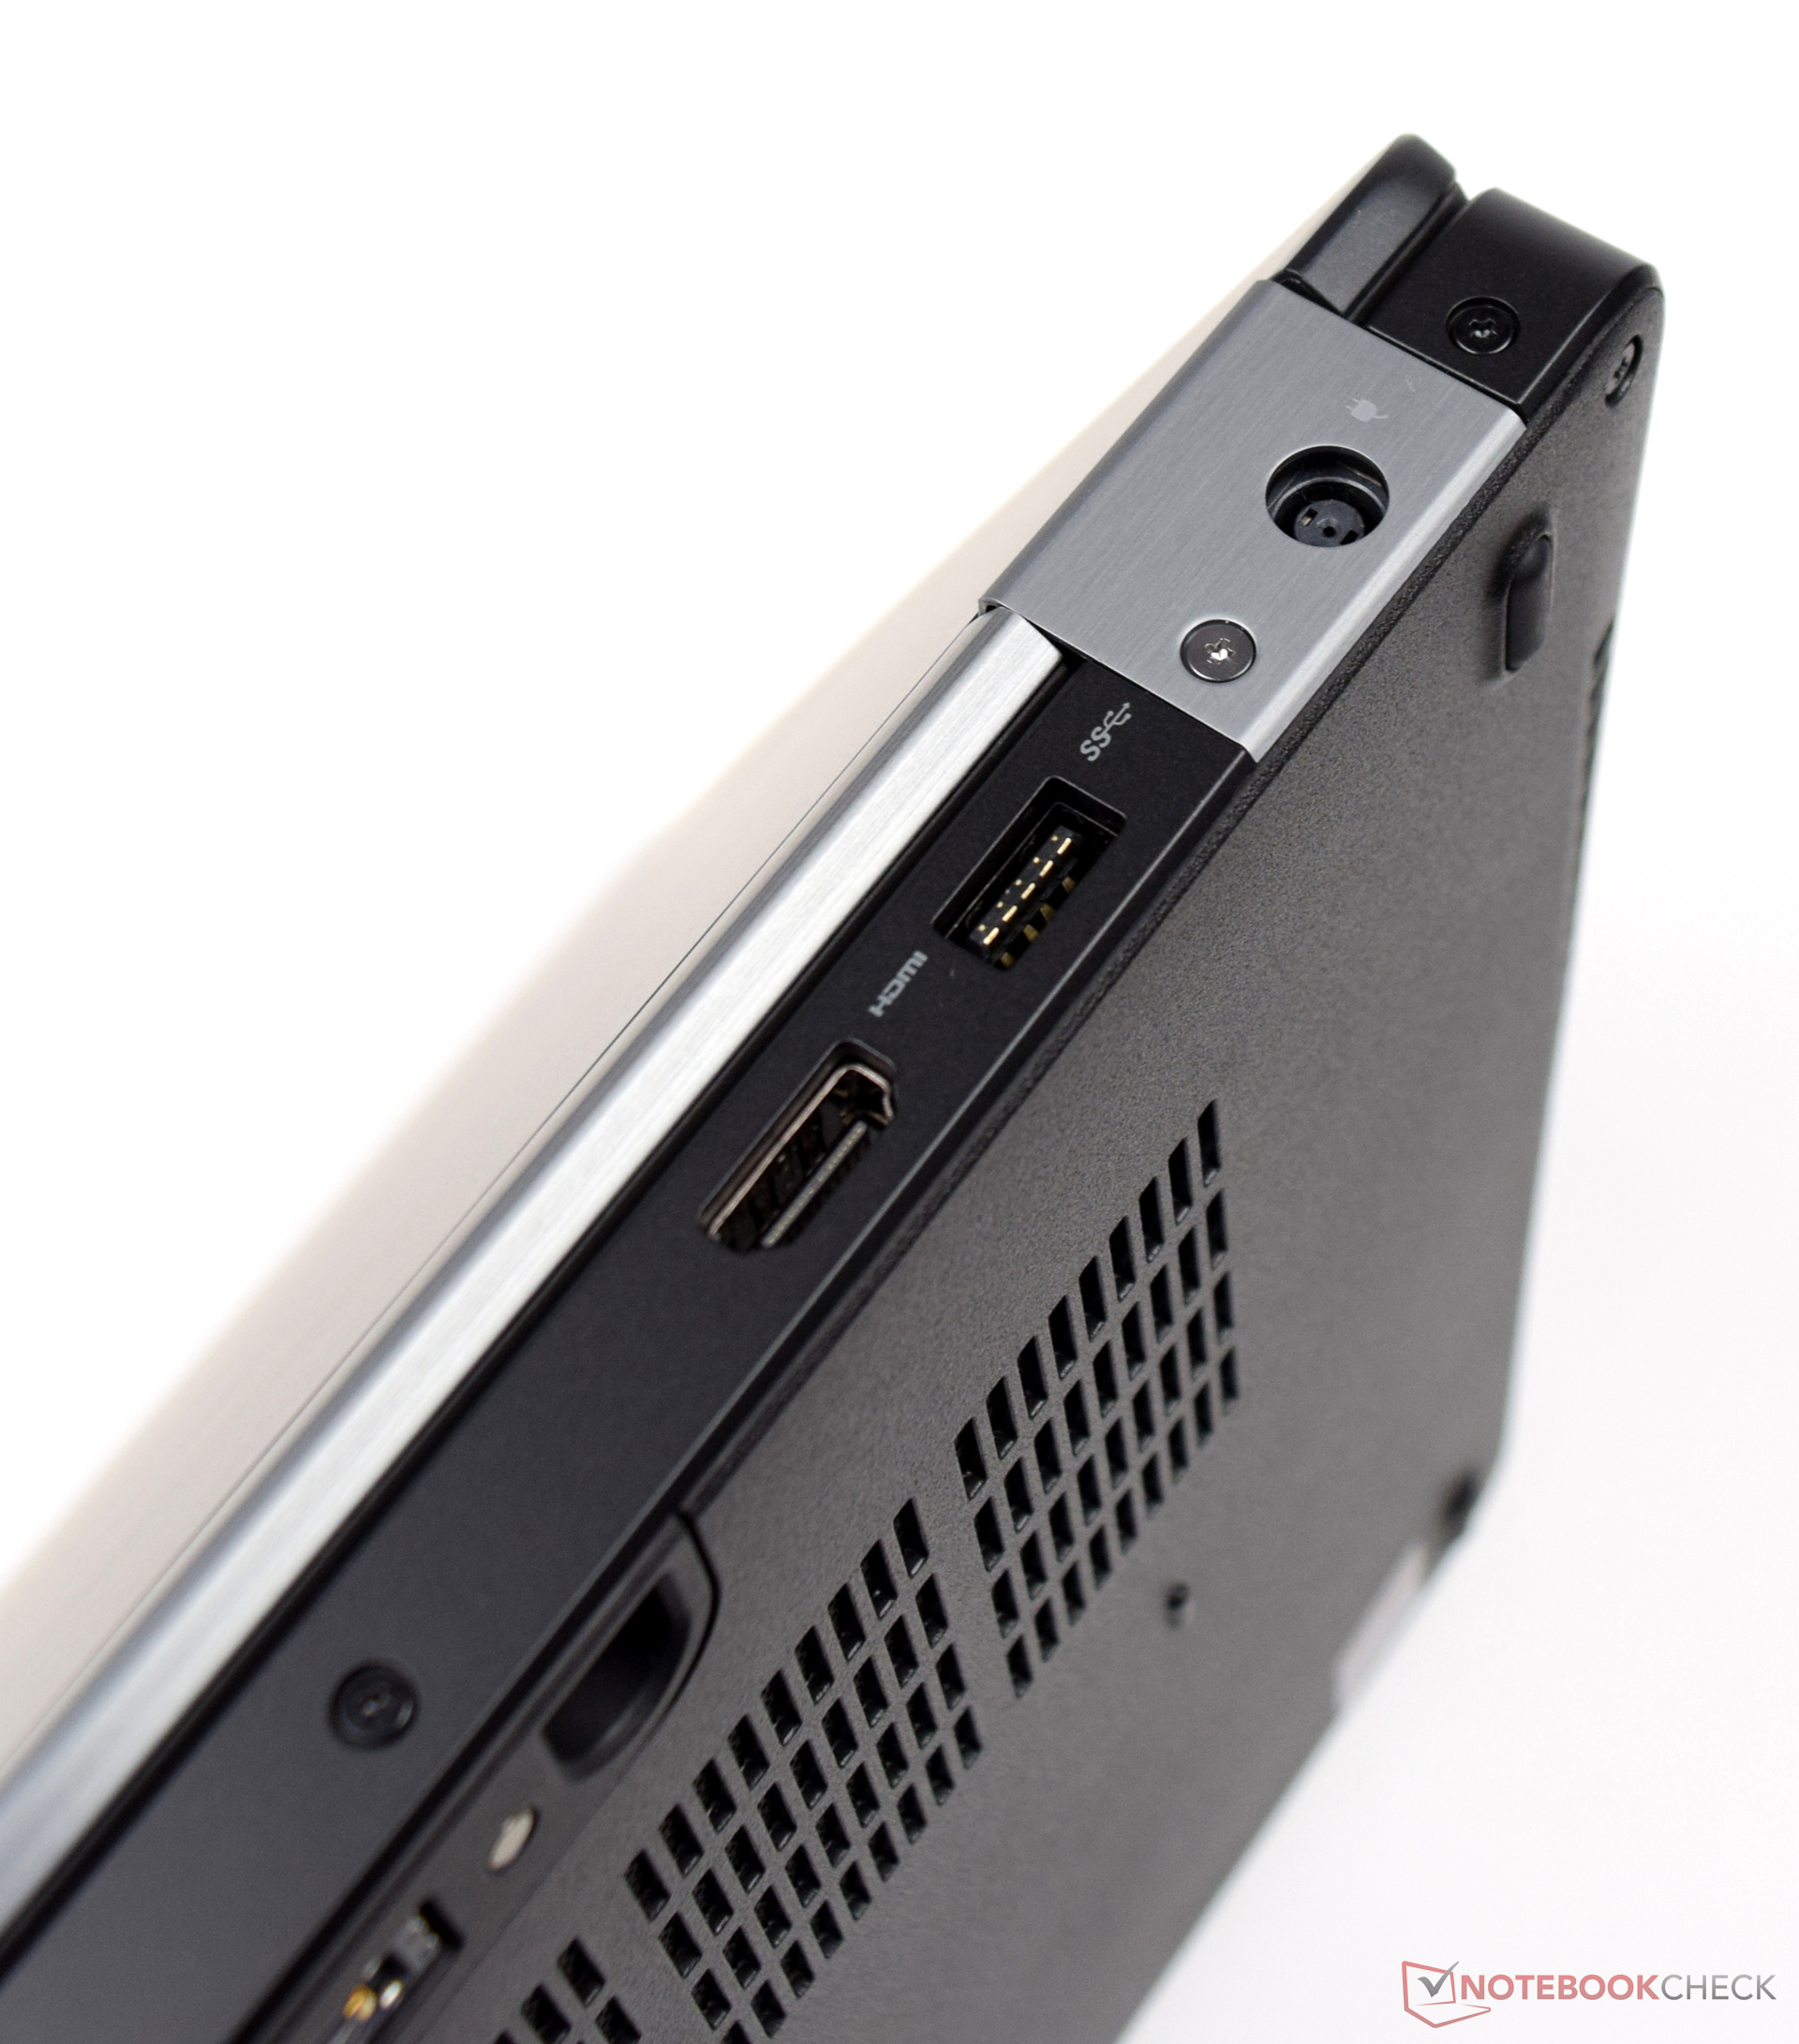
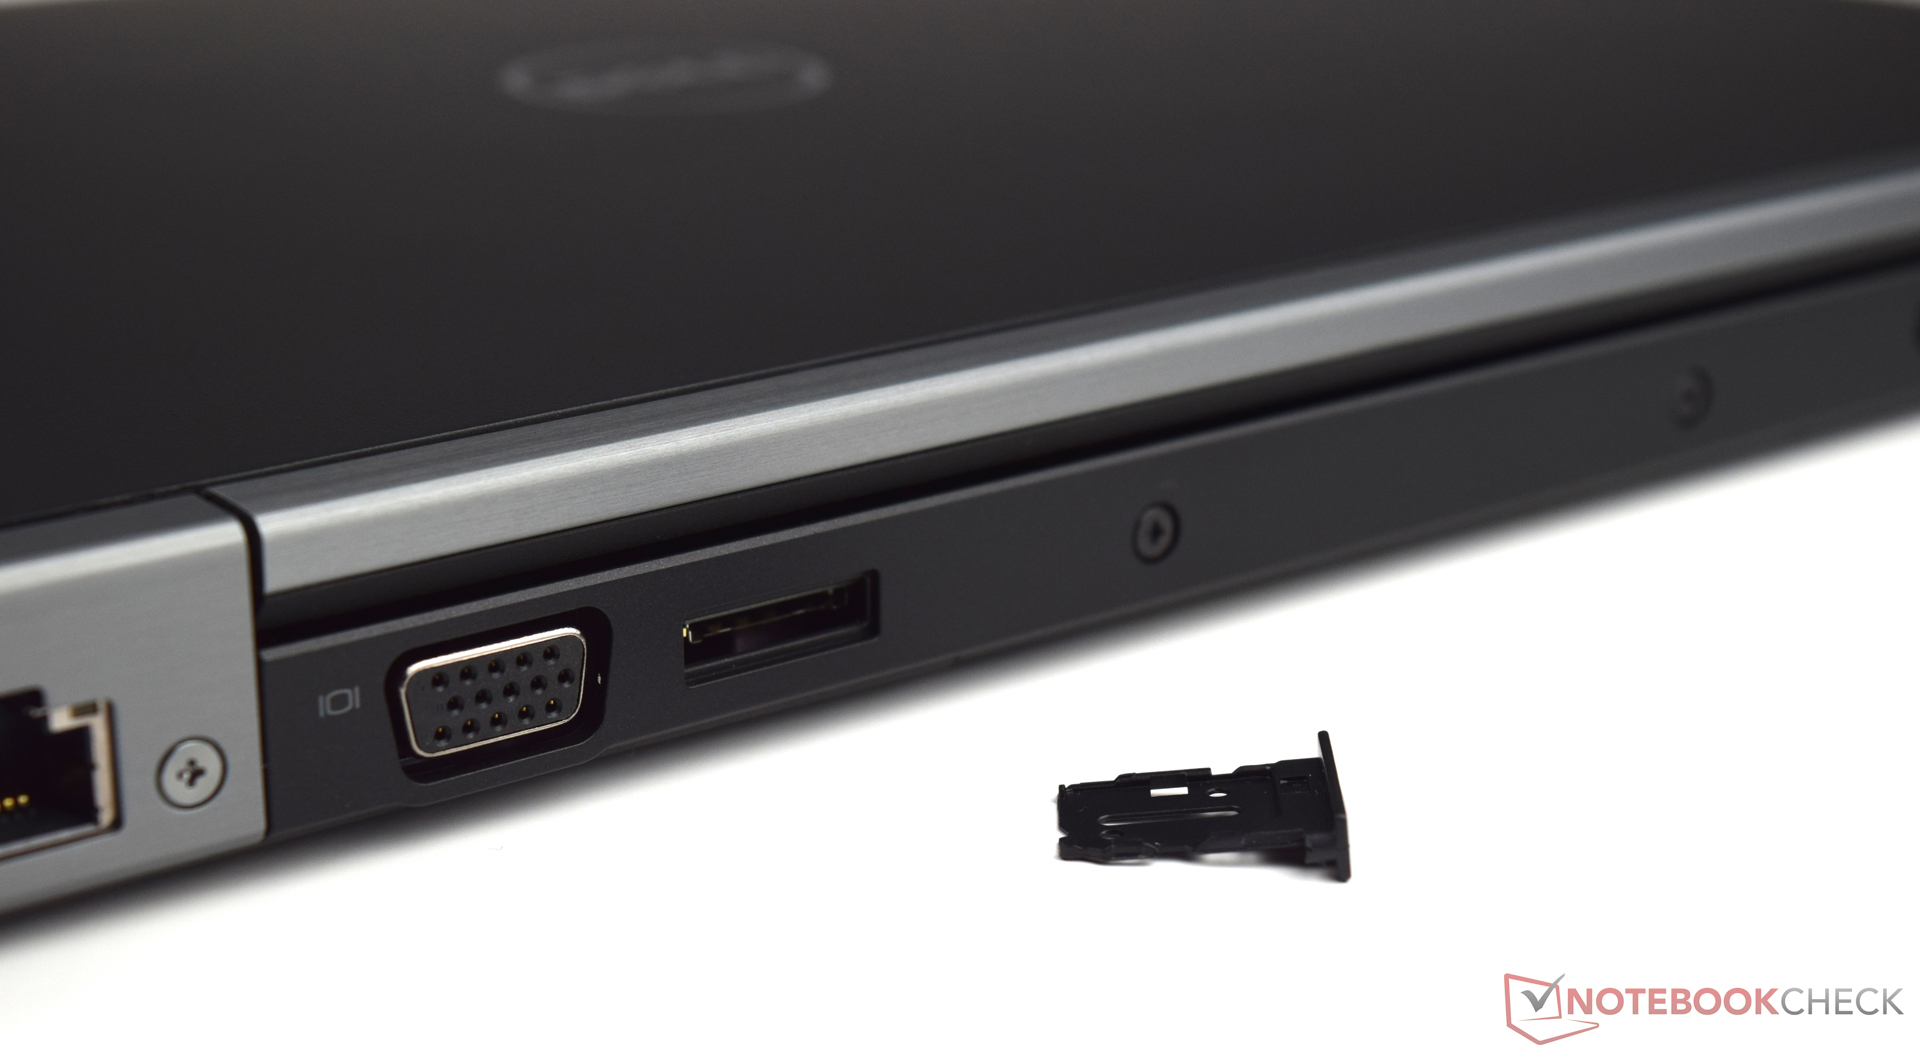
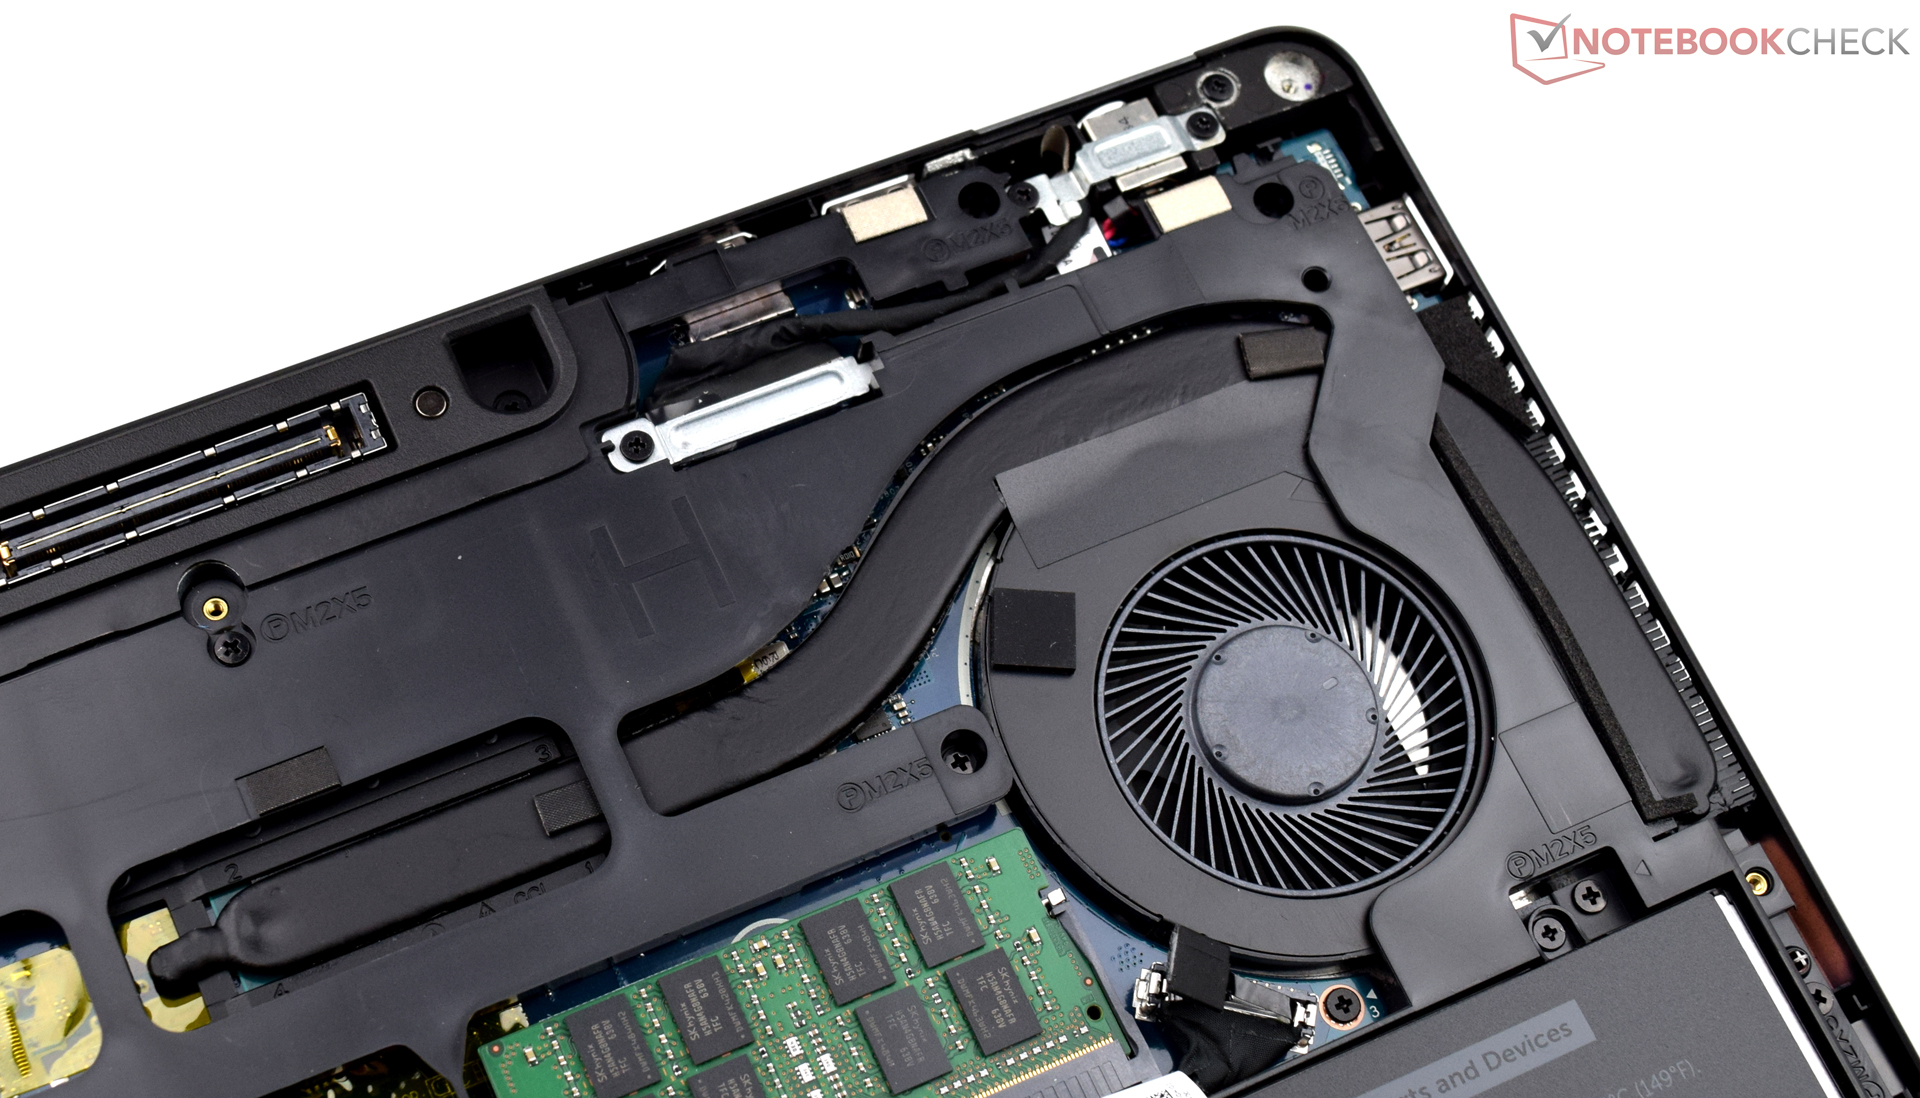
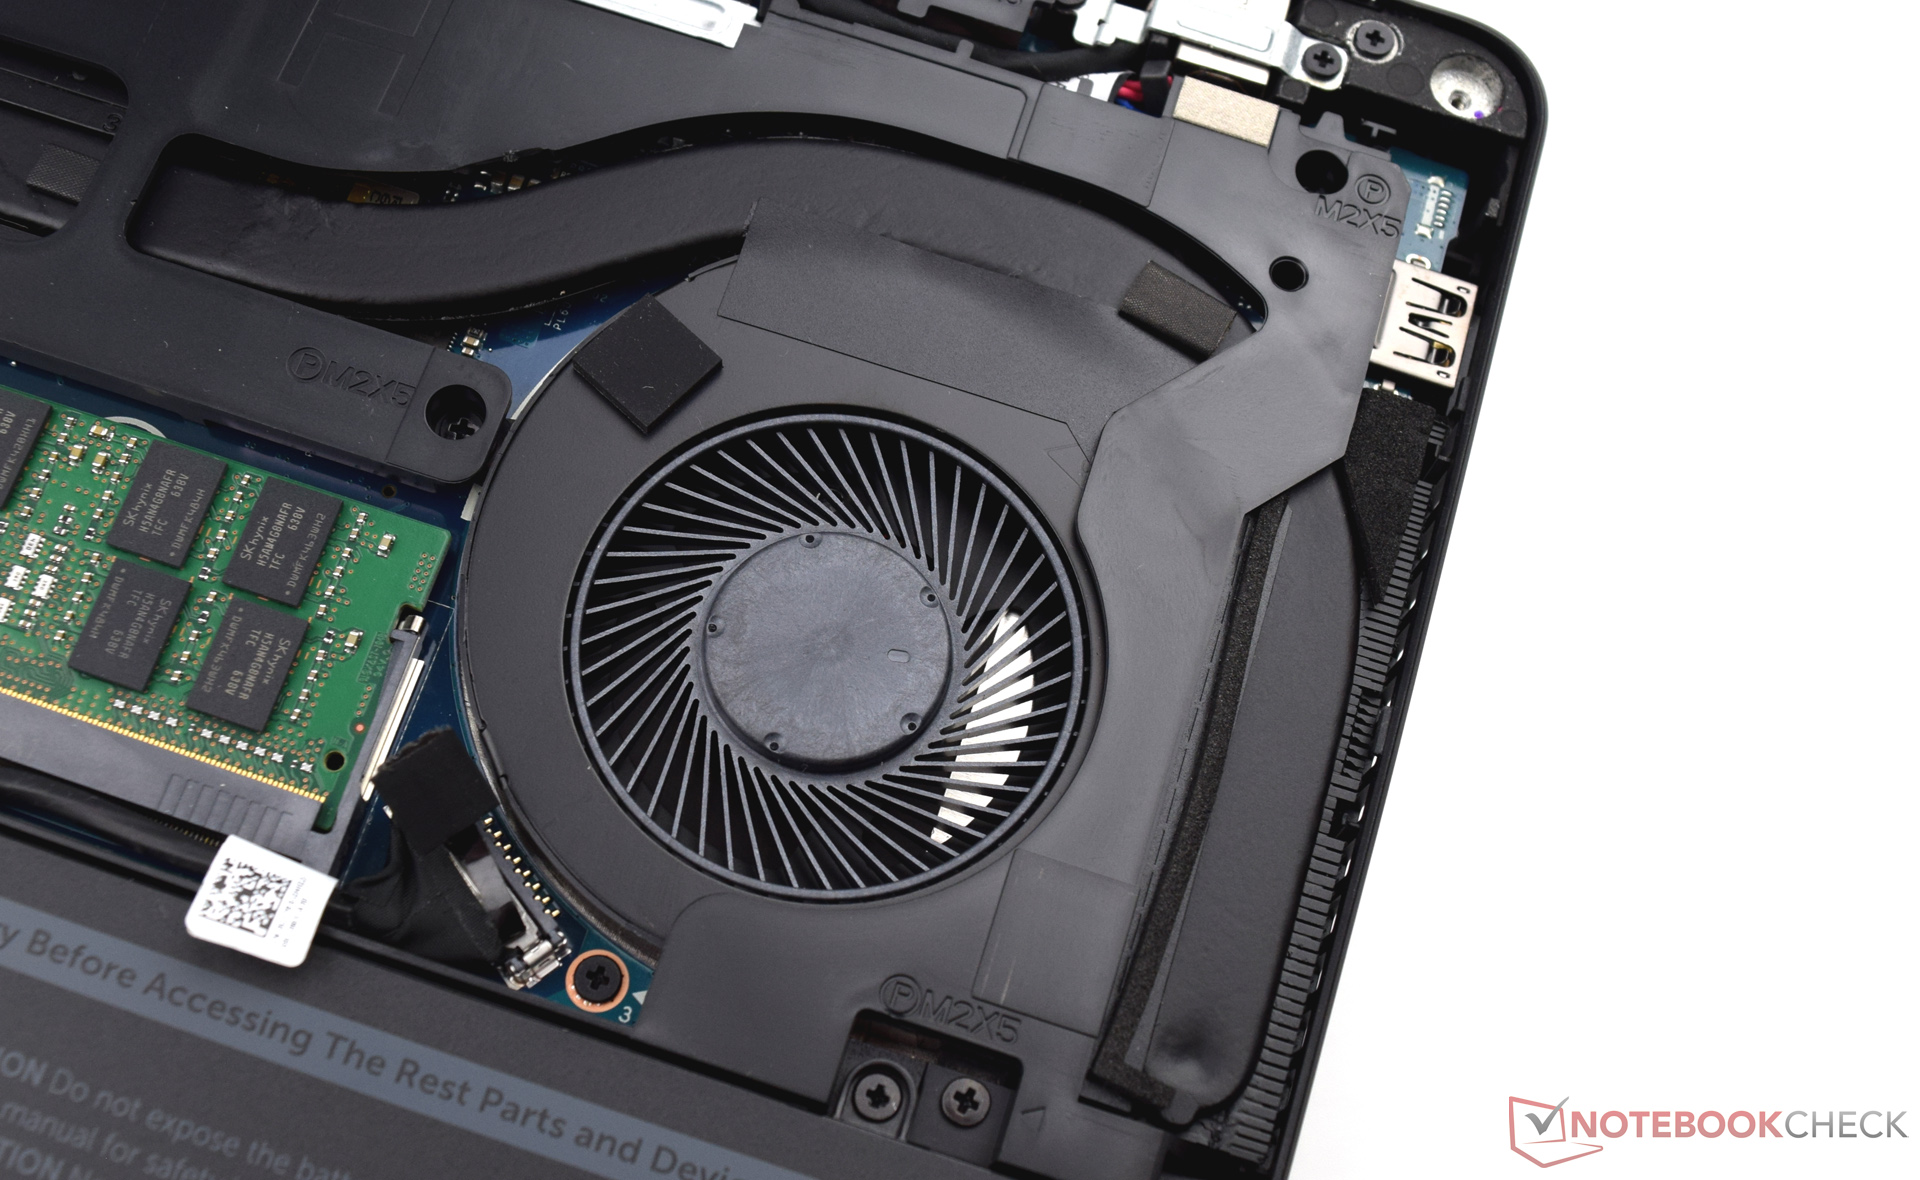
Il Dell Latitude 14 E5470 ci ha convinto con le sue buone prestazioni di lavoro durante il test. I dispositivi di input, il case solido e stiloso e la qualità di costruzione lo rendono duraturo. Le arie features di sicurezza e gli utili accessori ne facilitano l'utilizzo in ufficio.
Il Dell Latitude 14 E5470 non merita molte critiche, ma avremmo voluto almeno una porta USB Type-C Gen.2 in termini di prospettiva per il futuro. L'approccio con lo schermo è un passo nella giusta direzione. Tuttavia, in questa fascia di prezzo ci saremmo aspettati un contrasti migliore.
In definitiva possiamo dire che il Dell Latitude 14 E5470 è un buon dispositivo da ufficio per le attività quotidiane. Le varie features di sicurezza sono un punto di forza e potrebbero essere il fattore decisivo per l'acquisto.
Nota: si tratta di una recensione breve, con alcune sezioni non tradotte, per la versione integrale in inglese guardate qui.
Dell Latitude 14 E5470
- 02/10/2017 v6 (old)
Sebastian Bade