Recensione del portatile HP ZBook Firefly 16 G9 - Workstation mobile con prestazioni insoddisfacenti
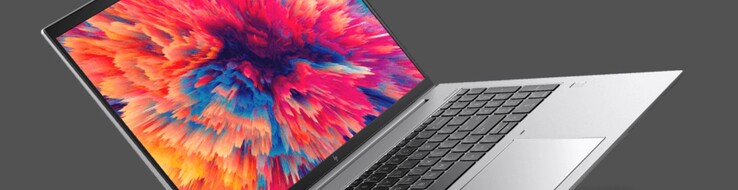
La serie ZBook Firefly di HP consiste da anni in workstation sottili con GPU professionali entry-level, anche se solo nei formati da 14 e 15 pollici. Il Firefly 16 G9 di quest'anno è dotato di un display più grande da 16 pollici e, come i modelli più piccoli, è stato etichettato da HP come la nona generazione. Il case in alluminio contiene un nuovo processore Alder Lake-U di Intel e una GPU T550 di livello professionale di Nvidia. Inoltre, il portatile è dotato di 32 GB di RAM, un'unità SSD da 1 TB e un display IPS opaco con un rapporto di aspetto 16:10 (1920 x 1200 pixel) al prezzo attuale di circa 3000 dollari.
Potenziali concorrenti a confronto
Punteggio | Data | Modello | Peso | Altezza | Dimensione | Risoluzione | Prezzo |
|---|---|---|---|---|---|---|---|
| 82.9 % v7 (old) | 10/2022 | HP ZBook Firefly 16 G9-6B897EA i7-1265U, T550 Laptop GPU | 2 kg | 19.2 mm | 16.00" | 1920x1200 | |
| 89.3 % v7 (old) | Lenovo ThinkPad P1 G4-20Y4Z9DVUS i7-11800H, T1200 Laptop GPU | 1.8 kg | 17.7 mm | 16.00" | 2560x1600 | ||
| 88.3 % v7 (old) | 10/2021 | Dell Precision 5000 5560 i7-11850H, RTX A2000 Laptop GPU | 2 kg | 18 mm | 15.60" | 3840x2400 | |
| 85.3 % v7 (old) | 06/2021 | Lenovo ThinkPad P15s Gen2-20W6000GGE i7-1165G7, T500 Laptop GPU | 1.9 kg | 19.1 mm | 15.60" | 3840x2160 | |
| 83.8 % v7 (old) | 04/2021 | HP ZBook Firefly 15 G8 2C9R7EA i7-1165G7, T500 Laptop GPU | 1.8 kg | 19.2 mm | 15.60" | 1920x1080 | |
| 93.2 % v7 (old) | 11/2021 | Apple MacBook Pro 16 2021 M1 Pro M1 Pro, M1 Pro 16-Core GPU | 2.2 kg | 16.8 mm | 16.20" | 3456x2234 |
Custodia - HP utilizza un guscio in alluminio premium
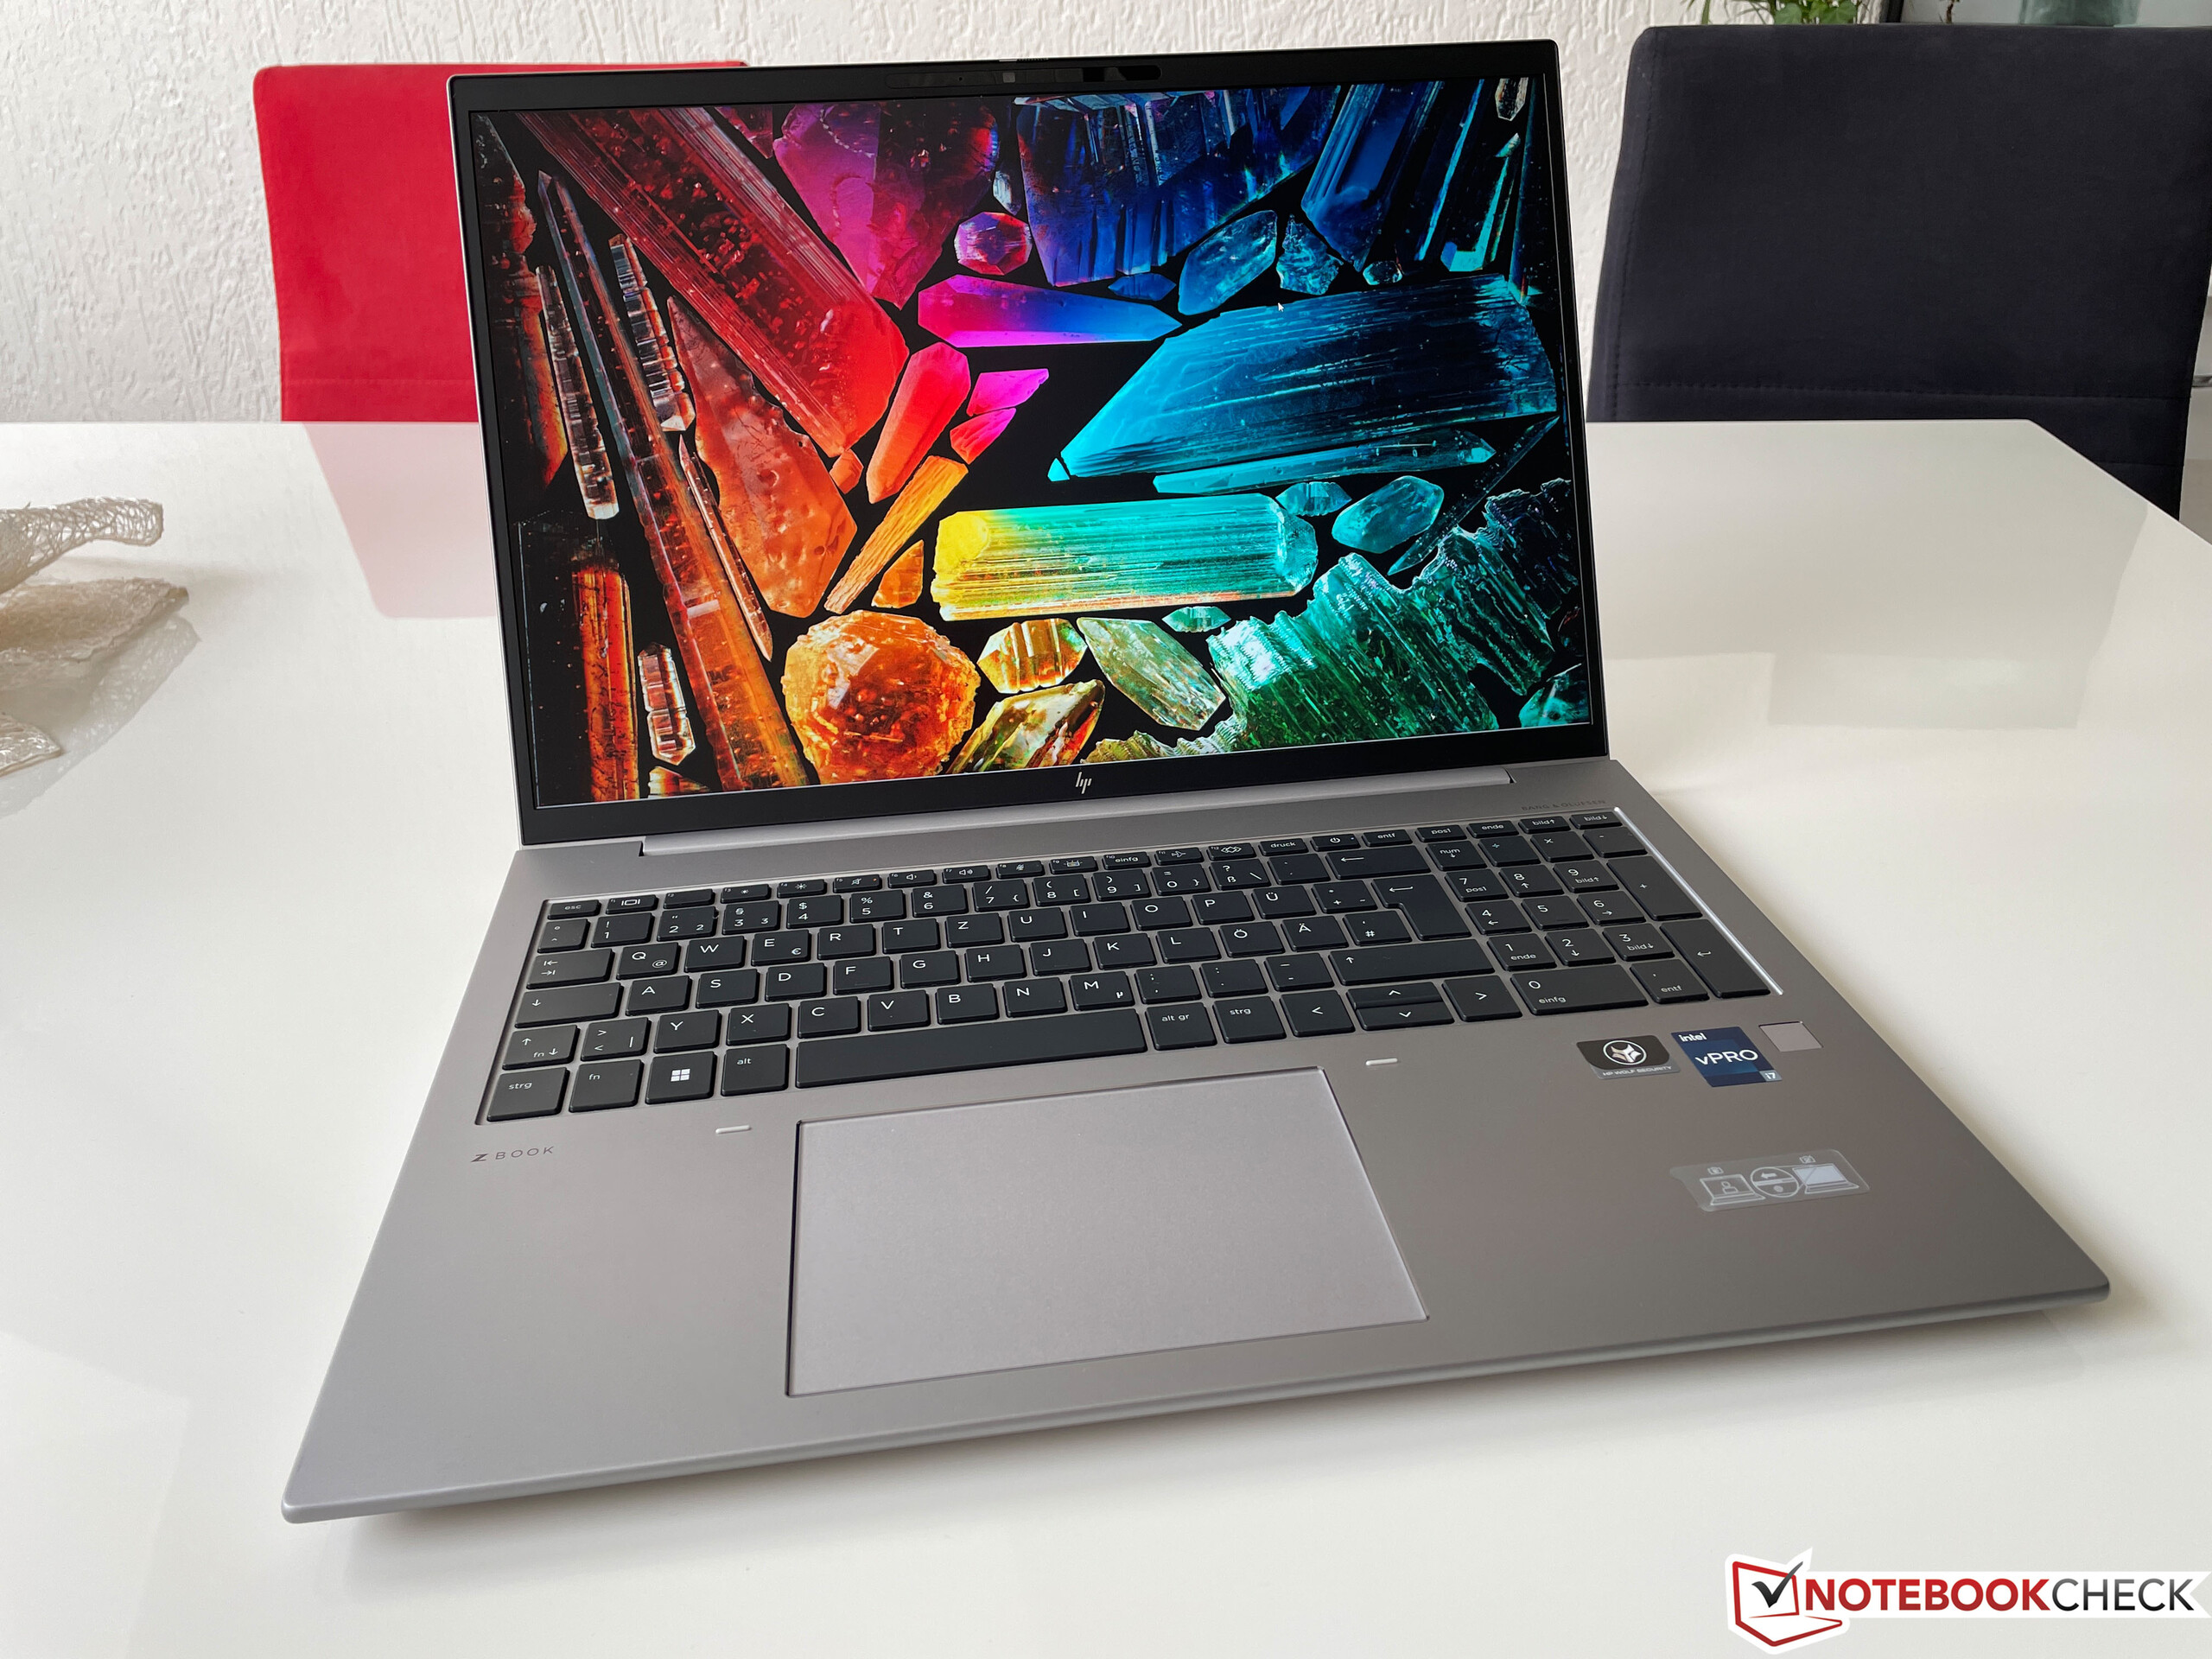
Rispetto al modello Modello G8dell'anno scorso, HP utilizza elementi di design più arrotondati per il nuovo Firefly G9 (che comprende sia il modello da 16 pollici che quello da 14 pollici) con una buona tattilità. Non offre grosse sorprese e lo chassis argentato, interamente in alluminio, dà un'impressione di grande qualità. L'unità di base è estremamente resistente alle torsioni degli angoli e cede appena sotto pressione. Il coperchio continua questa tendenza, con una minima sensibilità alla torsione e nessuna distorsione del display anche se sottoposto a una pressione mirata sul retro. Nel frattempo, le cerniere sono leggermente troppo allentate. Sebbene il display possa essere facilmente aperto con una sola mano, le cerniere non impediscono completamente il traballamento o la chiusura del display a piccoli angoli. Il display può essere aperto con un angolo massimo di 180 gradi.
Lo ZBook Firefly è piuttosto discreto dal punto di vista visivo, poiché il logo Z lucido sul coperchio, la tastiera nera e le cornici nere del display sono gli unici elementi di contrasto evidenti. Le cornici su tutti i lati sono piuttosto strette e il dispositivo ha un aspetto molto moderno.
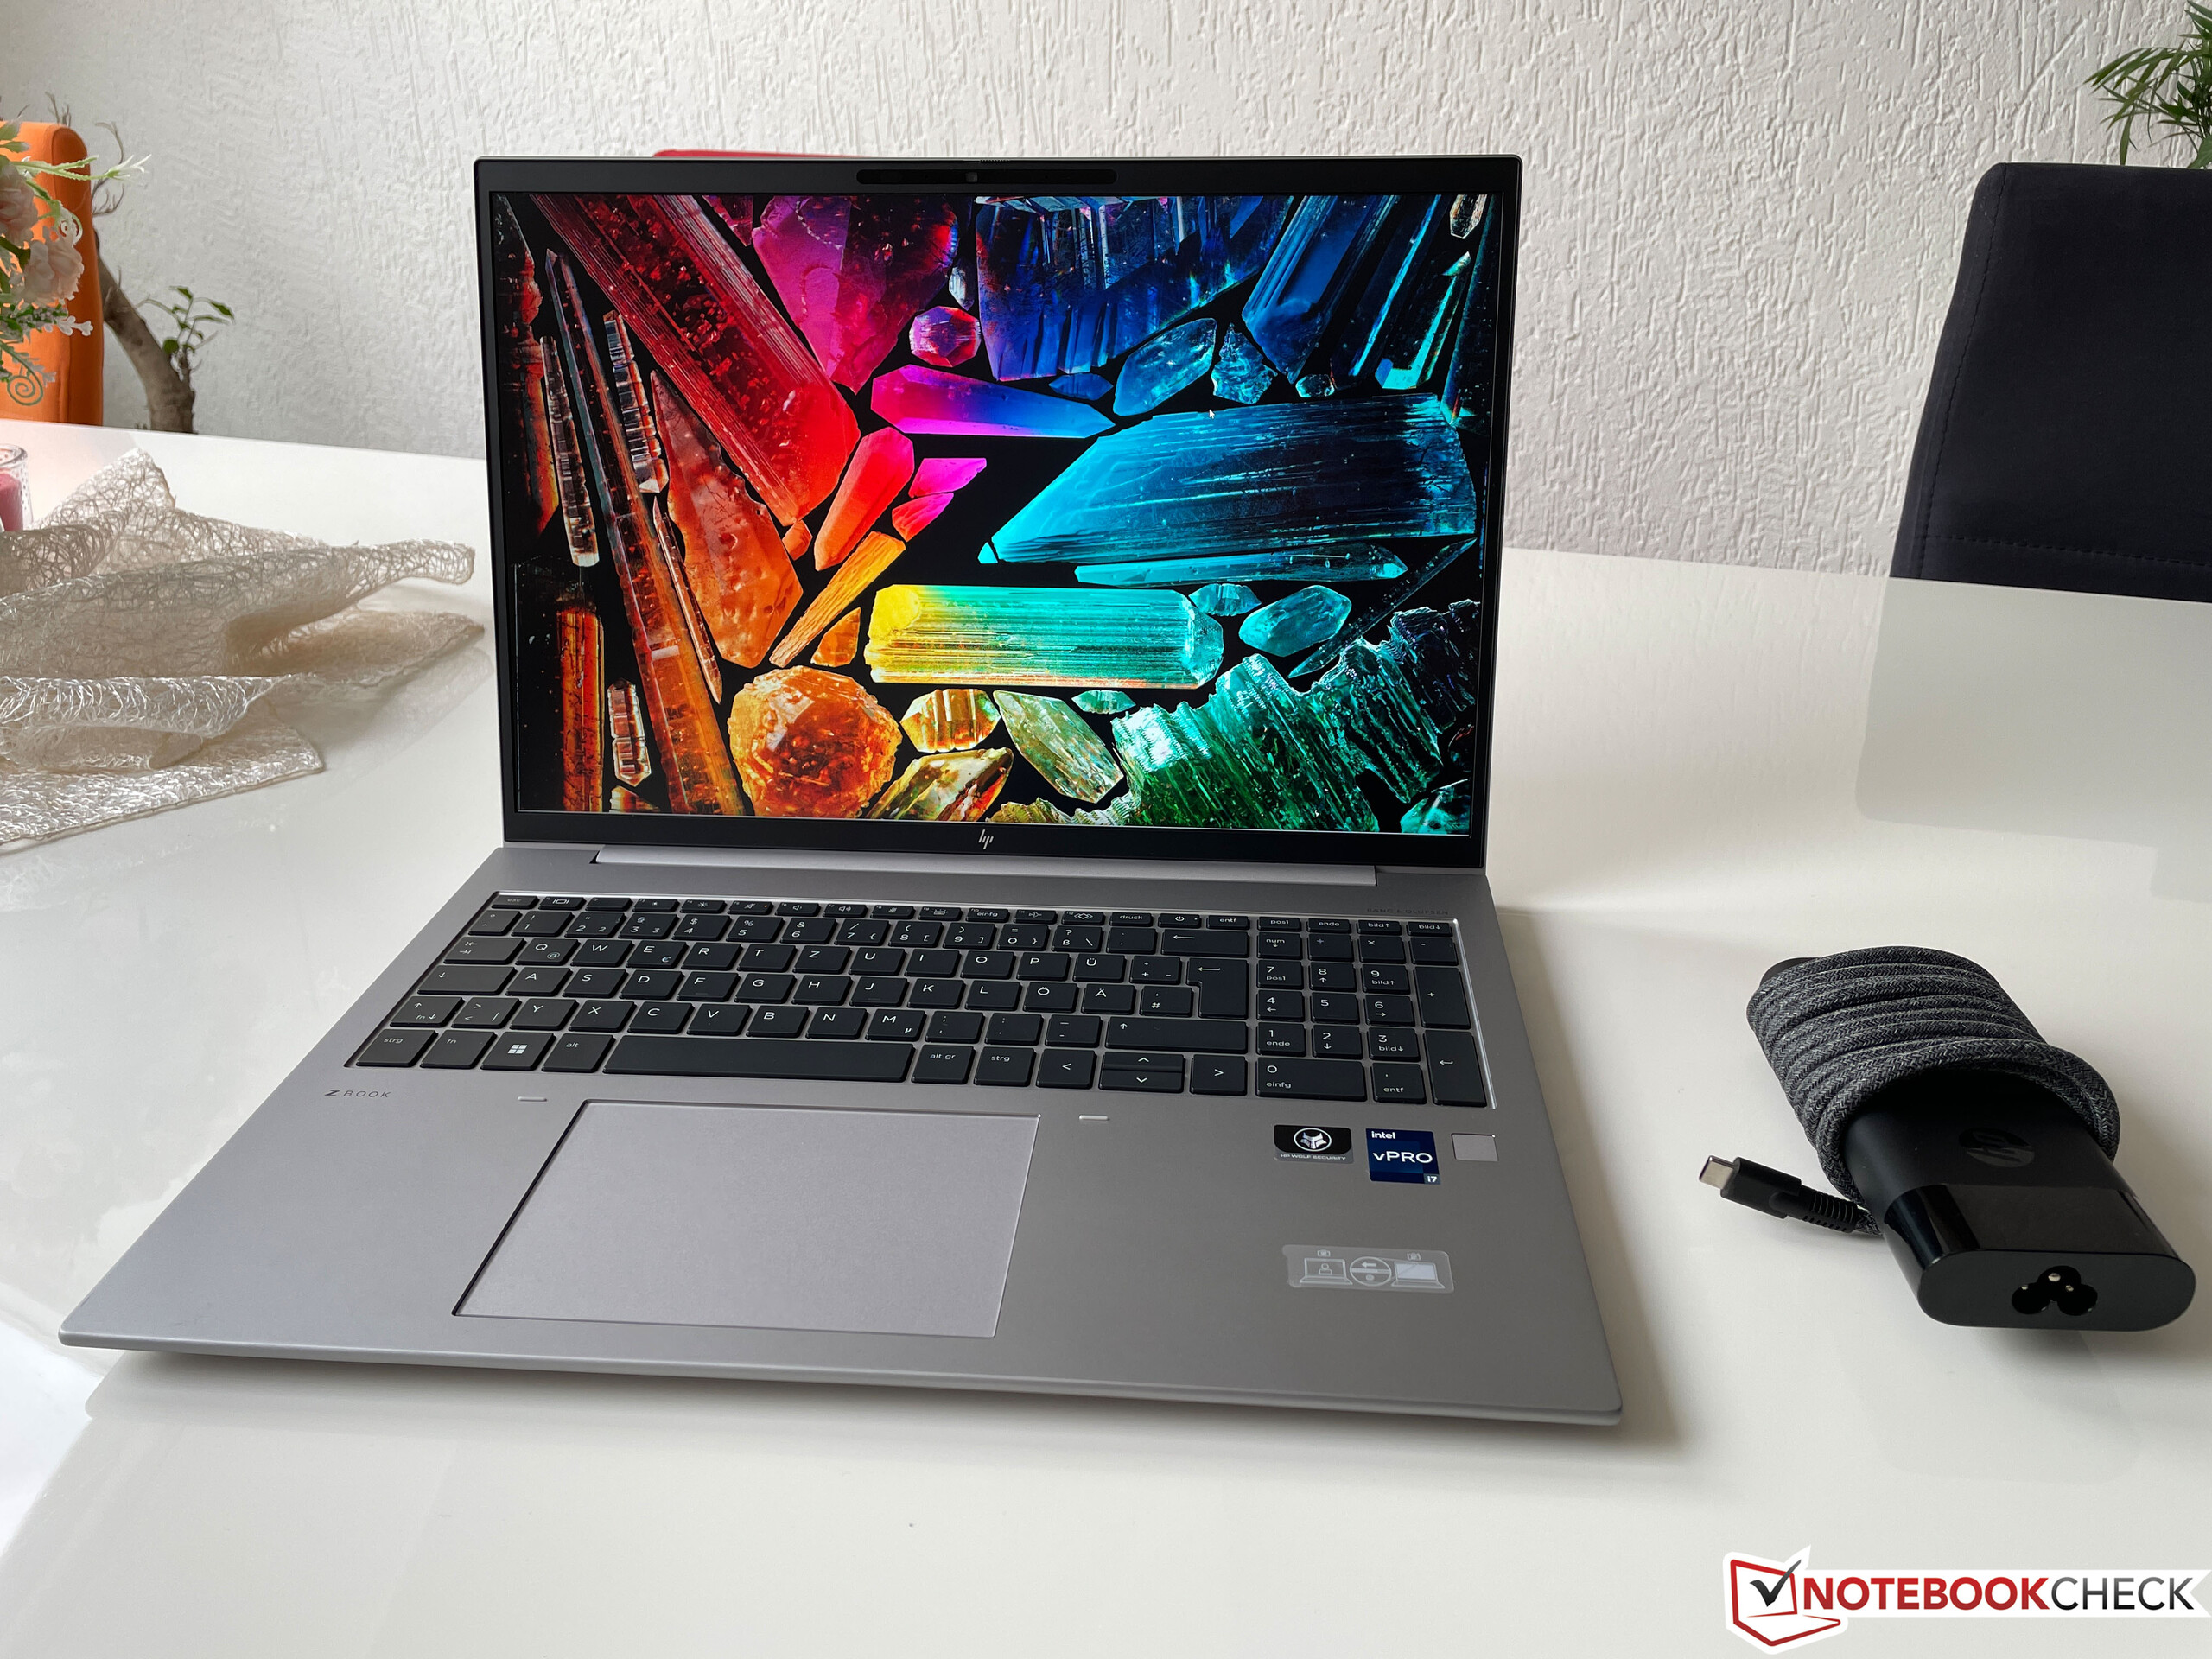
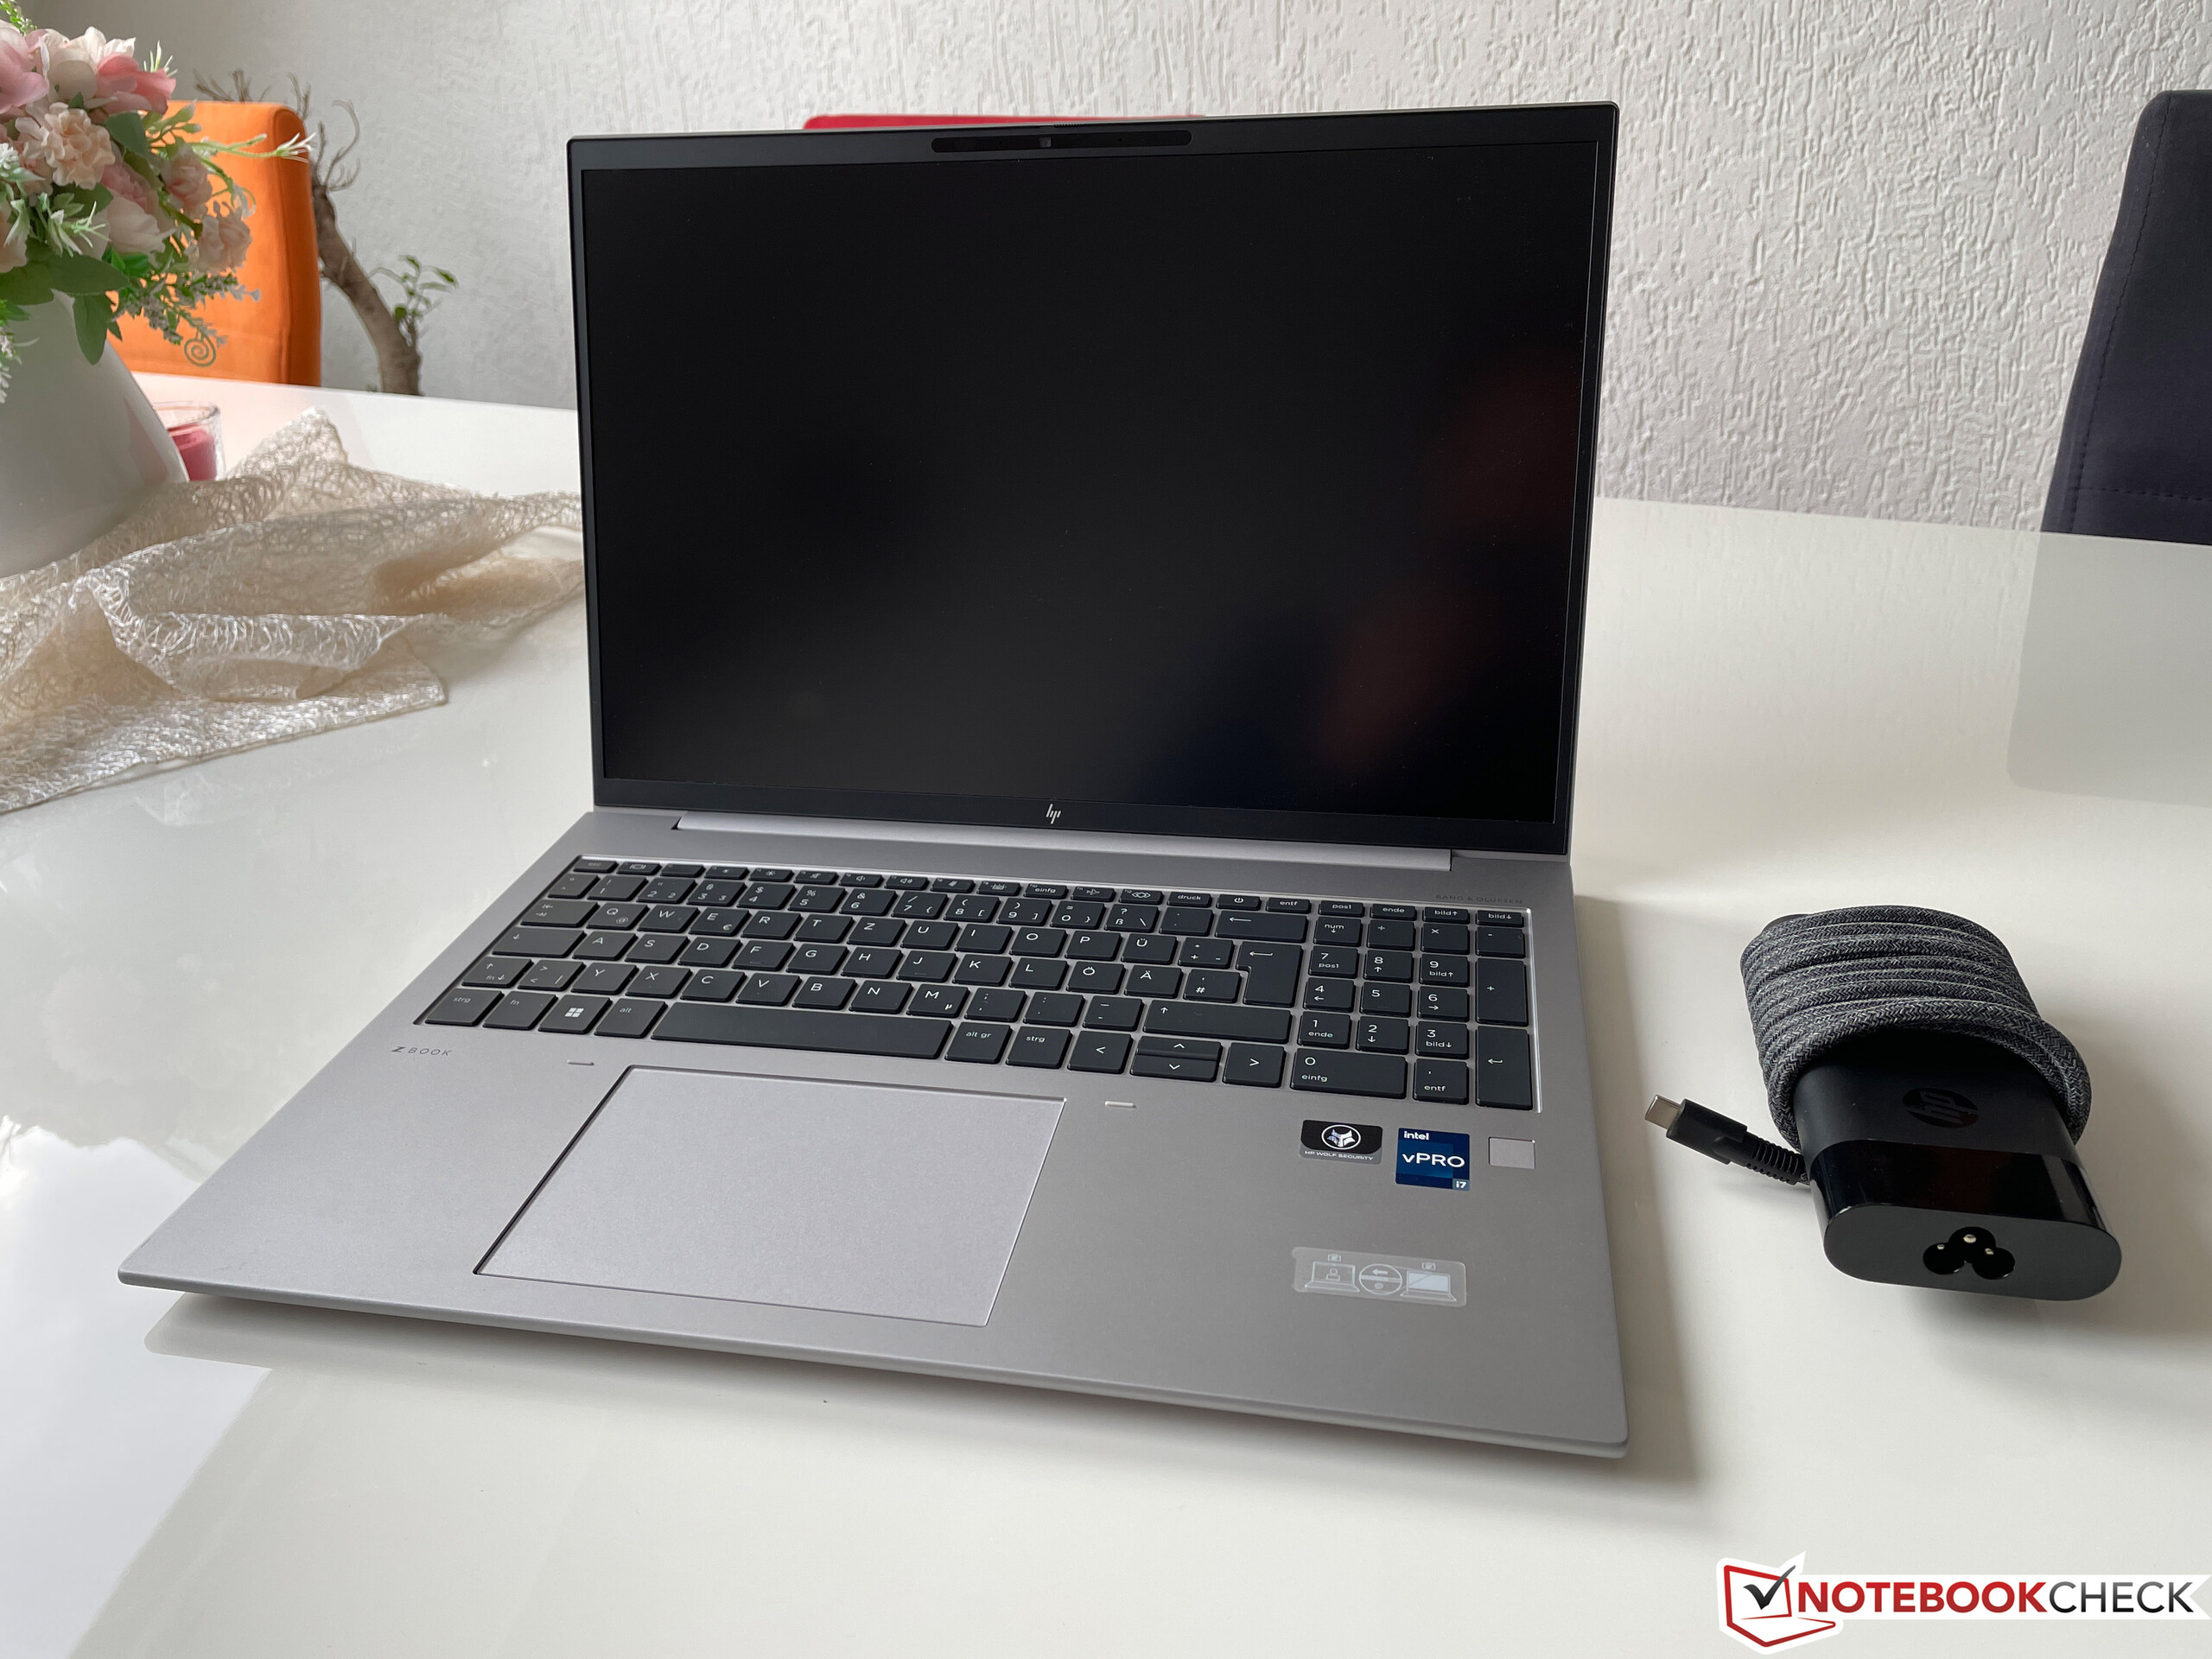
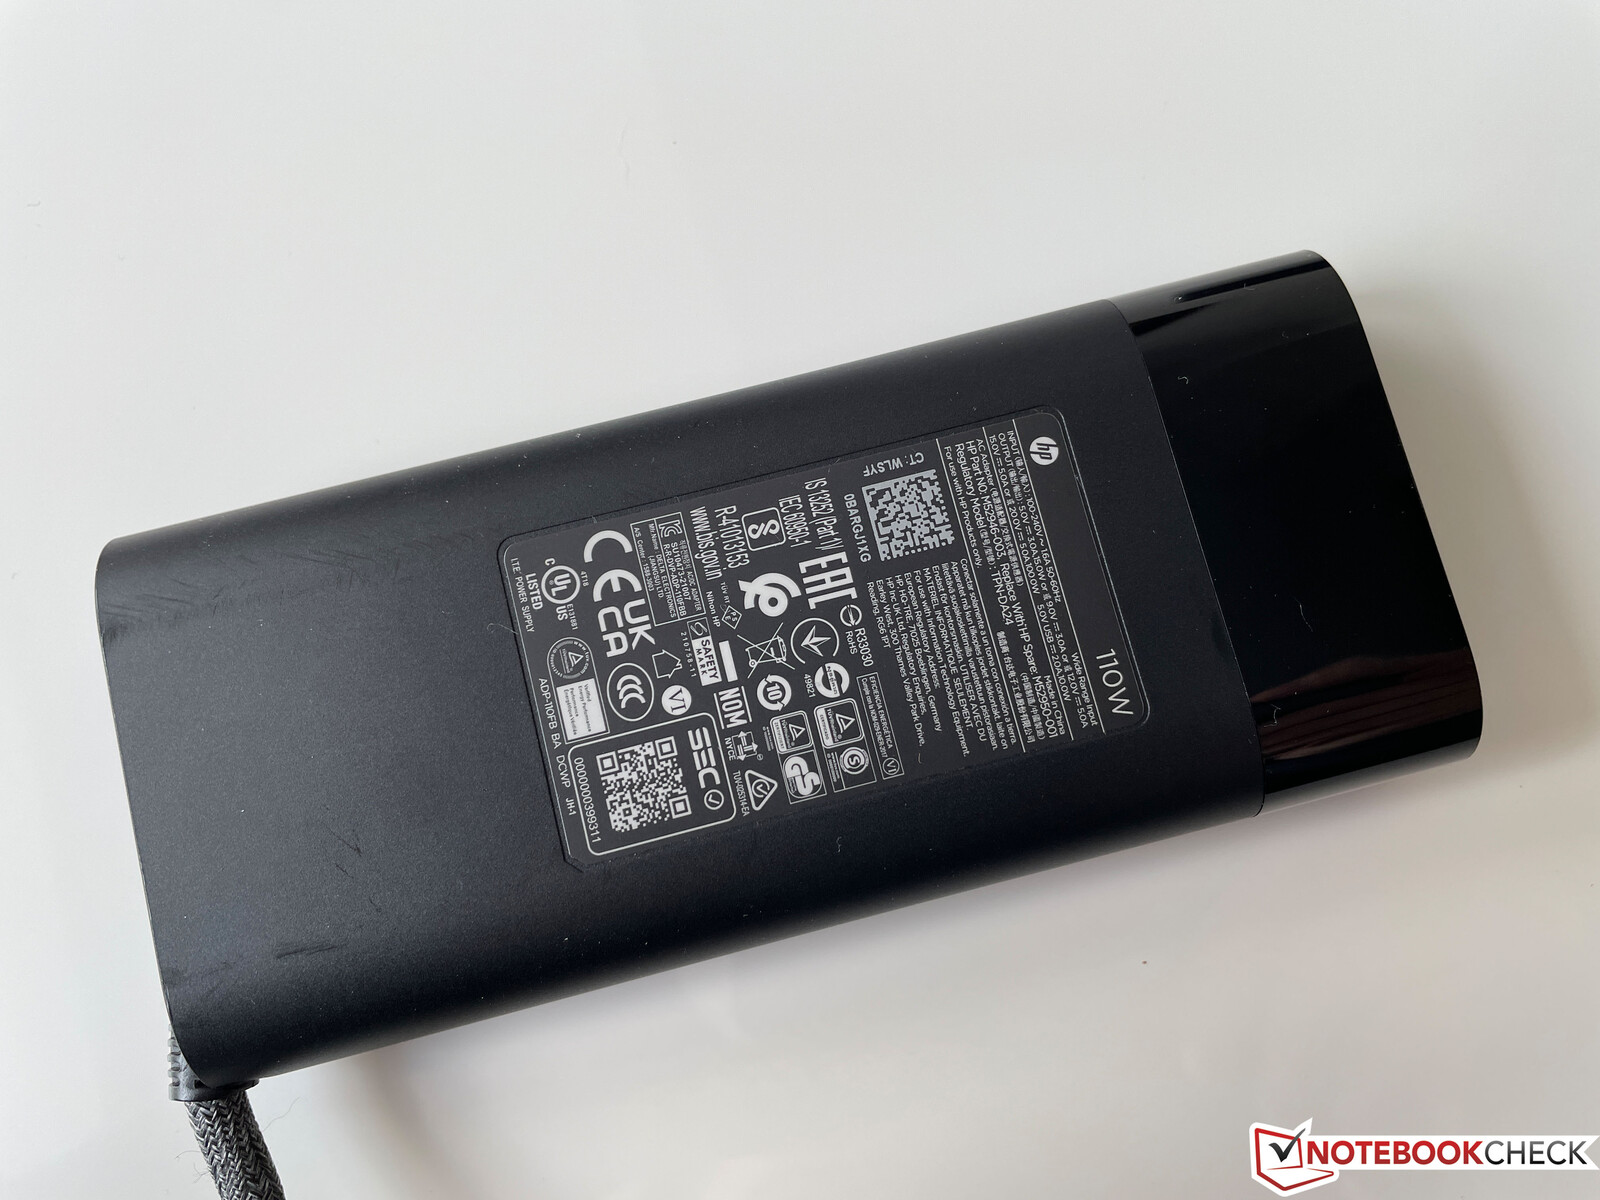
Il Firefly 16 G9 è relativamente compatto per un modello da 16 pollici e solo leggermente più largo rispetto, ad esempio, al vecchio ZBook Firefly 15 G8 ZBook Firefly 15 G8. Il peso è di quasi 2 kg (~4,4 libbre), mentre il caricabatterie da 110 watt pesa quasi altri 500 grammi (~1,1 libbre).
Connettività - Firefly con Thunderbolt 4 e Wi-Fi 6E
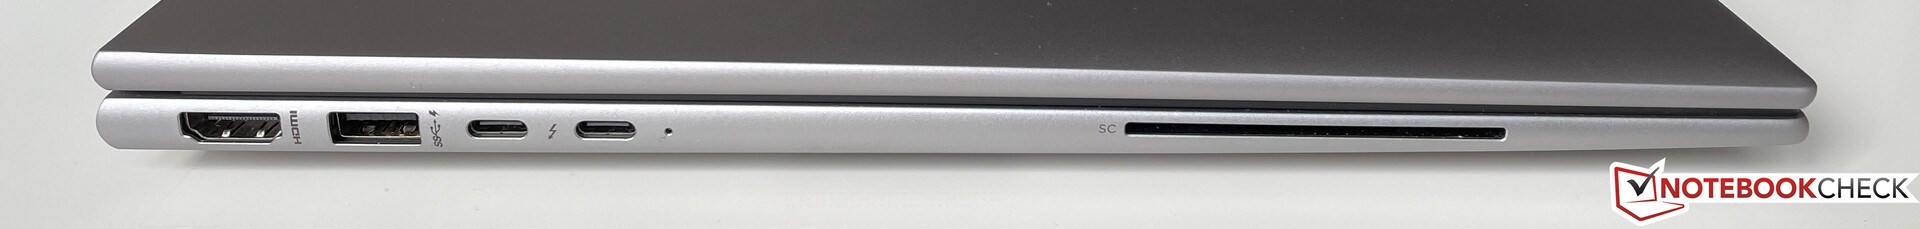
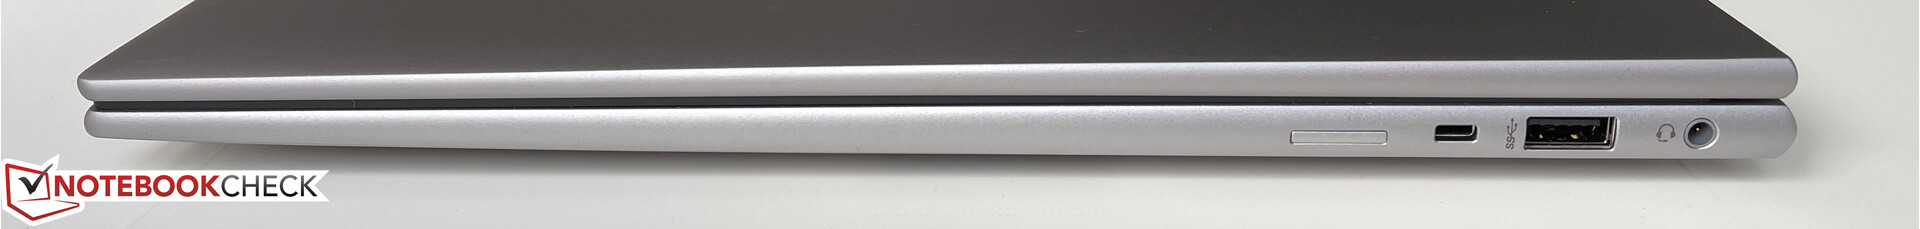
La maggior parte delle porte si trova sul lato sinistro del case, dove sono presenti una normale porta USB di tipo-A, un'uscita HDMI e un lettore di smart card oltre a due porte USB di tipo-C. Grazie alla Thunderbolt 4 integrata, lo ZBook è al passo con gli standard attuali, anche se la workstation è priva di una porta Ethernet (che può essere aggiunta tramite un adattatore USB-C).
Comunicazione
Lo ZBook Firefly può essere configurato - ma non adattato - con un modulo opzionale LTE o addirittura 5G. Il moderno modulo AX211E di Intel gestisce le comunicazioni wireless e supporta tutti gli standard Wi-Fi più recenti e il Bluetooth 5.2. Nei nostri test, la connessione alla rete a 6 GHz del nostro router di riferimento Asus è stata stabilita senza problemi e le velocità di trasferimento sono state sempre eccellenti.
Webcam
Le specifiche della webcam riportate sulla scheda tecnica sono un po' confuse, poiché HP menziona una fotocamera IR da 5 MP. Mentre non possiamo fare alcuna dichiarazione sulla risoluzione della fotocamera IR (che viene utilizzata per il riconoscimento facciale tramite Windows Hello), la fotocamera principale cattura immagini fino a 3,7 MP (2560 x 1440 pixel). I vantaggi della risoluzione più elevata rispetto alle vecchie webcam sono molto evidenti, anche se la precisione dei colori non è niente di eccezionale.


Manutenzione
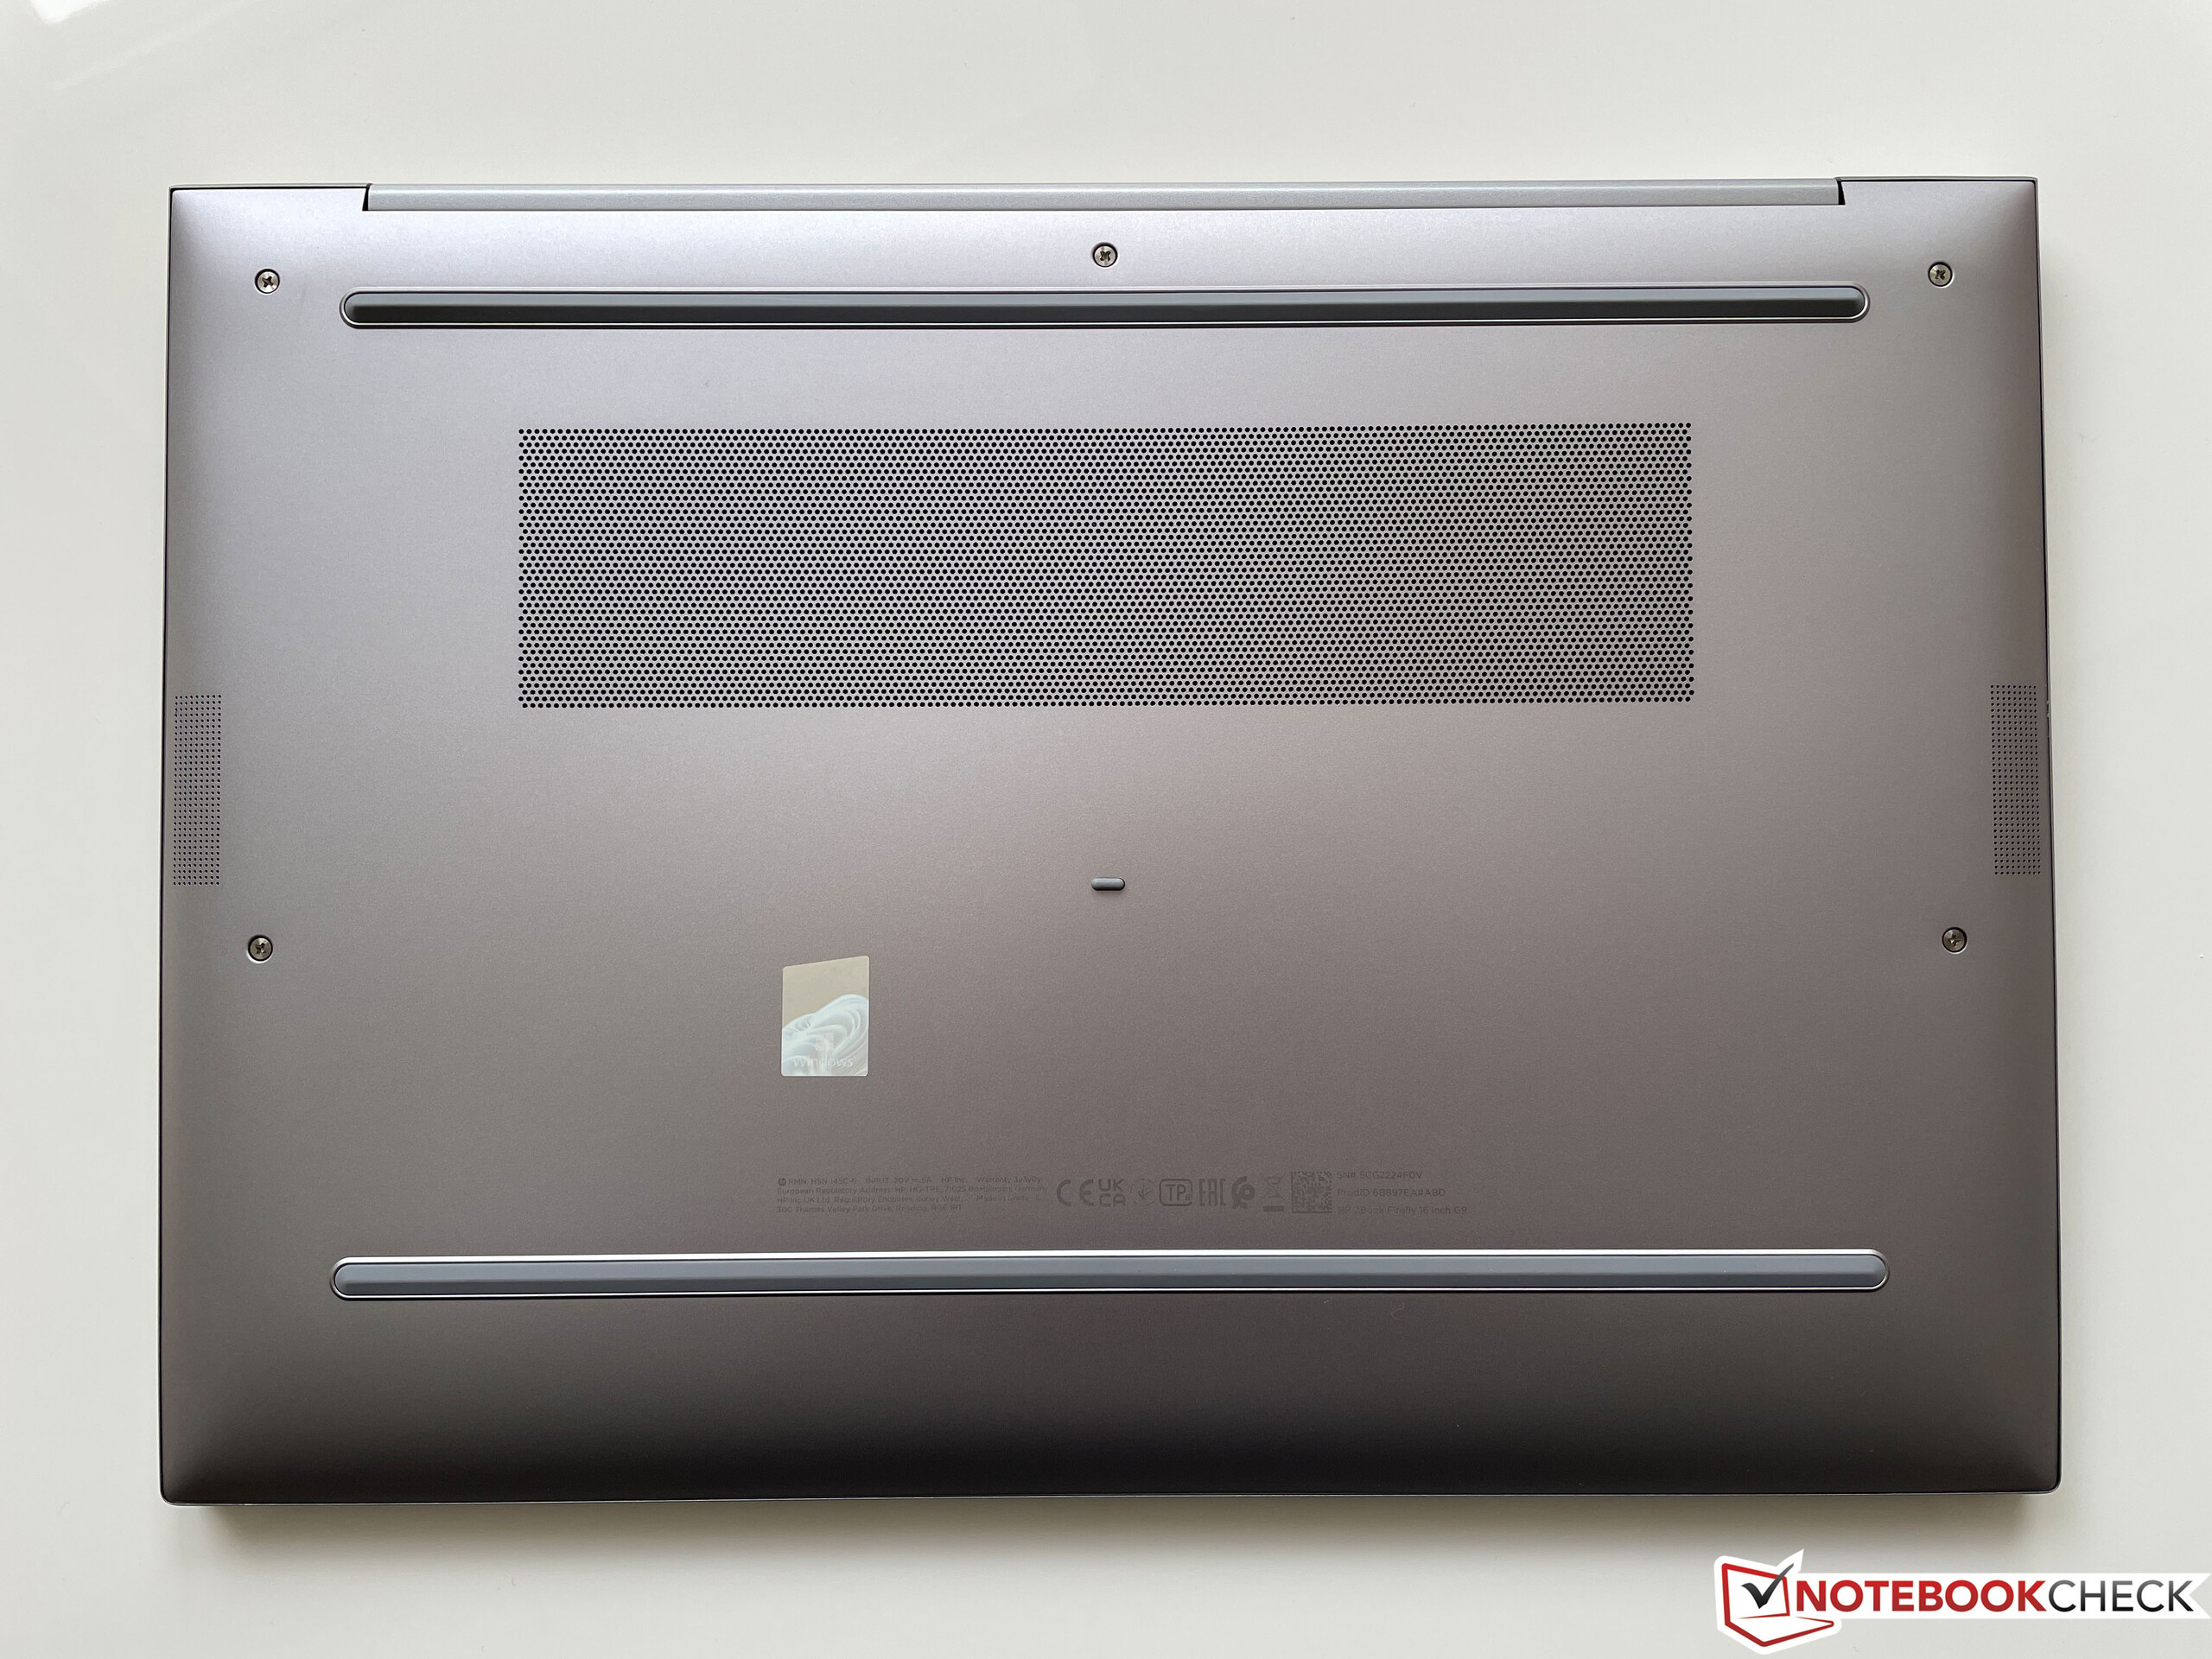
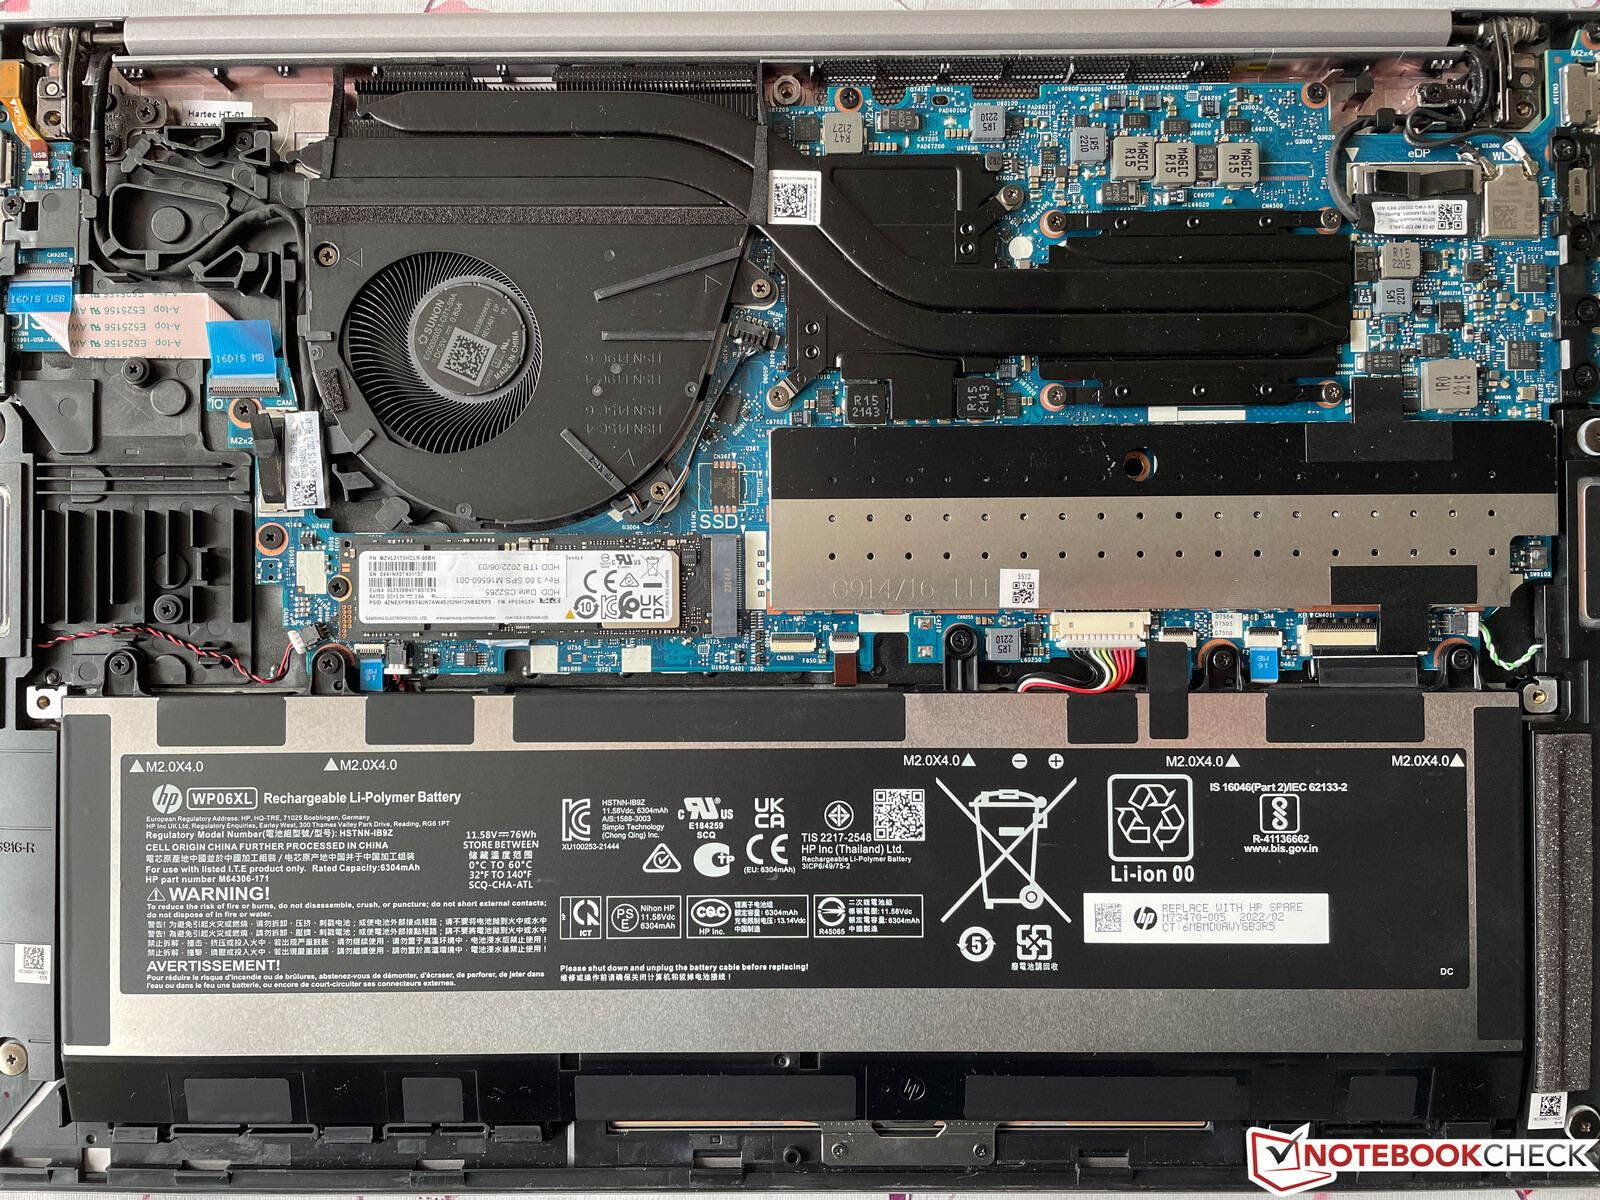
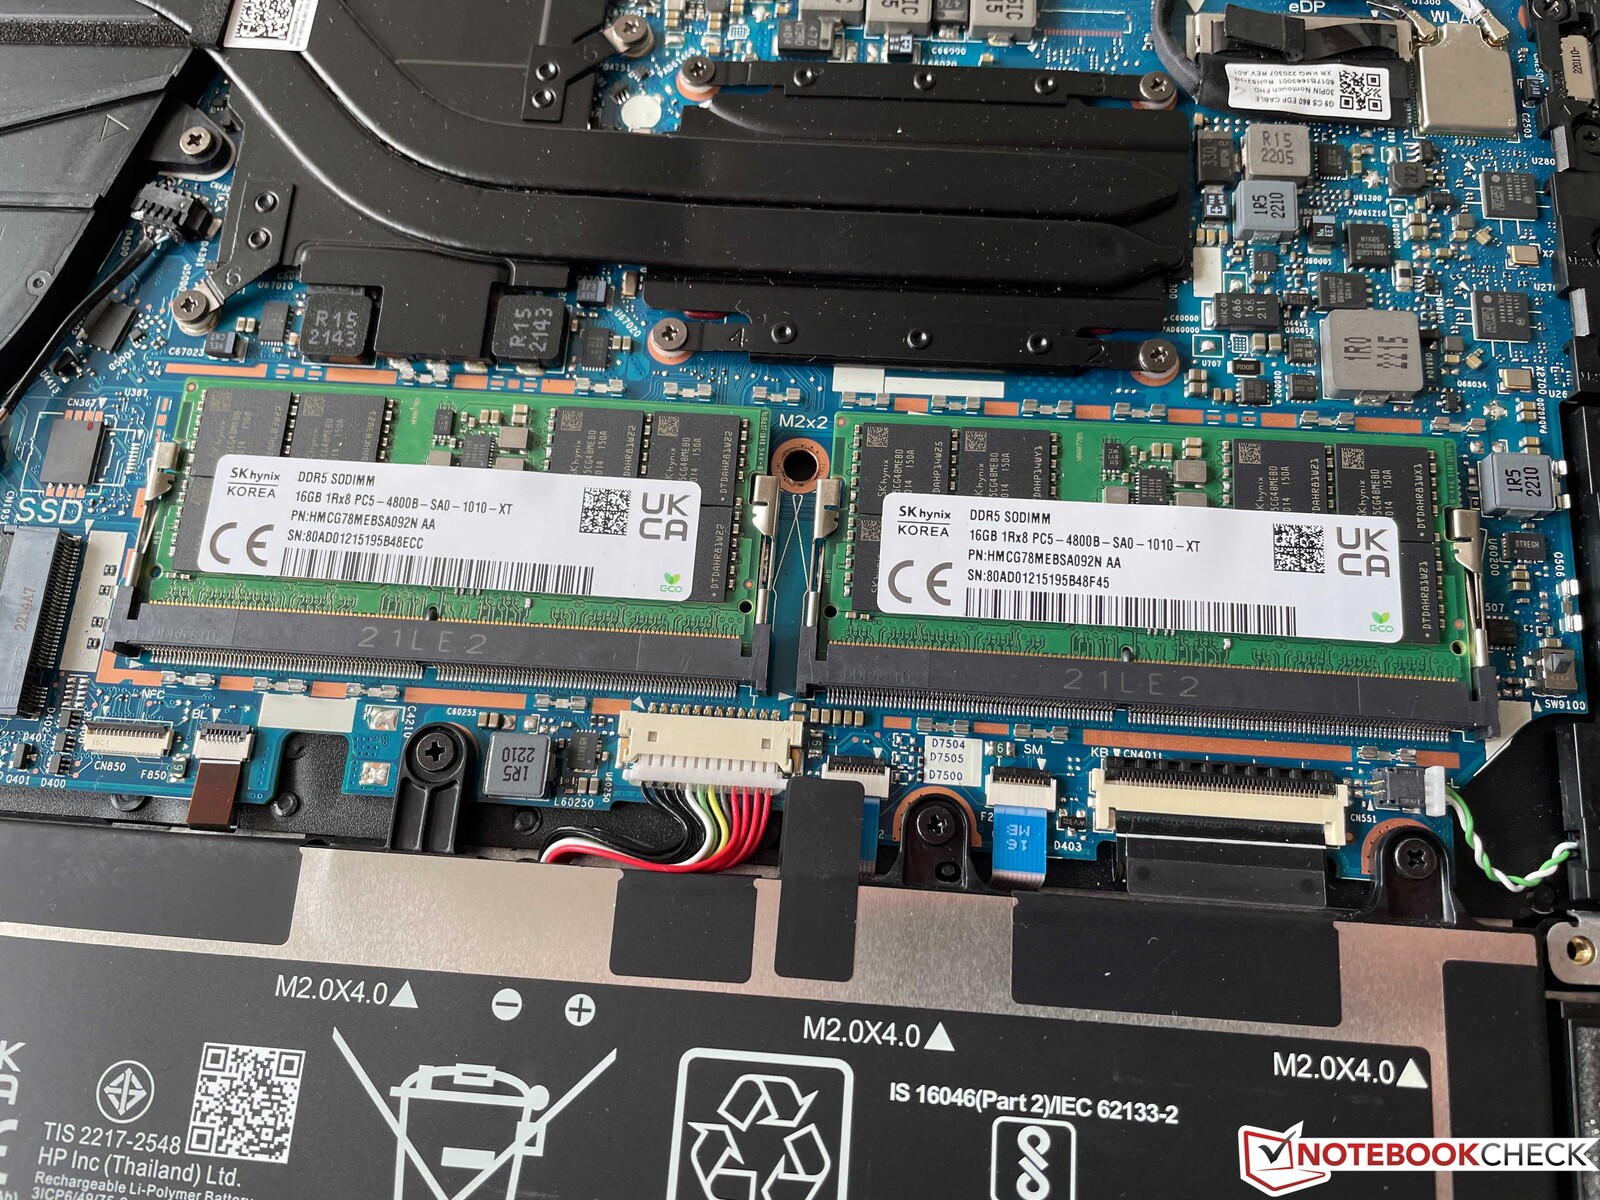
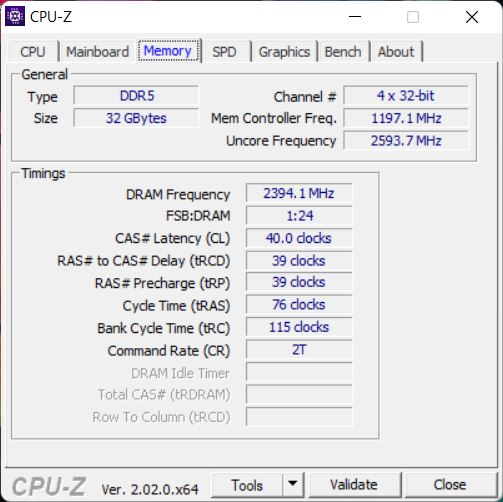
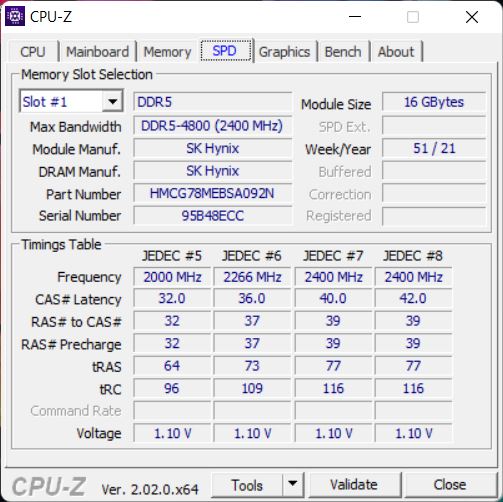
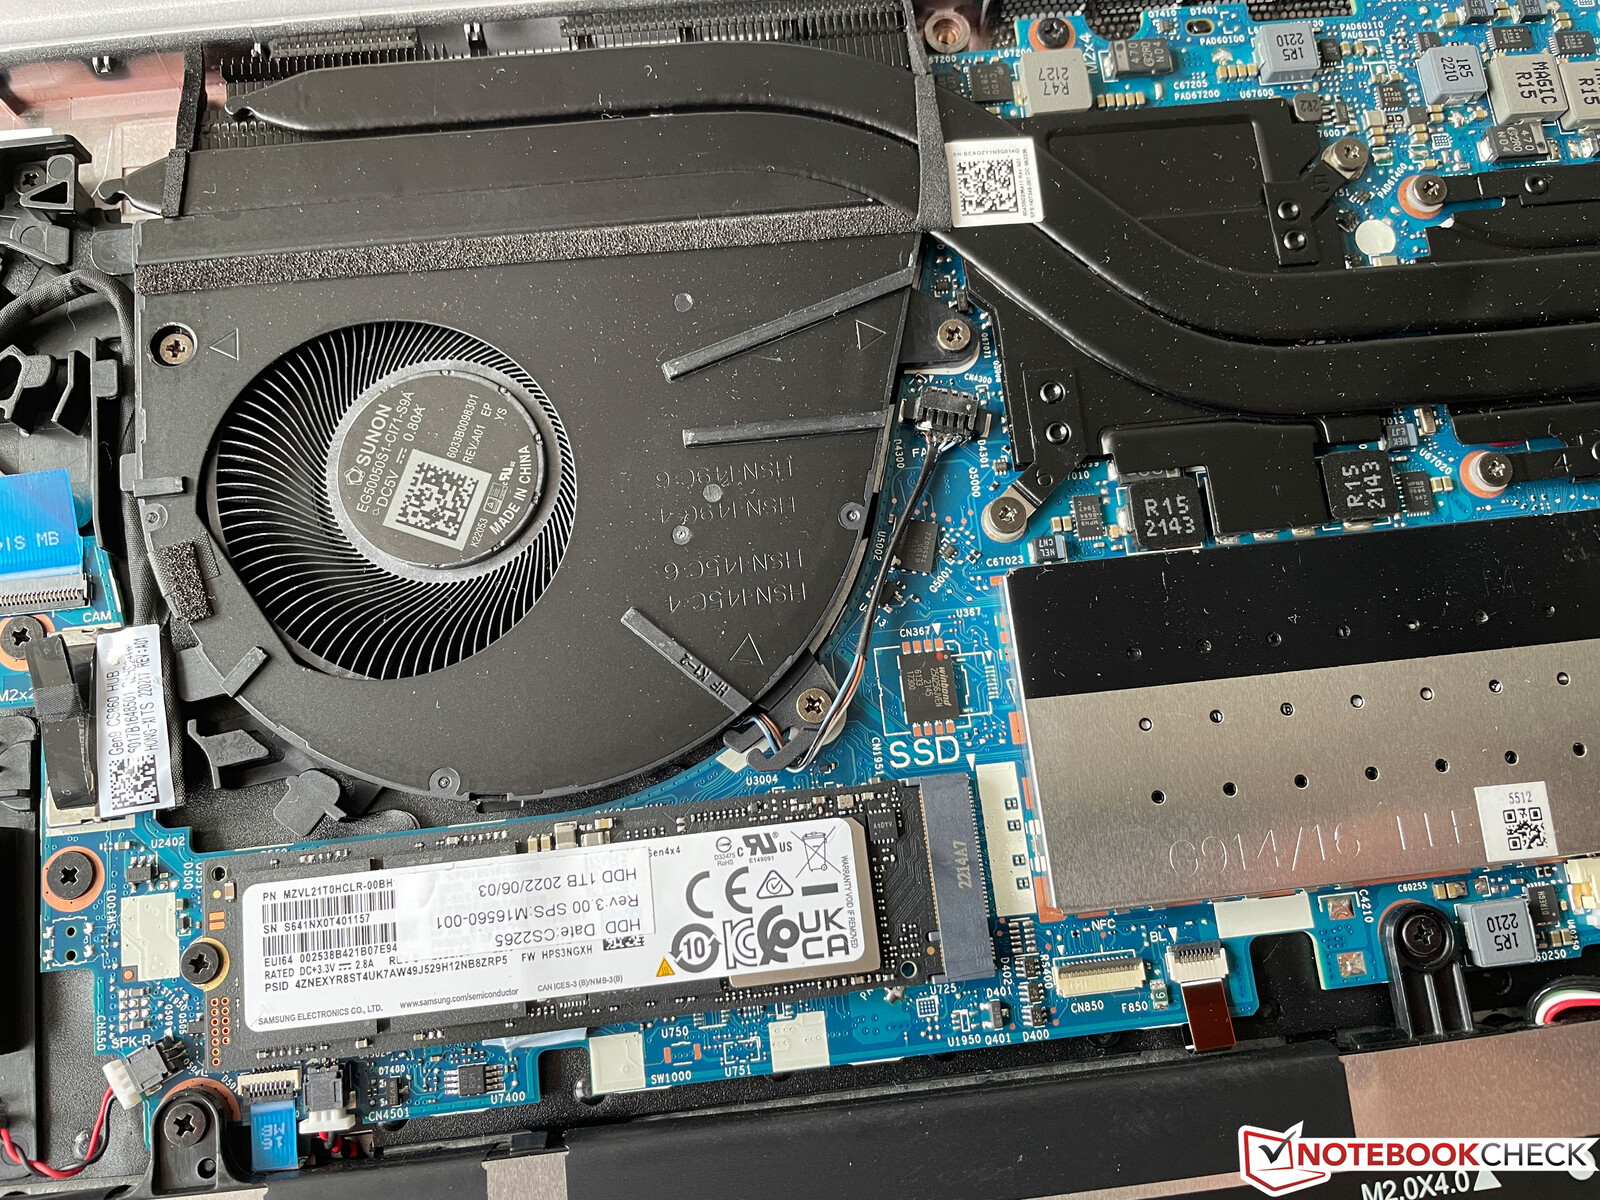
La piastra inferiore può essere facilmente rimossa, poiché vengono utilizzate esclusivamente viti standard con testa a croce (che devono essere solo allentate, non rimosse con la forza). All'interno, gli utenti hanno accesso alla batteria, alla ventola, all'unità SSD M.2-2280 e a entrambi i moduli SODIMM, che sono nascosti sotto un'ulteriore copertura. Il modulo Wi-Fi non può essere aggiornato.
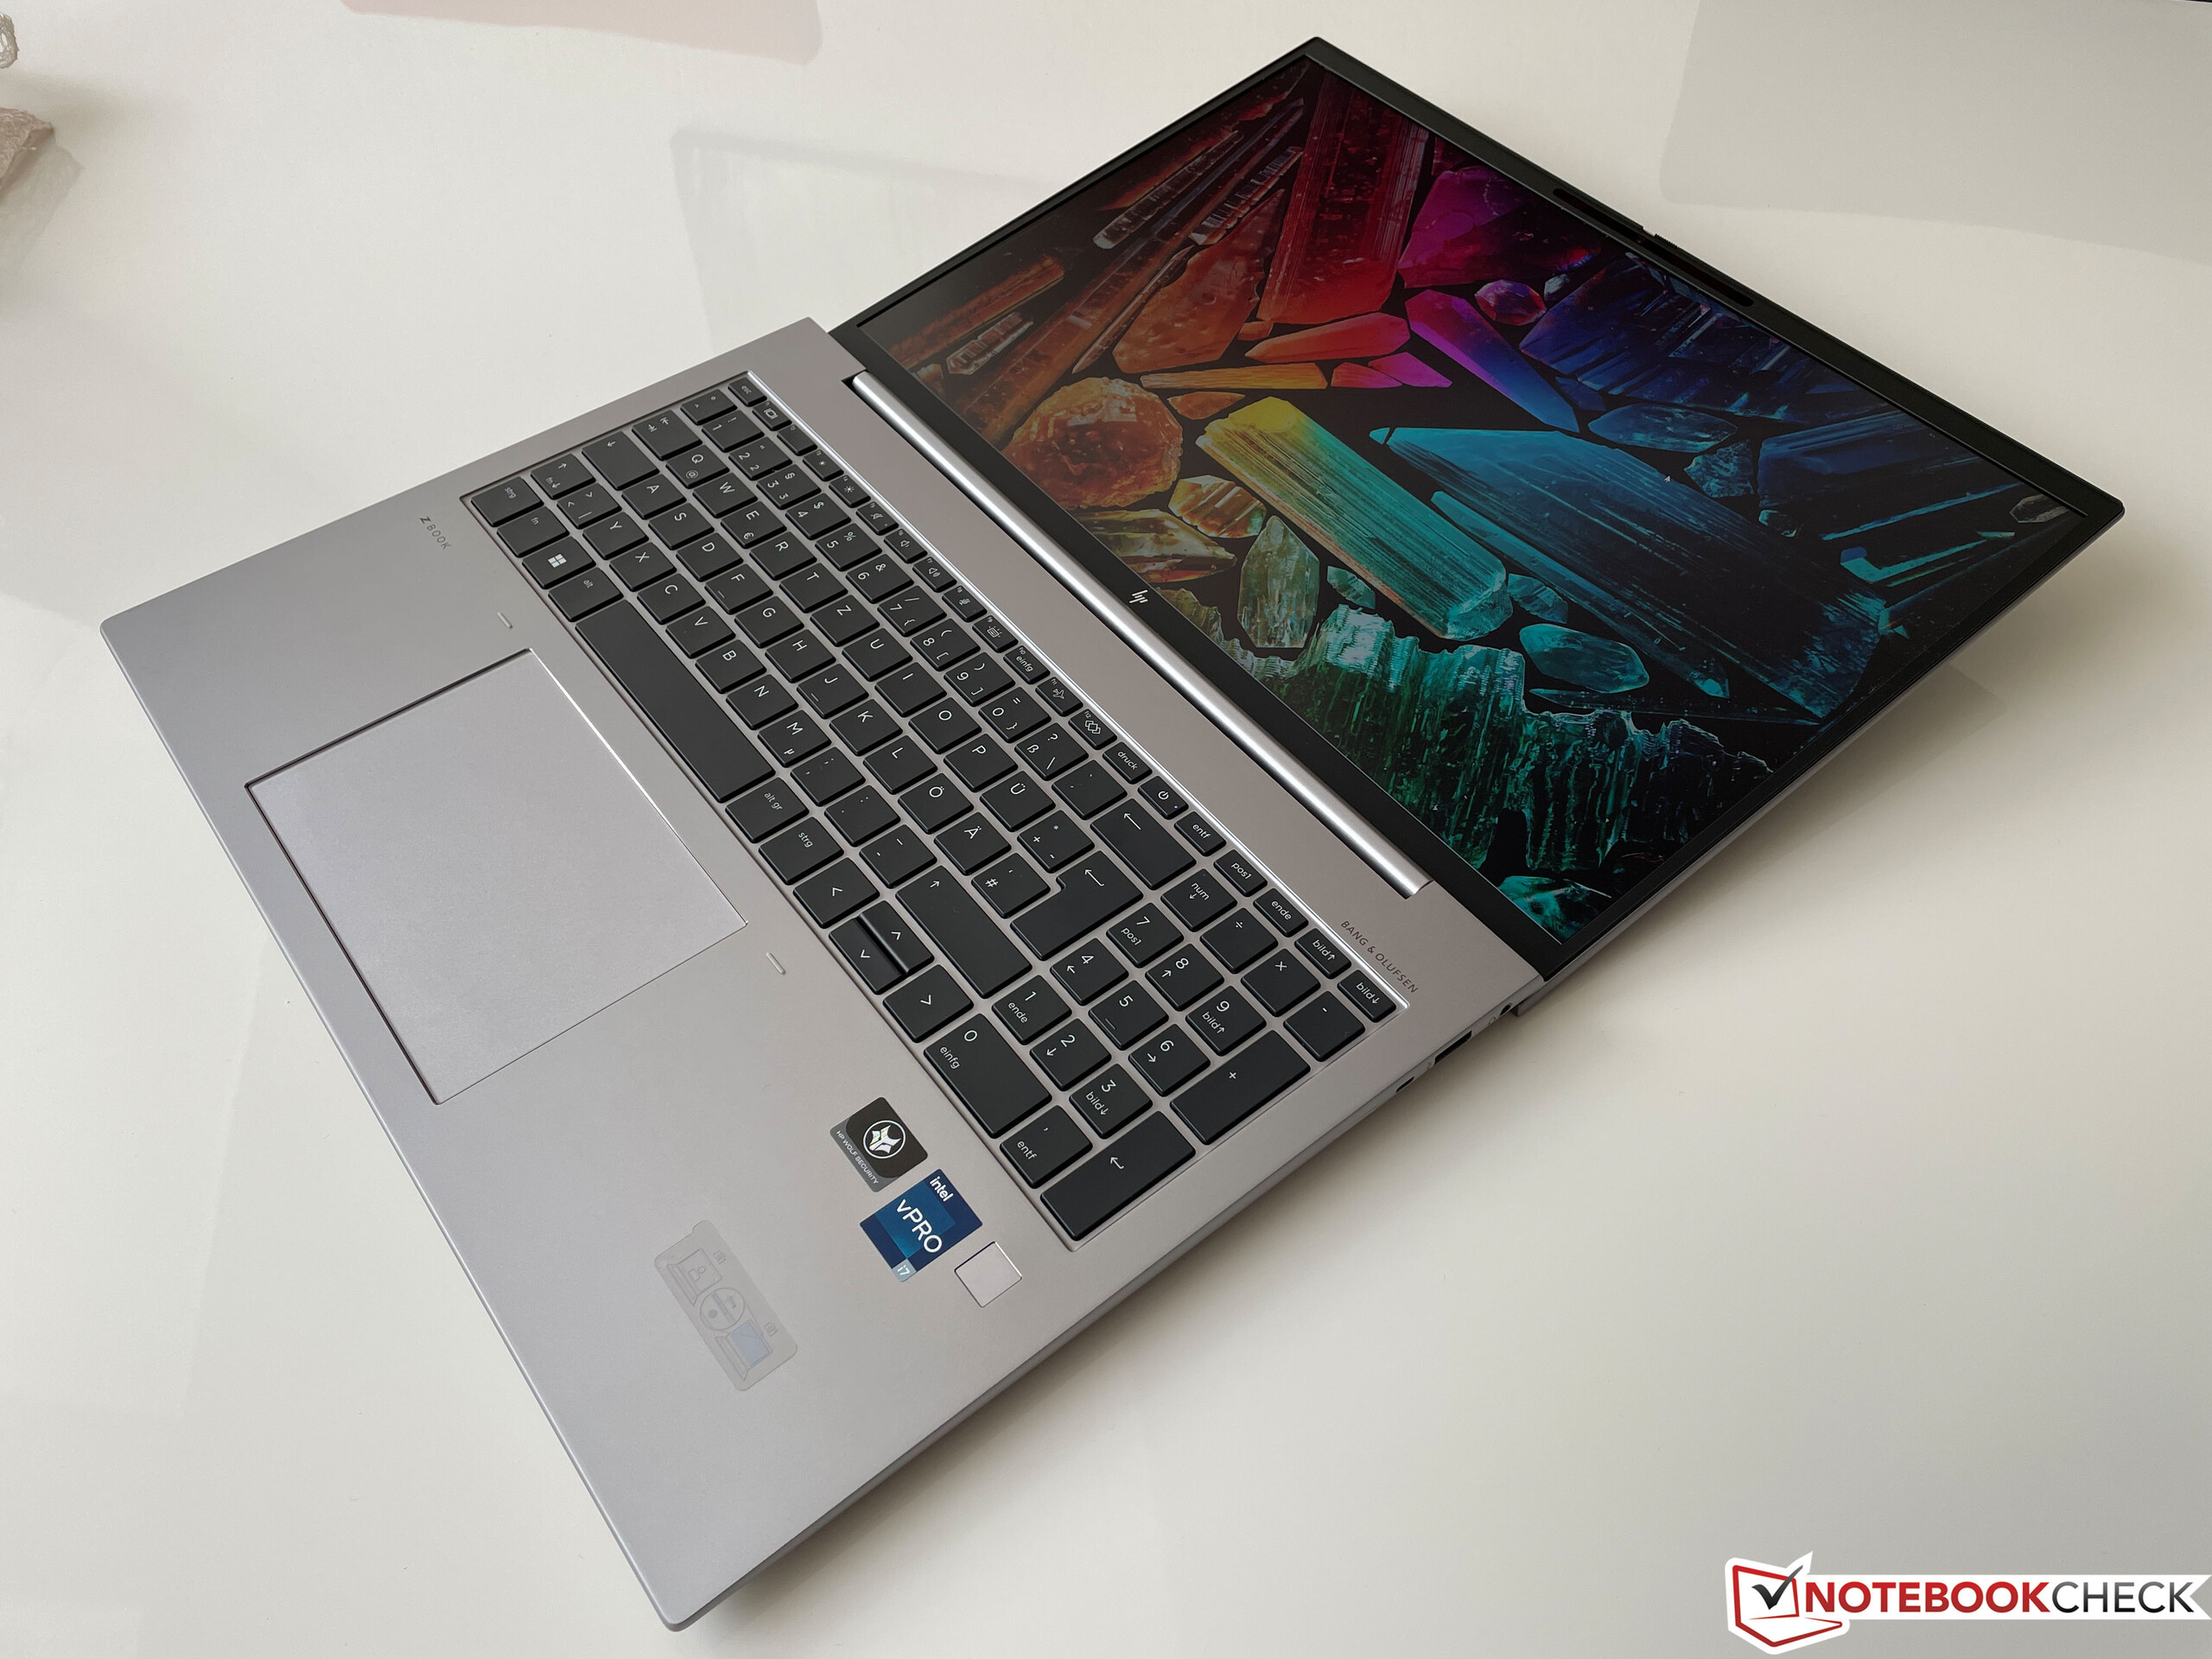
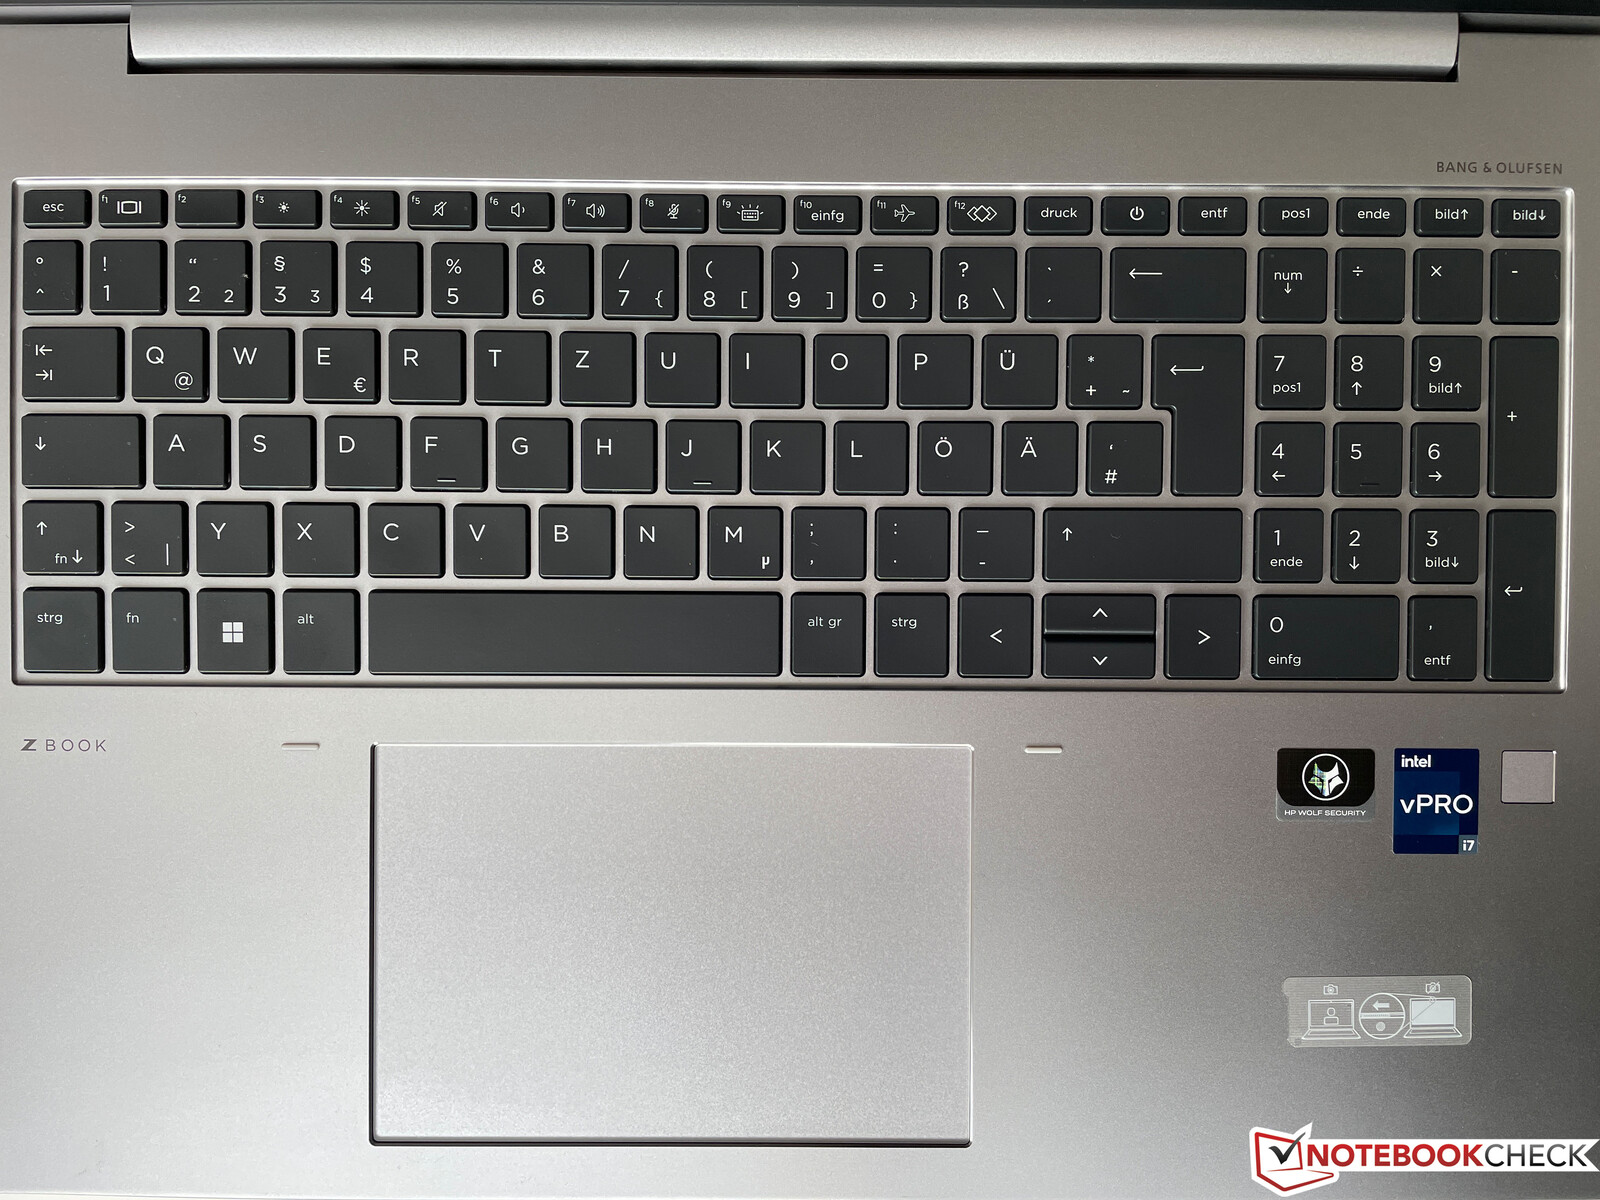
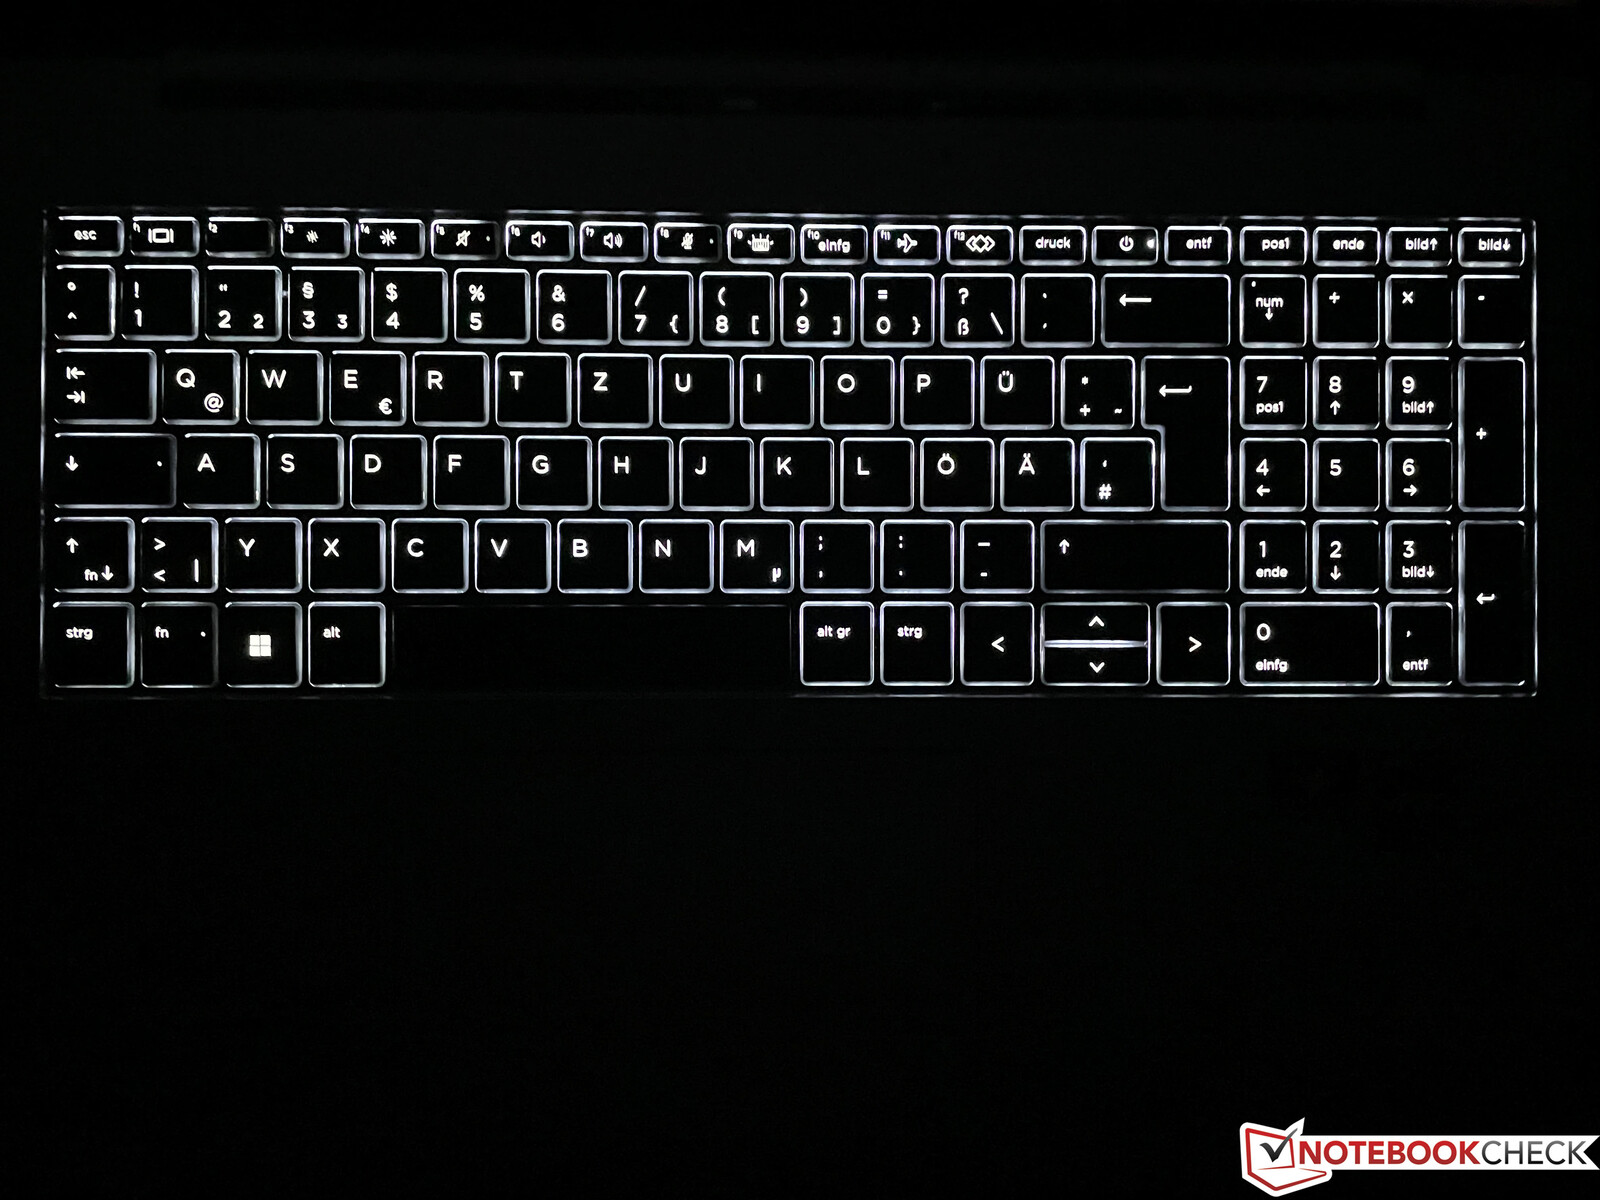
Dispositivi di input - ZBook con una tastiera eccellente
HP utilizza una tastiera con tastierino numerico, retroilluminazione bianca con due impostazioni di luminosità e resistenza agli spruzzi d'acqua. Nel complesso siamo molto soddisfatti della tastiera e, poiché HP non ha ripetutamente ridotto la corsa dei tasti, la tastiera è soggettivamente migliore di quella degli attuali modelli ThinkPad di Lenovo. Tuttavia, poiché il feedback è piuttosto deciso, l'impressione della tastiera può cambiare a seconda delle preferenze personali. Il pulsante di accensione è integrato nella tastiera, il che non è proprio l'ideale, ed è presente un lettore di impronte digitali sotto la parte inferiore destra della tastiera.
Poiché HP ha omesso il trackpoint al centro della tastiera, il grande clickpad è l'unico metodo di input del mouse disponibile per impostazione predefinita. È leggermente spostato verso sinistra e, con le sue dimensioni di 12,8 x 8,7 cm (~5,04 x 3,43 pollici), è sufficientemente grande anche per i gesti che richiedono fino a quattro dita. La superficie liscia offre buone proprietà di scorrimento e il controllo del cursore è impeccabile. I clic possono essere attivati nella parte inferiore del pad e hanno un suono piacevolmente profondo.
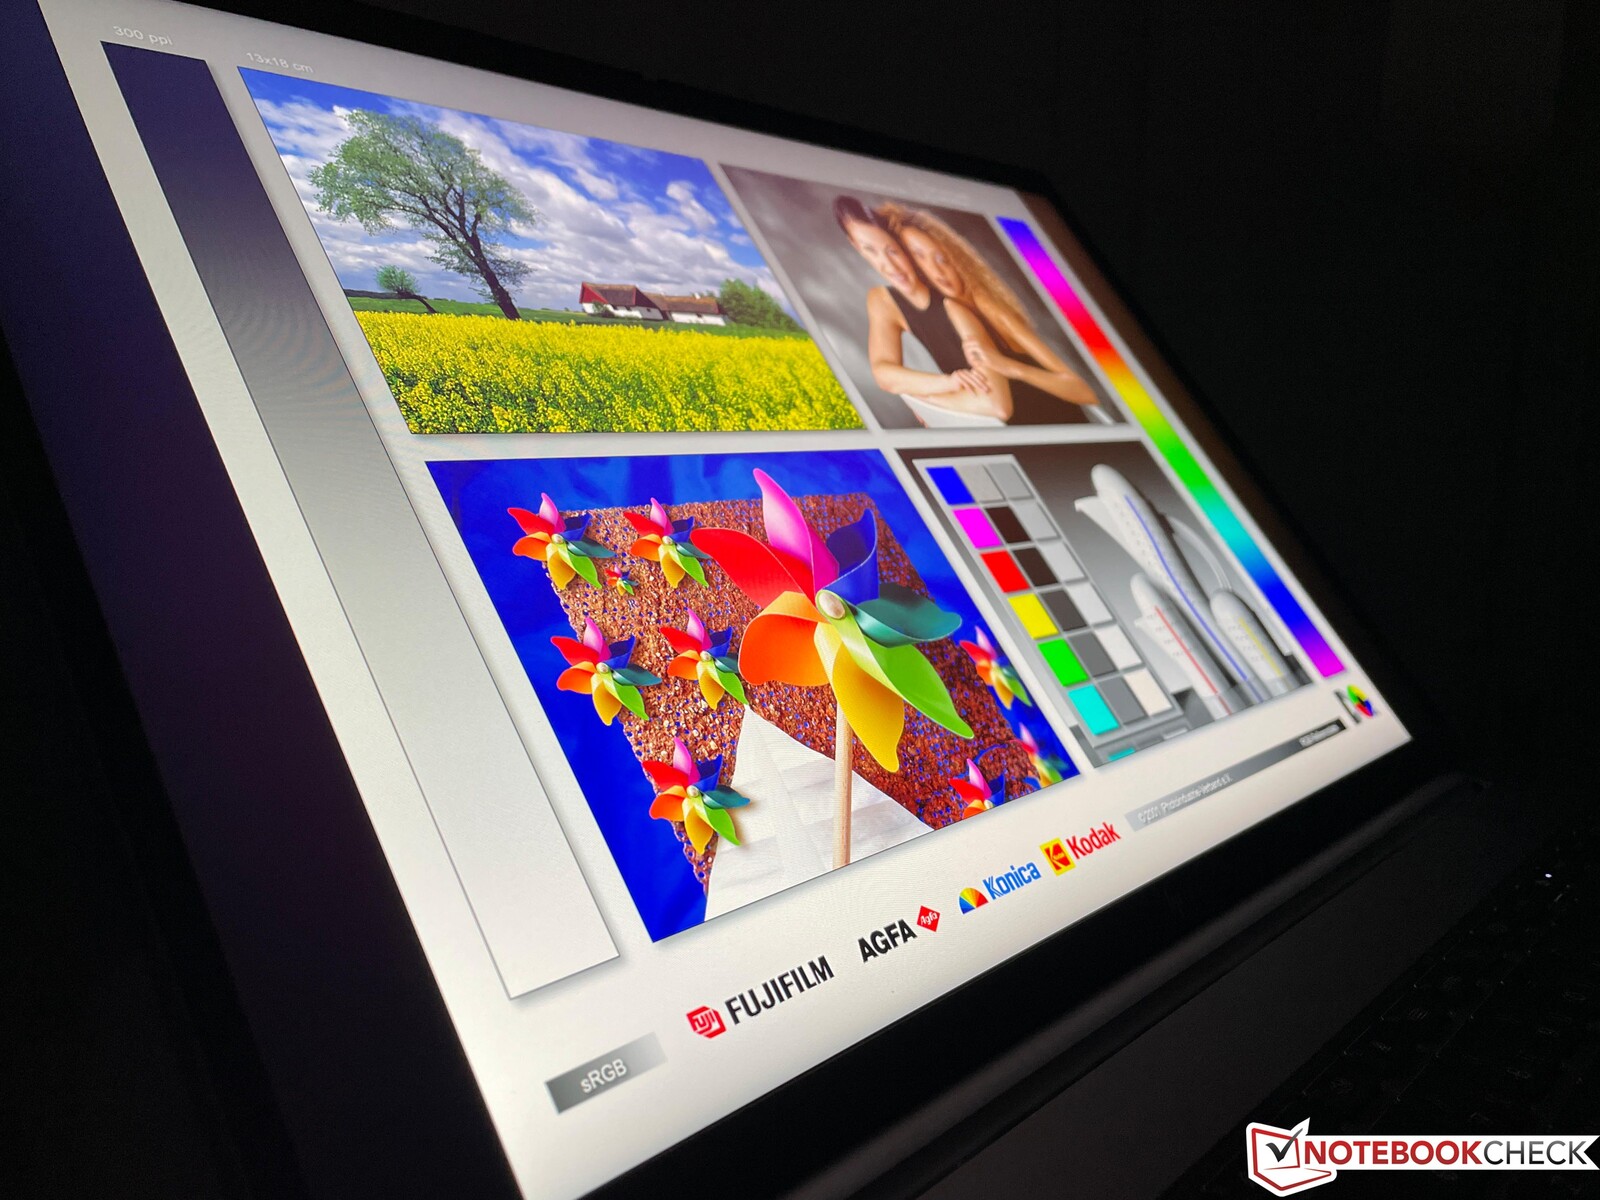
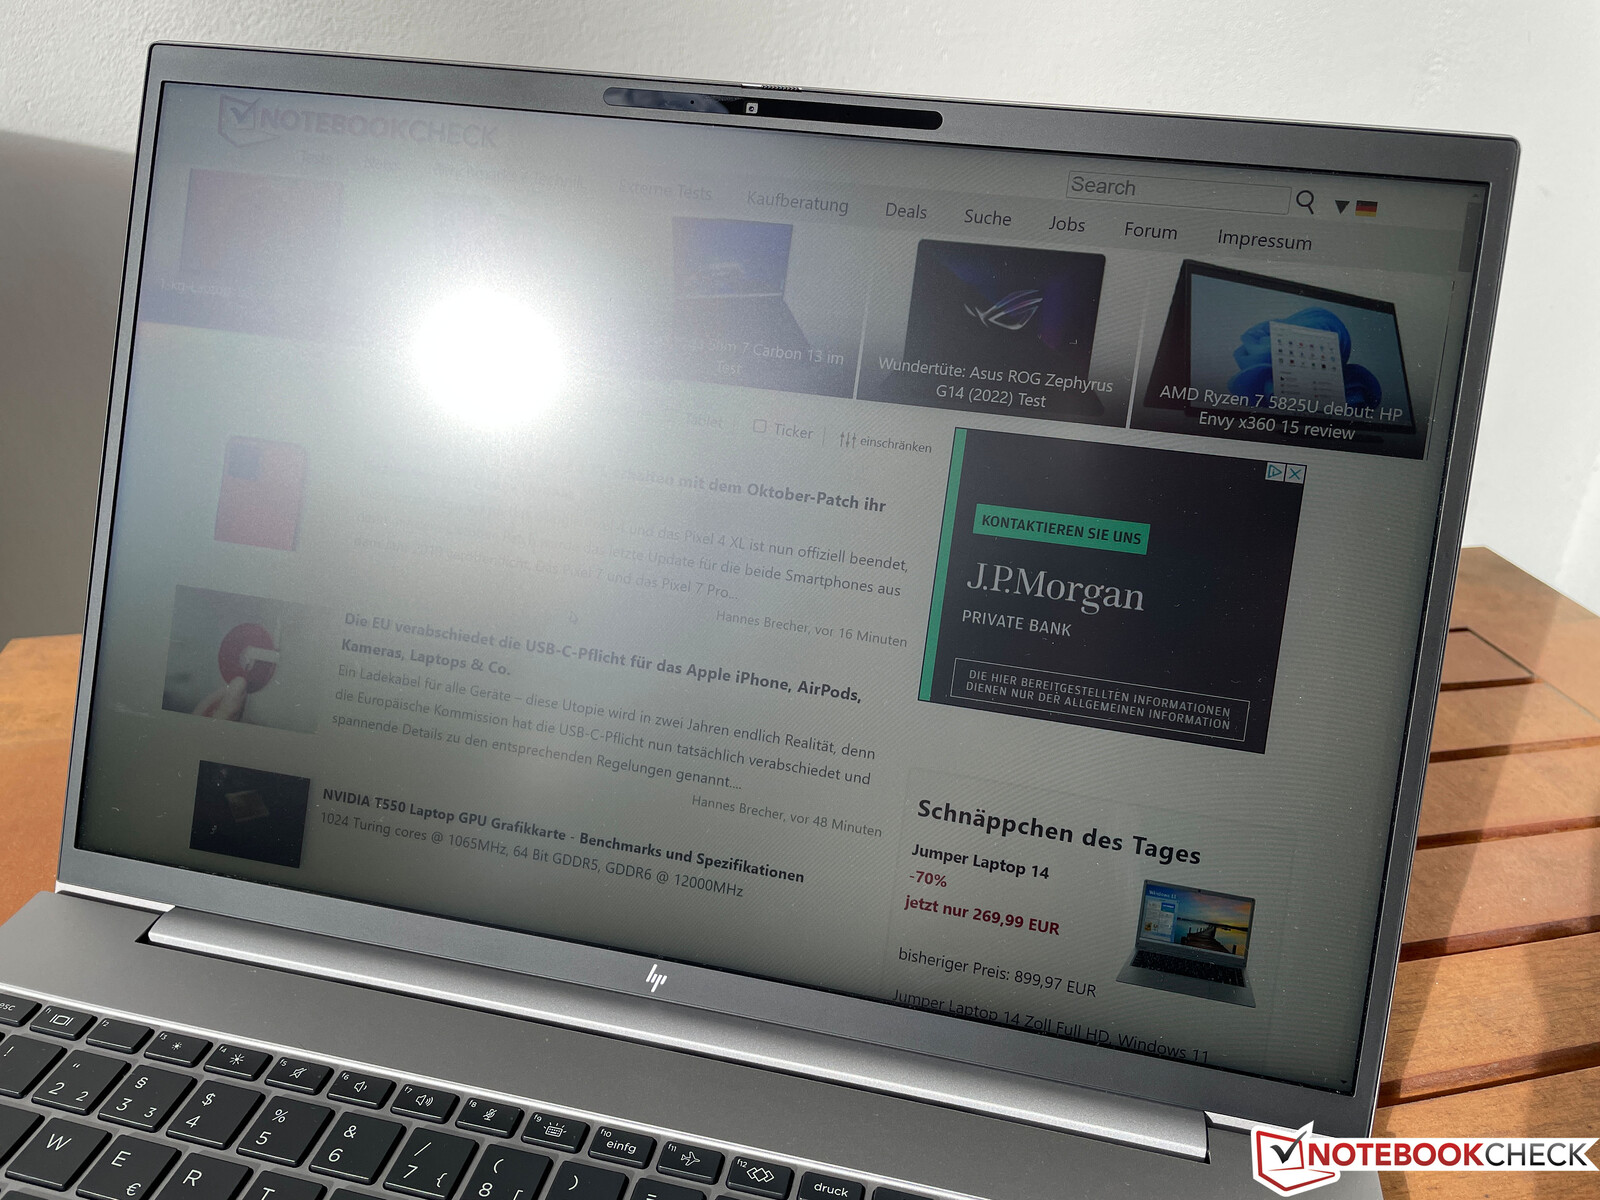
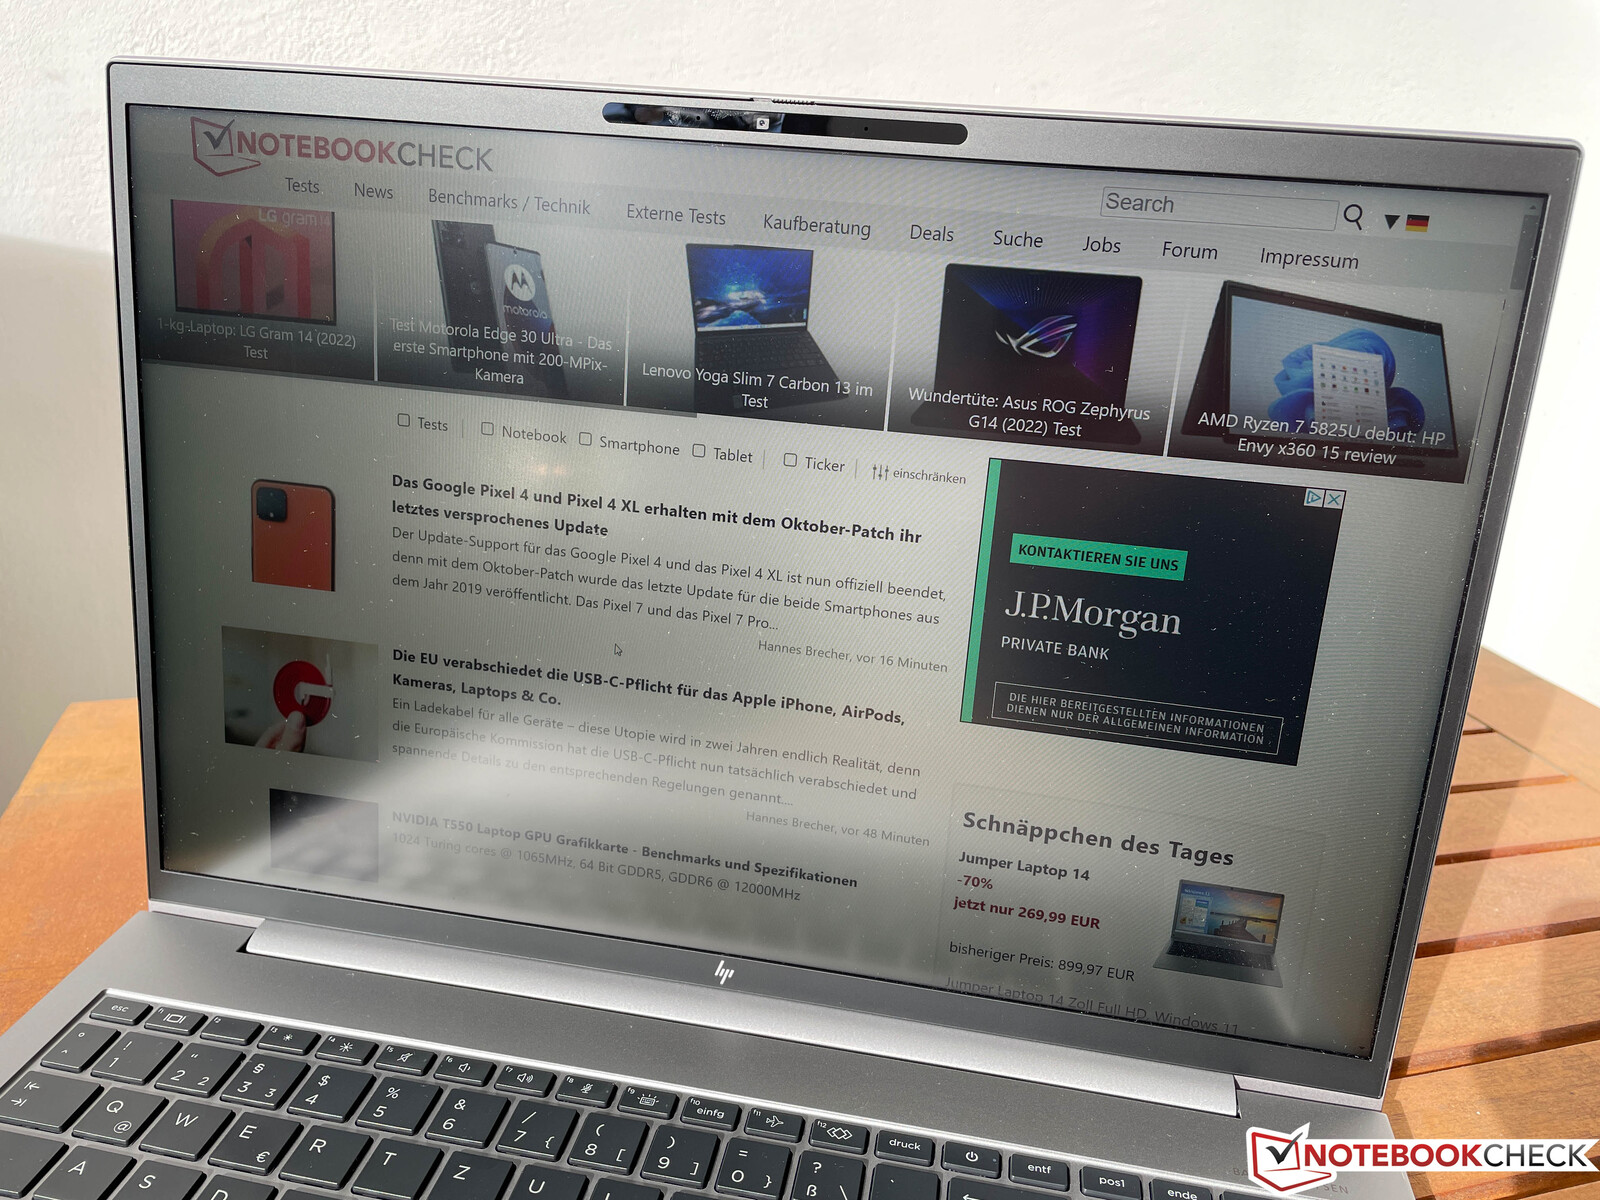
Display - HP utilizza un pannello opaco 16:10
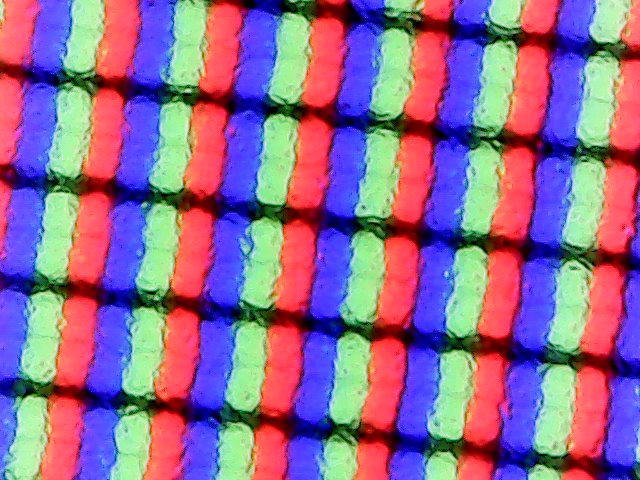
Lo ZBook Firefly 16 G9 utilizza esclusivamente pannelli IPS opachi con una risoluzione nativa di 1920 x 1200 pixel. Non sono disponibili opzioni di visualizzazione con risoluzioni più elevate o copertura dello spazio colore estesa. Le due opzioni standard (45% di copertura dello spazio colore NTSC) dovrebbero essere saltate, poiché sono specificate per una luminosità massima bassa di soli 250 nits.
- WUXGA (1920 x 1200), 250 nits, opaco, IPS, 45% NTSC
- WUXGA (1920 x 1200), 250 nits, opaco, IPS, 45 % NTSC, touchscreen
- WUXGA (1920 x 1200), 400 nits, opaco, IPS, 100 % sRGB
- WUXGA (1920 x 1200), 1000 nits SureView, opaco, IPS, 100 % sRGB
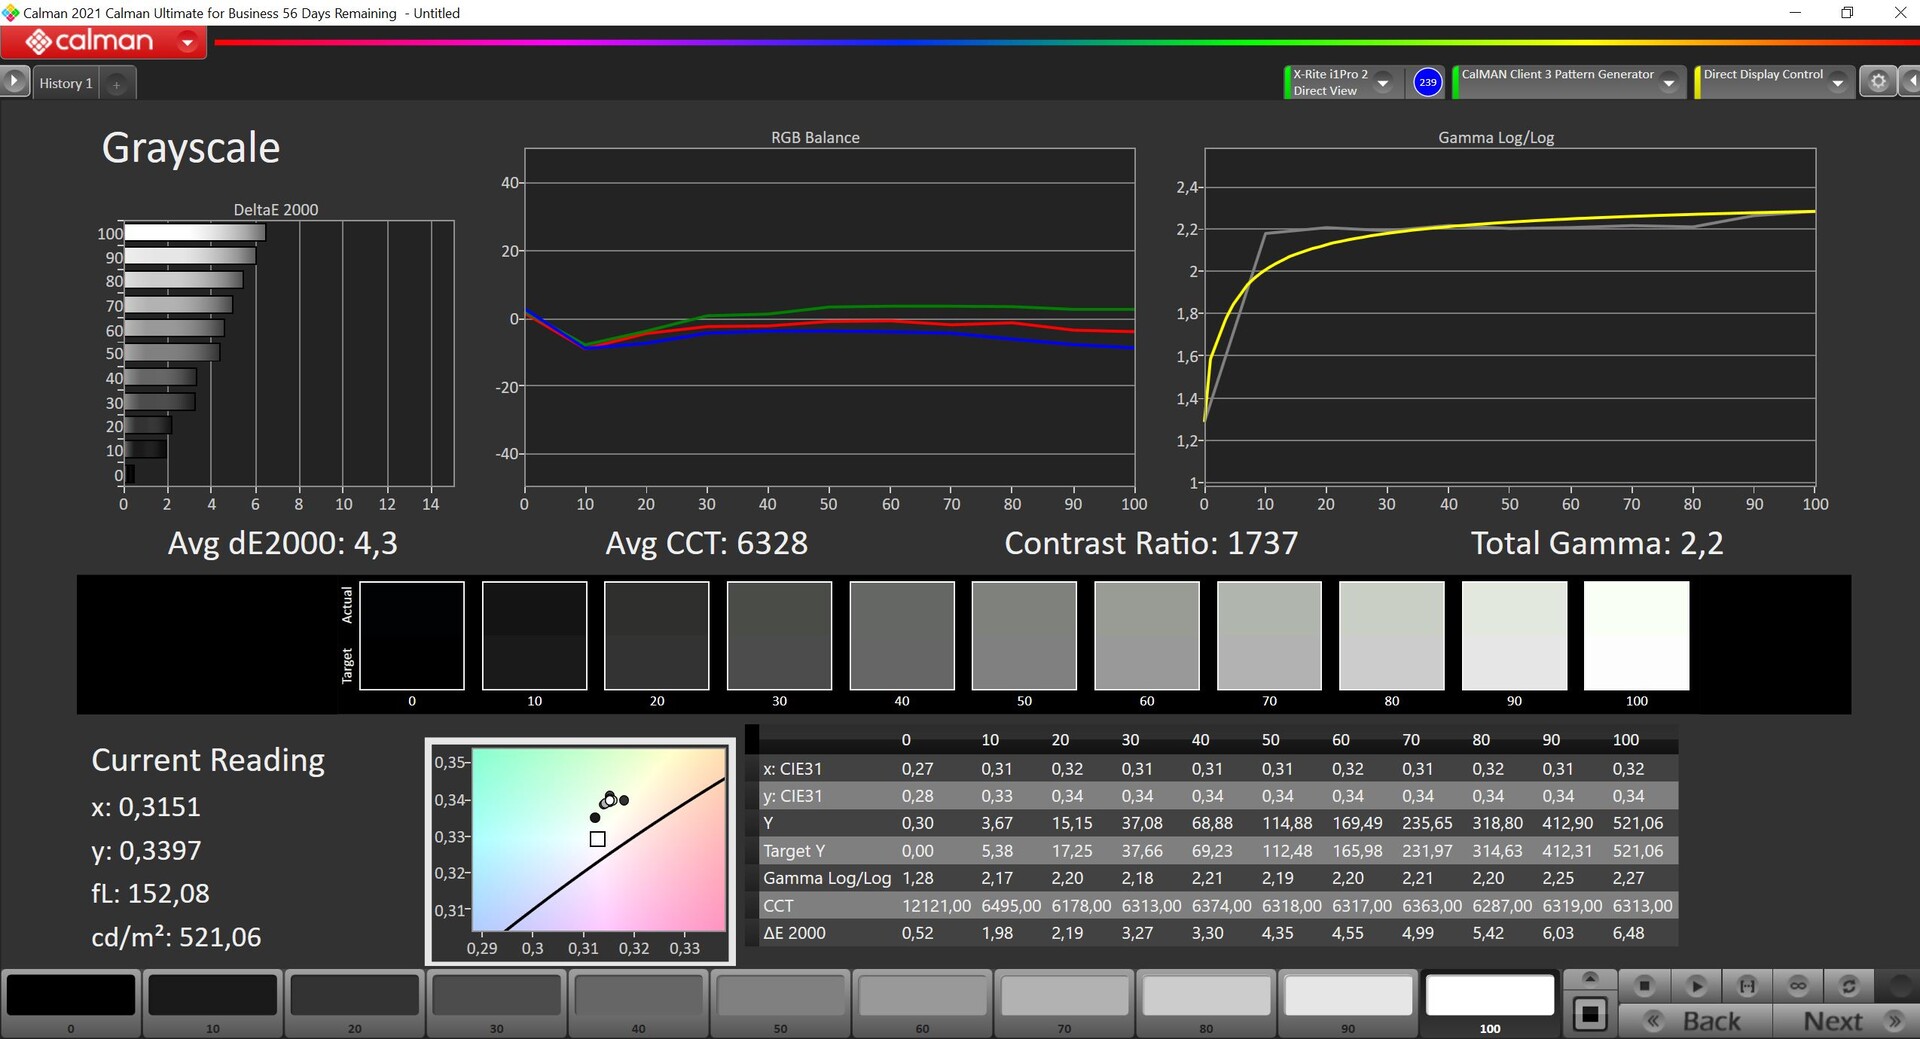
Come abbiamo visto molte volte come abbiamo già visto molte volte, il display SureView opzionale non è privo di punti deboli, per cui il pannello con 400 nits e copertura completa dello spazio colore sRGB, che è anche quello utilizzato nella nostra configurazione di test, è l'opzione migliore per ottenere un buon equilibrio tra luminosità e qualità dell'immagine. Siamo rimasti piacevolmente sorpresi dal nostro campione di prova BOE, che supera in modo significativo le sue specifiche con una media di quasi 500 nits. Allo stesso tempo, il suo valore del nero di 0,31 nits è buono, con un eccellente rapporto di contrasto di ~1700:1.
Soggettivamente, l'immagine è ottima e anche le aree più luminose non appaiono sgranate nonostante lo strato opaco. Lo schermo offre un grado di nitidezza sufficiente per la produttività, nonostante la risoluzione FHD. Tuttavia, i tempi di risposta sono un po' lenti e si nota un leggero ma evidente ghosting, ad esempio quando si sposta il cursore. Anche alla massima luminosità, non abbiamo osservato un'eccessiva perdita di luminosità della retroilluminazione e non c'è nemmeno uno sfarfallio PWM.
| |||||||||||||||||||||||||
Distribuzione della luminosità: 93 %
Al centro con la batteria: 524 cd/m²
Contrasto: 1697:1 (Nero: 0.31 cd/m²)
ΔE ColorChecker Calman: 3.6 | ∀{0.5-29.43 Ø4.72}
calibrated: 2.6
ΔE Greyscale Calman: 5.5 | ∀{0.09-98 Ø4.97}
70% AdobeRGB 1998 (Argyll 3D)
96.1% sRGB (Argyll 3D)
68.1% Display P3 (Argyll 3D)
Gamma: 2.02
CCT: 6527 K
| HP ZBook Firefly 16 G9-6B897EA BOE0A02, IPS, 1920x1200, 16" | Lenovo ThinkPad P1 G4-20Y4Z9DVUS NE160QDM-N63, IPS, 2560x1600, 16" | Dell Precision 5000 5560 Sharp LQ156R1, IPS, 3840x2400, 15.6" | Lenovo ThinkPad P15s Gen2-20W6000GGE MNF601EA1-1, IPS LED, 3840x2160, 15.6" | HP ZBook Firefly 15 G8 2C9R7EA LGD069B, IPS, 1920x1080, 15.6" | Apple MacBook Pro 16 2021 M1 Pro Liquid Retina XDR, Mini-LED, 3456x2234, 16.2" | |
|---|---|---|---|---|---|---|
| Display | 6% | 29% | 22% | 1% | 25% | |
| Display P3 Coverage (%) | 68.1 | 72.7 7% | 94.9 39% | 84.5 24% | 68.6 1% | 99.1 46% |
| sRGB Coverage (%) | 96.1 | 99.3 3% | 100 4% | 98.7 3% | 98.5 2% | 100 4% |
| AdobeRGB 1998 Coverage (%) | 70 | 74.7 7% | 100 43% | 97.8 40% | 70 0% | 88 26% |
| Response Times | 8% | -23% | 3% | -35% | -176% | |
| Response Time Grey 50% / Grey 80% * (ms) | 52.8 ? | 40.8 23% | 47.2 ? 11% | 40 ? 24% | 56 ? -6% | 42.8 ? 19% |
| Response Time Black / White * (ms) | 19.5 ? | 20.8 -7% | 30.4 ? -56% | 23.2 ? -19% | 32 ? -64% | 91.6 ? -370% |
| PWM Frequency (Hz) | 14880 | |||||
| Screen | 9% | -5% | 35% | -3% | 211% | |
| Brightness middle (cd/m²) | 526 | 441 -16% | 501.5 -5% | 604 15% | 397 -25% | 514 -2% |
| Brightness (cd/m²) | 499 | 420 -16% | 467 -6% | 609 22% | 402 -19% | 497 0% |
| Brightness Distribution (%) | 93 | 90 -3% | 83 -11% | 91 -2% | 84 -10% | 95 2% |
| Black Level * (cd/m²) | 0.31 | 0.27 13% | 0.44 -42% | 0.34 -10% | 0.13 58% | 0.02 94% |
| Contrast (:1) | 1697 | 1633 -4% | 1140 -33% | 1776 5% | 3054 80% | 25700 1414% |
| Colorchecker dE 2000 * | 3.6 | 2.6 28% | 4.73 -31% | 0.9 75% | 5.9 -64% | 1.4 61% |
| Colorchecker dE 2000 max. * | 6.6 | 6 9% | 8.45 -28% | 2.6 61% | 9.4 -42% | 2.8 58% |
| Colorchecker dE 2000 calibrated * | 2.6 | 1.2 54% | 0.51 80% | 0.8 69% | 1.1 58% | |
| Greyscale dE 2000 * | 5.5 | 4.5 18% | 3.6 35% | 1.1 80% | 8.8 -60% | 2.3 58% |
| Gamma | 2.02 109% | 2.18 101% | 2.08 106% | 2.15 102% | 2.47 89% | 2.27 97% |
| CCT | 6527 100% | 6623 98% | 6447 101% | 6656 98% | 6416 101% | 6792 96% |
| Color Space (Percent of AdobeRGB 1998) (%) | 84.5 | 63.7 | ||||
| Color Space (Percent of sRGB) (%) | 98.6 | 98.5 | ||||
| Media totale (Programma / Settaggio) | 8% /
8% | 0% /
0% | 20% /
28% | -12% /
-7% | 20% /
108% |
* ... Meglio usare valori piccoli
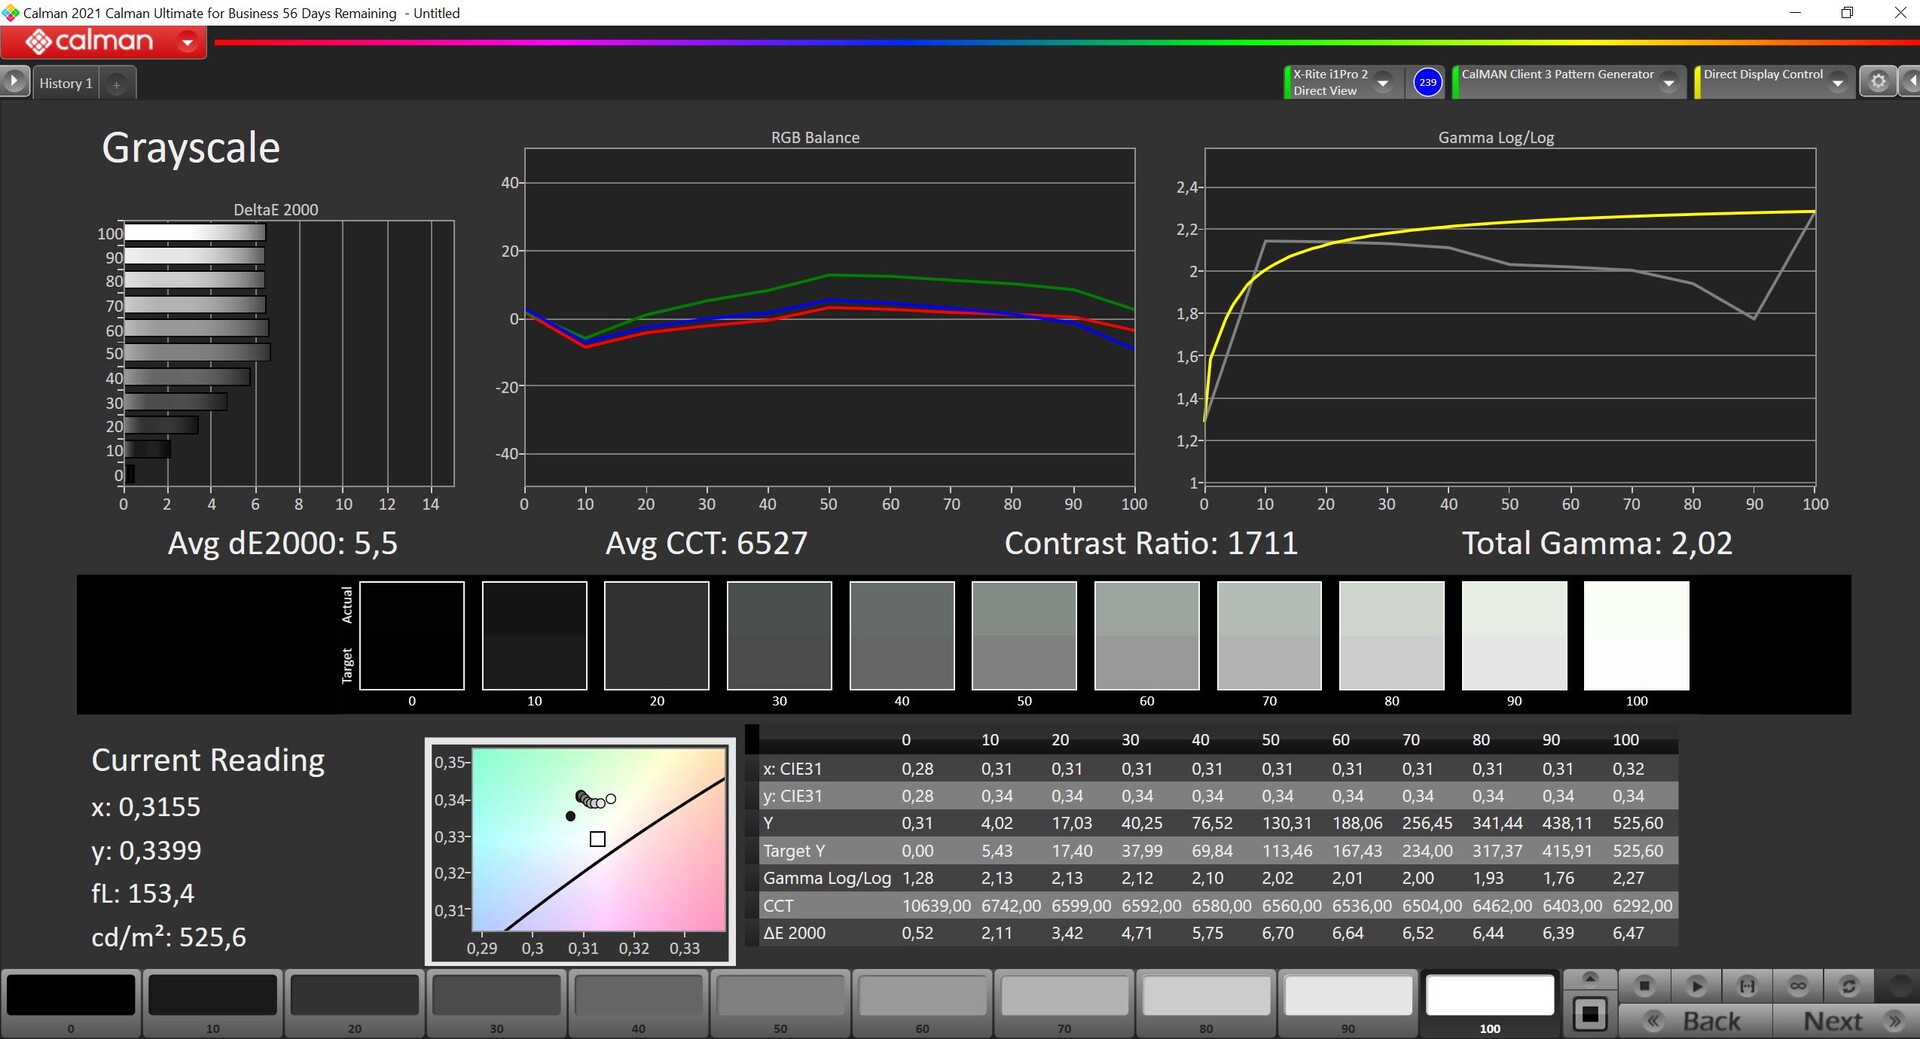
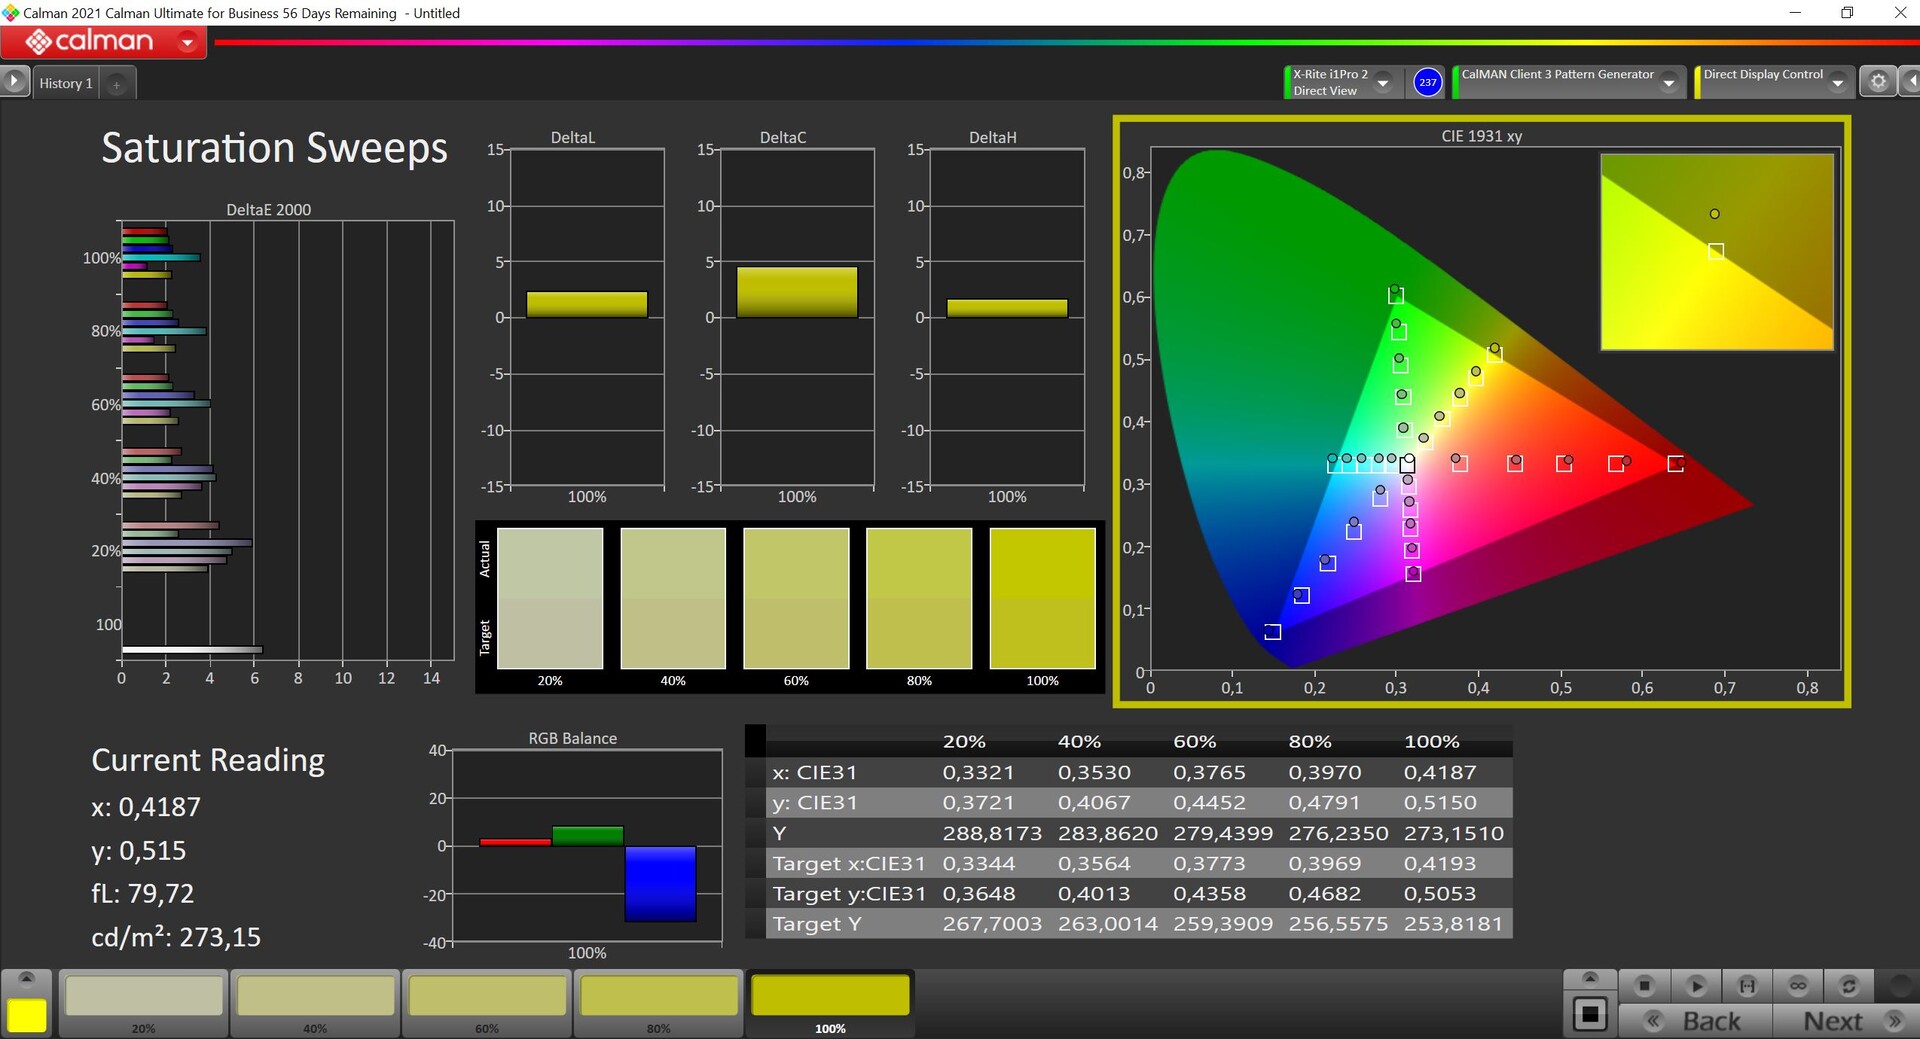
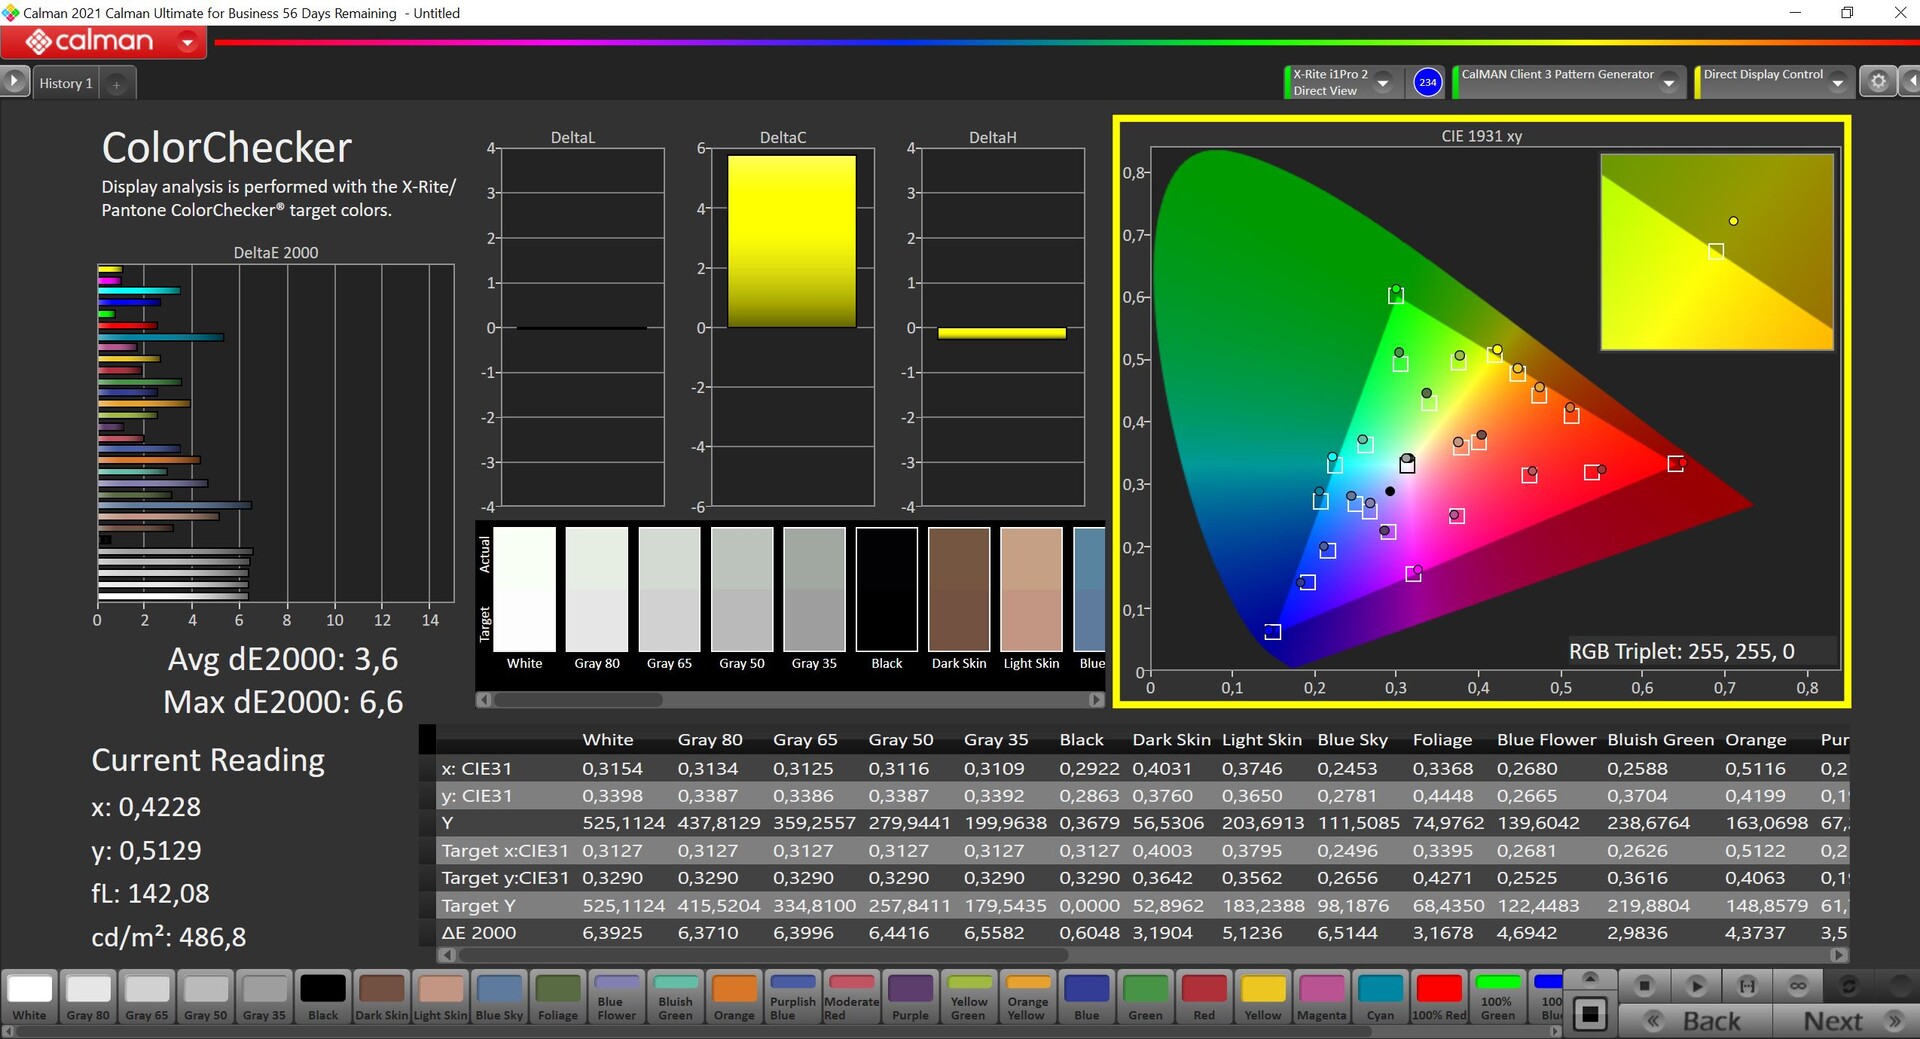
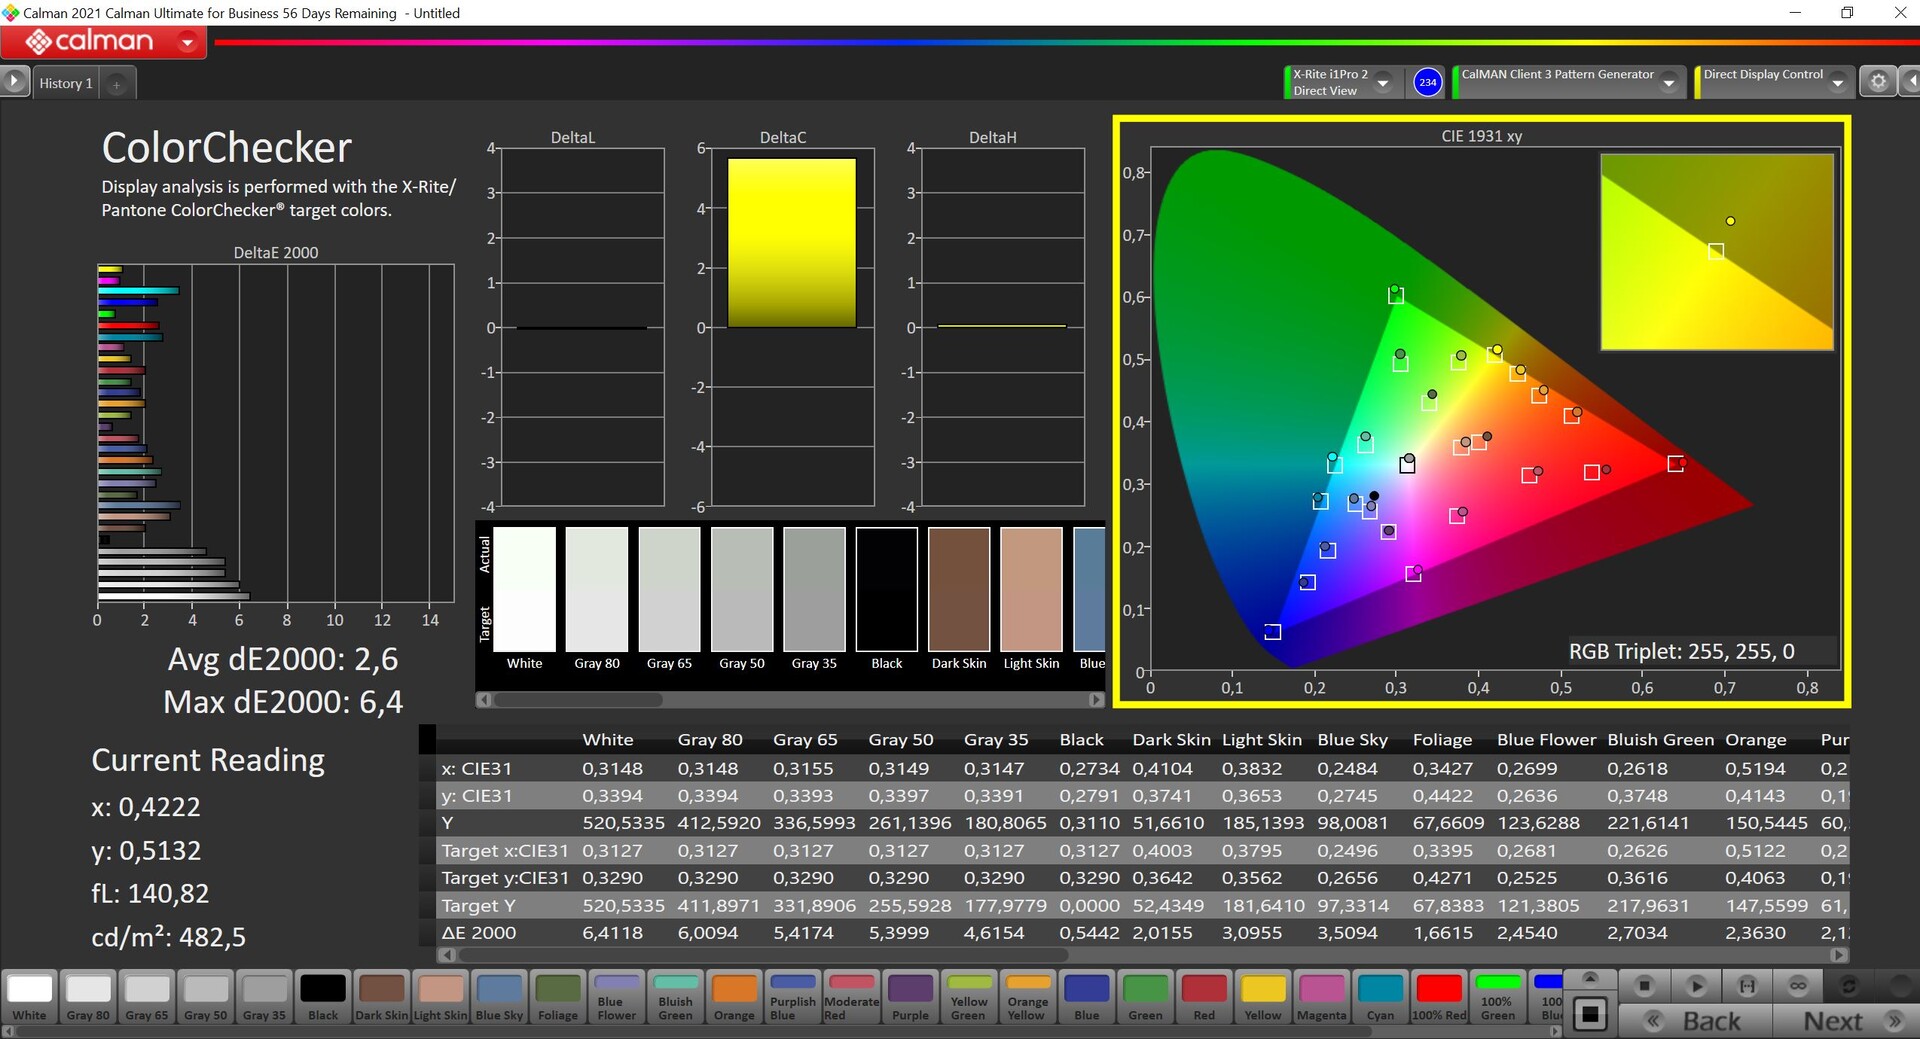
Durante l'analisi professionale CalMAN (X-Rite i1 Pro 2), abbiamo osservato una leggera tonalità verde e una scala di grigi media, nonché deviazioni cromatiche superiori a 3 rispetto allo spazio colore di riferimento sRGB. Dopo la calibrazione del display, la tinta verde non è più un problema e l'accuratezza del colore della maggior parte dei colori rientra nell'intervallo ideale. Grazie alla copertura quasi totale dello spazio colore sRGB, l'editing fotografico è una possibilità reale.
Tempi di risposta del Display
| ↔ Tempi di risposta dal Nero al Bianco | ||
|---|---|---|
| 19.5 ms ... aumenta ↗ e diminuisce ↘ combinato | ↗ 6 ms Incremento |  |
| ↘ 13.5 ms Calo | ||
| Lo schermo mostra buoni tempi di risposta durante i nostri tests, ma potrebbe essere troppo lento per i gamers competitivi. In confronto, tutti i dispositivi di test variano da 0.1 (minimo) a 240 (massimo) ms. » 43 % di tutti i dispositivi è migliore. Questo significa che i tempi di risposta rilevati sono simili alla media di tutti i dispositivi testati (19.9 ms). | ||
| ↔ Tempo di risposta dal 50% Grigio all'80% Grigio | ||
| 52.8 ms ... aumenta ↗ e diminuisce ↘ combinato | ↗ 22.9 ms Incremento | 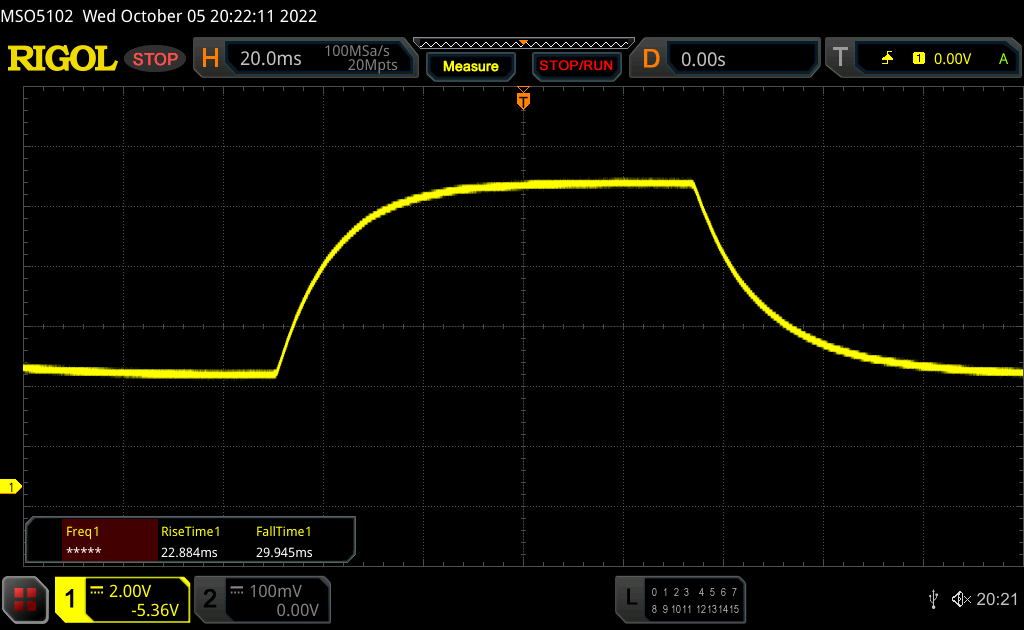 |
| ↘ 29.9 ms Calo | ||
| Lo schermo mostra tempi di risposta lenti nei nostri tests e sarà insoddisfacente per i gamers. In confronto, tutti i dispositivi di test variano da 0.165 (minimo) a 636 (massimo) ms. » 89 % di tutti i dispositivi è migliore. Questo significa che i tempi di risposta rilevati sono peggiori rispetto alla media di tutti i dispositivi testati (31.1 ms). | ||
Sfarfallio dello schermo / PWM (Pulse-Width Modulation)
| flickering dello schermo / PWM non rilevato |  | ||
In confronto: 52 % di tutti i dispositivi testati non utilizza PWM per ridurre la luminosita' del display. Se è rilevato PWM, una media di 7784 (minimo: 5 - massimo: 343500) Hz è stata rilevata. | |||
Lo ZBook Firefly 16 G9 è adatto all'uso all'aperto, dove il pannello opaco e l'elevata luminosità massima sono molto utili. Anche le giornate di sole non dovrebbero rappresentare un problema, a patto che la luce del sole non colpisca direttamente lo schermo.
Prestazioni - Alder Lake-U e Nvidia T550
Condizioni di test
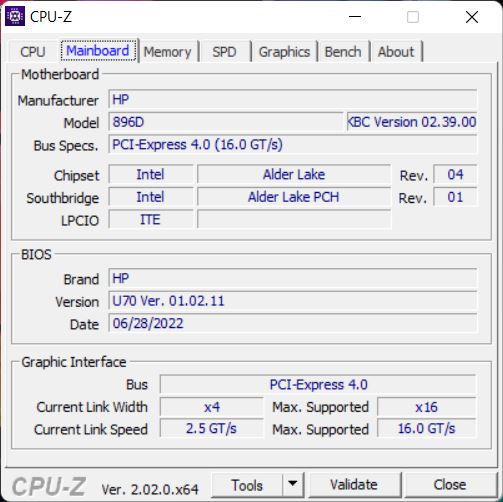
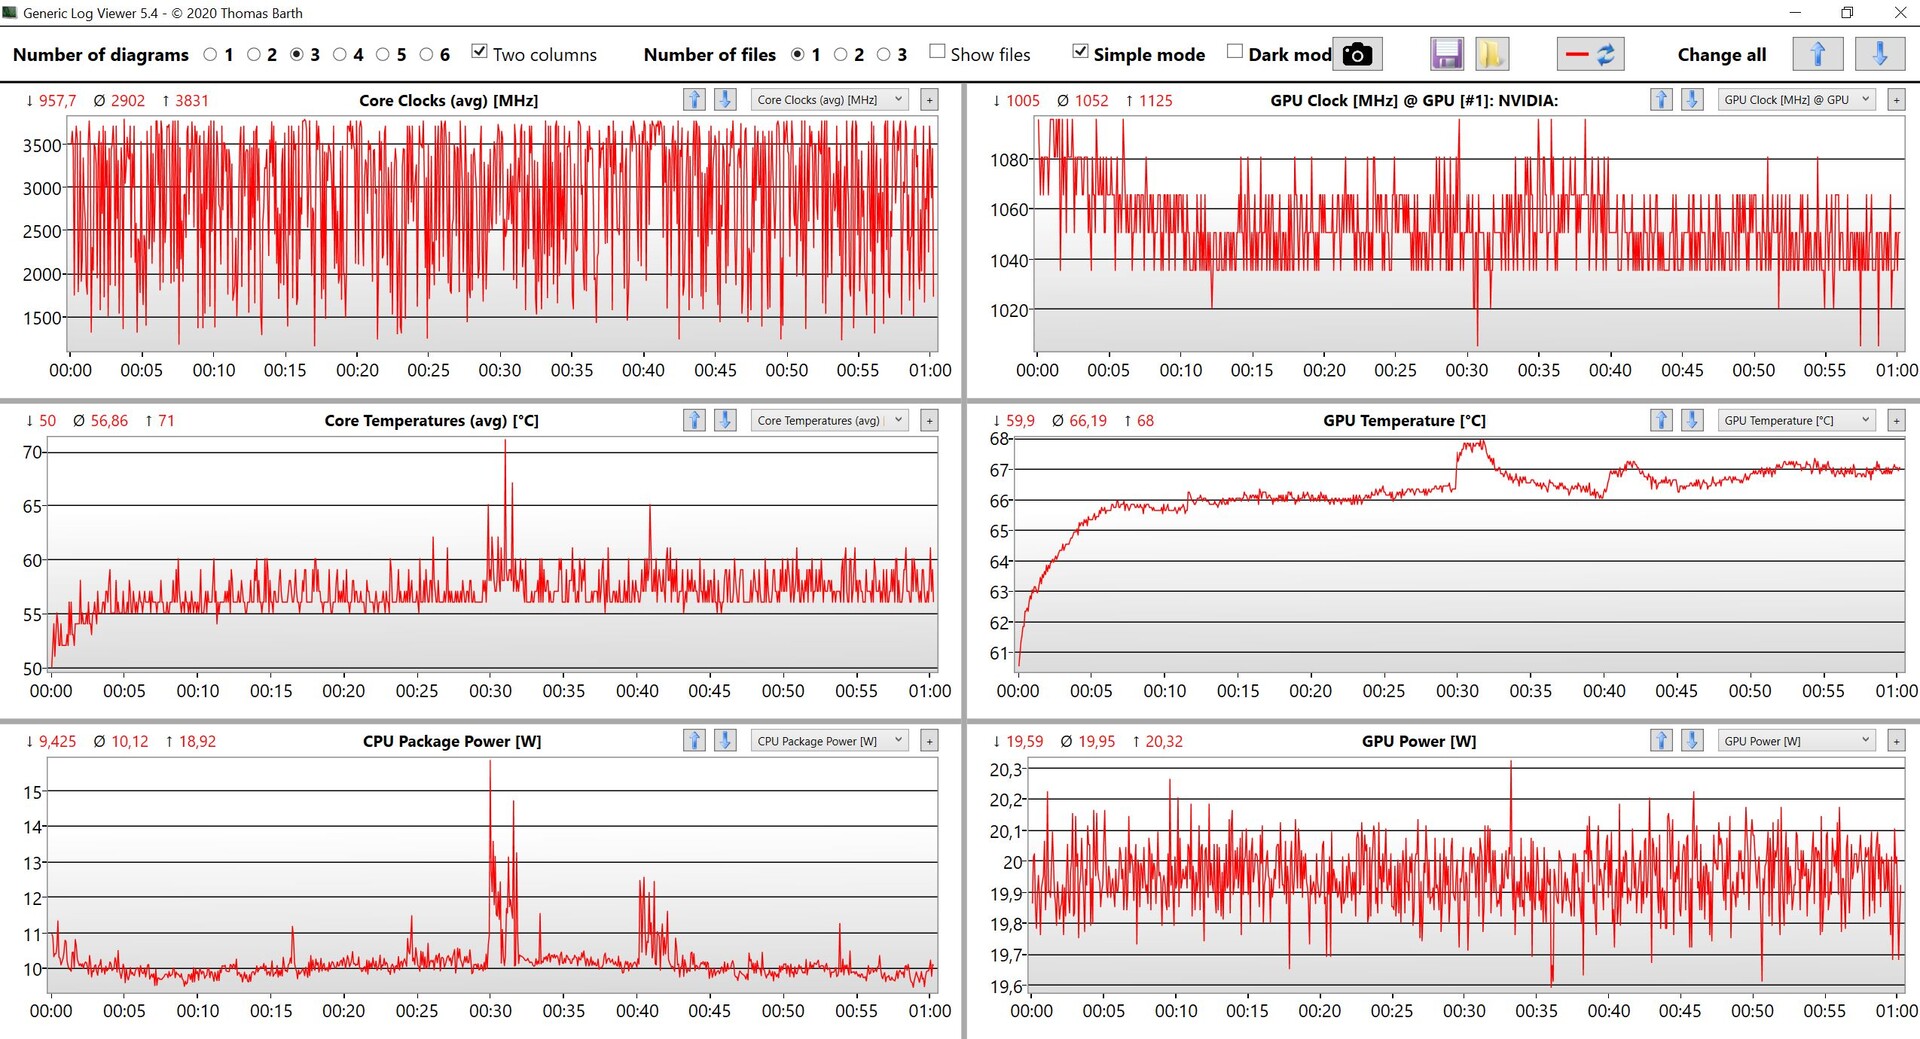
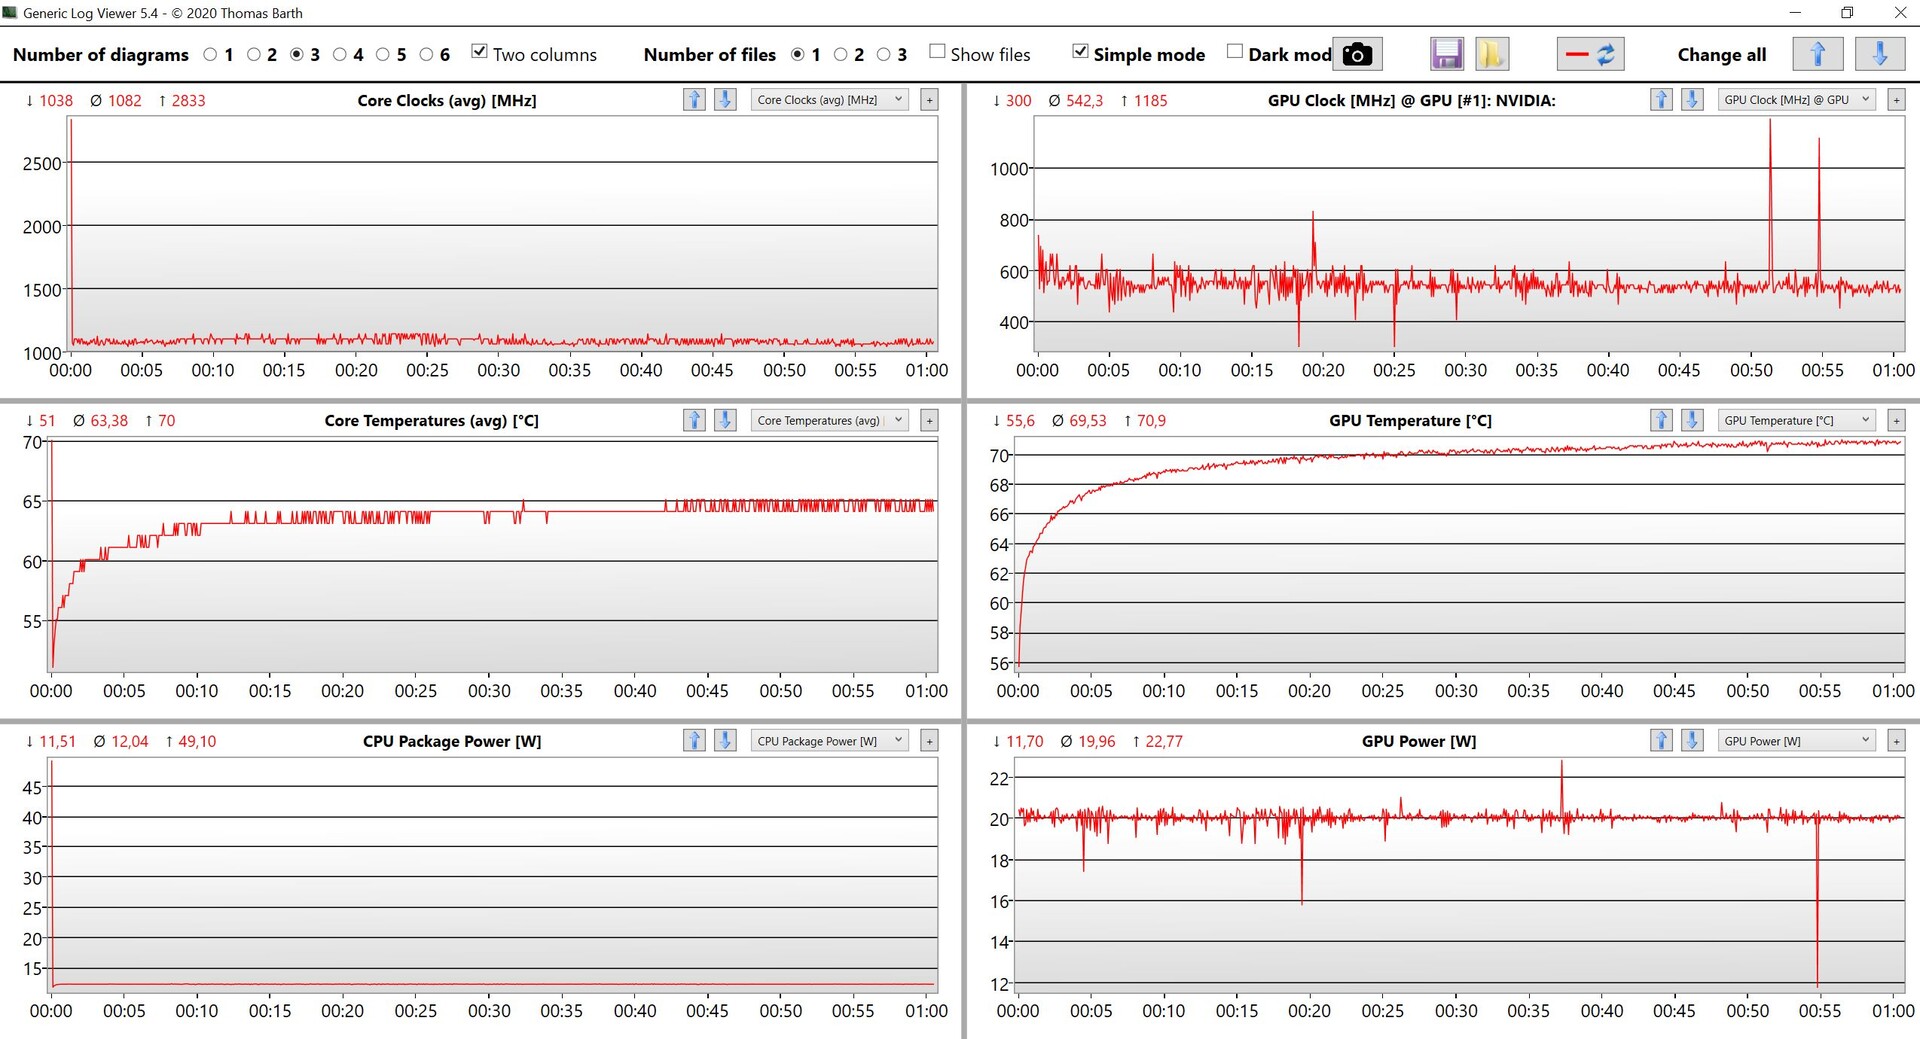
Non ci sono profili di alimentazione oltre alle impostazioni predefinite di Windows per le prestazioni. Siamo rimasti estremamente sorpresi nel vedere limiti di potenza molto bassi, pari a 51 watt durante brevi raffiche e a 12 watt sotto sforzo continuo. Soprattutto, l'elevato Turbo Boost è disponibile solo per circa un secondo. Abbiamo controllato tutte le impostazioni (compreso il BIOS) e installato tutti gli aggiornamenti disponibili, ma i limiti non sono cambiati. Allo stesso modo, il limite di 20 watt della scheda grafica rappresenta il valore più basso in assoluto per questo chip. Poiché abbiamo osservato un comportamento simile sulla nostra versione da 14 pollici, sembra improbabile un problema con il nostro dispositivo di prova. Anche se la soluzione di raffreddamento è al limite in caso di stress combinato CPU/GPU, non troviamo alcuna ragione per cui la CPU possa subire un throttling così severo in caso di puro carico della CPU. Secondo la scheda tecnica, i chip Alder Lake-P come il Core i5-1240P o Core i7-1260P sono disponibili, anche se al momento non siamo in grado di stabilire se i loro limiti di potenza siano più ragionevoli.
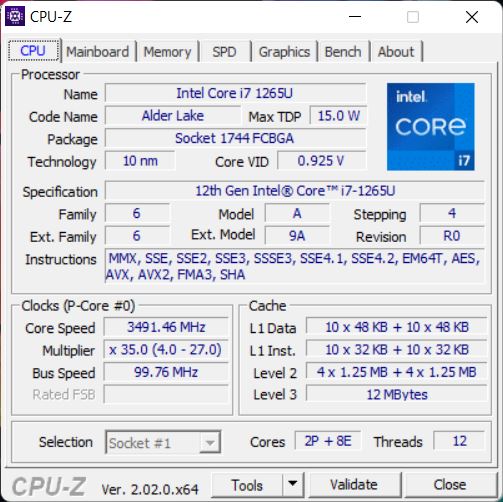
Processore
Nominalmente, il Intel Core i7-1265U è un processore veloce con due core per le prestazioni e otto per l'efficienza. Tuttavia, a causa del suo TDP massicciamente limitato a soli 12 watt, le prestazioni sono abissali e il throttling si verifica anche durante i benchmark single-core. Anche se le prestazioni effettive delle attuali GPU Intel possono variare notevolmente a seconda del TDP impostato dal produttore, non abbiamo mai visto risultati così bassi e persino il vecchio Firefly 15 G8 con il Core i7-1165G7 supera il nostro ZBook Firefly 16 G9. Mentre il deficit è meno drammatico nei benchmark single-core, rendendo le scarse prestazioni non così evidenti durante l'uso quotidiano, i risultati dei benchmark multi-core rendono questa workstation mobile più o meno uno dei laptop più lenti disponibili. Con nostra sorpresa, le prestazioni in modalità batteria sono ancora peggiori, con limiti di potenza di soli 30/10 watt. Altri benchmark sono disponibili qui.
Cinebench R15 Multi Loop
Cinebench R23: Multi Core | Single Core
Cinebench R20: CPU (Multi Core) | CPU (Single Core)
Cinebench R15: CPU Multi 64Bit | CPU Single 64Bit
Blender: v2.79 BMW27 CPU
7-Zip 18.03: 7z b 4 | 7z b 4 -mmt1
Geekbench 5.5: Multi-Core | Single-Core
HWBOT x265 Benchmark v2.2: 4k Preset
LibreOffice : 20 Documents To PDF
R Benchmark 2.5: Overall mean
| CPU Performance rating | |
| Media della classe Workstation | |
| Apple MacBook Pro 16 2021 M1 Pro -5! | |
| Lenovo ThinkPad P1 G4-20Y4Z9DVUS | |
| Dell Precision 5000 5560 -2! | |
| Media Intel Core i7-1265U | |
| Lenovo ThinkPad P15s Gen2-20W6000GGE | |
| HP ZBook Firefly 15 G8 2C9R7EA -2! | |
| HP ZBook Firefly 16 G9-6B897EA | |
| Cinebench R23 / Multi Core | |
| Media della classe Workstation (14055 - 38520, n=25, ultimi 2 anni) | |
| Lenovo ThinkPad P1 G4-20Y4Z9DVUS | |
| Apple MacBook Pro 16 2021 M1 Pro | |
| Dell Precision 5000 5560 | |
| Media Intel Core i7-1265U (4332 - 9219, n=10) | |
| Lenovo ThinkPad P15s Gen2-20W6000GGE | |
| HP ZBook Firefly 16 G9-6B897EA | |
| Cinebench R23 / Single Core | |
| Media della classe Workstation (1712 - 2228, n=25, ultimi 2 anni) | |
| Media Intel Core i7-1265U (1144 - 1820, n=10) | |
| Apple MacBook Pro 16 2021 M1 Pro | |
| Dell Precision 5000 5560 | |
| Lenovo ThinkPad P1 G4-20Y4Z9DVUS | |
| Lenovo ThinkPad P15s Gen2-20W6000GGE | |
| HP ZBook Firefly 16 G9-6B897EA | |
| Cinebench R20 / CPU (Multi Core) | |
| Media della classe Workstation (5471 - 15043, n=25, ultimi 2 anni) | |
| Lenovo ThinkPad P1 G4-20Y4Z9DVUS | |
| Dell Precision 5000 5560 | |
| Media Intel Core i7-1265U (1669 - 3584, n=10) | |
| Apple MacBook Pro 16 2021 M1 Pro | |
| HP ZBook Firefly 15 G8 2C9R7EA | |
| Lenovo ThinkPad P15s Gen2-20W6000GGE | |
| HP ZBook Firefly 16 G9-6B897EA | |
| Cinebench R20 / CPU (Single Core) | |
| Media della classe Workstation (671 - 857, n=25, ultimi 2 anni) | |
| Media Intel Core i7-1265U (528 - 701, n=10) | |
| HP ZBook Firefly 15 G8 2C9R7EA | |
| Lenovo ThinkPad P1 G4-20Y4Z9DVUS | |
| Dell Precision 5000 5560 | |
| Lenovo ThinkPad P15s Gen2-20W6000GGE | |
| HP ZBook Firefly 16 G9-6B897EA | |
| Apple MacBook Pro 16 2021 M1 Pro | |
| Cinebench R15 / CPU Multi 64Bit | |
| Media della classe Workstation (2489 - 5810, n=25, ultimi 2 anni) | |
| Lenovo ThinkPad P1 G4-20Y4Z9DVUS | |
| Apple MacBook Pro 16 2021 M1 Pro | |
| Dell Precision 5000 5560 | |
| Media Intel Core i7-1265U (706 - 1572, n=10) | |
| Lenovo ThinkPad P15s Gen2-20W6000GGE | |
| HP ZBook Firefly 15 G8 2C9R7EA | |
| HP ZBook Firefly 16 G9-6B897EA | |
| Cinebench R15 / CPU Single 64Bit | |
| Media della classe Workstation (191.4 - 328, n=25, ultimi 2 anni) | |
| Dell Precision 5000 5560 | |
| Lenovo ThinkPad P1 G4-20Y4Z9DVUS | |
| Media Intel Core i7-1265U (165.3 - 260, n=10) | |
| HP ZBook Firefly 15 G8 2C9R7EA | |
| Lenovo ThinkPad P15s Gen2-20W6000GGE | |
| Apple MacBook Pro 16 2021 M1 Pro | |
| HP ZBook Firefly 16 G9-6B897EA | |
| Blender / v2.79 BMW27 CPU | |
| HP ZBook Firefly 16 G9-6B897EA | |
| HP ZBook Firefly 15 G8 2C9R7EA | |
| Lenovo ThinkPad P15s Gen2-20W6000GGE | |
| Media Intel Core i7-1265U (364 - 684, n=10) | |
| Dell Precision 5000 5560 | |
| Lenovo ThinkPad P1 G4-20Y4Z9DVUS | |
| Apple MacBook Pro 16 2021 M1 Pro | |
| Media della classe Workstation (91 - 261, n=25, ultimi 2 anni) | |
| 7-Zip 18.03 / 7z b 4 | |
| Media della classe Workstation (54741 - 116969, n=25, ultimi 2 anni) | |
| Lenovo ThinkPad P1 G4-20Y4Z9DVUS | |
| Dell Precision 5000 5560 | |
| Media Intel Core i7-1265U (20087 - 38715, n=10) | |
| HP ZBook Firefly 15 G8 2C9R7EA | |
| Lenovo ThinkPad P15s Gen2-20W6000GGE | |
| HP ZBook Firefly 16 G9-6B897EA | |
| 7-Zip 18.03 / 7z b 4 -mmt1 | |
| Media della classe Workstation (5126 - 6960, n=25, ultimi 2 anni) | |
| Dell Precision 5000 5560 | |
| Lenovo ThinkPad P1 G4-20Y4Z9DVUS | |
| HP ZBook Firefly 15 G8 2C9R7EA | |
| Lenovo ThinkPad P15s Gen2-20W6000GGE | |
| Media Intel Core i7-1265U (4614 - 5617, n=10) | |
| HP ZBook Firefly 16 G9-6B897EA | |
| Geekbench 5.5 / Multi-Core | |
| Media della classe Workstation (11542 - 25554, n=25, ultimi 2 anni) | |
| Apple MacBook Pro 16 2021 M1 Pro | |
| Lenovo ThinkPad P1 G4-20Y4Z9DVUS | |
| Media Intel Core i7-1265U (5022 - 8981, n=10) | |
| Lenovo ThinkPad P15s Gen2-20W6000GGE | |
| HP ZBook Firefly 16 G9-6B897EA | |
| HP ZBook Firefly 15 G8 2C9R7EA | |
| Geekbench 5.5 / Single-Core | |
| Media della classe Workstation (1781 - 2183, n=25, ultimi 2 anni) | |
| HP ZBook Firefly 16 G9-6B897EA | |
| Apple MacBook Pro 16 2021 M1 Pro | |
| Media Intel Core i7-1265U (1429 - 1806, n=10) | |
| Lenovo ThinkPad P1 G4-20Y4Z9DVUS | |
| HP ZBook Firefly 15 G8 2C9R7EA | |
| Lenovo ThinkPad P15s Gen2-20W6000GGE | |
| HWBOT x265 Benchmark v2.2 / 4k Preset | |
| Media della classe Workstation (14.4 - 40.5, n=25, ultimi 2 anni) | |
| Lenovo ThinkPad P1 G4-20Y4Z9DVUS | |
| Dell Precision 5000 5560 | |
| Media Intel Core i7-1265U (5.09 - 10.6, n=10) | |
| Lenovo ThinkPad P15s Gen2-20W6000GGE | |
| HP ZBook Firefly 15 G8 2C9R7EA | |
| HP ZBook Firefly 16 G9-6B897EA | |
| LibreOffice / 20 Documents To PDF | |
| HP ZBook Firefly 16 G9-6B897EA | |
| Lenovo ThinkPad P1 G4-20Y4Z9DVUS | |
| Media Intel Core i7-1265U (44 - 61.6, n=10) | |
| Dell Precision 5000 5560 | |
| Media della classe Workstation (37.1 - 74.7, n=25, ultimi 2 anni) | |
| Lenovo ThinkPad P15s Gen2-20W6000GGE | |
| HP ZBook Firefly 15 G8 2C9R7EA | |
| R Benchmark 2.5 / Overall mean | |
| HP ZBook Firefly 15 G8 2C9R7EA | |
| Lenovo ThinkPad P15s Gen2-20W6000GGE | |
| Lenovo ThinkPad P1 G4-20Y4Z9DVUS | |
| HP ZBook Firefly 16 G9-6B897EA | |
| Dell Precision 5000 5560 | |
| Media Intel Core i7-1265U (0.4666 - 0.578, n=10) | |
| Media della classe Workstation (0.3825 - 0.603, n=25, ultimi 2 anni) | |
* ... Meglio usare valori piccoli
AIDA64: FP32 Ray-Trace | FPU Julia | CPU SHA3 | CPU Queen | FPU SinJulia | FPU Mandel | CPU AES | CPU ZLib | FP64 Ray-Trace | CPU PhotoWorxx
| Performance rating | |
| Media della classe Workstation | |
| Lenovo ThinkPad P1 G4-20Y4Z9DVUS | |
| Lenovo ThinkPad P15s Gen2-20W6000GGE | |
| Media Intel Core i7-1265U | |
| HP ZBook Firefly 15 G8 2C9R7EA | |
| HP ZBook Firefly 16 G9-6B897EA | |
| AIDA64 / FP32 Ray-Trace | |
| Media della classe Workstation (10658 - 61611, n=25, ultimi 2 anni) | |
| Lenovo ThinkPad P1 G4-20Y4Z9DVUS | |
| Lenovo ThinkPad P15s Gen2-20W6000GGE | |
| HP ZBook Firefly 15 G8 2C9R7EA | |
| Media Intel Core i7-1265U (2619 - 8178, n=10) | |
| HP ZBook Firefly 16 G9-6B897EA | |
| AIDA64 / FPU Julia | |
| Media della classe Workstation (56664 - 186971, n=25, ultimi 2 anni) | |
| Lenovo ThinkPad P1 G4-20Y4Z9DVUS | |
| Media Intel Core i7-1265U (12909 - 41649, n=10) | |
| Lenovo ThinkPad P15s Gen2-20W6000GGE | |
| HP ZBook Firefly 15 G8 2C9R7EA | |
| HP ZBook Firefly 16 G9-6B897EA | |
| AIDA64 / CPU SHA3 | |
| Media della classe Workstation (2608 - 8975, n=25, ultimi 2 anni) | |
| Lenovo ThinkPad P1 G4-20Y4Z9DVUS | |
| Lenovo ThinkPad P15s Gen2-20W6000GGE | |
| HP ZBook Firefly 15 G8 2C9R7EA | |
| Media Intel Core i7-1265U (824 - 2183, n=10) | |
| HP ZBook Firefly 16 G9-6B897EA | |
| AIDA64 / CPU Queen | |
| Media della classe Workstation (60778 - 144411, n=25, ultimi 2 anni) | |
| Lenovo ThinkPad P1 G4-20Y4Z9DVUS | |
| Media Intel Core i7-1265U (63615 - 67065, n=10) | |
| HP ZBook Firefly 16 G9-6B897EA | |
| Lenovo ThinkPad P15s Gen2-20W6000GGE | |
| HP ZBook Firefly 15 G8 2C9R7EA | |
| AIDA64 / FPU SinJulia | |
| Media della classe Workstation (8165 - 29343, n=25, ultimi 2 anni) | |
| Lenovo ThinkPad P1 G4-20Y4Z9DVUS | |
| Lenovo ThinkPad P15s Gen2-20W6000GGE | |
| HP ZBook Firefly 15 G8 2C9R7EA | |
| Media Intel Core i7-1265U (3105 - 5135, n=10) | |
| HP ZBook Firefly 16 G9-6B897EA | |
| AIDA64 / FPU Mandel | |
| Media della classe Workstation (27301 - 98153, n=25, ultimi 2 anni) | |
| Lenovo ThinkPad P1 G4-20Y4Z9DVUS | |
| Lenovo ThinkPad P15s Gen2-20W6000GGE | |
| HP ZBook Firefly 15 G8 2C9R7EA | |
| Media Intel Core i7-1265U (6967 - 20804, n=10) | |
| HP ZBook Firefly 16 G9-6B897EA | |
| AIDA64 / CPU AES | |
| Media della classe Workstation (56077 - 187841, n=25, ultimi 2 anni) | |
| Lenovo ThinkPad P1 G4-20Y4Z9DVUS | |
| Lenovo ThinkPad P15s Gen2-20W6000GGE | |
| HP ZBook Firefly 15 G8 2C9R7EA | |
| Media Intel Core i7-1265U (19489 - 42966, n=10) | |
| HP ZBook Firefly 16 G9-6B897EA | |
| AIDA64 / CPU ZLib | |
| Media della classe Workstation (742 - 2148, n=25, ultimi 2 anni) | |
| Lenovo ThinkPad P1 G4-20Y4Z9DVUS | |
| Media Intel Core i7-1265U (314 - 632, n=10) | |
| Lenovo ThinkPad P15s Gen2-20W6000GGE | |
| HP ZBook Firefly 15 G8 2C9R7EA | |
| HP ZBook Firefly 16 G9-6B897EA | |
| AIDA64 / FP64 Ray-Trace | |
| Media della classe Workstation (5580 - 32891, n=25, ultimi 2 anni) | |
| Lenovo ThinkPad P1 G4-20Y4Z9DVUS | |
| Lenovo ThinkPad P15s Gen2-20W6000GGE | |
| HP ZBook Firefly 15 G8 2C9R7EA | |
| Media Intel Core i7-1265U (1473 - 4376, n=10) | |
| HP ZBook Firefly 16 G9-6B897EA | |
| AIDA64 / CPU PhotoWorxx | |
| Media della classe Workstation (37151 - 93684, n=25, ultimi 2 anni) | |
| Media Intel Core i7-1265U (20213 - 47031, n=10) | |
| Lenovo ThinkPad P15s Gen2-20W6000GGE | |
| HP ZBook Firefly 16 G9-6B897EA | |
| HP ZBook Firefly 15 G8 2C9R7EA | |
| Lenovo ThinkPad P1 G4-20Y4Z9DVUS | |
Prestazioni del sistema
Soggettivamente, le prestazioni durante l'uso quotidiano sono eccellenti e le scarse prestazioni della CPU non sono così evidenti dai benchmark sintetici, il che può ovviamente essere parzialmente attribuito alla velocissima unità SSD PCIe-4.0. Detto questo, gli utenti incontreranno rapidamente dei limiti quando metteranno sotto stress il sistema, ad esempio con il multi-tasking. La lentezza delle prestazioni della CPU significa anche che il sistema non è certamente a prova di futuro.
CrossMark: Overall | Productivity | Creativity | Responsiveness
| PCMark 10 / Score | |
| Media della classe Workstation (6436 - 10409, n=21, ultimi 2 anni) | |
| Dell Precision 5000 5560 | |
| Lenovo ThinkPad P1 G4-20Y4Z9DVUS | |
| Media Intel Core i7-1265U, NVIDIA T550 Laptop GPU (5488 - 6181, n=3) | |
| HP ZBook Firefly 16 G9-6B897EA | |
| HP ZBook Firefly 15 G8 2C9R7EA | |
| Lenovo ThinkPad P15s Gen2-20W6000GGE | |
| PCMark 10 / Essentials | |
| Dell Precision 5000 5560 | |
| Media della classe Workstation (9622 - 11157, n=21, ultimi 2 anni) | |
| HP ZBook Firefly 16 G9-6B897EA | |
| Media Intel Core i7-1265U, NVIDIA T550 Laptop GPU (9960 - 10250, n=3) | |
| Lenovo ThinkPad P1 G4-20Y4Z9DVUS | |
| Lenovo ThinkPad P15s Gen2-20W6000GGE | |
| HP ZBook Firefly 15 G8 2C9R7EA | |
| PCMark 10 / Productivity | |
| Media della classe Workstation (8789 - 20616, n=21, ultimi 2 anni) | |
| Lenovo ThinkPad P15s Gen2-20W6000GGE | |
| Dell Precision 5000 5560 | |
| HP ZBook Firefly 15 G8 2C9R7EA | |
| Media Intel Core i7-1265U, NVIDIA T550 Laptop GPU (8315 - 9474, n=3) | |
| HP ZBook Firefly 16 G9-6B897EA | |
| Lenovo ThinkPad P1 G4-20Y4Z9DVUS | |
| PCMark 10 / Digital Content Creation | |
| Media della classe Workstation (7744 - 15631, n=21, ultimi 2 anni) | |
| Dell Precision 5000 5560 | |
| Lenovo ThinkPad P1 G4-20Y4Z9DVUS | |
| Media Intel Core i7-1265U, NVIDIA T550 Laptop GPU (5399 - 6793, n=3) | |
| HP ZBook Firefly 15 G8 2C9R7EA | |
| HP ZBook Firefly 16 G9-6B897EA | |
| Lenovo ThinkPad P15s Gen2-20W6000GGE | |
| CrossMark / Overall | |
| Media della classe Workstation (1307 - 2267, n=24, ultimi 2 anni) | |
| HP ZBook Firefly 16 G9-6B897EA | |
| Media Intel Core i7-1265U, NVIDIA T550 Laptop GPU (1591 - 1623, n=3) | |
| Apple MacBook Pro 16 2021 M1 Pro | |
| Lenovo ThinkPad P1 G4-20Y4Z9DVUS | |
| CrossMark / Productivity | |
| Media della classe Workstation (1130 - 2122, n=24, ultimi 2 anni) | |
| HP ZBook Firefly 16 G9-6B897EA | |
| Media Intel Core i7-1265U, NVIDIA T550 Laptop GPU (1553 - 1592, n=3) | |
| Lenovo ThinkPad P1 G4-20Y4Z9DVUS | |
| Apple MacBook Pro 16 2021 M1 Pro | |
| CrossMark / Creativity | |
| Media della classe Workstation (1657 - 2725, n=24, ultimi 2 anni) | |
| Apple MacBook Pro 16 2021 M1 Pro | |
| HP ZBook Firefly 16 G9-6B897EA | |
| Media Intel Core i7-1265U, NVIDIA T550 Laptop GPU (1723 - 1751, n=3) | |
| Lenovo ThinkPad P1 G4-20Y4Z9DVUS | |
| CrossMark / Responsiveness | |
| Media della classe Workstation (993 - 2096, n=24, ultimi 2 anni) | |
| HP ZBook Firefly 16 G9-6B897EA | |
| Media Intel Core i7-1265U, NVIDIA T550 Laptop GPU (1344 - 1376, n=3) | |
| Lenovo ThinkPad P1 G4-20Y4Z9DVUS | |
| Apple MacBook Pro 16 2021 M1 Pro | |
| PCMark 10 Score | 5634 punti | |
Aiuto | ||
| AIDA64 / Memory Copy | |
| Media della classe Workstation (56003 - 164795, n=25, ultimi 2 anni) | |
| Media Intel Core i7-1265U (40212 - 72204, n=10) | |
| HP ZBook Firefly 16 G9-6B897EA | |
| Lenovo ThinkPad P15s Gen2-20W6000GGE | |
| Lenovo ThinkPad P1 G4-20Y4Z9DVUS | |
| HP ZBook Firefly 15 G8 2C9R7EA | |
| AIDA64 / Memory Read | |
| Media della classe Workstation (55795 - 121563, n=25, ultimi 2 anni) | |
| Media Intel Core i7-1265U (41808 - 69493, n=10) | |
| HP ZBook Firefly 16 G9-6B897EA | |
| Lenovo ThinkPad P15s Gen2-20W6000GGE | |
| Lenovo ThinkPad P1 G4-20Y4Z9DVUS | |
| HP ZBook Firefly 15 G8 2C9R7EA | |
| AIDA64 / Memory Write | |
| Media della classe Workstation (55663 - 214520, n=25, ultimi 2 anni) | |
| HP ZBook Firefly 16 G9-6B897EA | |
| Media Intel Core i7-1265U (41382 - 76027, n=10) | |
| Lenovo ThinkPad P15s Gen2-20W6000GGE | |
| Lenovo ThinkPad P1 G4-20Y4Z9DVUS | |
| HP ZBook Firefly 15 G8 2C9R7EA | |
| AIDA64 / Memory Latency | |
| Media della classe Workstation (84.5 - 165.2, n=25, ultimi 2 anni) | |
| Media Intel Core i7-1265U (74.6 - 112.4, n=10) | |
| HP ZBook Firefly 16 G9-6B897EA | |
| Lenovo ThinkPad P1 G4-20Y4Z9DVUS | |
| Lenovo ThinkPad P15s Gen2-20W6000GGE | |
| HP ZBook Firefly 15 G8 2C9R7EA | |
* ... Meglio usare valori piccoli
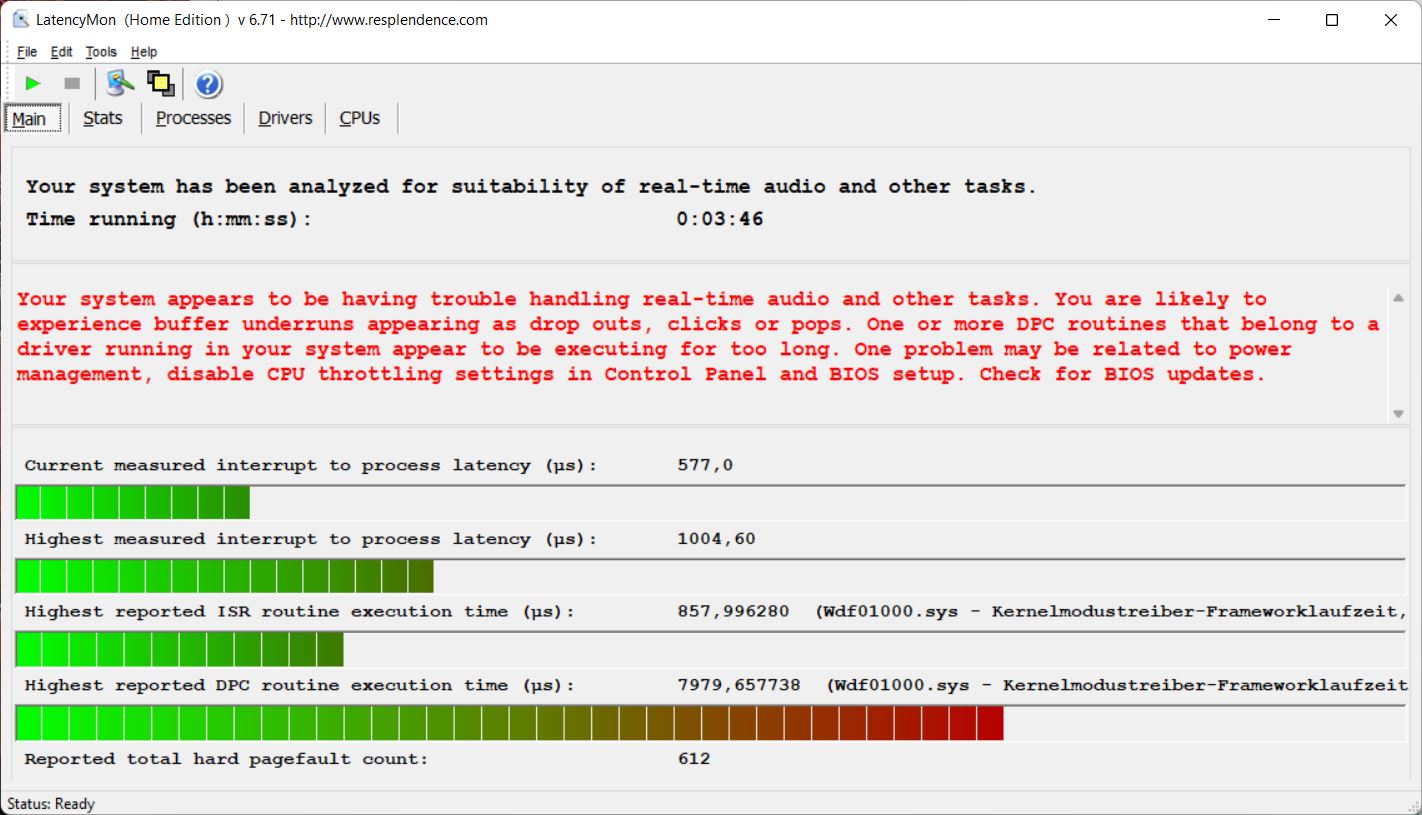
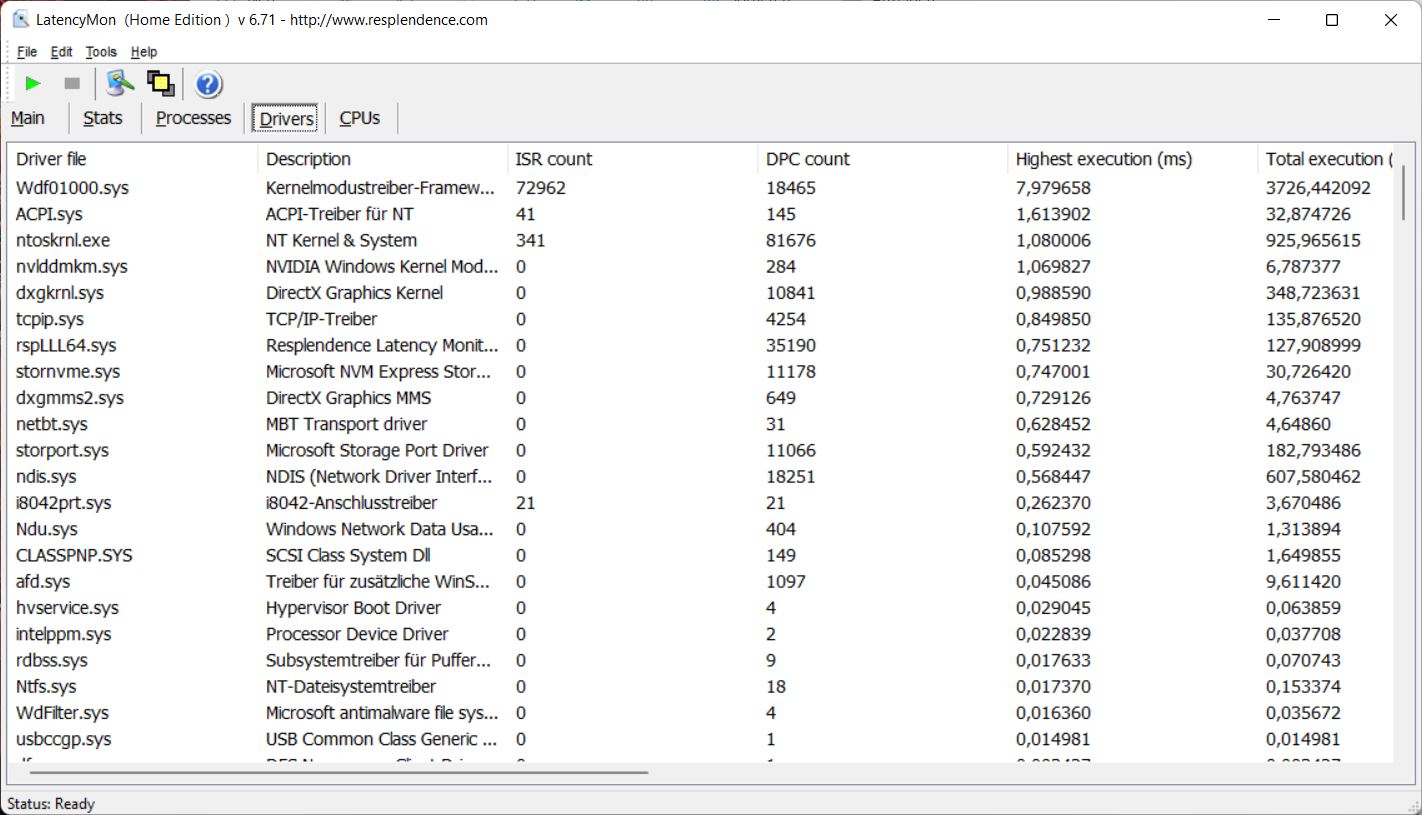
Latenza DPC
Con la versione del BIOS più aggiornata al momento del test, il nostro dispositivo di prova soffre di un leggero aumento delle latenze DPC durante il nostro test Wi-Fi standardizzato (navigazione web, visione di un video YouTube 4K, stress della CPU), rendendo lo ZBook una scelta non ottimale per l'uso di software audio in tempo reale.
| DPC Latencies / LatencyMon - interrupt to process latency (max), Web, Youtube, Prime95 | |
| Lenovo ThinkPad P15s Gen2-20W6000GGE | |
| Lenovo ThinkPad P1 G4-20Y4Z9DVUS | |
| HP ZBook Firefly 15 G8 2C9R7EA | |
| HP ZBook Firefly 16 G9-6B897EA | |
| Dell Precision 5000 5560 | |
* ... Meglio usare valori piccoli
Soluzione di stoccaggio
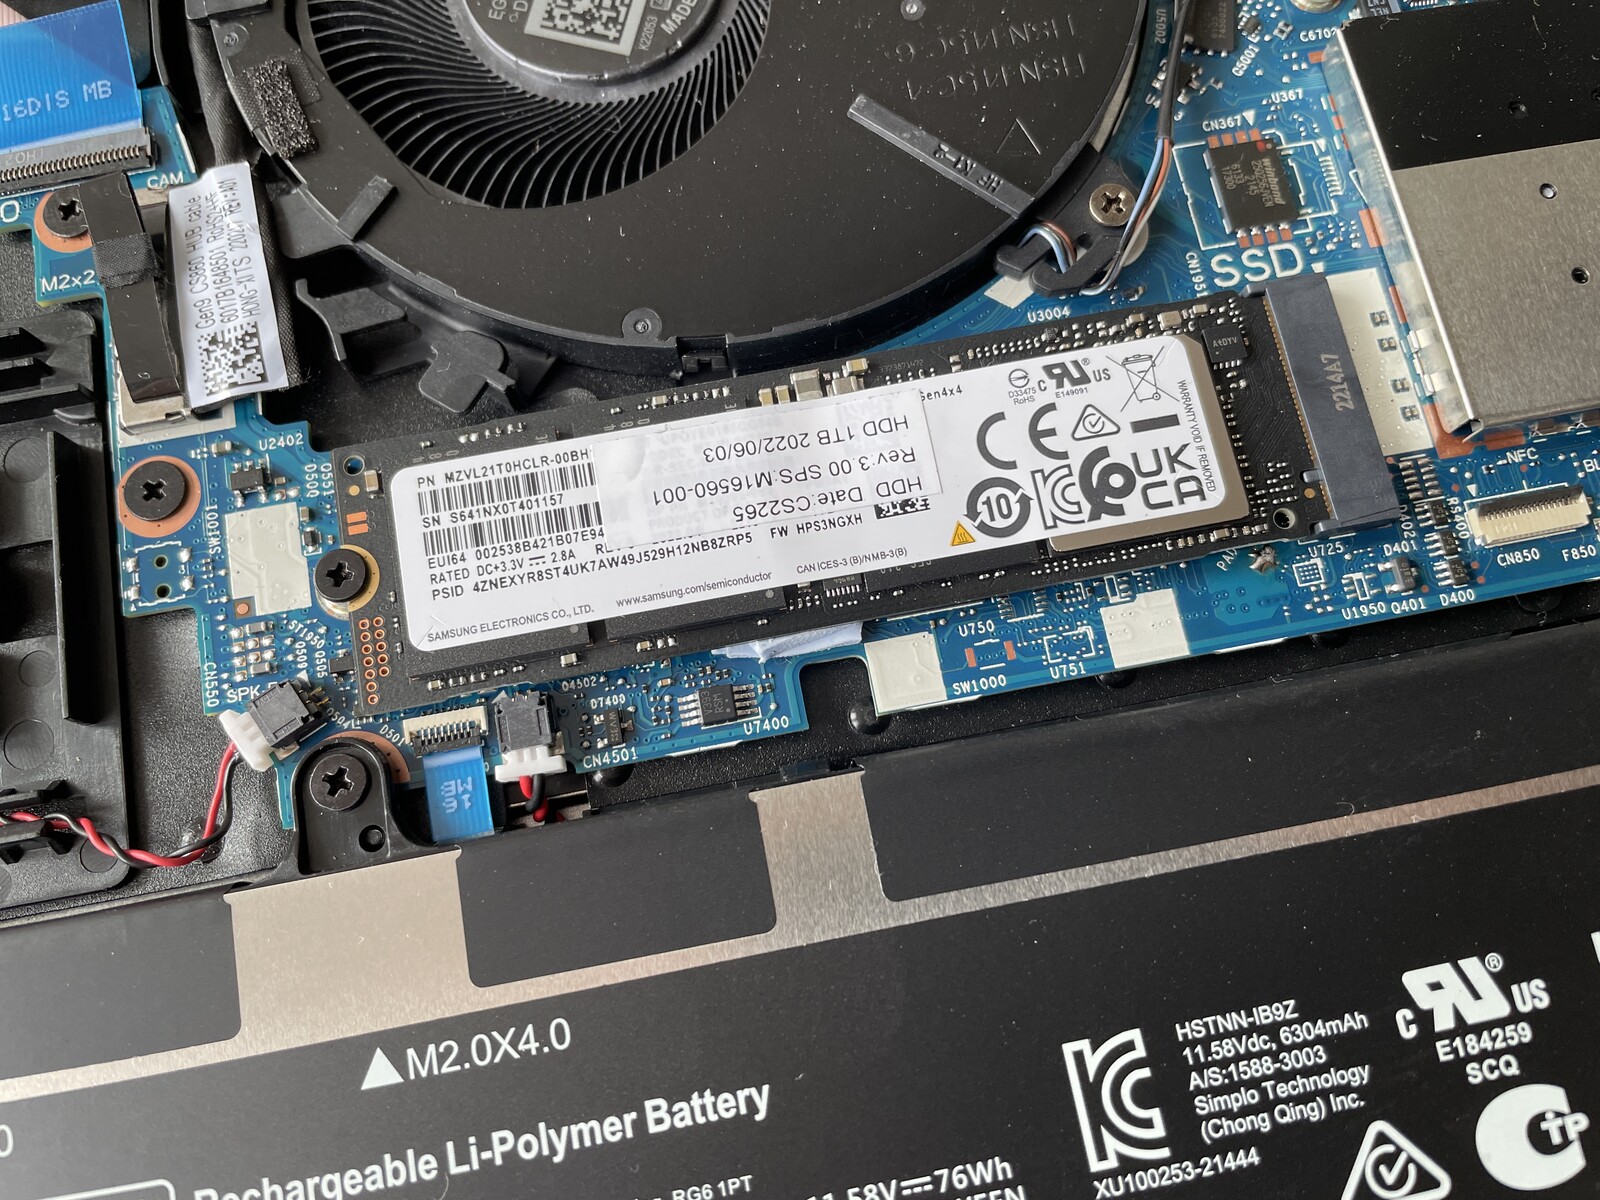
Lo ZBook Firefly 16 G9 è dotato di un veloce slot PCIe-4.0 e, nel caso del nostro esemplare di prova, di un'unità SSD Samsung M.2-2280 da 1 TB. L'unità PM9A1 è una delle unità SSD più veloci disponibili e abbiamo misurato velocità di trasferimento eccellenti. Anche se l'unità SSD non è dotata di un sistema di raffreddamento, le prestazioni non diminuiscono in particolare sotto sforzo continuo. Naturalmente, anche il posizionamento all'interno del case è un fattore importante. L'utente ha a disposizione 890 GB ex fabbrica. Altri benchmark sull'SSD sono disponibili qui.

| Drive Performance rating - Percent | |
| Media Samsung PM9A1 MZVL21T0HCLR | |
| Media della classe Workstation | |
| Dell Precision 5000 5560 | |
| Lenovo ThinkPad P1 G4-20Y4Z9DVUS | |
| HP ZBook Firefly 16 G9-6B897EA | |
| Lenovo ThinkPad P15s Gen2-20W6000GGE | |
| HP ZBook Firefly 15 G8 2C9R7EA | |
* ... Meglio usare valori piccoli
Disk Throttling: DiskSpd Read Loop, Queue Depth 8
Prestazioni della GPU
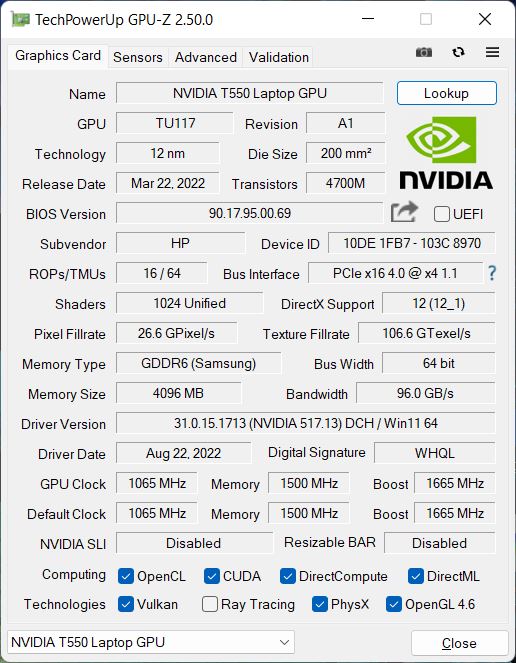
Il nuovo Nvidia T550 è un piccolo aggiornamento rispetto al vecchio T500 e si basa ancora sul chip TU-117, utilizzato anche dall'MX550 GeForce MX550 & MX450. In altre parole, si tratta di una scheda entry-level, soprattutto perché HP ha impostato il TGP a soli 20 watt (sarebbe stato possibile raggiungere i 60 watt). A seconda del caso d'uso, i driver professionali conferiscono alla GPU una certa legittimità.
I risultati dei nostri benchmark sintetici 3DMark sono deludenti, dato che il T500 del vecchio Firefly 15 G8 è leggermente più veloce e il chip consumer MX550, che abbiamo testato con un TGP di 35 watt, offre prestazioni significativamente migliori. Almeno nei benchmark professionali SPECViewperf, il T550 si assicura un piccolo vantaggio sul vecchio T500.
Le prestazioni della GPU rimangono costantemente a questo livello generalmente basso anche sotto carico continuo e in modalità batteria. Altri benchmark della GPU sono disponibili nel nostro elenco dei benchmark.
| GFXBench | |
| 2560x1440 Aztec Ruins High Tier Offscreen | |
| Apple MacBook Pro 16 2021 M1 Pro | |
| Media della classe Workstation (60.6 - 224, n=7, ultimi 2 anni) | |
| Lenovo IdeaCentre AIO 3 24IAP7 | |
| HP ZBook Firefly 16 G9-6B897EA | |
| Media NVIDIA T550 Laptop GPU (n=1) | |
| 1920x1080 Aztec Ruins Normal Tier Offscreen | |
| Apple MacBook Pro 16 2021 M1 Pro | |
| Media della classe Workstation (152.8 - 583, n=7, ultimi 2 anni) | |
| Lenovo IdeaCentre AIO 3 24IAP7 | |
| HP ZBook Firefly 16 G9-6B897EA | |
| Media NVIDIA T550 Laptop GPU (n=1) | |
| 1920x1080 Car Chase Offscreen | |
| Apple MacBook Pro 16 2021 M1 Pro | |
| Media della classe Workstation (157.3 - 526, n=6, ultimi 2 anni) | |
| Lenovo IdeaCentre AIO 3 24IAP7 | |
| HP ZBook Firefly 16 G9-6B897EA | |
| Media NVIDIA T550 Laptop GPU (n=1) | |
| 3DMark 06 Standard Score | 31003 punti | |
| 3DMark Vantage P Result | 25155 punti | |
| 3DMark 11 Performance | 7405 punti | |
| 3DMark Cloud Gate Standard Score | 17399 punti | |
| 3DMark Fire Strike Score | 4581 punti | |
| 3DMark Time Spy Score | 2066 punti | |
Aiuto | ||
| Blender | |
| v3.3 Classroom HIP/AMD | |
| Lenovo Legion 5 Pro 16 ARH7H-82RG0047GE | |
| Lenovo ThinkPad T14 G3-21CF004NGE | |
| v3.3 Classroom OPTIX/RTX | |
| HP ZBook Firefly 16 G9-6B897EA | |
| Dell Precision 5000 5470 | |
| Asus VivoBook Pro 16X OLED N7600PC-L2026X | |
| Lenovo Legion 5 Pro 16 ARH7H-82RG0047GE | |
| Media della classe Workstation (10 - 95, n=19, ultimi 2 anni) | |
| v3.3 Classroom CUDA | |
| HP ZBook Firefly 16 G9-6B897EA | |
| Dell Precision 5000 5470 | |
| Asus VivoBook Pro 16X OLED N7600PC-L2026X | |
| Lenovo Legion 5 Pro 16 ARH7H-82RG0047GE | |
| Media della classe Workstation (16 - 142, n=19, ultimi 2 anni) | |
| v3.3 Classroom CPU | |
| HP ZBook Firefly 16 G9-6B897EA | |
| Asus VivoBook Pro 16X OLED N7600PC-L2026X | |
| Lenovo ThinkPad T14 G3-21CF004NGE | |
| Lenovo Legion 5 Pro 16 ARH7H-82RG0047GE | |
| Dell Precision 5000 5470 | |
| Media della classe Workstation (148 - 464, n=25, ultimi 2 anni) | |
* ... Meglio usare valori piccoli
SPECviewperf 13: Solidworks (sw-04) | Siemens NX (snx-03) | Showcase (showcase-02) | Medical (medical-02) | Maya (maya-05) | Energy (energy-02) | Creo (creo-02) | Catia (catia-05) | 3ds Max (3dsmax-06)
| SPECviewperf 2020 / Solidworks (solidworks-05) | |
| Dell Precision 5000 5560 | |
| Lenovo ThinkPad P1 G4-20Y4Z9DVUS | |
| HP ZBook Firefly 16 G9-6B897EA | |
| HP ZBook Firefly 15 G8 2C9R7EA | |
| Lenovo ThinkPad P15s Gen2-20W6000GGE | |
| SPECviewperf 2020 / Siemens NX (snx-04) | |
| Dell Precision 5000 5560 | |
| Lenovo ThinkPad P1 G4-20Y4Z9DVUS | |
| HP ZBook Firefly 16 G9-6B897EA | |
| HP ZBook Firefly 15 G8 2C9R7EA | |
| Lenovo ThinkPad P15s Gen2-20W6000GGE | |
| SPECviewperf 2020 / Medical (medical-03) | |
| Dell Precision 5000 5560 | |
| Lenovo ThinkPad P1 G4-20Y4Z9DVUS | |
| HP ZBook Firefly 16 G9-6B897EA | |
| HP ZBook Firefly 15 G8 2C9R7EA | |
| Lenovo ThinkPad P15s Gen2-20W6000GGE | |
| SPECviewperf 2020 / Maya (maya-06) | |
| Dell Precision 5000 5560 | |
| Lenovo ThinkPad P1 G4-20Y4Z9DVUS | |
| HP ZBook Firefly 16 G9-6B897EA | |
| HP ZBook Firefly 15 G8 2C9R7EA | |
| Lenovo ThinkPad P15s Gen2-20W6000GGE | |
| SPECviewperf 2020 / Energy (energy-03) | |
| Dell Precision 5000 5560 | |
| Lenovo ThinkPad P1 G4-20Y4Z9DVUS | |
| HP ZBook Firefly 16 G9-6B897EA | |
| HP ZBook Firefly 15 G8 2C9R7EA | |
| Lenovo ThinkPad P15s Gen2-20W6000GGE | |
| SPECviewperf 2020 / Creo (creo-03) | |
| Dell Precision 5000 5560 | |
| Lenovo ThinkPad P1 G4-20Y4Z9DVUS | |
| HP ZBook Firefly 16 G9-6B897EA | |
| HP ZBook Firefly 15 G8 2C9R7EA | |
| Lenovo ThinkPad P15s Gen2-20W6000GGE | |
| SPECviewperf 2020 / CATIA (catia-06) | |
| Dell Precision 5000 5560 | |
| Lenovo ThinkPad P1 G4-20Y4Z9DVUS | |
| HP ZBook Firefly 16 G9-6B897EA | |
| HP ZBook Firefly 15 G8 2C9R7EA | |
| Lenovo ThinkPad P15s Gen2-20W6000GGE | |
| SPECviewperf 2020 / 3ds Max (3dsmax-07) | |
| Dell Precision 5000 5560 | |
| Lenovo ThinkPad P1 G4-20Y4Z9DVUS | |
| HP ZBook Firefly 16 G9-6B897EA | |
| HP ZBook Firefly 15 G8 2C9R7EA | |
| Lenovo ThinkPad P15s Gen2-20W6000GGE | |
| SPECviewperf 13 / Solidworks (sw-04) | |
| Dell Precision 5000 5560 | |
| Lenovo ThinkPad P1 G4-20Y4Z9DVUS | |
| HP ZBook Firefly 16 G9-6B897EA | |
| HP ZBook Firefly 15 G8 2C9R7EA | |
| Lenovo ThinkPad P15s Gen2-20W6000GGE | |
| SPECviewperf 13 / Siemens NX (snx-03) | |
| Dell Precision 5000 5560 | |
| Lenovo ThinkPad P1 G4-20Y4Z9DVUS | |
| HP ZBook Firefly 16 G9-6B897EA | |
| HP ZBook Firefly 15 G8 2C9R7EA | |
| Lenovo ThinkPad P15s Gen2-20W6000GGE | |
| SPECviewperf 13 / Showcase (showcase-02) | |
| Dell Precision 5000 5560 | |
| Lenovo ThinkPad P1 G4-20Y4Z9DVUS | |
| HP ZBook Firefly 16 G9-6B897EA | |
| HP ZBook Firefly 15 G8 2C9R7EA | |
| Lenovo ThinkPad P15s Gen2-20W6000GGE | |
| SPECviewperf 13 / Medical (medical-02) | |
| Dell Precision 5000 5560 | |
| Lenovo ThinkPad P1 G4-20Y4Z9DVUS | |
| HP ZBook Firefly 16 G9-6B897EA | |
| HP ZBook Firefly 15 G8 2C9R7EA | |
| Lenovo ThinkPad P15s Gen2-20W6000GGE | |
| SPECviewperf 13 / Maya (maya-05) | |
| Dell Precision 5000 5560 | |
| Lenovo ThinkPad P1 G4-20Y4Z9DVUS | |
| HP ZBook Firefly 16 G9-6B897EA | |
| HP ZBook Firefly 15 G8 2C9R7EA | |
| Lenovo ThinkPad P15s Gen2-20W6000GGE | |
| SPECviewperf 13 / Energy (energy-02) | |
| Dell Precision 5000 5560 | |
| Lenovo ThinkPad P1 G4-20Y4Z9DVUS | |
| HP ZBook Firefly 15 G8 2C9R7EA | |
| HP ZBook Firefly 16 G9-6B897EA | |
| Lenovo ThinkPad P15s Gen2-20W6000GGE | |
| SPECviewperf 13 / Creo (creo-02) | |
| Dell Precision 5000 5560 | |
| Lenovo ThinkPad P1 G4-20Y4Z9DVUS | |
| HP ZBook Firefly 16 G9-6B897EA | |
| HP ZBook Firefly 15 G8 2C9R7EA | |
| Lenovo ThinkPad P15s Gen2-20W6000GGE | |
| SPECviewperf 13 / Catia (catia-05) | |
| Dell Precision 5000 5560 | |
| Lenovo ThinkPad P1 G4-20Y4Z9DVUS | |
| HP ZBook Firefly 16 G9-6B897EA | |
| HP ZBook Firefly 15 G8 2C9R7EA | |
| Lenovo ThinkPad P15s Gen2-20W6000GGE | |
| SPECviewperf 13 / 3ds Max (3dsmax-06) | |
| Dell Precision 5000 5560 | |
| Lenovo ThinkPad P1 G4-20Y4Z9DVUS | |
| HP ZBook Firefly 16 G9-6B897EA | |
| HP ZBook Firefly 15 G8 2C9R7EA | |
| Lenovo ThinkPad P15s Gen2-20W6000GGE | |
Prestazioni di gioco
Anche se la Nvidia T550 è naturalmente un po' adatto per i giochi, le prestazioni soffrono a causa della lentezza della CPU e il T550 è a malapena più veloce della Radeon 680M integrata Radeon 680M del ThinkPad T14 G3ad esempio. Se il titolo in questione è meno impegnativo, le impostazioni medio-alte dovrebbero essere possibili per la maggior parte del tempo.
| The Witcher 3 | |
| 1920x1080 High Graphics & Postprocessing (Nvidia HairWorks Off) | |
| Media della classe Workstation (53.4 - 156.4, n=3, ultimi 2 anni) | |
| Dell Precision 5000 5560 | |
| Lenovo ThinkPad P1 G4-20Y4Z9DVUS | |
| Lenovo ThinkPad T14 G3-21CF004NGE | |
| Media NVIDIA T550 Laptop GPU (39 - 43, n=3) | |
| HP ZBook Firefly 16 G9-6B897EA | |
| Lenovo ThinkPad P15s Gen2-20W6000GGE | |
| 1920x1080 Ultra Graphics & Postprocessing (HBAO+) | |
| Media della classe Workstation (26.3 - 91.7, n=3, ultimi 2 anni) | |
| Dell Precision 5000 5560 | |
| Lenovo ThinkPad P1 G4-20Y4Z9DVUS | |
| Lenovo ThinkPad T14 G3-21CF004NGE | |
| HP ZBook Firefly 15 G8 2C9R7EA | |
| Media NVIDIA T550 Laptop GPU (19.6 - 23.2, n=3) | |
| HP ZBook Firefly 16 G9-6B897EA | |
| Lenovo ThinkPad P15s Gen2-20W6000GGE | |
| GTA V | |
| 1920x1080 High/On (Advanced Graphics Off) AA:2xMSAA + FX AF:8x | |
| Media della classe Workstation (44.4 - 179.4, n=22, ultimi 2 anni) | |
| Dell Precision 5000 5560 | |
| Lenovo ThinkPad T14 G3-21CF004NGE | |
| Media NVIDIA T550 Laptop GPU (61.5 - 63.9, n=3) | |
| HP ZBook Firefly 16 G9-6B897EA | |
| Lenovo ThinkPad P15s Gen2-20W6000GGE | |
| 1920x1080 Highest AA:4xMSAA + FX AF:16x | |
| Media della classe Workstation (18.1 - 156.1, n=24, ultimi 2 anni) | |
| Dell Precision 5000 5560 | |
| Media NVIDIA T550 Laptop GPU (29 - 29.6, n=3) | |
| HP ZBook Firefly 16 G9-6B897EA | |
| Lenovo ThinkPad P15s Gen2-20W6000GGE | |
| Lenovo ThinkPad T14 G3-21CF004NGE | |
| Final Fantasy XV Benchmark | |
| 1920x1080 Standard Quality | |
| Media della classe Workstation (38.2 - 232, n=25, ultimi 2 anni) | |
| Dell Precision 5000 5560 | |
| Lenovo ThinkPad P1 G4-20Y4Z9DVUS | |
| Lenovo ThinkPad T14 G3-21CF004NGE | |
| HP ZBook Firefly 16 G9-6B897EA | |
| Media NVIDIA T550 Laptop GPU (30.5 - 31.2, n=3) | |
| Lenovo ThinkPad P15s Gen2-20W6000GGE | |
| 1920x1080 High Quality | |
| Media della classe Workstation (26.4 - 197.6, n=25, ultimi 2 anni) | |
| Dell Precision 5000 5560 | |
| Lenovo ThinkPad P1 G4-20Y4Z9DVUS | |
| Lenovo ThinkPad T14 G3-21CF004NGE | |
| HP ZBook Firefly 16 G9-6B897EA | |
| Media NVIDIA T550 Laptop GPU (22 - 22.3, n=3) | |
| Lenovo ThinkPad P15s Gen2-20W6000GGE | |
| F1 2021 | |
| 1920x1080 High Preset AA:T AF:16x | |
| Dell Precision 5000 5560 | |
| HP ZBook Firefly 16 G9-6B897EA | |
| Media NVIDIA T550 Laptop GPU (56.5 - 59.9, n=3) | |
| Lenovo ThinkPad T14 G3-21CF004NGE | |
| 1920x1080 Ultra High Preset + Raytracing AA:T AF:16x | |
| Dell Precision 5000 5560 | |
| HP ZBook Firefly 16 G9-6B897EA | |
| Media NVIDIA T550 Laptop GPU (36.1 - 37, n=3) | |
| Lenovo ThinkPad T14 G3-21CF004NGE | |
| Dota 2 Reborn | |
| 1920x1080 high (2/3) | |
| Media della classe Workstation (52.1 - 199.8, n=25, ultimi 2 anni) | |
| Dell Precision 5000 5560 | |
| Lenovo ThinkPad P1 G4-20Y4Z9DVUS | |
| HP ZBook Firefly 15 G8 2C9R7EA | |
| Media NVIDIA T550 Laptop GPU (92.1 - 101.2, n=3) | |
| HP ZBook Firefly 16 G9-6B897EA | |
| Lenovo ThinkPad P15s Gen2-20W6000GGE | |
| Lenovo ThinkPad T14 G3-21CF004NGE | |
| 1920x1080 ultra (3/3) best looking | |
| Media della classe Workstation (50.7 - 178.4, n=25, ultimi 2 anni) | |
| Dell Precision 5000 5560 | |
| Lenovo ThinkPad P1 G4-20Y4Z9DVUS | |
| HP ZBook Firefly 15 G8 2C9R7EA | |
| Media NVIDIA T550 Laptop GPU (84 - 93.4, n=3) | |
| HP ZBook Firefly 16 G9-6B897EA | |
| Lenovo ThinkPad P15s Gen2-20W6000GGE | |
| Lenovo ThinkPad T14 G3-21CF004NGE | |
Witcher 3 FPS Graph
| basso | medio | alto | ultra | |
|---|---|---|---|---|
| GTA V (2015) | 106.2 | 103.3 | 61.5 | 29.2 |
| The Witcher 3 (2015) | 123 | 75 | 40 | 19.9 |
| Dota 2 Reborn (2015) | 111.4 | 100.3 | 92.1 | 85.2 |
| Final Fantasy XV Benchmark (2018) | 60.7 | 31.2 | 22.3 | |
| X-Plane 11.11 (2018) | 65.5 | 59.4 | 55.5 | |
| Far Cry 5 (2018) | 75 | 41 | 38 | 35 |
| Strange Brigade (2018) | 128 | 51 | 42 | 36 |
| F1 2021 (2021) | 151.1 | 74.4 | 59.5 | 37 |
| F1 22 (2022) | 69.6 | 62 | 43.3 | 31 |
Emissioni ed energia
Rumore del sistema
Una possibile ragione per le scarse prestazioni dei due componenti principali può essere individuata all'interno del case: C'è solo una ventola. L'unico chiaro vantaggio delle basse prestazioni è la silenziosità della ventola, che funziona sempre al minimo con bassi carichi e che è appena percettibile con il pieno carico della CPU a 29 dB(A). Quando la GPU dedicata entra in gioco, la rumorosità aumenta con circa 40-41 dB(A). Questo pone lo ZBook alla pari con il significativamente più veloce Dell Precision 5560e allo stesso tempo lo rende sensibilmente più rumoroso rispetto, ad esempio, al MacBook Pro 16 o del predecessore ZBook Firefly 15 G8che offrivano prestazioni migliori. Non abbiamo notato alcun rumore elettronico o coil whine.
Rumorosità
| Idle |
| 23.8 / 23.8 / 23.8 dB(A) |
| Sotto carico |
| 39.4 / 41.4 dB(A) |
 | ||
30 dB silenzioso 40 dB(A) udibile 50 dB(A) rumoroso |
||
min: | ||
| HP ZBook Firefly 16 G9-6B897EA T550 Laptop GPU, i7-1265U, Samsung PM9A1 MZVL21T0HCLR | Lenovo ThinkPad P1 G4-20Y4Z9DVUS T1200 Laptop GPU, i7-11800H, Samsung PM9A1 MZVL2512HCJQ | Dell Precision 5000 5560 RTX A2000 Laptop GPU, i7-11850H, Samsung PM9A1 MZVL22T0HBLB | Lenovo ThinkPad P15s Gen2-20W6000GGE T500 Laptop GPU, i7-1165G7, WDC PC SN720 SDAQNTW-1T00 | HP ZBook Firefly 15 G8 2C9R7EA T500 Laptop GPU, i7-1165G7, Toshiba XG6 KXG60ZNV1T02 | Apple MacBook Pro 16 2021 M1 Pro M1 Pro 16-Core GPU, M1 Pro, Apple SSD AP1024R | |
|---|---|---|---|---|---|---|
| Noise | -9% | 6% | 0% | 3% | 5% | |
| off /ambiente * (dB) | 23.8 | 24.3 -2% | 23.4 2% | 24.3 -2% | 24.1 -1% | 24.7 -4% |
| Idle Minimum * (dB) | 23.8 | 24.3 -2% | 23.6 1% | 25.5 -7% | 24.1 -1% | 24.7 -4% |
| Idle Average * (dB) | 23.8 | 24.3 -2% | 23.6 1% | 25.5 -7% | 24.1 -1% | 24.7 -4% |
| Idle Maximum * (dB) | 23.8 | 26.6 -12% | 23.6 1% | 25.5 -7% | 27.1 -14% | 24.7 -4% |
| Load Average * (dB) | 39.4 | 46.8 -19% | 25.8 35% | 35.65 10% | 32.8 17% | 26.1 34% |
| Witcher 3 ultra * (dB) | 40.5 | 46.8 -16% | 40.1 1% | 36.1 11% | ||
| Load Maximum * (dB) | 41.4 | 46.8 -13% | 41.4 -0% | 35.65 14% | 36.1 13% | 37.4 10% |
* ... Meglio usare valori piccoli
Temperatura
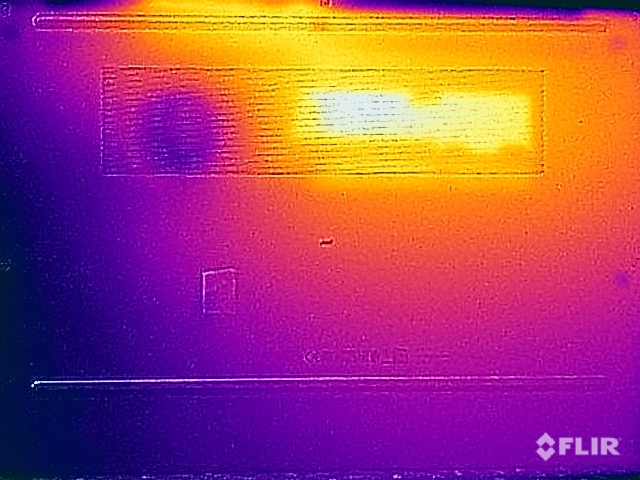
Gli utenti traggono vantaggio dal basso consumo energetico della CPU soprattutto durante l'uso quotidiano, quando la GPU dedicata gira al minimo mentre le superfici metalliche sono solo tiepide, rendendolo adatto a un uso confortevole sulle ginocchia. Tuttavia, se si stressa la GPU si ottengono temperature significativamente più elevate. Sebbene 48 °C (118,4 °F) sul fondo siano ben lontani dall'essere critici, sono abbastanza caldi considerando le scarse prestazioni (potenza totale del sistema di soli 32 watt). Durante lo stress test, il processore scende quasi istantaneamente a 12 watt, mentre la GPU rimane a 20 watt.
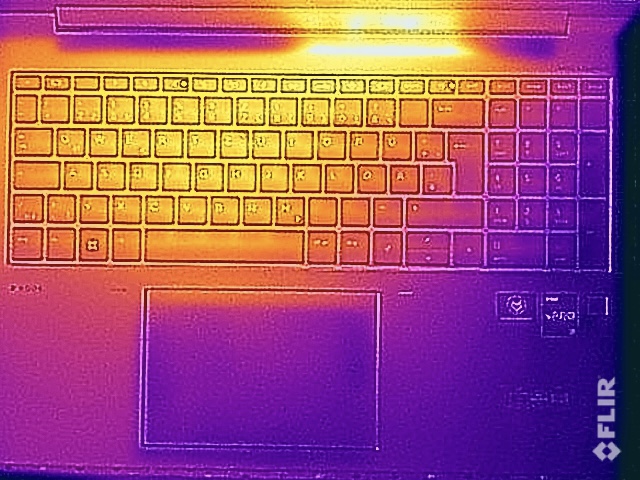
(±) La temperatura massima sul lato superiore è di 42.1 °C / 108 F, rispetto alla media di 38.2 °C / 101 F, che varia da 22.2 a 69.8 °C per questa classe Workstation.
(-) Il lato inferiore si riscalda fino ad un massimo di 48 °C / 118 F, rispetto alla media di 41.1 °C / 106 F
(+) In idle, la temperatura media del lato superiore è di 27.4 °C / 81 F, rispetto alla media deld ispositivo di 32 °C / 90 F.
(±) Riproducendo The Witcher 3, la temperatura media per il lato superiore e' di 33.6 °C / 92 F, rispetto alla media del dispositivo di 32 °C / 90 F.
(+) I poggiapolsi e il touchpad sono piu' freddi della temperatura della pelle con un massimo di 30.9 °C / 87.6 F e sono quindi freddi al tatto.
(-) La temperatura media della zona del palmo della mano di dispositivi simili e'stata di 27.8 °C / 82 F (-3.1 °C / -5.6 F).
| HP ZBook Firefly 16 G9-6B897EA Intel Core i7-1265U, NVIDIA T550 Laptop GPU | Lenovo ThinkPad P1 G4-20Y4Z9DVUS Intel Core i7-11800H, NVIDIA T1200 Laptop GPU | Dell Precision 5000 5560 Intel Core i7-11850H, NVIDIA RTX A2000 Laptop GPU | Lenovo ThinkPad P15s Gen2-20W6000GGE Intel Core i7-1165G7, NVIDIA T500 Laptop GPU | HP ZBook Firefly 15 G8 2C9R7EA Intel Core i7-1165G7, NVIDIA T500 Laptop GPU | Apple MacBook Pro 16 2021 M1 Pro Apple M1 Pro, Apple M1 Pro 16-Core GPU | |
|---|---|---|---|---|---|---|
| Heat | -1% | -7% | -0% | 13% | 17% | |
| Maximum Upper Side * (°C) | 42.1 | 49.9 -19% | 48.2 -14% | 42.8 -2% | 41.2 2% | 41 3% |
| Maximum Bottom * (°C) | 48 | 56.7 -18% | 42.6 11% | 59.1 -23% | 47.2 2% | 39 19% |
| Idle Upper Side * (°C) | 29.9 | 25.5 15% | 34.8 -16% | 26.4 12% | 23.7 21% | 24 20% |
| Idle Bottom * (°C) | 32.9 | 26.2 20% | 35.2 -7% | 28.9 12% | 23.9 27% | 24 27% |
* ... Meglio usare valori piccoli
Altoparlanti
I due altoparlanti stereo downfiring sono situati nella parte centrale ai lati destro e sinistro della tastiera. Anche se il suono non è così buono come quello del MacBook Pro 16è comunque eccellente nel complesso, con caratteristiche molto spaziose e corpose. C'è ancora margine di miglioramento, soprattutto per quanto riguarda i bassi.
HP ZBook Firefly 16 G9-6B897EA analisi audio
(+) | gli altoparlanti sono relativamente potenti (83 dB)
Bassi 100 - 315 Hz
(-) | quasi nessun basso - in media 17.5% inferiori alla media
(±) | la linearità dei bassi è media (12.1% delta rispetto alla precedente frequenza)
Medi 400 - 2000 Hz
(+) | medi bilanciati - solo only 2.7% rispetto alla media
(+) | medi lineari (3.8% delta rispetto alla precedente frequenza)
Alti 2 - 16 kHz
(+) | Alti bilanciati - appena 3% dalla media
(+) | alti lineari (5.3% delta rispetto alla precedente frequenza)
Nel complesso 100 - 16.000 Hz
(+) | suono nel complesso lineare (13.3% differenza dalla media)
Rispetto alla stessa classe
» 25% di tutti i dispositivi testati in questa classe è stato migliore, 4% simile, 71% peggiore
» Il migliore ha avuto un delta di 7%, medio di 17%, peggiore di 35%
Rispetto a tutti i dispositivi testati
» 14% di tutti i dispositivi testati in questa classe è stato migliore, 3% similare, 83% peggiore
» Il migliore ha avuto un delta di 4%, medio di 24%, peggiore di 134%
Apple MacBook Pro 16 2021 M1 Pro analisi audio
(+) | gli altoparlanti sono relativamente potenti (84.7 dB)
Bassi 100 - 315 Hz
(+) | bassi buoni - solo 3.8% dalla media
(+) | bassi in lineaa (5.2% delta rispetto alla precedente frequenza)
Medi 400 - 2000 Hz
(+) | medi bilanciati - solo only 1.3% rispetto alla media
(+) | medi lineari (2.1% delta rispetto alla precedente frequenza)
Alti 2 - 16 kHz
(+) | Alti bilanciati - appena 1.9% dalla media
(+) | alti lineari (2.7% delta rispetto alla precedente frequenza)
Nel complesso 100 - 16.000 Hz
(+) | suono nel complesso lineare (4.6% differenza dalla media)
Rispetto alla stessa classe
» 0% di tutti i dispositivi testati in questa classe è stato migliore, 0% simile, 100% peggiore
» Il migliore ha avuto un delta di 5%, medio di 17%, peggiore di 45%
Rispetto a tutti i dispositivi testati
» 0% di tutti i dispositivi testati in questa classe è stato migliore, 0% similare, 100% peggiore
» Il migliore ha avuto un delta di 4%, medio di 24%, peggiore di 134%
Consumo di energia
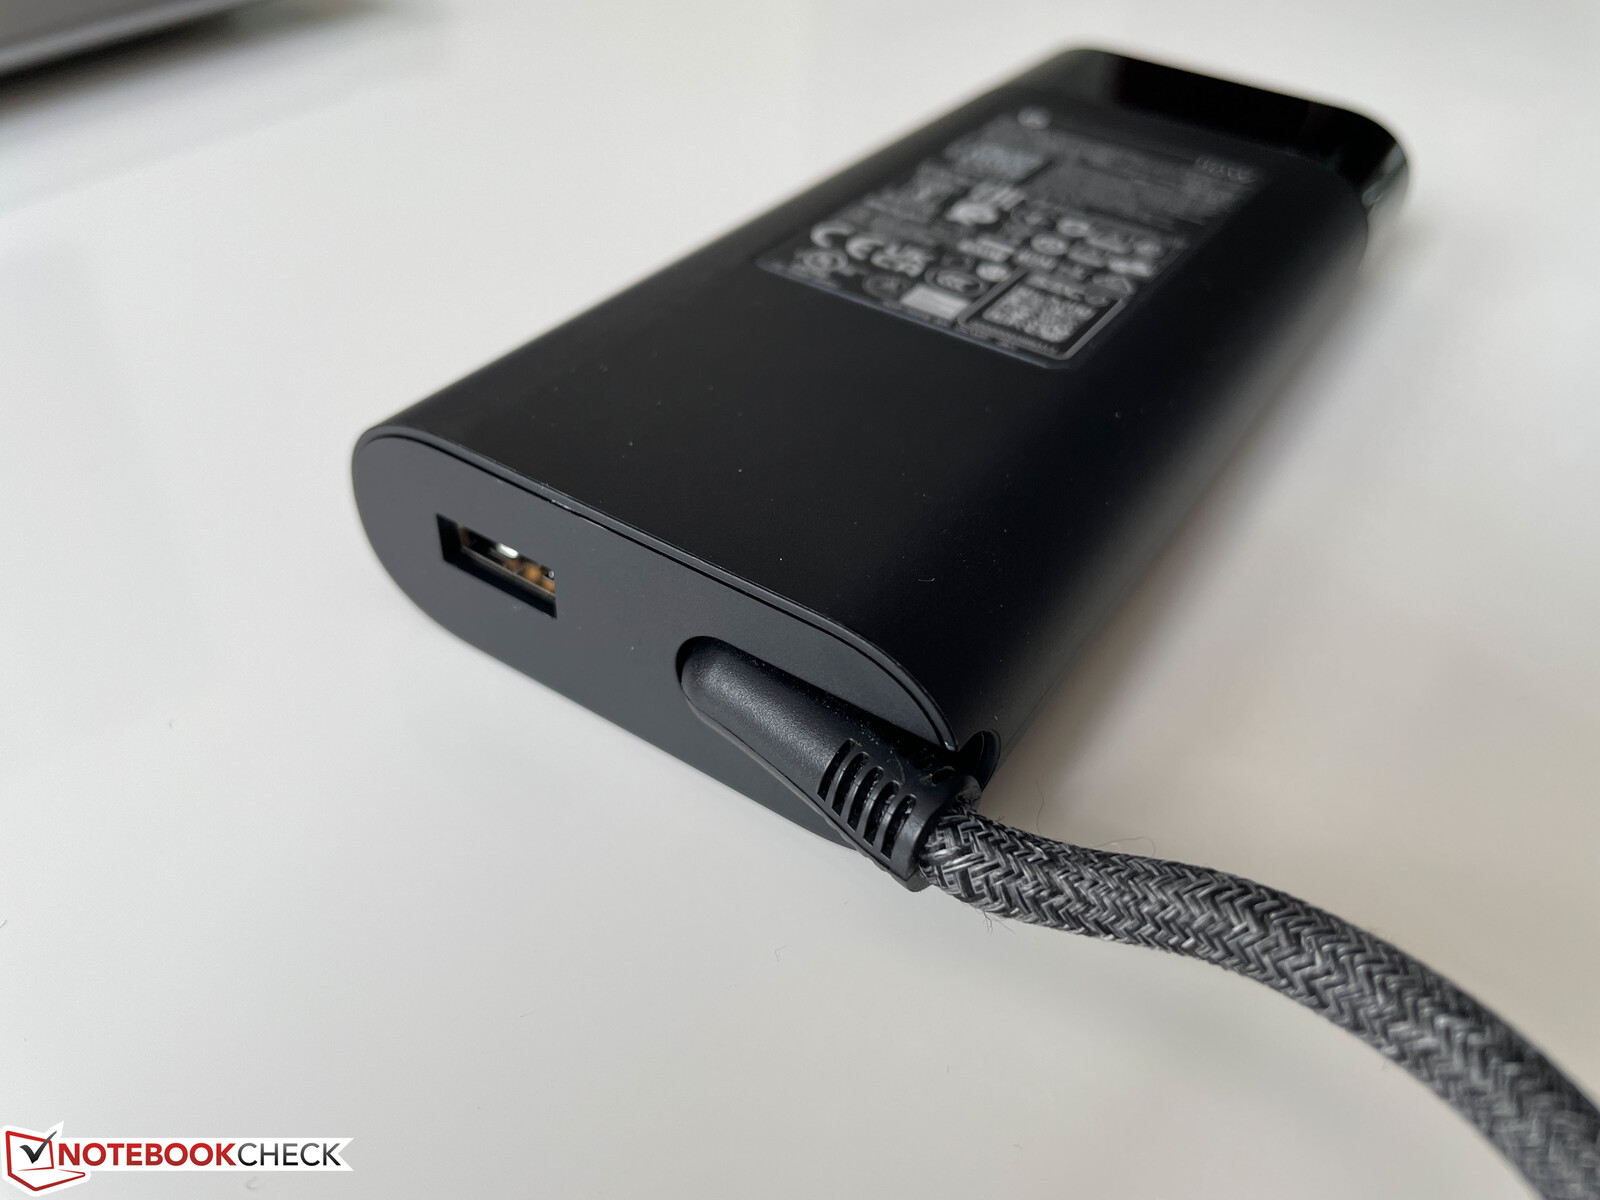
Durante i test al minimo, lo ZBook Firefly 16 G9 si presenta come un portatile molto efficiente dal punto di vista energetico, con un pannello FHD luminoso ma economico. Sebbene il dispositivo sia molto economico anche sotto carico, ciò avviene a scapito delle prestazioni. Durante lo stress test abbiamo occasionalmente misurato poco più di 90 watt, ma il valore scende rapidamente e si stabilizza a 47 watt. Un caricatore da 65 watt sarebbe stato sufficiente. Il modello da 110 W è in grado di erogare 100 watt tramite USB-C e 10 watt tramite la porta USB-A aggiuntiva.
| HP ZBook Firefly 16 G9-6B897EA T550 Laptop GPU, i7-1265U, Samsung PM9A1 MZVL21T0HCLR | Lenovo ThinkPad P1 G4-20Y4Z9DVUS T1200 Laptop GPU, i7-11800H, Samsung PM9A1 MZVL2512HCJQ | Dell Precision 5000 5560 RTX A2000 Laptop GPU, i7-11850H, Samsung PM9A1 MZVL22T0HBLB | Lenovo ThinkPad P15s Gen2-20W6000GGE T500 Laptop GPU, i7-1165G7, WDC PC SN720 SDAQNTW-1T00 | HP ZBook Firefly 15 G8 2C9R7EA T500 Laptop GPU, i7-1165G7, Toshiba XG6 KXG60ZNV1T02 | Apple MacBook Pro 16 2021 M1 Pro M1 Pro 16-Core GPU, M1 Pro, Apple SSD AP1024R | |
|---|---|---|---|---|---|---|
| Power Consumption | -93% | -86% | -19% | 6% | -37% | |
| Idle Minimum * (Watt) | 4.5 | 9.9 -120% | 6.2 -38% | 5.8 -29% | 3.3 27% | 5 -11% |
| Idle Average * (Watt) | 8 | 13.9 -74% | 13.9 -74% | 13.3 -66% | 5.6 30% | 15.1 -89% |
| Idle Maximum * (Watt) | 8.7 | 14.6 -68% | 23.8 -174% | 15.6 -79% | 8.7 -0% | 15.5 -78% |
| Load Average * (Watt) | 48.3 | 95 -97% | 95.7 -98% | 43.2 11% | 64.4 -33% | 54 -12% |
| Witcher 3 ultra * (Watt) | 45.3 | 98.9 -118% | 87 -92% | 37.1 18% | 53 -17% | |
| Load Maximum * (Watt) | 94.7 | 170.8 -80% | 132.6 -40% | 67.3 29% | 69 27% | 90 5% |
* ... Meglio usare valori piccoli
| Off / Standby | |
| Idle | |
| Sotto carico |
|
Leggenda:
min: | |
Energy Consumption Witcher 3 / Stress Test
Energy Consumption external Monitor
Durata della batteria
L'autonomia è eccellente grazie alla batteria di grandi dimensioni (76 Wh) e al basso consumo energetico. Nel nostro test Wi-Fi, il sistema dura quasi 10 ore con la massima luminosità e ben 13 ore con una luminosità regolata a 150 nits (nel caso del nostro dispositivo di prova, 57% di luminosità), mentre il test video dura oltre 18 ore. Questi risultati rendono lo ZBook un forte concorrente in questa categoria anche per il MacBook Pro 16. In condizioni di massimo stress, la batteria dura ancora due ore, ancora una volta a causa delle basse prestazioni. La ricarica completa del dispositivo mentre è in funzione richiede solo 90 minuti e il 50% di carica è disponibile dopo soli 30 minuti.
| HP ZBook Firefly 16 G9-6B897EA i7-1265U, T550 Laptop GPU, 76 Wh | Lenovo ThinkPad P1 G4-20Y4Z9DVUS i7-11800H, T1200 Laptop GPU, 90 Wh | Dell Precision 5000 5560 i7-11850H, RTX A2000 Laptop GPU, 86 Wh | Lenovo ThinkPad P15s Gen2-20W6000GGE i7-1165G7, T500 Laptop GPU, 57 Wh | HP ZBook Firefly 15 G8 2C9R7EA i7-1165G7, T500 Laptop GPU, 56 Wh | Apple MacBook Pro 16 2021 M1 Pro M1 Pro, M1 Pro 16-Core GPU, 99.6 Wh | Media della classe Workstation | |
|---|---|---|---|---|---|---|---|
| Autonomia della batteria | -32% | -31% | -31% | -7% | 13% | -37% | |
| H.264 (h) | 18.4 | 9.9 -46% | 15.3 -17% | 17.5 -5% | 9.51 ? -48% | ||
| WiFi v1.3 (h) | 13 | 8.8 -32% | 6.3 -52% | 7.7 -41% | 10.5 -19% | 16.9 30% | 8.53 ? -34% |
| Load (h) | 2 | 1.8 -10% | 1.9 -5% | 2.3 15% | 1.429 ? -29% |
Pro
Contro
Verdetto - La workstation mobile è più lenta del modello dell'anno scorso

Prestazioni buone e costanti dovrebbero essere la priorità numero uno per una workstation mobile. Anche se i modelli ZBook Firefly sono workstation sottili con componenti entry-level, il limite di potenza estremamente basso del processore mostra chiaramente che HP ha mancato il bersaglio. Siamo stupiti di come un processore Alder Lake-U di attuale generazione debba funzionare a soli 12 watt dopo un secondo, in particolare in un grande chassis da 16 pollici. In questo caso, qualsiasi subnotebook da 13 pollici offre prestazioni (molto) migliori.
Le prestazioni del Nvidia T550 È altrettanto deludente, poiché funziona solo a 20 watt, il valore minimo per questa GPU. Di conseguenza, le prestazioni grafiche sono solo marginalmente migliori e in alcuni scenari addirittura peggiori rispetto al vecchio ZBook Firefly 15 G8 ZBook Firefly 15 G8 con Nvidia T500. Si tratta di un passo nella direzione sbagliata. Nonostante la lentezza delle prestazioni, abbiamo misurato temperature superficiali elevate sotto carico, il che indica una scarsa capacità di raffreddamento.
Altri aspetti del portatile sono appena degni di nota, poiché il Firefly 16 G9 non riesce a soddisfare il suo scopo principale di workstation. La ventola silenziosa e la lunga durata della batteria possono fare poco per cambiare questo fatto. È un peccato, perché lo chassis di qualità superiore, l'eccellente tastiera e lo schermo opaco costituirebbero altrimenti una solida base per un buon prodotto.
Sebbene l'HP ZBook Firefly 16 G9 mostri un potenziale come solida workstation mobile entry-level, la CPU scadente e le prestazioni mediocri della GPU lo squalificano dal caso d'uso previsto. Sebbene non sia necessariamente un cattivo portatile, le prestazioni della CPU appaiono obsolete anche per gli standard consumer.
Pur dovendo ancora recensire le workstation concorrenti, sconsigliamo l'acquisto dell'HP a causa delle scarse prestazioni del processore. Cercheremo di mettere le mani su un altro modello di prova con un processore Alder Lake-P e, si spera, con prestazioni della CPU complessivamente migliori.
Prezzo e disponibilità
La nostra configurazione di prova è disponibile presso vari rivenditori online o presso il negozio online di HP direttamente per circa 3000 dollari.
HP ZBook Firefly 16 G9-6B897EA
- 10/07/2022 v7 (old)
Andreas Osthoff
Price comparison

