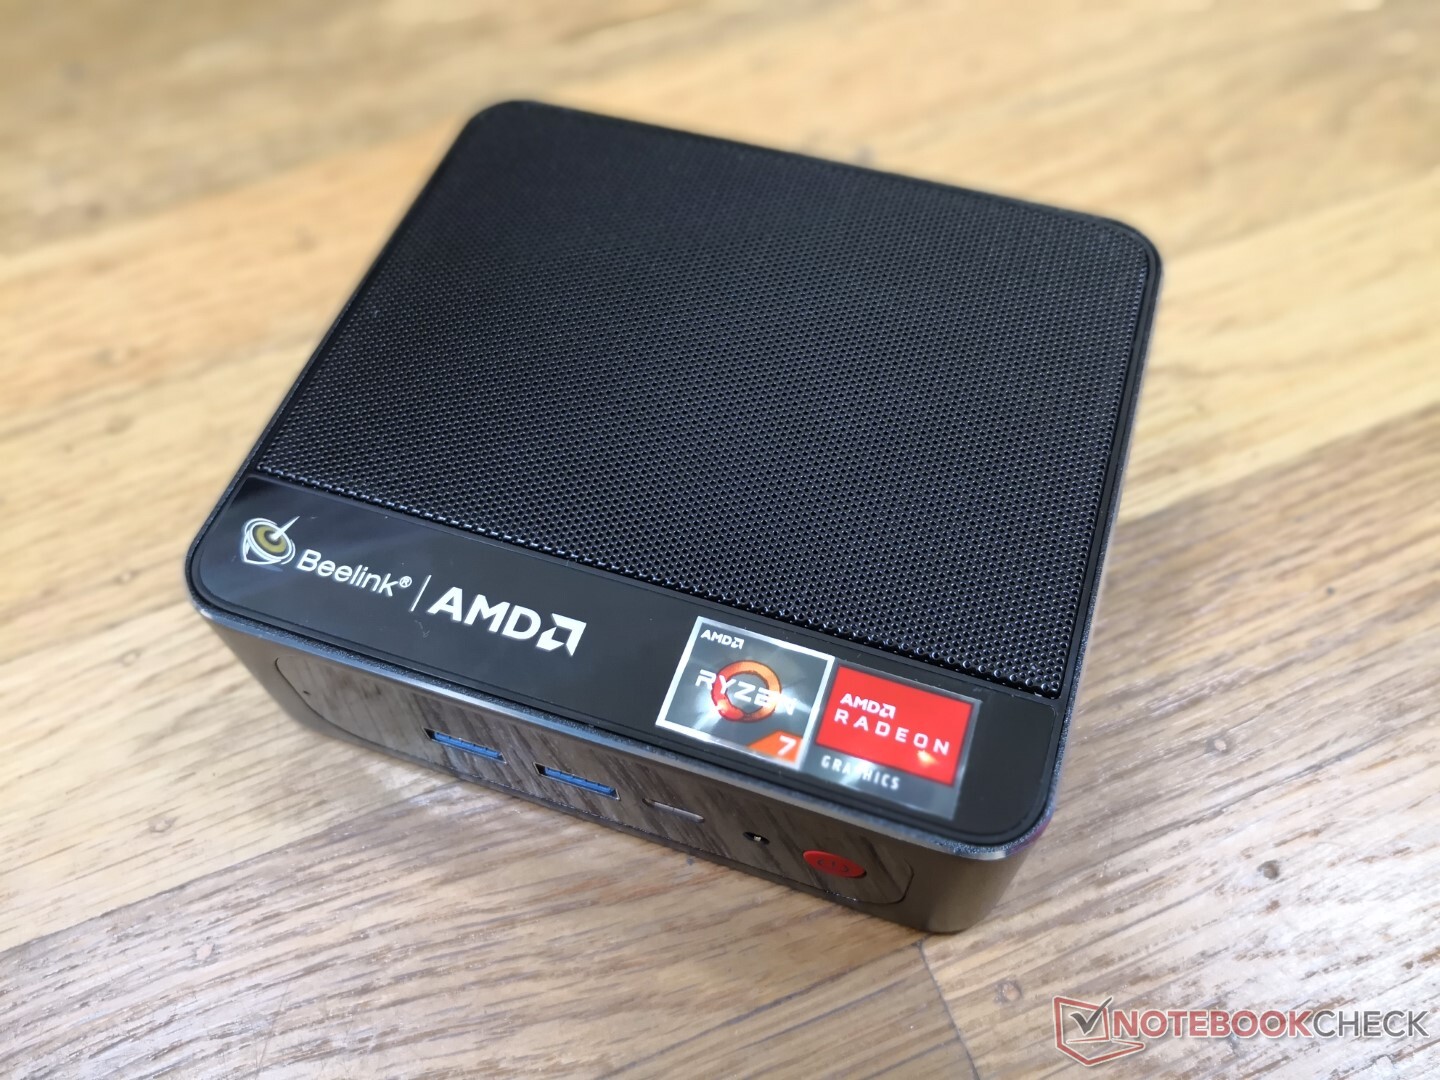
Recensione del mini PC Beelink SER3: Il vecchio Ryzen 7 3750H ha un suo perché

Beelink ha diversi mini PC alimentati da vecchie CPU Intel e AMD come alternative più economiche ai più recenti NUC Intel alimentati da processori di ultima generazione. Quasi tutte le applicazioni HTPC che vanno dalla navigazione web allo streaming video 4K non richiedono le CPU più veloci e più grandi, il che significa che la maggior parte degli utenti può cavarsela con un hardware meno costoso.
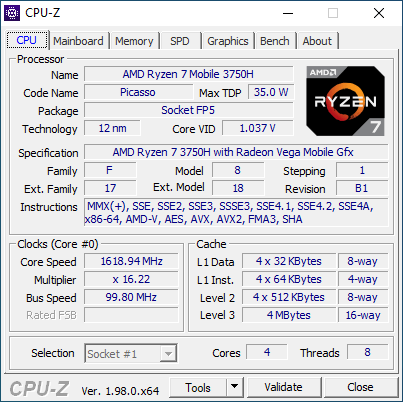
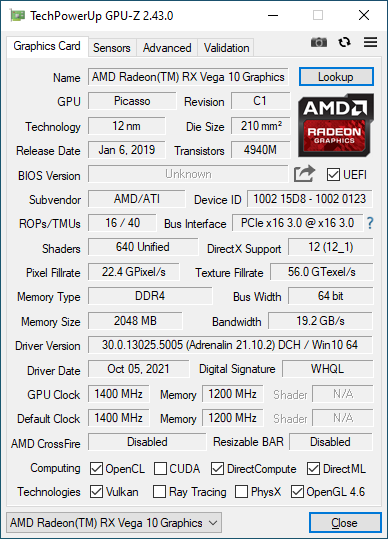
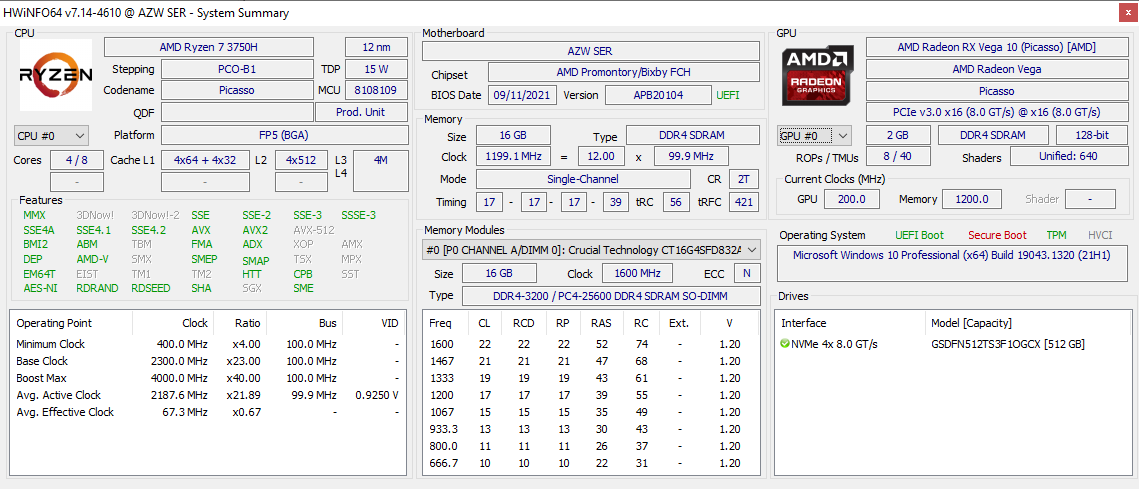
La nostra unità di prova Beelink SER3 è dotata del vecchio AMD Zen+ di due anni Ryzen 7 3750H CPU che da allora è stata sostituita dalle più recenti serie Zen 2 4000H e Zen 3 5000H.
Altre recensioni di Beelink
No, or more than one (0) Rating for the given SpecsID 326081 found
Potential Competitors in Comparison
Punteggio | Data | Modello | Peso | Altezza | Dimensione | Risoluzione | Prezzo |
|---|---|---|---|---|---|---|---|
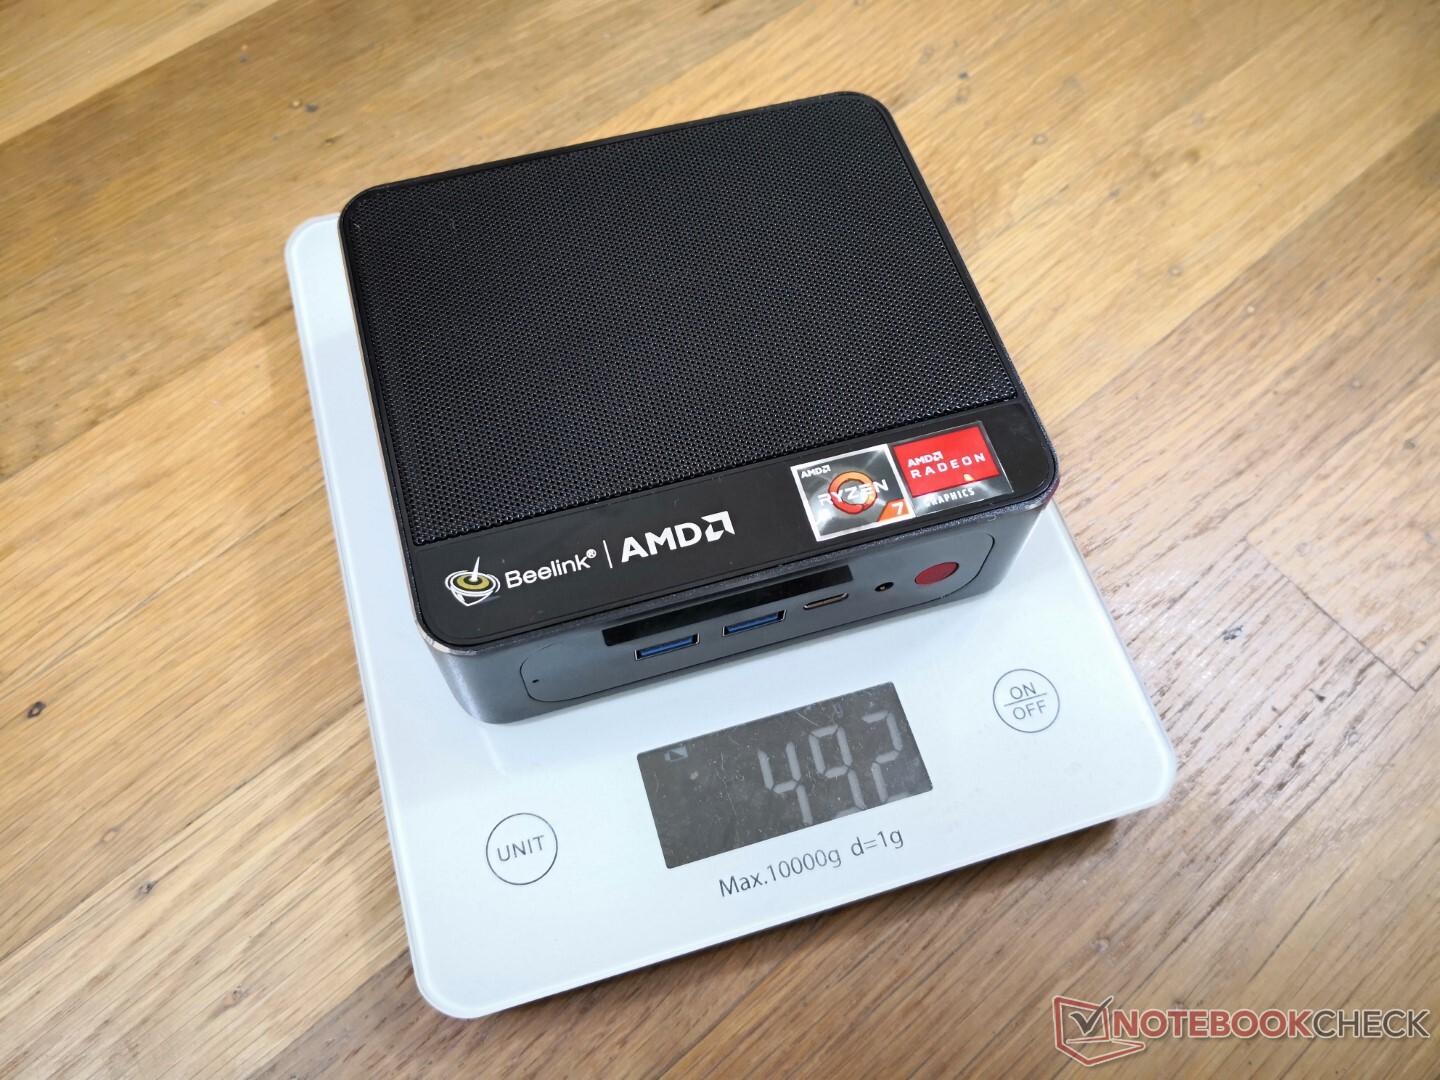
v (old) | 11/2021 | Beelink SER3 R7 3750H, Vega 10 | 492 gr | 40 mm | x | ||
v (old) | 12/2020 | Beelink SEi10 i3-1005G1, UHD Graphics G1 (Ice Lake 32 EU) | 350 gr | 41 mm | x | ||
v (old) | 11/2018 | Intel NUC8i7BE i7-8559U, Iris Plus Graphics 655 | 683 gr | 51 mm | x | ||
v (old) | 03/2021 | GMK NucBox 2 i5-8259U, Iris Plus Graphics 655 | 430 gr | 50 mm | x | ||
v (old) | 07/2020 | Zotac ZBox MI643 i5-10210U, UHD Graphics 620 | 550 gr | 28.5 mm | x | ||
v (old) | 04/2021 | Intel NUC11TNKi5 i5-1135G7, Iris Xe G7 80EUs | 504 gr | 37 mm | x |
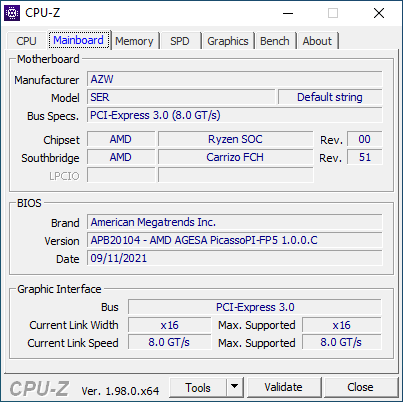
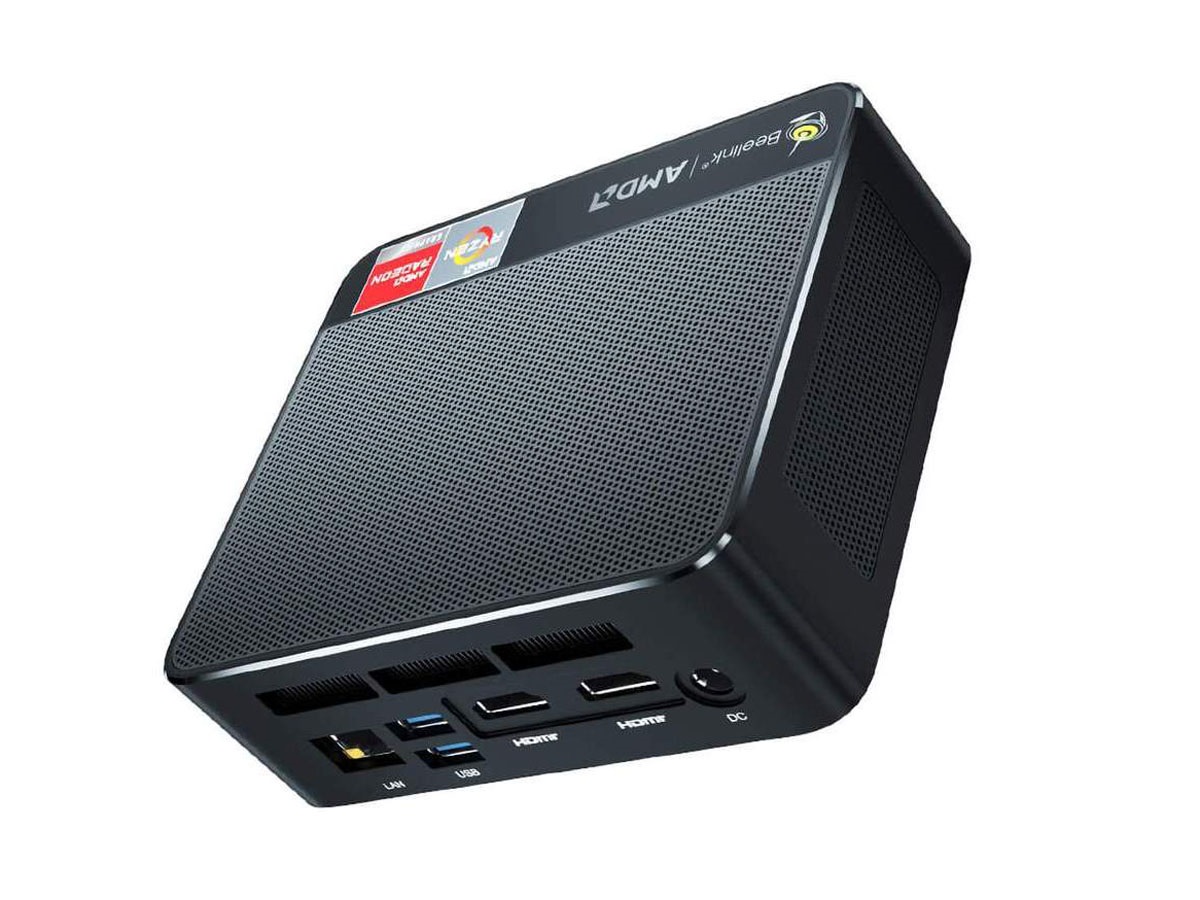
Caso
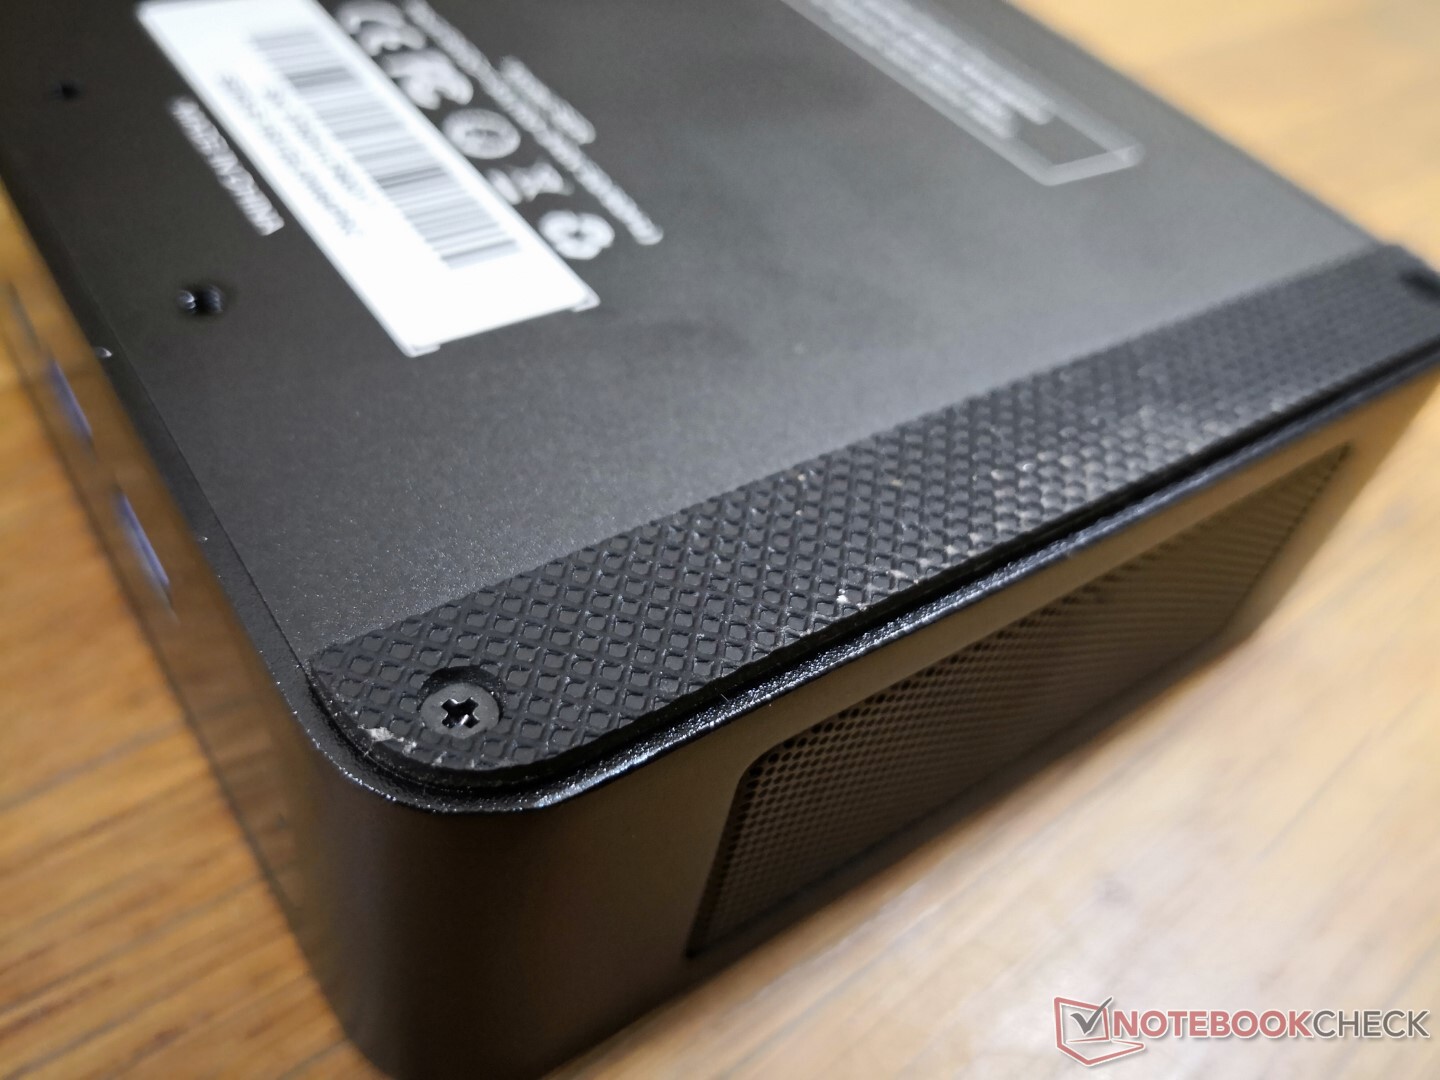
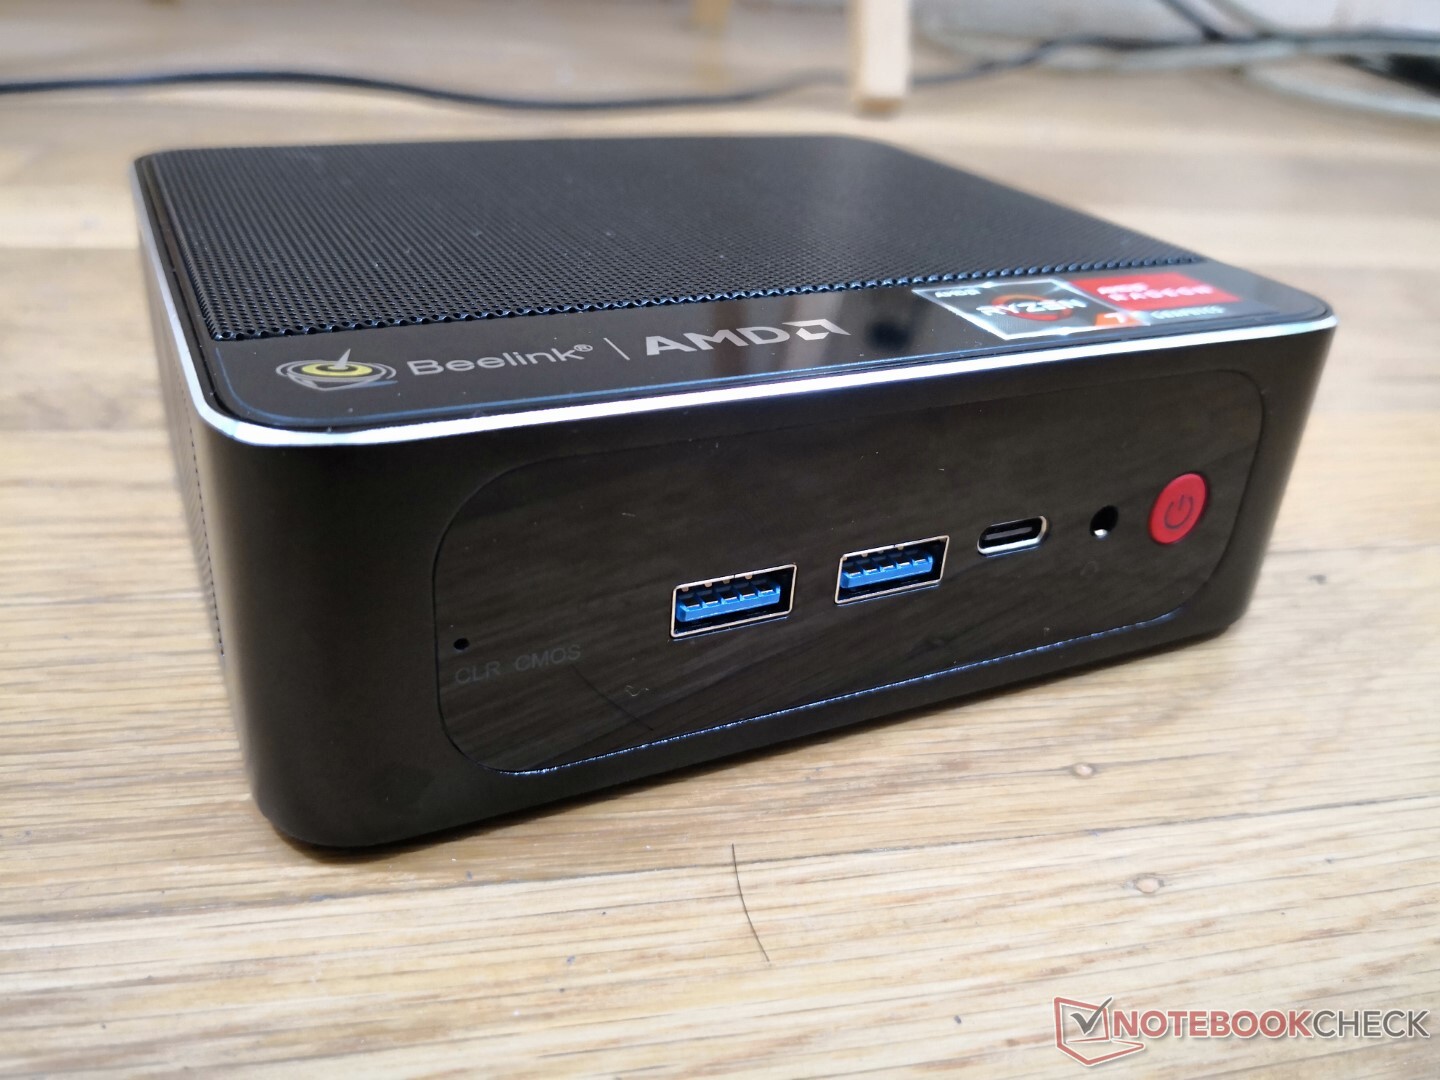
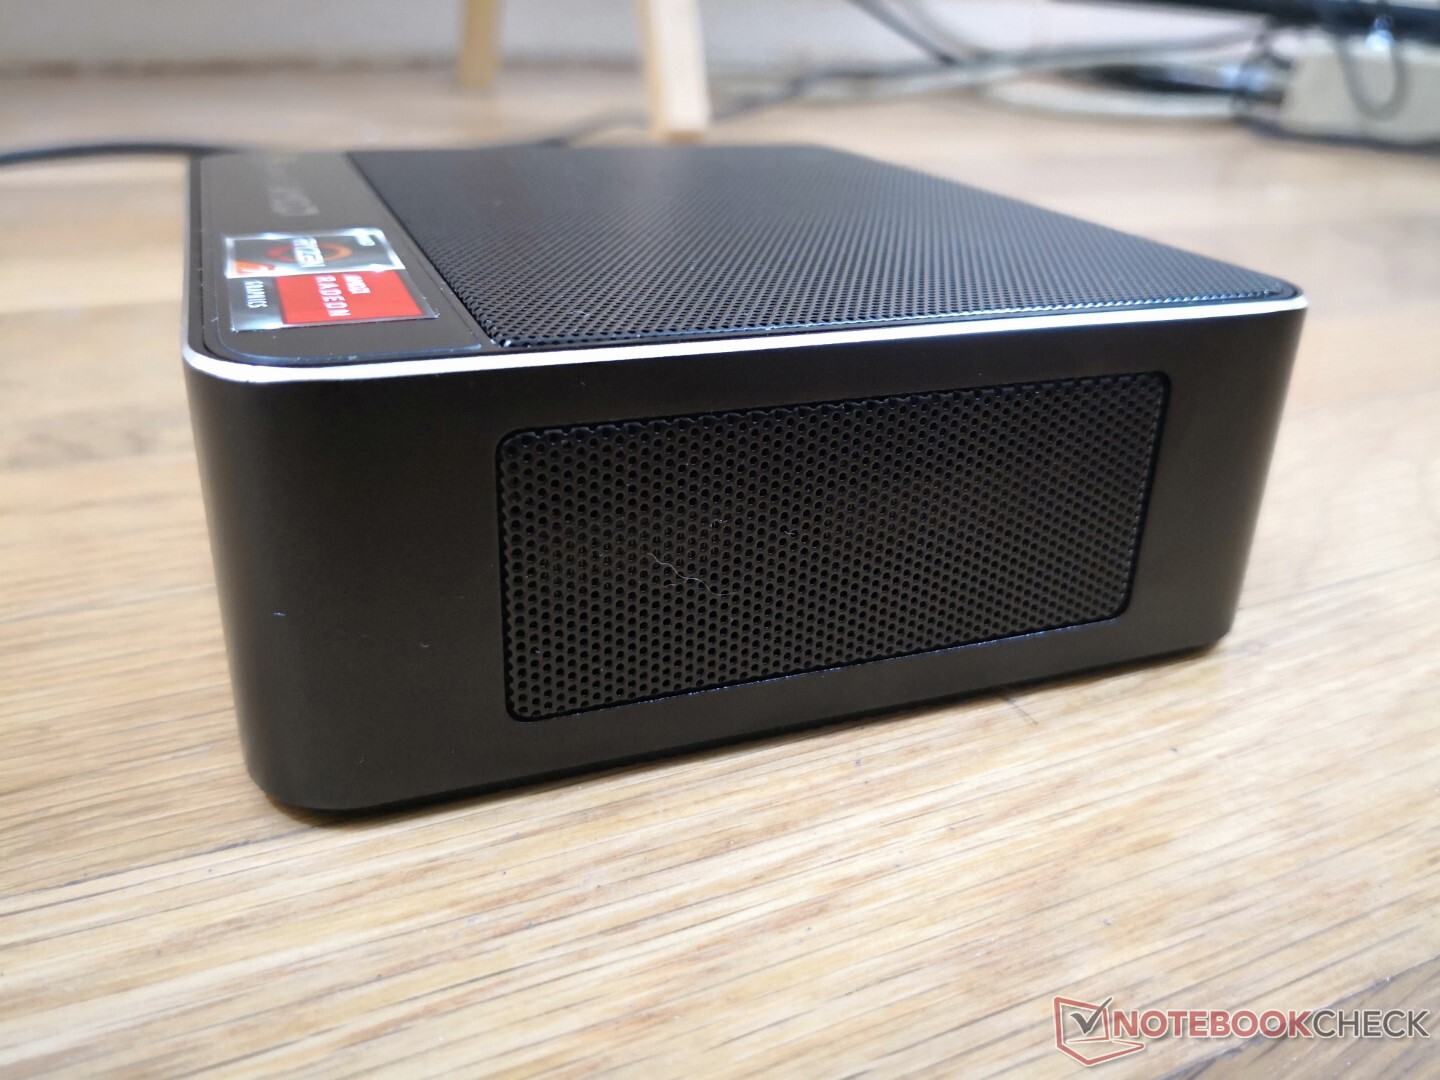
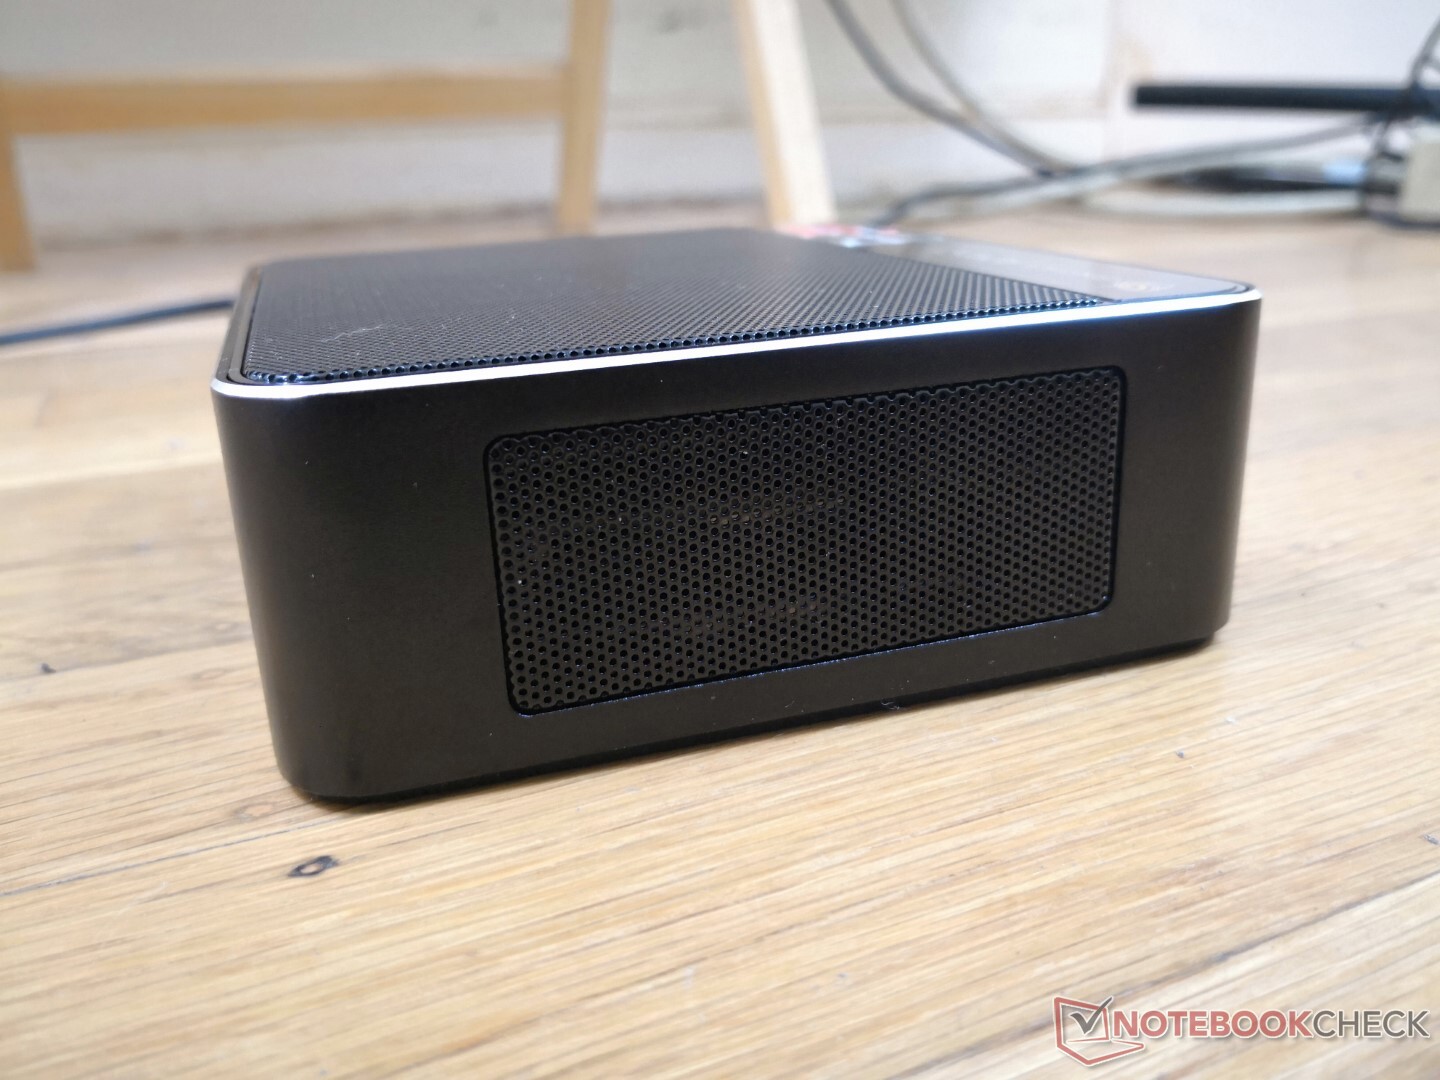
Lo chassis è per lo più in metallo opaco con un po' di plastica lucida sulla parte anteriore e parte della parte superiore. Le prime impressioni sono forti anche se non così rigide come un Intel NUC che utilizza materiali metallici più spessi e pesanti.
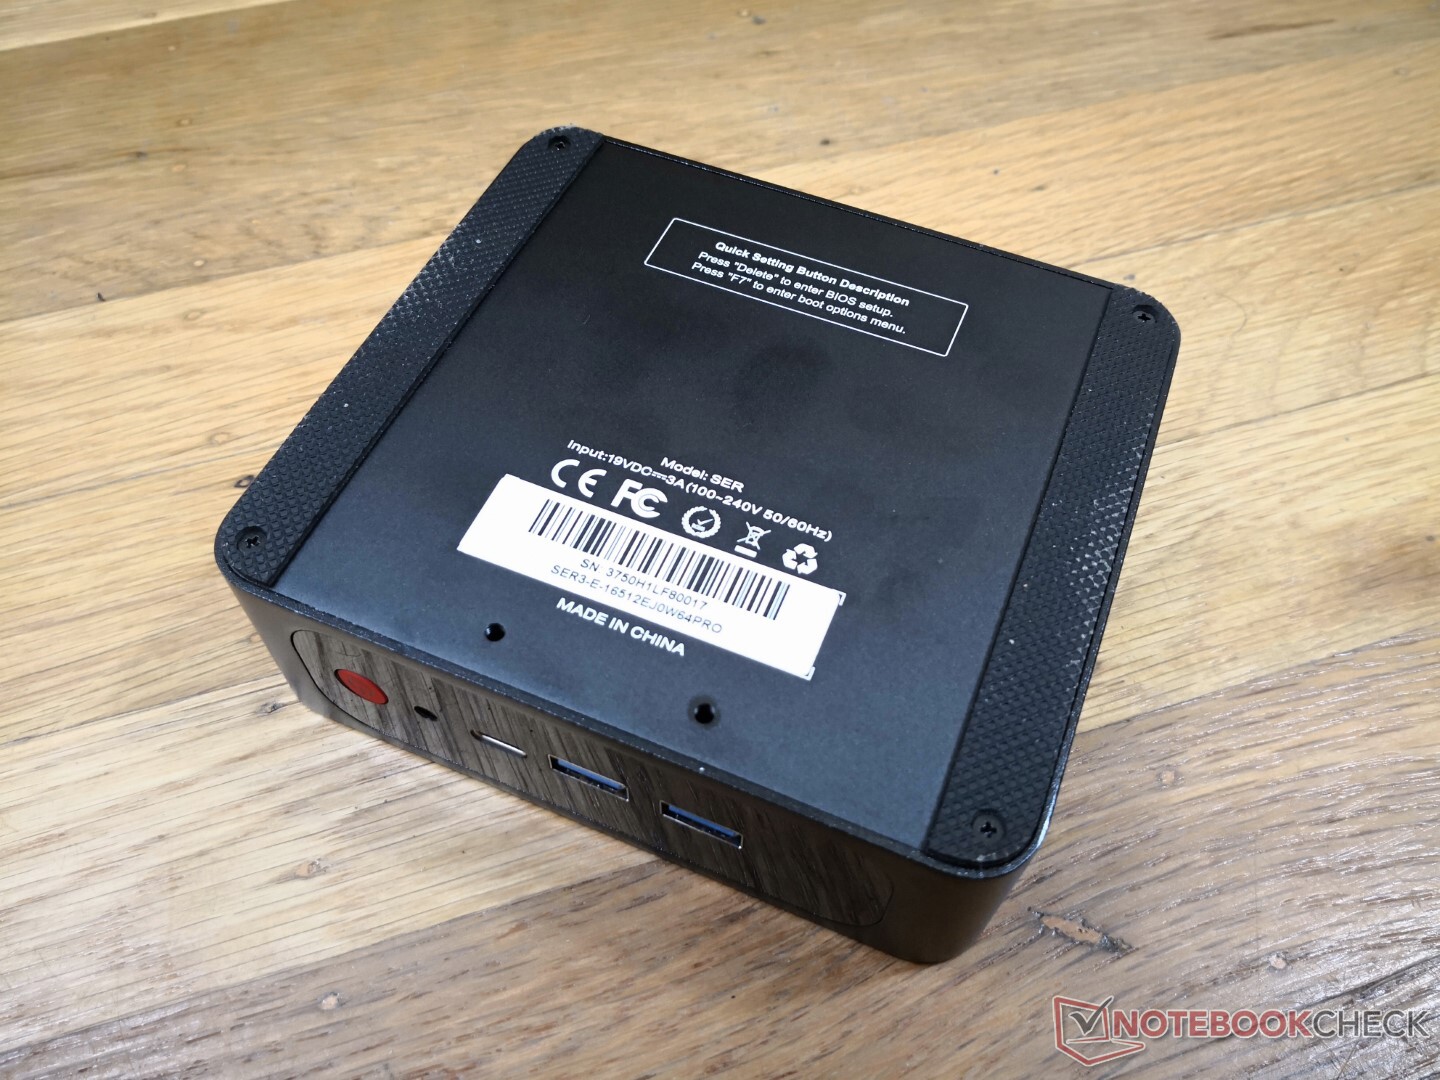
Connettività
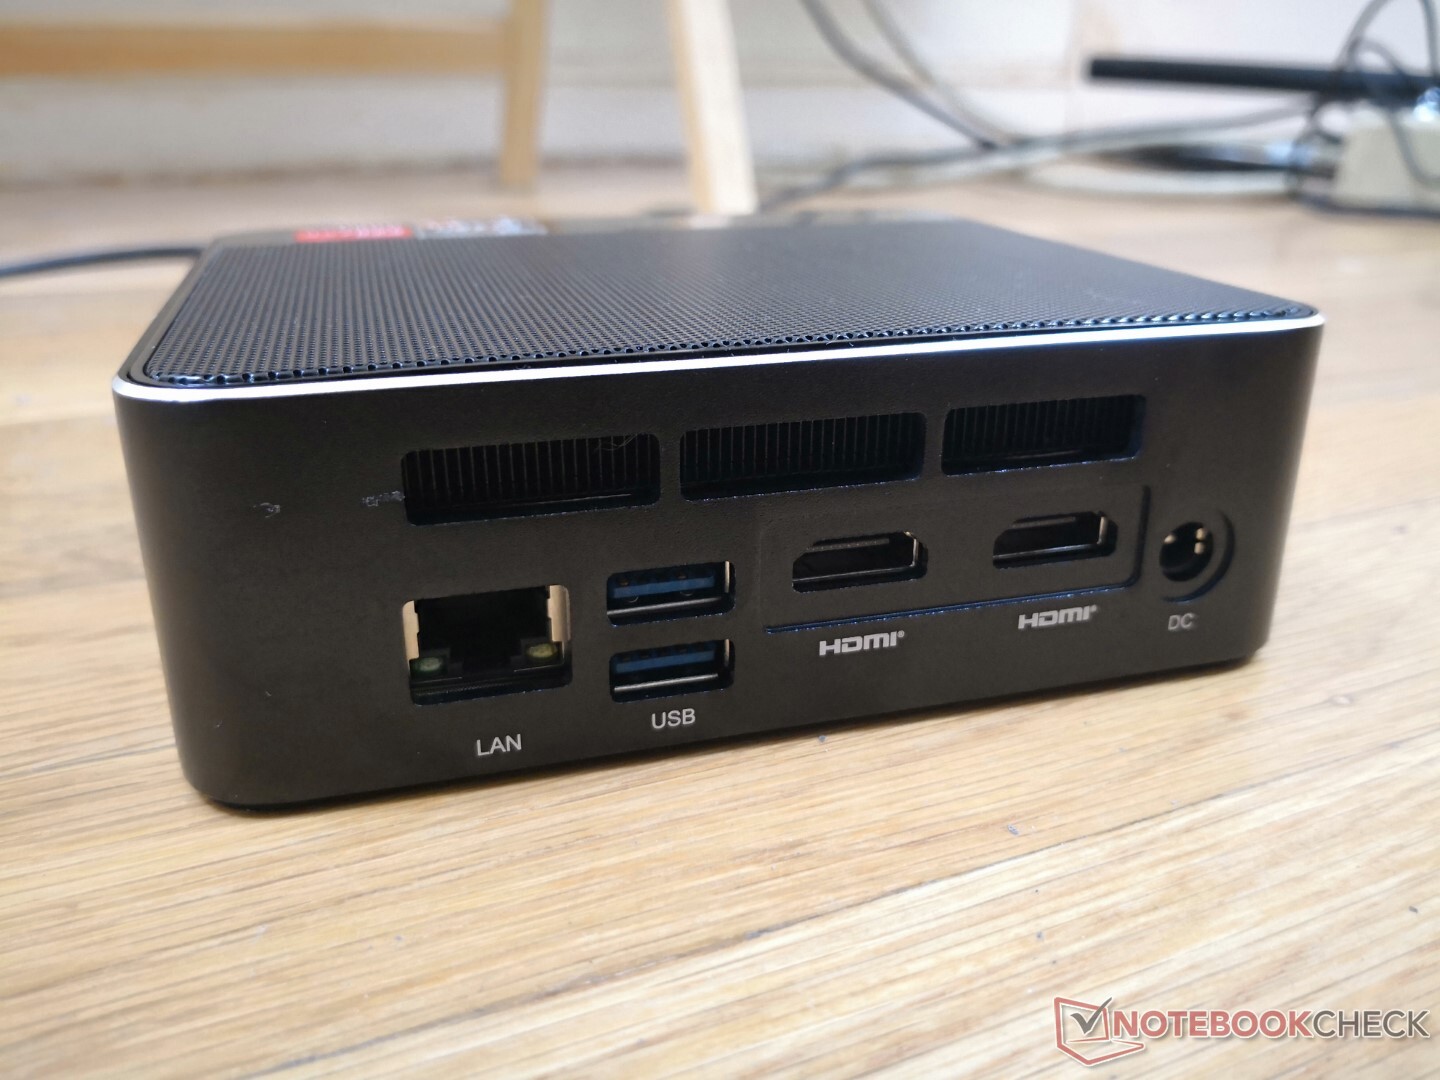
Le opzioni delle porte sono esattamente le stesse del Beelink SEi10. Tuttavia, tenete a mente che non c'è Thunderbolt sul SER3 poiché la sua CPU AMD non supporta nativamente l'interfaccia
La porta USB-C supporta DisplayPort-out, ma stranamente funzionerebbe solo con alcuni e non tutti i nostri monitor esterni.
Comunicazione
| Networking | |
| iperf3 transmit AX12 | |
| Intel NUC11TNKi5 | |
| Beelink SEi10 | |
| Intel NUC8i7BE | |
| GMK NucBox 2 | |
| Beelink SER3 | |
| Zotac ZBox MI643 | |
| iperf3 receive AX12 | |
| Intel NUC11TNKi5 | |
| Beelink SEi10 | |
| Beelink SER3 | |
| GMK NucBox 2 | |
| Intel NUC8i7BE | |
| Zotac ZBox MI643 | |
Manutenzione
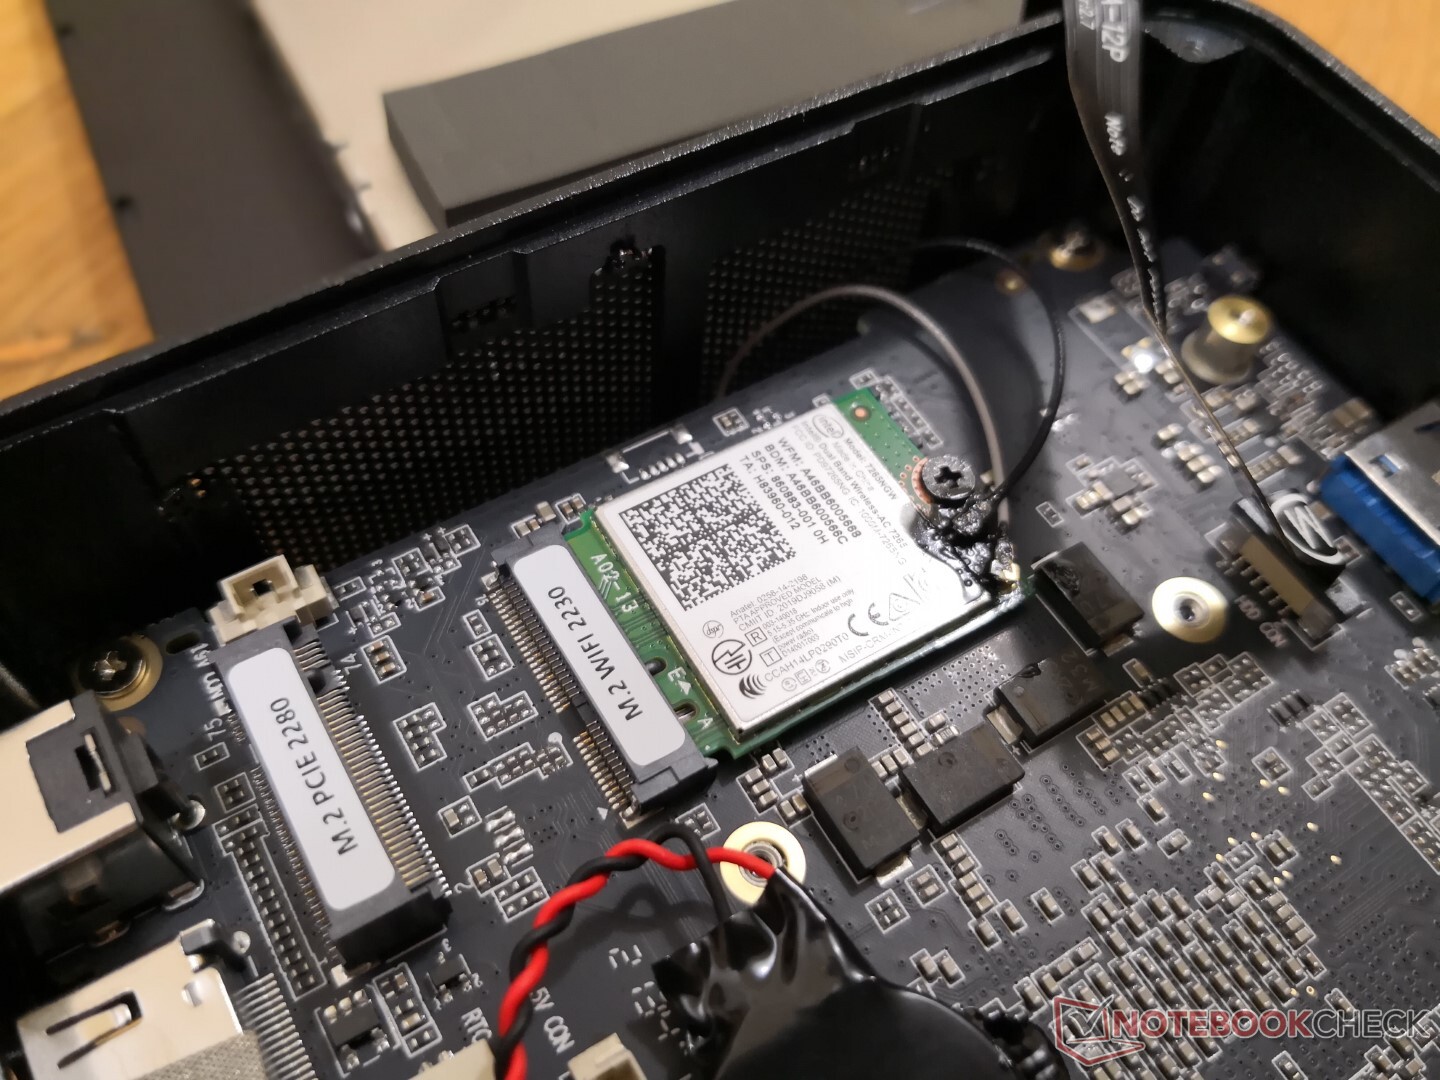
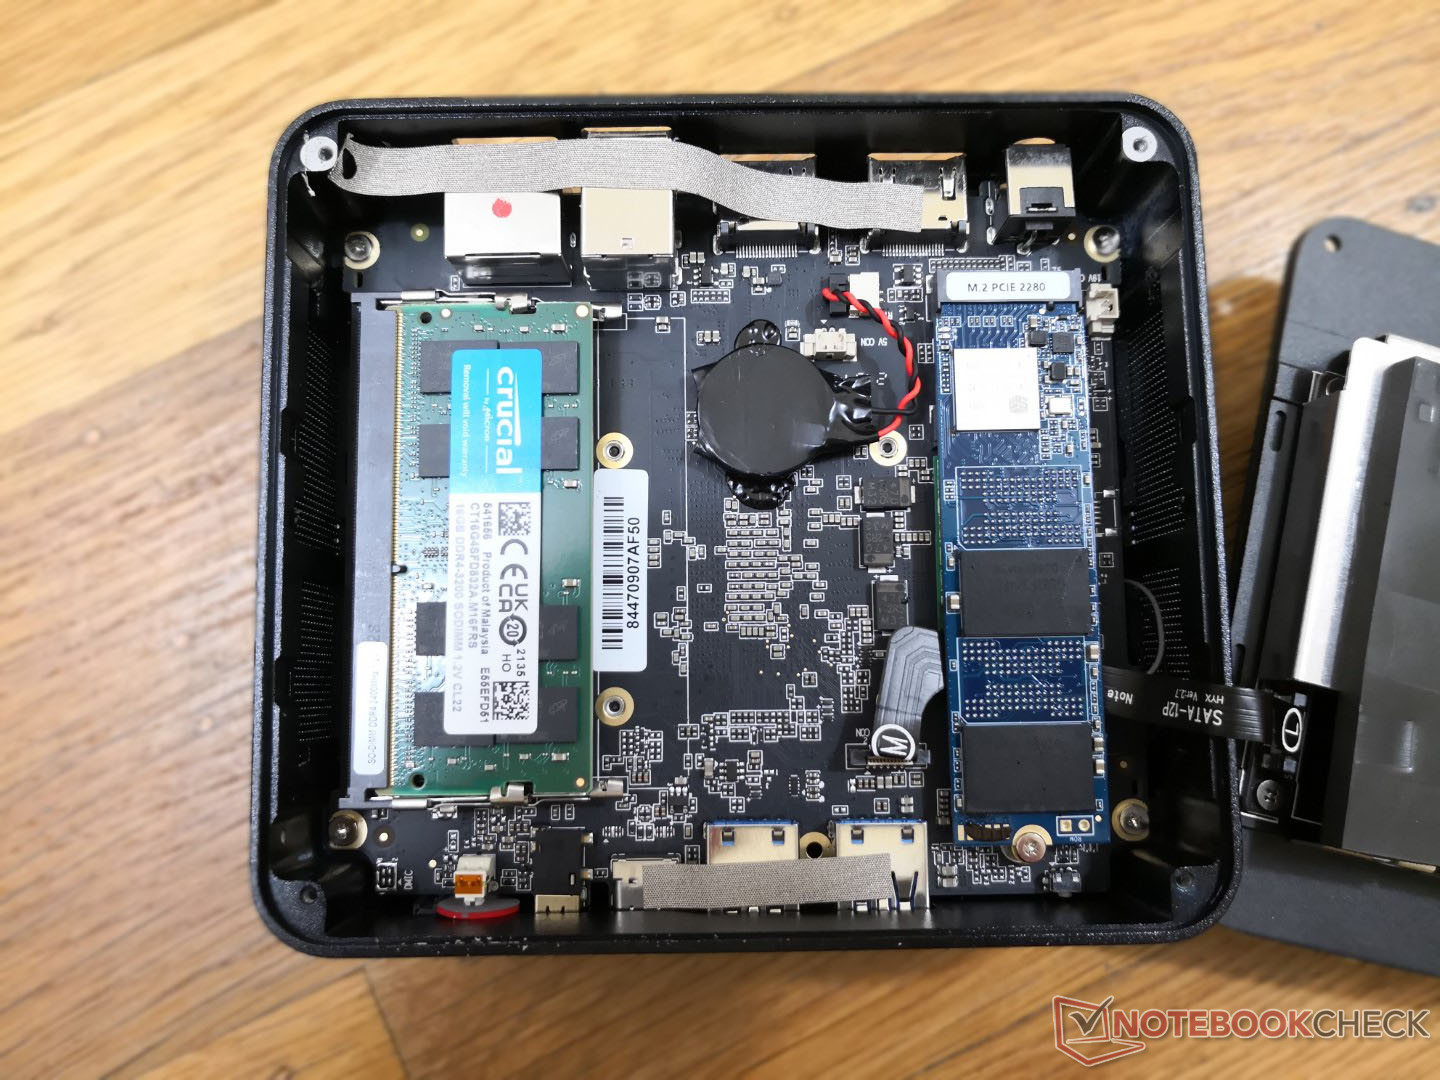
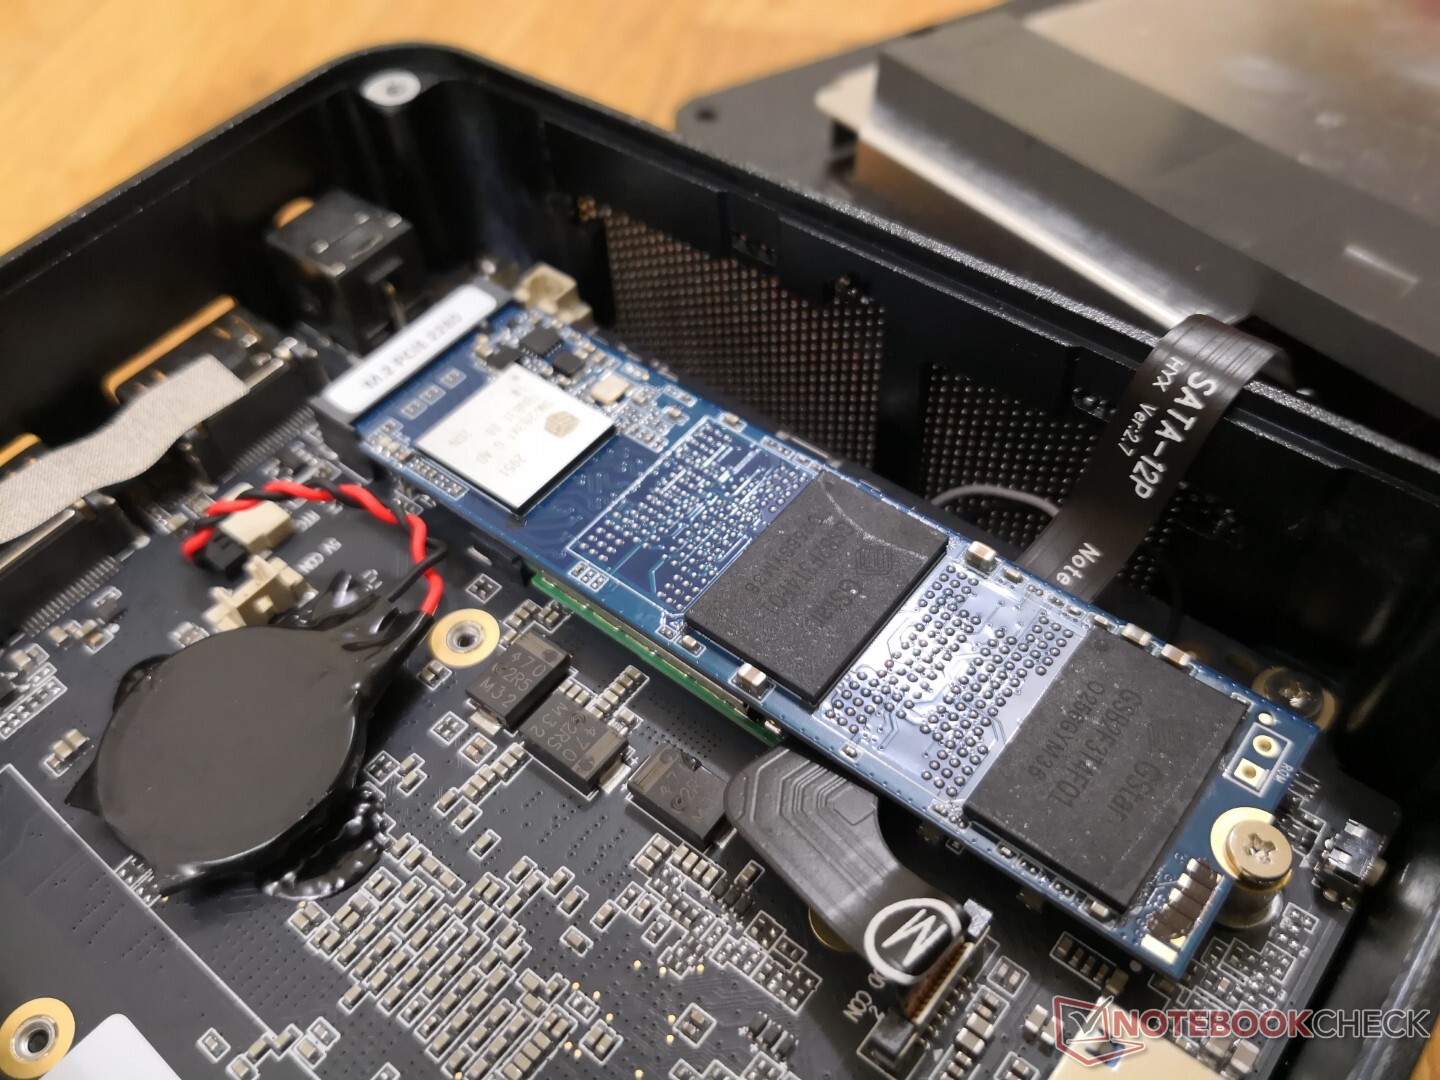
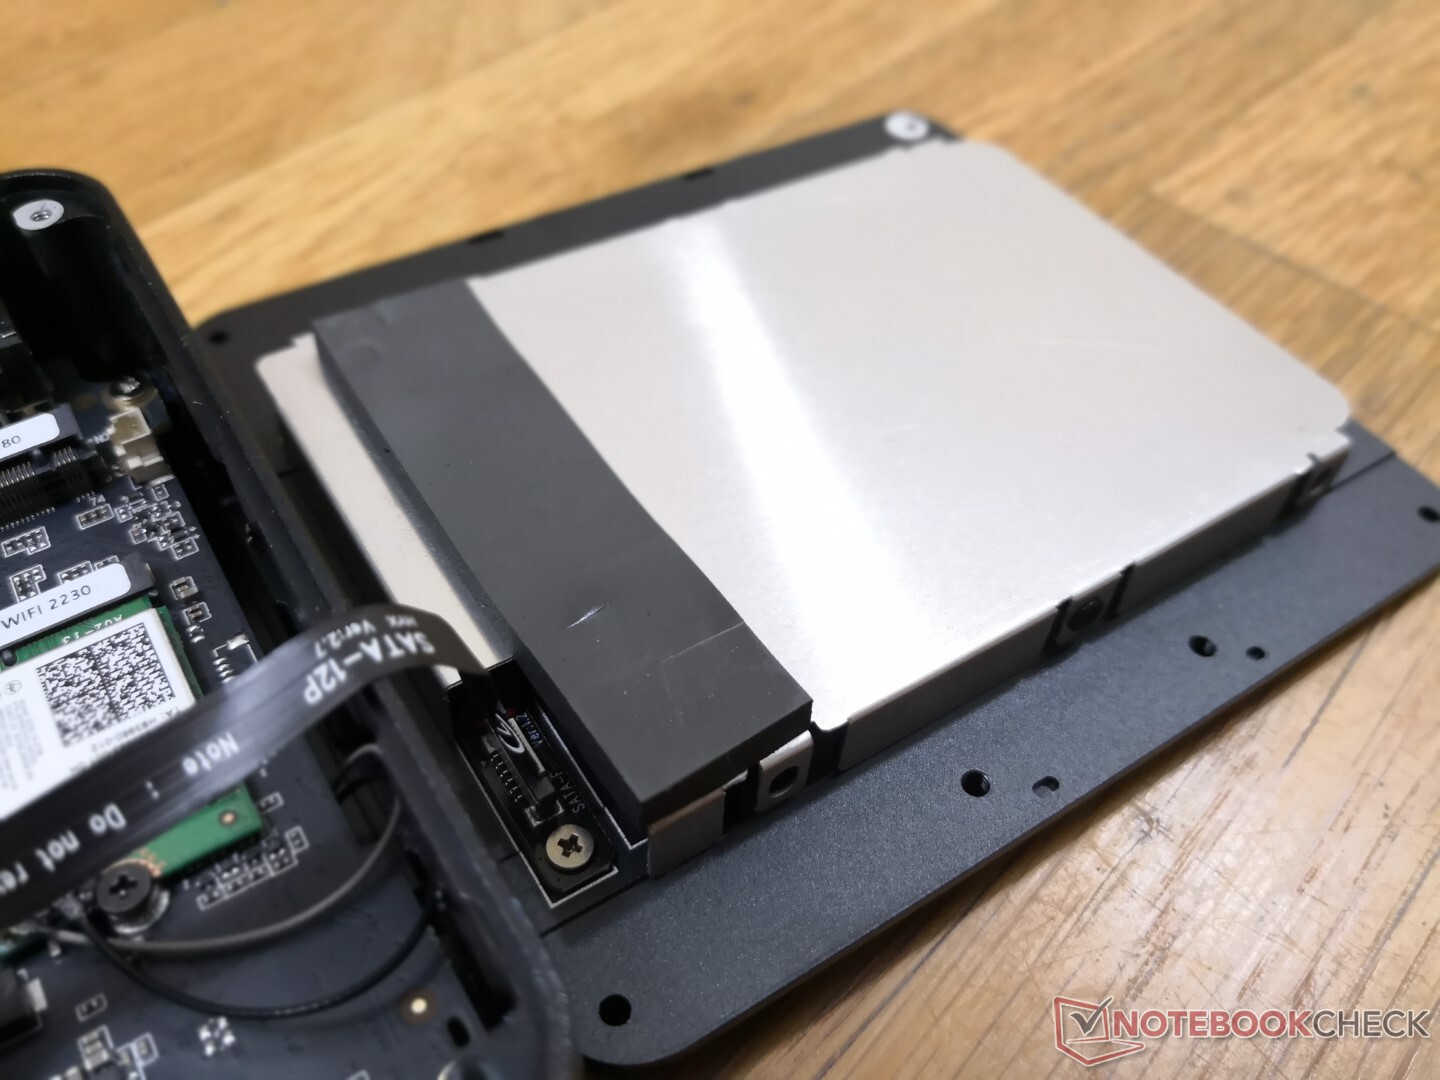
Il pannello inferiore può essere facilmente rimosso con un semplice cacciavite Philips per rivelare un modulo WLAN rimovibile, un SSD M.2 2280 NVMe rimovibile e 2 slot SODIMM.
Accessori e garanzia
La confezione al dettaglio include due cavi HDMI corti, una staffa di montaggio da 50 mm o 100 mm, e viti extra oltre al solito manuale e all'adattatore AC. Si applica una garanzia del produttore di un anno
Performance
Condizioni di test
La nostra unità è stata impostata in modalità Performance prima di eseguire qualsiasi benchmark qui sotto per ottenere i punteggi più alti possibili.
Processore
Le prestazioni grezze della CPU sono paragonabili alCore i5-8259U nel concorrente GMK NucBox 2. Non raggiunge le prestazioni delle più recenti CPU Zen 2 o Tiger Lake serie U come il Ryzen 7 5700U o Core i5-1135G7 che si trovano comunemente sugli ultimi Ultrabook. Le prestazioni sotto carichi elevati per lunghi periodi sono comunque consistenti, senza grossi problemi di throttling.
Cinebench R15 Multi Loop
Cinebench R23: Multi Core | Single Core
Cinebench R20: CPU (Multi Core) | CPU (Single Core)
Cinebench R15: CPU Multi 64Bit | CPU Single 64Bit
Blender: v2.79 BMW27 CPU
7-Zip 18.03: 7z b 4 | 7z b 4 -mmt1
Geekbench 5.5: Multi-Core | Single-Core
HWBOT x265 Benchmark v2.2: 4k Preset
LibreOffice : 20 Documents To PDF
R Benchmark 2.5: Overall mean
| CPU Performance rating | |
| Intel NUC11TNKi5 | |
| Intel NUC8i7BE -3! | |
| GMK NucBox 2 | |
| Media AMD Ryzen 7 3750H | |
| Zotac ZBox MI643 -2! | |
| Beelink SER3 -2! | |
| Beelink SEi10 -2! | |
| Cinebench R23 / Multi Core | |
| Intel NUC11TNKi5 | |
| Beelink SER3 | |
| Media AMD Ryzen 7 3750H (n=1) | |
| GMK NucBox 2 | |
| Cinebench R23 / Single Core | |
| Intel NUC11TNKi5 | |
| GMK NucBox 2 | |
| Beelink SER3 | |
| Media AMD Ryzen 7 3750H (n=1) | |
| Cinebench R20 / CPU (Multi Core) | |
| Intel NUC11TNKi5 | |
| Intel NUC8i7BE | |
| Media AMD Ryzen 7 3750H (1514 - 1825, n=4) | |
| Beelink SER3 | |
| GMK NucBox 2 | |
| Zotac ZBox MI643 | |
| Beelink SEi10 | |
| Cinebench R20 / CPU (Single Core) | |
| Intel NUC11TNKi5 | |
| Intel NUC8i7BE | |
| Zotac ZBox MI643 | |
| Beelink SEi10 | |
| GMK NucBox 2 | |
| Beelink SER3 | |
| Media AMD Ryzen 7 3750H (340 - 386, n=4) | |
| Cinebench R15 / CPU Multi 64Bit | |
| Intel NUC8i7BE | |
| Intel NUC11TNKi5 | |
| Media AMD Ryzen 7 3750H (672 - 805, n=7) | |
| Beelink SER3 | |
| GMK NucBox 2 | |
| Zotac ZBox MI643 | |
| Beelink SEi10 | |
| Cinebench R15 / CPU Single 64Bit | |
| Intel NUC11TNKi5 | |
| Intel NUC8i7BE | |
| Zotac ZBox MI643 | |
| Beelink SEi10 | |
| GMK NucBox 2 | |
| Beelink SER3 | |
| Media AMD Ryzen 7 3750H (135 - 157, n=7) | |
| Blender / v2.79 BMW27 CPU | |
| Beelink SEi10 | |
| Zotac ZBox MI643 | |
| GMK NucBox 2 | |
| Intel NUC8i7BE | |
| Intel NUC8i7BE | |
| Beelink SER3 | |
| Media AMD Ryzen 7 3750H (584 - 672, n=3) | |
| Intel NUC11TNKi5 | |
| 7-Zip 18.03 / 7z b 4 | |
| Intel NUC8i7BE | |
| Intel NUC8i7BE | |
| Intel NUC11TNKi5 | |
| GMK NucBox 2 | |
| Media AMD Ryzen 7 3750H (17077 - 19187, n=3) | |
| Beelink SER3 | |
| Zotac ZBox MI643 | |
| Beelink SEi10 | |
| 7-Zip 18.03 / 7z b 4 -mmt1 | |
| Intel NUC8i7BE | |
| Intel NUC8i7BE | |
| Intel NUC11TNKi5 | |
| Zotac ZBox MI643 | |
| Beelink SEi10 | |
| GMK NucBox 2 | |
| Beelink SER3 | |
| Media AMD Ryzen 7 3750H (3511 - 3752, n=3) | |
| Geekbench 5.5 / Multi-Core | |
| Intel NUC11TNKi5 | |
| Zotac ZBox MI643 | |
| Intel NUC8i7BE | |
| Media AMD Ryzen 7 3750H (n=1) | |
| GMK NucBox 2 | |
| Beelink SEi10 | |
| Geekbench 5.5 / Single-Core | |
| Intel NUC11TNKi5 | |
| Zotac ZBox MI643 | |
| Beelink SEi10 | |
| GMK NucBox 2 | |
| Media AMD Ryzen 7 3750H (n=1) | |
| Intel NUC8i7BE | |
| HWBOT x265 Benchmark v2.2 / 4k Preset | |
| Intel NUC11TNKi5 | |
| Intel NUC8i7BE | |
| Intel NUC8i7BE | |
| GMK NucBox 2 | |
| Media AMD Ryzen 7 3750H (4.14 - 4.4, n=3) | |
| Zotac ZBox MI643 | |
| Beelink SER3 | |
| Beelink SEi10 | |
| LibreOffice / 20 Documents To PDF | |
| Beelink SER3 | |
| Media AMD Ryzen 7 3750H (n=1) | |
| GMK NucBox 2 | |
| Zotac ZBox MI643 | |
| Beelink SEi10 | |
| Intel NUC11TNKi5 | |
| R Benchmark 2.5 / Overall mean | |
| GMK NucBox 2 | |
| Beelink SEi10 | |
| Beelink SER3 | |
| Media AMD Ryzen 7 3750H (0.69 - 0.723, n=2) | |
| Zotac ZBox MI643 | |
| Intel NUC8i7BE | |
| Intel NUC11TNKi5 | |
* ... Meglio usare valori piccoli
AIDA64: FP32 Ray-Trace | FPU Julia | CPU SHA3 | CPU Queen | FPU SinJulia | FPU Mandel | CPU AES | CPU ZLib | FP64 Ray-Trace | CPU PhotoWorxx
| Performance rating | |
| Intel NUC11TNKi5 | |
| Intel NUC8i7BE -1! | |
| GMK NucBox 2 | |
| Media AMD Ryzen 7 3750H | |
| Zotac ZBox MI643 | |
| Beelink SER3 | |
| AIDA64 / FP32 Ray-Trace | |
| Intel NUC11TNKi5 | |
| Intel NUC8i7BE | |
| GMK NucBox 2 | |
| Zotac ZBox MI643 | |
| Media AMD Ryzen 7 3750H (3338 - 3668, n=2) | |
| Beelink SER3 | |
| AIDA64 / FPU Julia | |
| Intel NUC11TNKi5 | |
| Intel NUC8i7BE | |
| GMK NucBox 2 | |
| Zotac ZBox MI643 | |
| Media AMD Ryzen 7 3750H (16912 - 19132, n=2) | |
| Beelink SER3 | |
| AIDA64 / CPU SHA3 | |
| Intel NUC11TNKi5 | |
| GMK NucBox 2 | |
| Media AMD Ryzen 7 3750H (897 - 1001, n=2) | |
| Zotac ZBox MI643 | |
| Beelink SER3 | |
| AIDA64 / CPU Queen | |
| Intel NUC8i7BE | |
| Zotac ZBox MI643 | |
| Media AMD Ryzen 7 3750H (43632 - 50328, n=2) | |
| Intel NUC11TNKi5 | |
| Beelink SER3 | |
| GMK NucBox 2 | |
| AIDA64 / FPU SinJulia | |
| Media AMD Ryzen 7 3750H (5639 - 6478, n=2) | |
| Beelink SER3 | |
| Intel NUC8i7BE | |
| Intel NUC11TNKi5 | |
| GMK NucBox 2 | |
| Zotac ZBox MI643 | |
| AIDA64 / FPU Mandel | |
| Intel NUC11TNKi5 | |
| Intel NUC8i7BE | |
| GMK NucBox 2 | |
| Zotac ZBox MI643 | |
| Media AMD Ryzen 7 3750H (8846 - 9928, n=2) | |
| Beelink SER3 | |
| AIDA64 / CPU AES | |
| Intel NUC11TNKi5 | |
| Media AMD Ryzen 7 3750H (28977 - 32668, n=2) | |
| Beelink SER3 | |
| Intel NUC8i7BE | |
| GMK NucBox 2 | |
| Zotac ZBox MI643 | |
| AIDA64 / CPU ZLib | |
| Intel NUC11TNKi5 | |
| Intel NUC8i7BE | |
| Media AMD Ryzen 7 3750H (313 - 350, n=2) | |
| Beelink SER3 | |
| GMK NucBox 2 | |
| Zotac ZBox MI643 | |
| AIDA64 / FP64 Ray-Trace | |
| Intel NUC11TNKi5 | |
| Intel NUC8i7BE | |
| GMK NucBox 2 | |
| Zotac ZBox MI643 | |
| Media AMD Ryzen 7 3750H (1758 - 1935, n=2) | |
| Beelink SER3 | |
| AIDA64 / CPU PhotoWorxx | |
| Zotac ZBox MI643 | |
| Intel NUC8i7BE | |
| Intel NUC11TNKi5 | |
| Media AMD Ryzen 7 3750H (10338 - 18898, n=2) | |
| Beelink SER3 | |
| GMK NucBox 2 | |
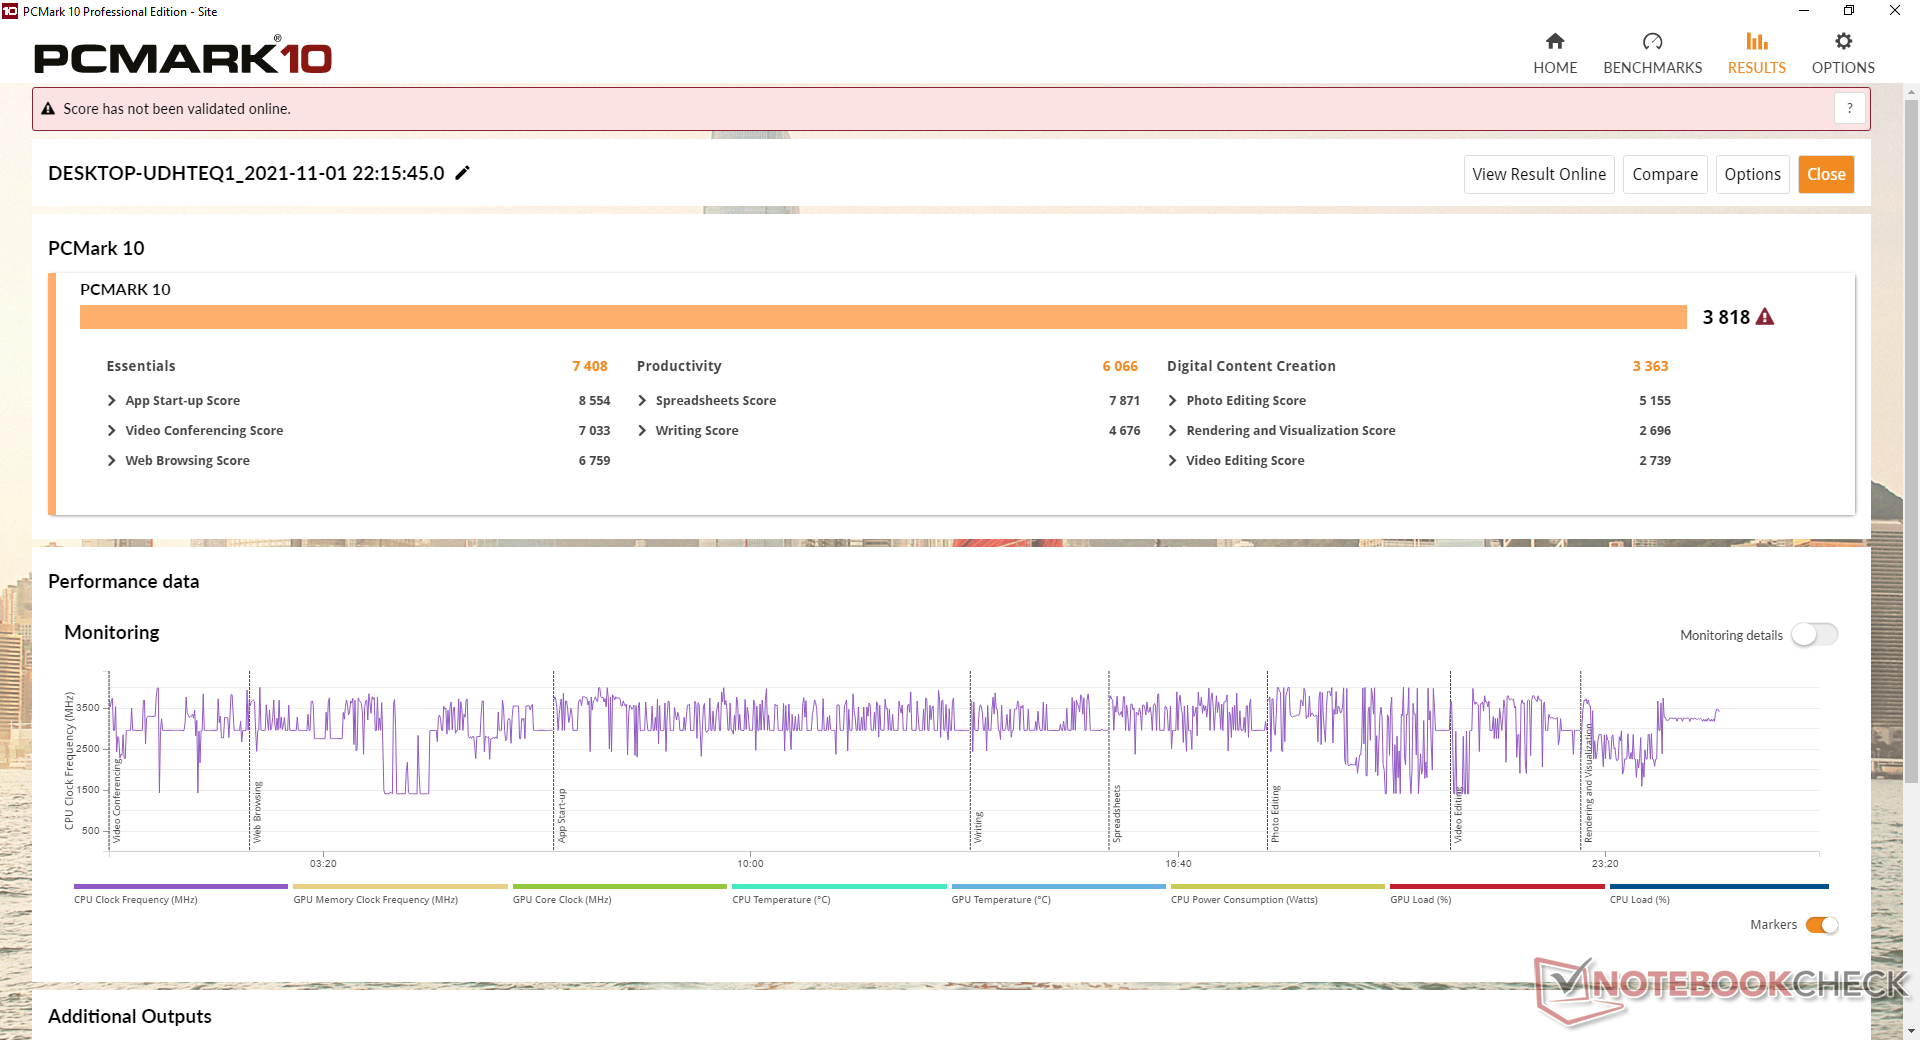
Prestazioni del sistema
| PCMark 10 / Score | |
| Intel NUC8i7BE | |
| Intel NUC11TNKi5 | |
| Zotac ZBox MI643 | |
| GMK NucBox 2 | |
| Beelink SER3 | |
| Media AMD Ryzen 7 3750H, AMD Radeon RX Vega 10 (n=1) | |
| Beelink SEi10 | |
| PCMark 10 / Essentials | |
| Zotac ZBox MI643 | |
| Intel NUC11TNKi5 | |
| Intel NUC8i7BE | |
| GMK NucBox 2 | |
| Beelink SEi10 | |
| Beelink SER3 | |
| Media AMD Ryzen 7 3750H, AMD Radeon RX Vega 10 (n=1) | |
| PCMark 10 / Productivity | |
| Intel NUC8i7BE | |
| Zotac ZBox MI643 | |
| GMK NucBox 2 | |
| Intel NUC11TNKi5 | |
| Beelink SER3 | |
| Media AMD Ryzen 7 3750H, AMD Radeon RX Vega 10 (n=1) | |
| Beelink SEi10 | |
| PCMark 10 / Digital Content Creation | |
| Intel NUC11TNKi5 | |
| Intel NUC8i7BE | |
| GMK NucBox 2 | |
| Beelink SER3 | |
| Media AMD Ryzen 7 3750H, AMD Radeon RX Vega 10 (n=1) | |
| Zotac ZBox MI643 | |
| Beelink SEi10 | |
| PCMark 10 Score | 3818 punti | |
Aiuto | ||
| AIDA64 / Memory Copy | |
| Intel NUC8i7BE | |
| GMK NucBox 2 | |
| Zotac ZBox MI643 | |
| Media AMD Ryzen 7 3750H (16249 - 30963, n=2) | |
| Intel NUC11TNKi5 | |
| Beelink SER3 | |
| AIDA64 / Memory Read | |
| Intel NUC8i7BE | |
| GMK NucBox 2 | |
| Zotac ZBox MI643 | |
| Media AMD Ryzen 7 3750H (18268 - 35218, n=2) | |
| Intel NUC11TNKi5 | |
| Beelink SER3 | |
| AIDA64 / Memory Write | |
| Intel NUC8i7BE | |
| GMK NucBox 2 | |
| Zotac ZBox MI643 | |
| Media AMD Ryzen 7 3750H (18455 - 35988, n=2) | |
| Intel NUC11TNKi5 | |
| Beelink SER3 | |
| AIDA64 / Memory Latency | |
| Media AMD Ryzen 7 3750H (95.8 - 118, n=2) | |
| Beelink SER3 | |
| Intel NUC11TNKi5 | |
| Zotac ZBox MI643 | |
| GMK NucBox 2 | |
| Intel NUC8i7BE | |
* ... Meglio usare valori piccoli
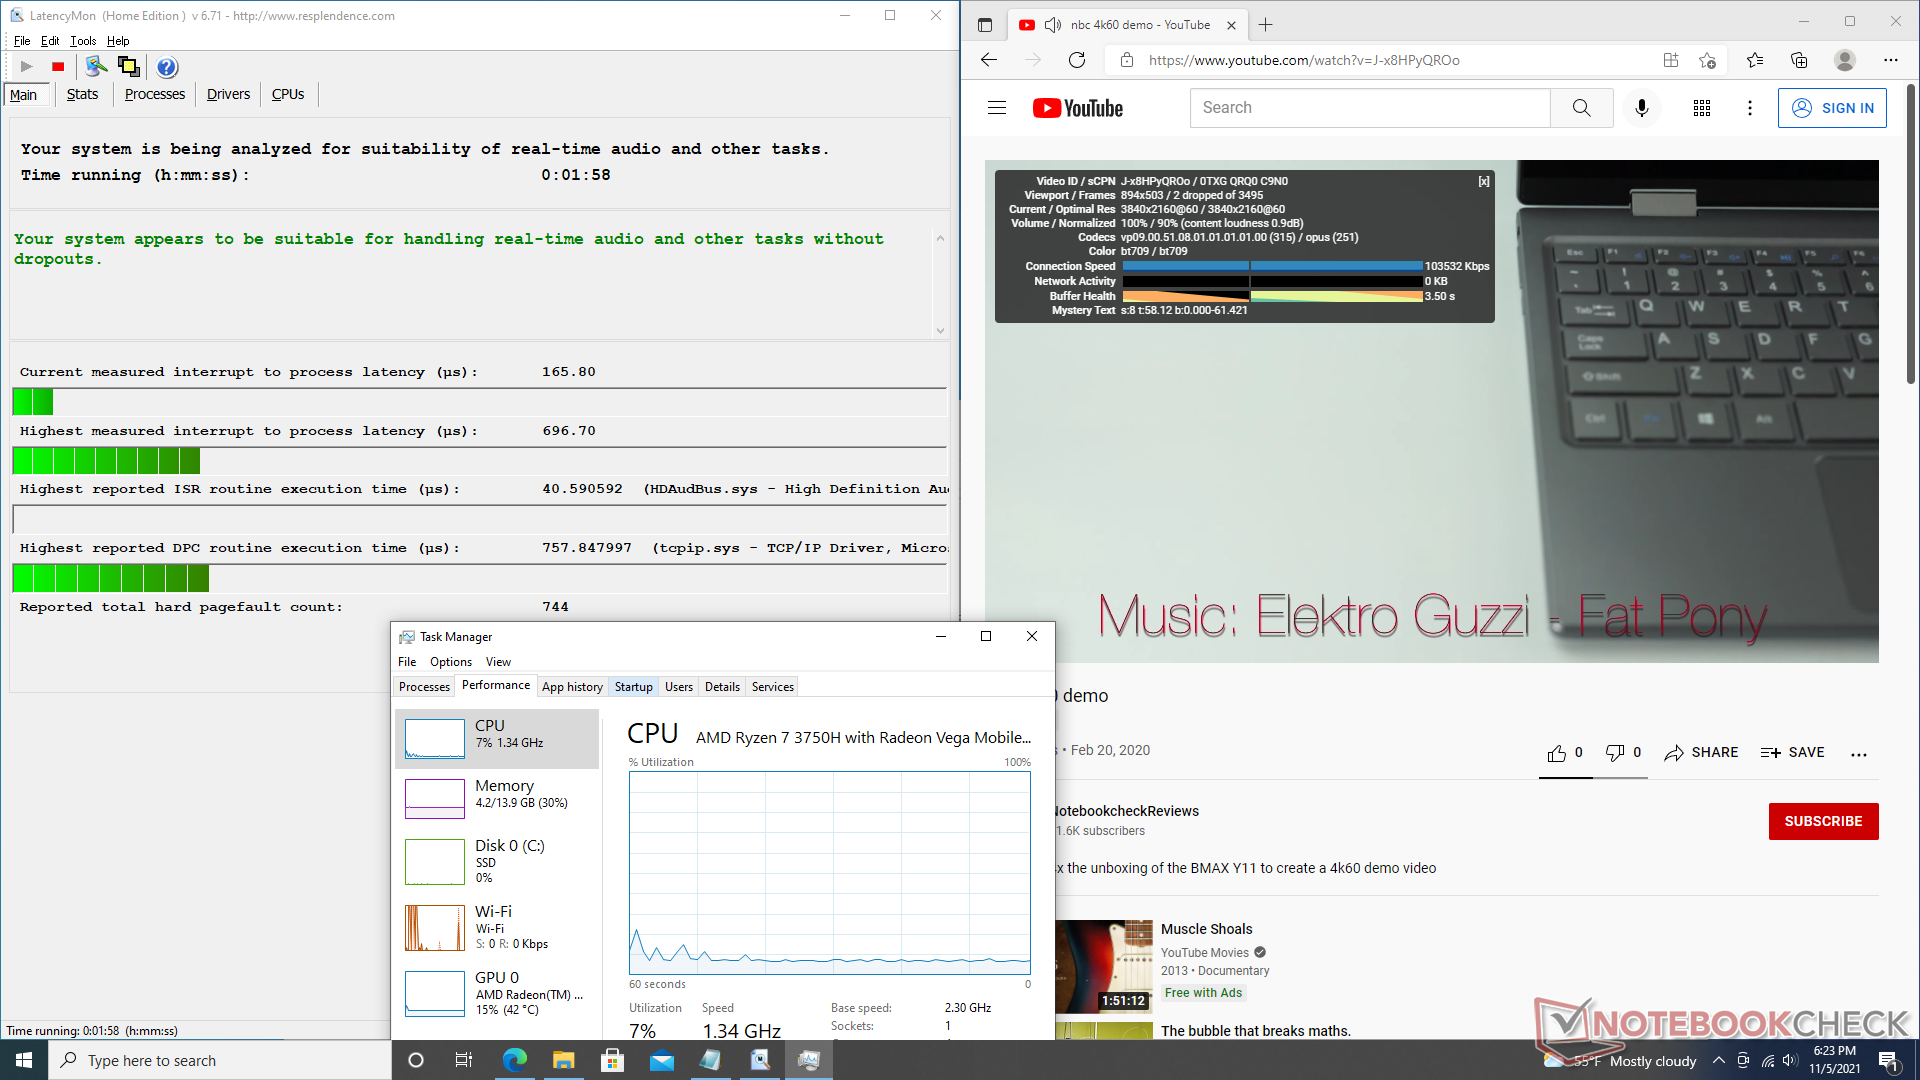
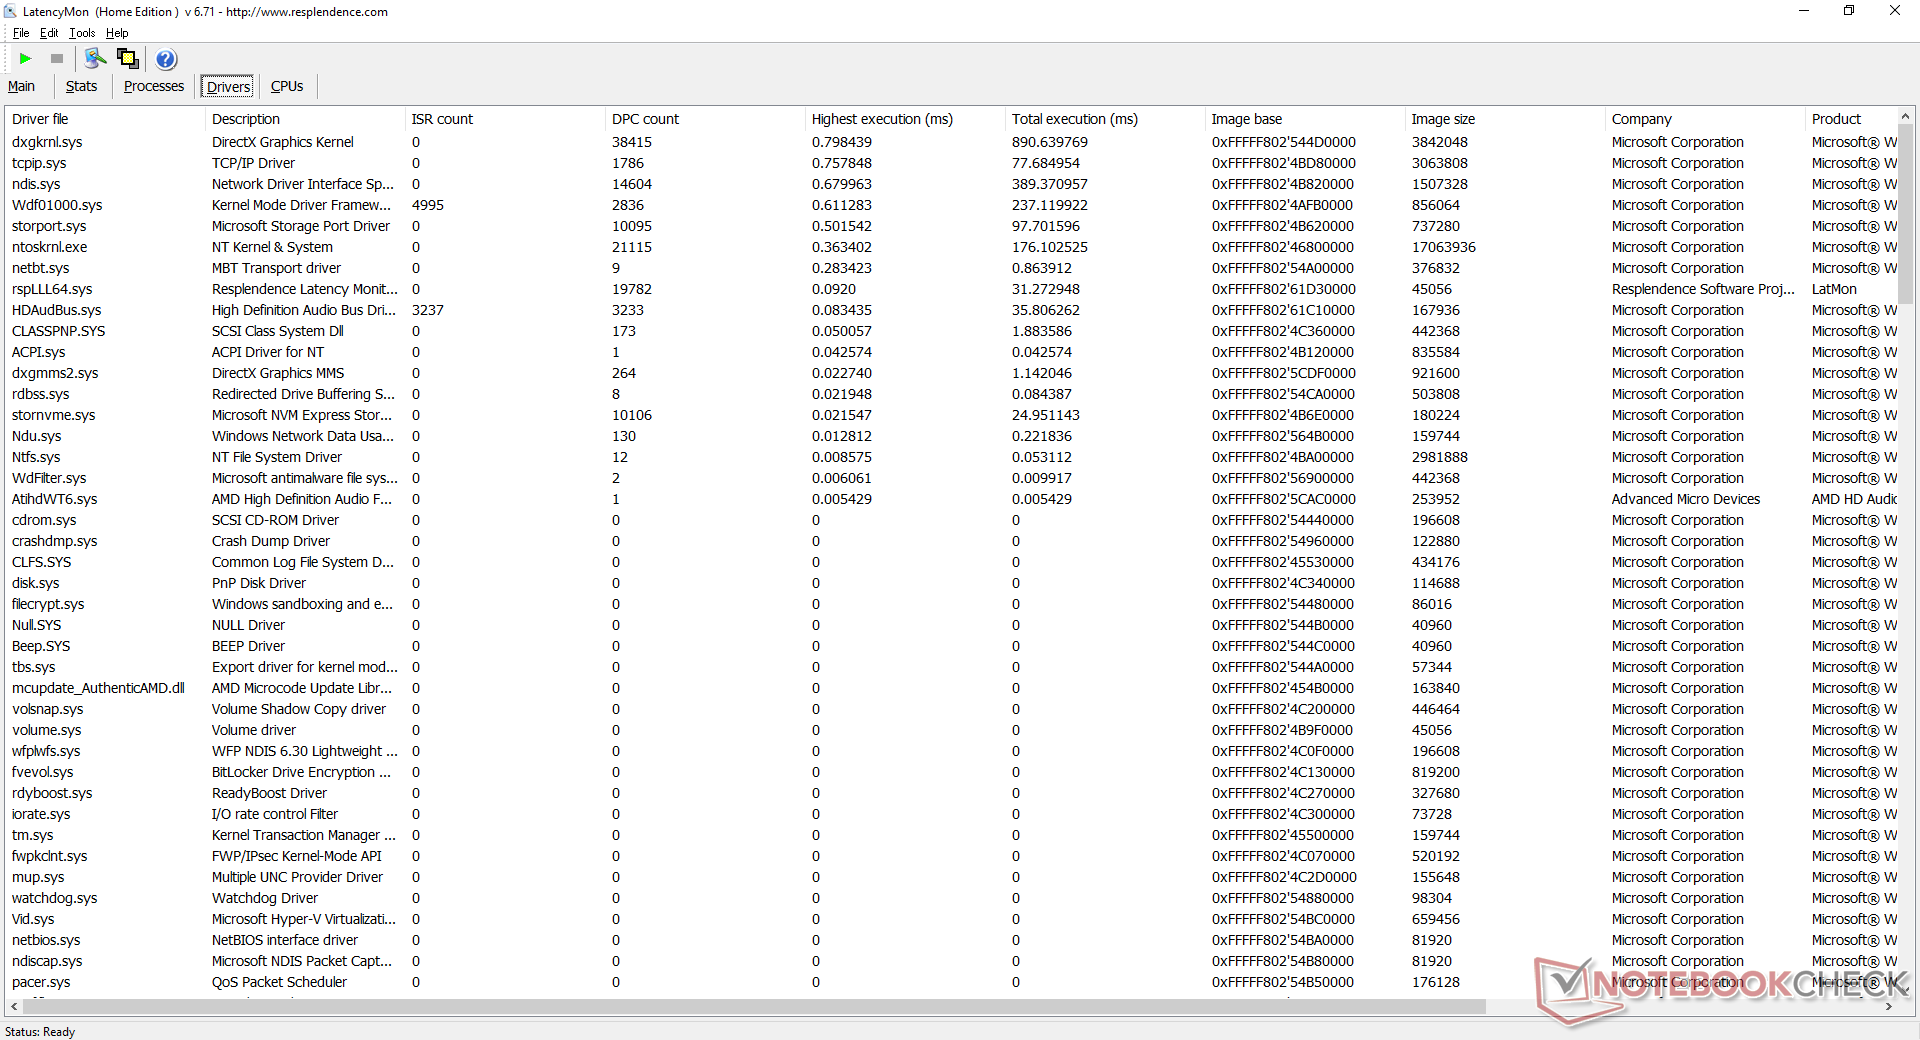
Latenza DPC
LatencyMon non mostra problemi di DPC quando si aprono più schede del browser sulla nostra homepage o quando si esegue lo stress Prime95. La riproduzione di video 4K a 60 FPS è fluida e con quasi nessun fotogramma perso.
| DPC Latencies / LatencyMon - interrupt to process latency (max), Web, Youtube, Prime95 | |
| Beelink SEi10 | |
| GMK NucBox 2 | |
| Zotac ZBox MI643 | |
| Beelink SER3 | |
| Intel NUC11TNKi5 | |
* ... Meglio usare valori piccoli
Dispositivi di archiviazione
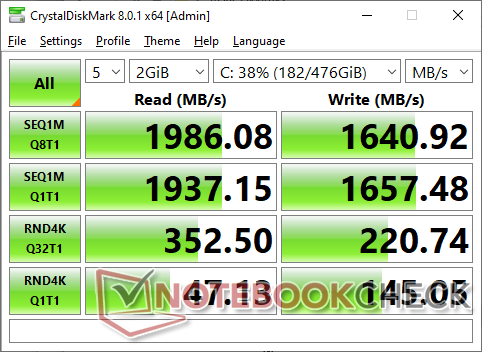
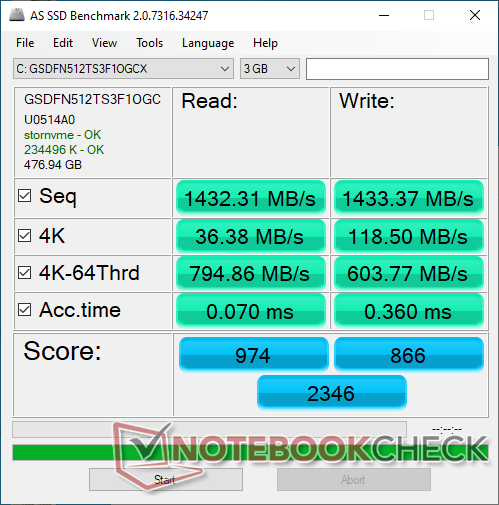
Mentre il nostro SEi10 è dotato di un SSD Silicon Motion AZW NVMe da 256 GB, il nostro SER3 ha invece la versione da 512 GB. Le velocità di lettura e scrittura sequenziale rivelano che l'unità è un'offerta NVMe di fascia media. Le velocità di trasferimento rallenteranno nel tempo se sollecitate da 1900 MB/s a 1400 MB/s o meno a causa delle limitazioni termiche. Molti Intel NUC integrano un diffusore di calore sulla parte superiore dell'SSD NVMe per il raffreddamento per prevenire o ritardare il rallentamento delle prestazioni.

| Drive Performance rating - Percent | |
| Zotac ZBox MI643 | |
| Beelink SER3 | |
| GMK NucBox 2 | |
| Beelink SEi10 | |
| Intel NUC11TNKi5 | |
* ... Meglio usare valori piccoli
Disk Throttling: DiskSpd Read Loop, Queue Depth 8
Prestazioni della GPU
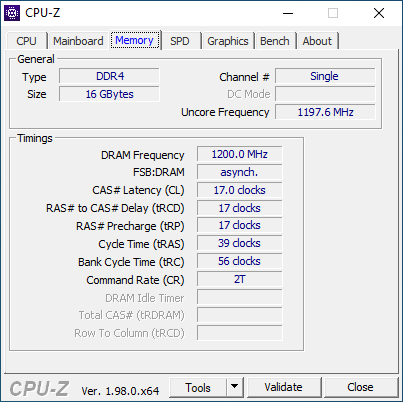
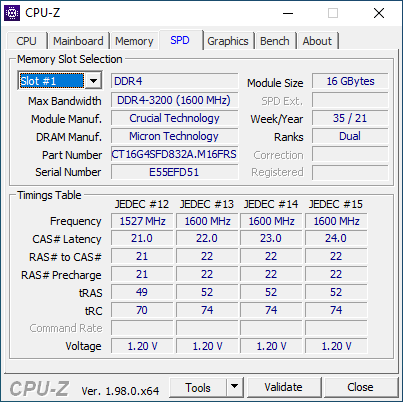
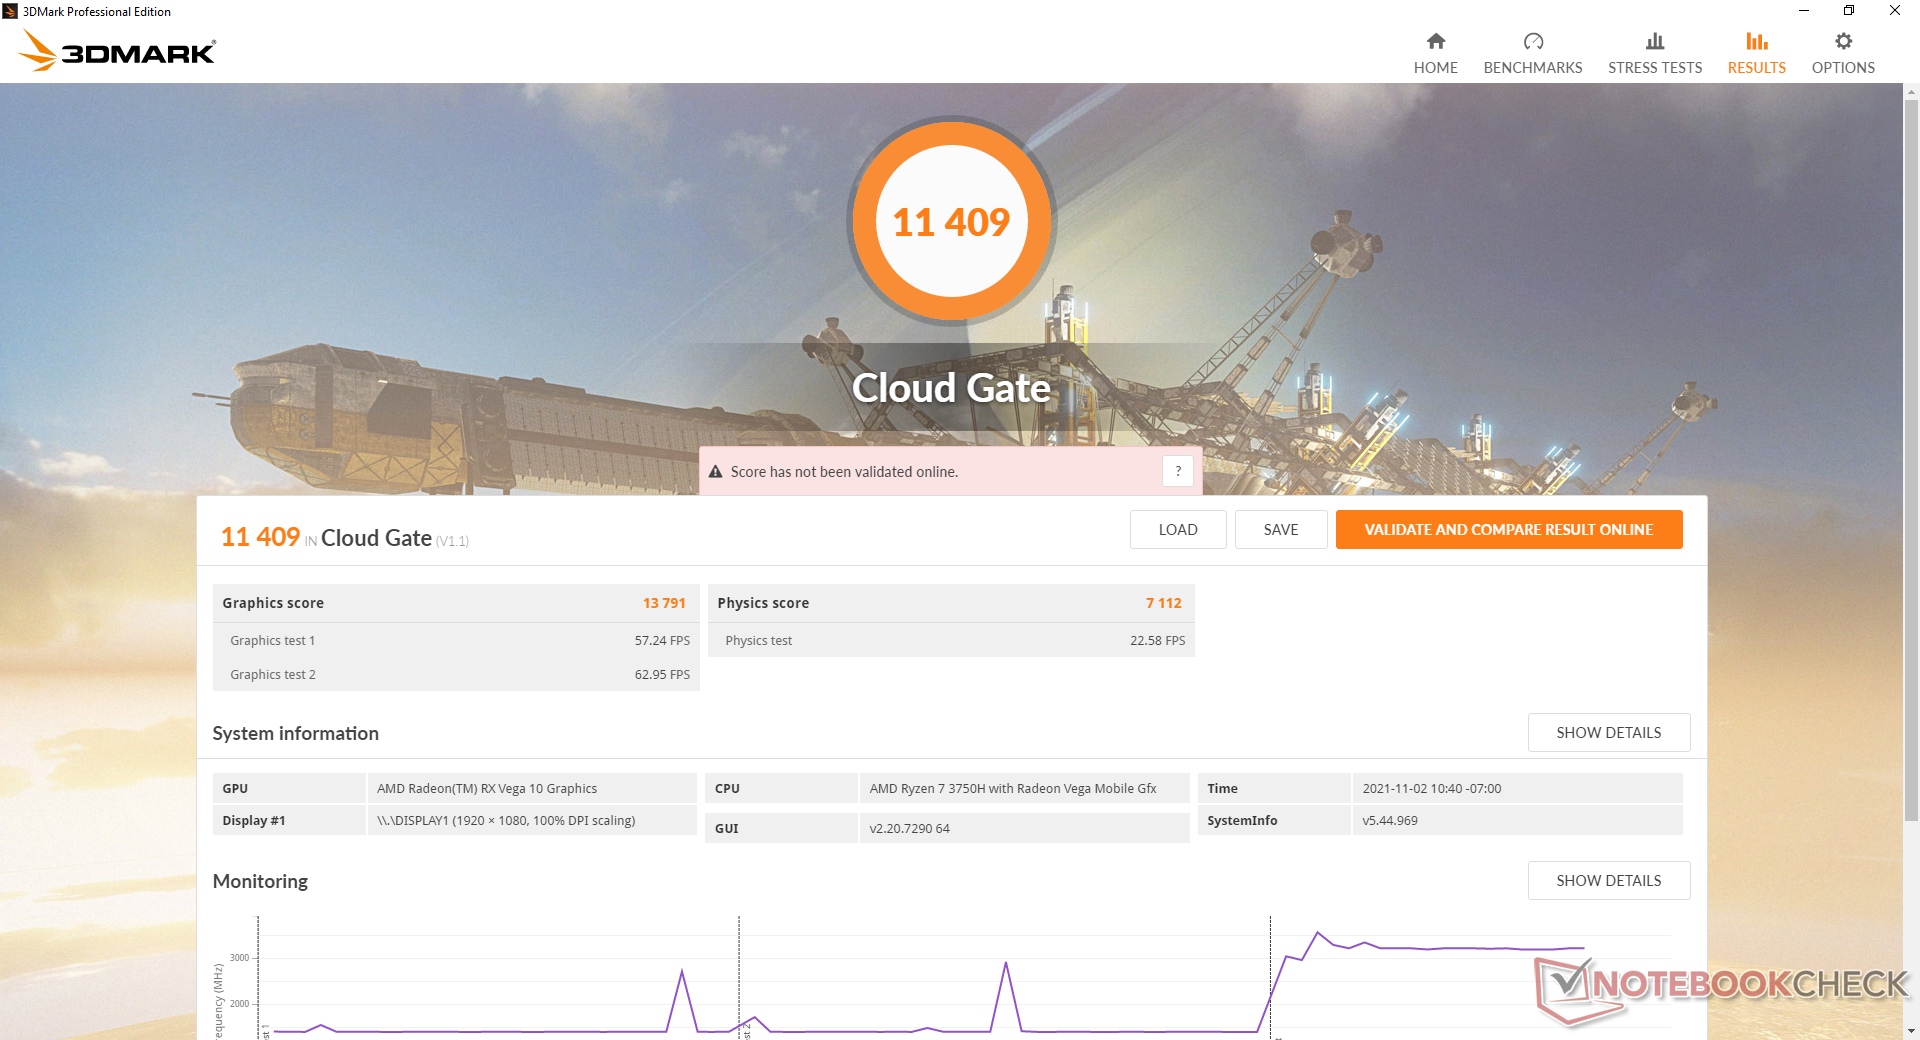
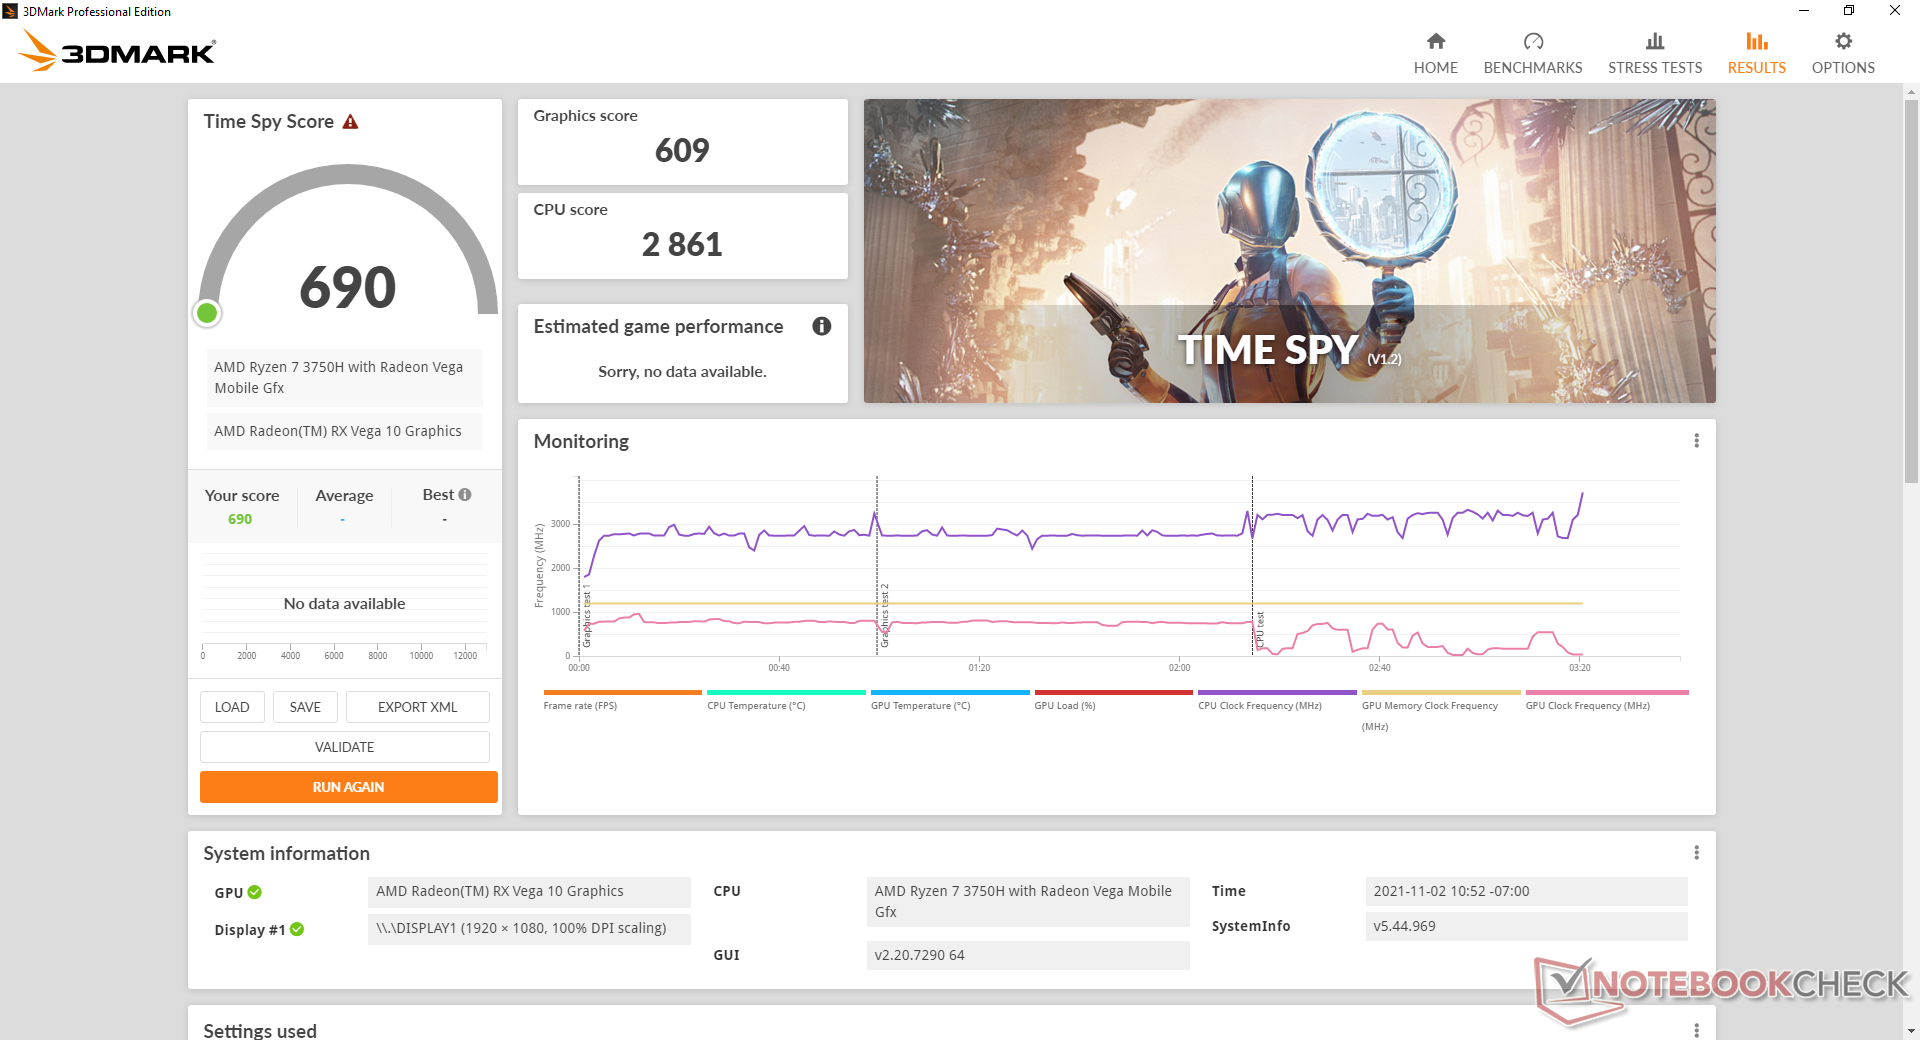
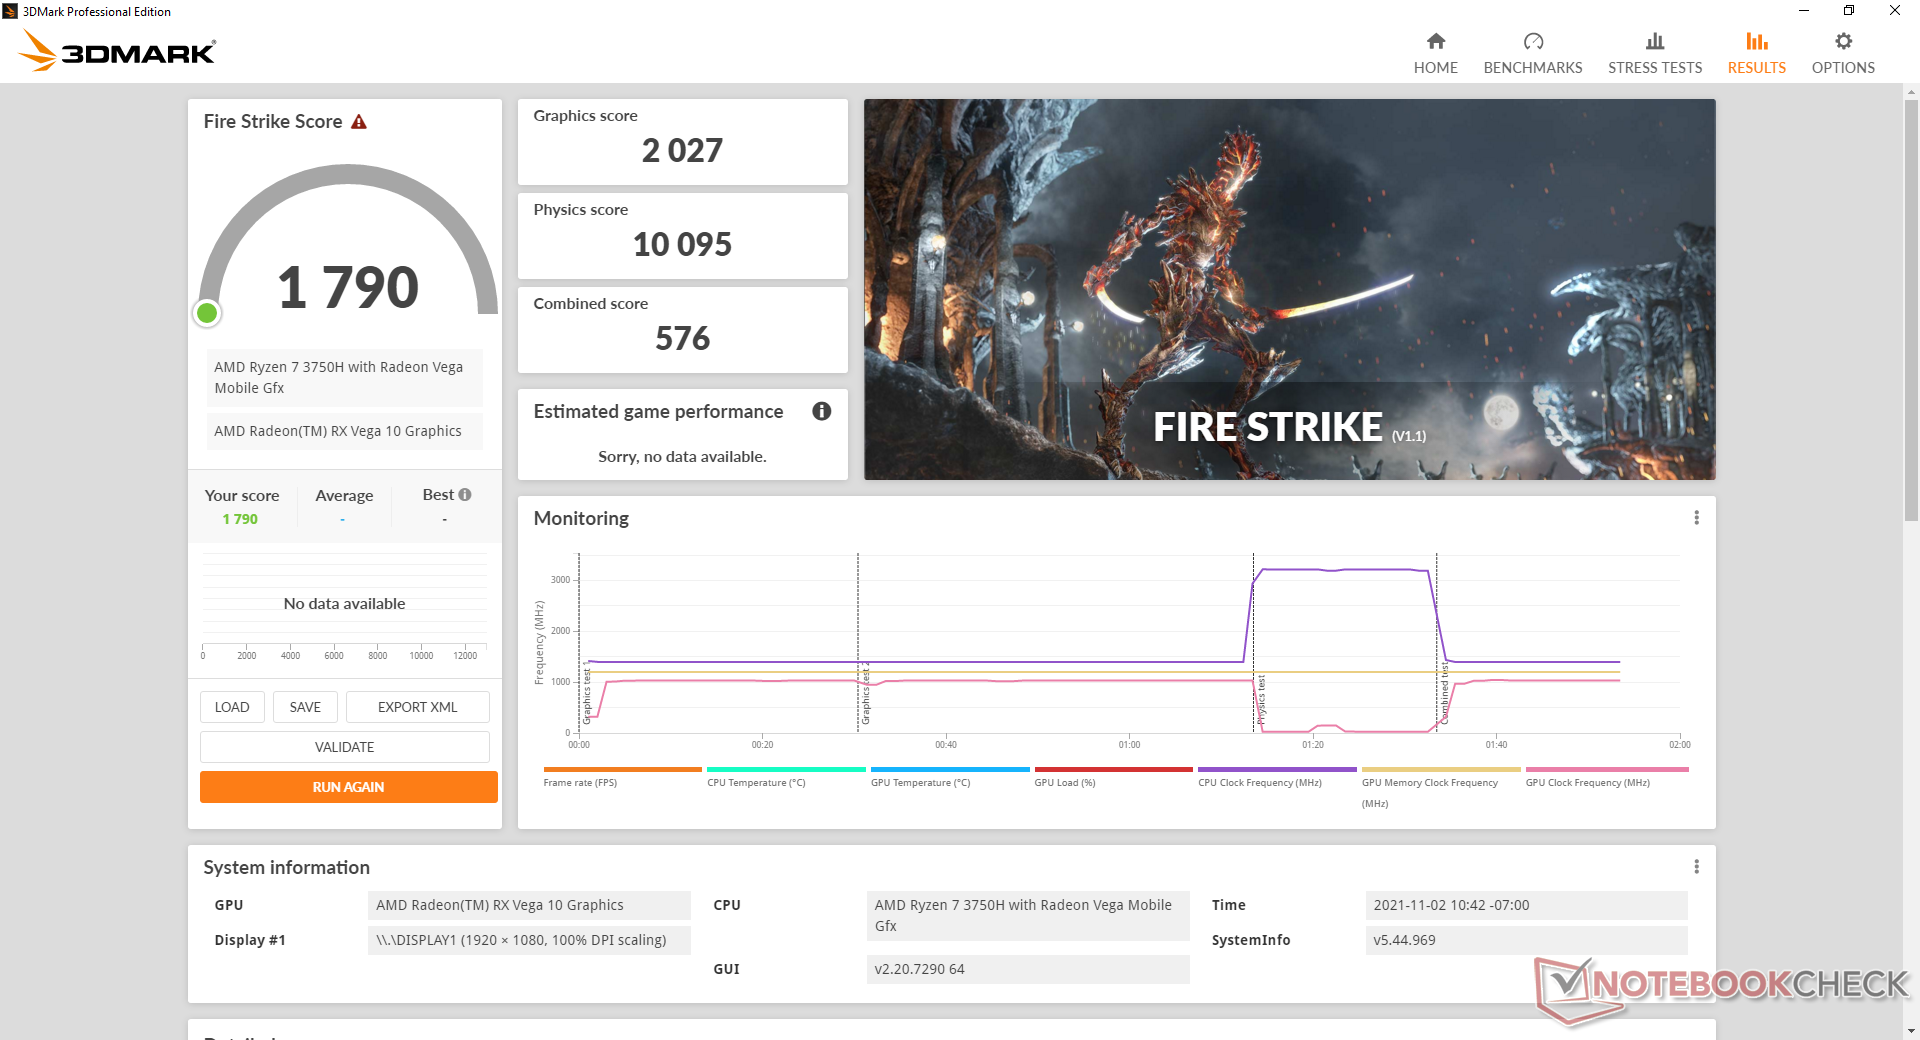
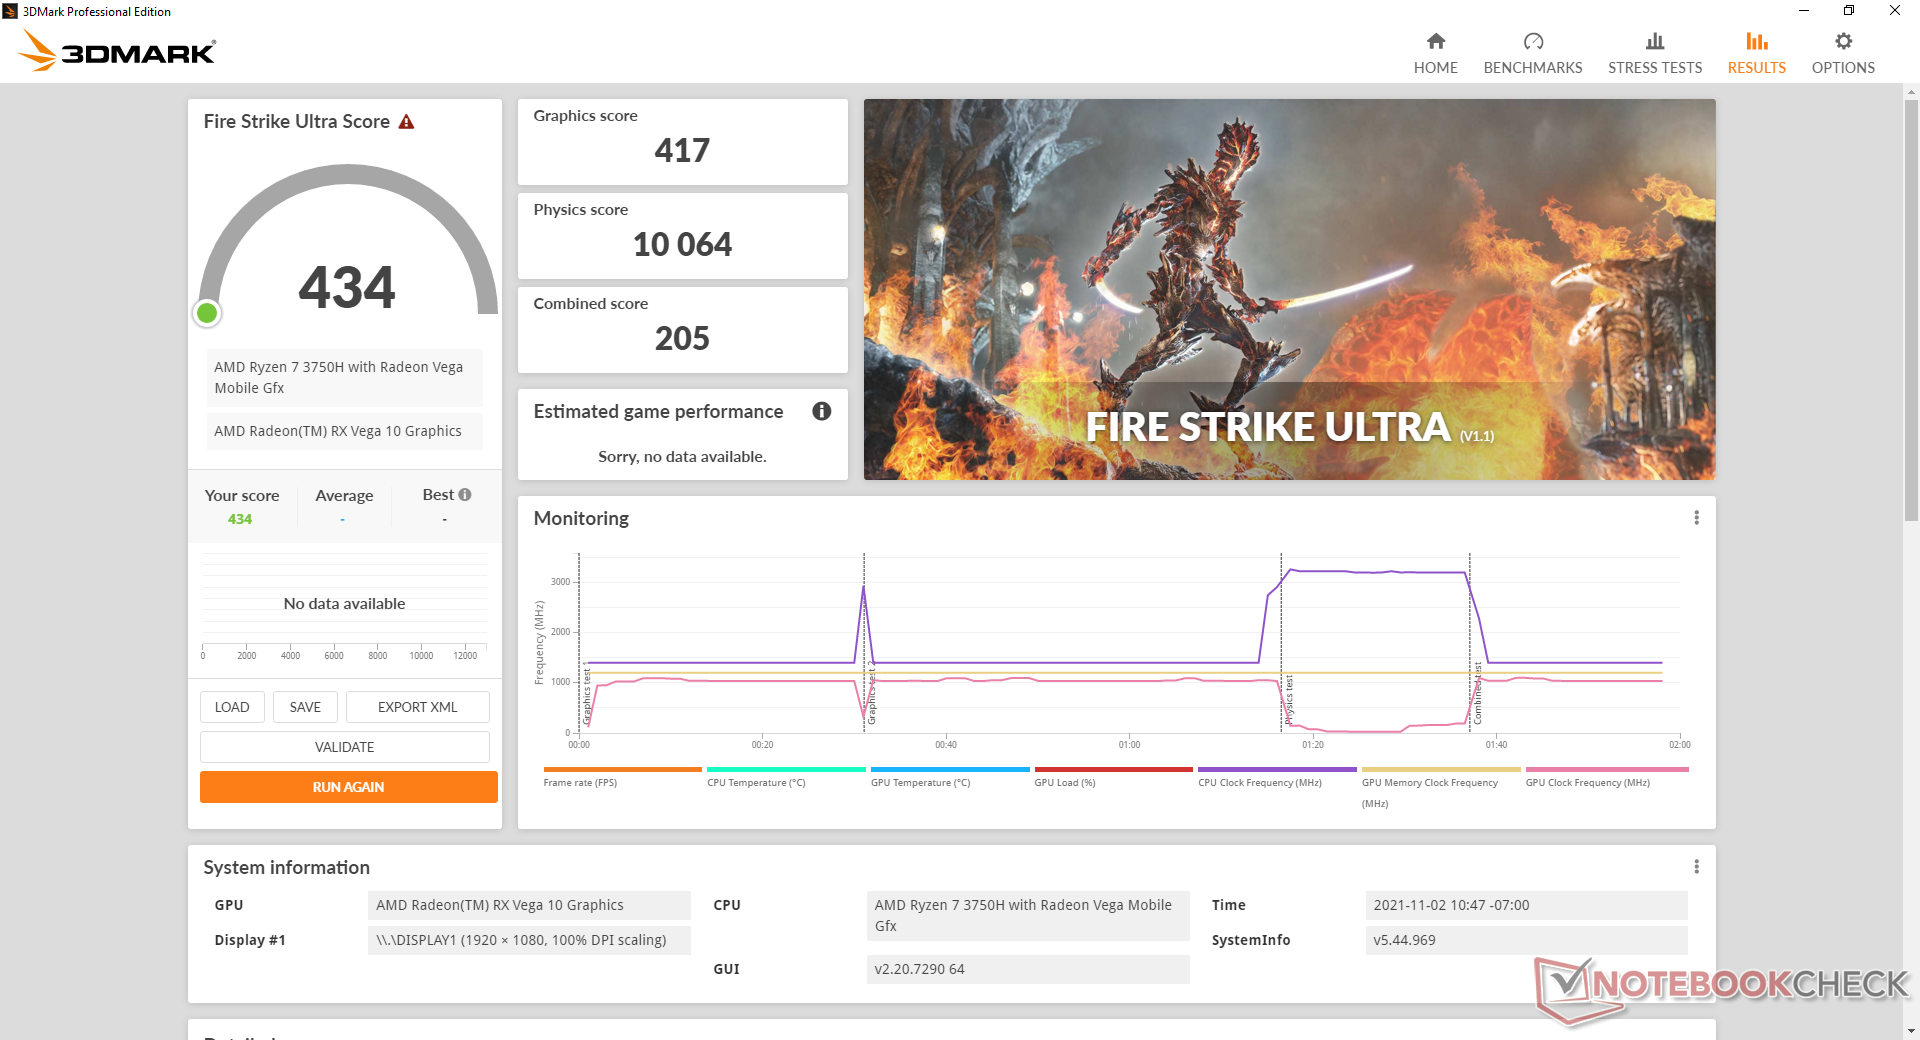
Le prestazioni grafiche sono molto simili a quelle della Iris Plus Graphics 655. Mentre la nostra Radeon RX Vega 10 è un decente aggiornamento rispetto al UHD Graphics 620è ancora significativamente più lenta delle ultime opzioni Opzioni Iris Xe NUC da Intel. Le prestazioni complessive sono leggermente più lente rispetto alla media delle RX Vega 10 nel nostro database perché la nostra unità di test SER3 è dotata solo di RAM a singolo canale. Gli utenti possono spremere più prestazioni dalla GPU se configurata con RAM a doppio canale.
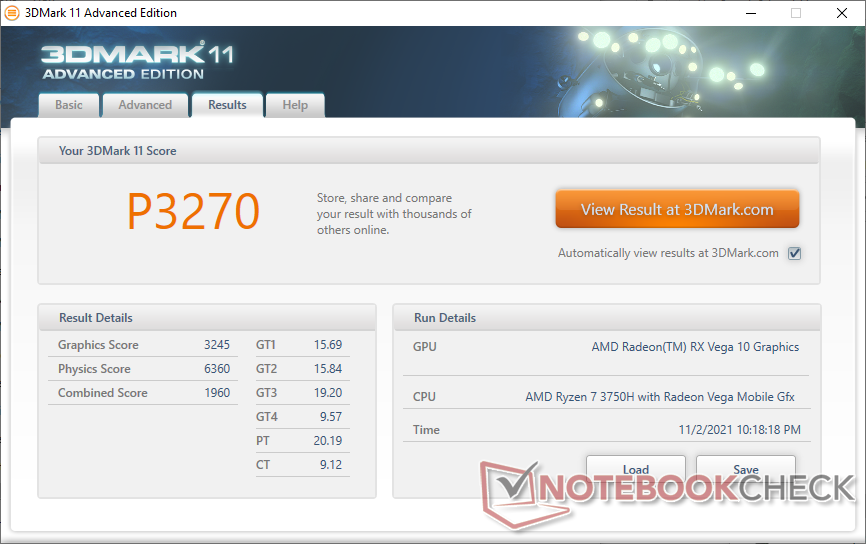
| 3DMark 11 Performance | 3270 punti | |
| 3DMark Cloud Gate Standard Score | 11409 punti | |
| 3DMark Fire Strike Score | 1790 punti | |
| 3DMark Time Spy Score | 690 punti | |
Aiuto | ||
Witcher 3 FPS Chart
| basso | medio | alto | ultra | |
|---|---|---|---|---|
| GTA V (2015) | 51.8 | 46.3 | 13.2 | 6.76 |
| The Witcher 3 (2015) | 35.7 | 22.9 | 12.2 | 8 |
| Dota 2 Reborn (2015) | 67.4 | 52 | 30.1 | 28.3 |
| Final Fantasy XV Benchmark (2018) | 19 | 9.98 | 6.8 | |
| X-Plane 11.11 (2018) | 23.8 | 18.5 | 16.7 | |
| Far Cry 5 (2018) | 23 | 12 | 11 | 10 |
| Strange Brigade (2018) | 37.9 | 15.1 | 12.6 | 10.9 |
Emissioni
Rumore di sistema
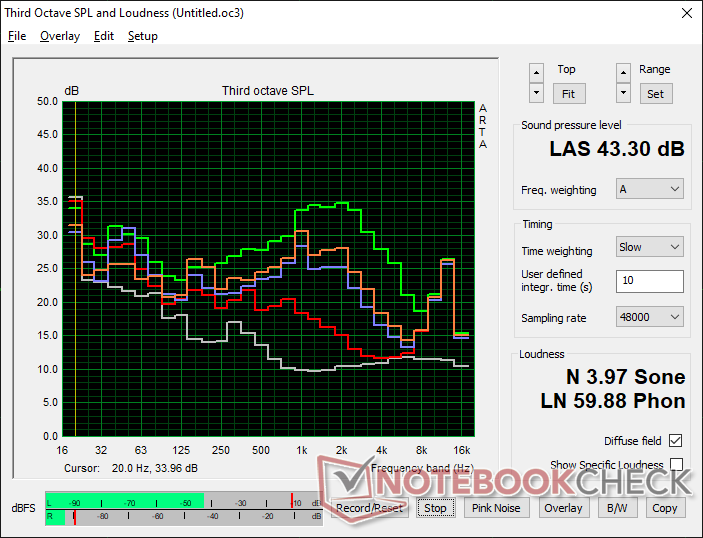
La ventola pulsa frequentemente quando si eseguono carichi tipici dell'HTPC come la navigazione o lo streaming video. Le pulsazioni non sono estreme, solo fino a 29,4 dB(A) contro uno sfondo silenzioso di 23,4 dB(A), ma si nota in un ambiente d'ufficio tranquillo. Fortunatamente non è abbastanza forte da distrarre durante la riproduzione di musica o video più forte.
L'esecuzione di carichi più elevati come i giochi può indurre un rumore di ventola fino a 37-43 dB(A), non diversamente da molti Ultrabook alimentati dalla serie U o dai vecchiIntel NUC8i7BE.
Rumorosità
| Idle |
| 23.4 / 23.4 / 29.4 dB(A) |
| Sotto carico |
| 35.2 / 43.3 dB(A) |
 | ||
30 dB silenzioso 40 dB(A) udibile 50 dB(A) rumoroso |
||
min: | ||
| Beelink SER3 Vega 10, R7 3750H, GSemi AZW GSDFN512TS3F1OGCX | Beelink SEi10 UHD Graphics G1 (Ice Lake 32 EU), i3-1005G1, Silicon Motion AZW 256G M.2280 NVMe 4X 200725 D | Intel NUC8i7BE Iris Plus Graphics 655, i7-8559U | GMK NucBox 2 Iris Plus Graphics 655, i5-8259U, Netac S930E8/256GPN | Zotac ZBox MI643 UHD Graphics 620, i5-10210U, Lexar NM610 1TB | Intel NUC11TNKi5 Iris Xe G7 80EUs, i5-1135G7, Transcend M.2 SSD 430S TS512GMTS430S | |
|---|---|---|---|---|---|---|
| Noise | -23% | -13% | 1% | -4% | -21% | |
| off /ambiente * (dB) | 23.4 | 27.5 -18% | 28.7 -23% | 25.6 -9% | 26.1 -12% | 24.8 -6% |
| Idle Minimum * (dB) | 23.4 | 30.9 -32% | 28.7 -23% | 25.7 -10% | 27.5 -18% | 35.6 -52% |
| Idle Average * (dB) | 23.4 | 33.5 -43% | 29.3 -25% | 25.7 -10% | 27.5 -18% | 35.6 -52% |
| Idle Maximum * (dB) | 29.4 | 33.5 -14% | 31.8 -8% | 25.7 13% | 27.5 6% | 35.6 -21% |
| Load Average * (dB) | 35.2 | 38.5 -9% | 39 -11% | 35.3 -0% | 28.9 18% | 36.2 -3% |
| Witcher 3 ultra * (dB) | 37.2 | 39 -5% | 38 -2% | |||
| Load Maximum * (dB) | 43.3 | 51.6 -19% | 41.4 4% | 35.1 19% | 42 3% | 47.6 -10% |
* ... Meglio usare valori piccoli
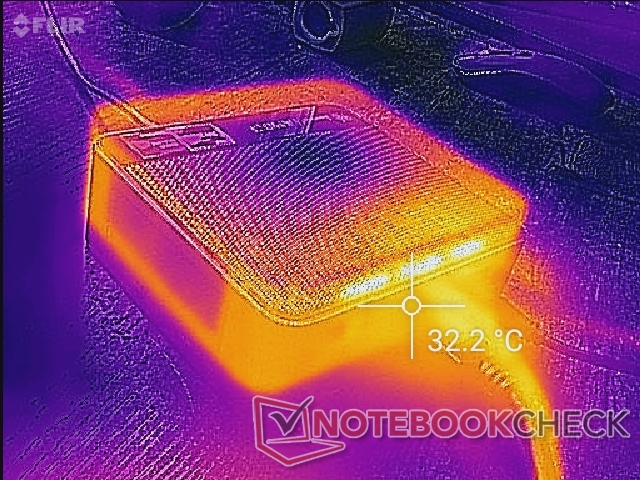
Temperatura
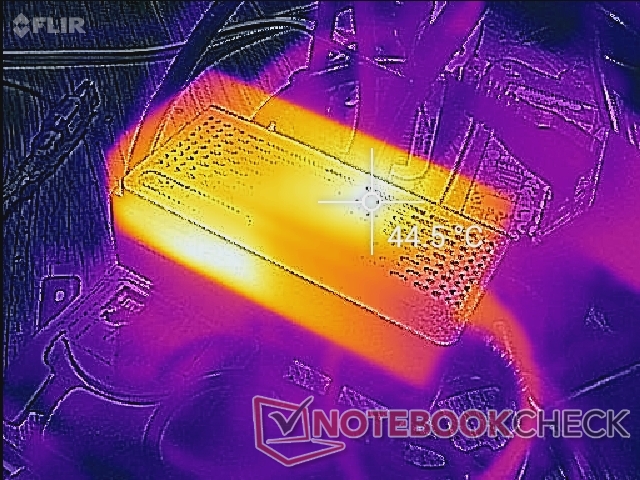
Le temperature di superficie non sono un problema per il SER3. L'aria calda esce dalla parte posteriore mentre l'aria fredda entra dall'alto e quindi non raccomandiamo di impilare libri o carte sul mini PC
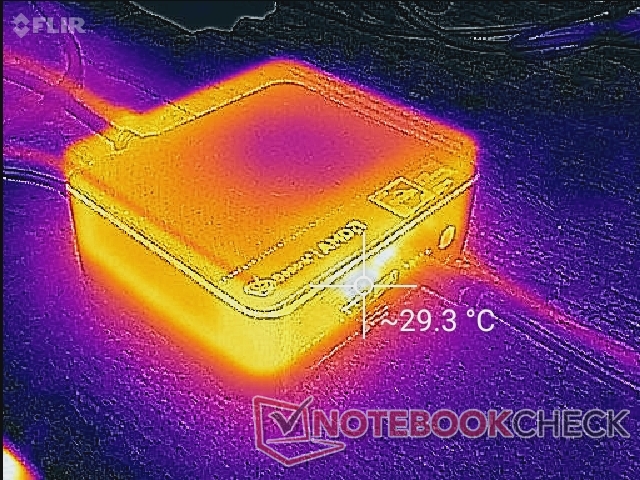
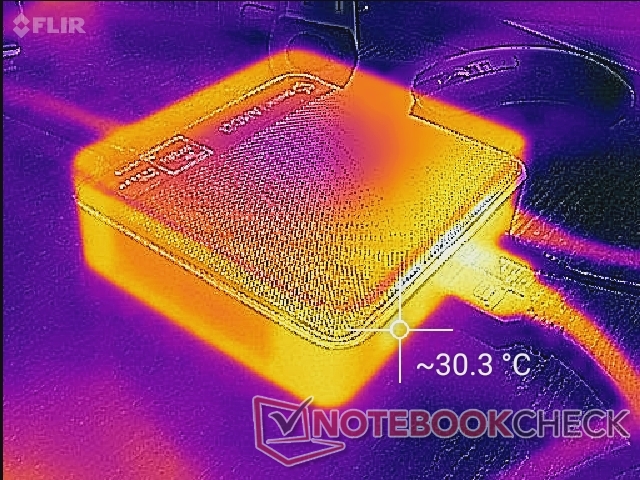
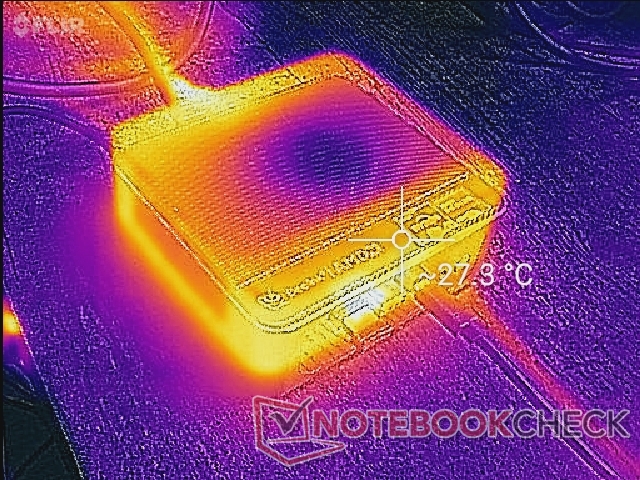
L'adattatore AC può diventare più caldo del mini PC stesso quando si utilizzano carichi elevati, come mostrato dalle nostre mappe di temperatura.
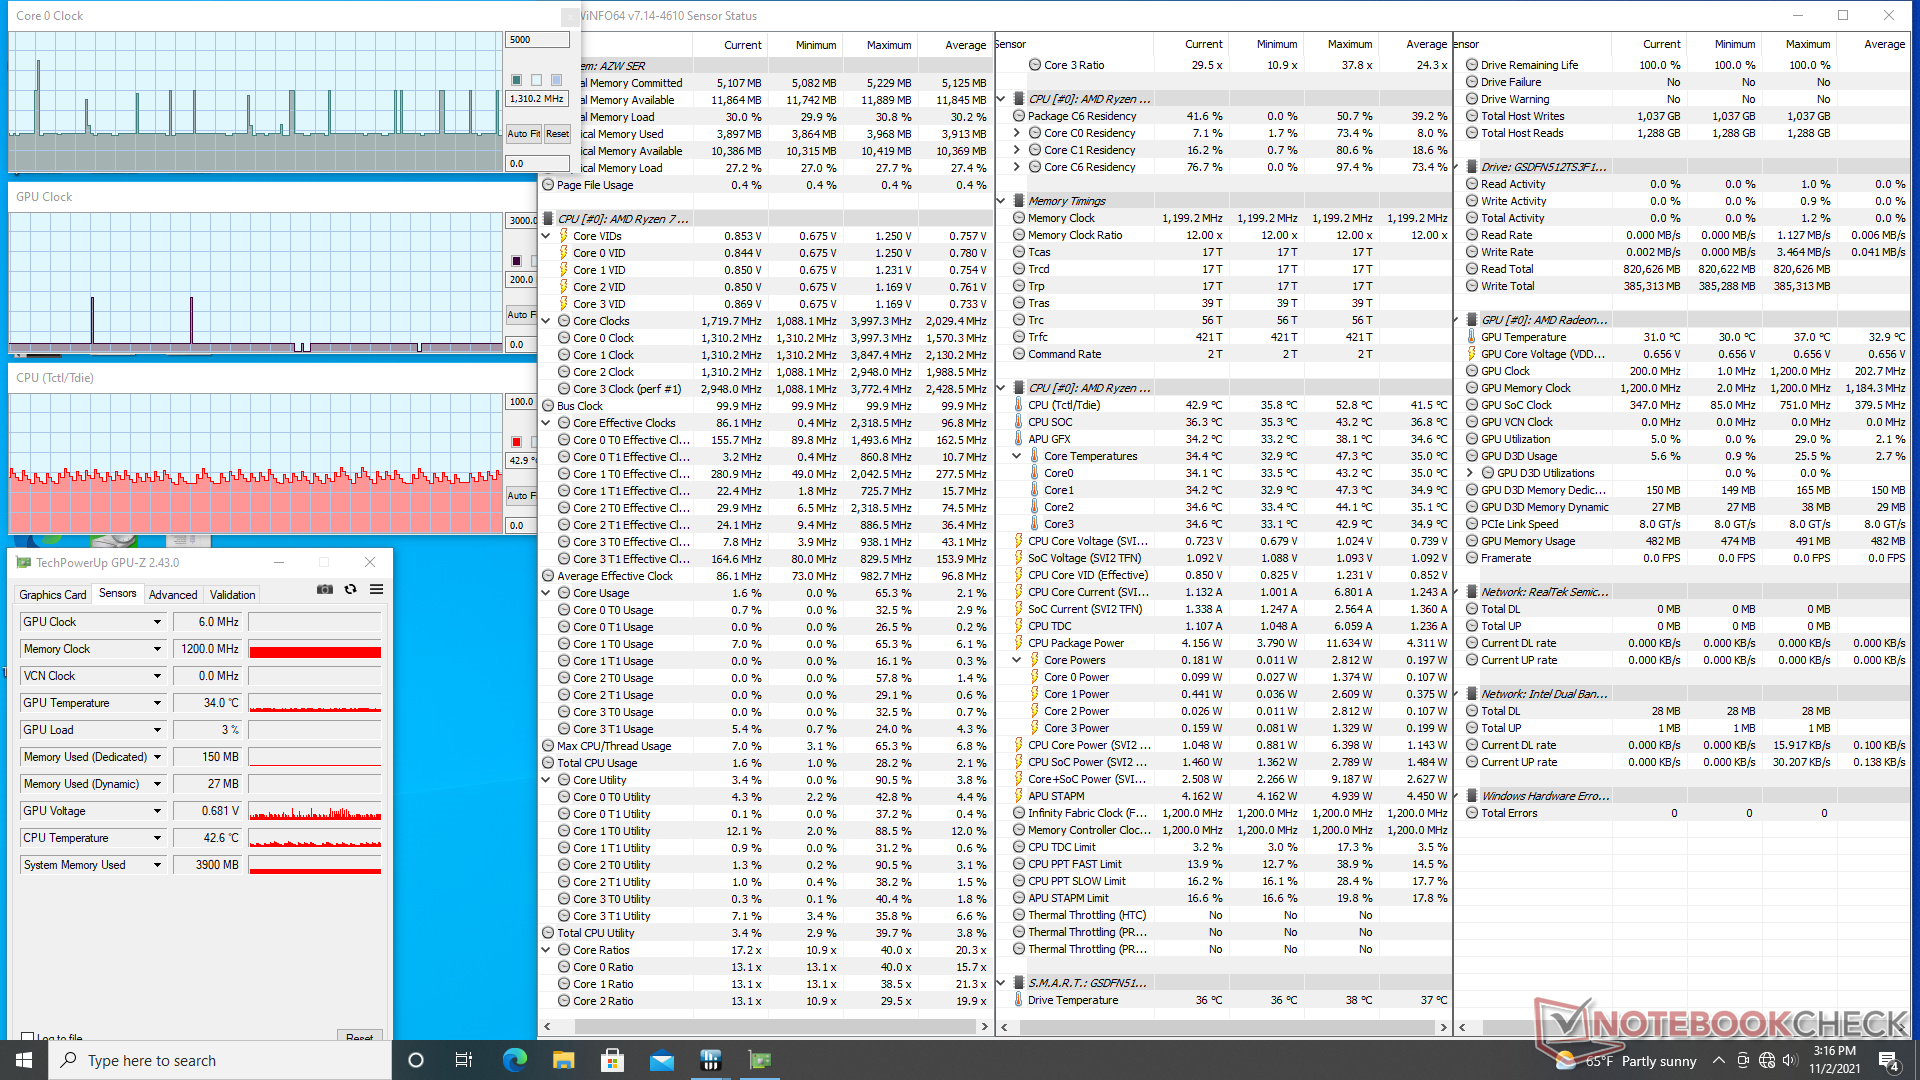
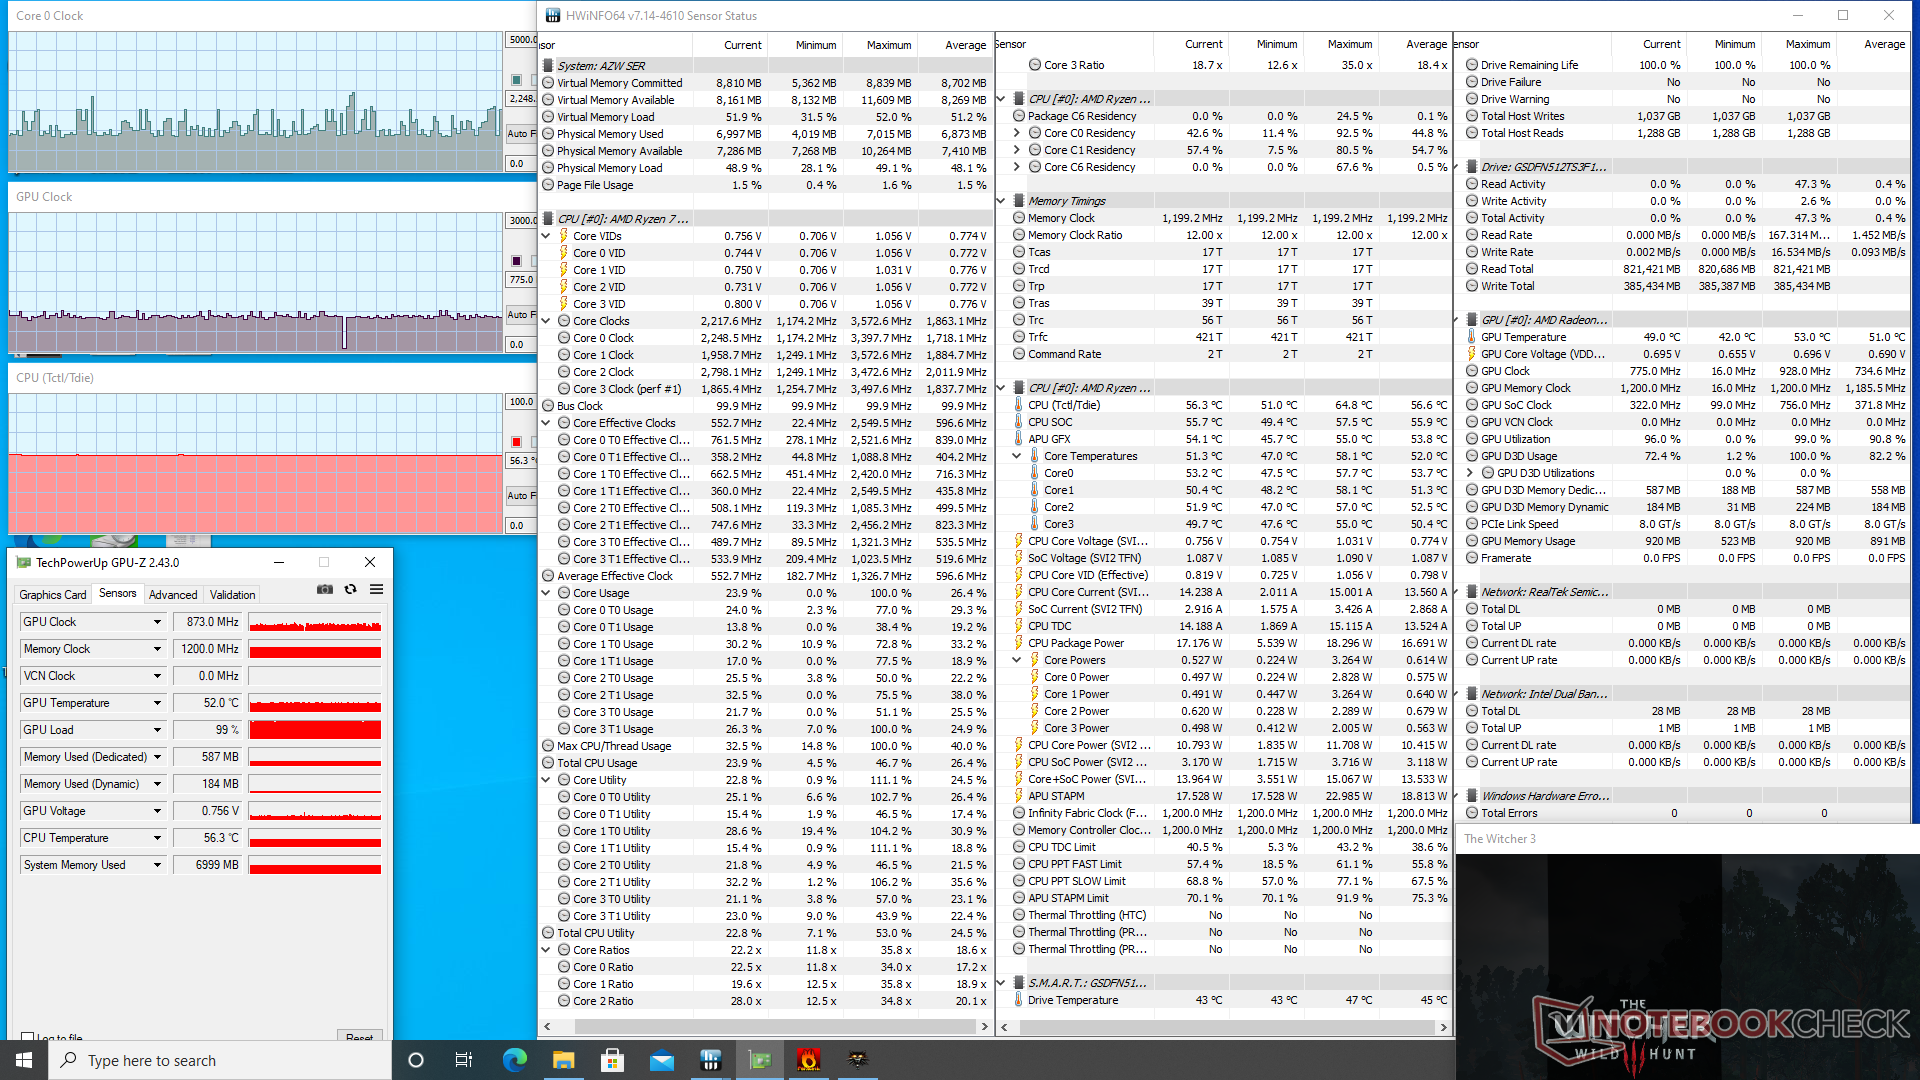
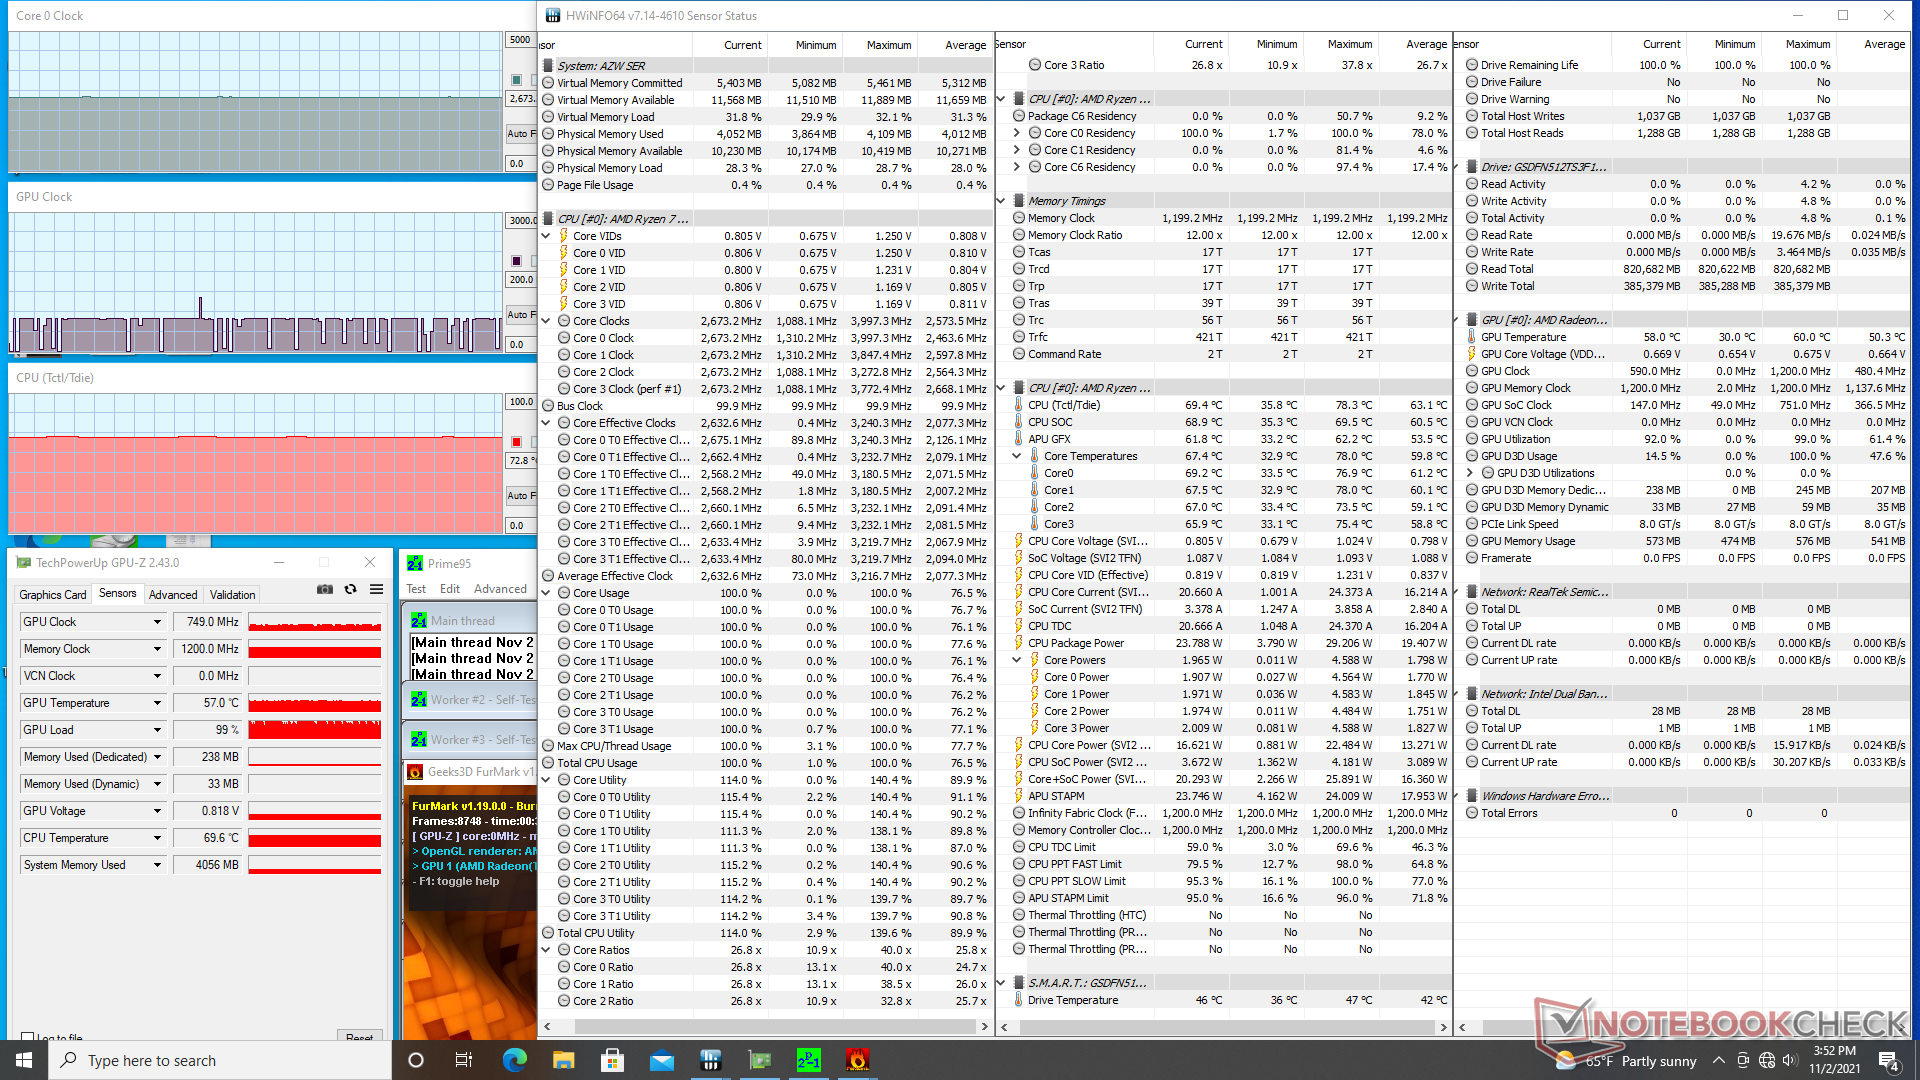
Test di stress
Quando si esegue prime95, i tassi di clock della CPU aumentano a 3,3 GHz per il primo minuto o giù di lì fino a raggiungere una temperatura del core di 78 C. I tassi di clock scendono poi a 3,0 GHz per mantenere una temperatura del core più fredda di 72 C.
La temperatura del nucleo è relativamente fredda a soli 56 C quando si corre Witcher 3 rispetto ai 62 C del Intel NUC11TNKi5 Pro.
| Clock della CPU (GHz)Clock della GPU(MHz)Temperaturamedia dellaCPU Tctl/Tdie (°C) |
| Sistema inattivo |
| Prime95 Stress |
| Prime95 + FurMark Stress |
| Witcher 3 Stress |
Gestione dell'energia
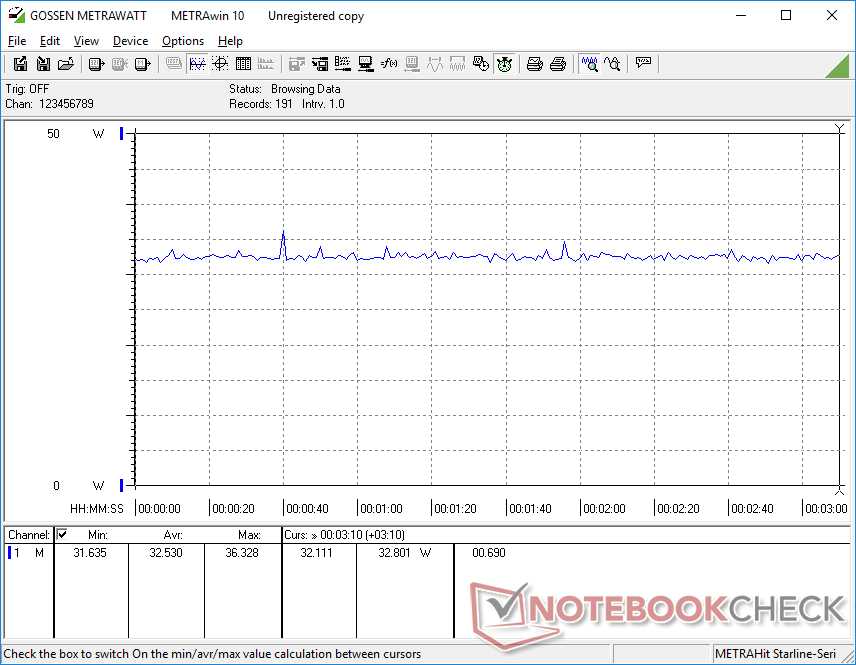
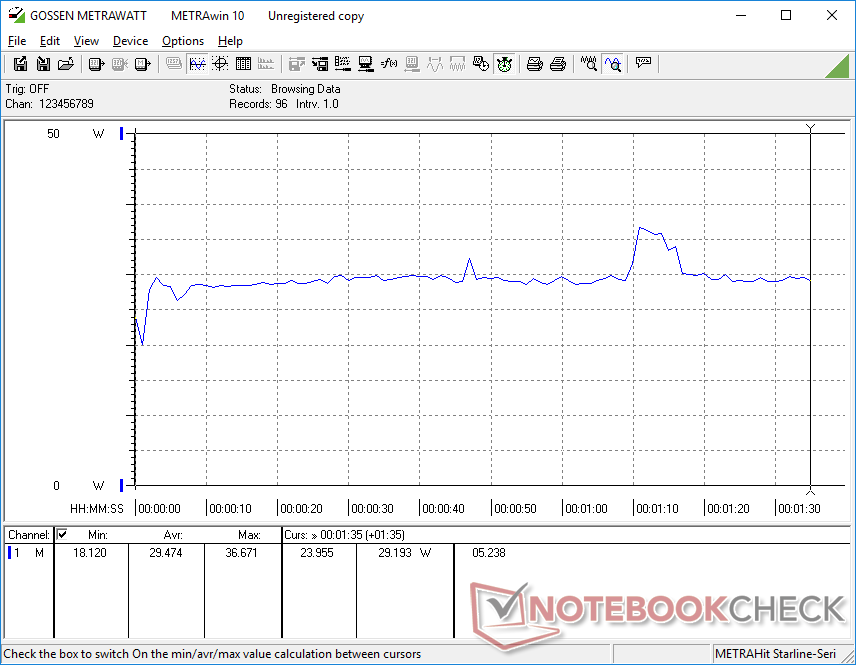
Consumo di energia
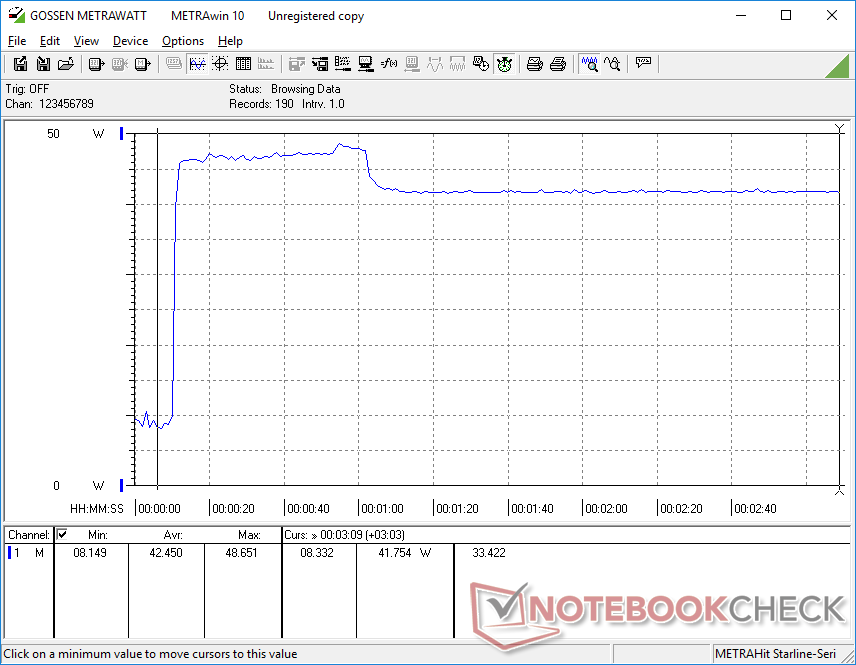
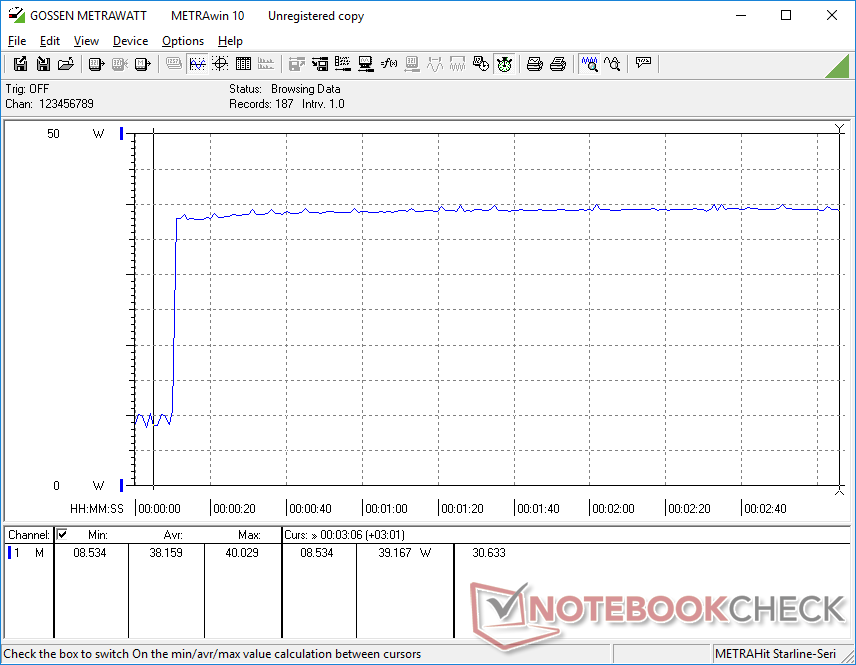
Il consumo di energia quando è inattivo sul desktop è leggermente più alto rispetto alla maggior parte degli altri mini PC che utilizzano CPU Core serie U, poiché il nostro SER3 utilizza un processore serie H più esigente. Tuttavia, il consumo di energia quando si eseguono carichi più elevati è inferiore al previsto a soli 30 W a 40 W in media
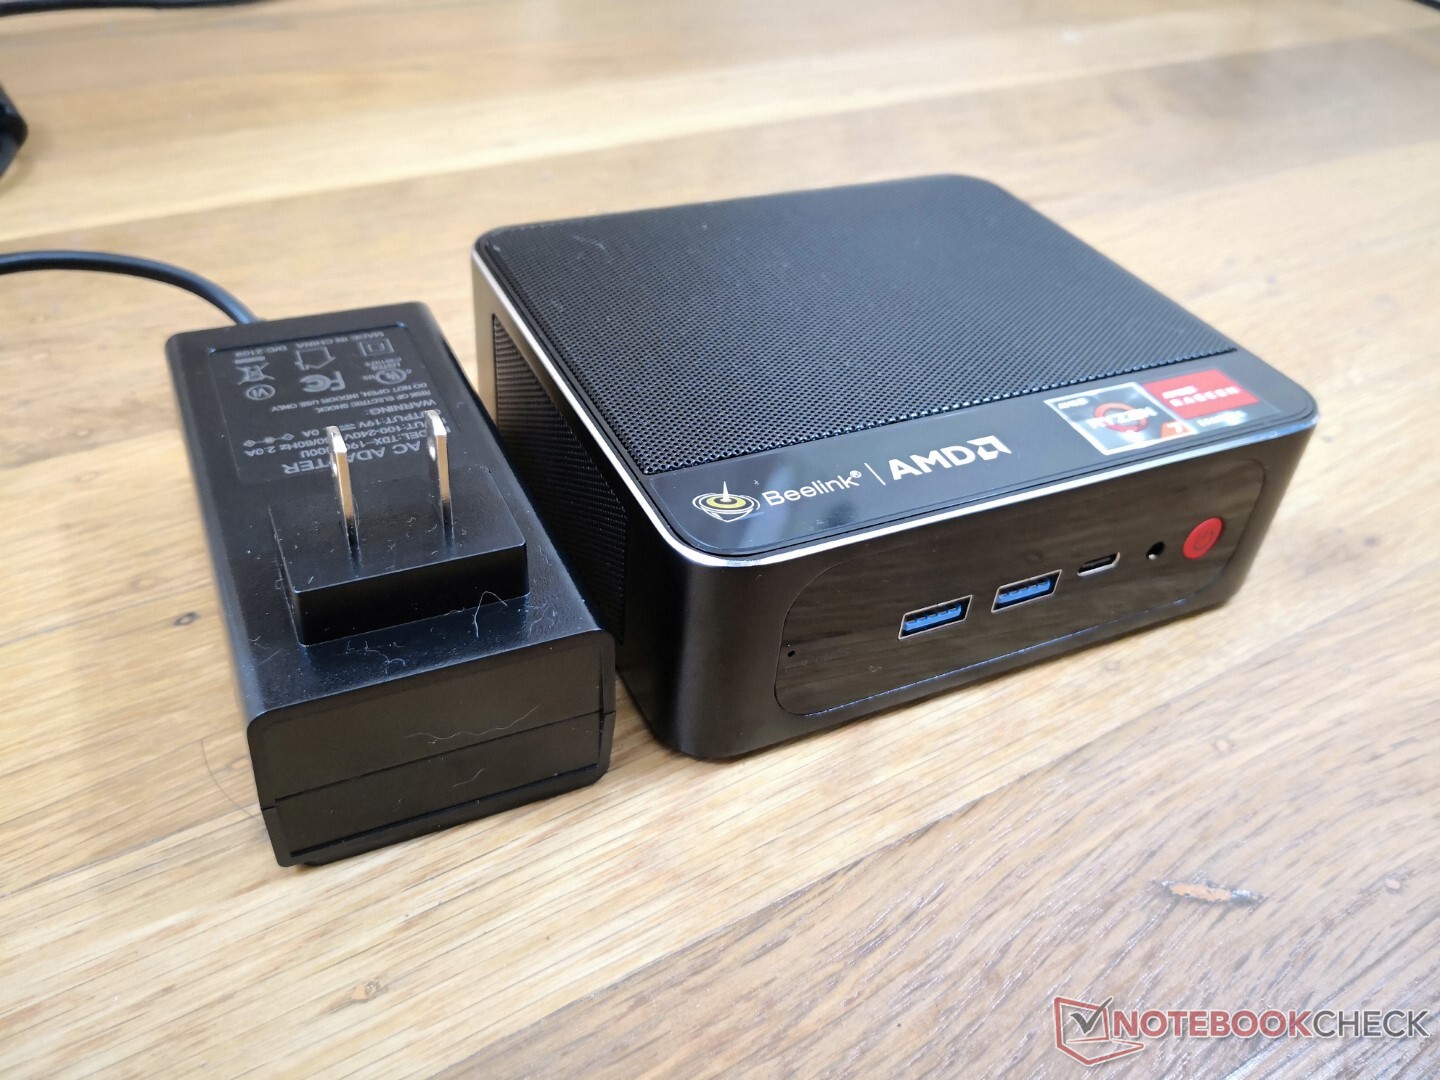
Siamo in grado di registrare un massimo di poco meno di 49 W dall'adattatore AC da 57 W di medie dimensioni (~10 x 5 x 6 cm compresi i poli) quando la CPU è utilizzata al 100%. Questo tasso cade dopo circa un minuto a causa delle limitazioni termiche.
| Off / Standby | |
| Idle | |
| Sotto carico |
|
Leggenda:
min: | |
| Beelink SER3 R7 3750H, Vega 10, GSemi AZW GSDFN512TS3F1OGCX, , x, | Beelink SEi10 i3-1005G1, UHD Graphics G1 (Ice Lake 32 EU), Silicon Motion AZW 256G M.2280 NVMe 4X 200725 D, , x, | Intel NUC8i7BE i7-8559U, Iris Plus Graphics 655, , , x, | GMK NucBox 2 i5-8259U, Iris Plus Graphics 655, Netac S930E8/256GPN, , x, | Zotac ZBox MI643 i5-10210U, UHD Graphics 620, Lexar NM610 1TB, , x, | Intel NUC11TNKi5 i5-1135G7, Iris Xe G7 80EUs, Transcend M.2 SSD 430S TS512GMTS430S, , x, | |
|---|---|---|---|---|---|---|
| Power Consumption | 17% | -8% | 0% | -10% | -43% | |
| Idle Minimum * (Watt) | 7 | 6.3 10% | 2.7 61% | 6.1 13% | 7.5 -7% | 11.5 -64% |
| Idle Average * (Watt) | 9.1 | 6.6 27% | 3.1 66% | 6.8 25% | 9.2 -1% | 12.4 -36% |
| Idle Maximum * (Watt) | 9.7 | 6.7 31% | 6.3 35% | 7.3 25% | 9.6 1% | 12.9 -33% |
| Load Average * (Watt) | 29.5 | 25.9 12% | 59.7 -102% | 46.3 -57% | 34.4 -17% | 40.7 -38% |
| Witcher 3 ultra * (Watt) | 32.5 | 47.2 -45% | 43.9 -35% | |||
| Load Maximum * (Watt) | 48.7 | 46.7 4% | 78 -60% | 50.7 -4% | 60.6 -24% | 73.5 -51% |
* ... Meglio usare valori piccoli
Power Consumption Witcher 3 / Stresstest
Pro
Contro
Verdetto
Per meno di $500 USD, gli utenti stanno ottenendo un mini PC pronto per l'HTPC con un livello di prestazioni simile al Core i5-8259U in alcuni NUC Intel. Il sistema è diversi passi avanti rispetto ad altri mini PC economici che girano su CPU Atom o Celeron come il Chuwi LarkBox o GBox che sono notoriamente lenti anche quando si eseguono applicazioni poco impegnative. Apprezziamo che Beelink stia offrendo i SER3 come PC pronti all'uso completi di RAM e storage, mentre i NUC Intel sono quasi sempre venduti come SKU barebone.
Il Beelink SER3 è un HTPC discreto facile da usare con opzioni di aggiornamento accessibili. Preparatevi a un po' di rumore della ventola soprattutto quando si eseguono applicazioni molto esigenti.
Gli acquirenti dovrebbero essere consapevoli che il SER3 omette una manciata di caratteristiche ausiliarie probabilmente per mantenere bassi i costi. Non c'è il blocco Kensington, il lettore SD, il ricevitore IR o il supporto Thunderbolt, mentre DP-over-USB-C può essere inaffidabile. La ventola pulsa frequentemente e l'adattatore AC wall wart è sia spesso che corto. L'SSD NVMe incluso, anche se decentemente veloce, si strozza nelle prestazioni quando viene sollecitato a causa della mancanza di un diffusore di calore incorporato.
Prezzo e disponibilità
Il Beelink SER3 può essere trovato su Amazon per 479 dollari con 8 GB di RAM e 256 GB di SSD o 559 dollari con il doppio della RAM e dello storage.
No, or more than one (0) Rating for the given SpecsID 326081 found

