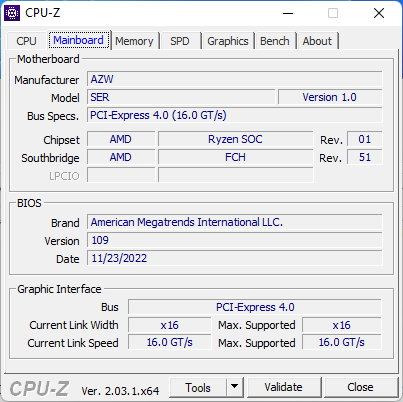
Recensione del Beelink SER6 Pro: La AMD Radeon 680M è sorprendente su un mini PC
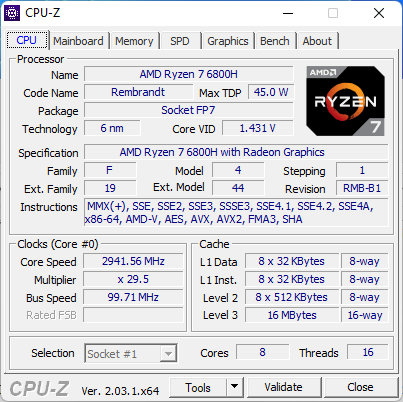
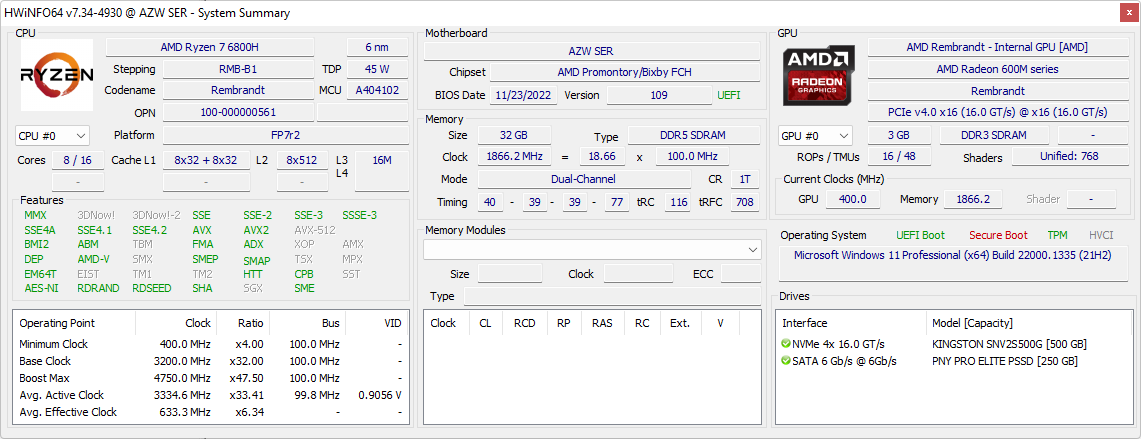
Beelink SER6 Pro succede alla generazione precedente Beelink SER5 Pro. Introduce nuove modifiche esterne e una CPU Zen 3+ Ryzen 7 6800H aggiornata che sostituisce la Zen 3 Ryzen 7 5800H del modello precedente. Al momento non sono disponibili altre opzioni di CPU per il SER6 Pro.
Il SER6 Pro compete direttamente con molte soluzioni NUC di Intel così come con lo Zotac ZBox o la serie MSI Cubi. La nostra configurazione specifica di Beelink ha un prezzo di vendita compreso tra 600 e 700 dollari.
Altre recensioni di Beelink:
Potenziali concorrenti a confronto
Punteggio | Data | Modello | Peso | Altezza | Dimensione | Risoluzione | Prezzo |
|---|---|---|---|---|---|---|---|
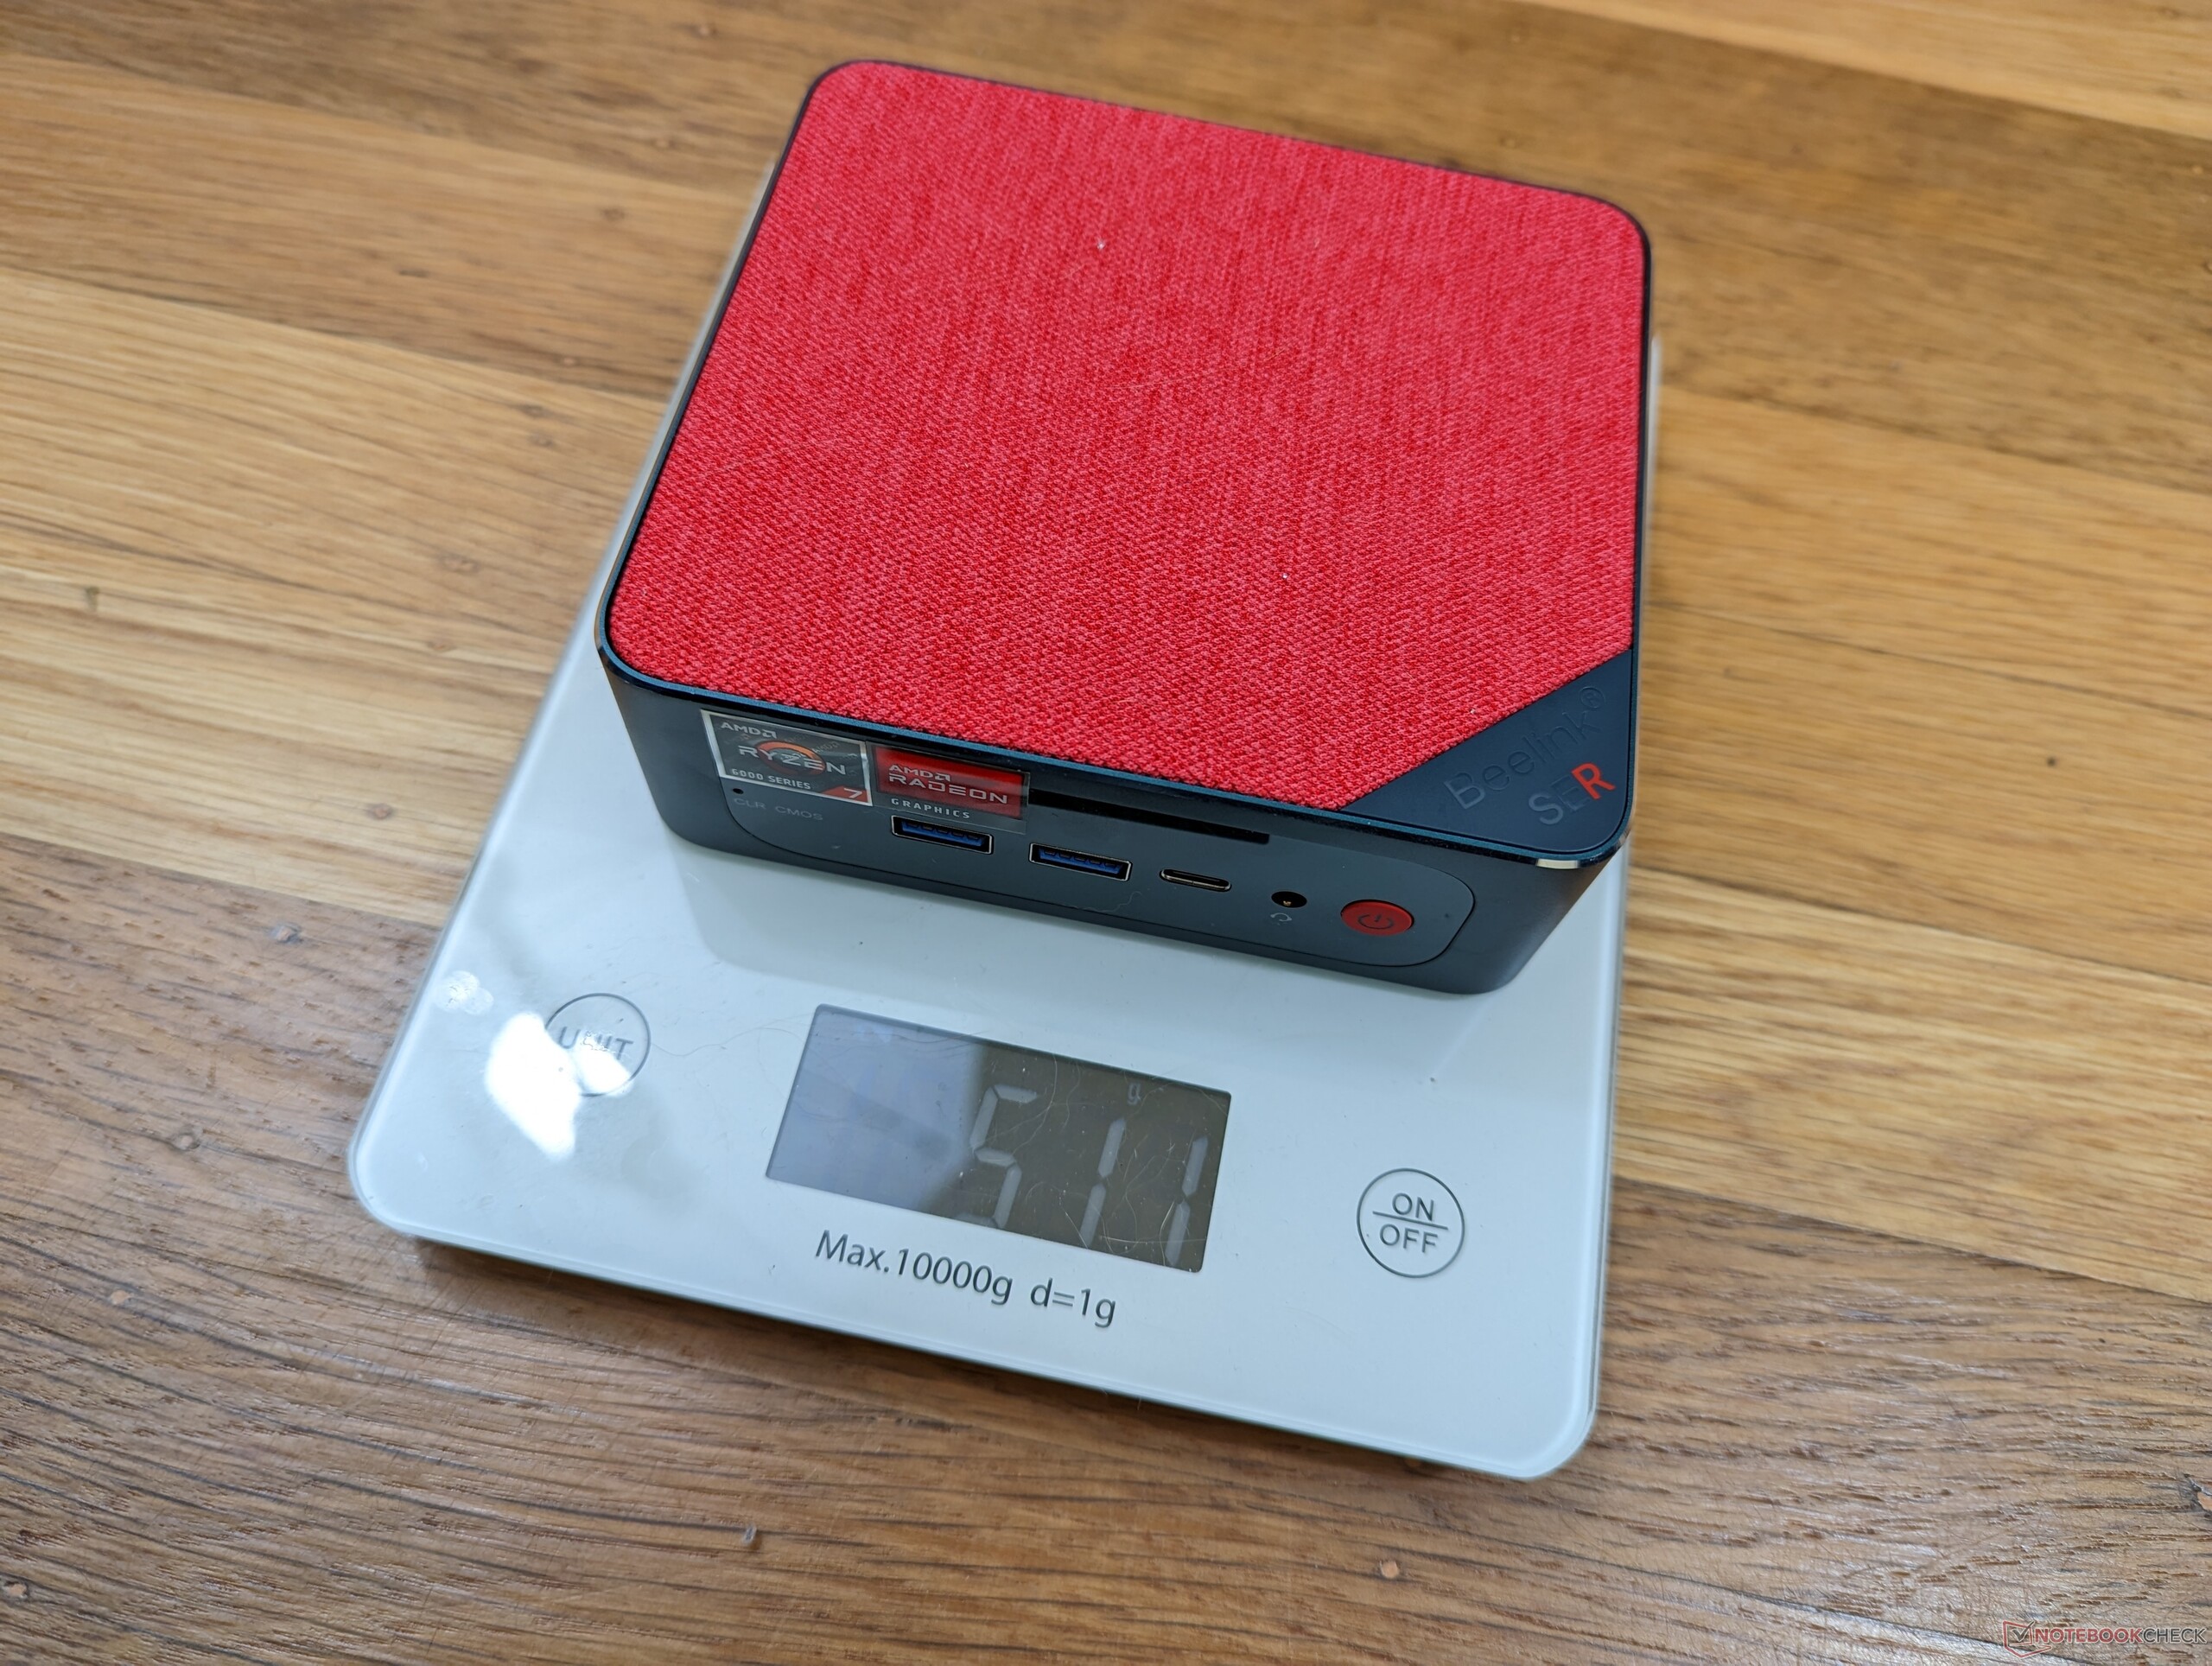
v (old) | 01/2023 | Beelink SER6 Pro R7 6800H, Radeon 680M | 511 gr | 42 mm | x | ||
v (old) | 11/2022 | Beelink GTR6 R9 6900HX, Radeon 680M | 815 gr | 43 mm | x | ||
v (old) | 09/2022 | Beelink SEi11 Pro i5-11320H, Iris Xe G7 96EUs | 440 gr | 40 mm | x | ||
| 78.9 % v7 (old) | 11/2022 | Intel NUC 12 Pro Kit NUC12WSKi7 i7-1260P, Iris Xe G7 96EUs | 511 gr | 37 mm | x | ||
v (old) | 04/2021 | Intel NUC11PHKi7C i7-1165G7, GeForce RTX 2060 Mobile | 1.4 kg | 42 mm | x | ||
v (old) | 04/2018 | Intel Hades Canyon NUC8i7HVK i7-8809G, Vega M GH | 1.3 kg | 39 mm | x |
Caso
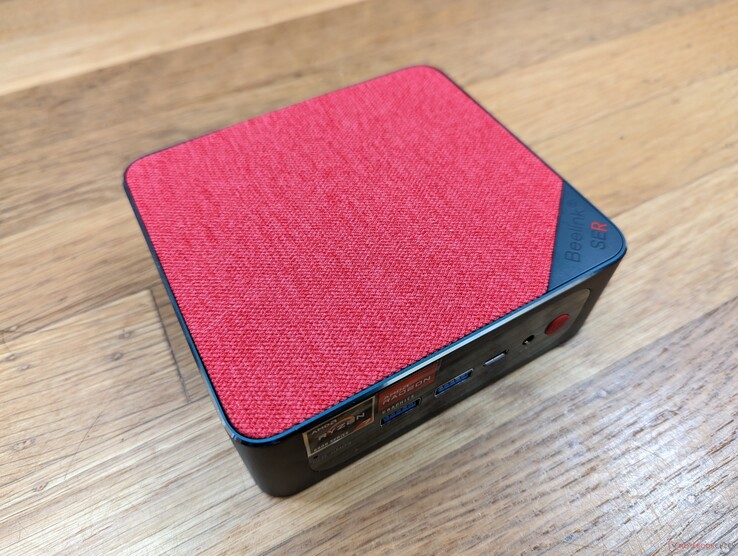
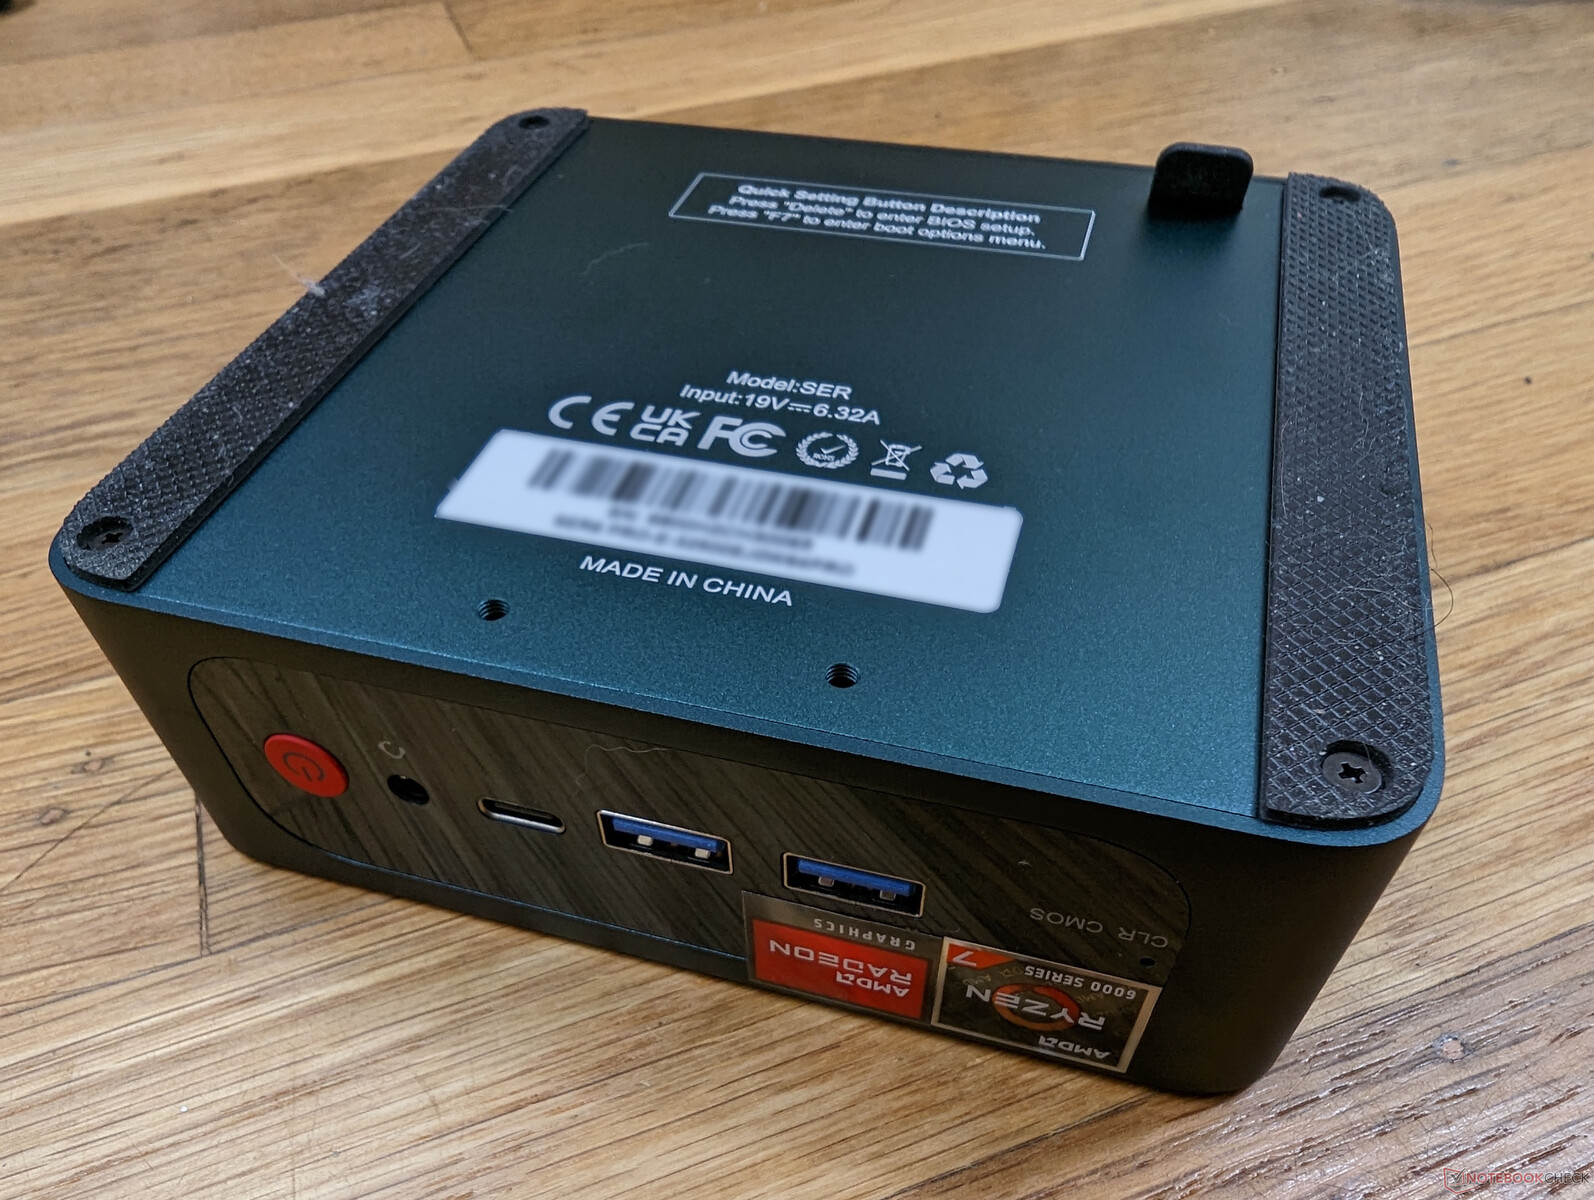
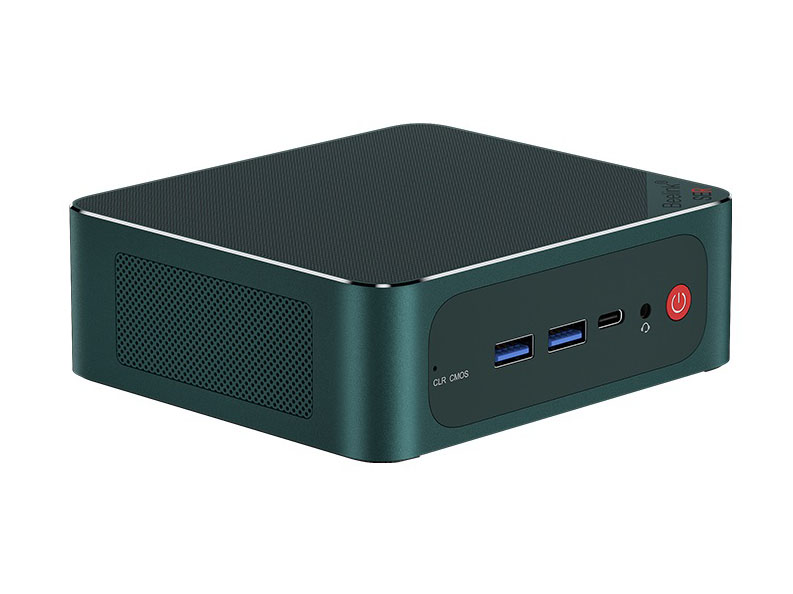
Il telaio è in metallo su tutti i lati, a parte il rivestimento superiore in tessuto rimovibile. Le dimensioni complessive sono molto simili a quelle delSEi11 Pro anche se leggermente più pesante a causa della revisione dei componenti interni. Sorprendentemente, il SER6 Pro pesa quanto il NUC 12 Pro anche se il NUC è più piccolo.
Connettività
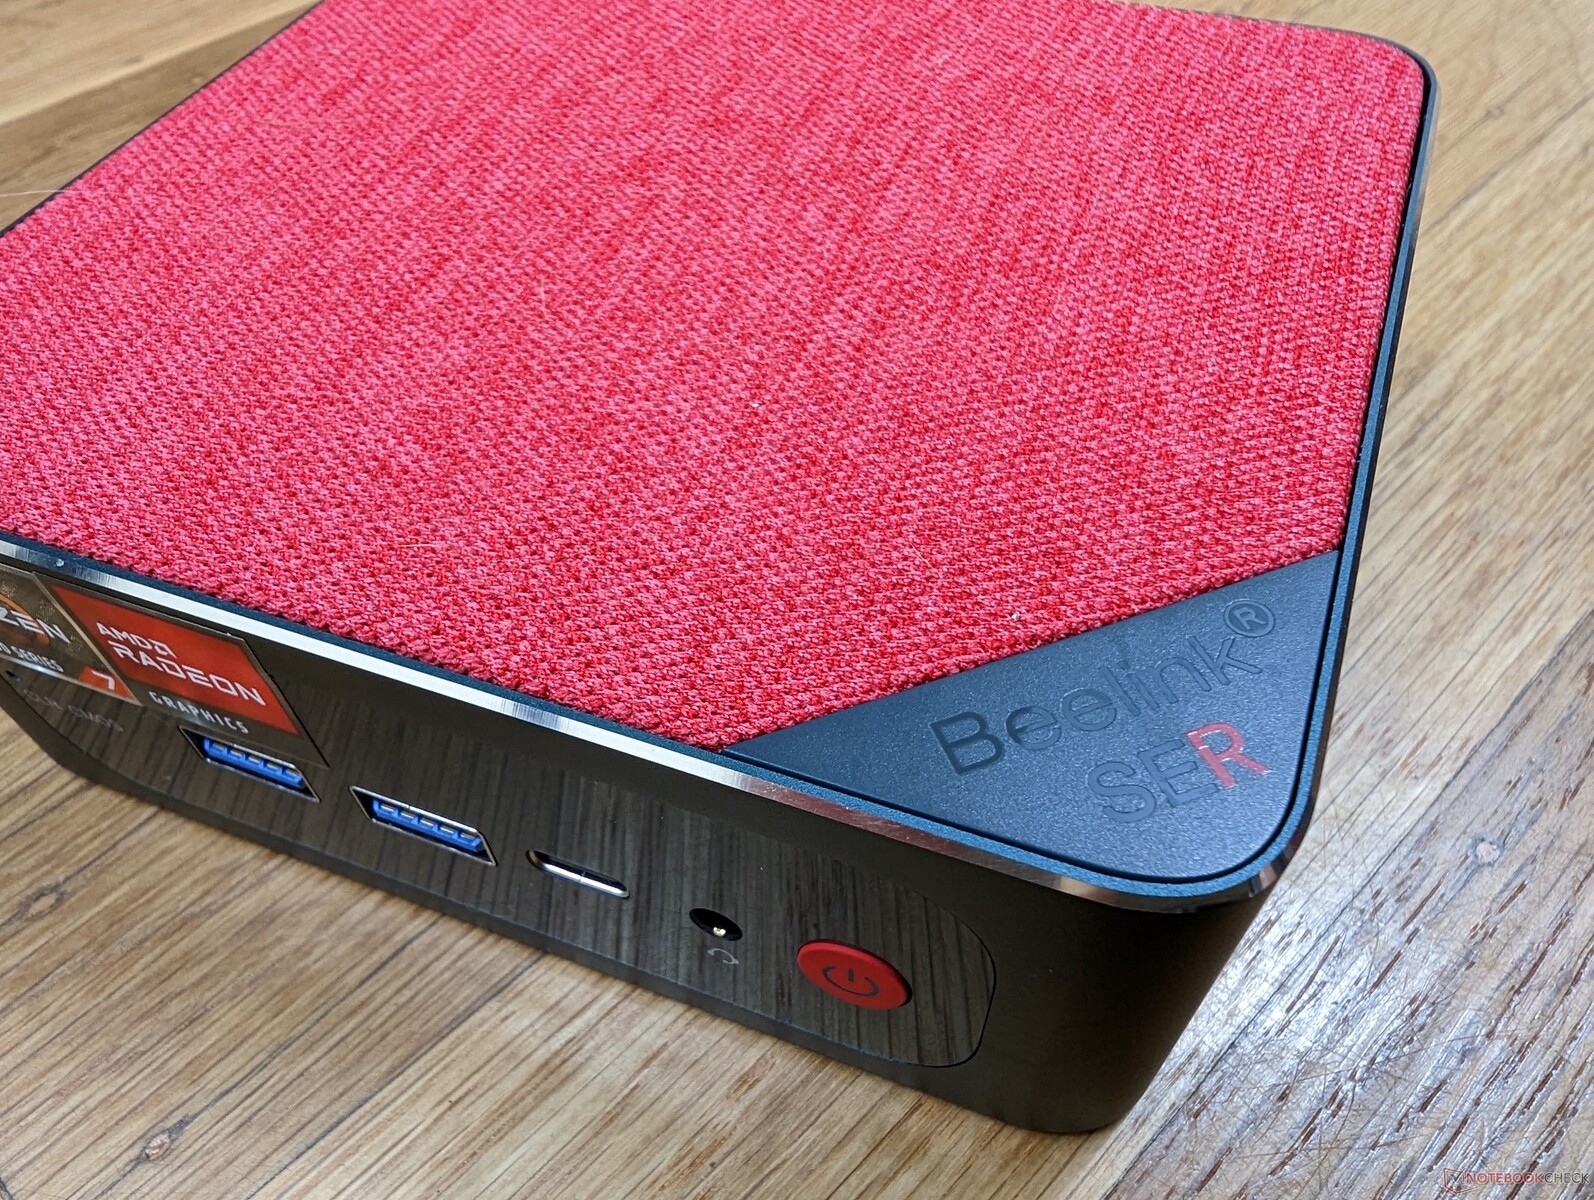
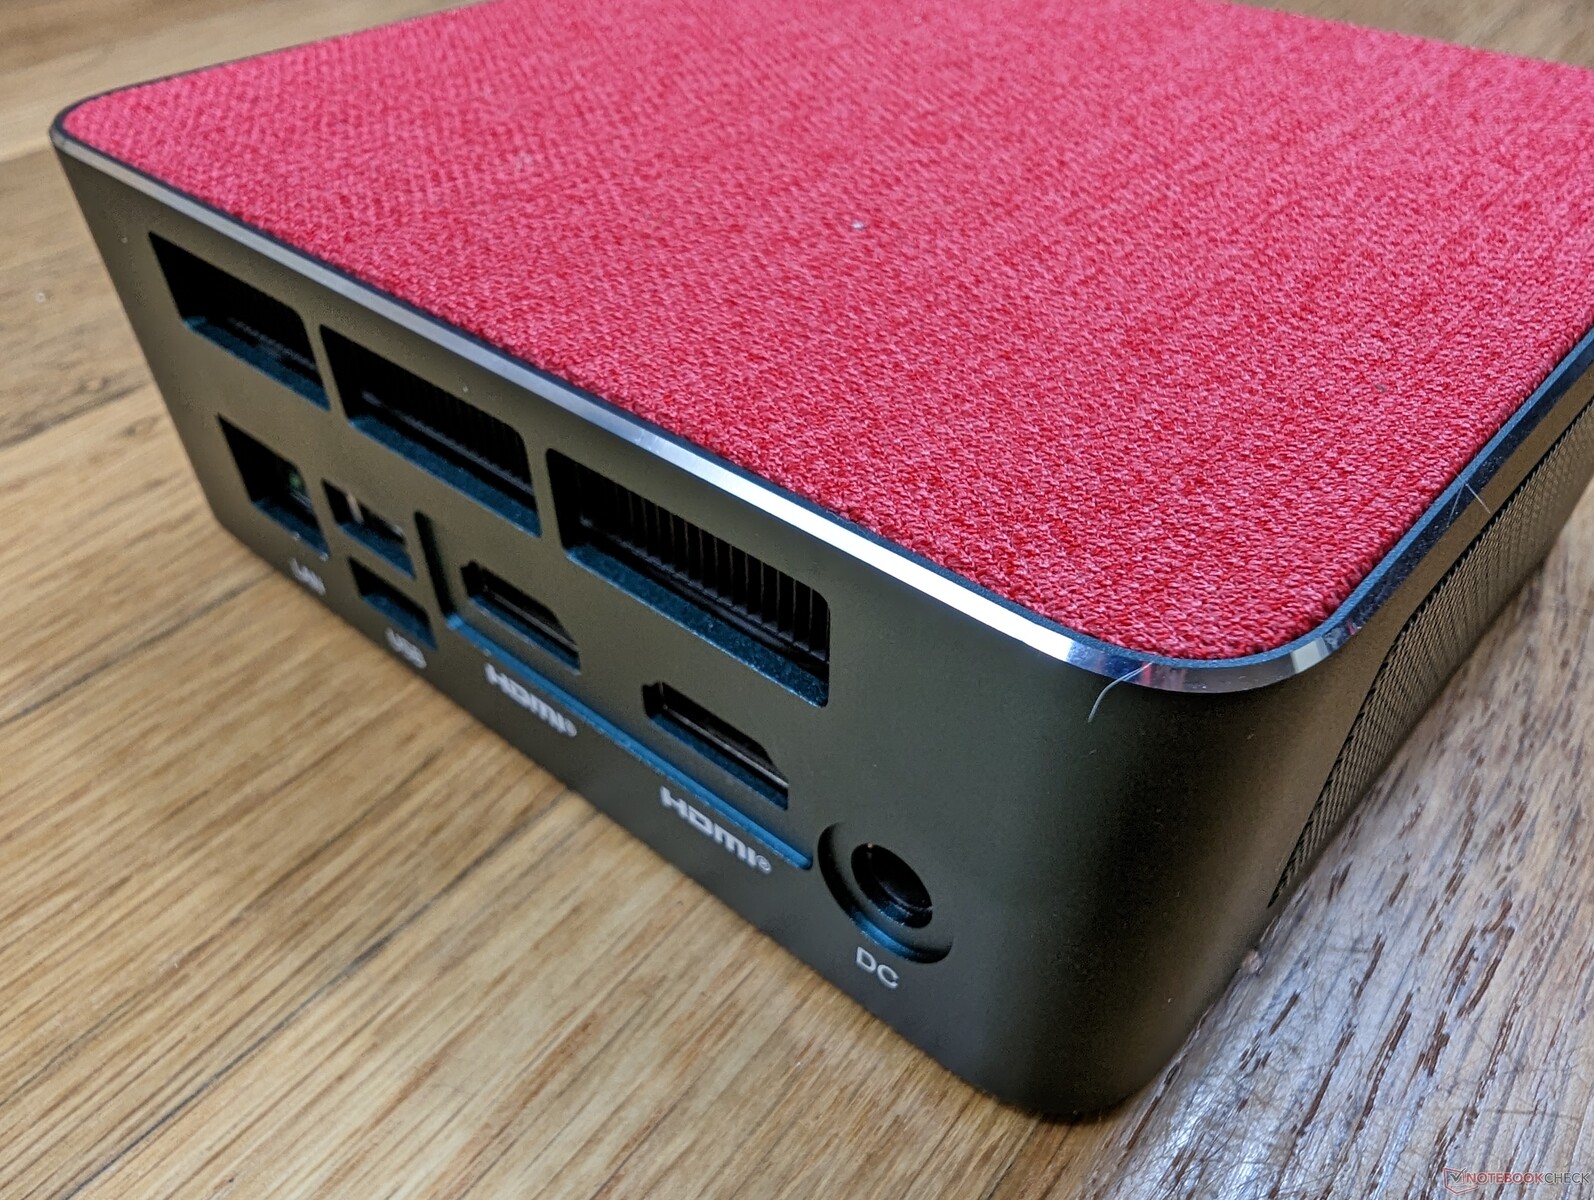
Le opzioni e il posizionamento delle porte sono identici a quelli del SER5 Pro, ma con un notevole aggiornamento: la porta RJ-45 ora supporta velocità di 2,5 Gbps invece di 1 Gbps. Il sistema può essere alimentato anche da adattatori CA USB-C di terze parti, nel caso in cui si dovesse perdere l'adattatore proprietario fornito nella confezione. Il nostro adattatore CA da 130 W fornito con il Dell XPS 17alimenta senza problemi il nostro SER6 Pro.
Comunicazione
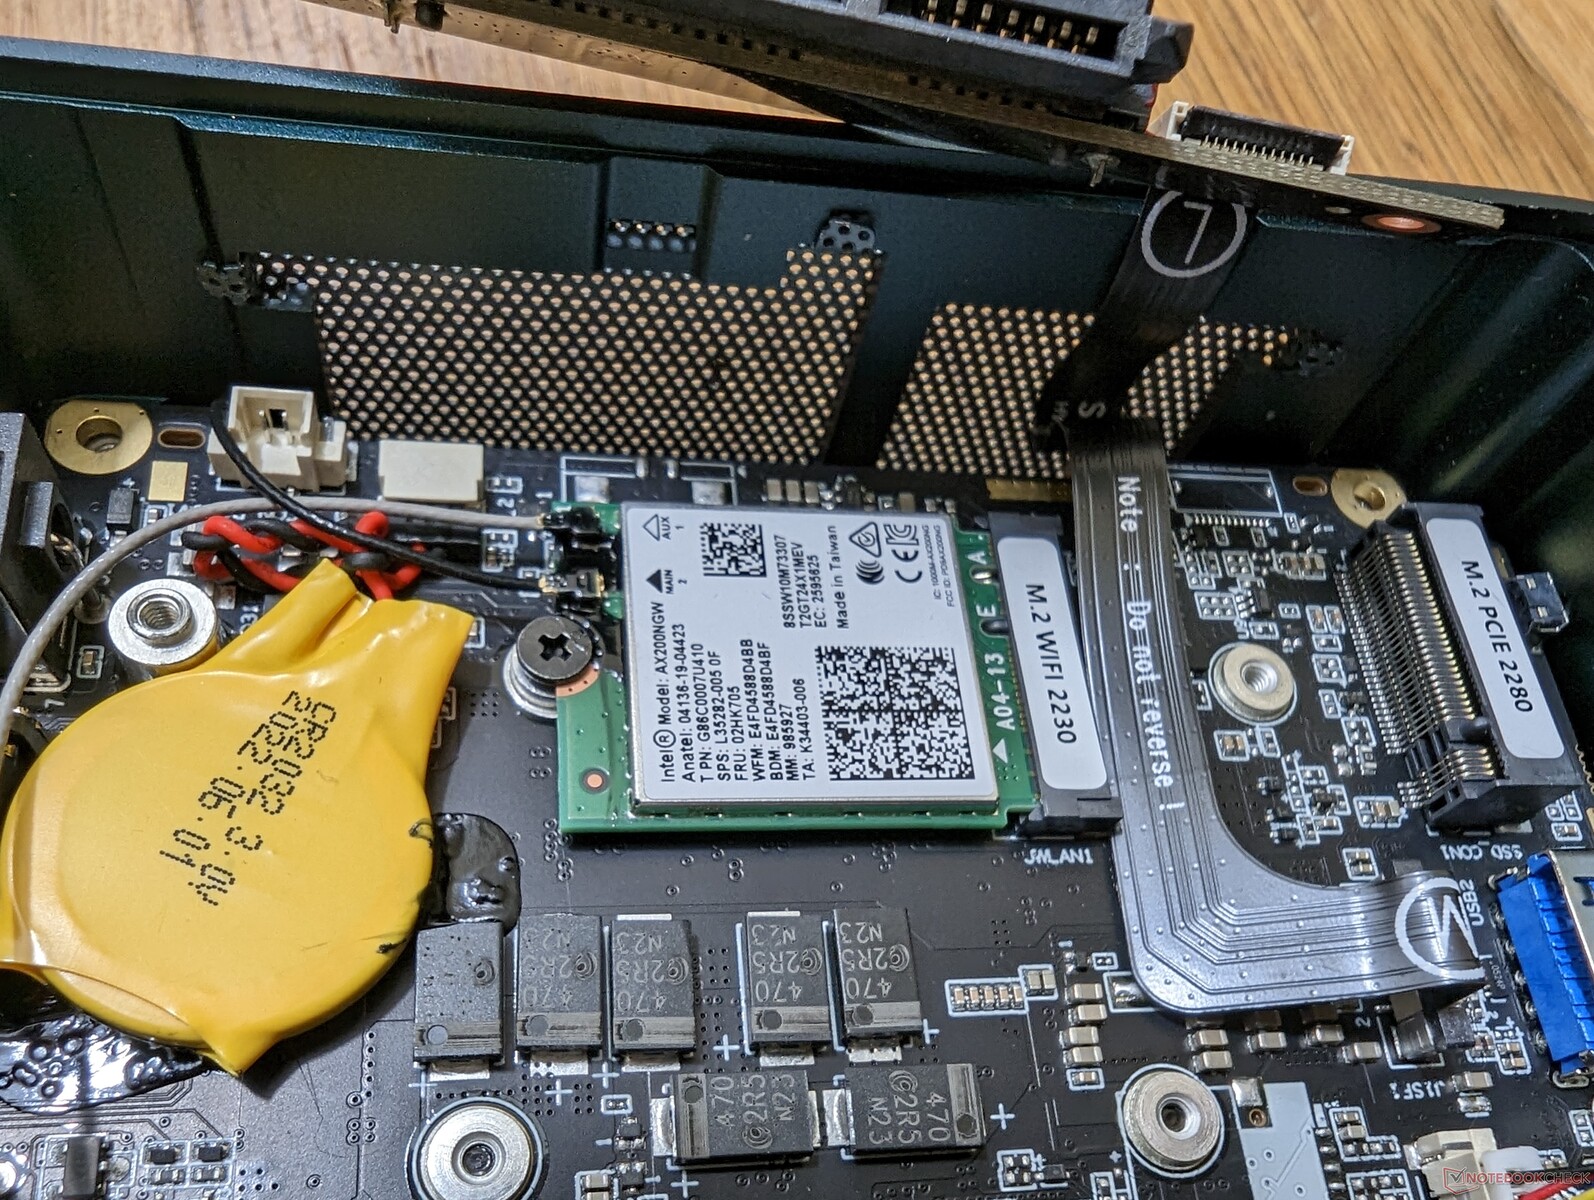
Beelink ha sostituito il MediaTek RZ608 del SER5 Pro con il più comune modulo Intel AX200. Questo particolare modulo Intel non dispone di funzionalità Wi-Fi 6E, ma le velocità di trasferimento sono comunque elevate, con una media di circa 1200 Mbps quando è stato abbinato al nostro router di prova Asus AXE11000.
| Networking | |
| iperf3 transmit AX12 | |
| Intel NUC11PHKi7C | |
| Intel Hades Canyon NUC8i7HVK | |
| iperf3 receive AX12 | |
| Intel NUC11PHKi7C | |
| Intel Hades Canyon NUC8i7HVK | |
| iperf3 receive AXE11000 6GHz | |
| Intel NUC 12 Pro Kit NUC12WSKi7 | |
| Beelink GTR6 | |
| Beelink SEi11 Pro | |
| iperf3 receive AXE11000 | |
| Beelink SER6 Pro | |
| Beelink GTR6 | |
| iperf3 transmit AXE11000 | |
| Beelink SER6 Pro | |
| Beelink GTR6 | |
| iperf3 transmit AXE11000 6GHz | |
| Beelink GTR6 | |
| Intel NUC 12 Pro Kit NUC12WSKi7 | |
| Beelink SEi11 Pro | |
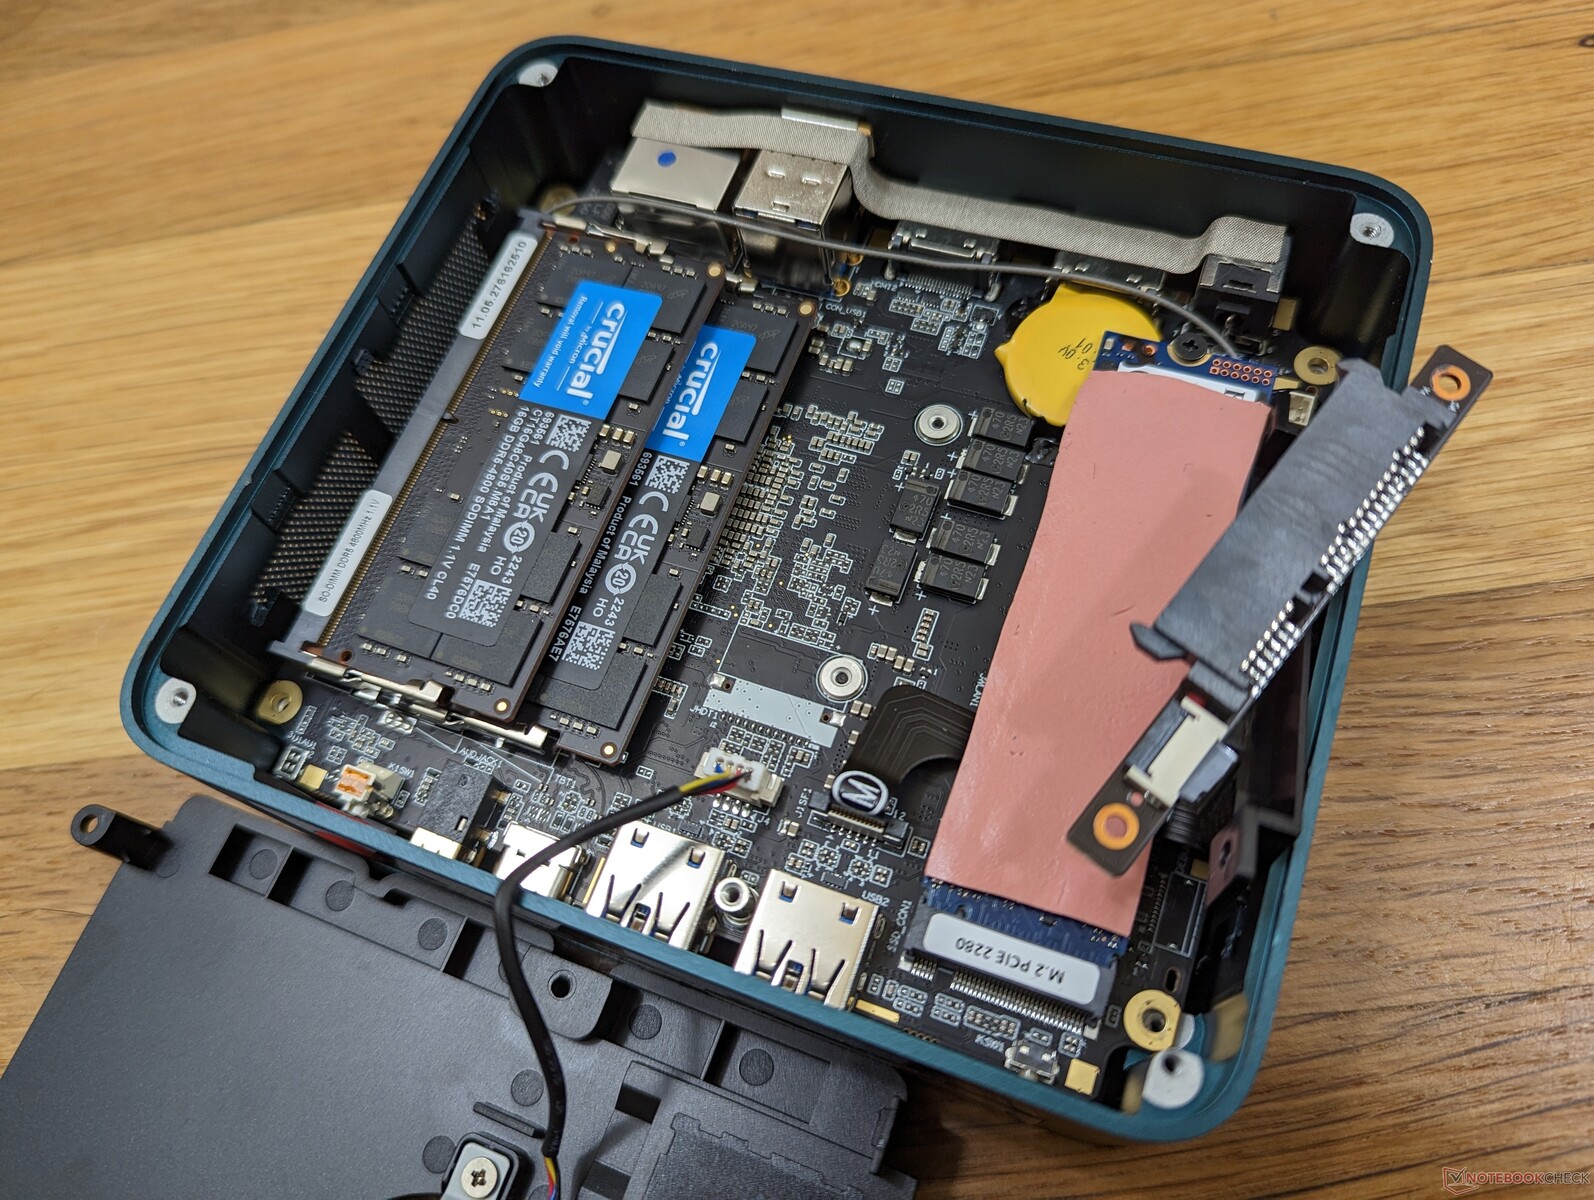
Manutenzione
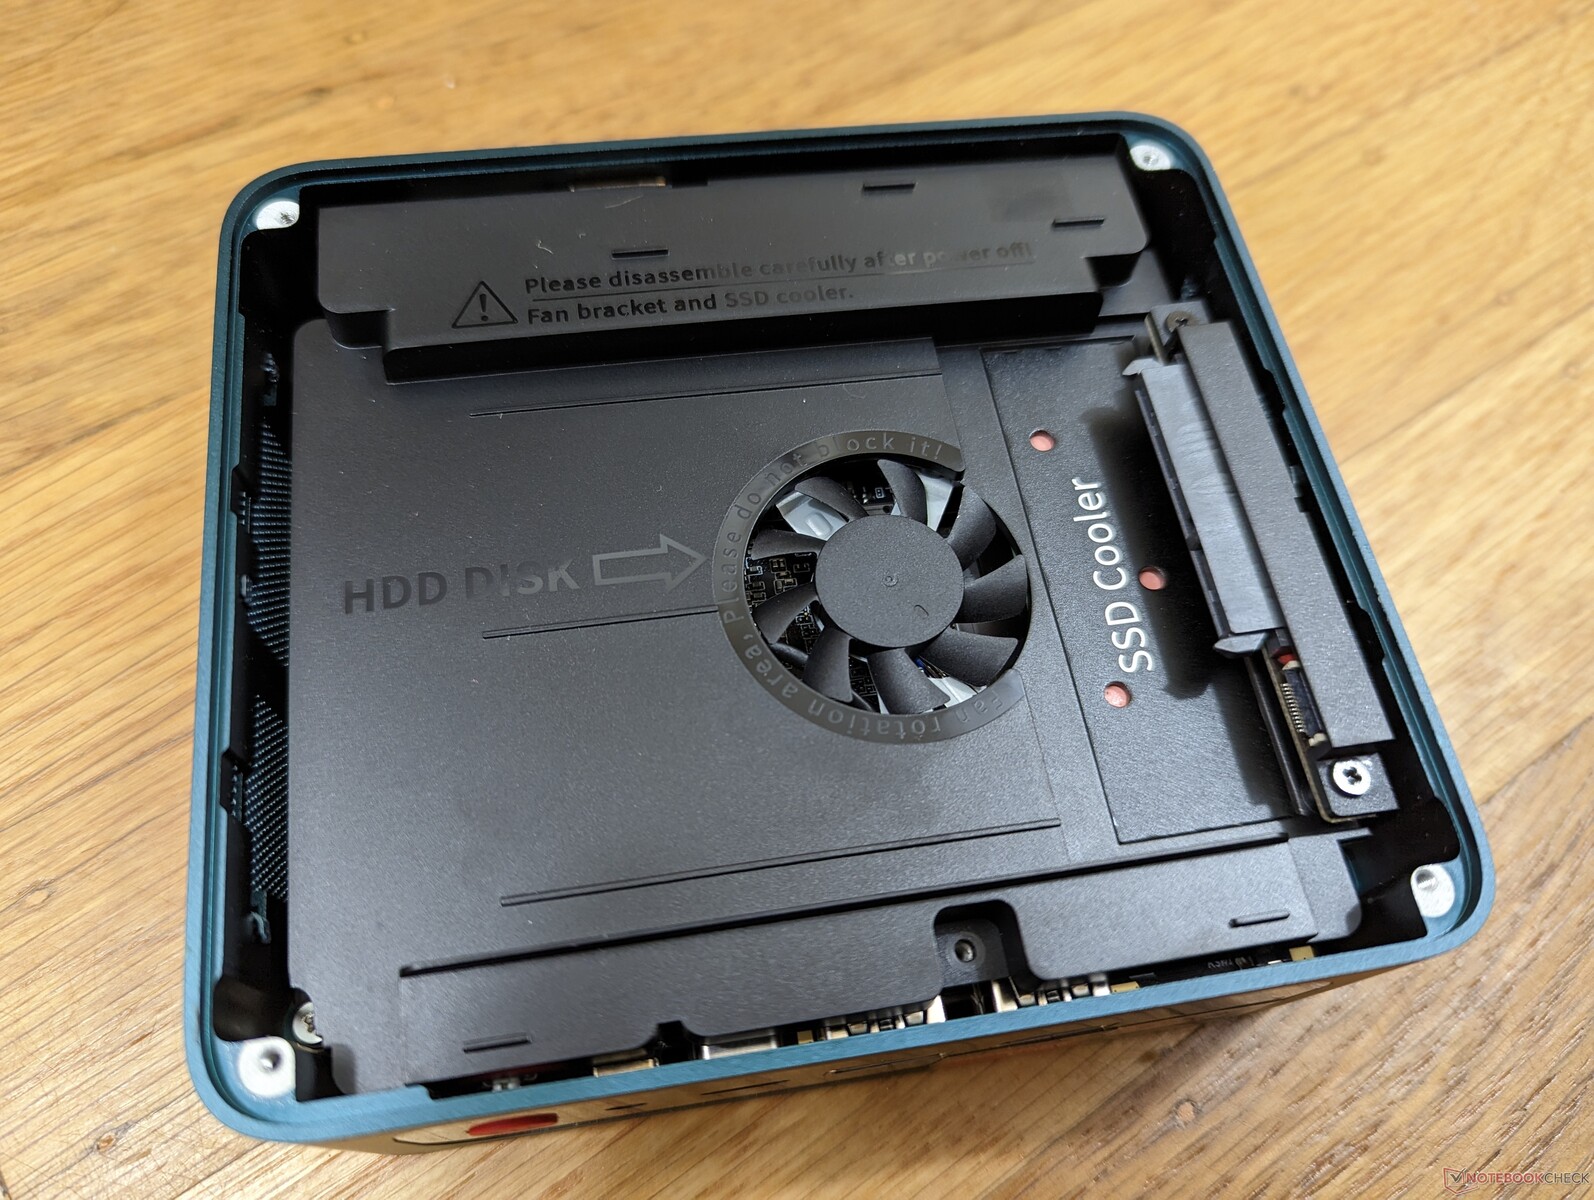
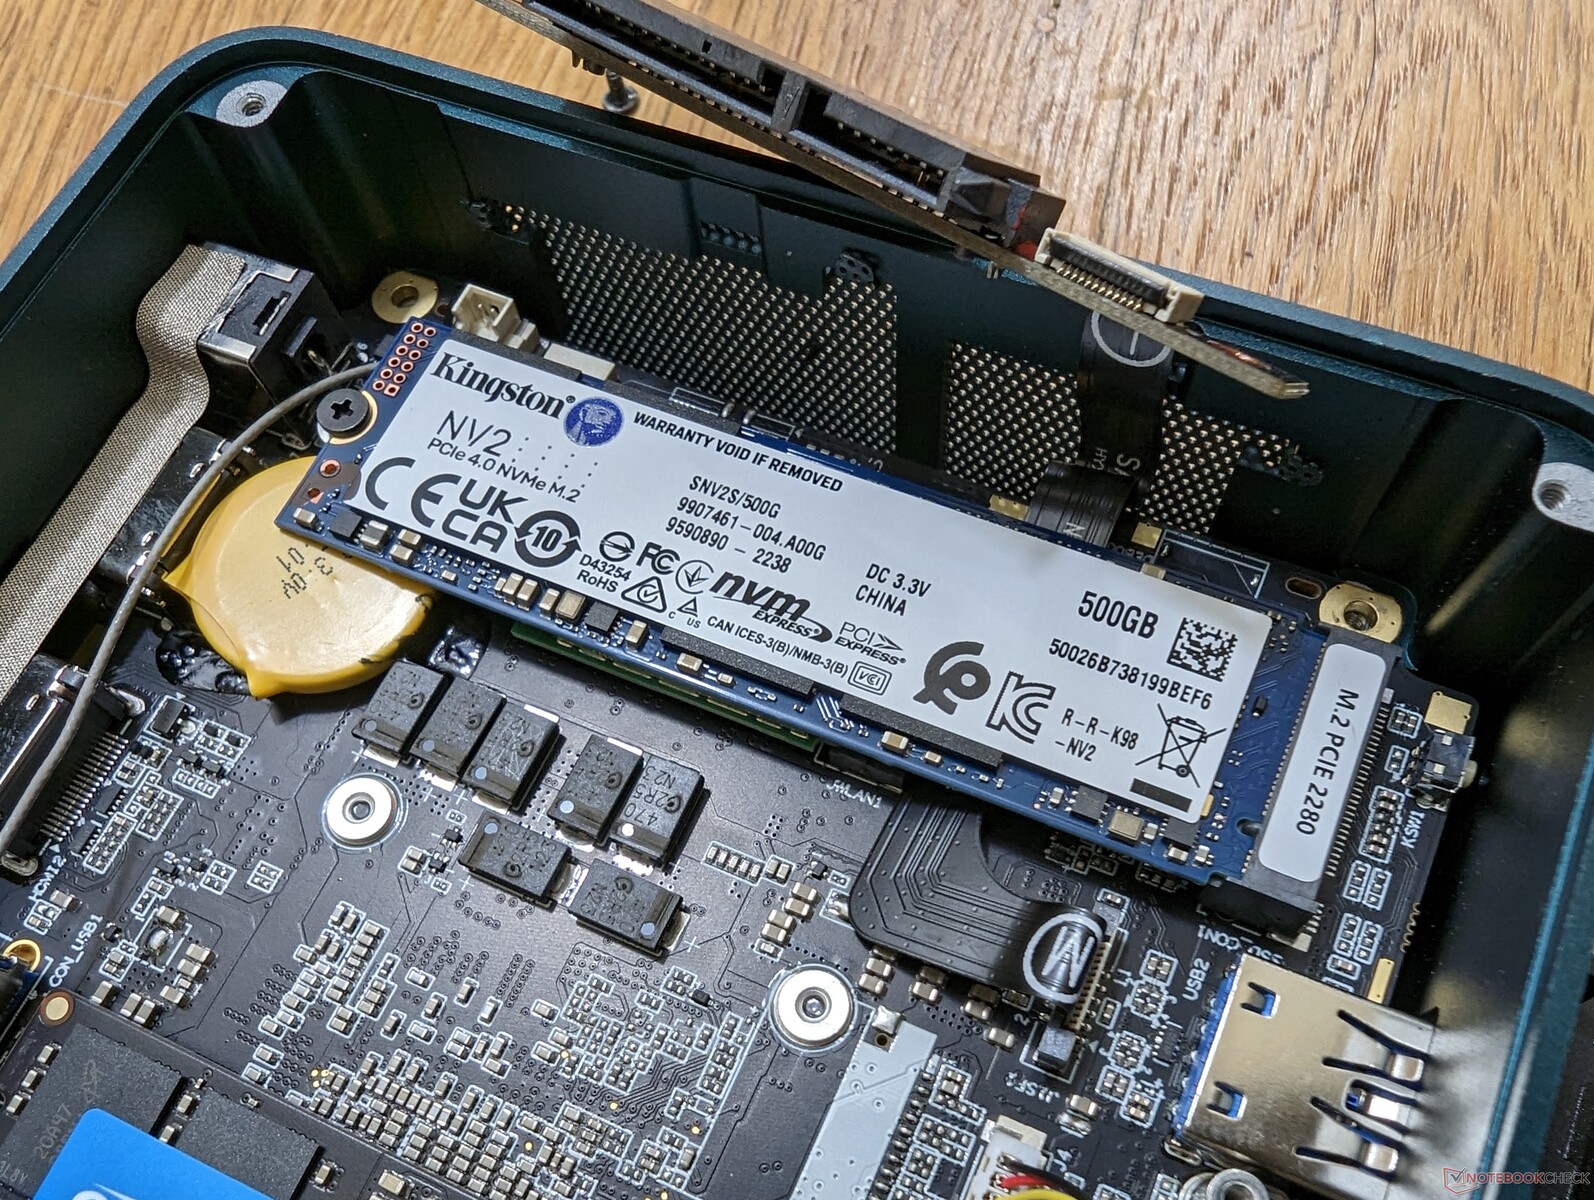
L'aggiornamento della RAM e dello storage è semplice e richiede solo un cacciavite Philips. Gli utenti possono installare fino a due moduli RAM SODIMM e due unità (1x M.2 PCIe4 x4 + 1x 2,5" SATA III).
Accessori e garanzia
La confezione include due cavi HDMI, una staffa di montaggio VESA rimovibile, coperture in tessuto nero e rosso, adattatore CA e documentazione. Se acquistato negli Stati Uniti, si applica la consueta garanzia limitata di un anno del produttore.
Prestazioni
Condizioni di test
Abbiamo impostato l'unità in modalità Performance prima di eseguire i benchmark riportati di seguito. Non ci sono applicazioni di tipo control center preinstallate.
Processore
Le prestazioni del processore sono quasi identiche a quelle della generazione precedente Ryzen 7 5800H. Le prestazioni a thread singolo possono essere fino al 5% più veloci, ma le differenze sono al massimo marginali. I maggiori miglioramenti tra le due CPU riguardano invece le loro GPU integrate, come dimostrerà la nostra sezione dedicata alla GPU.
Cinebench R15 Multi Loop
Cinebench R23: Multi Core | Single Core
Cinebench R15: CPU Multi 64Bit | CPU Single 64Bit
Blender: v2.79 BMW27 CPU
7-Zip 18.03: 7z b 4 | 7z b 4 -mmt1
Geekbench 5.5: Multi-Core | Single-Core
HWBOT x265 Benchmark v2.2: 4k Preset
LibreOffice : 20 Documents To PDF
R Benchmark 2.5: Overall mean
Cinebench R23: Multi Core | Single Core
Cinebench R15: CPU Multi 64Bit | CPU Single 64Bit
Blender: v2.79 BMW27 CPU
7-Zip 18.03: 7z b 4 | 7z b 4 -mmt1
Geekbench 5.5: Multi-Core | Single-Core
HWBOT x265 Benchmark v2.2: 4k Preset
LibreOffice : 20 Documents To PDF
R Benchmark 2.5: Overall mean
* ... Meglio usare valori piccoli
AIDA64: FP32 Ray-Trace | FPU Julia | CPU SHA3 | CPU Queen | FPU SinJulia | FPU Mandel | CPU AES | CPU ZLib | FP64 Ray-Trace | CPU PhotoWorxx
| Performance rating | |
| Media AMD Ryzen 7 6800H | |
| Beelink GTR6 | |
| Beelink SER6 Pro | |
| Intel NUC 12 Pro Kit NUC12WSKi7 | |
| Intel NUC11PHKi7C | |
| Beelink SEi11 Pro | |
| AIDA64 / FP32 Ray-Trace | |
| Media AMD Ryzen 7 6800H (12876 - 17031, n=8) | |
| Beelink GTR6 | |
| Beelink SER6 Pro | |
| Intel NUC 12 Pro Kit NUC12WSKi7 | |
| Intel NUC11PHKi7C | |
| Beelink SEi11 Pro | |
| AIDA64 / FPU Julia | |
| Media AMD Ryzen 7 6800H (82673 - 105987, n=8) | |
| Beelink GTR6 | |
| Beelink SER6 Pro | |
| Intel NUC 12 Pro Kit NUC12WSKi7 | |
| Intel NUC11PHKi7C | |
| Beelink SEi11 Pro | |
| AIDA64 / CPU SHA3 | |
| Media AMD Ryzen 7 6800H (2886 - 3634, n=8) | |
| Beelink GTR6 | |
| Beelink SER6 Pro | |
| Intel NUC 12 Pro Kit NUC12WSKi7 | |
| Intel NUC11PHKi7C | |
| Beelink SEi11 Pro | |
| AIDA64 / CPU Queen | |
| Media AMD Ryzen 7 6800H (75117 - 106322, n=8) | |
| Beelink GTR6 | |
| Beelink SER6 Pro | |
| Intel NUC 12 Pro Kit NUC12WSKi7 | |
| Intel NUC11PHKi7C | |
| Beelink SEi11 Pro | |
| AIDA64 / FPU SinJulia | |
| Media AMD Ryzen 7 6800H (11771 - 13120, n=8) | |
| Beelink GTR6 | |
| Beelink SER6 Pro | |
| Intel NUC 12 Pro Kit NUC12WSKi7 | |
| Intel NUC11PHKi7C | |
| Beelink SEi11 Pro | |
| AIDA64 / FPU Mandel | |
| Media AMD Ryzen 7 6800H (45287 - 58327, n=8) | |
| Beelink GTR6 | |
| Beelink SER6 Pro | |
| Intel NUC 12 Pro Kit NUC12WSKi7 | |
| Intel NUC11PHKi7C | |
| Beelink SEi11 Pro | |
| AIDA64 / CPU AES | |
| Beelink GTR6 | |
| Media AMD Ryzen 7 6800H (67816 - 137383, n=8) | |
| Beelink SER6 Pro | |
| Intel NUC 12 Pro Kit NUC12WSKi7 | |
| Intel NUC11PHKi7C | |
| Beelink SEi11 Pro | |
| AIDA64 / CPU ZLib | |
| Media AMD Ryzen 7 6800H (732 - 901, n=8) | |
| Beelink GTR6 | |
| Beelink SER6 Pro | |
| Intel NUC 12 Pro Kit NUC12WSKi7 | |
| Intel NUC11PHKi7C | |
| Beelink SEi11 Pro | |
| AIDA64 / FP64 Ray-Trace | |
| Media AMD Ryzen 7 6800H (6917 - 8980, n=8) | |
| Beelink GTR6 | |
| Beelink SER6 Pro | |
| Intel NUC 12 Pro Kit NUC12WSKi7 | |
| Intel NUC11PHKi7C | |
| Beelink SEi11 Pro | |
| AIDA64 / CPU PhotoWorxx | |
| Beelink GTR6 | |
| Beelink SER6 Pro | |
| Media AMD Ryzen 7 6800H (26496 - 30360, n=8) | |
| Intel NUC 12 Pro Kit NUC12WSKi7 | |
| Intel NUC11PHKi7C | |
| Beelink SEi11 Pro | |
Prestazioni del sistema
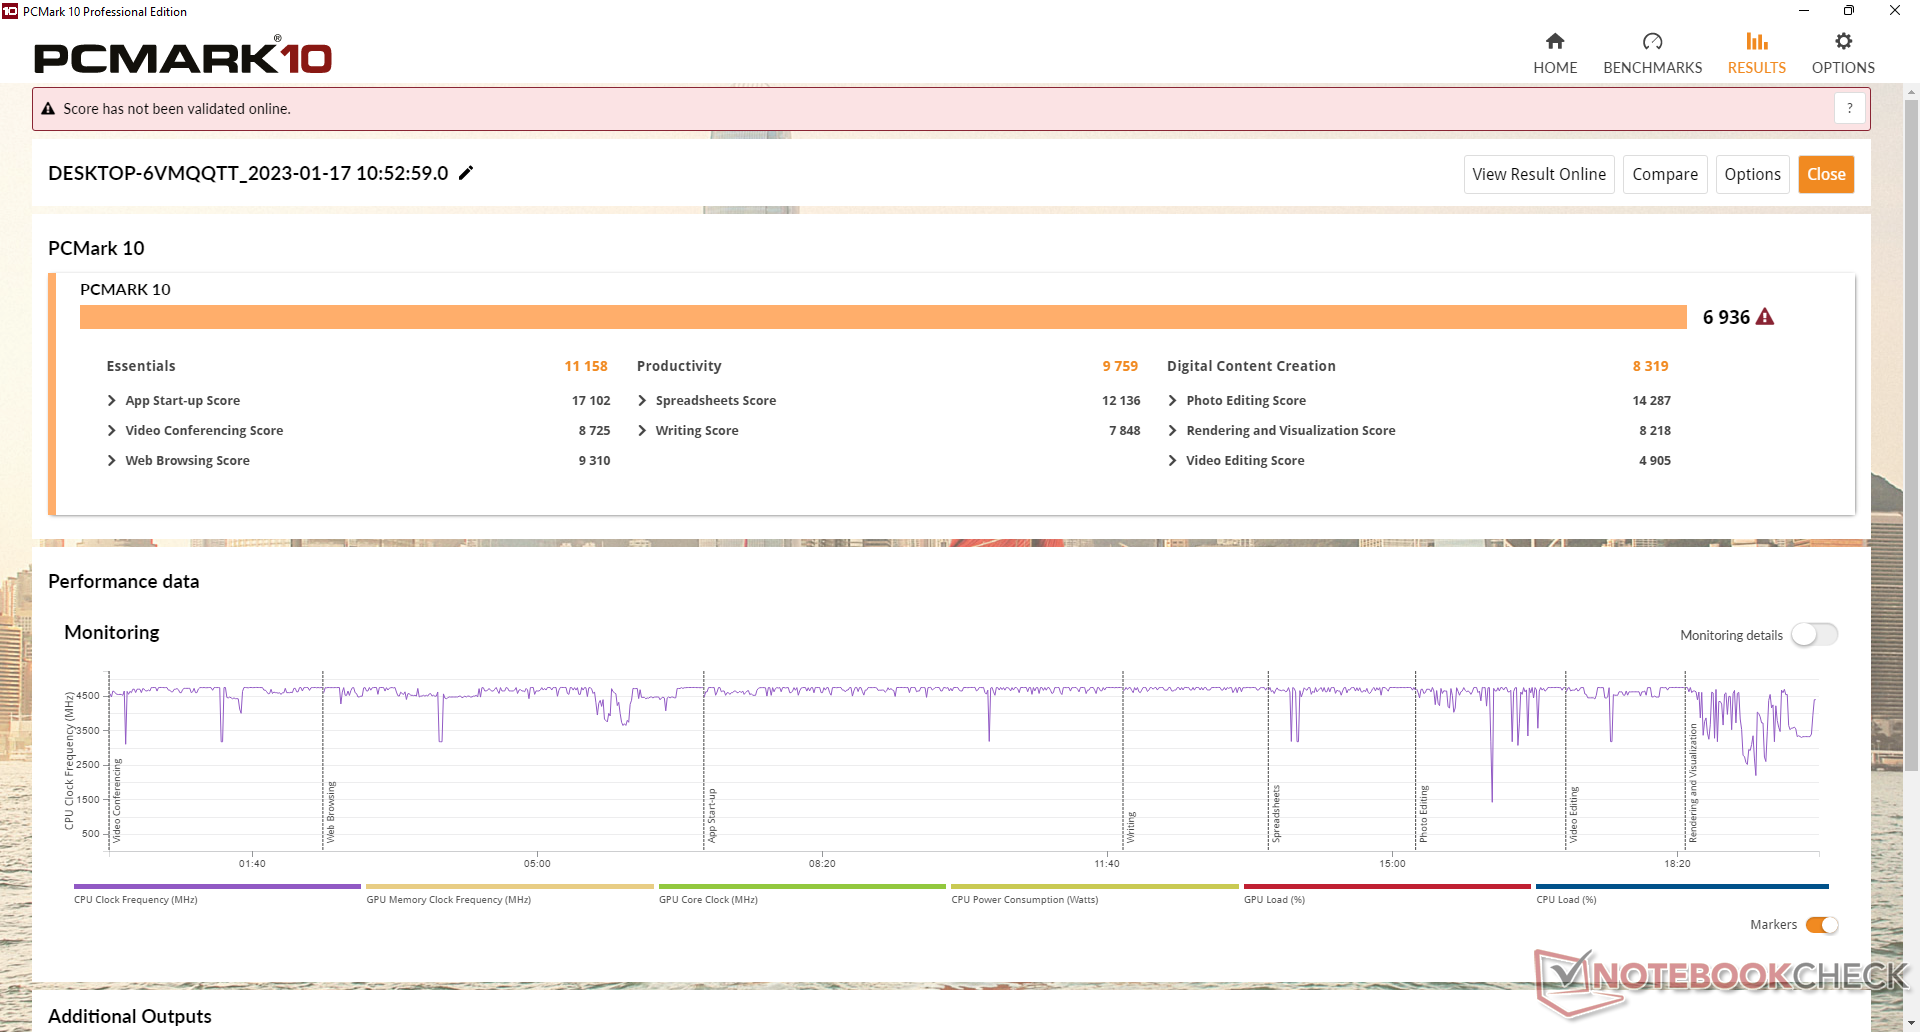
I risultati di PCMark sono tra i più alti per qualsiasi mini PC senza grafica dedicata. Gli alti punteggi sono attribuiti alla nuova Radeon 680M che rappresenta un salto sostanziale rispetto alla vecchia serie integrata Radeon RX Vega integrata o Serie Iris Xe.
CrossMark: Overall | Productivity | Creativity | Responsiveness
| PCMark 10 / Score | |
| Beelink GTR6 | |
| Beelink SER6 Pro | |
| Media AMD Ryzen 7 6800H, AMD Radeon 680M (6591 - 6936, n=4) | |
| Intel NUC11PHKi7C | |
| Intel NUC 12 Pro Kit NUC12WSKi7 | |
| Beelink SER Pro Ryzen 5 5600H | |
| Intel Hades Canyon NUC8i7HVK | |
| Beelink SEi11 Pro | |
| PCMark 10 / Essentials | |
| Beelink GTR6 | |
| Beelink SER6 Pro | |
| Intel NUC 12 Pro Kit NUC12WSKi7 | |
| Media AMD Ryzen 7 6800H, AMD Radeon 680M (10381 - 11158, n=4) | |
| Beelink SER Pro Ryzen 5 5600H | |
| Beelink SEi11 Pro | |
| Intel NUC11PHKi7C | |
| Intel Hades Canyon NUC8i7HVK | |
| PCMark 10 / Productivity | |
| Beelink GTR6 | |
| Beelink SER6 Pro | |
| Media AMD Ryzen 7 6800H, AMD Radeon 680M (9140 - 9759, n=4) | |
| Beelink SER Pro Ryzen 5 5600H | |
| Intel NUC11PHKi7C | |
| Intel Hades Canyon NUC8i7HVK | |
| Intel NUC 12 Pro Kit NUC12WSKi7 | |
| Beelink SEi11 Pro | |
| PCMark 10 / Digital Content Creation | |
| Beelink GTR6 | |
| Media AMD Ryzen 7 6800H, AMD Radeon 680M (8092 - 8485, n=4) | |
| Beelink SER6 Pro | |
| Intel NUC11PHKi7C | |
| Intel NUC 12 Pro Kit NUC12WSKi7 | |
| Beelink SER Pro Ryzen 5 5600H | |
| Intel Hades Canyon NUC8i7HVK | |
| Beelink SEi11 Pro | |
| CrossMark / Overall | |
| Beelink SER6 Pro | |
| Beelink GTR6 | |
| Intel NUC 12 Pro Kit NUC12WSKi7 | |
| Media AMD Ryzen 7 6800H, AMD Radeon 680M (1590 - 1704, n=3) | |
| Beelink SEi11 Pro | |
| Beelink SER Pro Ryzen 5 5600H | |
| CrossMark / Productivity | |
| Beelink GTR6 | |
| Beelink SER6 Pro | |
| Intel NUC 12 Pro Kit NUC12WSKi7 | |
| Media AMD Ryzen 7 6800H, AMD Radeon 680M (1566 - 1674, n=3) | |
| Beelink SEi11 Pro | |
| Beelink SER Pro Ryzen 5 5600H | |
| CrossMark / Creativity | |
| Intel NUC 12 Pro Kit NUC12WSKi7 | |
| Beelink SER6 Pro | |
| Media AMD Ryzen 7 6800H, AMD Radeon 680M (1696 - 1763, n=3) | |
| Beelink GTR6 | |
| Beelink SER Pro Ryzen 5 5600H | |
| Beelink SEi11 Pro | |
| CrossMark / Responsiveness | |
| Beelink GTR6 | |
| Beelink SER6 Pro | |
| Media AMD Ryzen 7 6800H, AMD Radeon 680M (1340 - 1625, n=3) | |
| Intel NUC 12 Pro Kit NUC12WSKi7 | |
| Beelink SEi11 Pro | |
| Beelink SER Pro Ryzen 5 5600H | |
| PCMark 10 Score | 6936 punti | |
Aiuto | ||
| AIDA64 / Memory Copy | |
| Beelink SER6 Pro | |
| Beelink GTR6 | |
| Media AMD Ryzen 7 6800H (48209 - 51186, n=8) | |
| Intel NUC 12 Pro Kit NUC12WSKi7 | |
| Beelink SEi11 Pro | |
| Intel NUC11PHKi7C | |
| AIDA64 / Memory Read | |
| Beelink GTR6 | |
| Beelink SER6 Pro | |
| Media AMD Ryzen 7 6800H (43828 - 51778, n=8) | |
| Intel NUC 12 Pro Kit NUC12WSKi7 | |
| Beelink SEi11 Pro | |
| Intel NUC11PHKi7C | |
| AIDA64 / Memory Write | |
| Beelink GTR6 | |
| Beelink SER6 Pro | |
| Media AMD Ryzen 7 6800H (51116 - 55307, n=8) | |
| Beelink SEi11 Pro | |
| Intel NUC 12 Pro Kit NUC12WSKi7 | |
| Intel NUC11PHKi7C | |
| AIDA64 / Memory Latency | |
| Intel NUC 12 Pro Kit NUC12WSKi7 | |
| Intel NUC11PHKi7C | |
| Media AMD Ryzen 7 6800H (83.1 - 104.1, n=8) | |
| Beelink SER6 Pro | |
| Beelink GTR6 | |
| Beelink SEi11 Pro | |
* ... Meglio usare valori piccoli
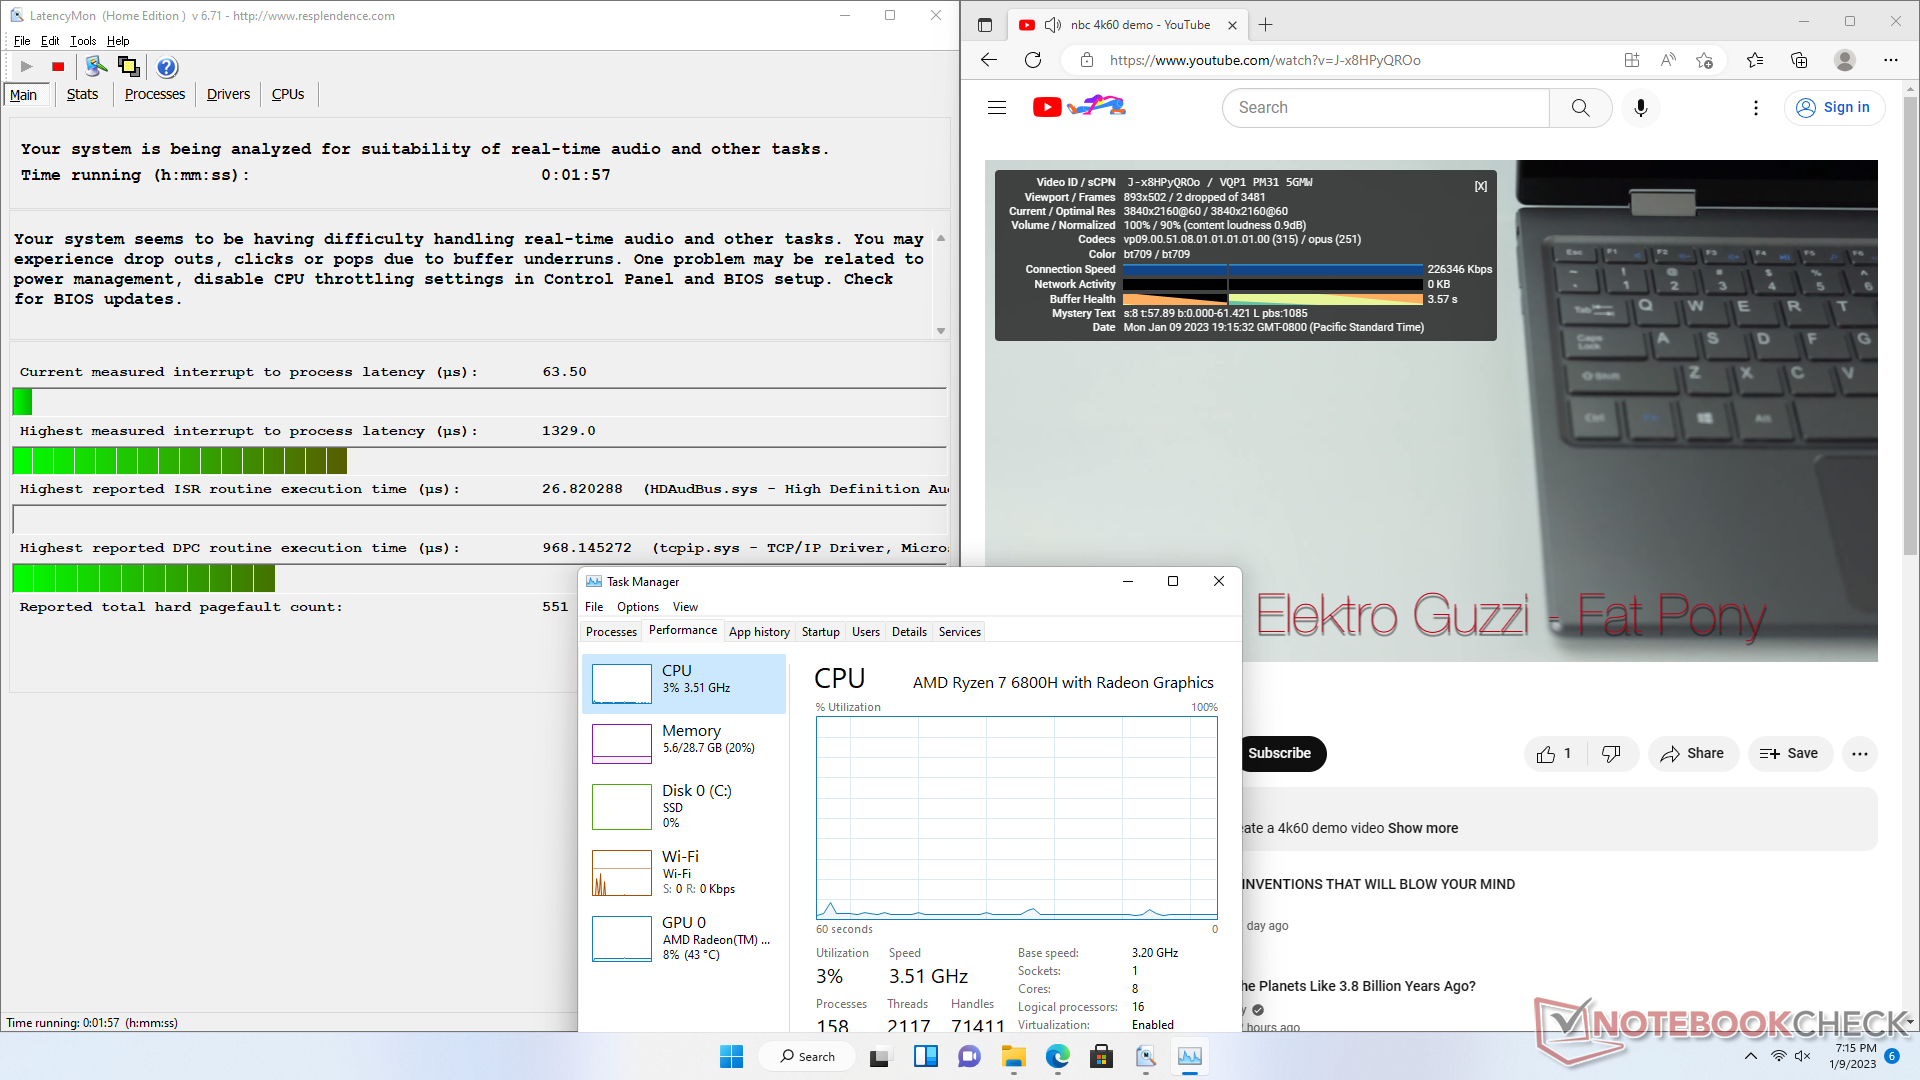
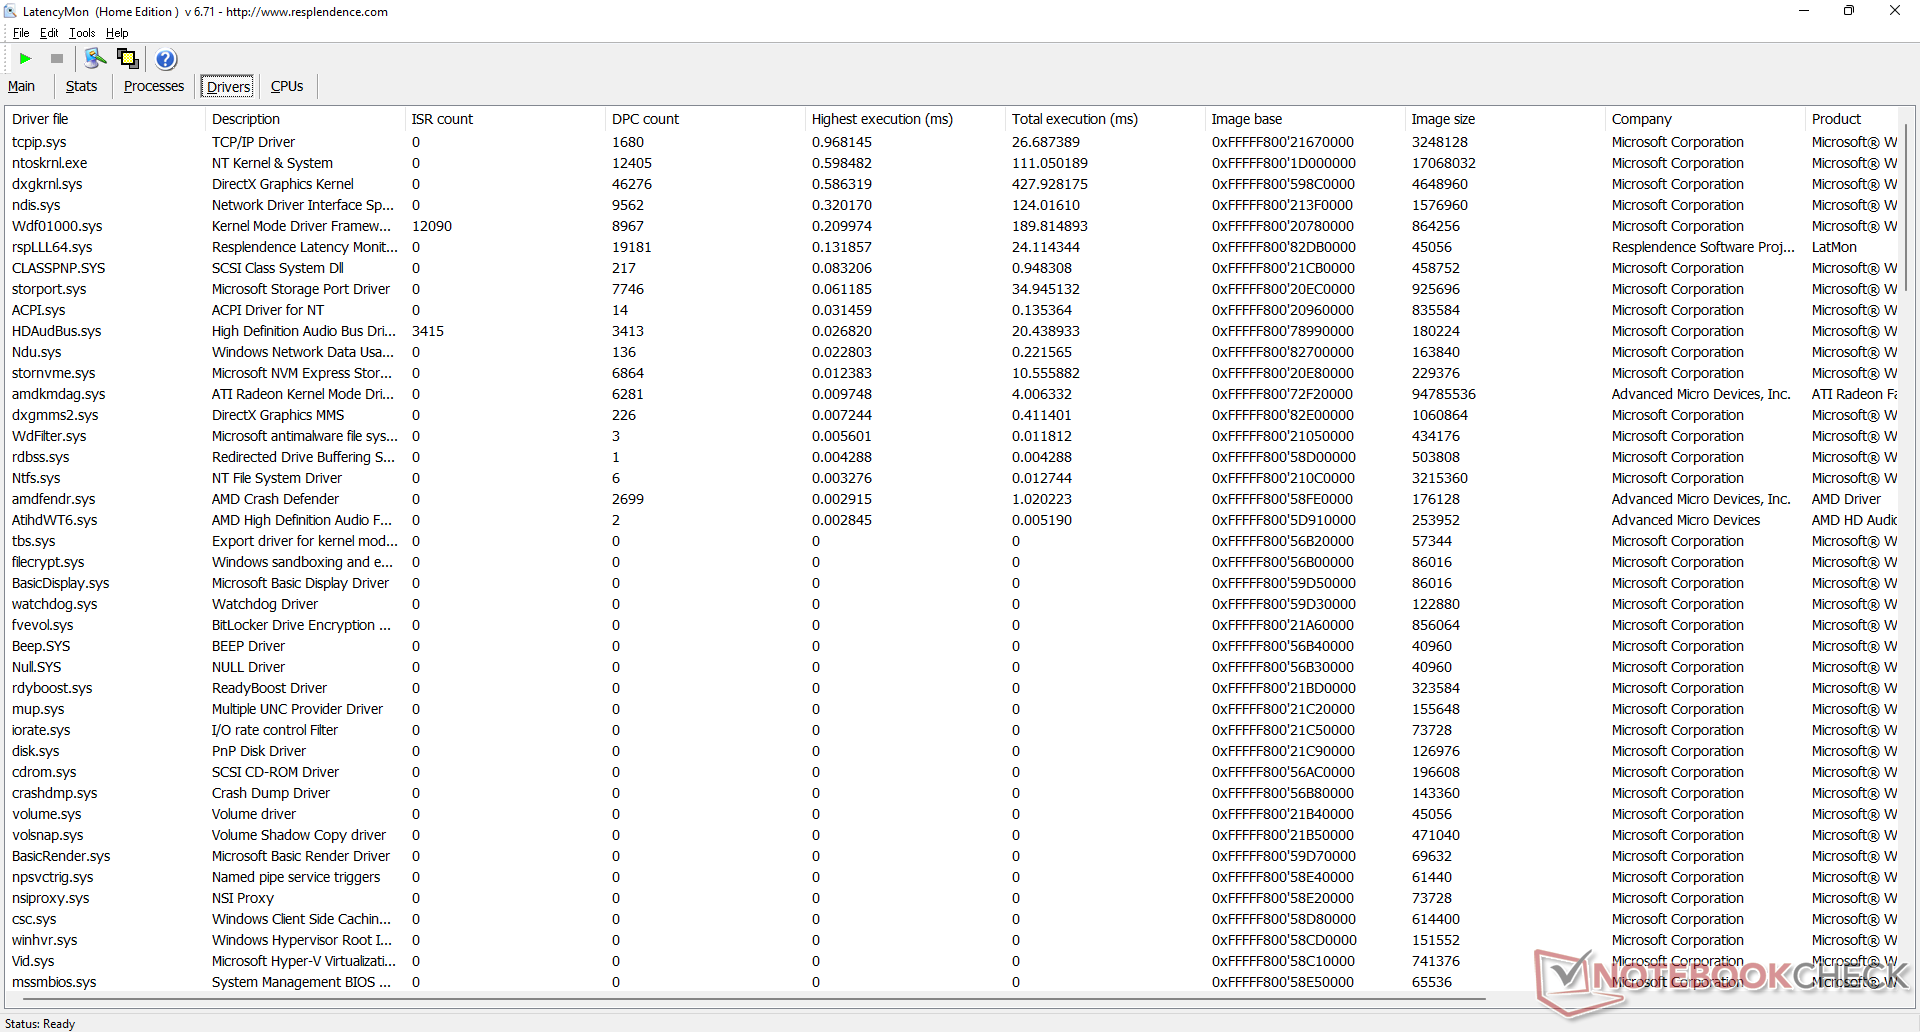
Latenza DPC
LatencyMon rivela problemi di DPC quando si aprono più schede del browser della nostra homepage. la riproduzione di video 4K a 60 FPS è invece fluida, con due sole cadute di fotogrammi durante il nostro video di prova di un minuto.
| DPC Latencies / LatencyMon - interrupt to process latency (max), Web, Youtube, Prime95 | |
| Beelink SER6 Pro | |
| Intel NUC11PHKi7C | |
| Intel NUC 12 Pro Kit NUC12WSKi7 | |
| Beelink GTR6 | |
| Beelink SEi11 Pro | |
* ... Meglio usare valori piccoli
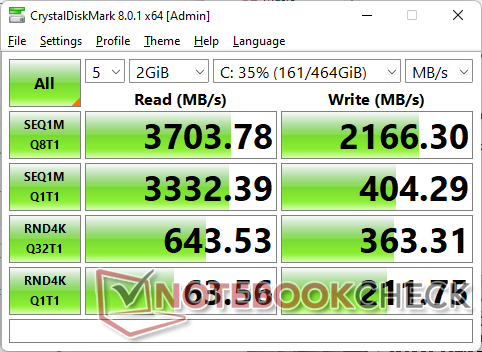
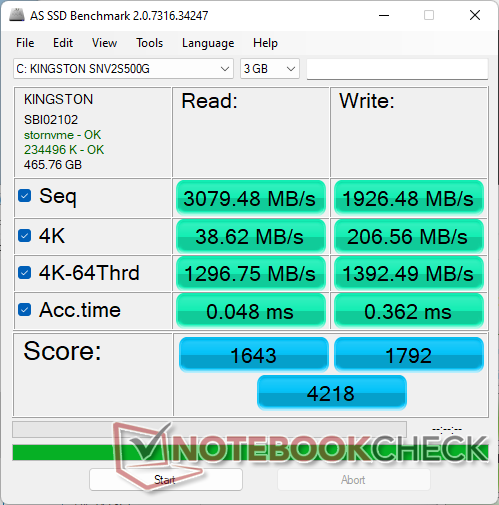
Dispositivi di archiviazione
il Kingston SNV2S L'unità SSD PCIe4 x4 di Kingston nella nostra unità è un drive NVMe di fascia media con velocità di lettura sequenziale e velocità di circa 3700 MB/s e 2200 MB/s, rispettivamente, rispetto ai 5000 MB/s o più di alternative come il Samsung PM9A1. L'unità entra in contatto con una piastra metallica interna sotto lo slot SATA III da 2,5 pollici per la dissipazione del calore.

| Drive Performance rating - Percent | |
| Beelink GTR6 | |
| Beelink SER6 Pro | |
| Intel Hades Canyon NUC8i7HVK -8! | |
| Intel NUC11PHKi7C | |
| Beelink SEi11 Pro | |
| Intel NUC 12 Pro Kit NUC12WSKi7 | |
* ... Meglio usare valori piccoli
Disk Throttling: DiskSpd Read Loop, Queue Depth 8
Prestazioni della GPU
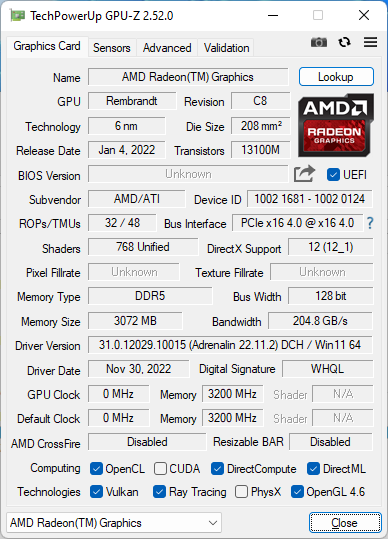
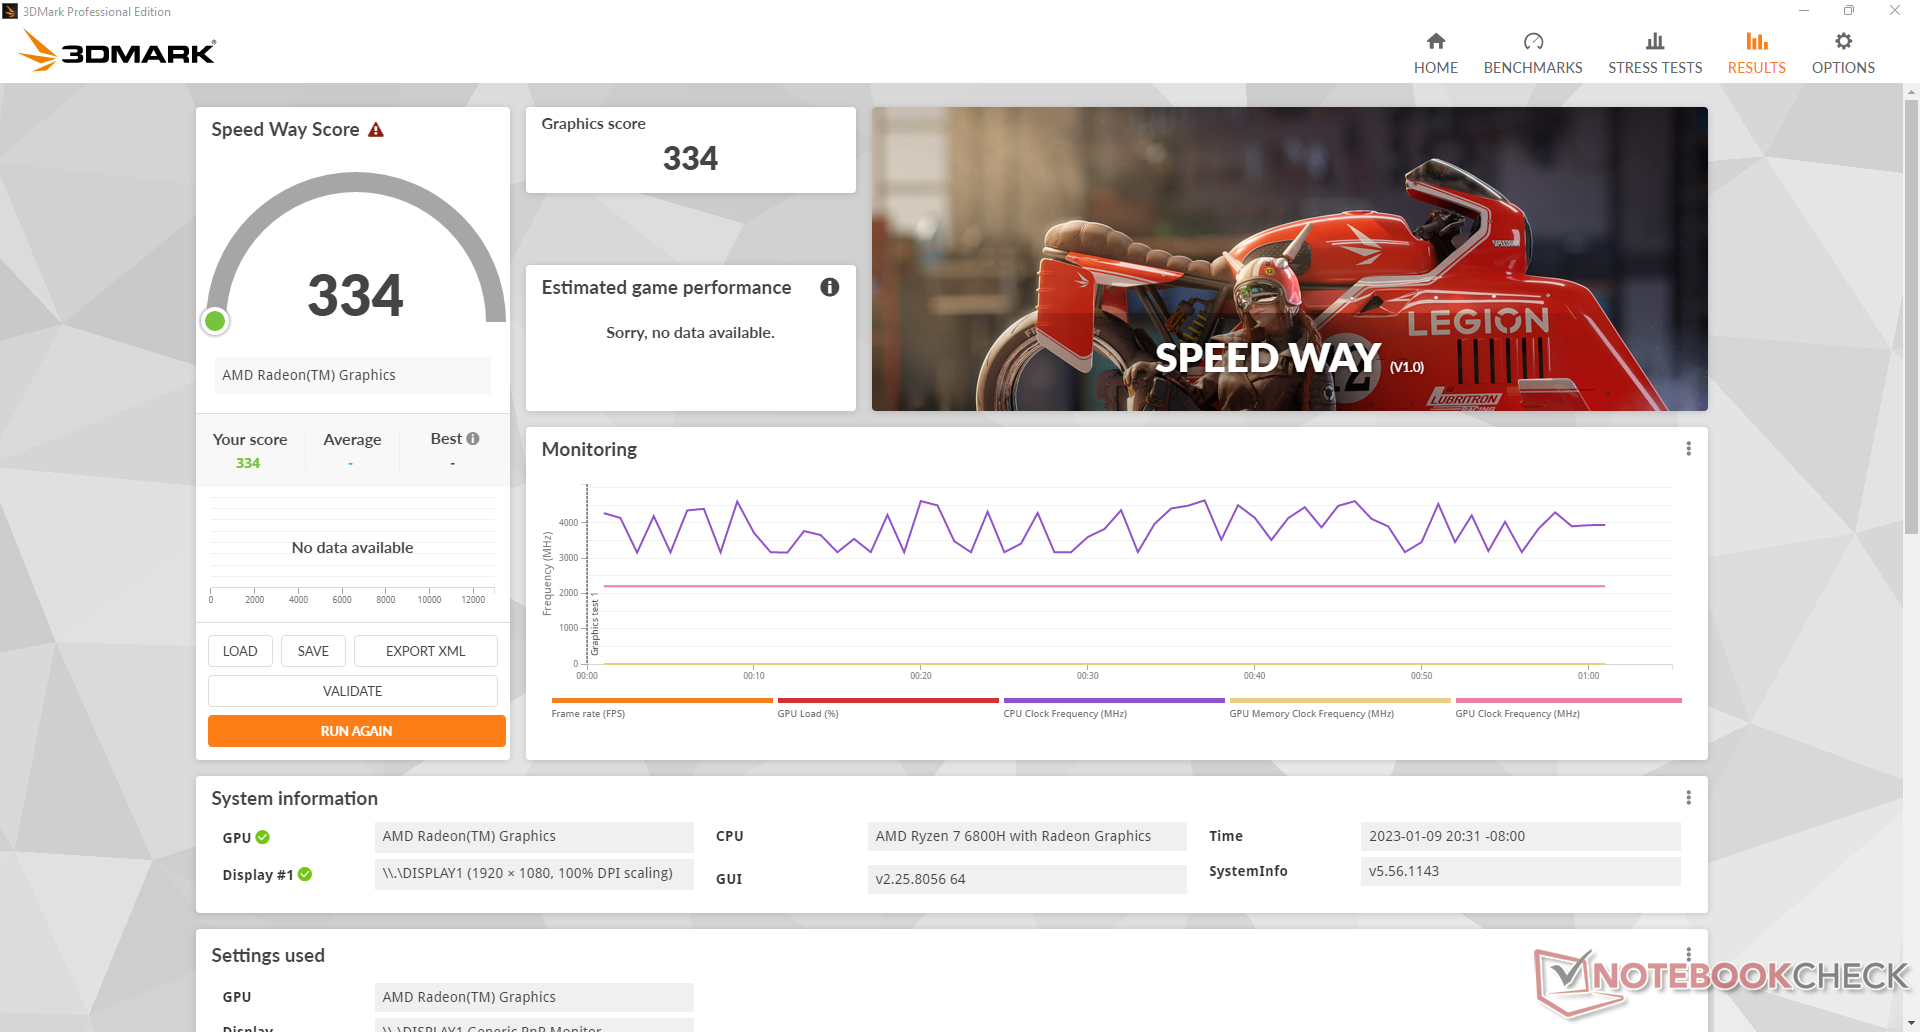
La scheda integrata Radeon 680M integrata è un aggiornamento significativo rispetto alla precedente generazione di Radeon RX Vega 7 o Vega 8, presenti rispettivamente su Ryzen 5 5600H o Ryzen 7 5800H. Le prestazioni grezze sono più veloci del 70-100%, per un'esperienza di gioco sensibilmente migliore. Questo non significa che il SER6 Pro sia una macchina da gioco, in quanto è ancora due volte più lento di un laptop dotato di GeForce Laptop con RTX 2060ma ha comunque una potenza sufficiente per eseguire comodamente la maggior parte dei giochi a 1080p con impostazioni medio-basse.
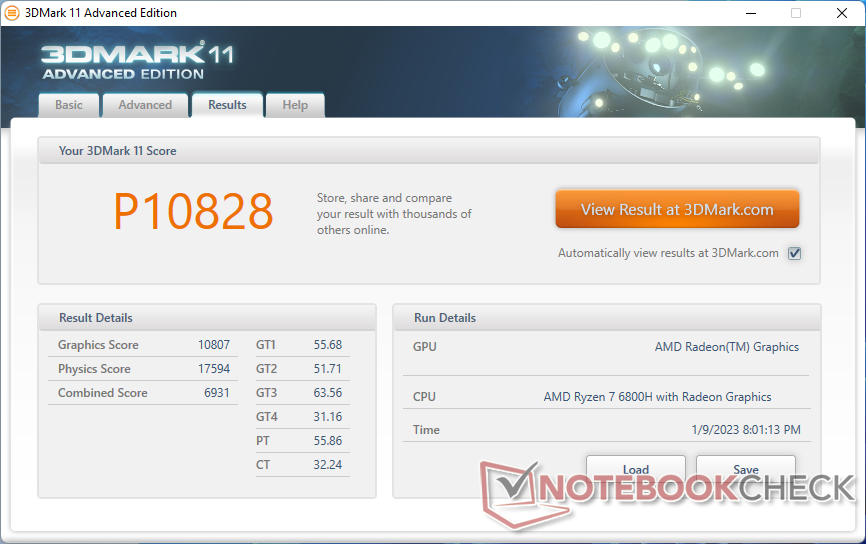
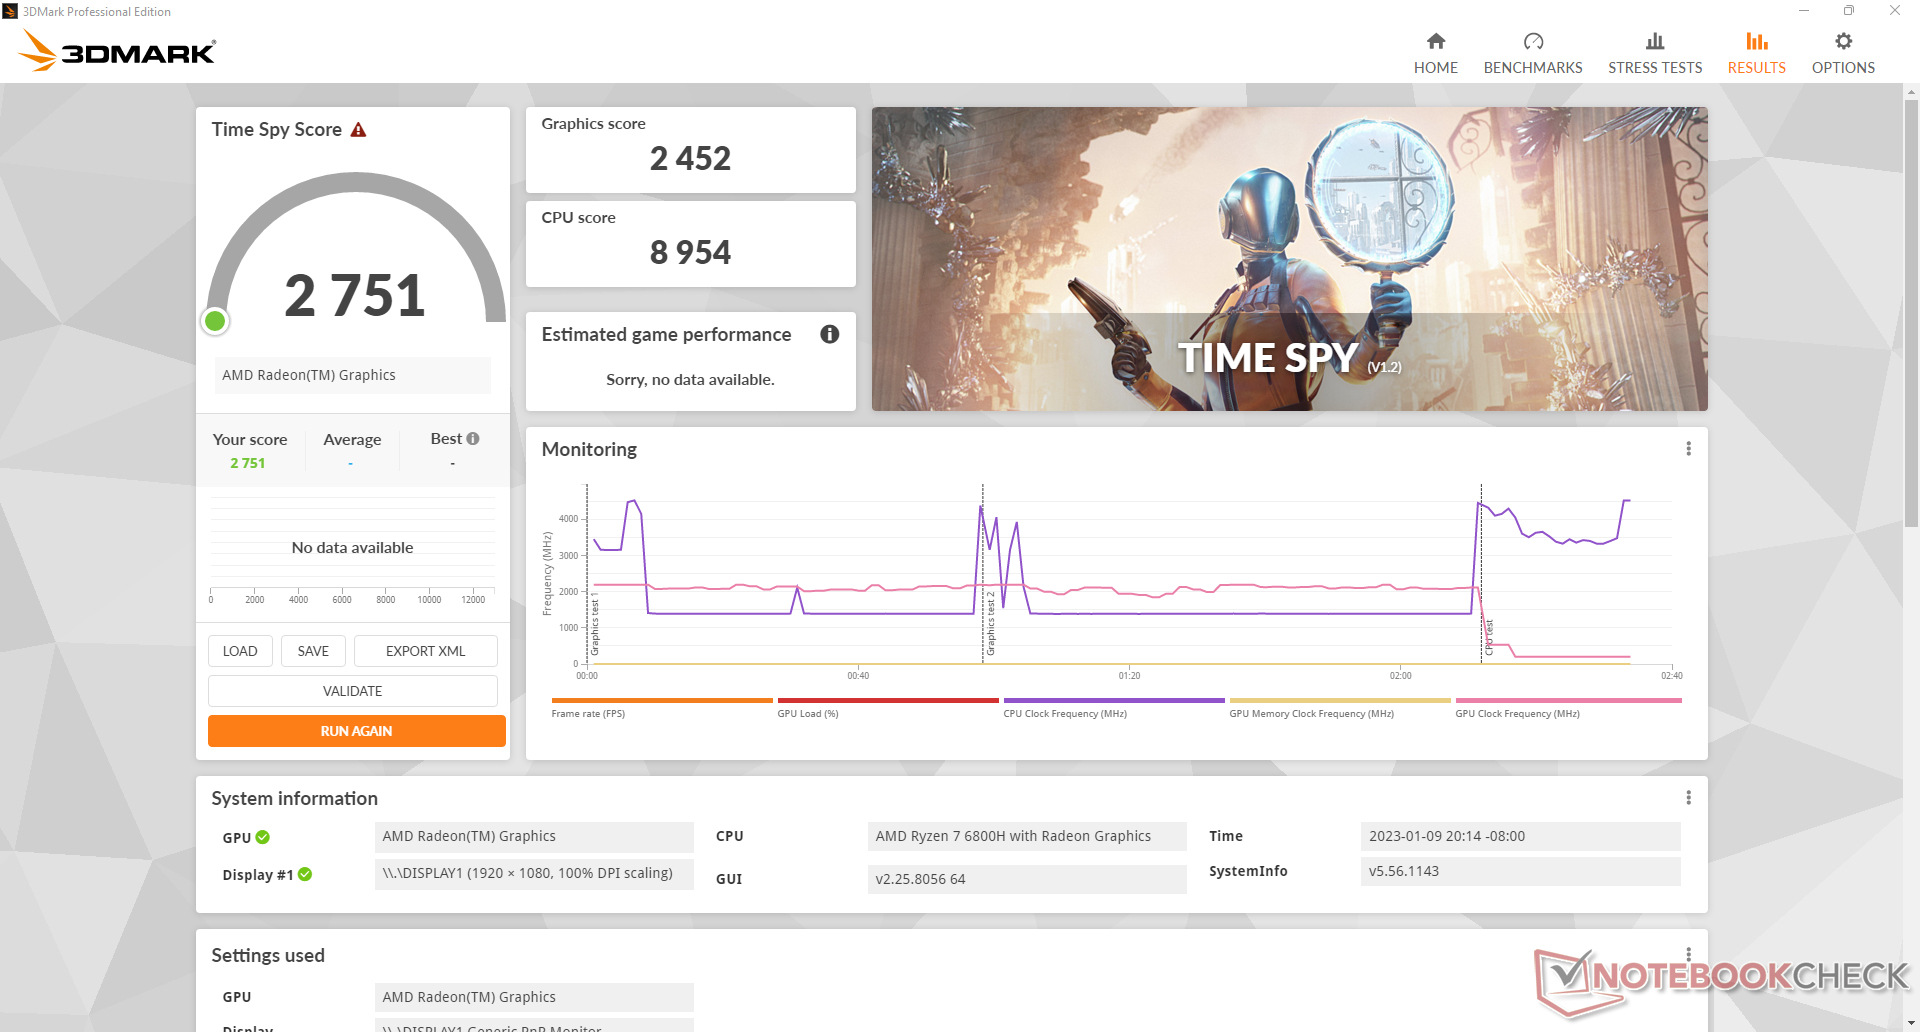
| 3DMark 11 Performance | 10825 punti | |
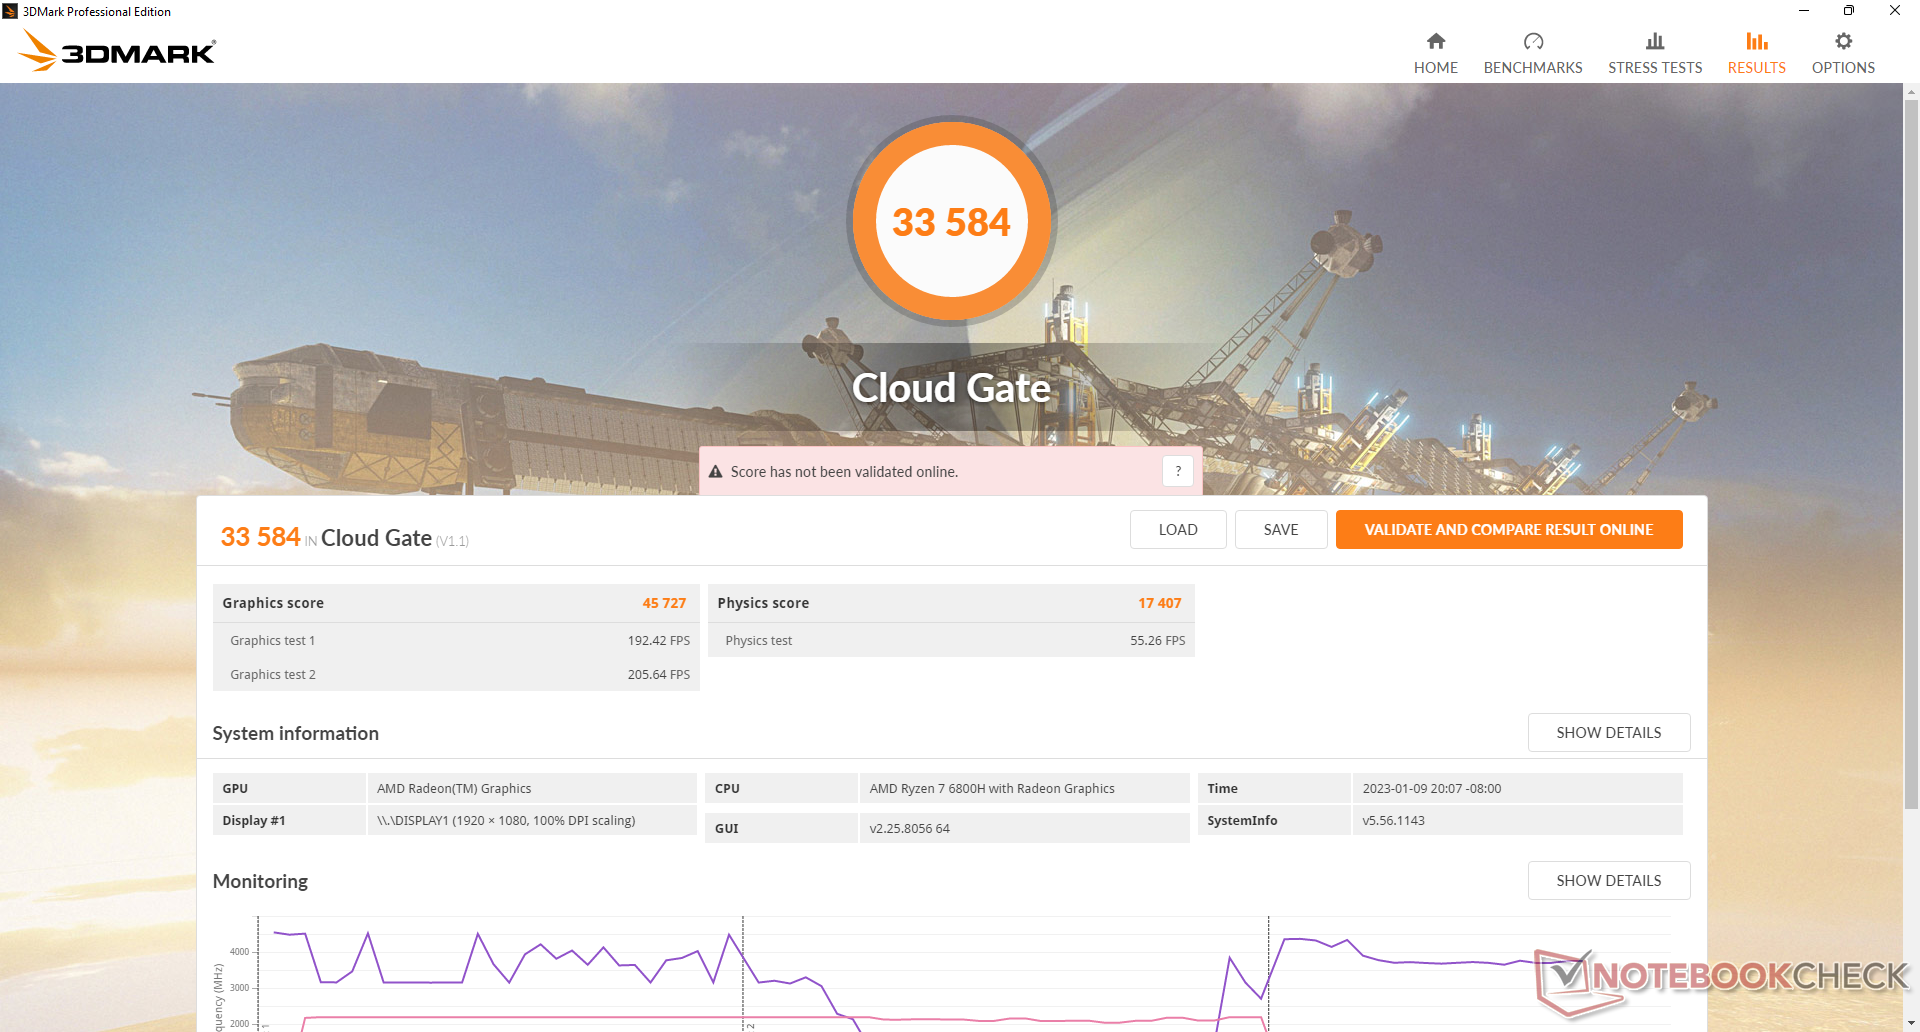
| 3DMark Cloud Gate Standard Score | 33584 punti | |
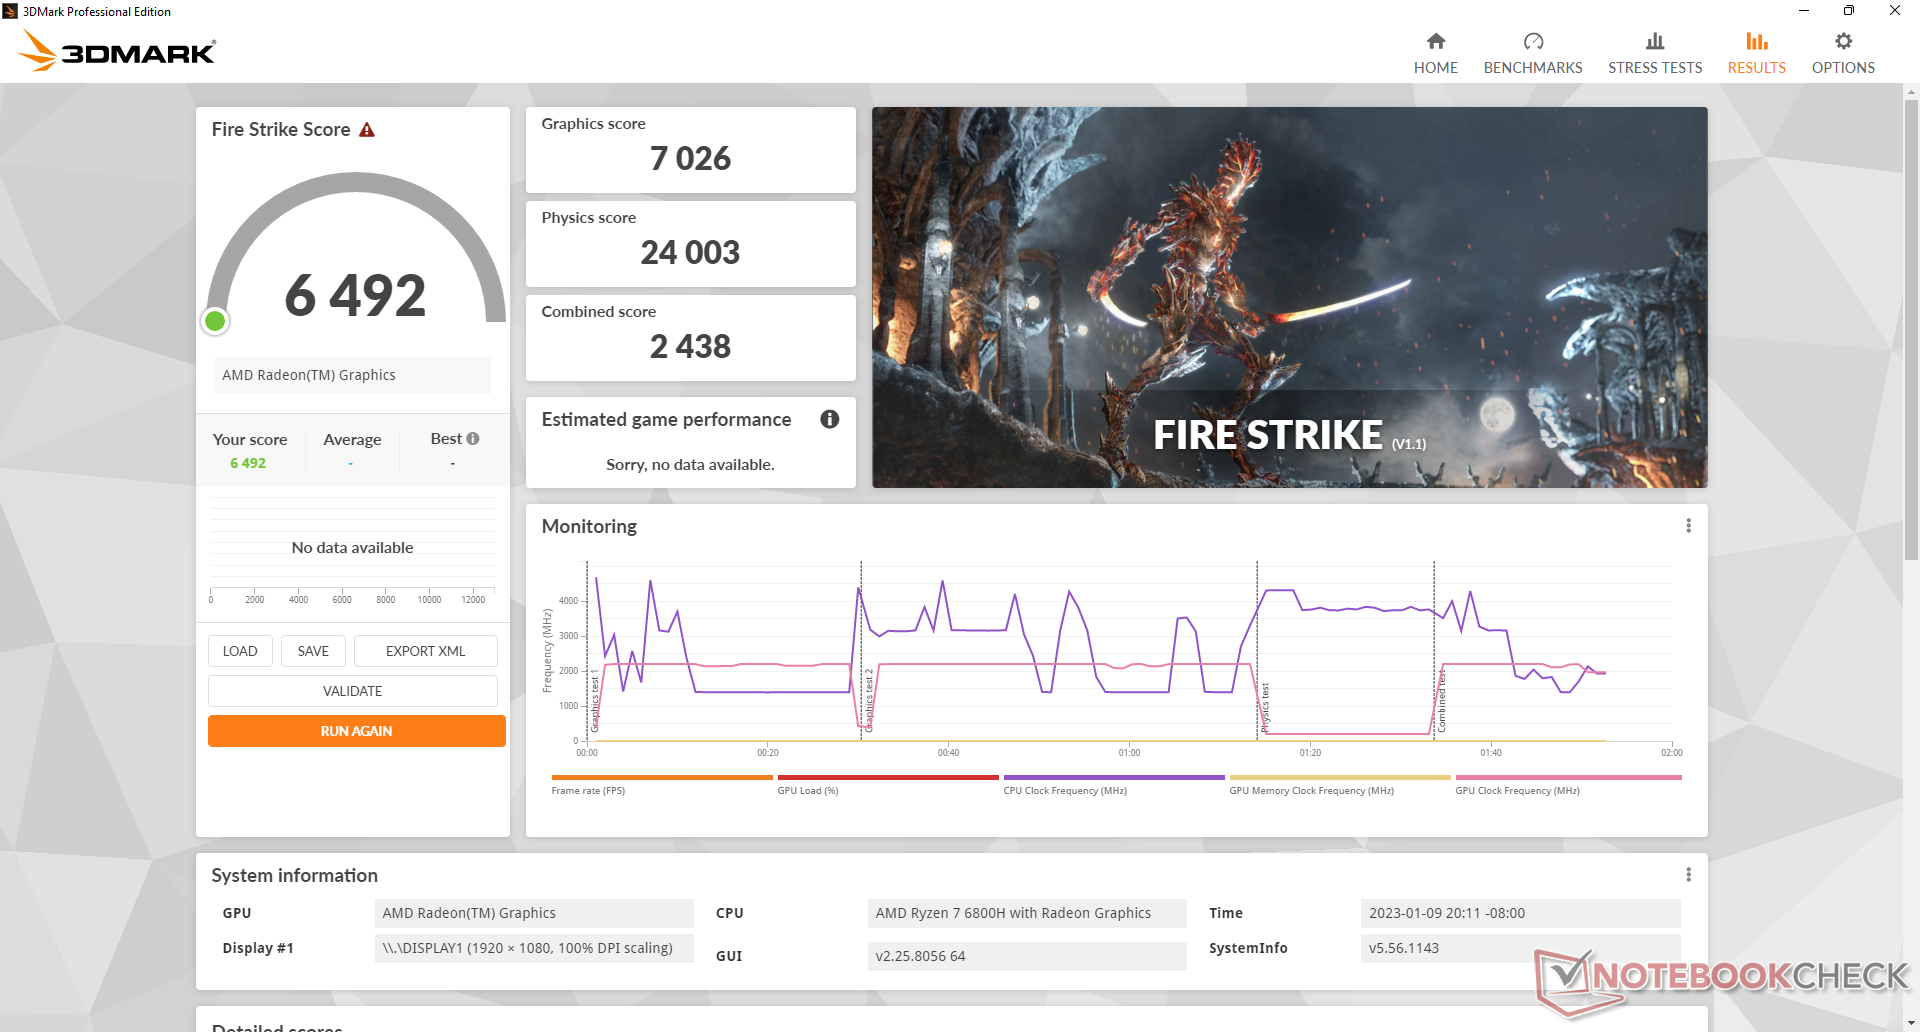
| 3DMark Fire Strike Score | 6492 punti | |
| 3DMark Time Spy Score | 2751 punti | |
Aiuto | ||
* ... Meglio usare valori piccoli
La nostra unità mostrava problemi nel mantenere la frequenza dei fotogrammi. Quando è al minimo su Witcher 3il frame rate scendeva periodicamente da circa 80 FPS a circa 70 FPS, apparentemente senza motivo. Abbiamo persino sperimentato un calo fino a 18 FPS, come mostra il grafico sottostante. L'instabilità suggerisce l'interruzione delle attività in background o una cattiva gestione delle applicazioni in background.
Witcher 3 FPS Chart
| basso | medio | alto | ultra | |
|---|---|---|---|---|
| GTA V (2015) | 152.3 | 139.7 | 51.9 | 23.7 |
| The Witcher 3 (2015) | 138.1 | 85.1 | 43.3 | 27 |
| Dota 2 Reborn (2015) | 143.3 | 113.4 | 83.9 | 73.1 |
| Final Fantasy XV Benchmark (2018) | 68.1 | 34.7 | 24.6 | |
| X-Plane 11.11 (2018) | 66.4 | 52.9 | 43 | |
| Strange Brigade (2018) | 141.9 | 57.8 | 48.6 | 41.9 |
| Cyberpunk 2077 1.6 (2022) | 43.3 | 33.1 | 21.3 | 17.2 |
Emissioni
Rumore del sistema
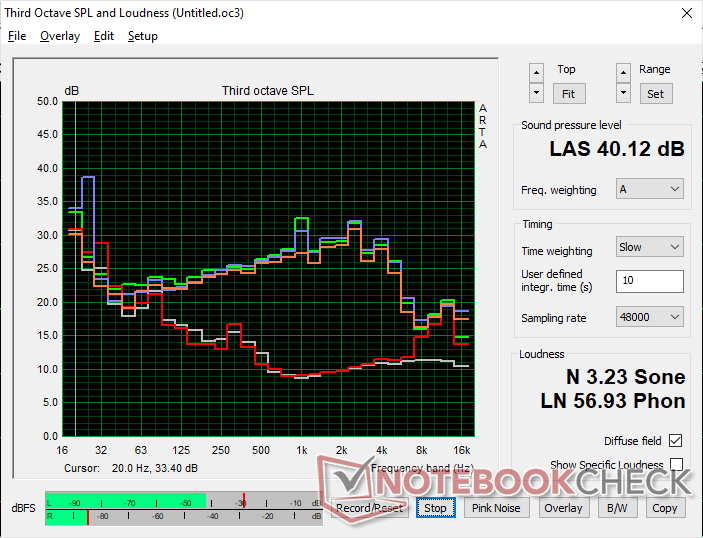
Le ventole interne sono sensibili ai carichi sullo schermo. Durante la navigazione sul web o lo streaming video, ad esempio, il rumore della ventola può occasionalmente raggiungere i 33 dB(A) per brevi periodi. Il rumore della ventola raggiunge il suo massimo di circa 40 dB(A) più rapidamente rispetto alla maggior parte degli altri mini PC.
Abbiamo riscontrato un leggero rumore elettronico o coil whine sulla nostra unità di test. Pertanto, siamo riusciti a registrare un rumore di 24,1 dB(A) contro uno sfondo silenzioso di 22,8 dB(A) anche quando la ventola era inattiva.
Rumorosità
| Idle |
| 24.1 / 24.1 / 33.8 dB(A) |
| Sotto carico |
| 40.1 / 40.1 dB(A) |
 | ||
30 dB silenzioso 40 dB(A) udibile 50 dB(A) rumoroso |
||
min: | ||
| Beelink SER6 Pro Radeon 680M, R7 6800H, Kingston NV2 500GB SNV2S/500G | Beelink GTR6 Radeon 680M, R9 6900HX, Kingston KC3000 512G SKC3000S512G | Beelink SEi11 Pro Iris Xe G7 96EUs, i5-11320H, Kingston NV1 SNVS/500GCN | Intel NUC 12 Pro Kit NUC12WSKi7 Iris Xe G7 96EUs, i7-1260P, Transcend M.2 SSD 2200S TS512GMTE220S | Intel NUC11PHKi7C GeForce RTX 2060 Mobile, i7-1165G7, Samsung SSD 980 Pro 500GB MZ-V8P500BW | Intel Hades Canyon NUC8i7HVK Vega M GH, i7-8809G, Intel Optane 120 GB SSDPEK1W120GA | |
|---|---|---|---|---|---|---|
| Noise | -3% | 8% | -18% | -1% | -11% | |
| off /ambiente * (dB) | 22.8 | 23.2 -2% | 22.8 -0% | 30.4 -33% | 24.5 -7% | 28.7 -26% |
| Idle Minimum * (dB) | 24.1 | 23.6 2% | 24.7 -2% | 33.1 -37% | 25.3 -5% | 29 -20% |
| Idle Average * (dB) | 24.1 | 23.8 1% | 24.7 -2% | 33.1 -37% | 25.3 -5% | 29 -20% |
| Idle Maximum * (dB) | 33.8 | 36.2 -7% | 25.3 25% | 33.1 2% | 25.3 25% | 29 14% |
| Load Average * (dB) | 40.1 | 39.7 1% | 33.2 17% | 38.1 5% | 36.4 9% | 36 10% |
| Witcher 3 ultra * (dB) | 38.7 | 41 -6% | 34.5 11% | 39.7 -3% | 42 -9% | |
| Load Maximum * (dB) | 40.1 | 43 -7% | 37.8 6% | 43.6 -9% | 47.9 -19% | 49.4 -23% |
* ... Meglio usare valori piccoli
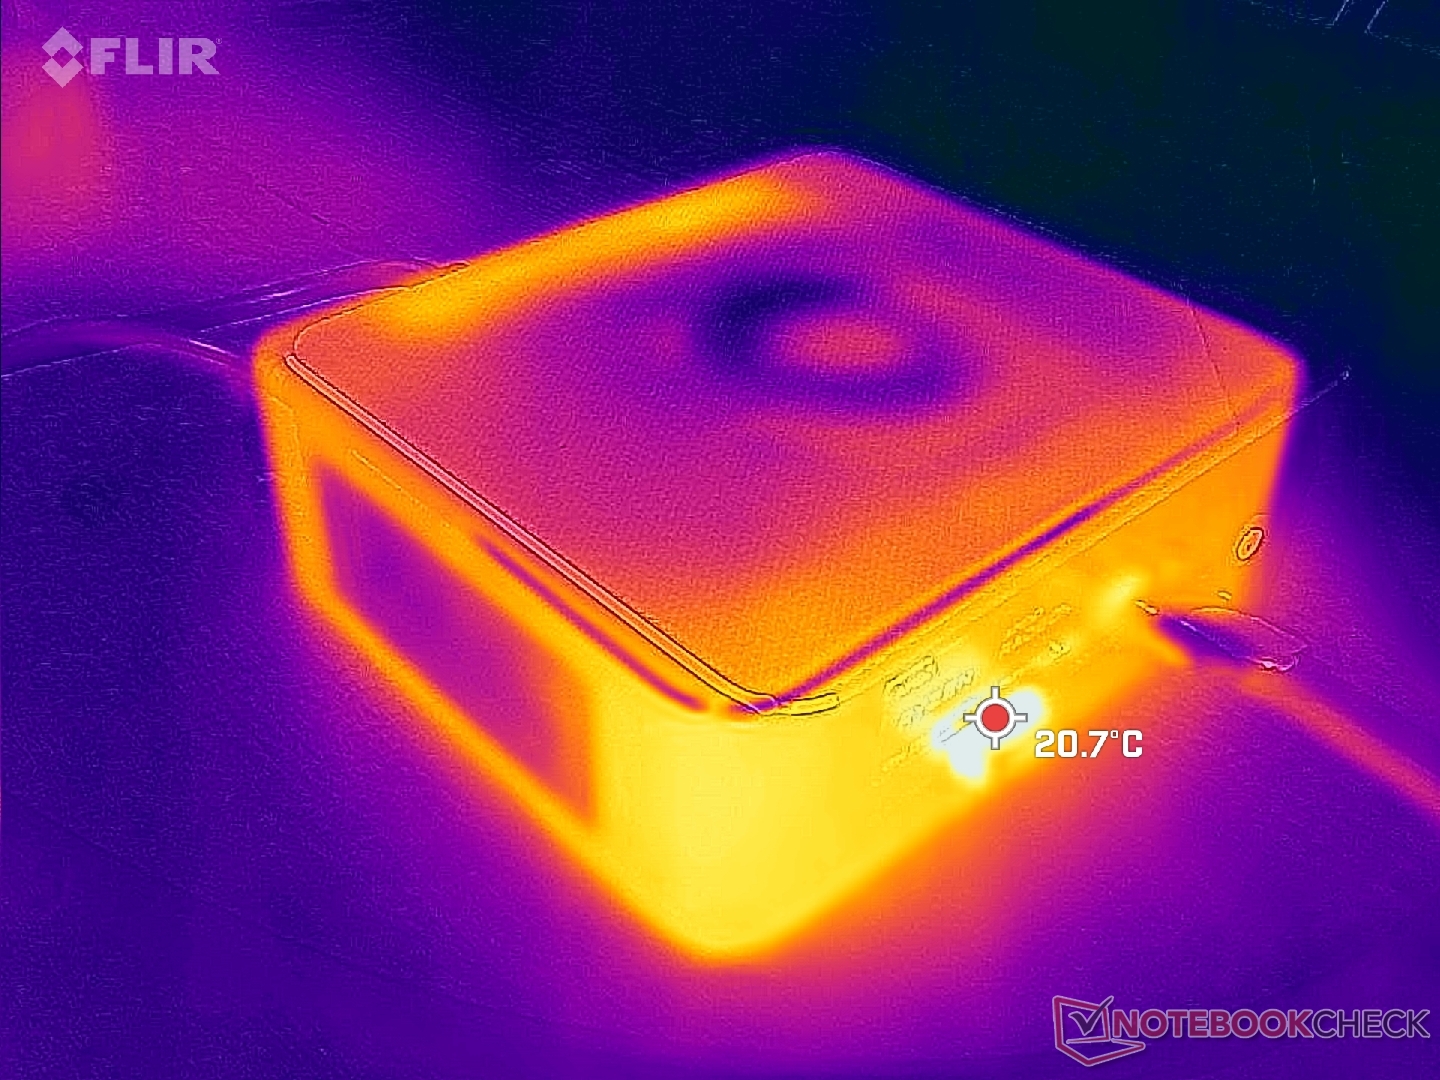
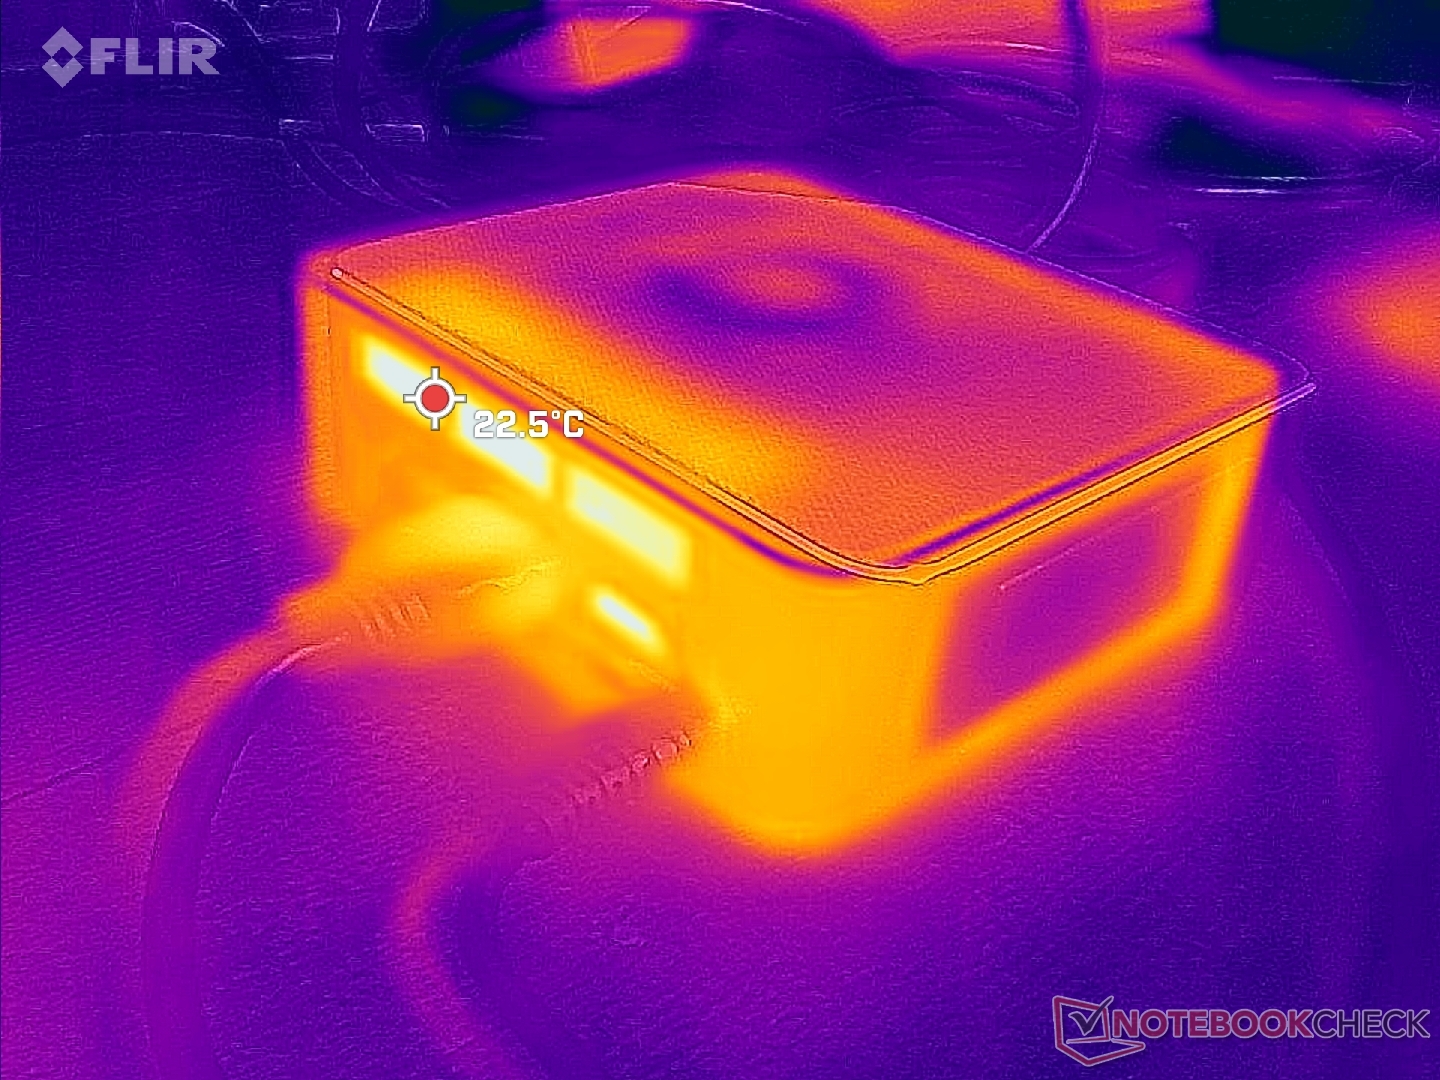
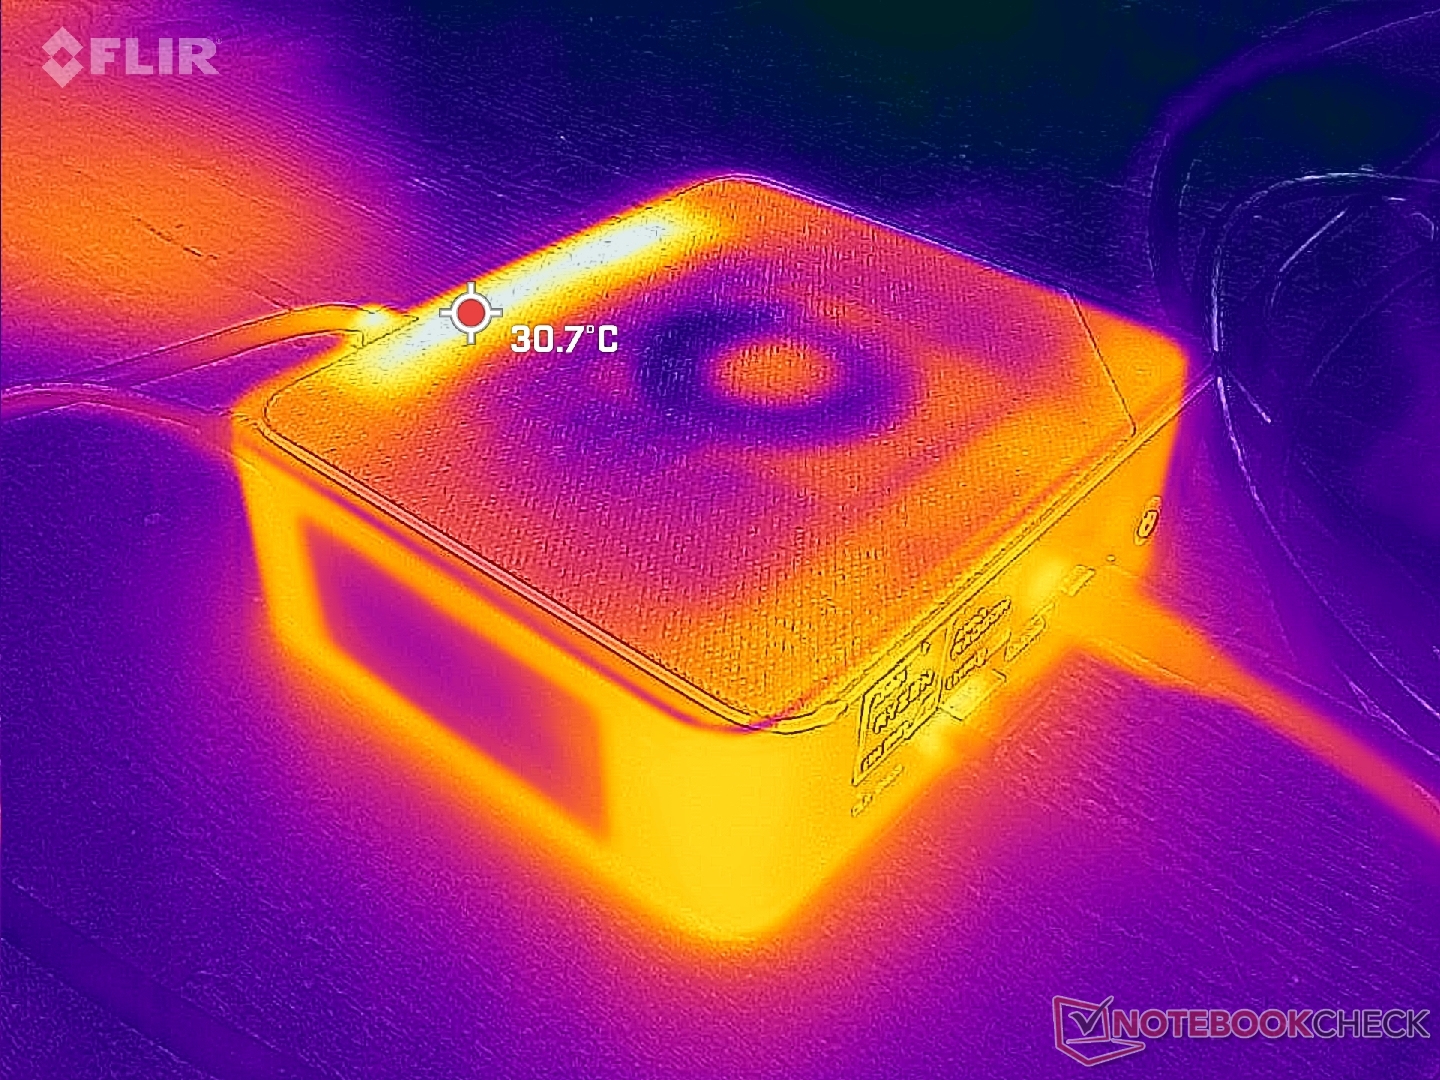
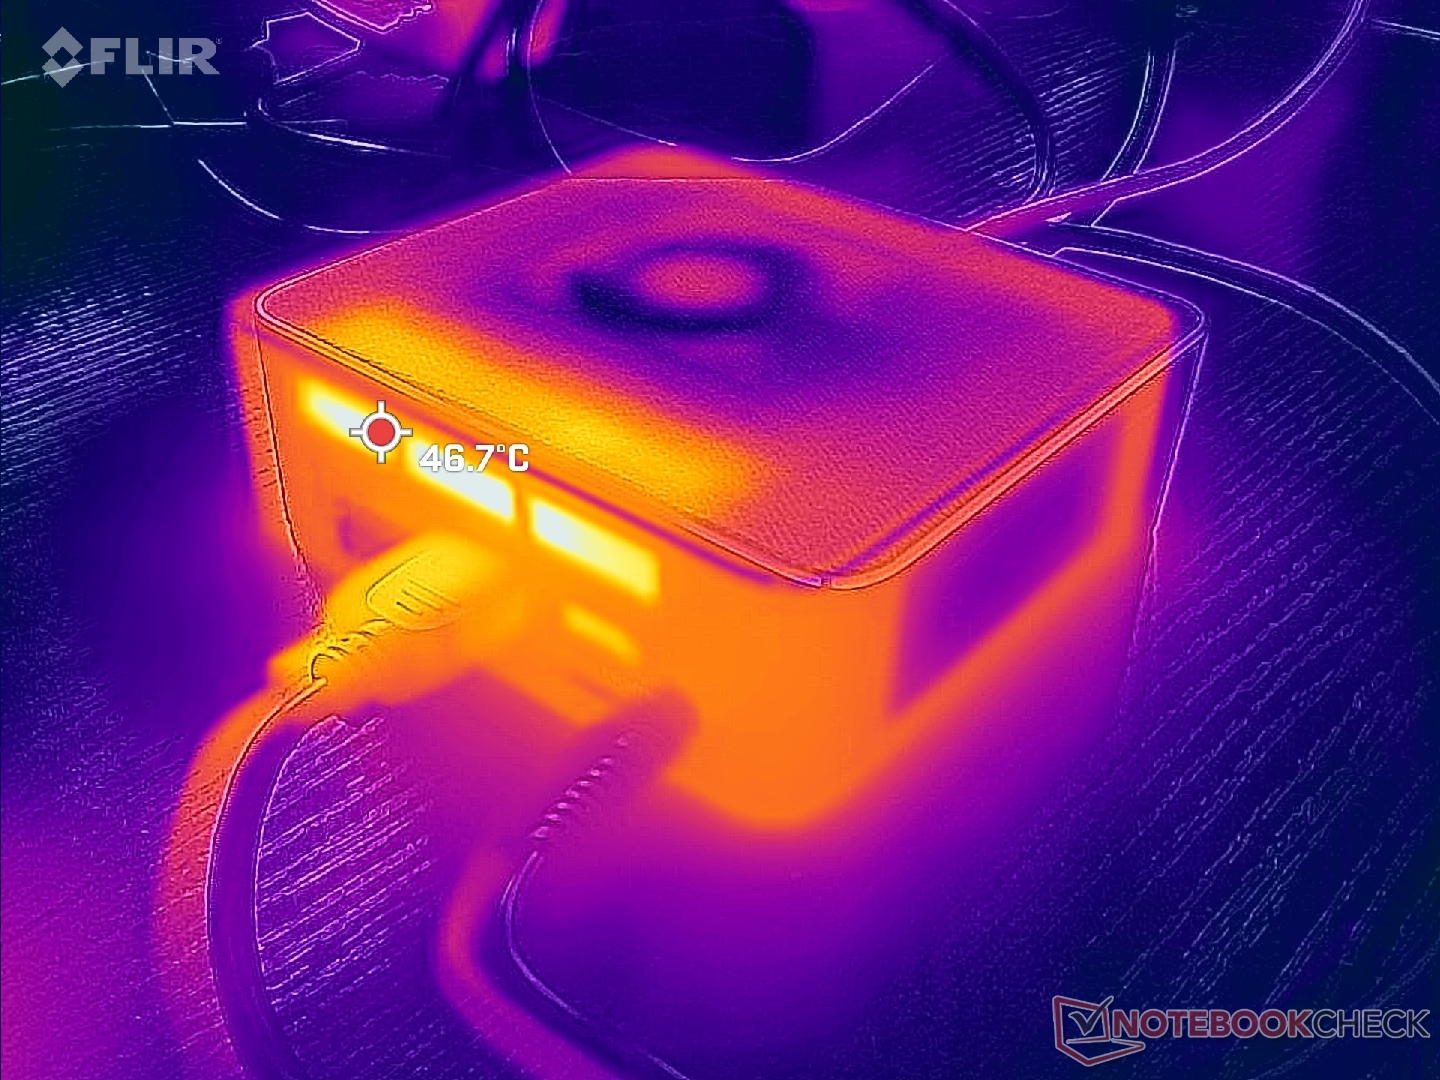
Temperatura
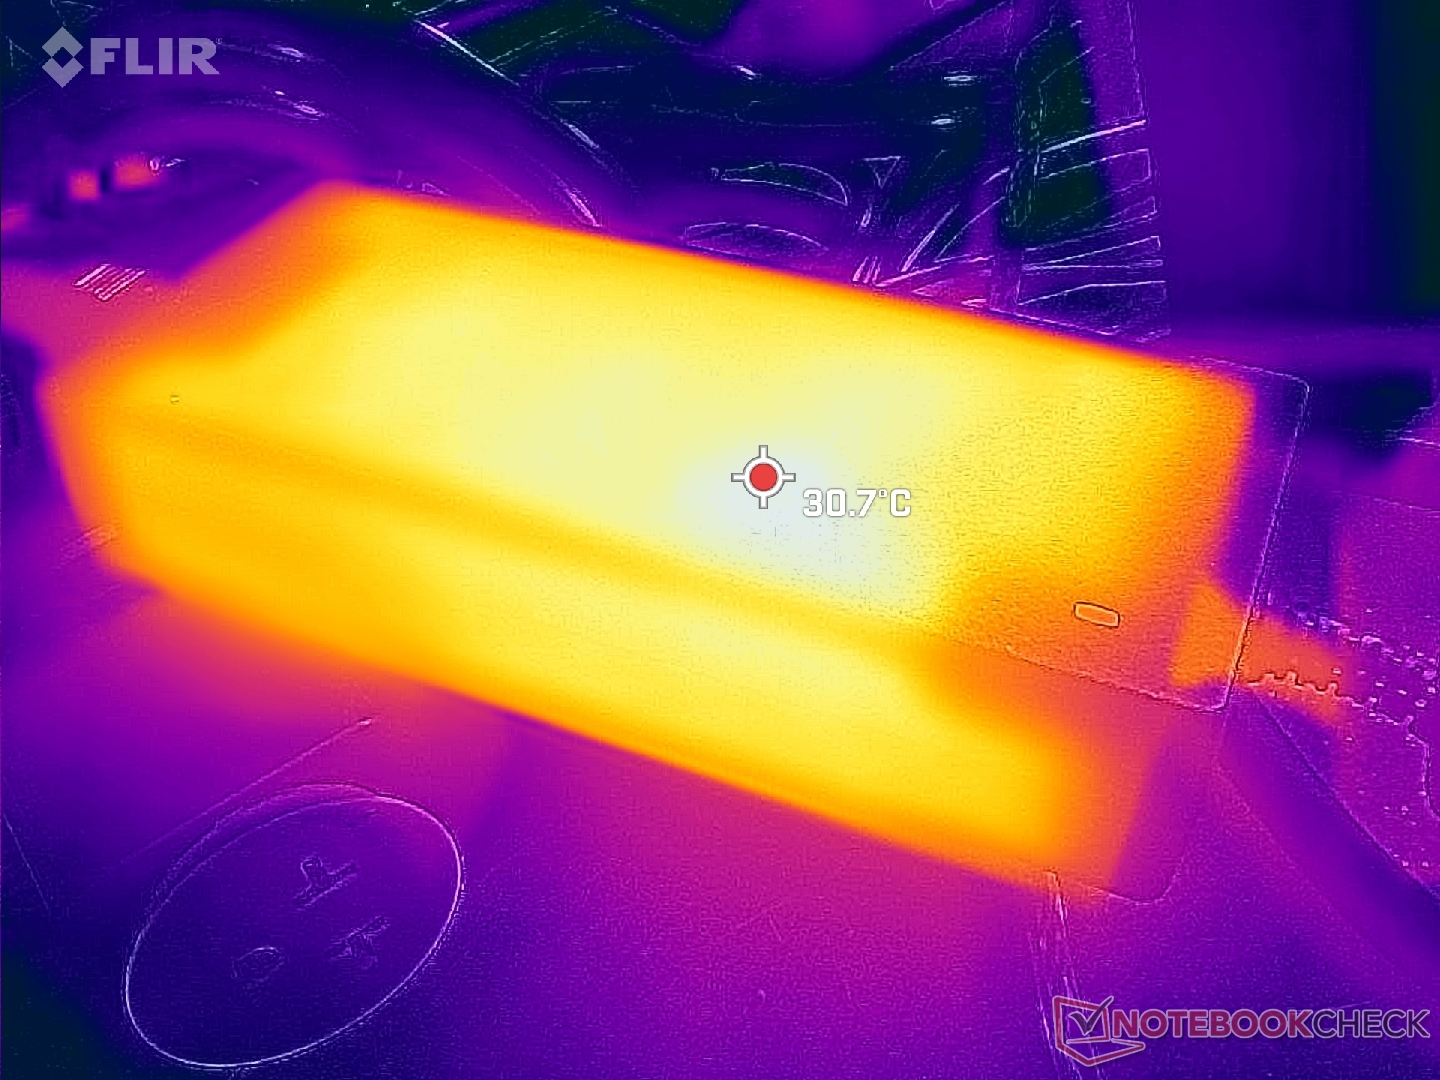
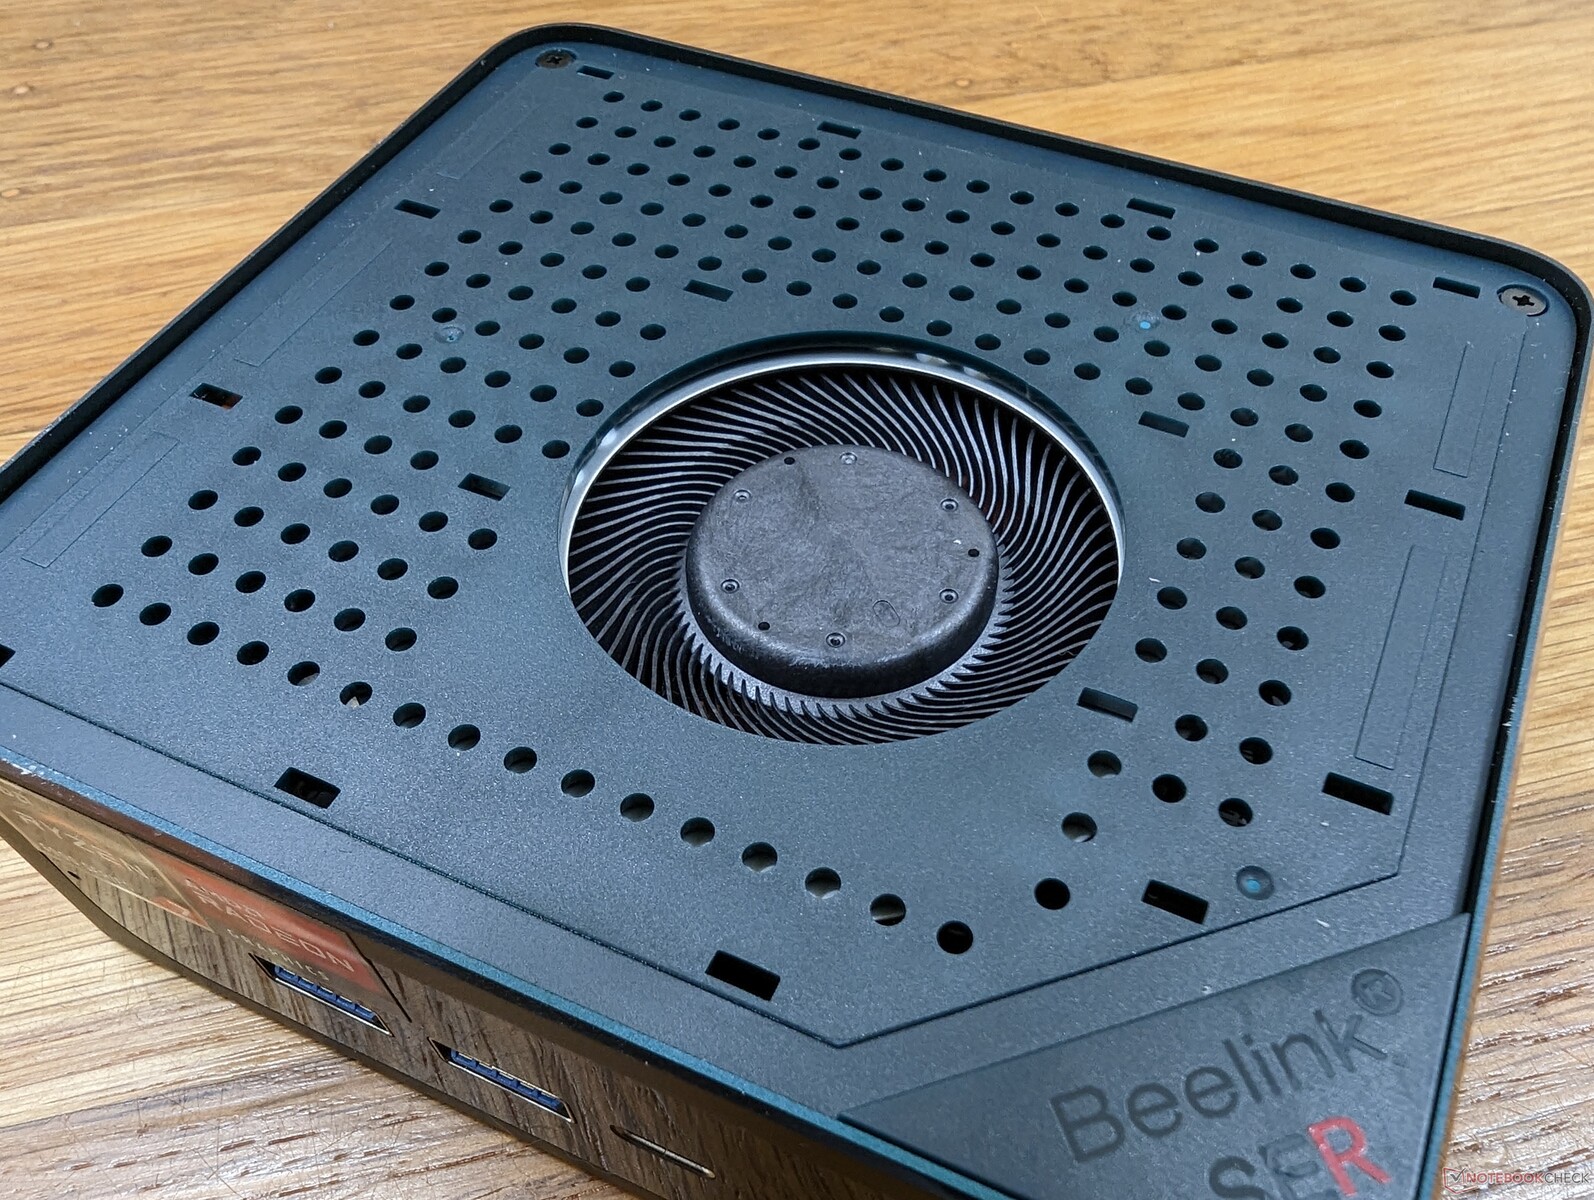
Le temperature di superficie non sono un problema. A differenza di molti altri mini PC, il SER6 Pro incorpora due ventole per migliorare il potenziale di raffreddamento. L'aria fredda entra dai lati e dalla parte superiore, mentre l'aria calda esce dalla parte posteriore. Posizionare oggetti sopra il mini PC o posizionarlo in verticale ostruisce il flusso d'aria.
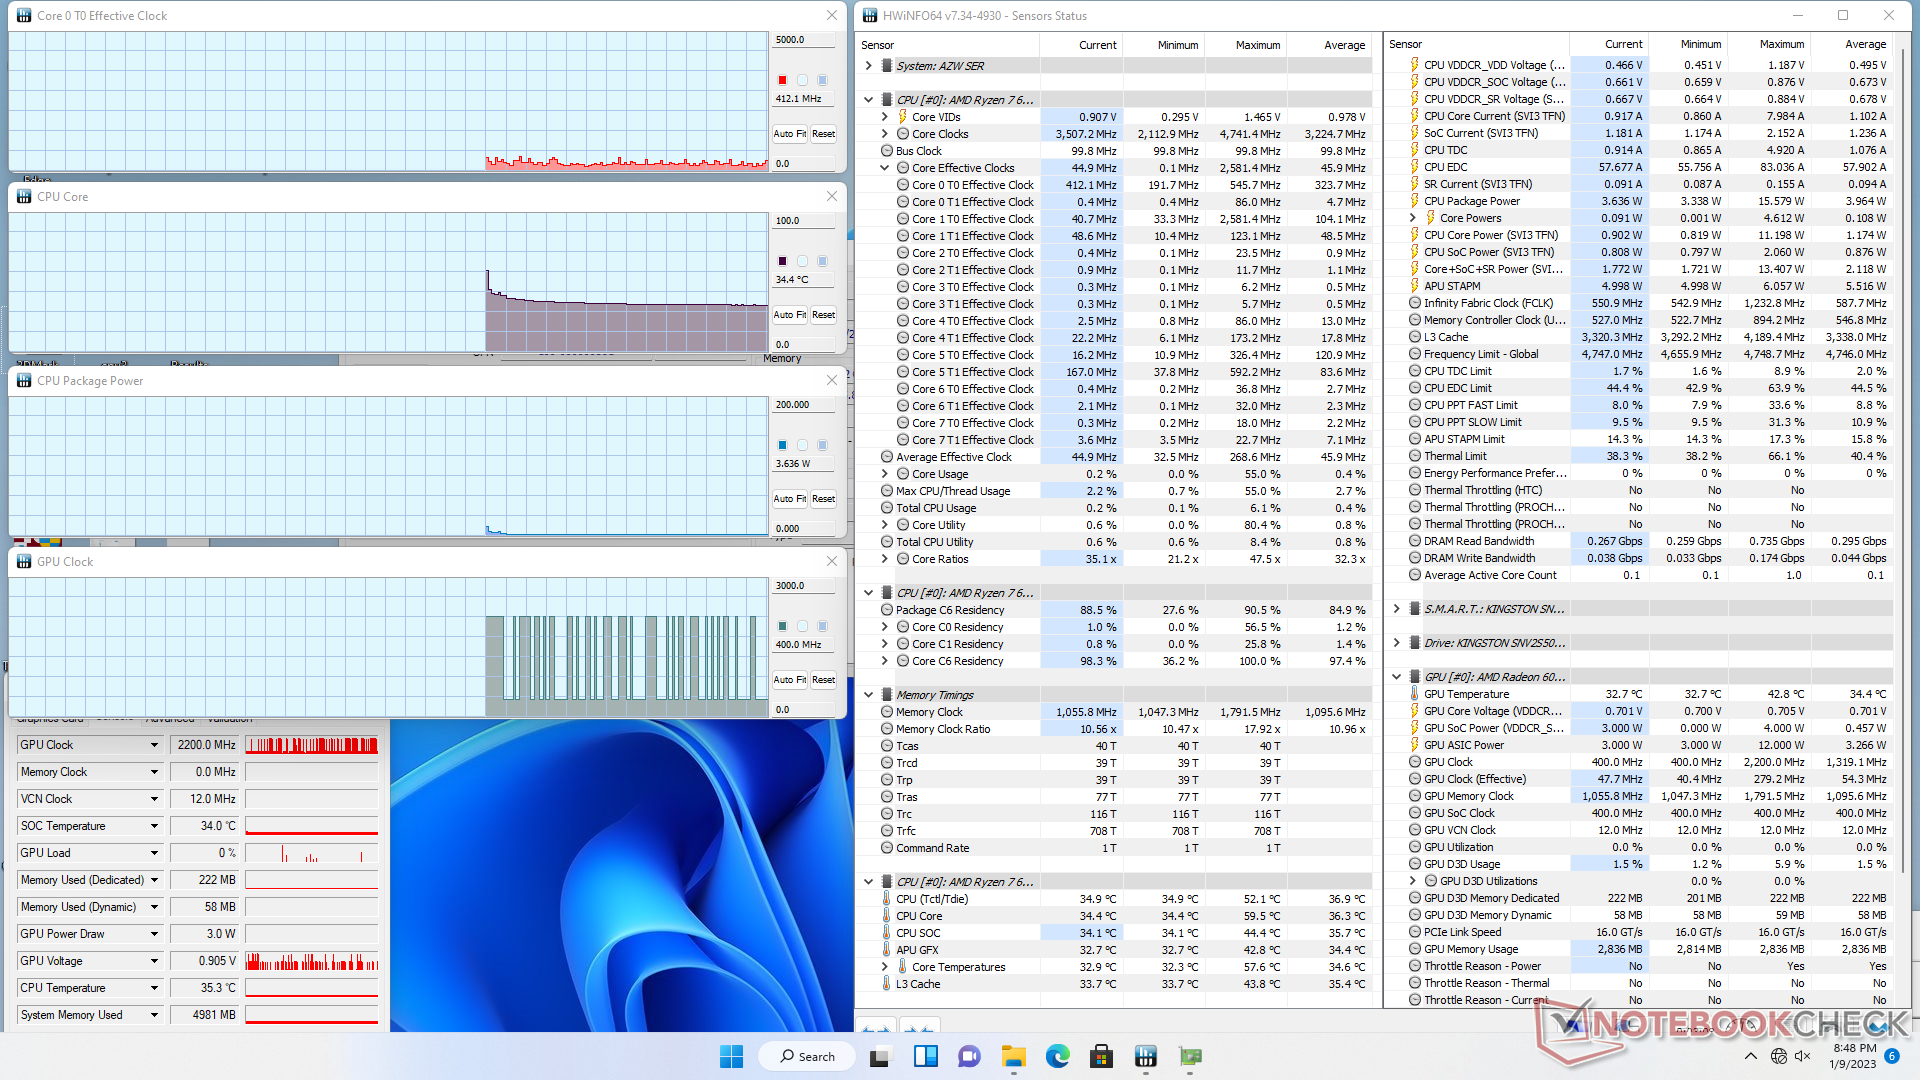
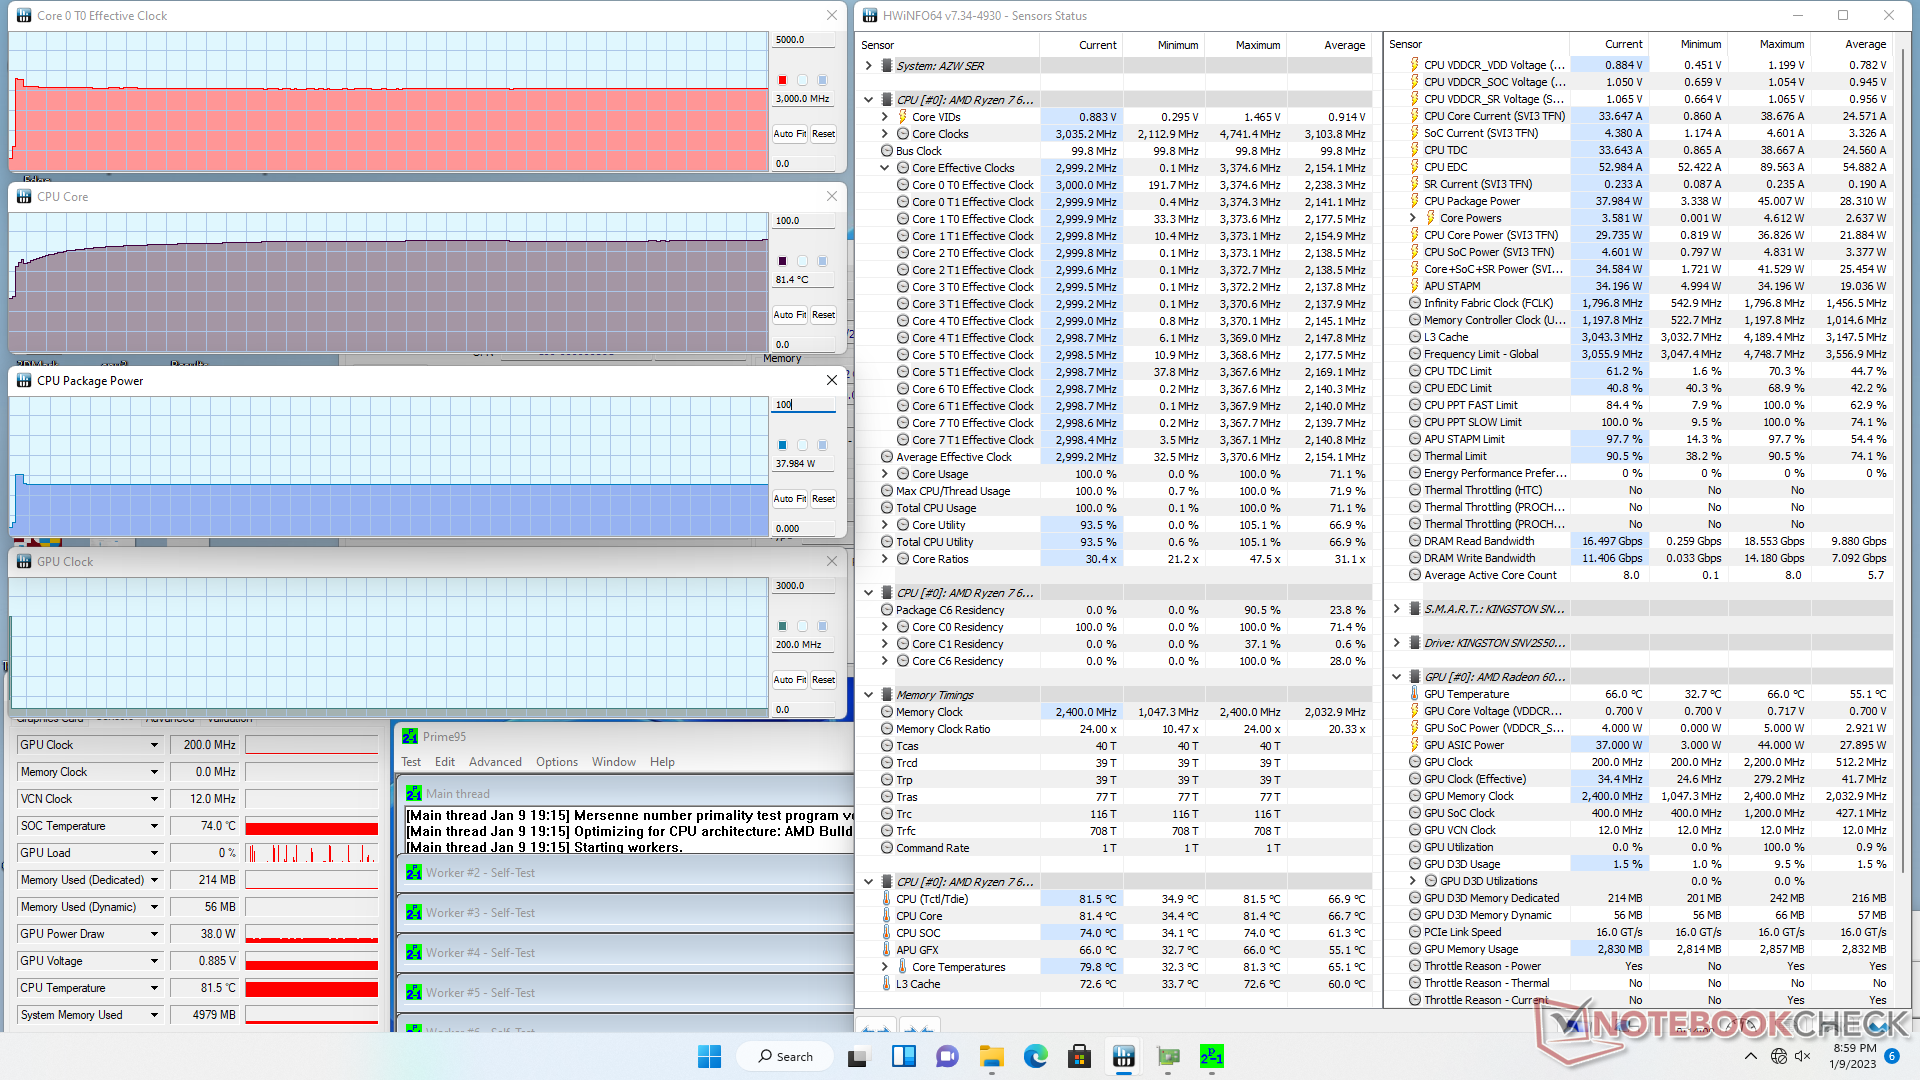
Stress test
Quando si esegue Prime95 per stressare la CPU, la velocità di clock e l'assorbimento di potenza della scheda aumentano rispettivamente a 3,3 GHz e 45 W, per pochi secondi. La CPU si stabilizzava quindi rapidamente a 3 GHz, 38 W e 82 C. Ripetendo lo stesso test sulBeelink SEi11 alimentato dal più lento Core i5-11320H, si ottiene una temperatura più elevata, pari a 89°C.
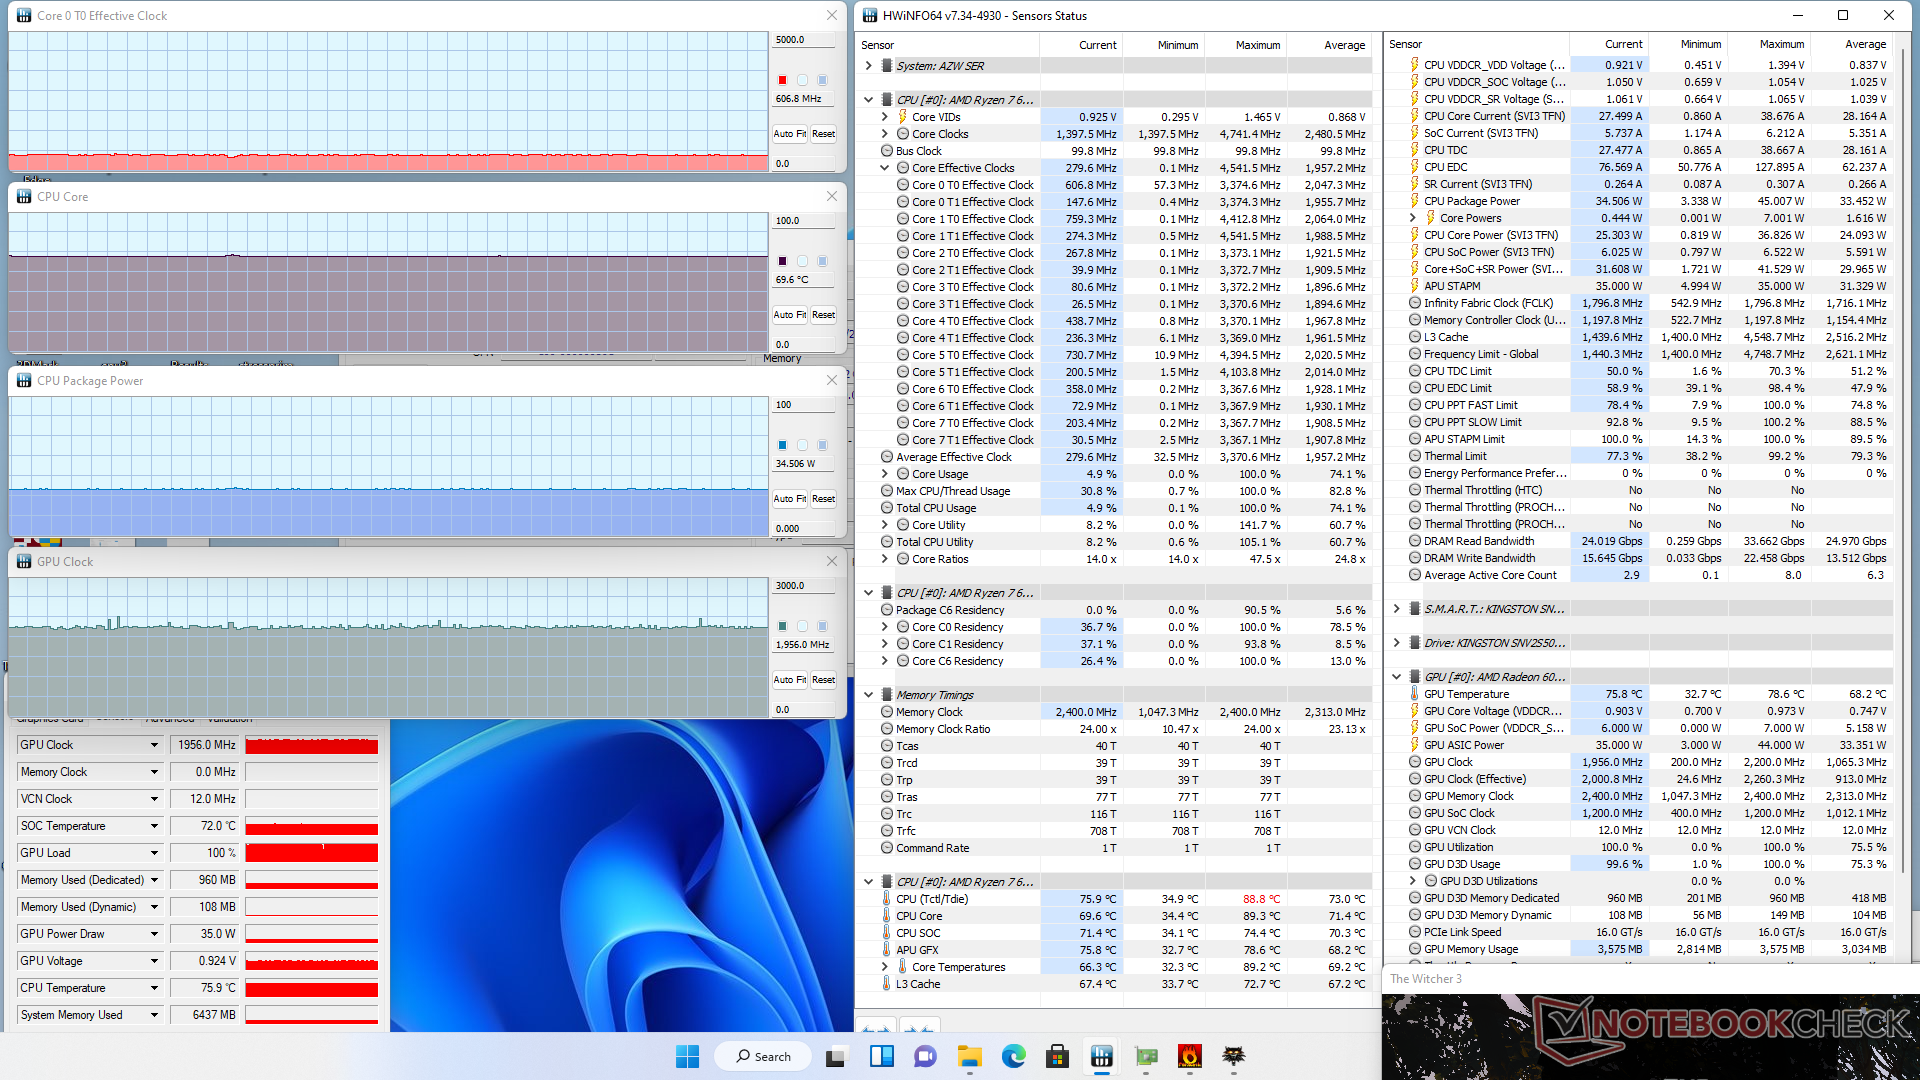
Quando si esegue Witcher 3 per rappresentare i carichi di gioco tipici, la velocità di clock della GPU e la temperatura si stabilizzerebbero rispettivamente a 1956 MHz e 70 C, rispetto agli 83 C del SEi11. Il SER6 Pro non è solo più veloce, ma anche più freddo.
| Clock della CPU (GHz) | Clock della GPU (MHz) | Temperatura media della CPU (°C) | |
| Sistema inattivo | -- | -- | 34 |
| Stress Prime95 | 3.0 | -- | 82 |
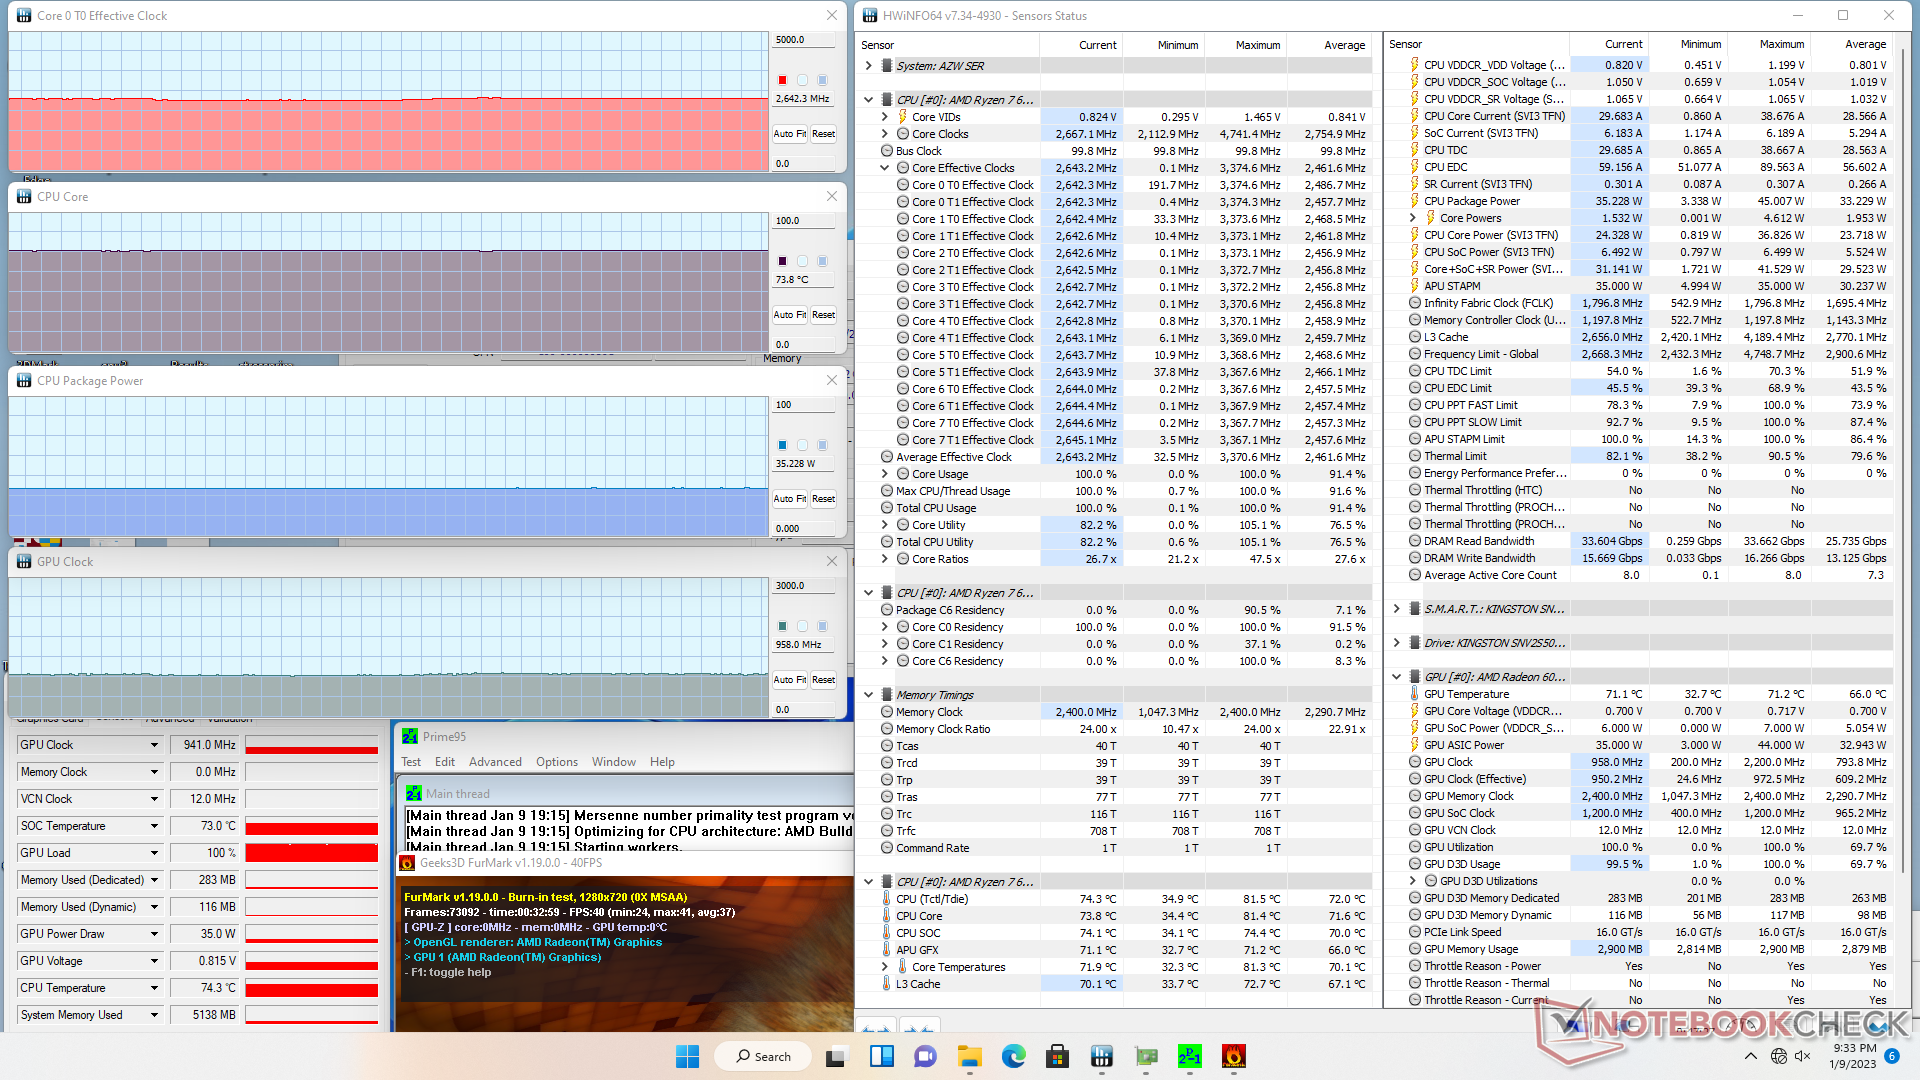
| Prime95 + FurMark Stress | 2,7 | 941 | 74 |
| Witcher 3 Stress | ~0,6 | 1956 | 70 |
Gestione dell'energia
Consumo di energia
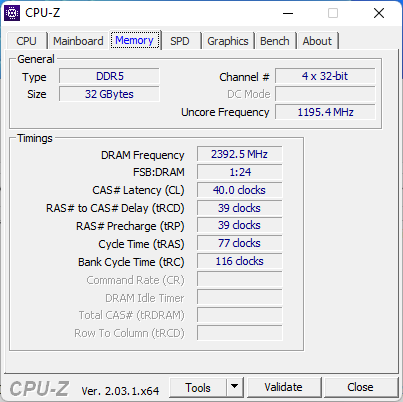
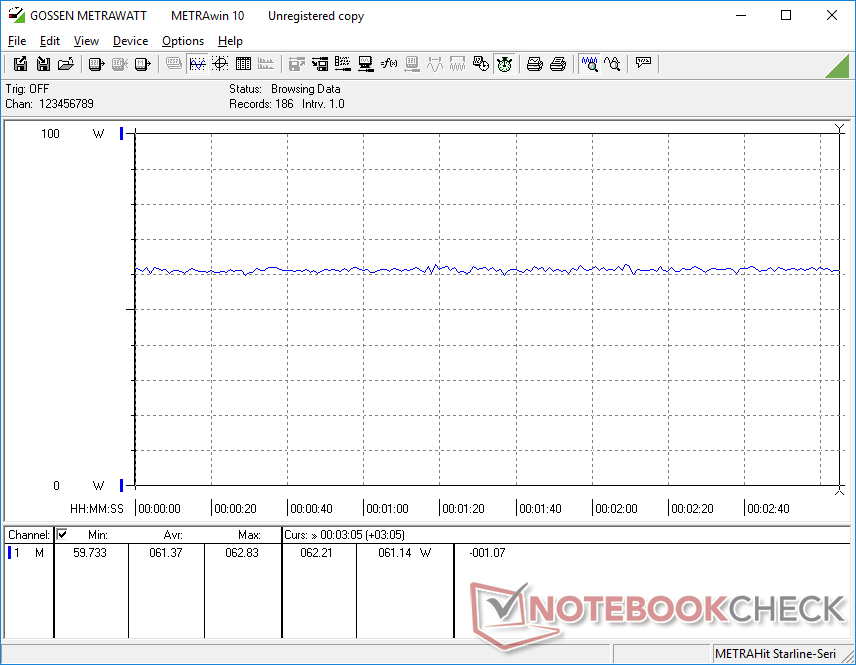
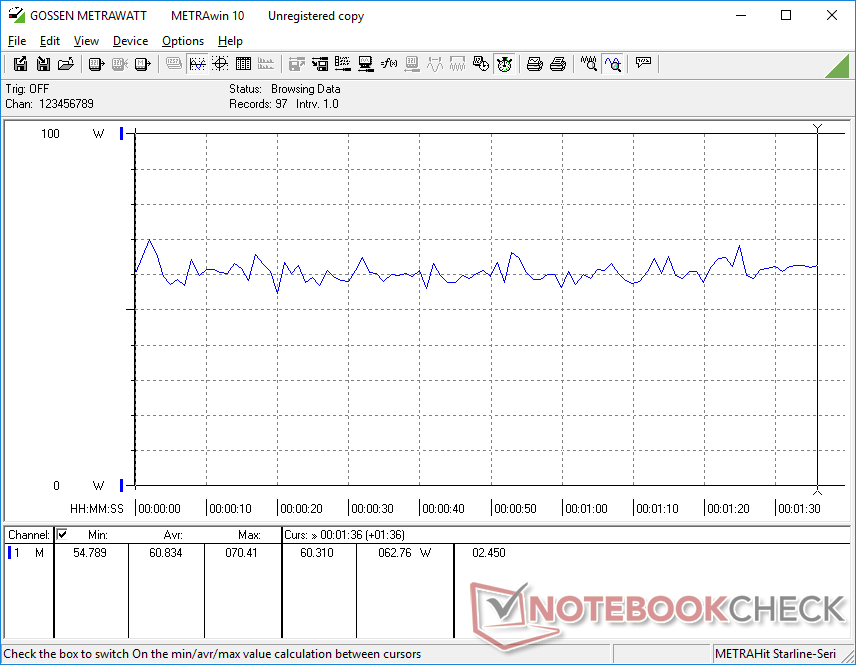
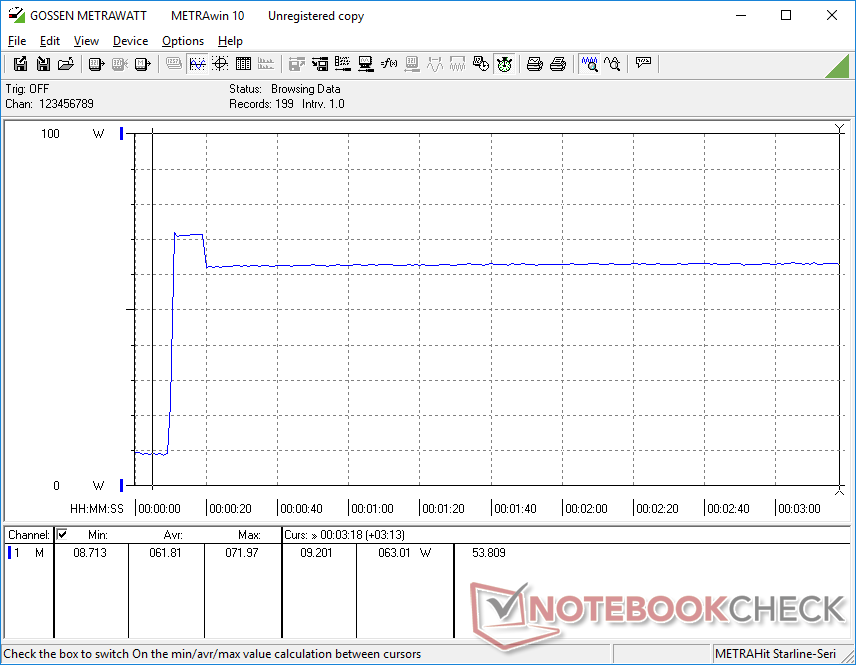
Il consumo di energia durante i giochi è superiore di circa il 33% rispetto al SER5 Pro con l'ultima generazione di Ryzen 5H Ryzen 5 5600H e anche leggermente superiore a quello del SEi11 Pro con CPU Intel Core serie H di 12a generazione. Se si considera che la nostra Radeon 680M può offrire fino a due volte le prestazioni della Radeon RX Vega 7, tuttavia, il consumo energetico più elevato vale sicuramente la pena. Il funzionamento al minimo su desktop consuma ancora la stessa quantità di energia del modello dell'anno scorso, nonostante la grafica aggiornata.
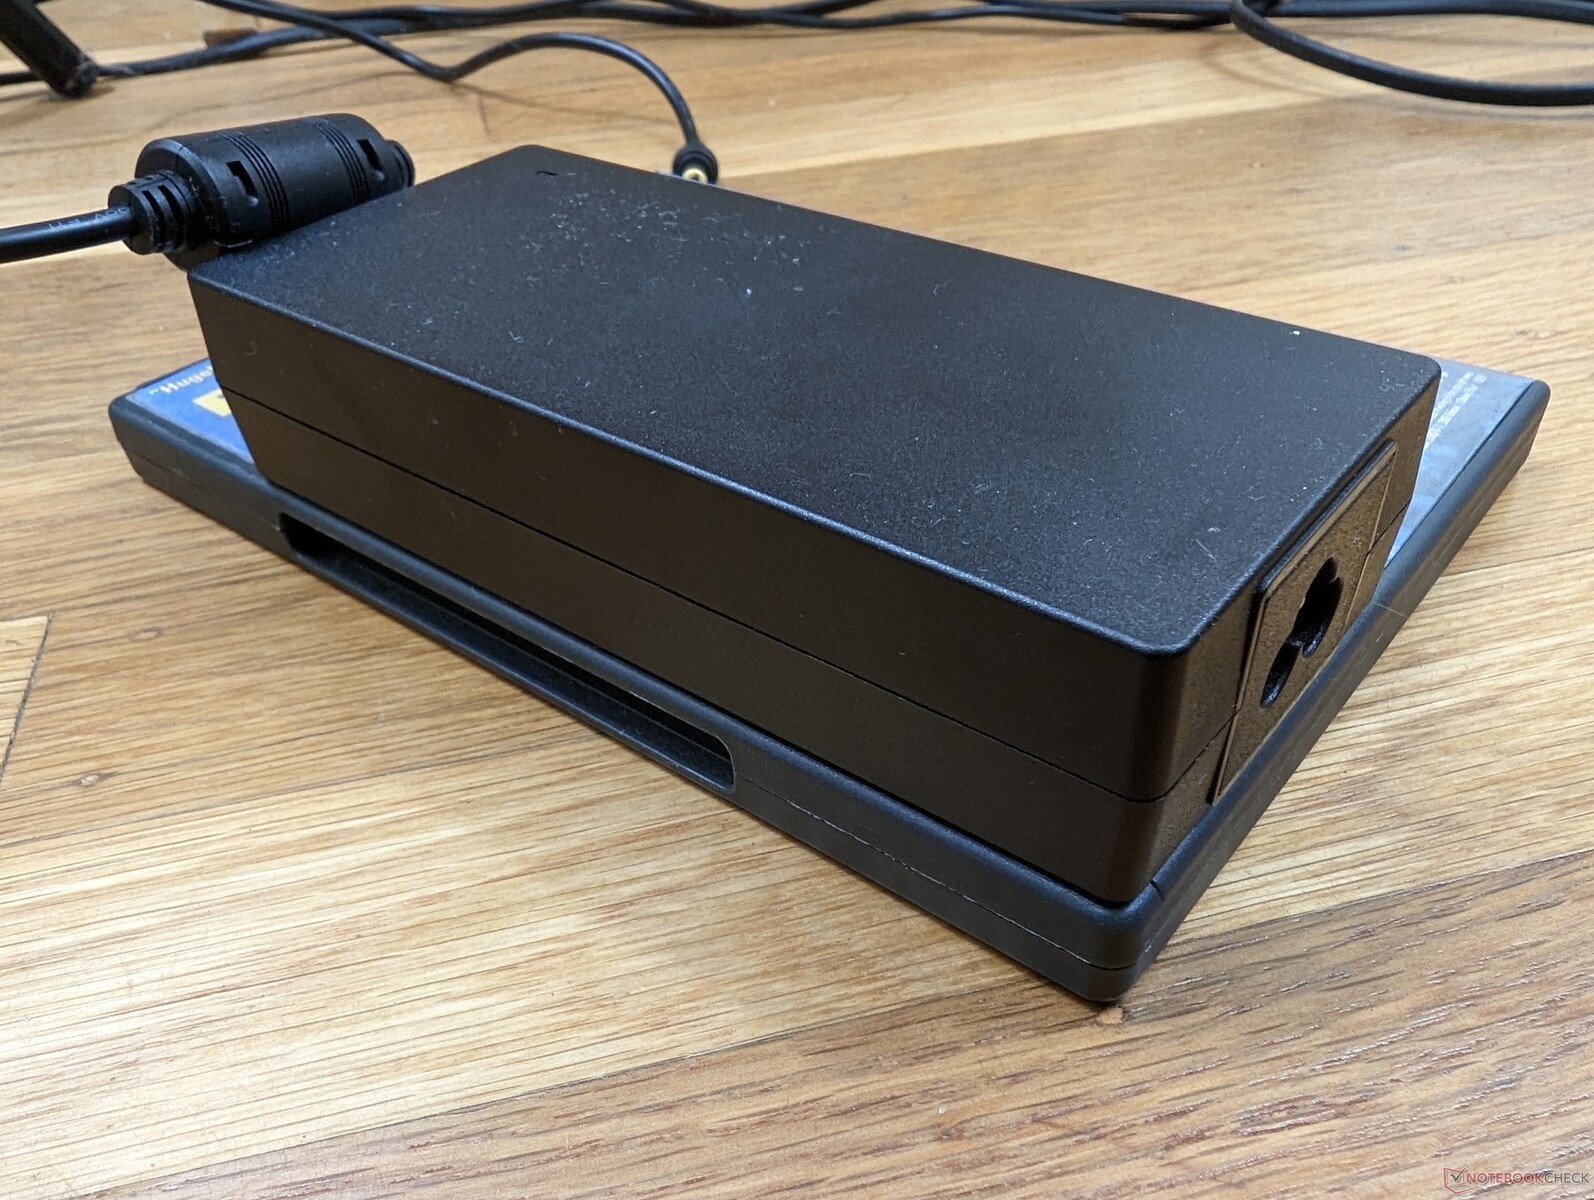
Siamo riusciti a registrare un consumo massimo di 72 W dall'adattatore CA da 120 W quando la CPU è al 100% di utilizzo. L'elevato consumo consente al mini PC di alimentare o caricare alcuni dispositivi USB-C a spese di un adattatore CA più ingombrante.

| Off / Standby | |
| Idle | |
| Sotto carico |
|
Leggenda:
min: | |
| Beelink SER6 Pro R7 6800H, Radeon 680M, Kingston NV2 500GB SNV2S/500G, , x, | Beelink SER Pro Ryzen 5 5600H R5 5600H, Vega 7, Kingston NV1 SNVS/500GCN, , x, | Beelink SEi11 Pro i5-11320H, Iris Xe G7 96EUs, Kingston NV1 SNVS/500GCN, , x, | Intel NUC 12 Pro Kit NUC12WSKi7 i7-1260P, Iris Xe G7 96EUs, Transcend M.2 SSD 2200S TS512GMTE220S, , x, | Intel NUC11PHKi7C i7-1165G7, GeForce RTX 2060 Mobile, Samsung SSD 980 Pro 500GB MZ-V8P500BW, , x, | Intel Hades Canyon NUC8i7HVK i7-8809G, Vega M GH, Intel Optane 120 GB SSDPEK1W120GA, , x, | |
|---|---|---|---|---|---|---|
| Power Consumption | 19% | -3% | -35% | -93% | -91% | |
| Idle Minimum * (Watt) | 8.3 | 5.4 35% | 9.8 -18% | 12.1 -46% | 5.8 30% | 15.5 -87% |
| Idle Average * (Watt) | 8.4 | 8.2 2% | 10.3 -23% | 12.2 -45% | 5.9 30% | 16.2 -93% |
| Idle Maximum * (Watt) | 8.7 | 8.3 5% | 10.5 -21% | 12.3 -41% | 20.7 -138% | 16.5 -90% |
| Load Average * (Watt) | 60.8 | 49.3 19% | 54.2 11% | 64 -5% | 130.8 -115% | 83.4 -37% |
| Witcher 3 ultra * (Watt) | 61.4 | 46.1 25% | 53.1 14% | 154.4 -151% | 121.7 -98% | |
| Load Maximum * (Watt) | 72 | 50.2 30% | 59 18% | 98.8 -37% | 225.2 -213% | 173.5 -141% |
* ... Meglio usare valori piccoli
Power Consumption Witcher 3 / Stresstest
Power Consumption external Monitor
Pro
Contro
Verdetto - Un colpo di fortuna
Il SER6 Pro condivide molti degli stessi vantaggi e svantaggi del recente GTR6. In particolare, le prestazioni sono particolarmente elevate rispetto ad altri mini PC con grafica integrata, ma il rumore della ventola e il consumo energetico sono rispettivamente più rumorosi e leggermente superiori. I due principali svantaggi non sminuiscono l'incredibile valore che gli acquirenti possono ottenere: 32 GB di RAM, 500 GB di SSD NVMe, Windows 11 Pro e uno dei più veloci mini PC con grafica integrata, il tutto a soli 650 dollari.
Il Beelink SER6 Pro batte di gran lunga un NUC Intel Core serie U di prezzo equivalente sia in termini di prestazioni che di valore.
Per le revisioni future, ci piacerebbe vedere un adattatore CA più piccolo e una sola grande ventola interna invece di due più piccole. L'attuale adattatore CA è più pesante del mini PC stesso, mentre una ventola più grande permetterebbe di ottenere un rumore più basso e meno evidente. Gli utenti dovrebbero inoltre prestare attenzione a potenziali problemi di stabilità del frame rate durante i giochi. A parte questo, Beelink ha fatto centro con il suo SEi e SER sia in termini di prestazioni che di valore.
Prezzo e disponibilità
Amazon sta attualmente spedendo la nostra esatta configurazione SER6 Pro al prezzo di 650 dollari. Gli utenti possono anche acquistare direttamente dal produttore per 659 dollari.
Transparency
La selezione dei dispositivi da recensire viene effettuata dalla nostra redazione. Il campione di prova è stato fornito all'autore come prestito dal produttore o dal rivenditore ai fini di questa recensione. L'istituto di credito non ha avuto alcuna influenza su questa recensione, né il produttore ne ha ricevuto una copia prima della pubblicazione. Non vi era alcun obbligo di pubblicare questa recensione. In quanto società mediatica indipendente, Notebookcheck non è soggetta all'autorità di produttori, rivenditori o editori.
Ecco come Notebookcheck esegue i test
Ogni anno, Notebookcheck esamina in modo indipendente centinaia di laptop e smartphone utilizzando procedure standardizzate per garantire che tutti i risultati siano comparabili. Da circa 20 anni sviluppiamo continuamente i nostri metodi di prova e nel frattempo stabiliamo gli standard di settore. Nei nostri laboratori di prova, tecnici ed editori esperti utilizzano apparecchiature di misurazione di alta qualità. Questi test comportano un processo di validazione in più fasi. Il nostro complesso sistema di valutazione si basa su centinaia di misurazioni e parametri di riferimento ben fondati, che mantengono l'obiettività.Price comparison

