Recensione del mini PC Beelink GTR6 Ryzen 9 6900HX: Più veloce della maggior parte dei NUC Intel

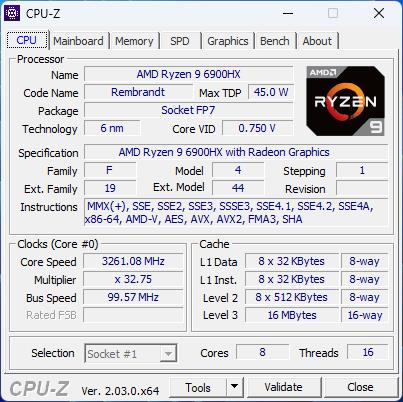
A differenza delle serie più piccole Beelink SEi o SER, alimentate da processori della serie U, la serie GTR è composta da modelli alimentati da processori della serie H, più veloci. Il GTR6 succede direttamente al vecchio GTR5 con una CPU aggiornata (da Zen 3 Ryzen 9 5900HX a Zen 3+ Ryzen 9 6900HX) e una leggera riprogettazione dello chassis. I nostri benchmark di seguito mostrano che si tratta di uno dei mini PC più veloci dell'ampia gamma di prodotti Beelink.
L'unità in esame è un GTR6 completamente configurato con 32 GB di RAM e 512 GB di SSD NVMe al prezzo di circa 750 dollari. Tutte le opzioni sono dotate della stessa CPU Ryzen 9 6900HX e della stessa GPU Radeon 680M integrata. Il GTR6 compete direttamente con i NUC di Intel dotati di grafica integrata.
Altre recensioni di Beelink:
Potenziali concorrenti a confronto
Punteggio | Data | Modello | Peso | Altezza | Dimensione | Risoluzione | Prezzo |
|---|---|---|---|---|---|---|---|
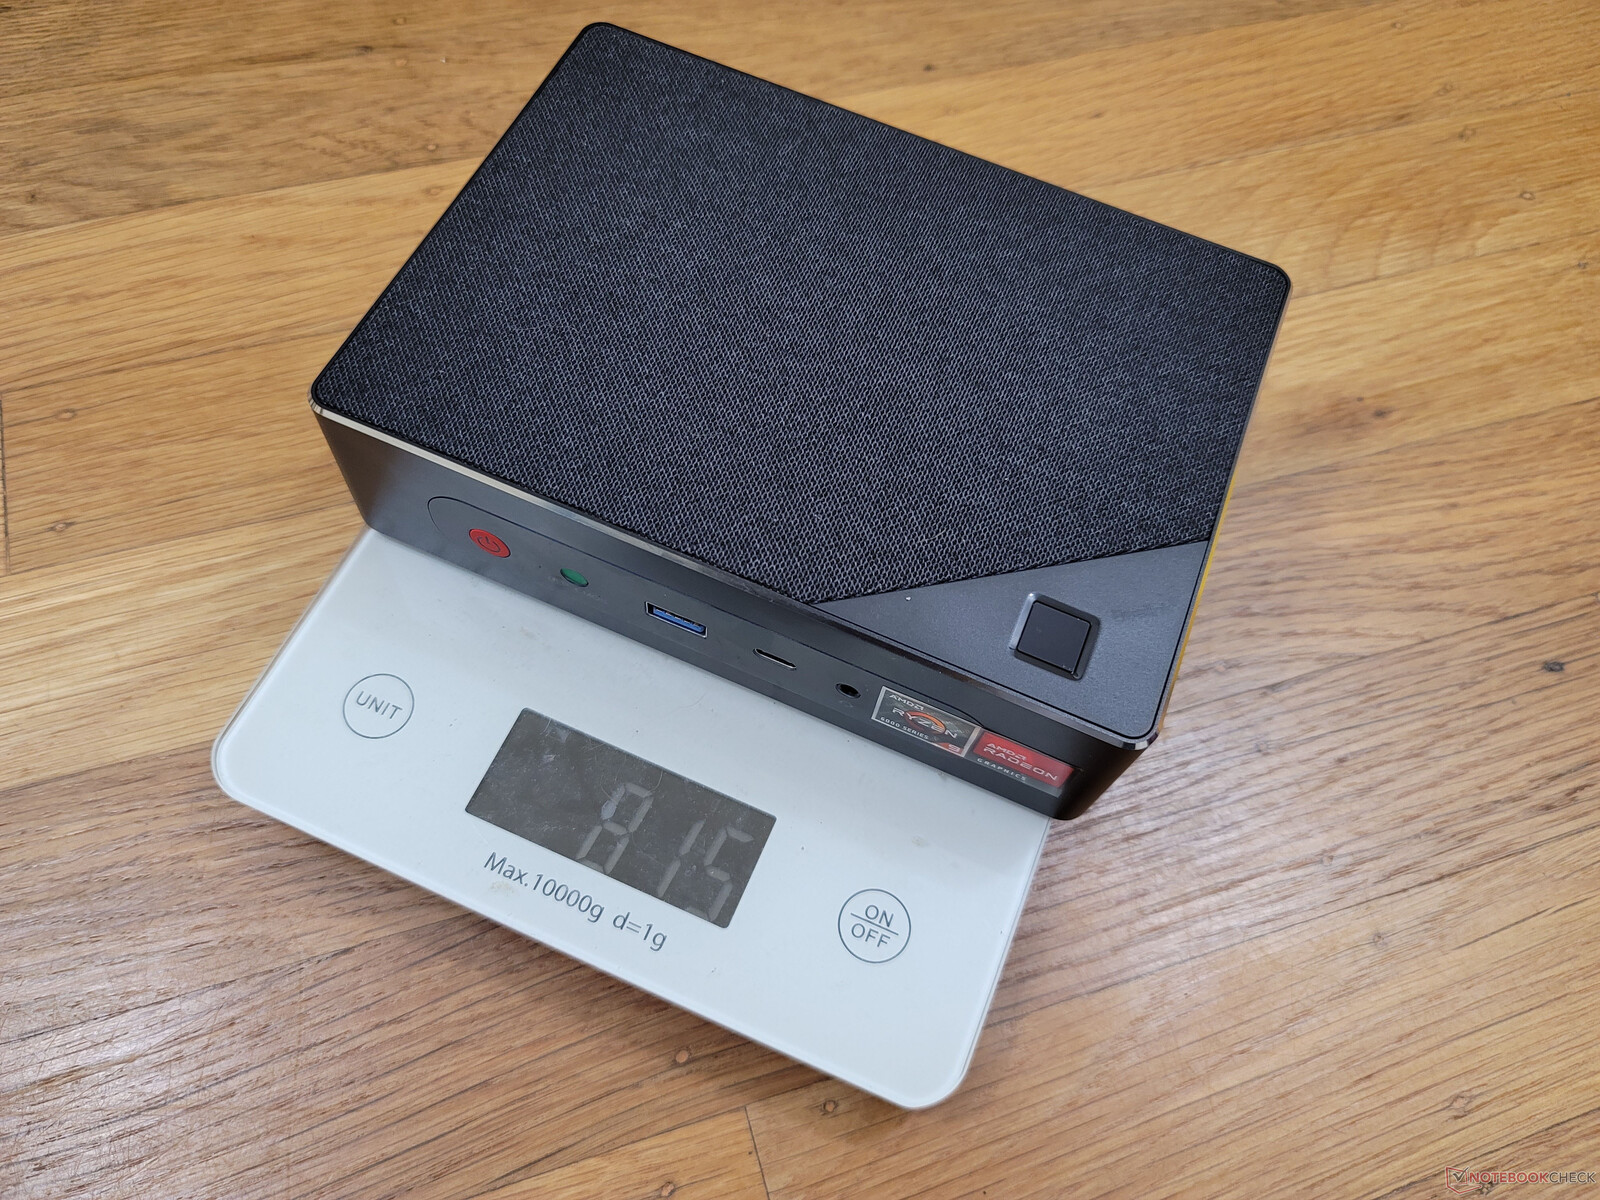
v (old) | 11/2022 | Beelink GTR6 R9 6900HX, Radeon 680M | 815 gr | 43 mm | x | ||
v (old) | 09/2022 | Beelink SEi11 Pro i5-11320H, Iris Xe G7 96EUs | 440 gr | 40 mm | x | ||
v (old) | 01/2022 | Beelink GTR5 R9 5900HX, Vega 8 | 686 gr | 39 mm | x | ||
v (old) | 04/2021 | Intel NUC11PHKi7C i7-1165G7, GeForce RTX 2060 Mobile | 1.4 kg | 42 mm | x | ||
v (old) | 04/2021 | Intel NUC11TNKi5 i5-1135G7, Iris Xe G7 80EUs | 504 gr | 37 mm | x | ||
v (old) | 03/2021 | GMK NucBox 2 i5-8259U, Iris Plus Graphics 655 | 430 gr | 50 mm | x |
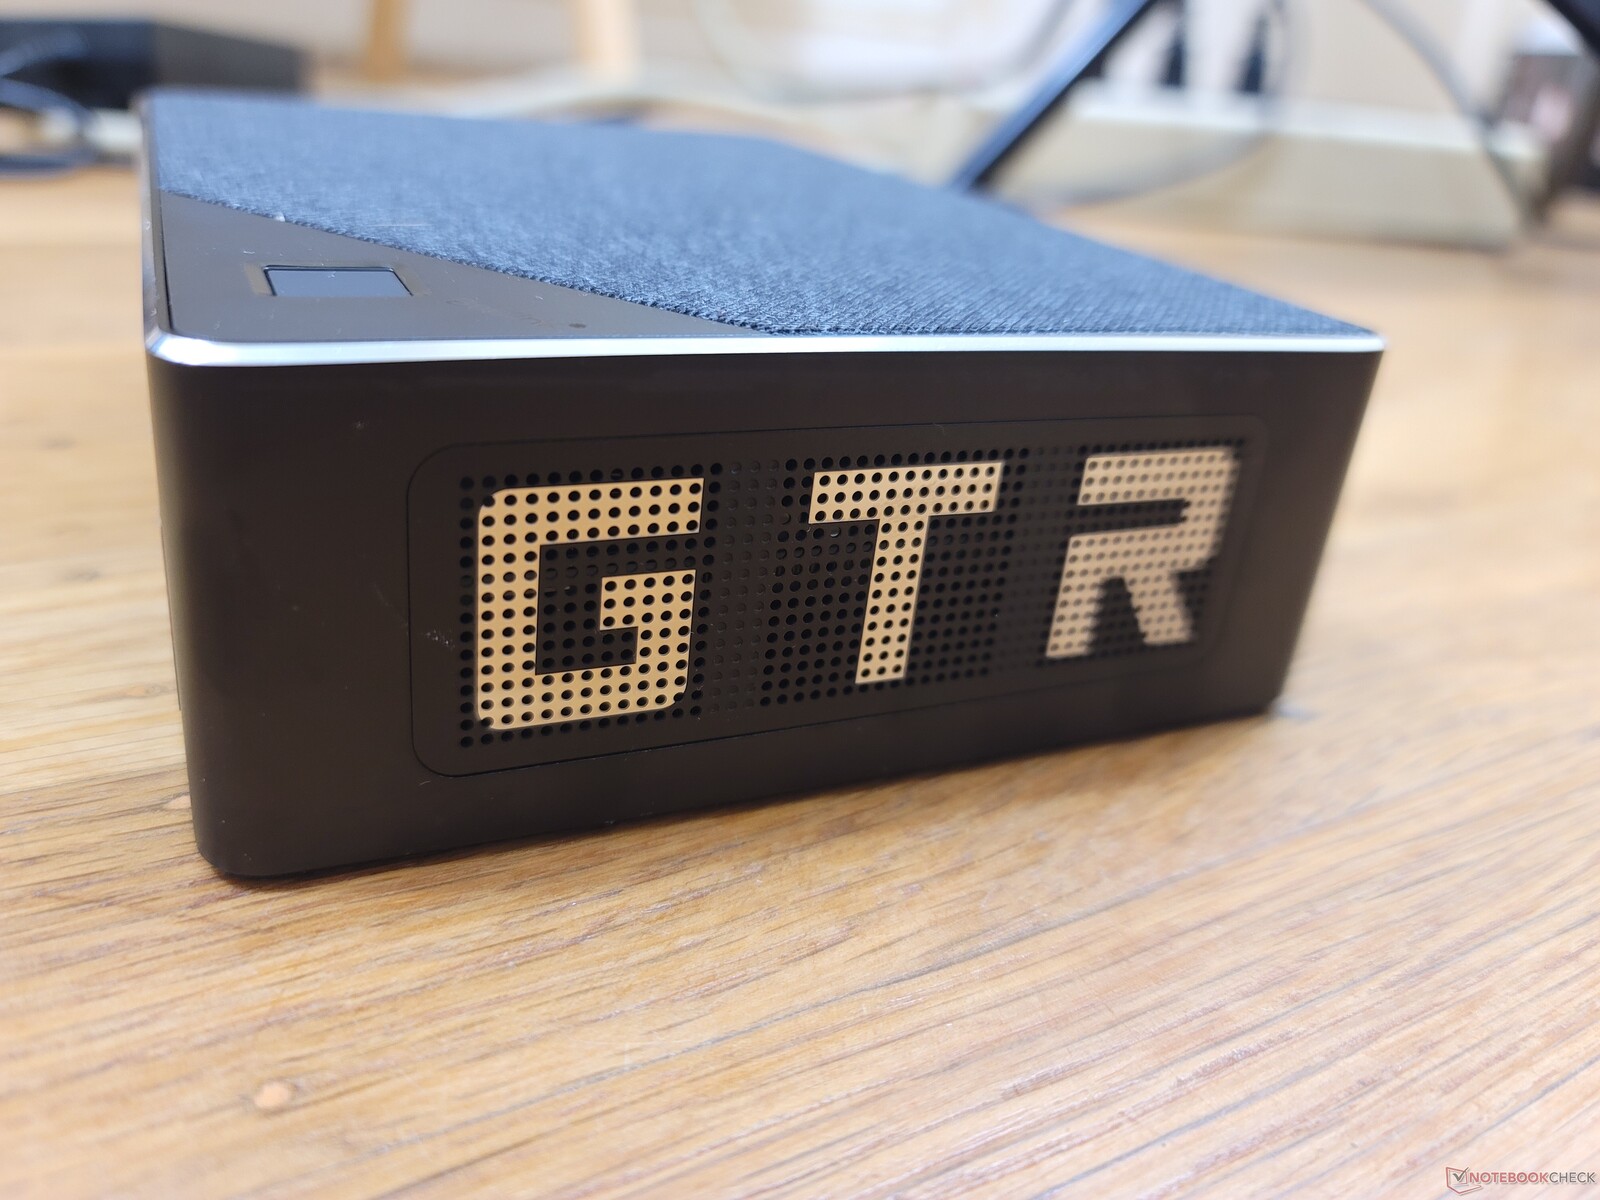
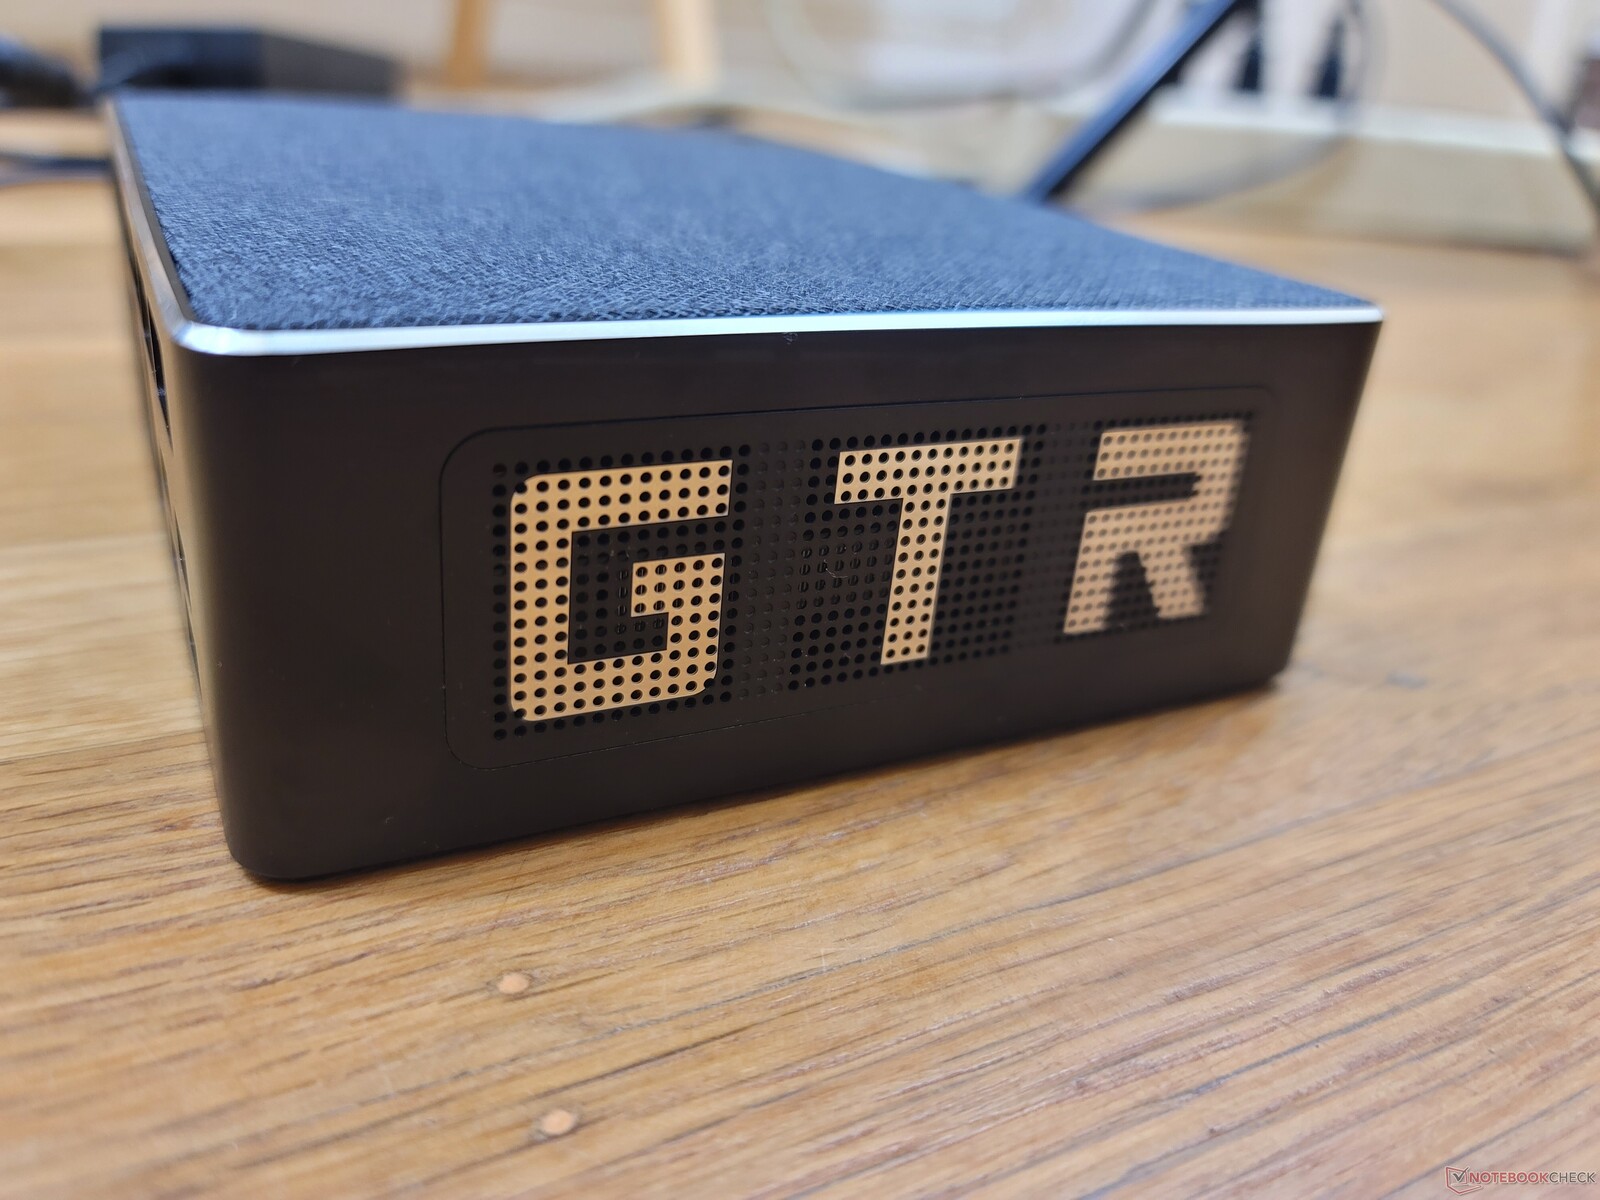
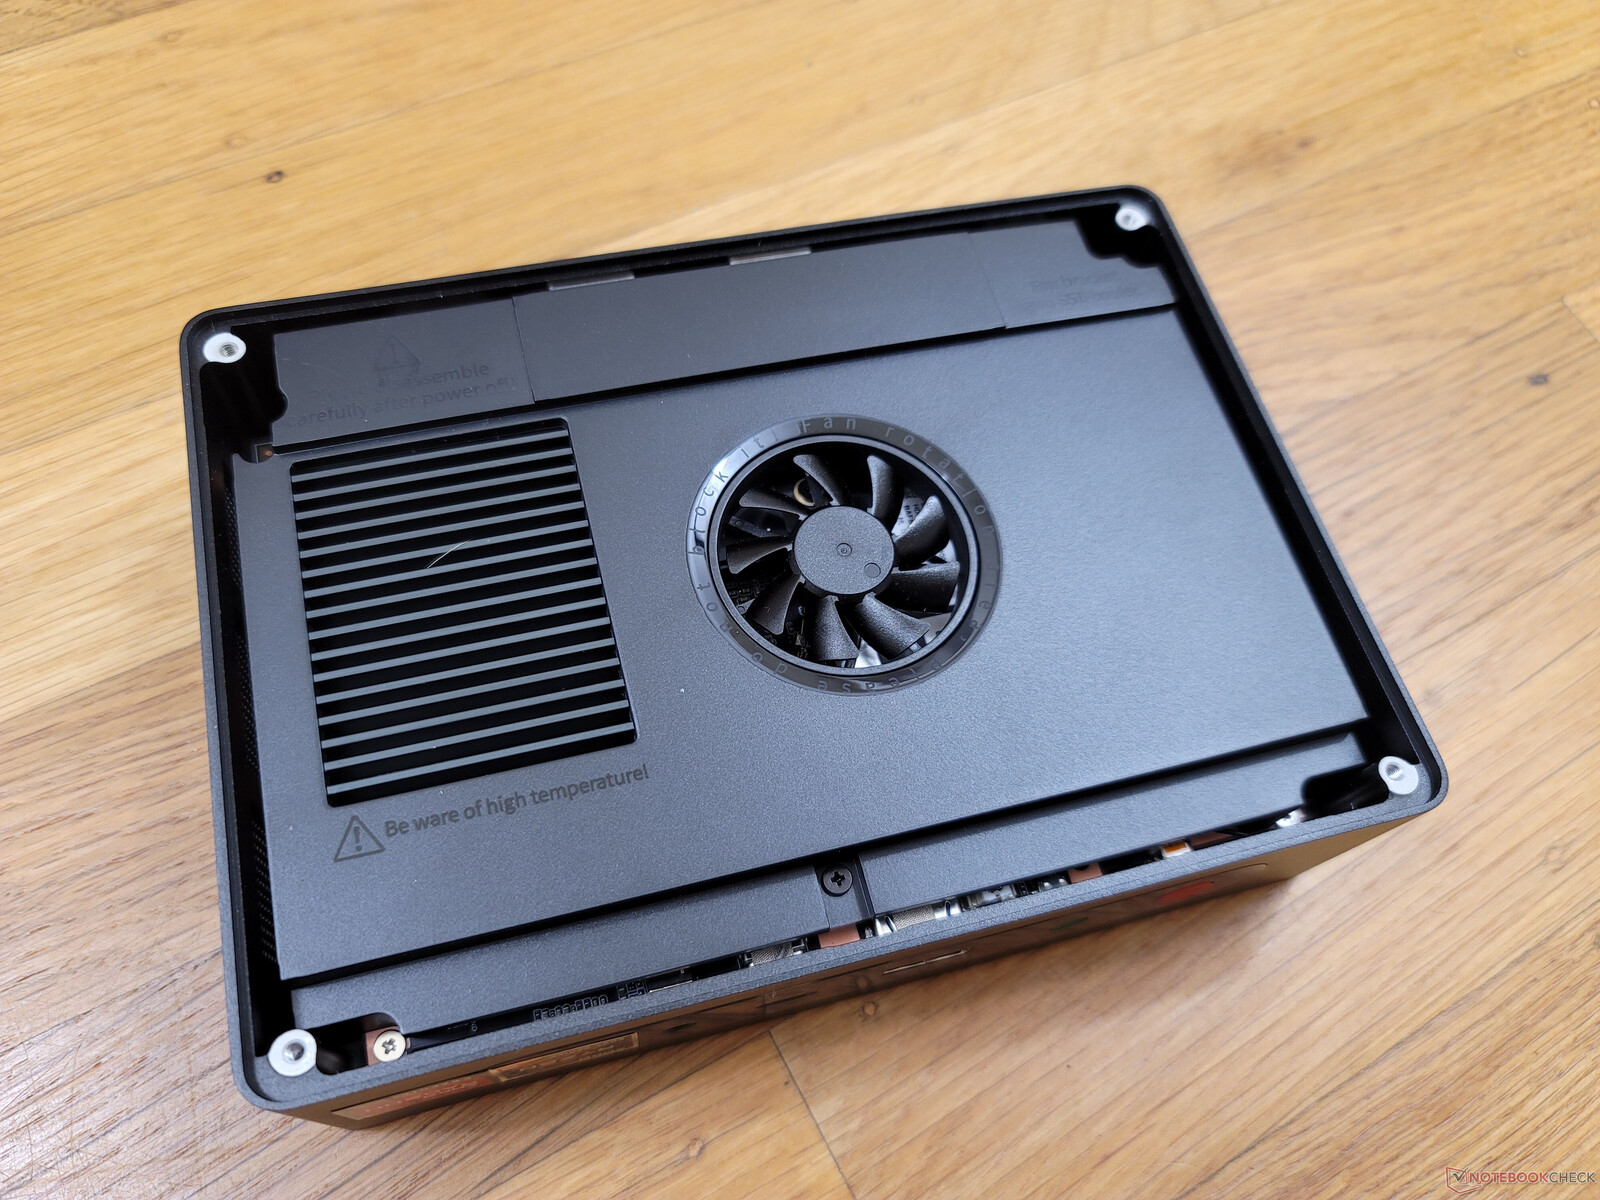
Valigetta - Nuovo top in rete morbida
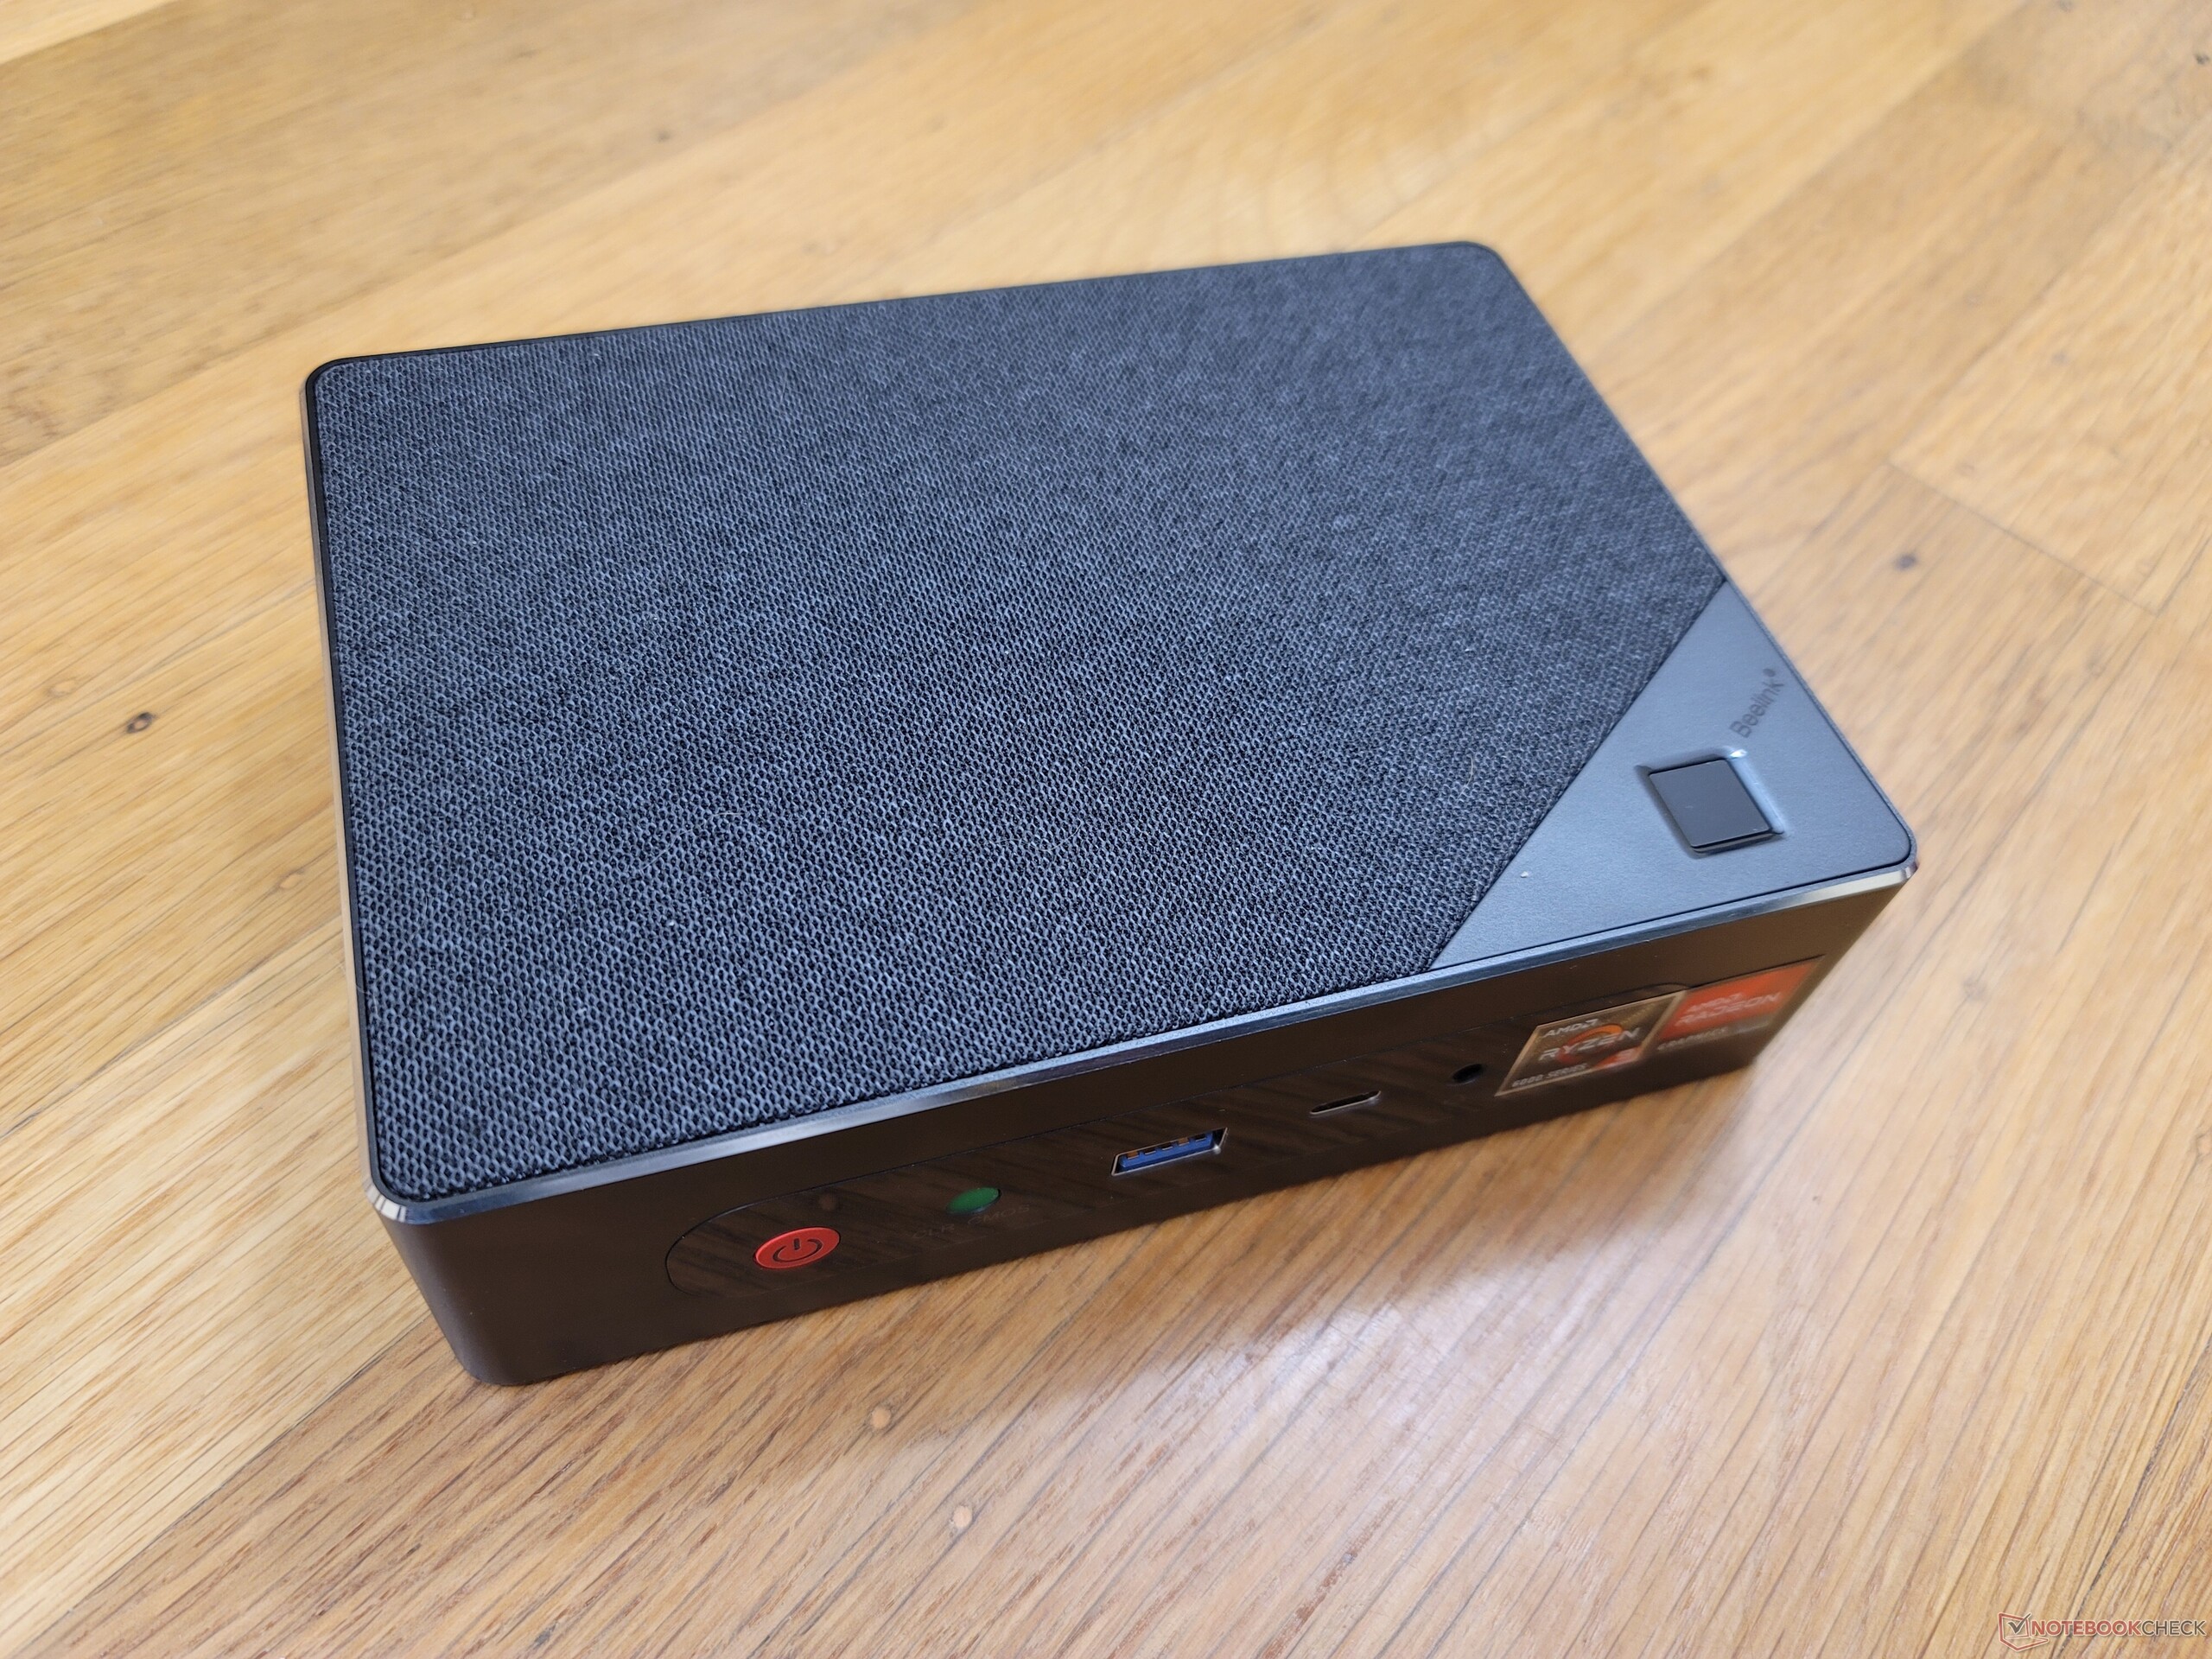
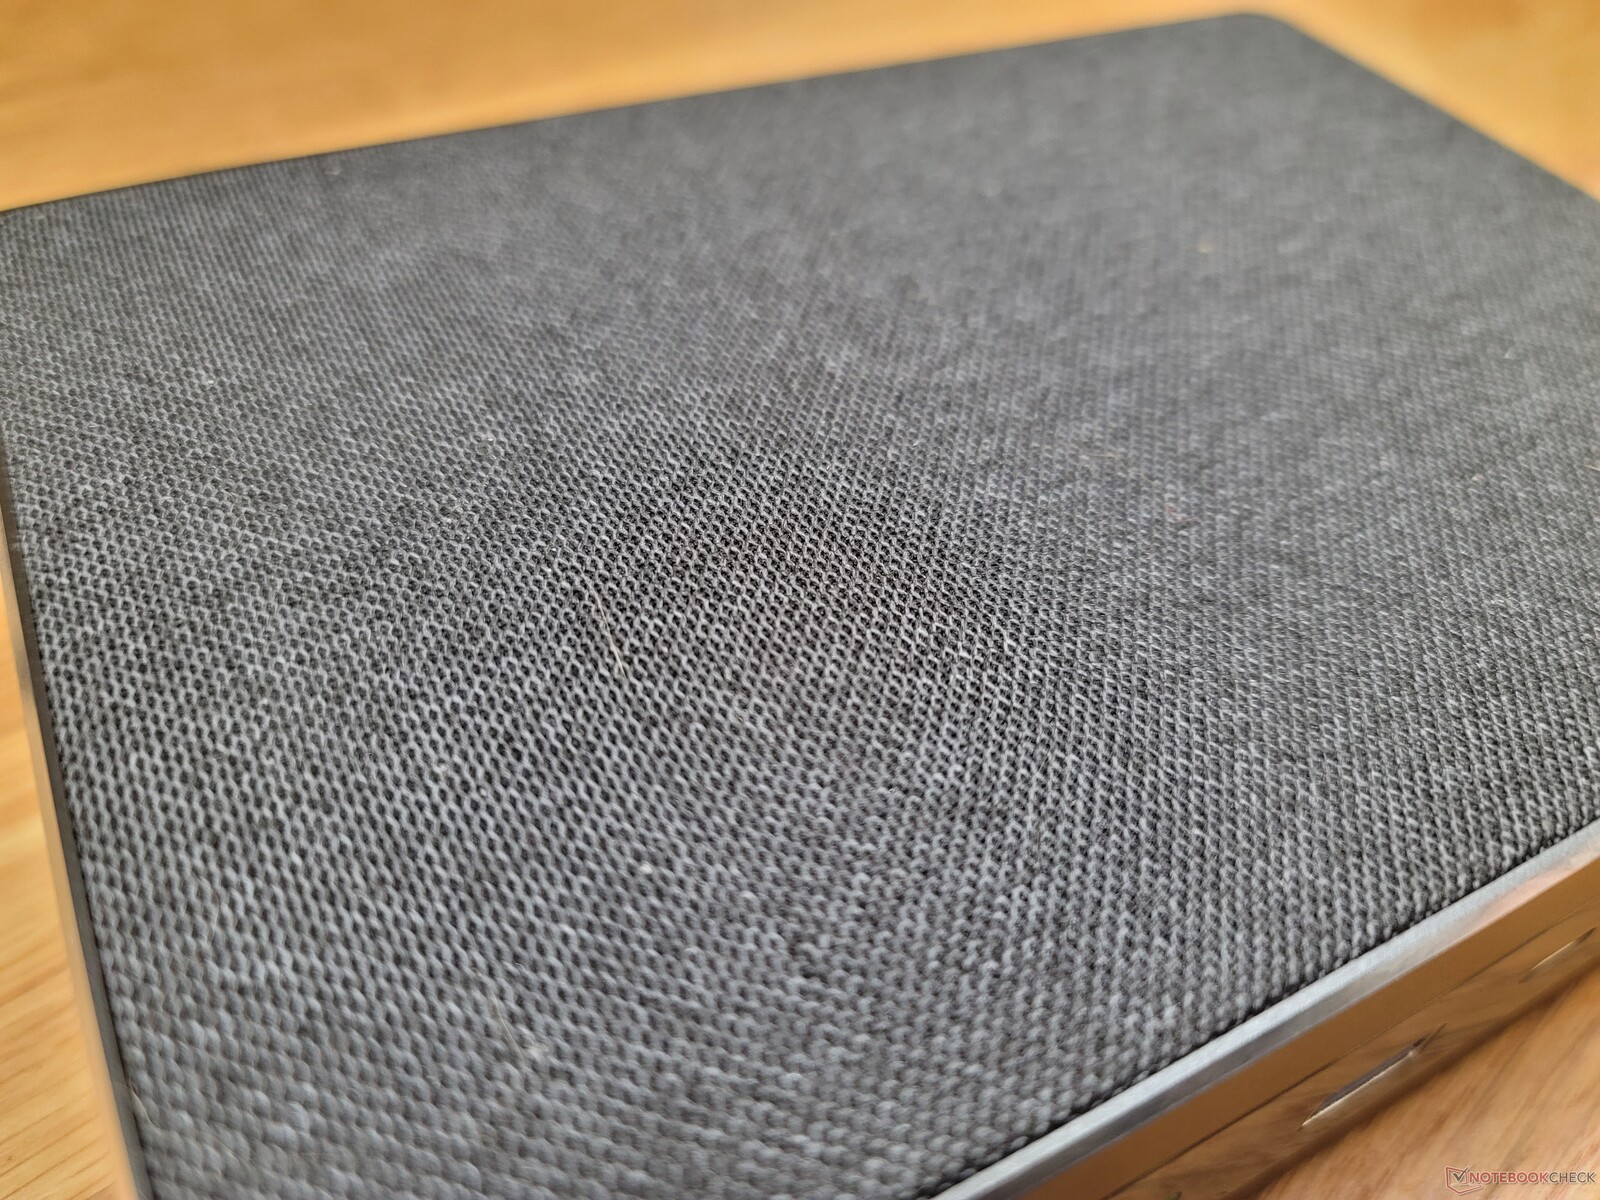
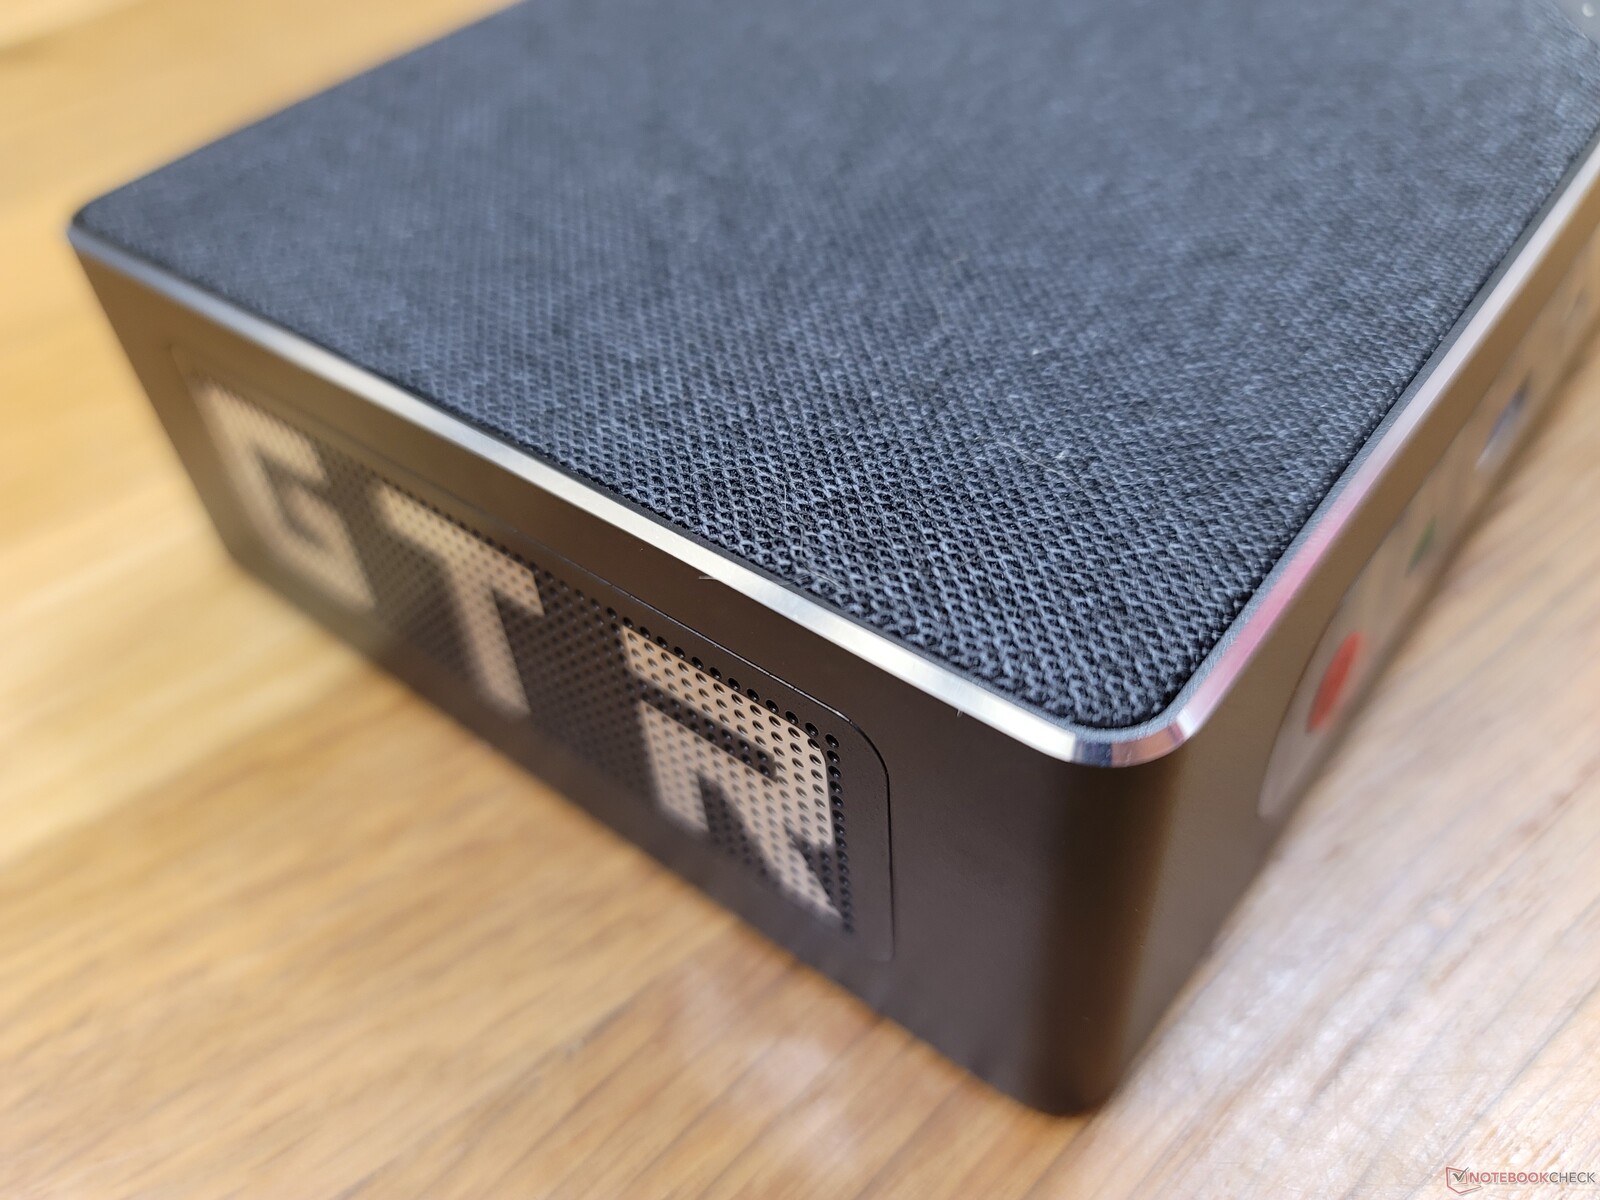
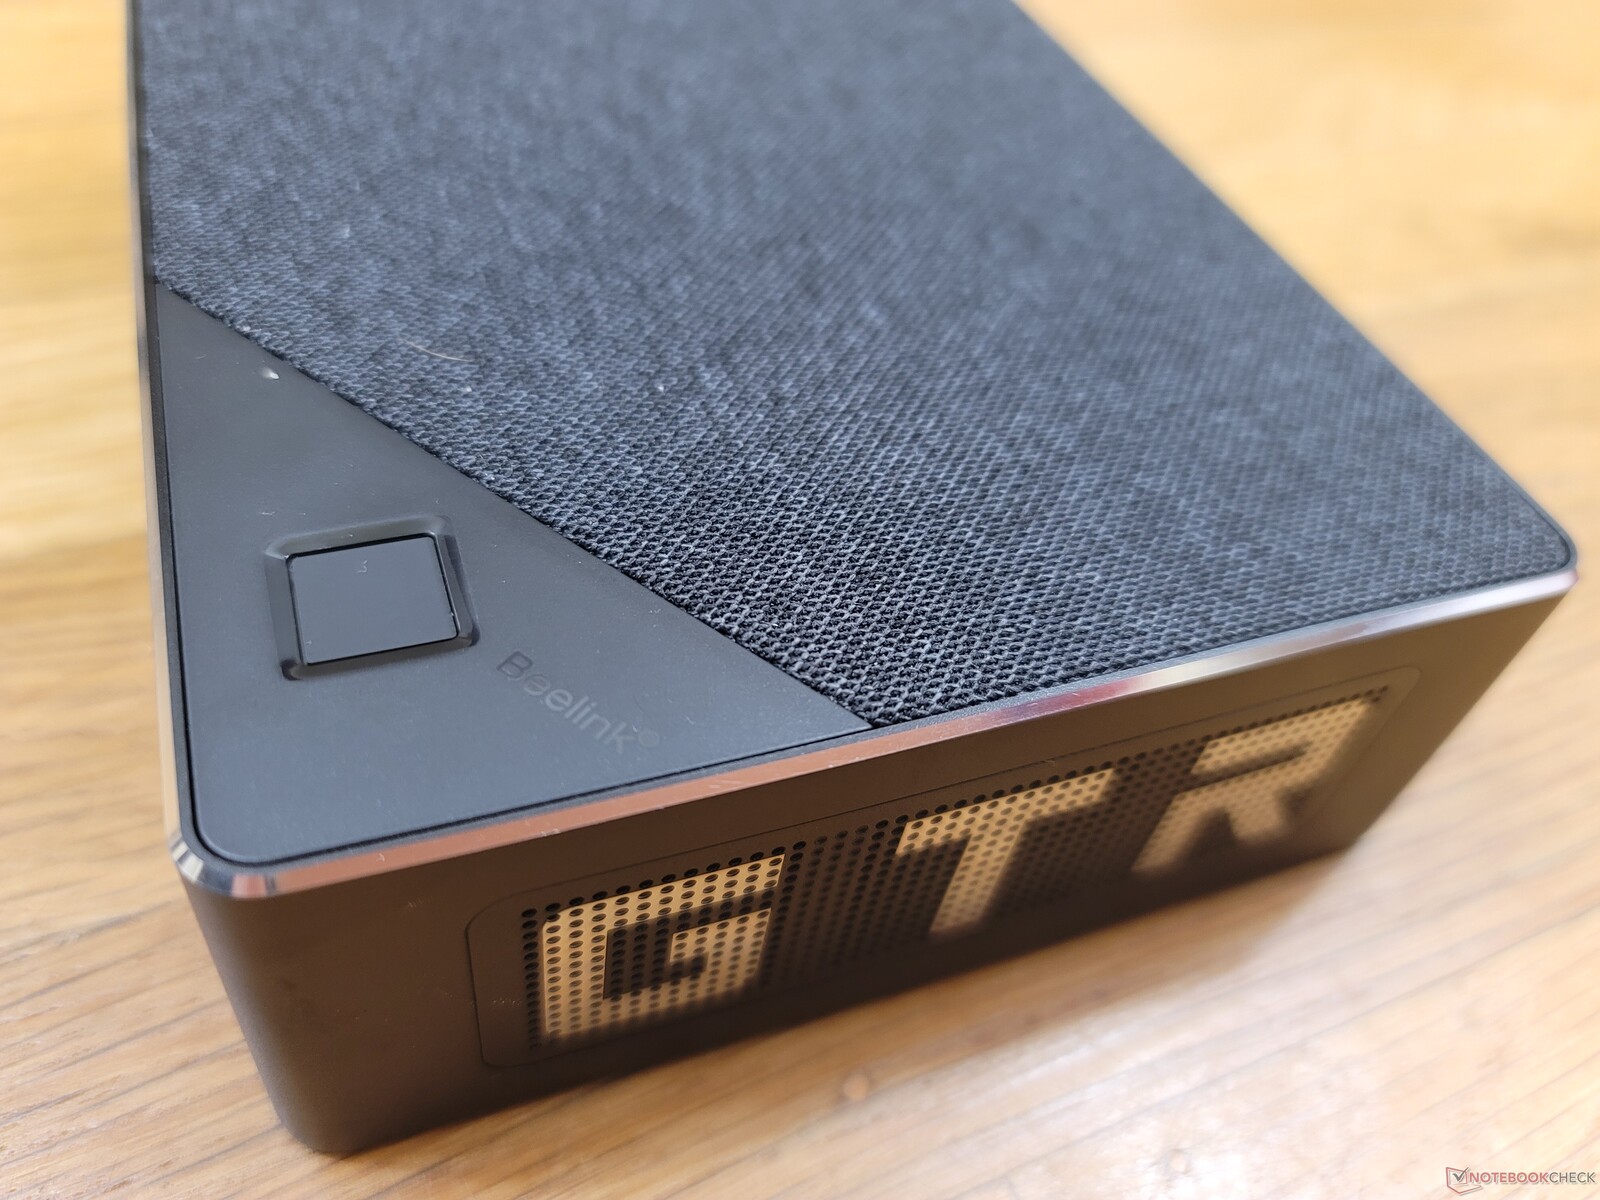
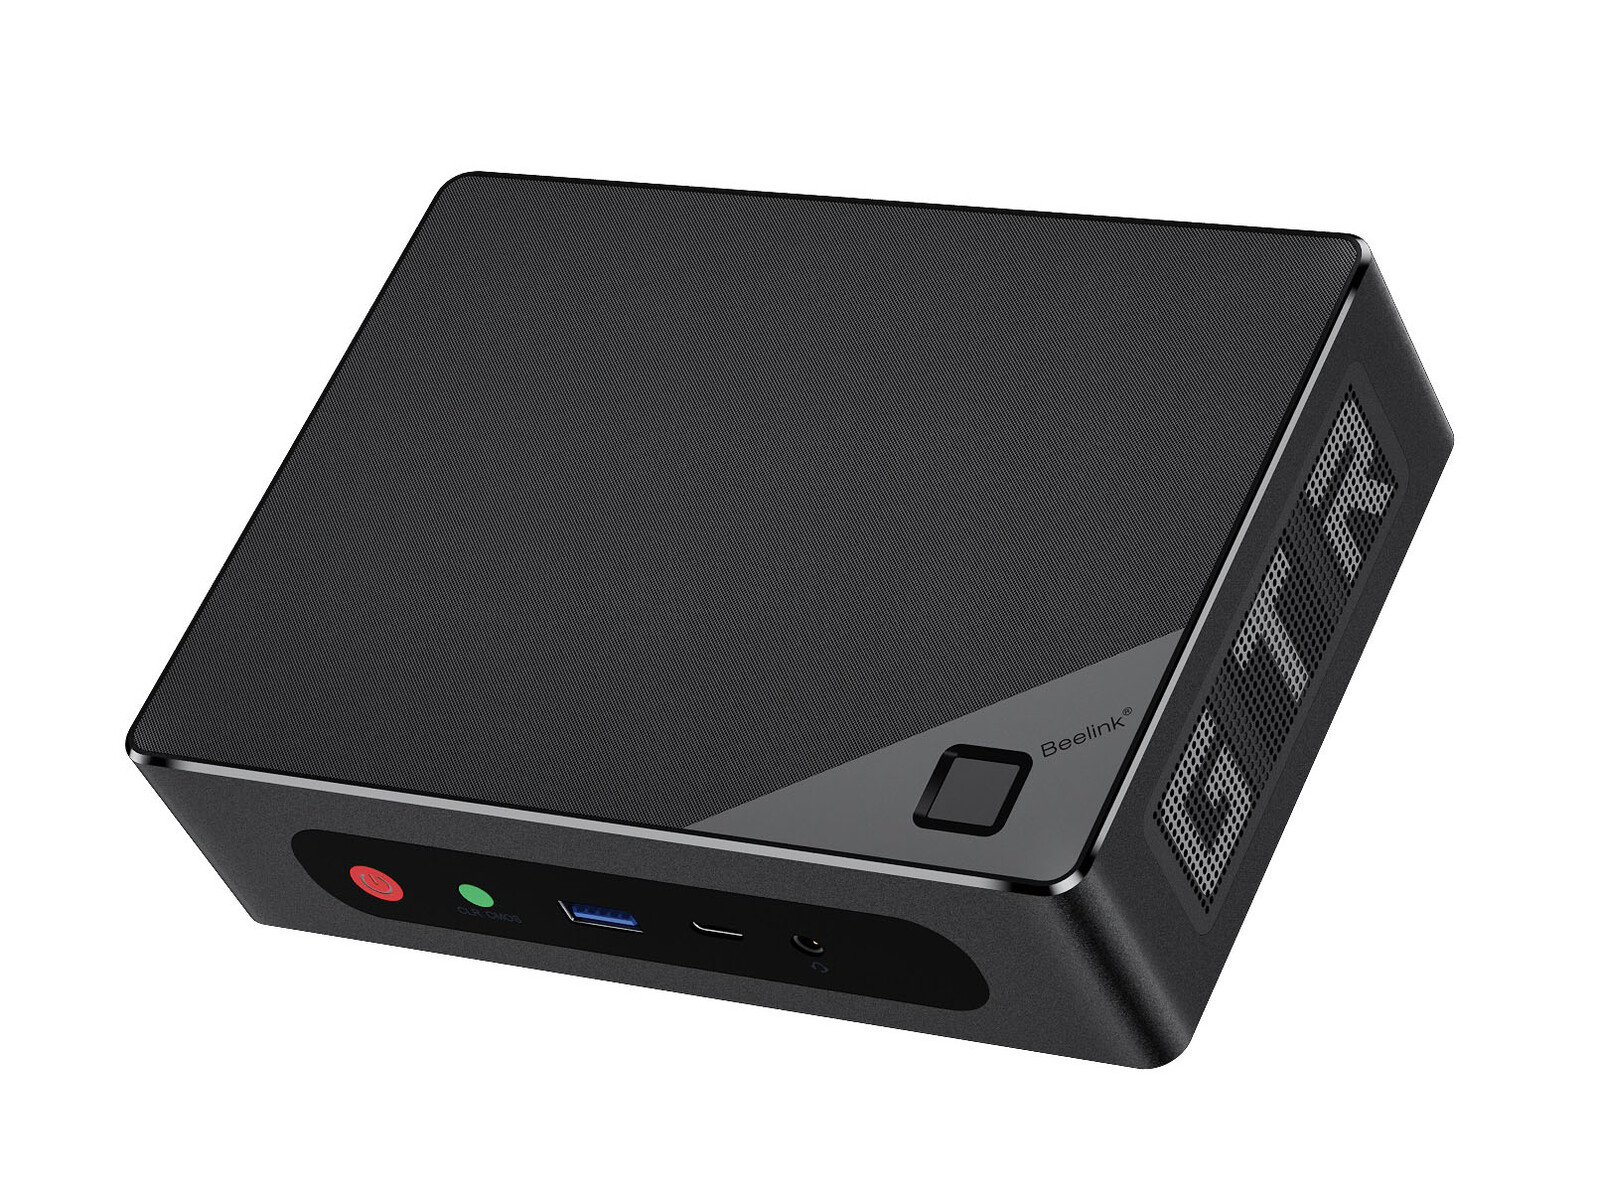
Il case è robusto, con i suoi lati in metallo e la rete morbida e traspirante sulla parte superiore per il flusso d'aria. Quest'ultima, in particolare, è una novità per Beelink, dato che i precedenti mini PC dell'azienda presentavano invece top in plastica o metallo. La rete rimovibile aggiunge un elemento di qualità o di lusso al design complessivo.
Il GTR6 è più spesso e più pesante del GTR5 e della maggior parte dei modelli NUC Intel. Le dimensioni maggiori sono dovute in parte al processore AMD HX, più esigente rispetto alla serie Intel Core U.
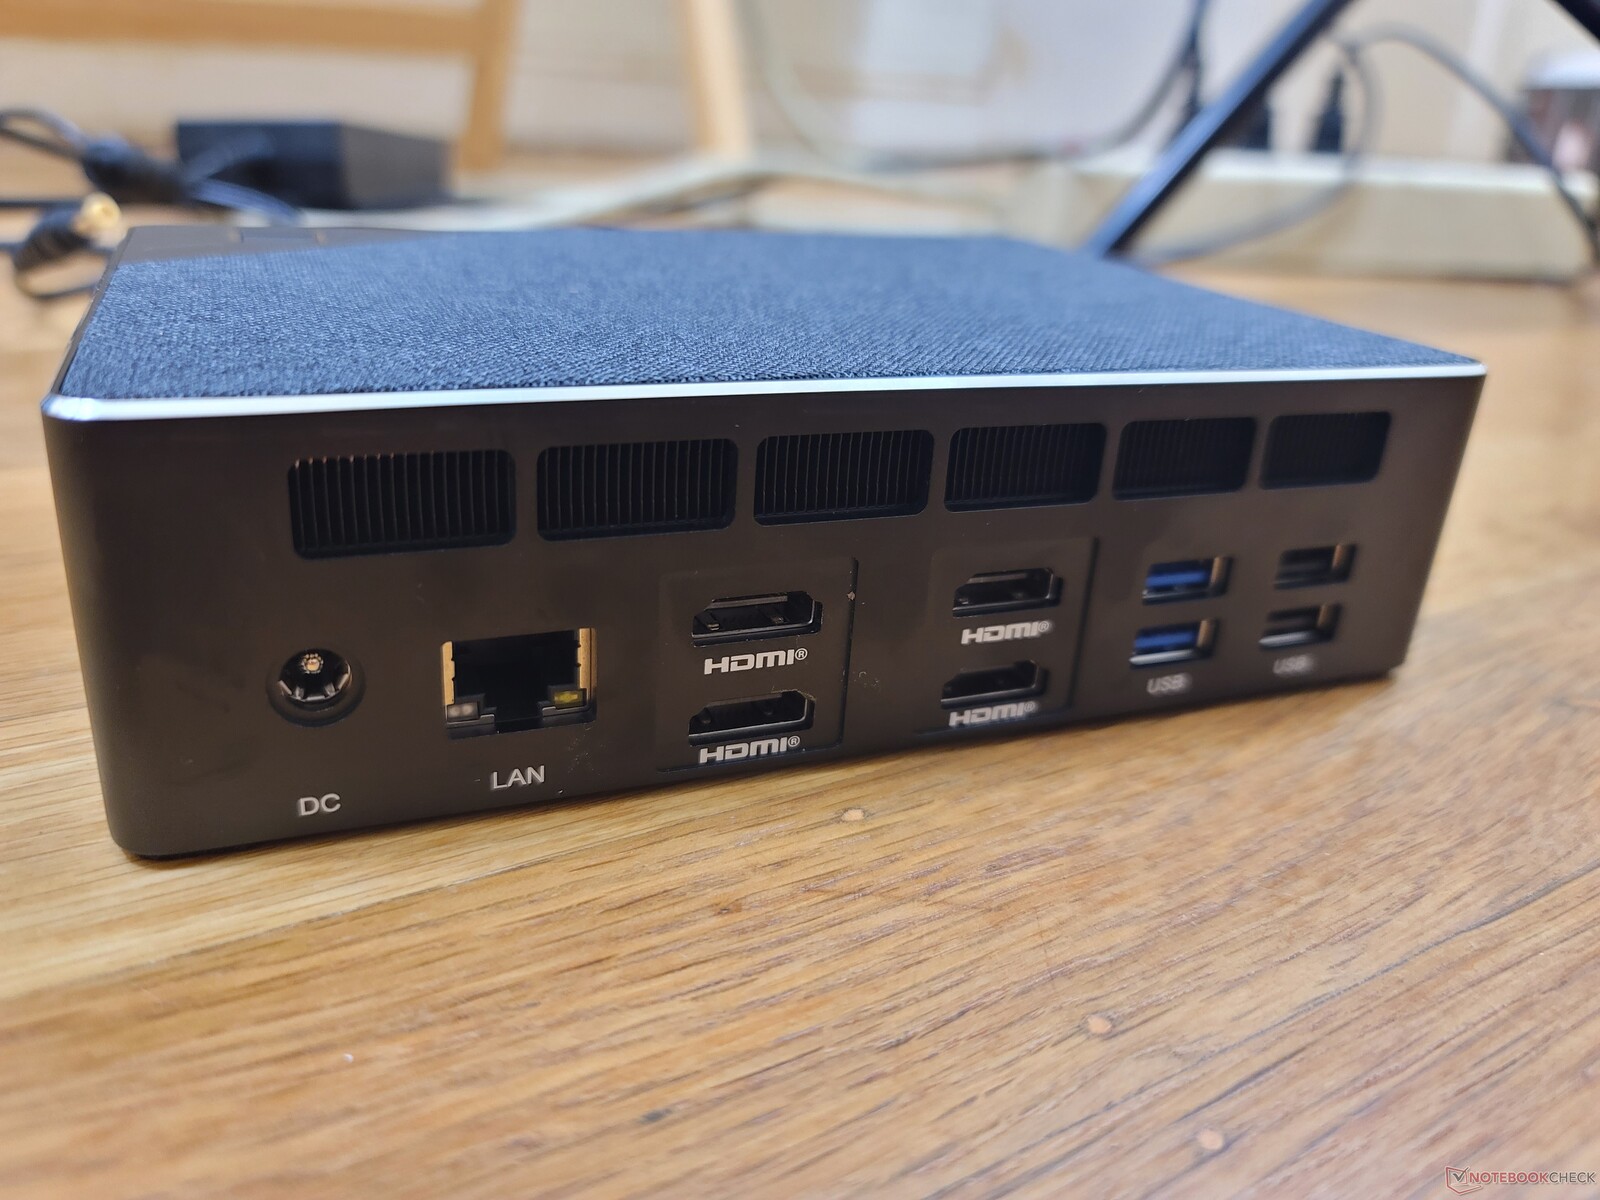
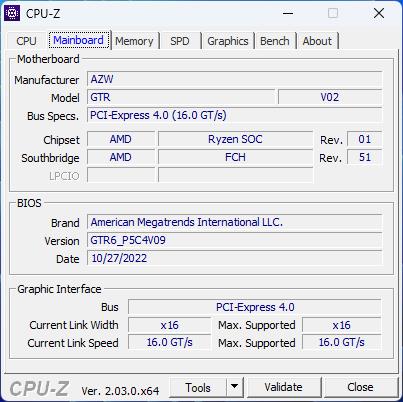
Connettività - Niente Thunderbolt
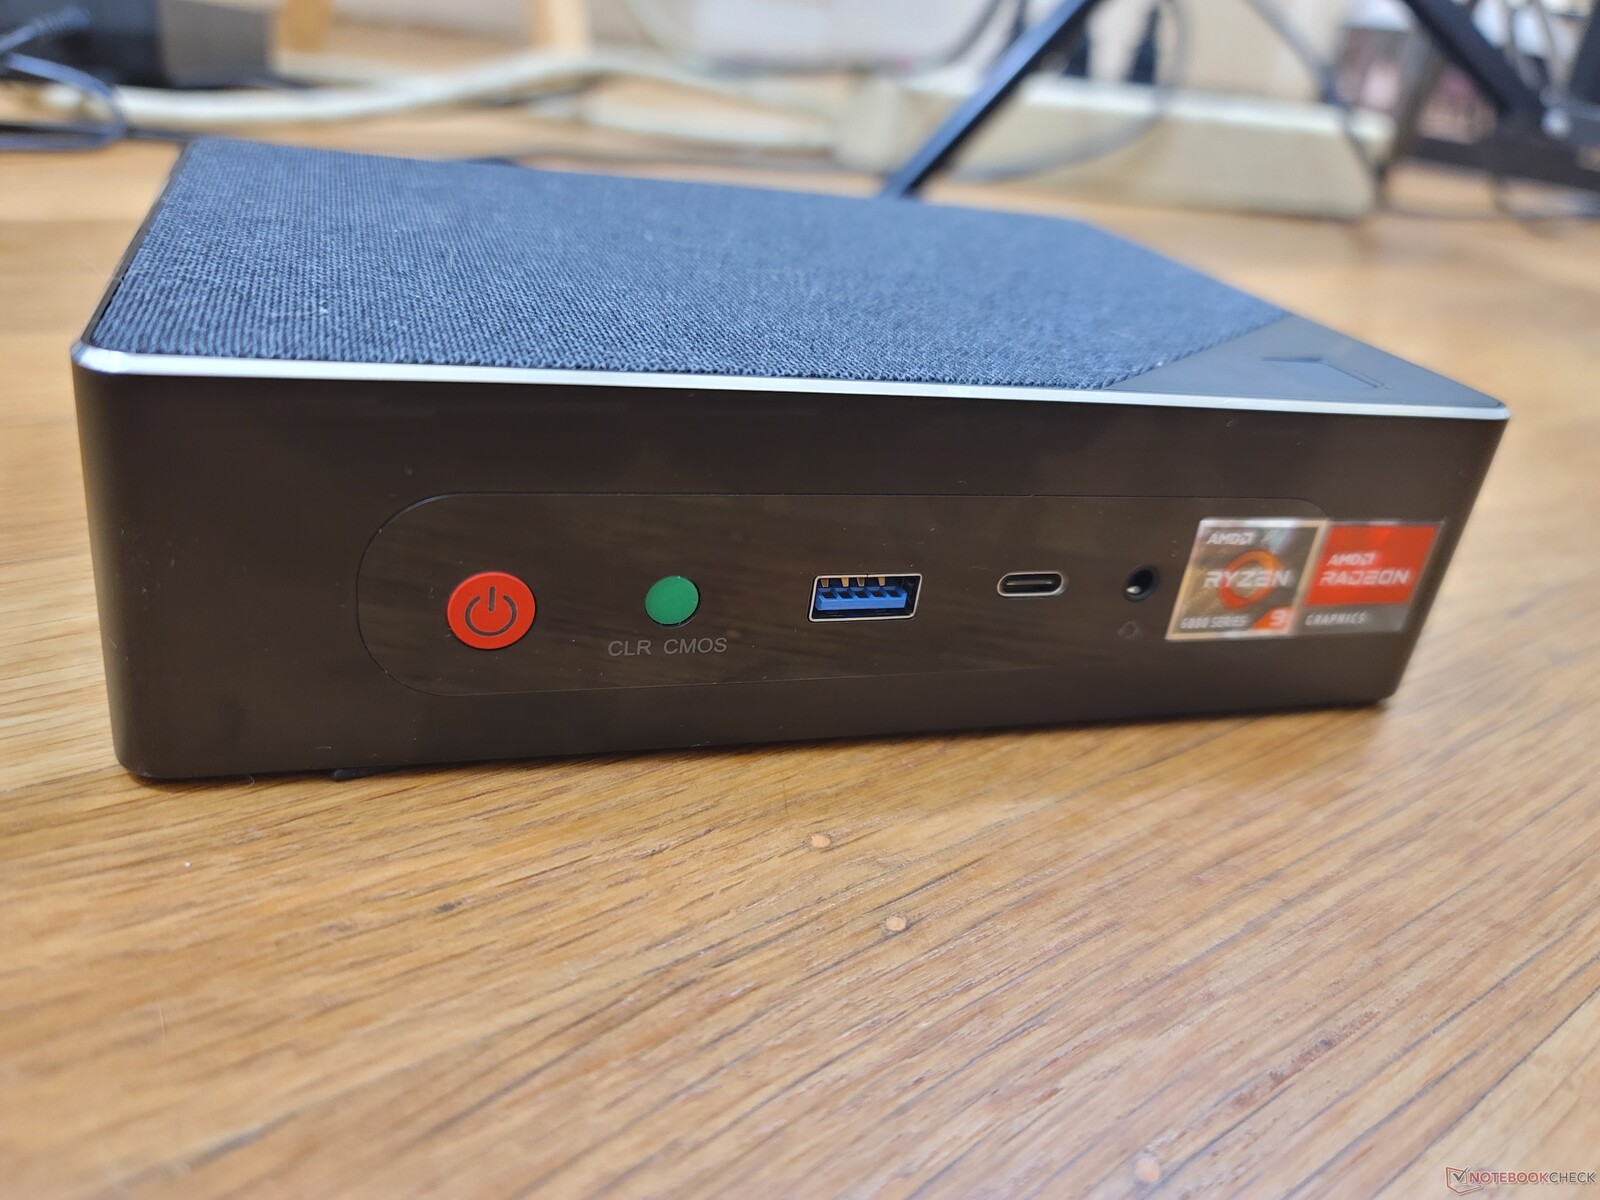
Le opzioni di porta sono eccellenti, con quattro porte HDMI 2.1 individuali che supportano monitor fino a 8K a 60 Hz. Tuttavia, è presente solo una porta USB-C e la porta LAN è solo a 1 Gbps, mentre molti modelli NUC ora supportano 10 Gbps
Thunderbolt non è supportata a causa della CPU AMD.
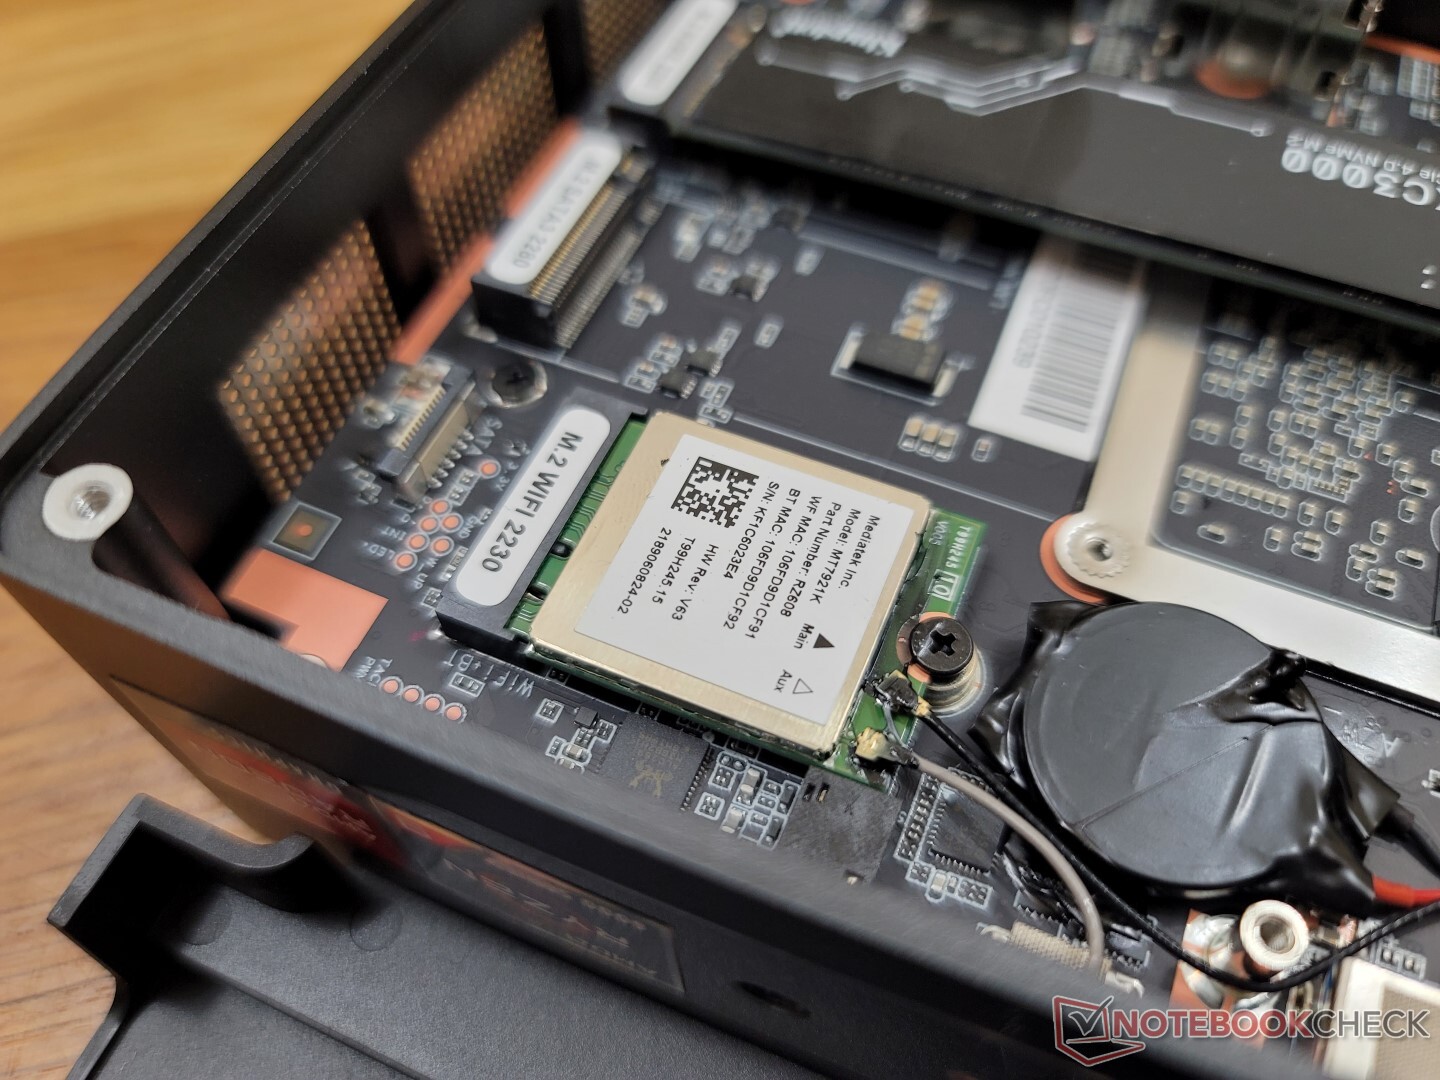
Comunicazione - Wi-Fi 6E Standard
Il MediaTek RZ608 è di serie per la connettività Wi-Fi 6E e Bluetooth 5.2. Le velocità di trasferimento sono costanti, anche se più lente rispetto alla maggior parte delle soluzioni Intel AX201/210
L'RZ608 sulla nostra unità di prova è stato lento a rilevare la nostra rete AXE11000 a 6 GHz anche dopo l'aggiornamento ai driver più recenti al momento in cui scriviamo. Potrebbe essere necessario attendere diversi minuti prima che il sistema riesca a rilevare e connettersi alla rete a 6 GHz.
| Networking | |
| iperf3 transmit AX12 | |
| Intel NUC11TNKi5 | |
| Intel NUC11PHKi7C | |
| Beelink GTR5 | |
| GMK NucBox 2 | |
| iperf3 receive AX12 | |
| Intel NUC11TNKi5 | |
| Intel NUC11PHKi7C | |
| Beelink GTR5 | |
| GMK NucBox 2 | |
| iperf3 receive AXE11000 6GHz | |
| Beelink GTR6 | |
| Beelink SEi11 Pro | |
| iperf3 receive AXE11000 | |
| Beelink GTR6 | |
| iperf3 transmit AXE11000 | |
| Beelink GTR6 | |
| iperf3 transmit AXE11000 6GHz | |
| Beelink GTR6 | |
| Beelink SEi11 Pro | |
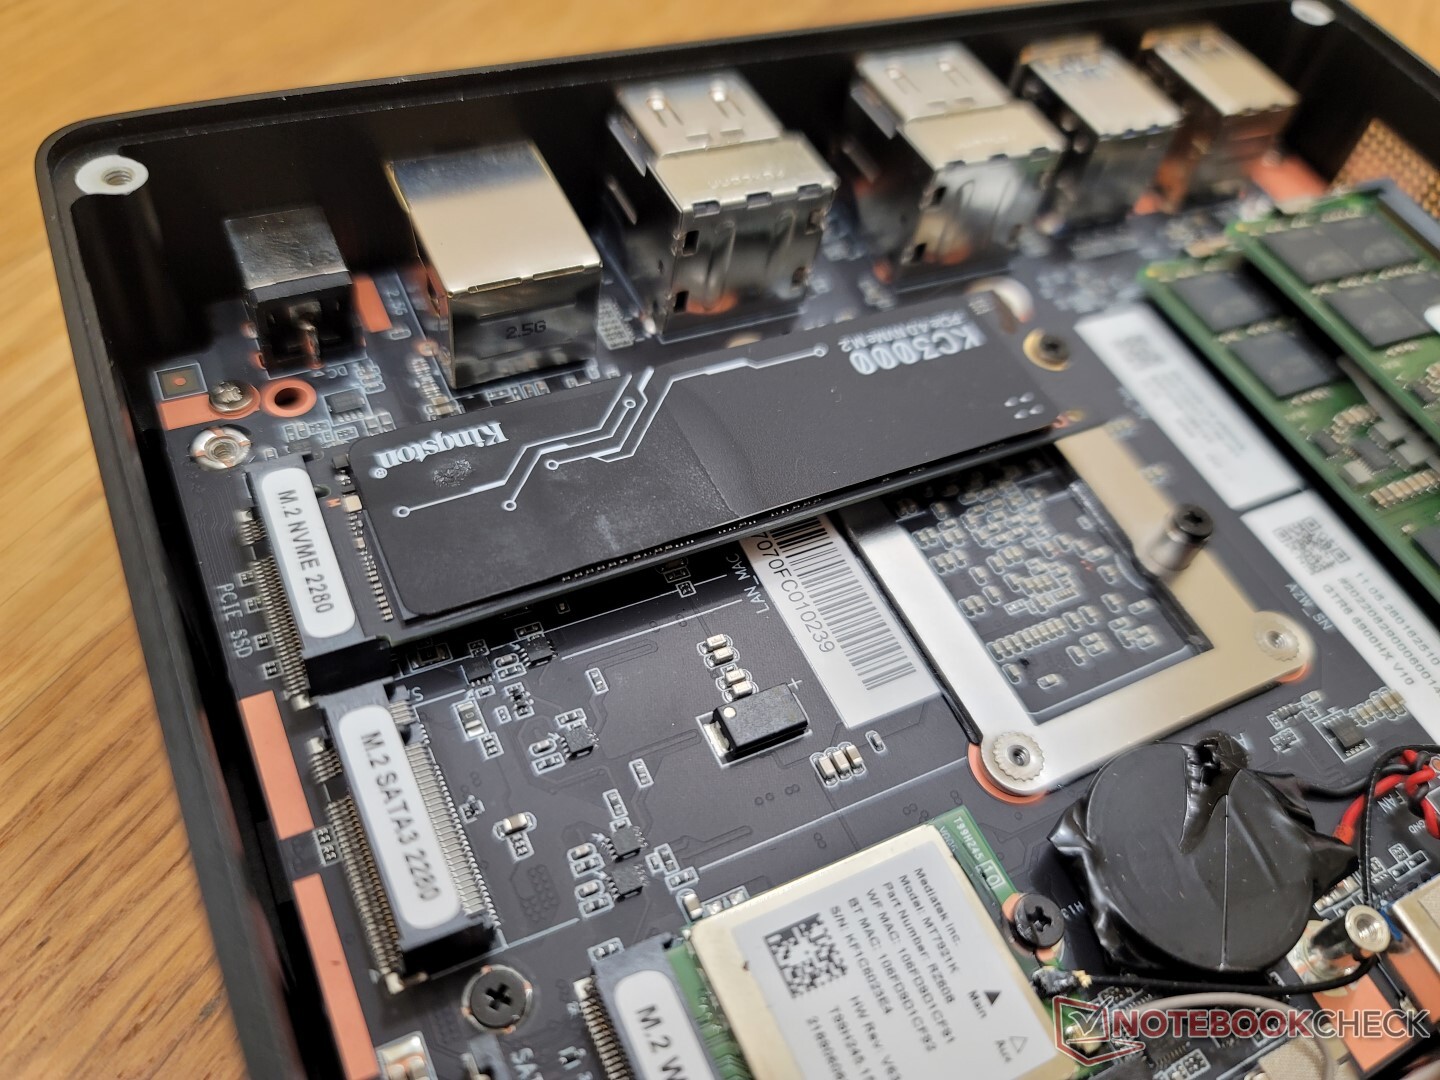
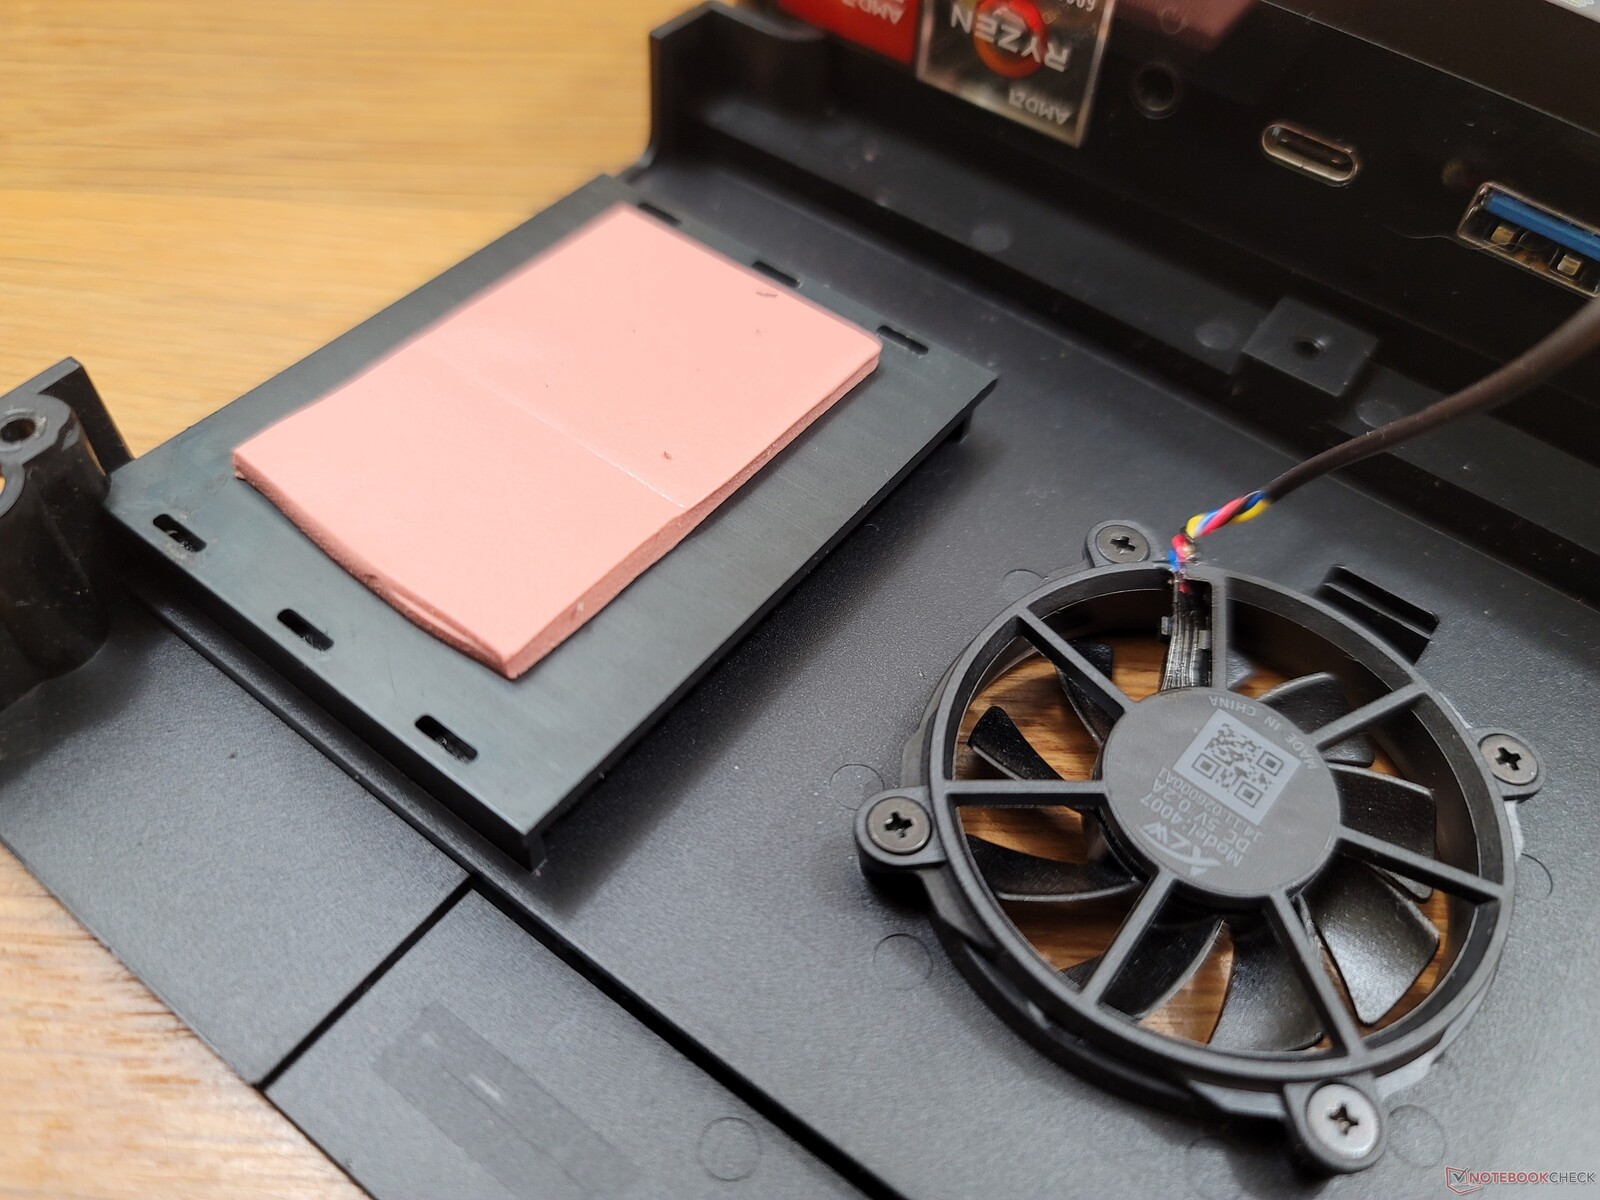
Manutenzione
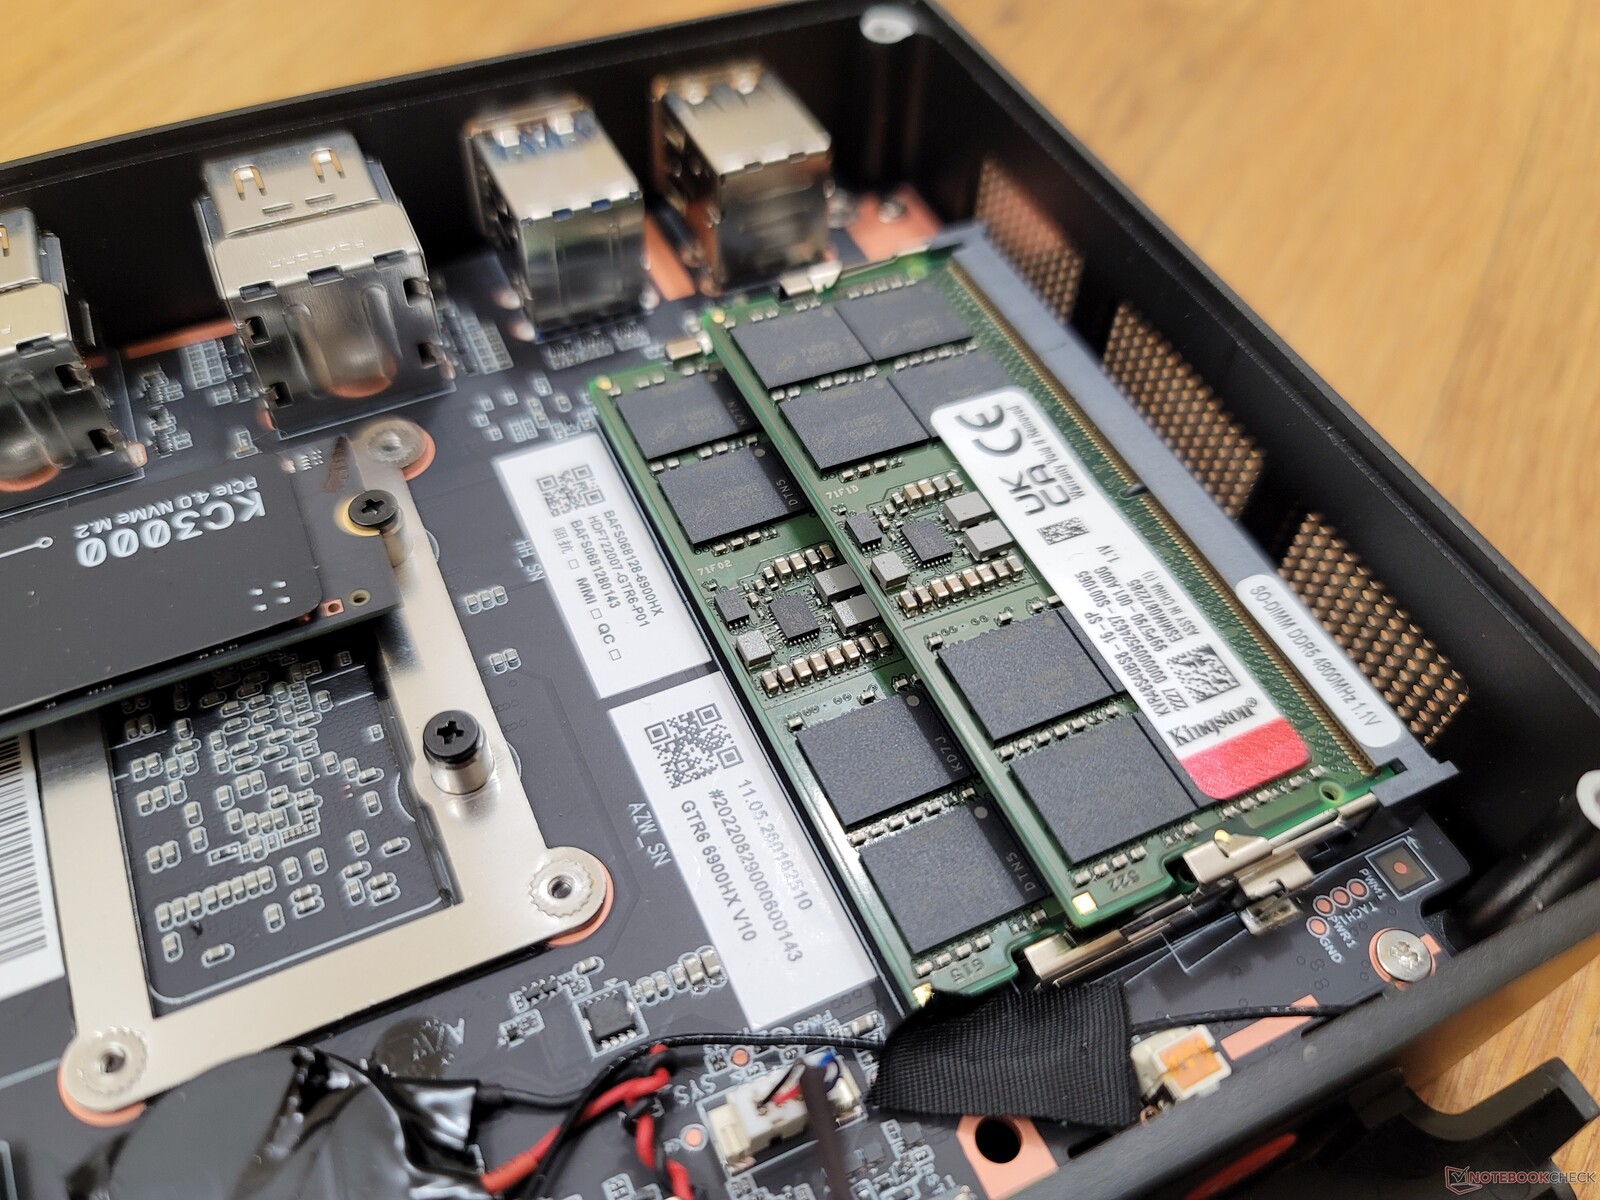
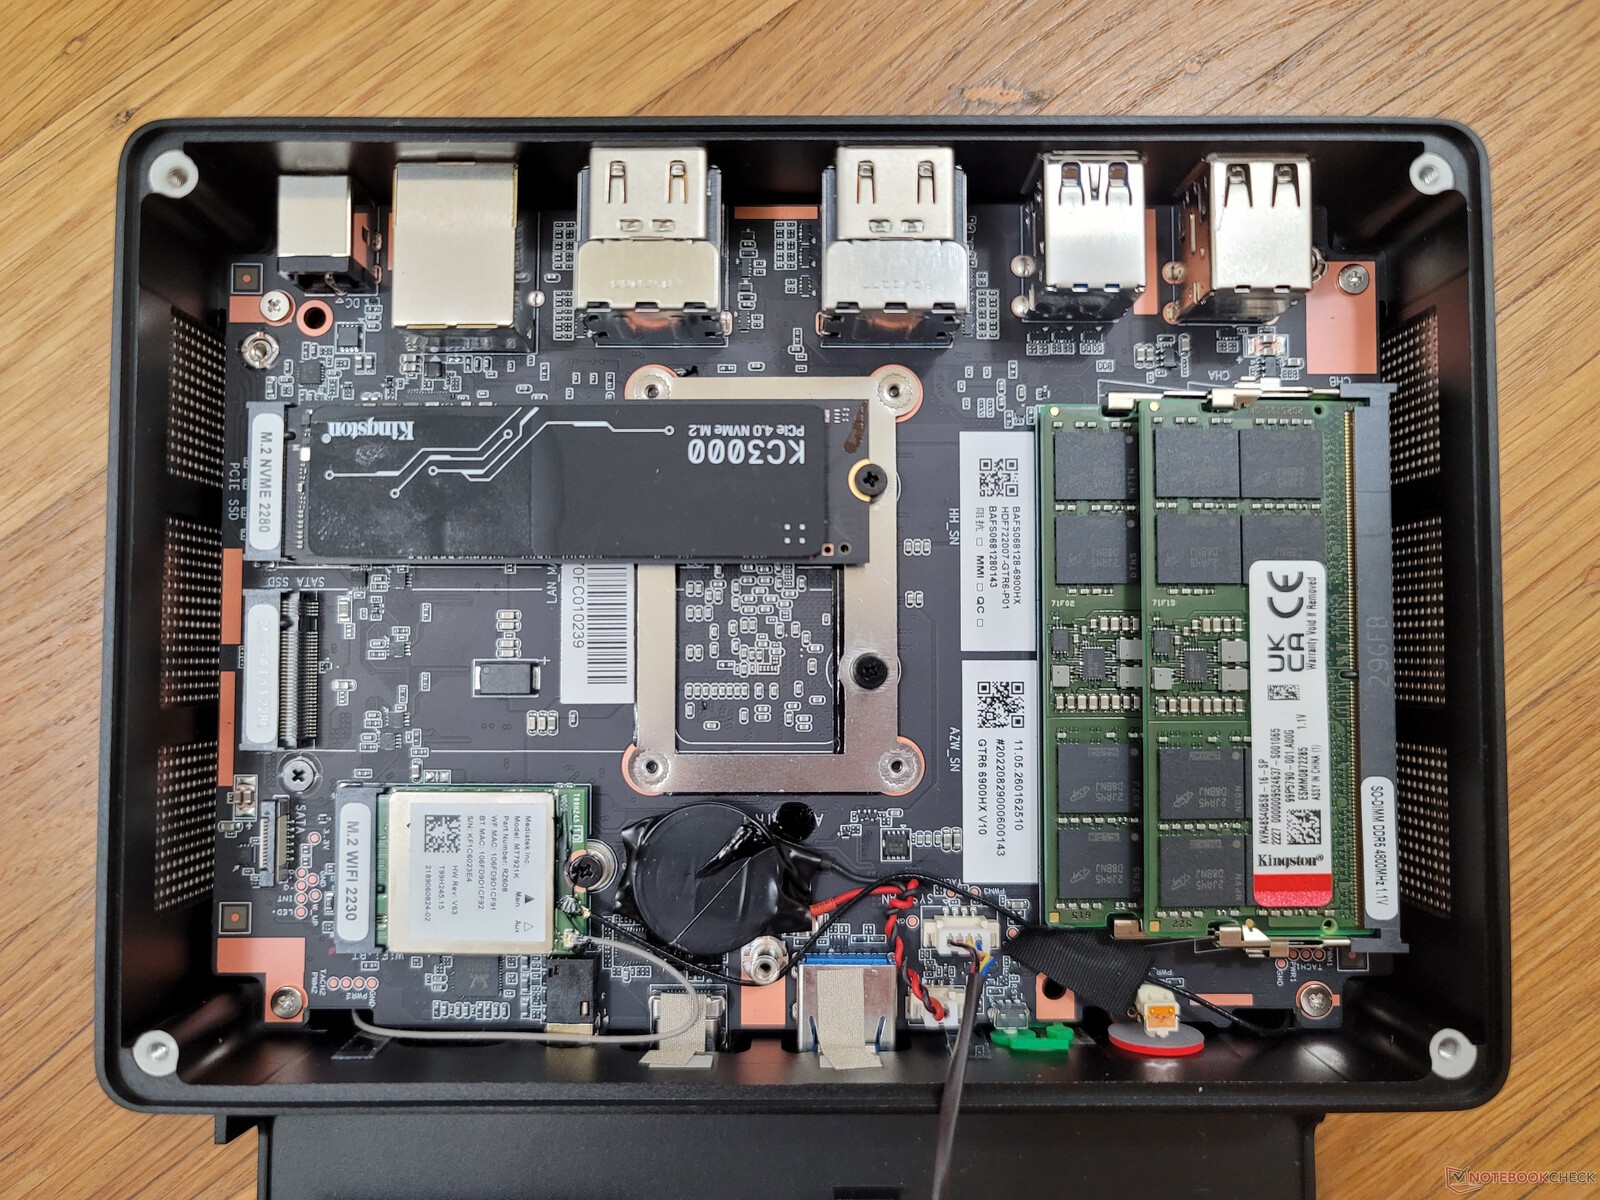
Il pannello inferiore è fissato con quattro viti Philips per facilitare la manutenzione. Tuttavia, sotto di esso si trova un'altra piastra che richiede la rimozione di altre quattro viti, come mostrato nelle immagini sottostanti.
Accessori e garanzia
La confezione include due cavi HDMI, un supporto VESA rimovibile con viti aggiuntive, il manuale d'uso e due coperture aggiuntive in rete soft-touch per la parte superiore dell'unità. Una di queste coperture è di colore rosso per completare il colore dell'hardware e delle finiture AMD.
Prestazioni - Aggiornamento Zen 3+
Condizioni di test
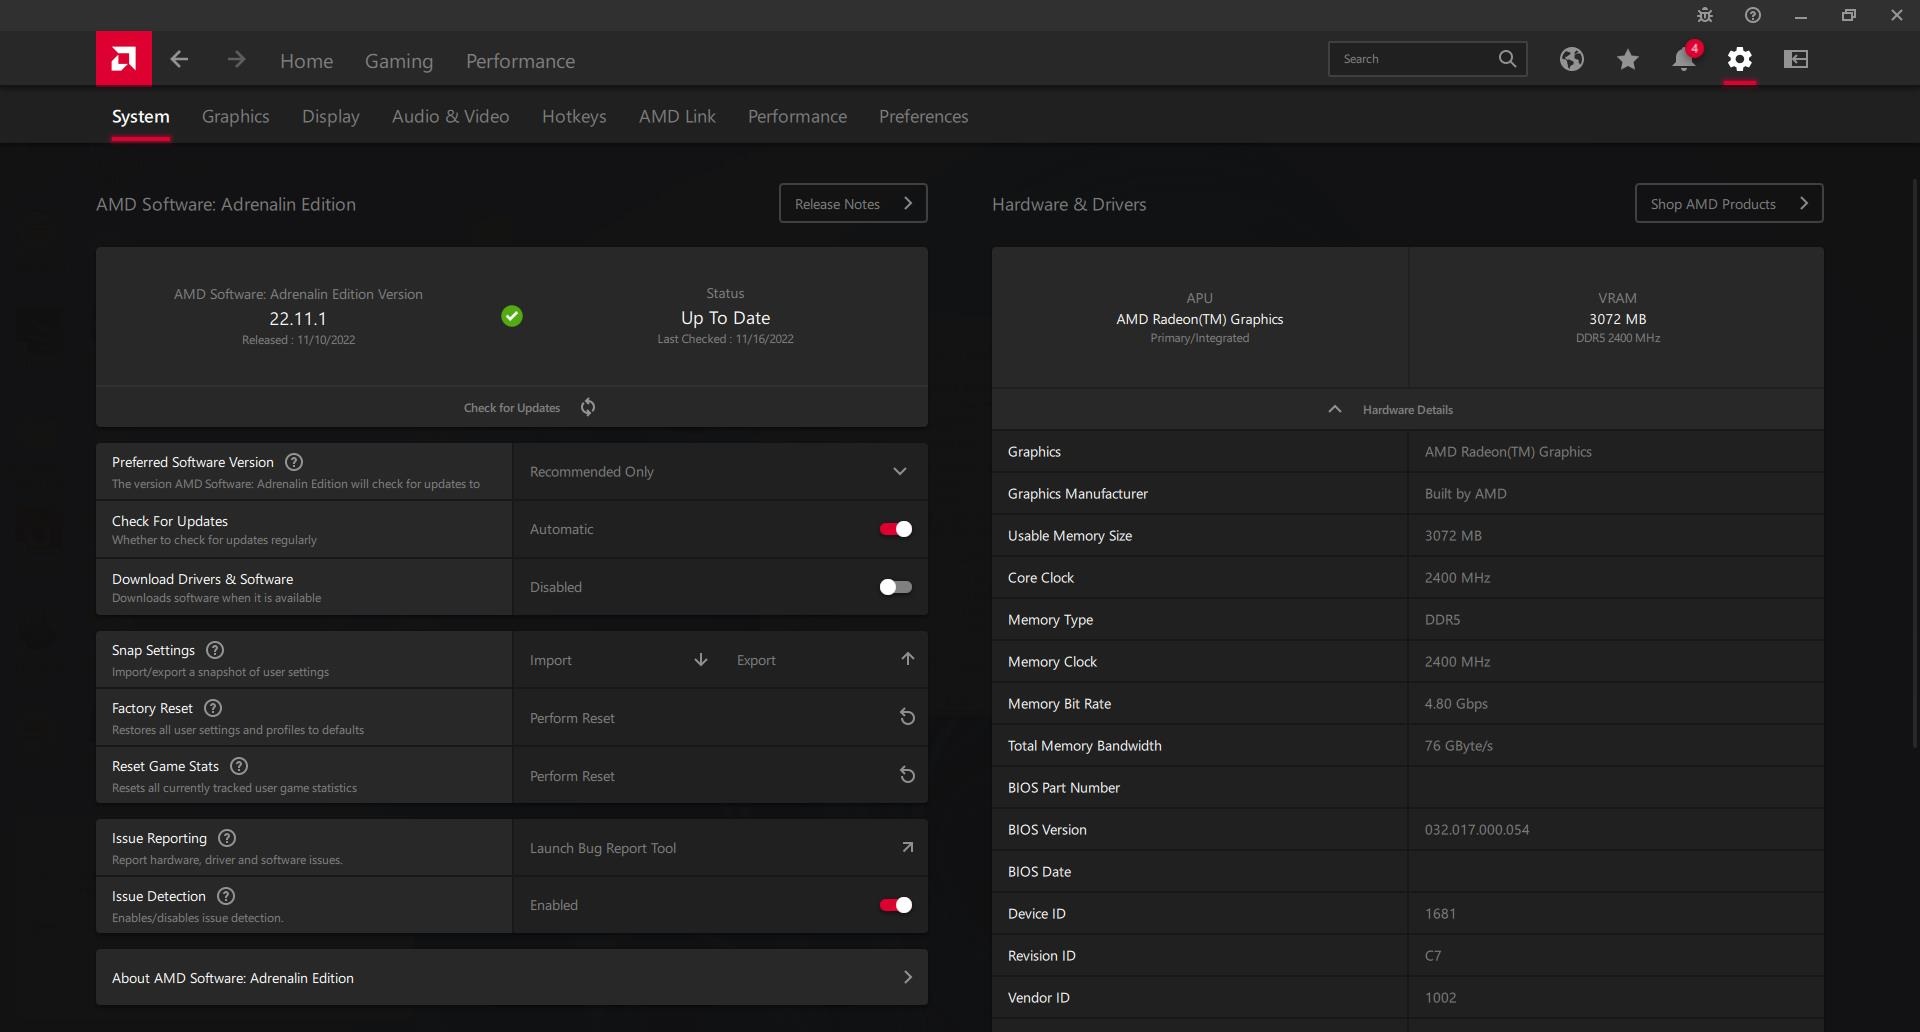
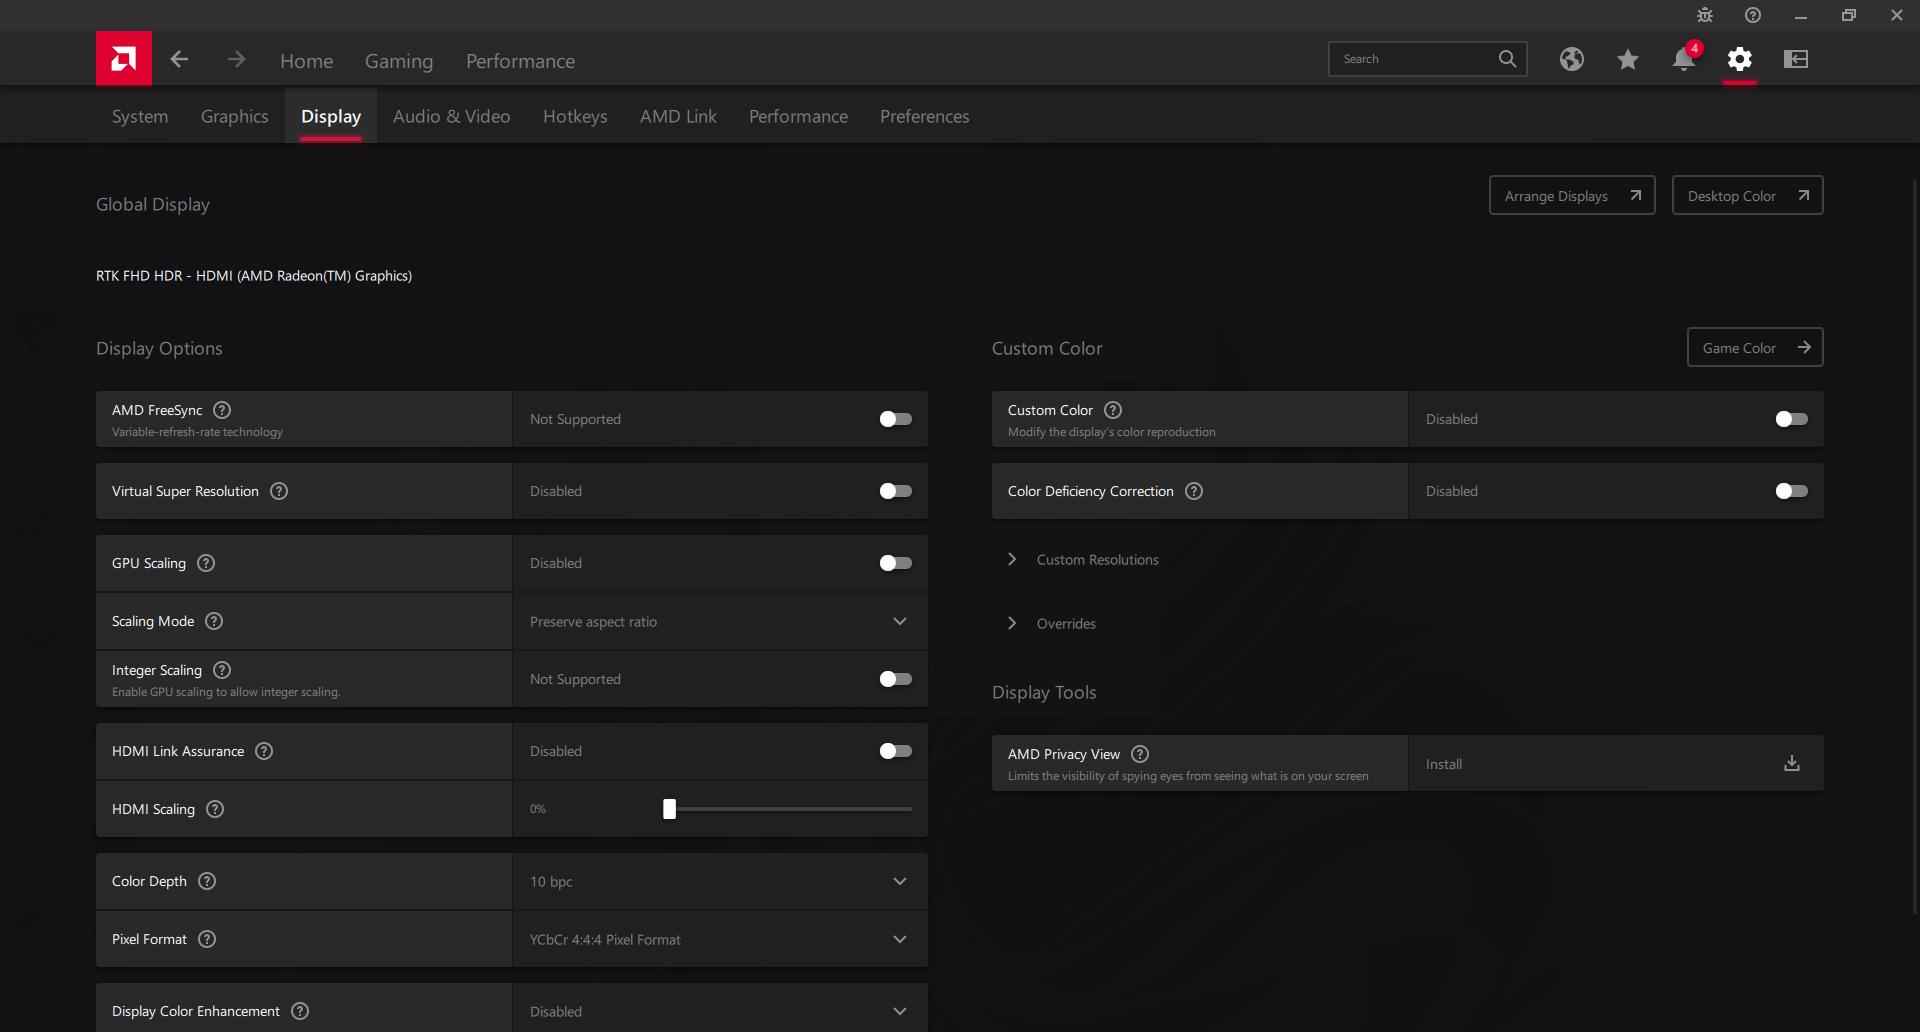
Abbiamo impostato la nostra unità in modalità Prestazioni tramite Windows prima di eseguire i benchmark riportati di seguito. Beelink non include applicazioni preinstallate per un'esperienza pulita con Windows 11 Pro. Tuttavia, raccomandiamo di installare il software AMD Radeon per le impostazioni aggiuntive, come mostrano gli screenshot qui sotto.
Processore
Le prestazioni della CPU sono purtroppo solo un piccolo passo avanti rispetto a quelle del Ryzen 9 5900HX nella migliore delle ipotesi. I benchmark mostrano prestazioni multi-thread identiche a quelle del Ryzen 9 5900HX nel Beelink GTR5 e prestazioni single-thread leggermente superiori, fino al 10%. Le prestazioni medie in multi-thread sono circa il 15% più lente rispetto ai portatili con lo stesso Ryzen 9 6900HX CPU CPU Ryzen 9 6900HX come ad esempio il Lenovo Legion S7 16. Nonostante ciò, il GTR6 è ancora uno dei mini PC più veloci per le sue dimensioni, anche se le prestazioni sono leggermente inferiori.
Cinebench R15 Multi Loop
Cinebench R23: Multi Core | Single Core
Cinebench R15: CPU Multi 64Bit | CPU Single 64Bit
Blender: v2.79 BMW27 CPU
7-Zip 18.03: 7z b 4 | 7z b 4 -mmt1
Geekbench 5.5: Multi-Core | Single-Core
HWBOT x265 Benchmark v2.2: 4k Preset
LibreOffice : 20 Documents To PDF
R Benchmark 2.5: Overall mean
| Cinebench R20 / CPU (Multi Core) | |
| MSI GE67 HX 12UGS | |
| Schenker Vision 14 2022 RTX 3050 Ti | |
| Media AMD Ryzen 9 6900HX (3742 - 5813, n=19) | |
| Beelink GTR6 | |
| Beelink GTR5 | |
| Alienware m15 R4 RTX 3080 | |
| Lenovo Legion C7 15IMH05 82EH0030GE | |
| Beelink SEi11 Pro | |
| Intel NUC11TNKi5 | |
| Intel NUC11PHKi7C | |
| GMK NucBox 2 | |
| Cinebench R20 / CPU (Single Core) | |
| Schenker Vision 14 2022 RTX 3050 Ti | |
| MSI GE67 HX 12UGS | |
| Beelink GTR6 | |
| Media AMD Ryzen 9 6900HX (595 - 631, n=19) | |
| Intel NUC11PHKi7C | |
| Beelink GTR5 | |
| Beelink SEi11 Pro | |
| Intel NUC11TNKi5 | |
| Lenovo Legion C7 15IMH05 82EH0030GE | |
| Alienware m15 R4 RTX 3080 | |
| GMK NucBox 2 | |
| Cinebench R23 / Multi Core | |
| MSI GE67 HX 12UGS | |
| Schenker Vision 14 2022 RTX 3050 Ti | |
| Media AMD Ryzen 9 6900HX (9709 - 15100, n=19) | |
| Beelink GTR6 | |
| Beelink GTR5 | |
| Alienware m15 R4 RTX 3080 | |
| Lenovo Legion C7 15IMH05 82EH0030GE | |
| Intel NUC11PHKi7C | |
| Beelink SEi11 Pro | |
| Intel NUC11TNKi5 | |
| GMK NucBox 2 | |
| Cinebench R23 / Single Core | |
| MSI GE67 HX 12UGS | |
| Schenker Vision 14 2022 RTX 3050 Ti | |
| Beelink GTR6 | |
| Media AMD Ryzen 9 6900HX (1516 - 1616, n=19) | |
| Intel NUC11PHKi7C | |
| Beelink GTR5 | |
| Beelink SEi11 Pro | |
| Intel NUC11TNKi5 | |
| Lenovo Legion C7 15IMH05 82EH0030GE | |
| Alienware m15 R4 RTX 3080 | |
| GMK NucBox 2 | |
| Cinebench R15 / CPU Multi 64Bit | |
| MSI GE67 HX 12UGS | |
| Schenker Vision 14 2022 RTX 3050 Ti | |
| Media AMD Ryzen 9 6900HX (1588 - 2411, n=19) | |
| Beelink GTR6 | |
| Beelink GTR5 | |
| Alienware m15 R4 RTX 3080 | |
| Lenovo Legion C7 15IMH05 82EH0030GE | |
| Intel NUC11PHKi7C | |
| Beelink SEi11 Pro | |
| Intel NUC11TNKi5 | |
| GMK NucBox 2 | |
| Cinebench R15 / CPU Single 64Bit | |
| Schenker Vision 14 2022 RTX 3050 Ti | |
| MSI GE67 HX 12UGS | |
| Beelink GTR6 | |
| Media AMD Ryzen 9 6900HX (241 - 261, n=19) | |
| Beelink GTR5 | |
| Intel NUC11PHKi7C | |
| Beelink SEi11 Pro | |
| Lenovo Legion C7 15IMH05 82EH0030GE | |
| Intel NUC11TNKi5 | |
| Alienware m15 R4 RTX 3080 | |
| GMK NucBox 2 | |
| 7-Zip 18.03 / 7z b 4 -mmt1 | |
| Beelink GTR6 | |
| Schenker Vision 14 2022 RTX 3050 Ti | |
| Media AMD Ryzen 9 6900HX (5090 - 6070, n=20) | |
| Beelink GTR5 | |
| MSI GE67 HX 12UGS | |
| Lenovo Legion C7 15IMH05 82EH0030GE | |
| Alienware m15 R4 RTX 3080 | |
| Intel NUC11PHKi7C | |
| Beelink SEi11 Pro | |
| Intel NUC11TNKi5 | |
| GMK NucBox 2 | |
| Geekbench 5.5 / Multi-Core | |
| MSI GE67 HX 12UGS | |
| Schenker Vision 14 2022 RTX 3050 Ti | |
| Media AMD Ryzen 9 6900HX (8313 - 10490, n=21) | |
| Beelink GTR6 | |
| Lenovo Legion C7 15IMH05 82EH0030GE | |
| Beelink GTR5 | |
| Alienware m15 R4 RTX 3080 | |
| Intel NUC11PHKi7C | |
| Beelink SEi11 Pro | |
| Intel NUC11TNKi5 | |
| GMK NucBox 2 | |
| Geekbench 5.5 / Single-Core | |
| Schenker Vision 14 2022 RTX 3050 Ti | |
| MSI GE67 HX 12UGS | |
| Beelink GTR6 | |
| Media AMD Ryzen 9 6900HX (1523 - 1652, n=21) | |
| Beelink GTR5 | |
| Intel NUC11PHKi7C | |
| Beelink SEi11 Pro | |
| Intel NUC11TNKi5 | |
| Lenovo Legion C7 15IMH05 82EH0030GE | |
| Alienware m15 R4 RTX 3080 | |
| GMK NucBox 2 | |
| HWBOT x265 Benchmark v2.2 / 4k Preset | |
| MSI GE67 HX 12UGS | |
| Media AMD Ryzen 9 6900HX (12.6 - 18.7, n=20) | |
| Beelink GTR6 | |
| Beelink GTR5 | |
| Schenker Vision 14 2022 RTX 3050 Ti | |
| Alienware m15 R4 RTX 3080 | |
| Lenovo Legion C7 15IMH05 82EH0030GE | |
| Beelink SEi11 Pro | |
| Intel NUC11PHKi7C | |
| Intel NUC11TNKi5 | |
| GMK NucBox 2 | |
| LibreOffice / 20 Documents To PDF | |
| Alienware m15 R4 RTX 3080 | |
| GMK NucBox 2 | |
| Lenovo Legion C7 15IMH05 82EH0030GE | |
| Media AMD Ryzen 9 6900HX (44.8 - 81.7, n=20) | |
| Intel NUC11TNKi5 | |
| Beelink GTR5 | |
| Beelink SEi11 Pro | |
| Intel NUC11PHKi7C | |
| Beelink GTR6 | |
| Schenker Vision 14 2022 RTX 3050 Ti | |
| MSI GE67 HX 12UGS | |
| R Benchmark 2.5 / Overall mean | |
| GMK NucBox 2 | |
| Intel NUC11TNKi5 | |
| Alienware m15 R4 RTX 3080 | |
| Lenovo Legion C7 15IMH05 82EH0030GE | |
| Beelink SEi11 Pro | |
| Intel NUC11PHKi7C | |
| Media AMD Ryzen 9 6900HX (0.4627 - 0.4974, n=20) | |
| Beelink GTR5 | |
| Beelink GTR6 | |
| MSI GE67 HX 12UGS | |
| Schenker Vision 14 2022 RTX 3050 Ti | |
* ... Meglio usare valori piccoli
AIDA64: FP32 Ray-Trace | FPU Julia | CPU SHA3 | CPU Queen | FPU SinJulia | FPU Mandel | CPU AES | CPU ZLib | FP64 Ray-Trace | CPU PhotoWorxx
| Performance rating | |
| Media AMD Ryzen 9 6900HX | |
| Beelink GTR6 | |
| Beelink GTR5 | |
| Intel NUC11PHKi7C | |
| Beelink SEi11 Pro | |
| Intel NUC11TNKi5 | |
| GMK NucBox 2 | |
| AIDA64 / FP32 Ray-Trace | |
| Media AMD Ryzen 9 6900HX (10950 - 17963, n=20) | |
| Beelink GTR5 | |
| Beelink GTR6 | |
| Intel NUC11PHKi7C | |
| Beelink SEi11 Pro | |
| Intel NUC11TNKi5 | |
| GMK NucBox 2 | |
| AIDA64 / FPU Julia | |
| Media AMD Ryzen 9 6900HX (71414 - 110797, n=20) | |
| Beelink GTR5 | |
| Beelink GTR6 | |
| Intel NUC11PHKi7C | |
| Beelink SEi11 Pro | |
| Intel NUC11TNKi5 | |
| GMK NucBox 2 | |
| AIDA64 / CPU SHA3 | |
| Media AMD Ryzen 9 6900HX (2471 - 3804, n=20) | |
| Beelink GTR6 | |
| Beelink GTR5 | |
| Intel NUC11PHKi7C | |
| Beelink SEi11 Pro | |
| Intel NUC11TNKi5 | |
| GMK NucBox 2 | |
| AIDA64 / CPU Queen | |
| Media AMD Ryzen 9 6900HX (84185 - 107544, n=20) | |
| Beelink GTR5 | |
| Beelink GTR6 | |
| Intel NUC11PHKi7C | |
| Beelink SEi11 Pro | |
| Intel NUC11TNKi5 | |
| GMK NucBox 2 | |
| AIDA64 / FPU SinJulia | |
| Media AMD Ryzen 9 6900HX (10970 - 13205, n=20) | |
| Beelink GTR5 | |
| Beelink GTR6 | |
| Intel NUC11PHKi7C | |
| Beelink SEi11 Pro | |
| Intel NUC11TNKi5 | |
| GMK NucBox 2 | |
| AIDA64 / FPU Mandel | |
| Media AMD Ryzen 9 6900HX (39164 - 61370, n=20) | |
| Beelink GTR5 | |
| Beelink GTR6 | |
| Intel NUC11PHKi7C | |
| Beelink SEi11 Pro | |
| Intel NUC11TNKi5 | |
| GMK NucBox 2 | |
| AIDA64 / CPU AES | |
| Beelink GTR6 | |
| Beelink GTR5 | |
| Media AMD Ryzen 9 6900HX (54613 - 142360, n=20) | |
| Intel NUC11PHKi7C | |
| Beelink SEi11 Pro | |
| Intel NUC11TNKi5 | |
| GMK NucBox 2 | |
| AIDA64 / CPU ZLib | |
| Media AMD Ryzen 9 6900HX (578 - 911, n=20) | |
| Beelink GTR5 | |
| Beelink GTR6 | |
| Intel NUC11PHKi7C | |
| Intel NUC11TNKi5 | |
| Beelink SEi11 Pro | |
| GMK NucBox 2 | |
| AIDA64 / FP64 Ray-Trace | |
| Media AMD Ryzen 9 6900HX (5798 - 9540, n=20) | |
| Beelink GTR5 | |
| Beelink GTR6 | |
| Intel NUC11PHKi7C | |
| Beelink SEi11 Pro | |
| Intel NUC11TNKi5 | |
| GMK NucBox 2 | |
| AIDA64 / CPU PhotoWorxx | |
| Beelink GTR6 | |
| Media AMD Ryzen 9 6900HX (26873 - 30604, n=20) | |
| Intel NUC11PHKi7C | |
| Beelink SEi11 Pro | |
| Beelink GTR5 | |
| Intel NUC11TNKi5 | |
| GMK NucBox 2 | |
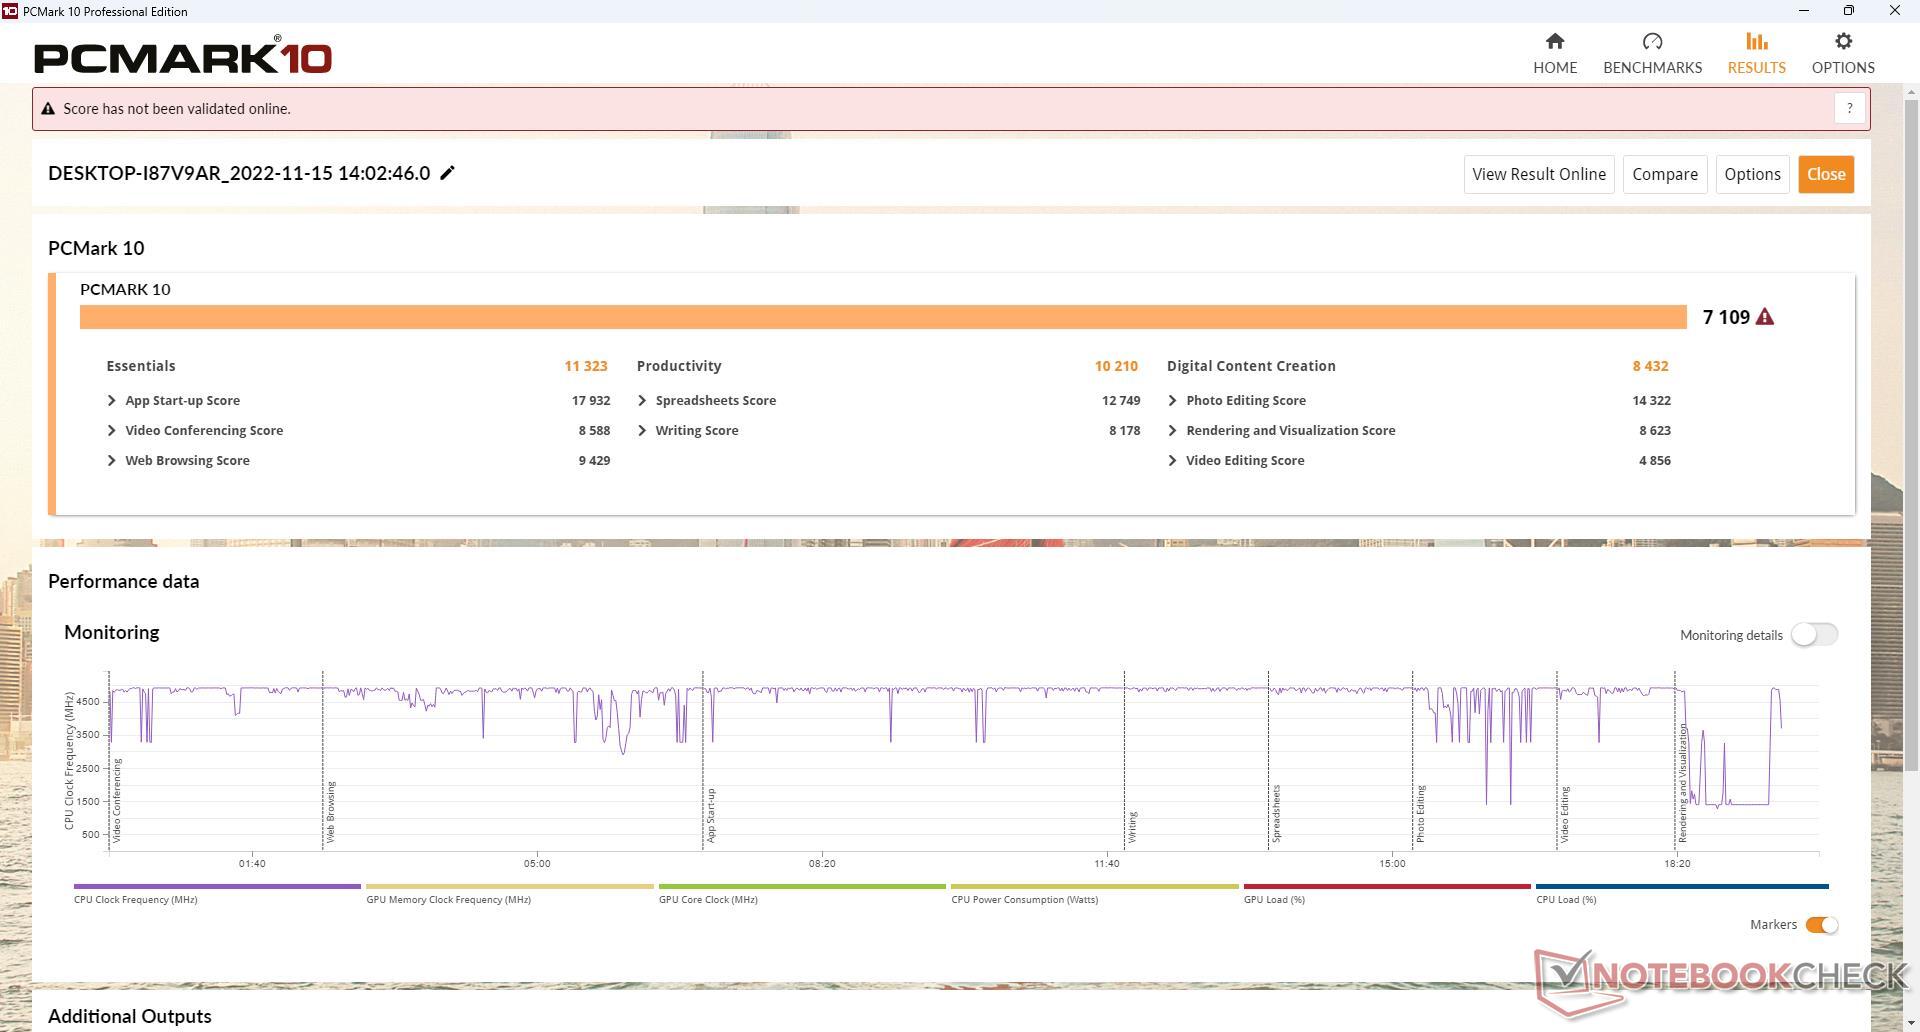
Prestazioni del sistema
I risultati di PCMark 10 sono costantemente superiori rispetto a quelli ottenuti con la GTR5 soprattutto nel sottotest Creazione di contenuti digitali, dove le prestazioni grafiche sono più importanti.
CrossMark: Overall | Productivity | Creativity | Responsiveness
| PCMark 10 / Score | |
| Beelink GTR6 | |
| Media AMD Ryzen 9 6900HX, AMD Radeon 680M (6251 - 7109, n=7) | |
| Beelink GTR5 | |
| Intel NUC11PHKi7C | |
| Beelink SEi11 Pro | |
| Intel NUC11TNKi5 | |
| GMK NucBox 2 | |
| PCMark 10 / Essentials | |
| Beelink GTR6 | |
| Beelink GTR5 | |
| Media AMD Ryzen 9 6900HX, AMD Radeon 680M (10029 - 11323, n=7) | |
| Beelink SEi11 Pro | |
| Intel NUC11PHKi7C | |
| Intel NUC11TNKi5 | |
| GMK NucBox 2 | |
| PCMark 10 / Productivity | |
| Beelink GTR6 | |
| Beelink GTR5 | |
| Media AMD Ryzen 9 6900HX, AMD Radeon 680M (9550 - 10210, n=7) | |
| Intel NUC11PHKi7C | |
| Beelink SEi11 Pro | |
| GMK NucBox 2 | |
| Intel NUC11TNKi5 | |
| PCMark 10 / Digital Content Creation | |
| Beelink GTR6 | |
| Media AMD Ryzen 9 6900HX, AMD Radeon 680M (6920 - 8703, n=7) | |
| Beelink GTR5 | |
| Intel NUC11PHKi7C | |
| Beelink SEi11 Pro | |
| Intel NUC11TNKi5 | |
| GMK NucBox 2 | |
| CrossMark / Overall | |
| Beelink GTR6 | |
| Media AMD Ryzen 9 6900HX, AMD Radeon 680M (1476 - 1731, n=7) | |
| Beelink GTR5 | |
| Beelink SEi11 Pro | |
| CrossMark / Productivity | |
| Beelink GTR6 | |
| Media AMD Ryzen 9 6900HX, AMD Radeon 680M (1451 - 1738, n=7) | |
| Beelink GTR5 | |
| Beelink SEi11 Pro | |
| CrossMark / Creativity | |
| Beelink GTR6 | |
| Media AMD Ryzen 9 6900HX, AMD Radeon 680M (1632 - 1745, n=7) | |
| Beelink GTR5 | |
| Beelink SEi11 Pro | |
| CrossMark / Responsiveness | |
| Beelink GTR6 | |
| Media AMD Ryzen 9 6900HX, AMD Radeon 680M (1060 - 1671, n=7) | |
| Beelink SEi11 Pro | |
| Beelink GTR5 | |
| PCMark 10 Score | 7109 punti | |
Aiuto | ||
| AIDA64 / Memory Copy | |
| Beelink GTR6 | |
| Media AMD Ryzen 9 6900HX (47938 - 53345, n=20) | |
| GMK NucBox 2 | |
| Beelink GTR5 | |
| Beelink SEi11 Pro | |
| Intel NUC11PHKi7C | |
| Intel NUC11TNKi5 | |
| AIDA64 / Memory Read | |
| Beelink GTR6 | |
| Media AMD Ryzen 9 6900HX (43892 - 53321, n=20) | |
| Beelink GTR5 | |
| Beelink SEi11 Pro | |
| Intel NUC11PHKi7C | |
| GMK NucBox 2 | |
| Intel NUC11TNKi5 | |
| AIDA64 / Memory Write | |
| Beelink GTR6 | |
| Media AMD Ryzen 9 6900HX (51085 - 57202, n=20) | |
| GMK NucBox 2 | |
| Beelink SEi11 Pro | |
| Beelink GTR5 | |
| Intel NUC11PHKi7C | |
| Intel NUC11TNKi5 | |
| AIDA64 / Memory Latency | |
| Intel NUC11PHKi7C | |
| Media AMD Ryzen 9 6900HX (80.7 - 120.6, n=20) | |
| Intel NUC11TNKi5 | |
| Beelink GTR6 | |
| Beelink SEi11 Pro | |
| Beelink GTR5 | |
| GMK NucBox 2 | |
* ... Meglio usare valori piccoli
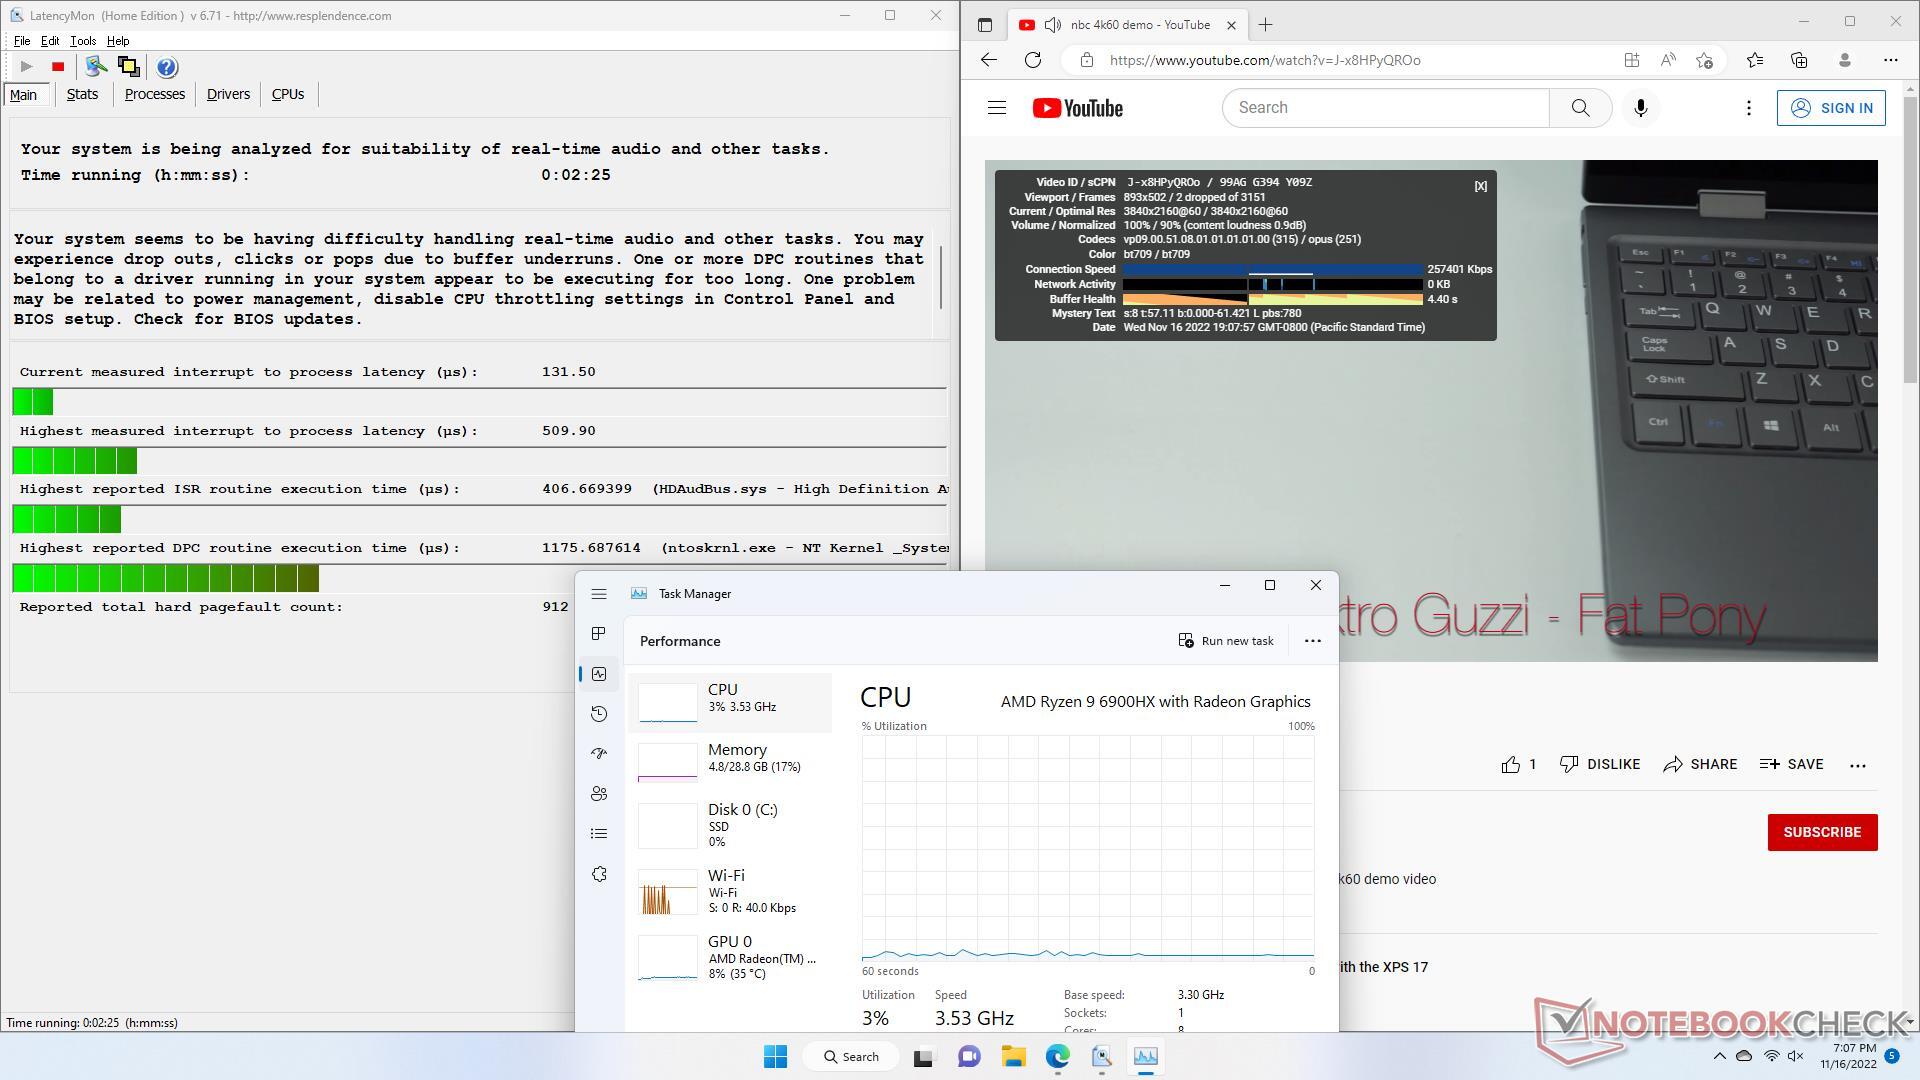
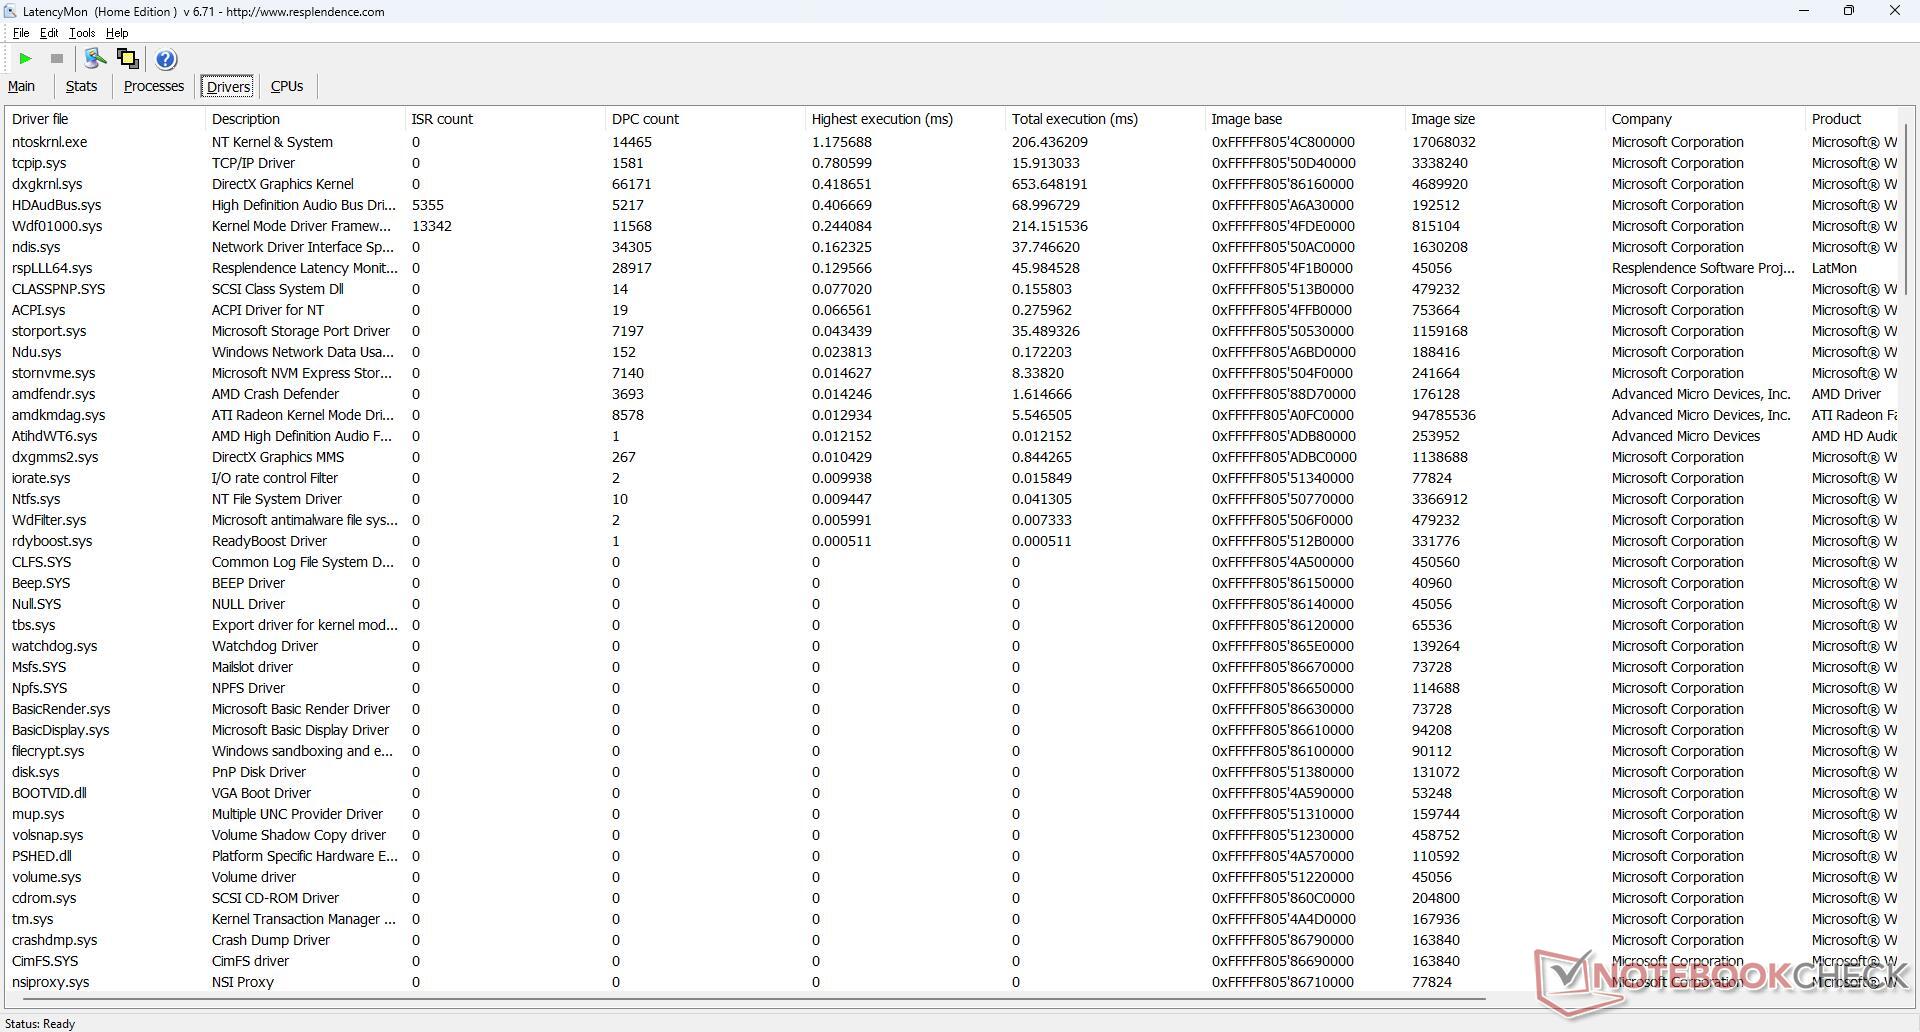
Latenza DPC
Ci sono piccoli problemi di DPC quando si aprono più schede del browser sulla nostra homepage. la riproduzione di video 4K a 60 FPS è invece eccellente, con solo 2 cadute di fotogrammi durante il nostro video di prova della durata di un minuto. L'utilizzo del processore è molto basso rispetto ai PC dotati di CPU serie U più lente.
| DPC Latencies / LatencyMon - interrupt to process latency (max), Web, Youtube, Prime95 | |
| Intel NUC11PHKi7C | |
| GMK NucBox 2 | |
| Intel NUC11TNKi5 | |
| Beelink GTR6 | |
| Beelink SEi11 Pro | |
| Beelink GTR5 | |
* ... Meglio usare valori piccoli
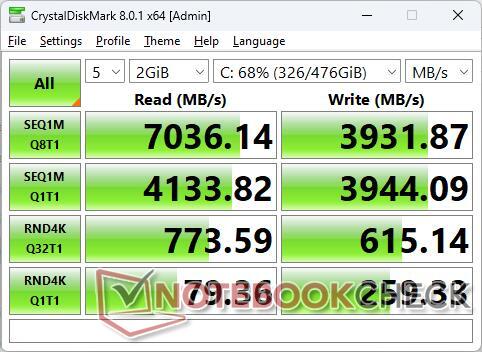
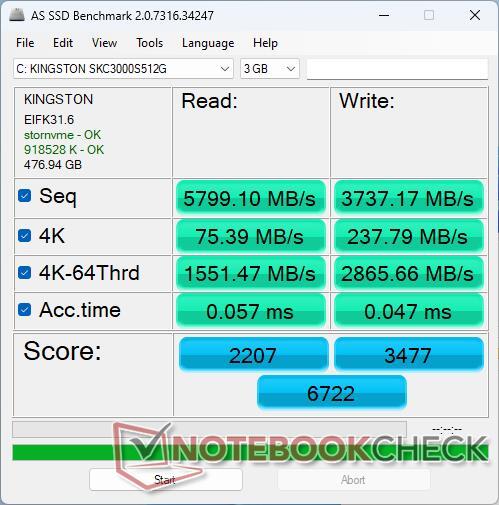
Dispositivi di archiviazione - Raffreddamento SSD incluso
La nostra unità viene fornita con un disco da 512 GB Kingston KC3000 PCIe4 x4 NVMe che offre velocità di lettura e scrittura sequenziale rispettivamente di 7000 MB/s e 4000 MB/s. L'unità non ha problemi a sostenere le massime velocità di trasferimento per periodi prolungati, poiché sono preinstallati un dissipatore di calore e un pad termico dedicati all'unità SSD.

| Drive Performance rating - Percent | |
| Beelink GTR6 | |
| Intel NUC11PHKi7C | |
| Beelink SEi11 Pro | |
| Beelink GTR5 | |
| GMK NucBox 2 | |
| Intel NUC11TNKi5 | |
* ... Meglio usare valori piccoli
Disk Throttling: DiskSpd Read Loop, Queue Depth 8
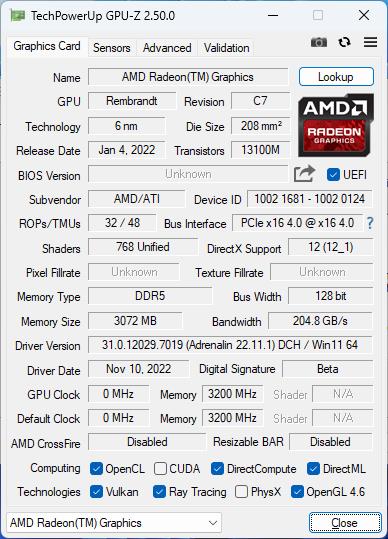
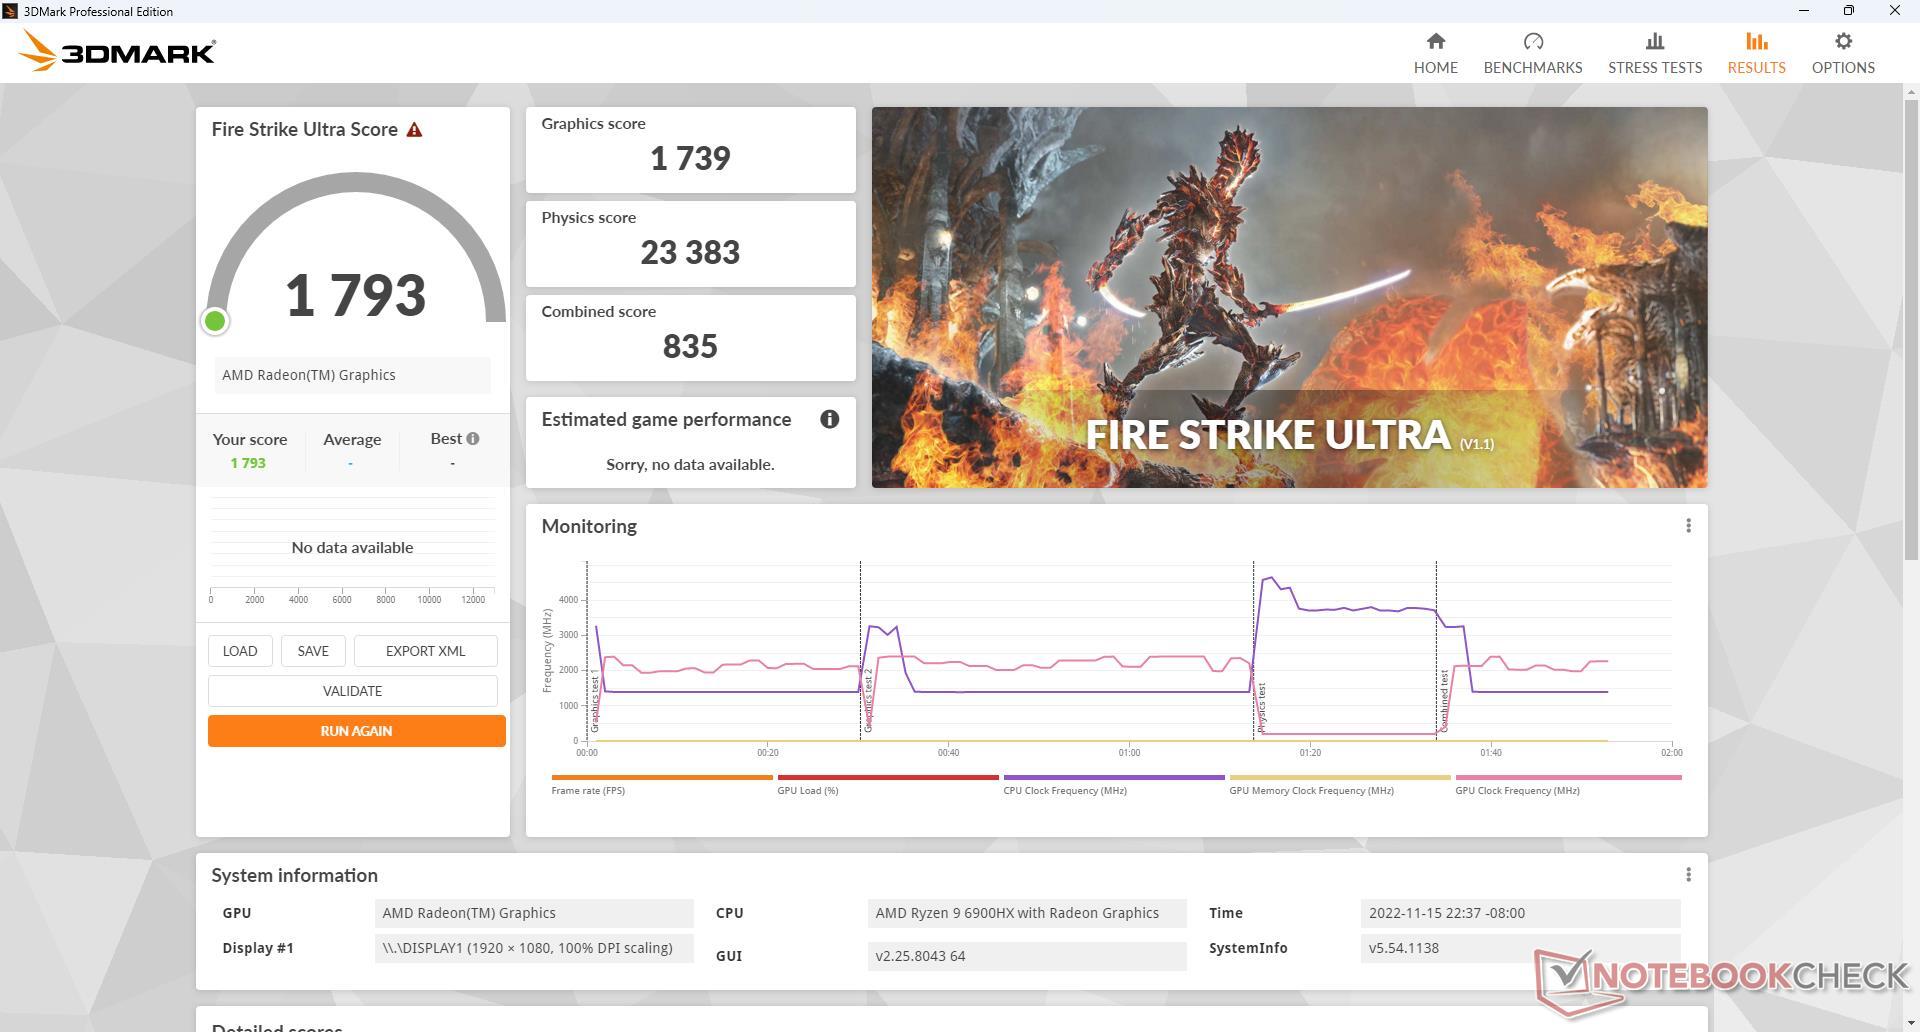
Prestazioni della GPU - La grafica integrata più veloce
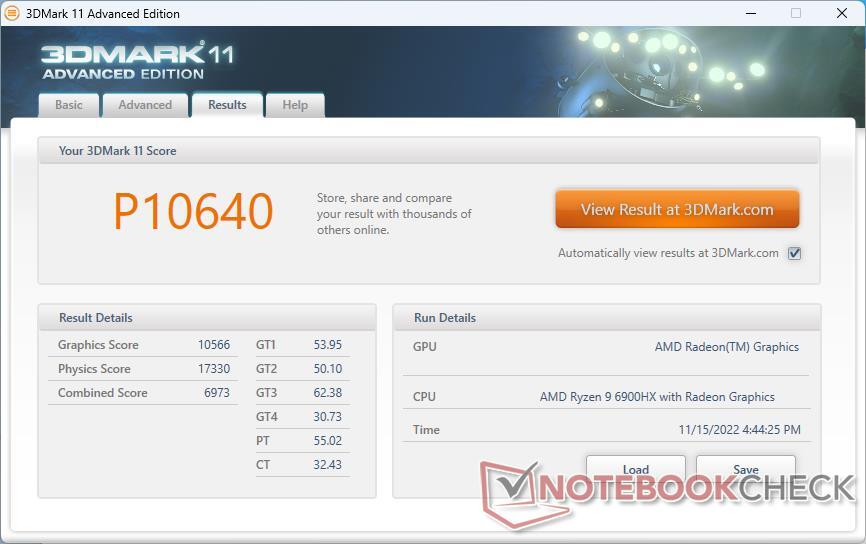
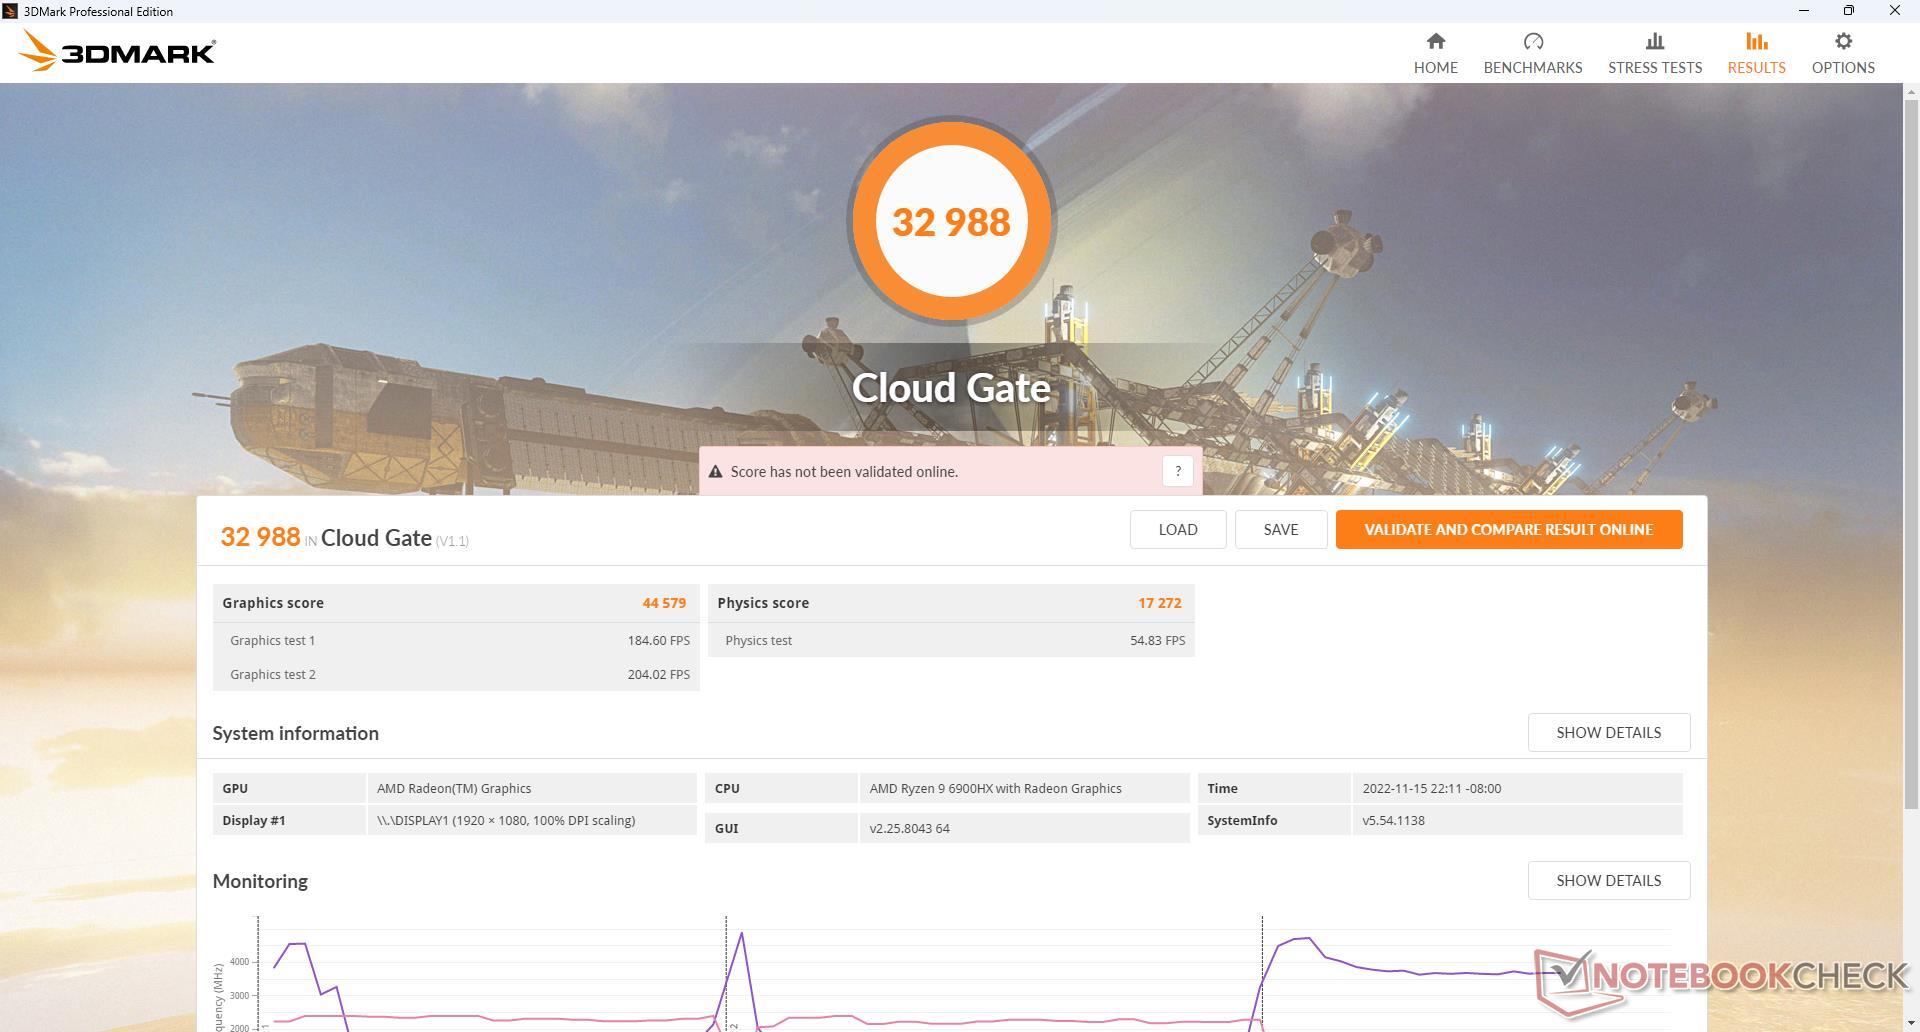
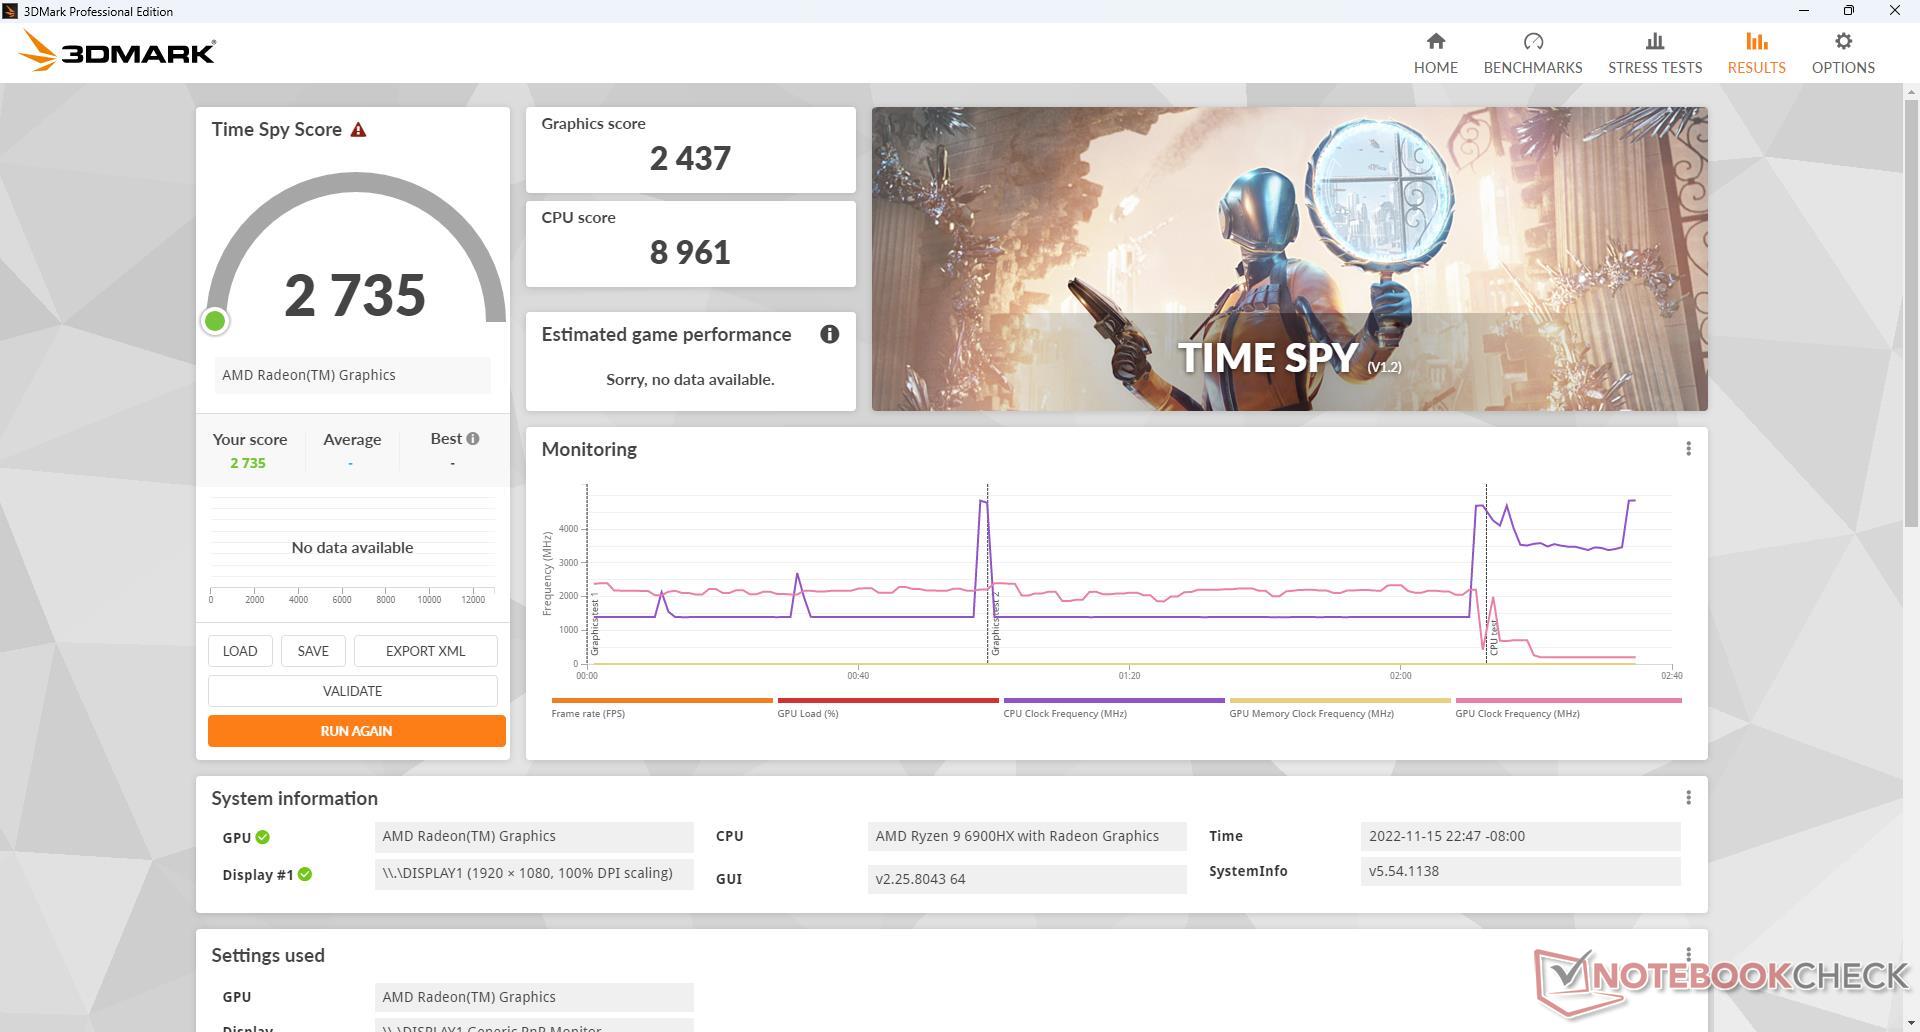
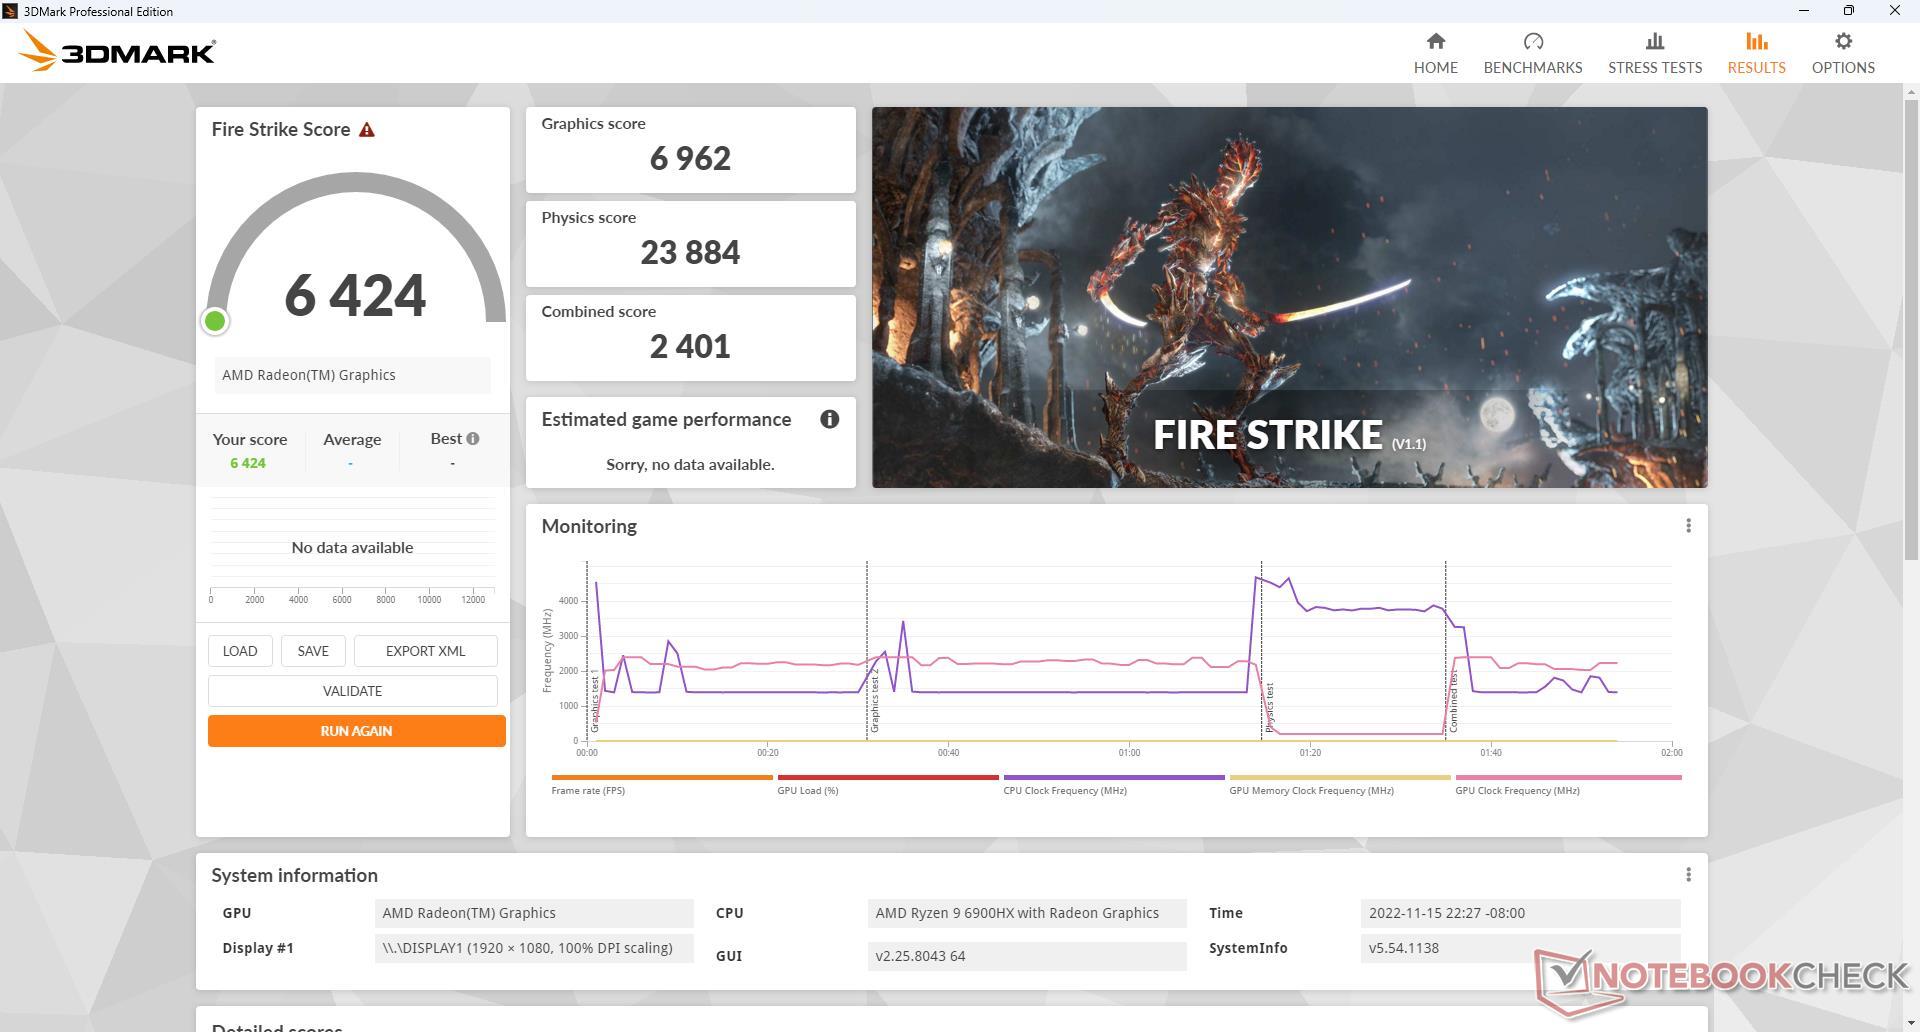
La Radeon 680M continua a stupire con risultati più veloci di circa il 60 percento rispetto alla Radeon RX Vega 8 nell'ultima generazione di Ryzen 9 5900HX. Ciò pone la nuova GPU integrata di AMD ben al di sopra di qualsiasi soluzione Intel Iris Xe 96 EUs del 50% o più. Le GPU dedicate di fascia bassa come la GeForce GTX 1060 o la GTX 1650 sono ancora molto più veloci, ma il 680M è comunque impressionante per una GPU integrata. La maggior parte dei titoli è giocabile con impostazioni medio-basse a una risoluzione di 1080p, compreso Cyberpunk 2077.
| 3DMark | |
| 1920x1080 Fire Strike Graphics | |
| Intel NUC11PHKi7C | |
| Desktop PC Intel Xeon E5 2680v4 KFA2 GTX 1060 6GB | |
| KFA2 GeForce GTX 1650 EX One Click Plus | |
| Beelink GTR6 | |
| Media AMD Radeon 680M (3791 - 7706, n=41) | |
| Beelink SEi11 Pro | |
| Beelink GTR5 | |
| Intel NUC11TNKi5 | |
| GMK NucBox 2 | |
| 2560x1440 Time Spy Graphics | |
| Intel NUC11PHKi7C | |
| Desktop PC Intel Xeon E5 2680v4 KFA2 GTX 1060 6GB | |
| KFA2 GeForce GTX 1650 EX One Click Plus | |
| Beelink GTR6 | |
| Media AMD Radeon 680M (1359 - 2607, n=41) | |
| Beelink SEi11 Pro | |
| Beelink GTR5 | |
| Intel NUC11TNKi5 | |
| GMK NucBox 2 | |
| 2560x1440 Time Spy Score | |
| Intel NUC11PHKi7C | |
| Desktop PC Intel Xeon E5 2680v4 KFA2 GTX 1060 6GB | |
| KFA2 GeForce GTX 1650 EX One Click Plus | |
| Beelink GTR6 | |
| Media AMD Radeon 680M (1546 - 2914, n=41) | |
| Beelink GTR5 | |
| Beelink SEi11 Pro | |
| Intel NUC11TNKi5 | |
| GMK NucBox 2 | |
| 3DMark 11 - 1280x720 Performance GPU | |
| Intel NUC11PHKi7C | |
| Desktop PC Intel Xeon E5 2680v4 KFA2 GTX 1060 6GB | |
| KFA2 GeForce GTX 1650 EX One Click Plus | |
| Beelink GTR6 | |
| Media AMD Radeon 680M (6858 - 11755, n=39) | |
| Beelink GTR5 | |
| Beelink SEi11 Pro | |
| Intel NUC11TNKi5 | |
| GMK NucBox 2 | |
| 3DMark 11 Performance | 10640 punti | |
| 3DMark Cloud Gate Standard Score | 32988 punti | |
| 3DMark Fire Strike Score | 6424 punti | |
| 3DMark Time Spy Score | 2735 punti | |
Aiuto | ||
| Blender | |
| v3.3 Classroom HIP/AMD | |
| Beelink GTR6 | |
| Media AMD Radeon 680M (270 - 555, n=34) | |
| v3.3 Classroom CPU | |
| Beelink SEi11 Pro | |
| Media AMD Radeon 680M (389 - 980, n=37) | |
| Beelink GTR6 | |
* ... Meglio usare valori piccoli
| Performance rating - Percent | |
| Intel NUC11PHKi7C | |
| Beelink GTR6 | |
| Beelink GTR5 | |
| Beelink SEi11 Pro -1! | |
| Intel NUC11TNKi5 -3! | |
| GMK NucBox 2 -3! | |
| The Witcher 3 - 1920x1080 Ultra Graphics & Postprocessing (HBAO+) | |
| Intel NUC11PHKi7C | |
| Beelink GTR6 | |
| Beelink GTR5 | |
| Beelink SEi11 Pro | |
| GTA V - 1920x1080 Highest AA:4xMSAA + FX AF:16x | |
| Intel NUC11PHKi7C | |
| Beelink GTR6 | |
| Beelink GTR5 | |
| Final Fantasy XV Benchmark - 1920x1080 High Quality | |
| Intel NUC11PHKi7C | |
| Beelink GTR6 | |
| Beelink GTR5 | |
| Beelink SEi11 Pro | |
| Intel NUC11TNKi5 | |
| GMK NucBox 2 | |
| Strange Brigade - 1920x1080 ultra AA:ultra AF:16 | |
| Intel NUC11PHKi7C | |
| Beelink GTR6 | |
| Beelink GTR5 | |
| Beelink SEi11 Pro | |
| Dota 2 Reborn - 1920x1080 ultra (3/3) best looking | |
| Intel NUC11PHKi7C | |
| Beelink GTR6 | |
| Beelink GTR5 | |
| Beelink SEi11 Pro | |
| Intel NUC11TNKi5 | |
| GMK NucBox 2 | |
| X-Plane 11.11 - 1920x1080 high (fps_test=3) | |
| Intel NUC11PHKi7C | |
| Beelink GTR6 | |
| Beelink GTR5 | |
| Beelink SEi11 Pro | |
| Intel NUC11TNKi5 | |
| GMK NucBox 2 | |
| Final Fantasy XV Benchmark | |
| 1280x720 Lite Quality | |
| Intel NUC11PHKi7C | |
| Beelink GTR6 | |
| Media AMD Radeon 680M (34.4 - 74.7, n=39) | |
| Beelink GTR5 | |
| Beelink SEi11 Pro | |
| Intel NUC11TNKi5 | |
| GMK NucBox 2 | |
| 1920x1080 Standard Quality | |
| Intel NUC11PHKi7C | |
| Beelink GTR6 | |
| Media AMD Radeon 680M (18.3 - 36.9, n=40) | |
| Beelink GTR5 | |
| Beelink SEi11 Pro | |
| Intel NUC11TNKi5 | |
| GMK NucBox 2 | |
| 1920x1080 High Quality | |
| Intel NUC11PHKi7C | |
| Beelink GTR6 | |
| Media AMD Radeon 680M (12.9 - 26.2, n=40) | |
| Beelink GTR5 | |
| Beelink SEi11 Pro | |
| Intel NUC11TNKi5 | |
| GMK NucBox 2 | |
| The Witcher 3 | |
| 1024x768 Low Graphics & Postprocessing | |
| Intel NUC11PHKi7C | |
| Beelink GTR6 | |
| Media AMD Radeon 680M (67.4 - 150, n=31) | |
| Beelink SEi11 Pro | |
| Beelink GTR5 | |
| Intel NUC11TNKi5 | |
| 1366x768 Medium Graphics & Postprocessing | |
| Intel NUC11PHKi7C | |
| Beelink GTR6 | |
| Media AMD Radeon 680M (44.5 - 85.3, n=24) | |
| Beelink GTR5 | |
| Beelink SEi11 Pro | |
| 1920x1080 High Graphics & Postprocessing (Nvidia HairWorks Off) | |
| Intel NUC11PHKi7C | |
| Beelink GTR6 | |
| Media AMD Radeon 680M (22.3 - 48, n=33) | |
| Beelink SEi11 Pro | |
| Beelink GTR5 | |
| 1920x1080 Ultra Graphics & Postprocessing (HBAO+) | |
| Intel NUC11PHKi7C | |
| Beelink GTR6 | |
| Media AMD Radeon 680M (14.3 - 27.1, n=33) | |
| Beelink GTR5 | |
| Beelink SEi11 Pro | |
| GTA V | |
| 1024x768 Lowest Settings possible | |
| Intel NUC11PHKi7C | |
| Beelink GTR6 | |
| Beelink GTR5 | |
| Media AMD Radeon 680M (67.7 - 155.4, n=35) | |
| Beelink SEi11 Pro | |
| 1920x1080 Lowest Settings possible | |
| Intel NUC11PHKi7C | |
| Beelink GTR6 | |
| Media AMD Radeon 680M (56.9 - 115.8, n=27) | |
| Beelink GTR5 | |
| Beelink SEi11 Pro | |
| 1366x768 Normal/Off AF:4x | |
| Intel NUC11PHKi7C | |
| Beelink GTR6 | |
| Beelink GTR5 | |
| Media AMD Radeon 680M (60.7 - 143.9, n=32) | |
| Beelink SEi11 Pro | |
| 1920x1080 Normal/Off AF:4x | |
| Intel NUC11PHKi7C | |
| Beelink GTR6 | |
| Media AMD Radeon 680M (54.9 - 117.3, n=27) | |
| Beelink GTR5 | |
| Beelink SEi11 Pro | |
| 1920x1080 High/On (Advanced Graphics Off) AA:2xMSAA + FX AF:8x | |
| Intel NUC11PHKi7C | |
| Beelink GTR6 | |
| Media AMD Radeon 680M (25.9 - 99.1, n=37) | |
| Beelink GTR5 | |
| Beelink SEi11 Pro | |
| 1920x1080 Highest AA:4xMSAA + FX AF:16x | |
| Intel NUC11PHKi7C | |
| Beelink GTR6 | |
| Media AMD Radeon 680M (11.3 - 25.3, n=37) | |
| Beelink GTR5 | |
| Cyberpunk 2077 1.6 | |
| 1280x720 Low Preset | |
| Beelink GTR6 | |
| Media AMD Radeon 680M (46.1 - 77.6, n=14) | |
| 1920x1080 Low Preset | |
| Beelink GTR6 | |
| Media AMD Radeon 680M (26 - 50.6, n=15) | |
| Beelink SEi11 Pro | |
| 1920x1080 Medium Preset | |
| Beelink GTR6 | |
| Media AMD Radeon 680M (20.1 - 41.8, n=15) | |
| Beelink SEi11 Pro | |
| 1920x1080 High Preset | |
| Beelink GTR6 | |
| Media AMD Radeon 680M (16.3 - 33.6, n=15) | |
| Beelink SEi11 Pro | |
| 1920x1080 Ultra Preset | |
| Beelink GTR6 | |
| Media AMD Radeon 680M (14 - 23.8, n=15) | |
| Beelink SEi11 Pro | |
| X-Plane 11.11 | |
| 1280x720 low (fps_test=1) | |
| Intel NUC11PHKi7C | |
| Beelink GTR6 | |
| Beelink GTR5 | |
| Beelink SEi11 Pro | |
| Media AMD Radeon 680M (26.8 - 66.7, n=41) | |
| Intel NUC11TNKi5 | |
| GMK NucBox 2 | |
| 1920x1080 med (fps_test=2) | |
| Intel NUC11PHKi7C | |
| Beelink GTR6 | |
| Beelink GTR5 | |
| Media AMD Radeon 680M (21.1 - 53.1, n=41) | |
| Beelink SEi11 Pro | |
| Intel NUC11TNKi5 | |
| GMK NucBox 2 | |
| 1920x1080 high (fps_test=3) | |
| Intel NUC11PHKi7C | |
| Beelink GTR6 | |
| Beelink GTR5 | |
| Beelink SEi11 Pro | |
| Media AMD Radeon 680M (16.6 - 44.5, n=41) | |
| Intel NUC11TNKi5 | |
| GMK NucBox 2 | |
| Strange Brigade | |
| 1280x720 lowest AF:1 | |
| Intel NUC11PHKi7C | |
| Beelink GTR6 | |
| Media AMD Radeon 680M (72.9 - 167.5, n=38) | |
| Beelink GTR5 | |
| Beelink SEi11 Pro | |
| 1920x1080 medium AA:medium AF:4 | |
| Intel NUC11PHKi7C | |
| Beelink GTR6 | |
| Media AMD Radeon 680M (30 - 63, n=38) | |
| Beelink GTR5 | |
| Beelink SEi11 Pro | |
| 1920x1080 high AA:high AF:8 | |
| Intel NUC11PHKi7C | |
| Beelink GTR6 | |
| Media AMD Radeon 680M (25.3 - 53.1, n=38) | |
| Beelink GTR5 | |
| Beelink SEi11 Pro | |
| 1920x1080 ultra AA:ultra AF:16 | |
| Intel NUC11PHKi7C | |
| Beelink GTR6 | |
| Media AMD Radeon 680M (22 - 46, n=38) | |
| Beelink GTR5 | |
| Beelink SEi11 Pro | |
Witcher 3 FPS Chart
| basso | medio | alto | ultra | |
|---|---|---|---|---|
| GTA V (2015) | 152.6 | 138 | 51.8 | 23.7 |
| The Witcher 3 (2015) | 139.2 | 84 | 46 | 27.1 |
| Dota 2 Reborn (2015) | 141.9 | 112.7 | 80.9 | 71.4 |
| Final Fantasy XV Benchmark (2018) | 68.5 | 34.9 | 24.5 | |
| X-Plane 11.11 (2018) | 64.8 | 52.6 | 41.8 | |
| Strange Brigade (2018) | 142.4 | 57.4 | 48.5 | 41.6 |
| Cyberpunk 2077 1.6 (2022) | 43 | 33 | 22.3 | 17.5 |
Emissioni
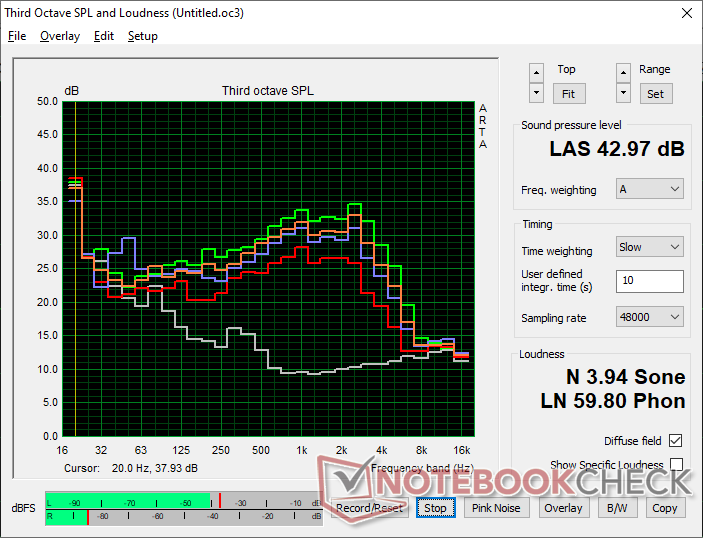
Rumore del sistema
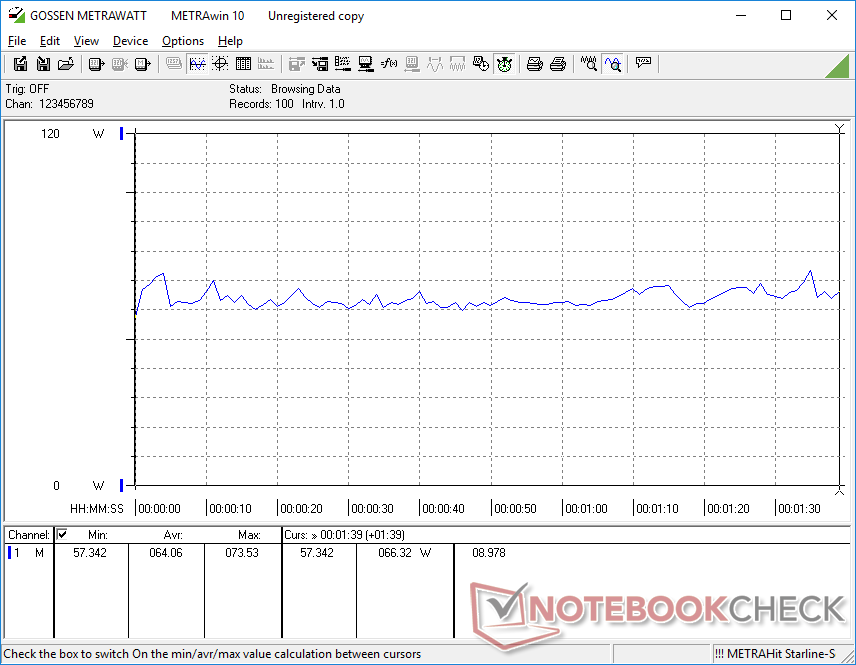
Il rumore della ventola è forse quello che richiede più attenzione da parte del produttore. Il GTR6 pulsa costantemente tra i 23 dB(A) e i 36 dB(A) anche in assenza di attività sullo schermo. I cambiamenti nel rumore della ventola sono evidenti e distraggono se si sta semplicemente navigando sul web o si sta trasmettendo un video. La maggior parte degli altri mini PC dispone di controlli della ventola e di un comportamento degli RPM superiori a quelli del GTR6
Il rumore della ventola si stabilizza intorno ai 40 dB(A) quando si gioca, un valore almeno paragonabile a quello di molti Ultrabook e del vecchio GTR5 in condizioni di test simili. È un peccato che la ventola pulsi così frequentemente durante i carichi medio-bassi.
Rumorosità
| Idle |
| 23.6 / 23.8 / 36.2 dB(A) |
| Sotto carico |
| 39.7 / 43 dB(A) |
 | ||
30 dB silenzioso 40 dB(A) udibile 50 dB(A) rumoroso |
||
min: | ||
| Beelink GTR6 Radeon 680M, R9 6900HX, Kingston KC3000 512G SKC3000S512G | Beelink SEi11 Pro Iris Xe G7 96EUs, i5-11320H, Kingston NV1 SNVS/500GCN | Beelink GTR5 Vega 8, R9 5900HX, Kingston NV1 SNVS/500GCN | Intel NUC11PHKi7C GeForce RTX 2060 Mobile, i7-1165G7, Samsung SSD 980 Pro 500GB MZ-V8P500BW | Intel NUC11TNKi5 Iris Xe G7 80EUs, i5-1135G7, Transcend M.2 SSD 430S TS512GMTS430S | GMK NucBox 2 Iris Plus Graphics 655, i5-8259U, Netac S930E8/256GPN | |
|---|---|---|---|---|---|---|
| Noise | 10% | -14% | 2% | -14% | 5% | |
| off /ambiente * (dB) | 23.2 | 22.8 2% | 23.1 -0% | 24.5 -6% | 24.8 -7% | 25.6 -10% |
| Idle Minimum * (dB) | 23.6 | 24.7 -5% | 34.2 -45% | 25.3 -7% | 35.6 -51% | 25.7 -9% |
| Idle Average * (dB) | 23.8 | 24.7 -4% | 34.2 -44% | 25.3 -6% | 35.6 -50% | 25.7 -8% |
| Idle Maximum * (dB) | 36.2 | 25.3 30% | 34.2 6% | 25.3 30% | 35.6 2% | 25.7 29% |
| Load Average * (dB) | 39.7 | 33.2 16% | 44.6 -12% | 36.4 8% | 36.2 9% | 35.3 11% |
| Witcher 3 ultra * (dB) | 41 | 34.5 16% | 41.4 -1% | 39.7 3% | 38 7% | |
| Load Maximum * (dB) | 43 | 37.8 12% | 45.1 -5% | 47.9 -11% | 47.6 -11% | 35.1 18% |
* ... Meglio usare valori piccoli
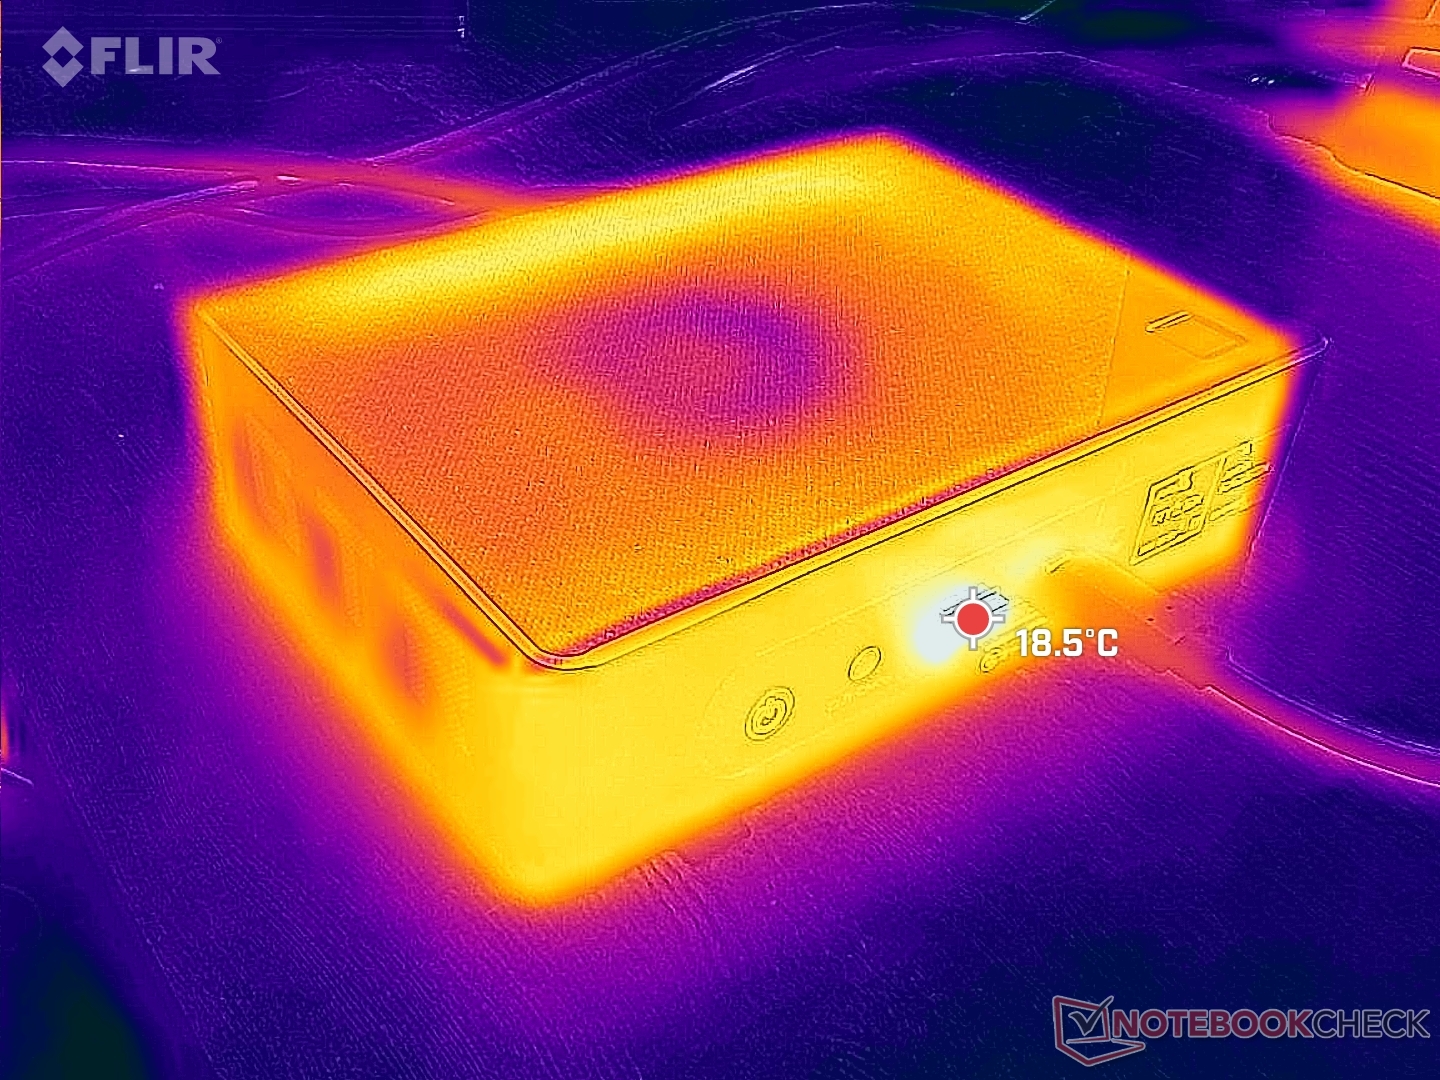
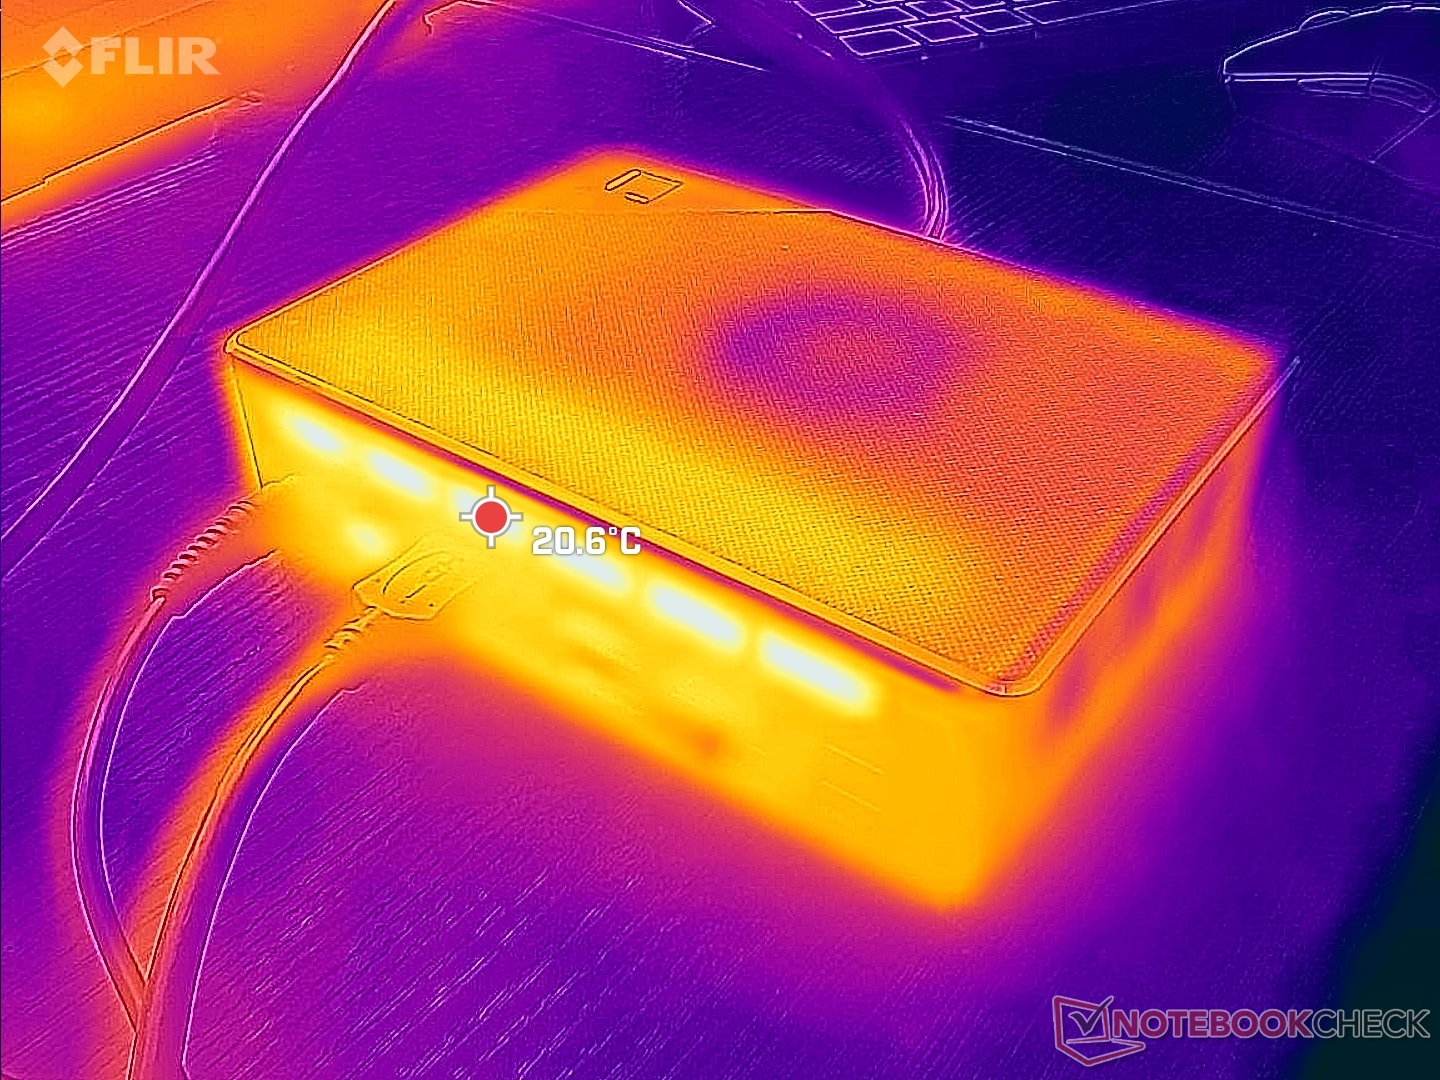
Temperatura
La temperatura della superficie non è un problema, poiché non è mai fastidiosamente calda. Tuttavia, è bene tenere presente che l'aria fredda entra dall'alto e quindi non è consigliabile posizionare libri o oggetti sopra l'unità. Assicuratevi di lasciare un ampio spazio anche dietro l'unità, dove il calore residuo fuoriesce.
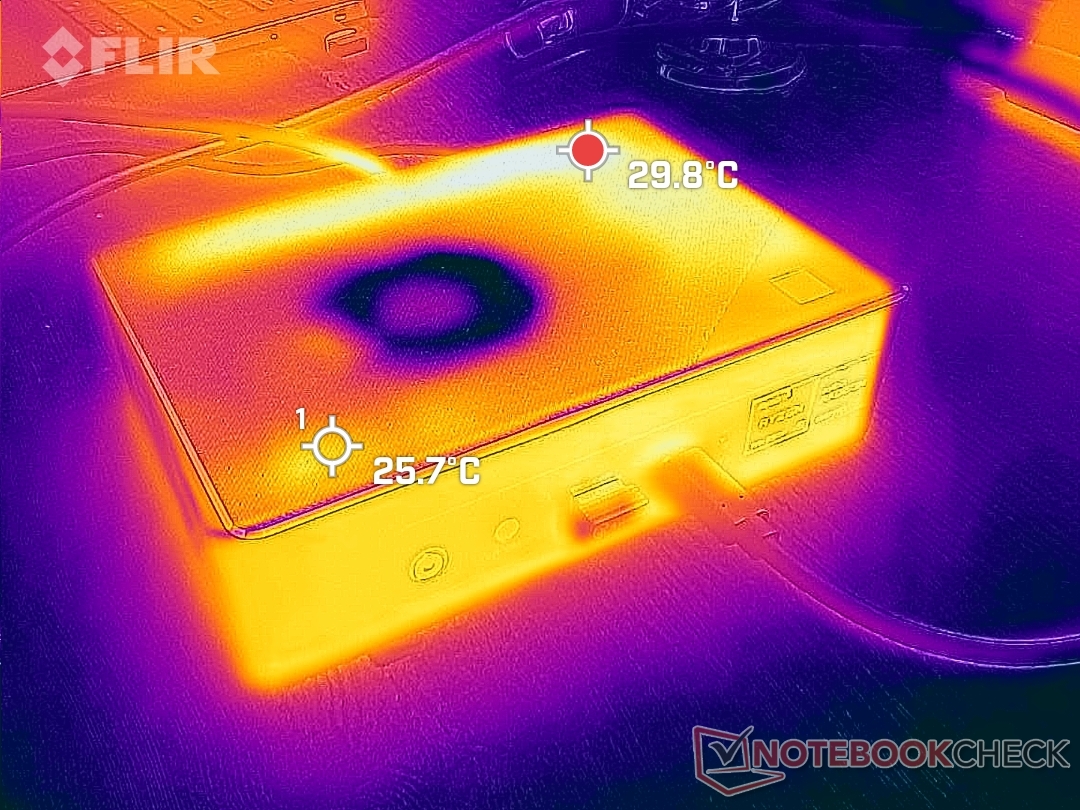
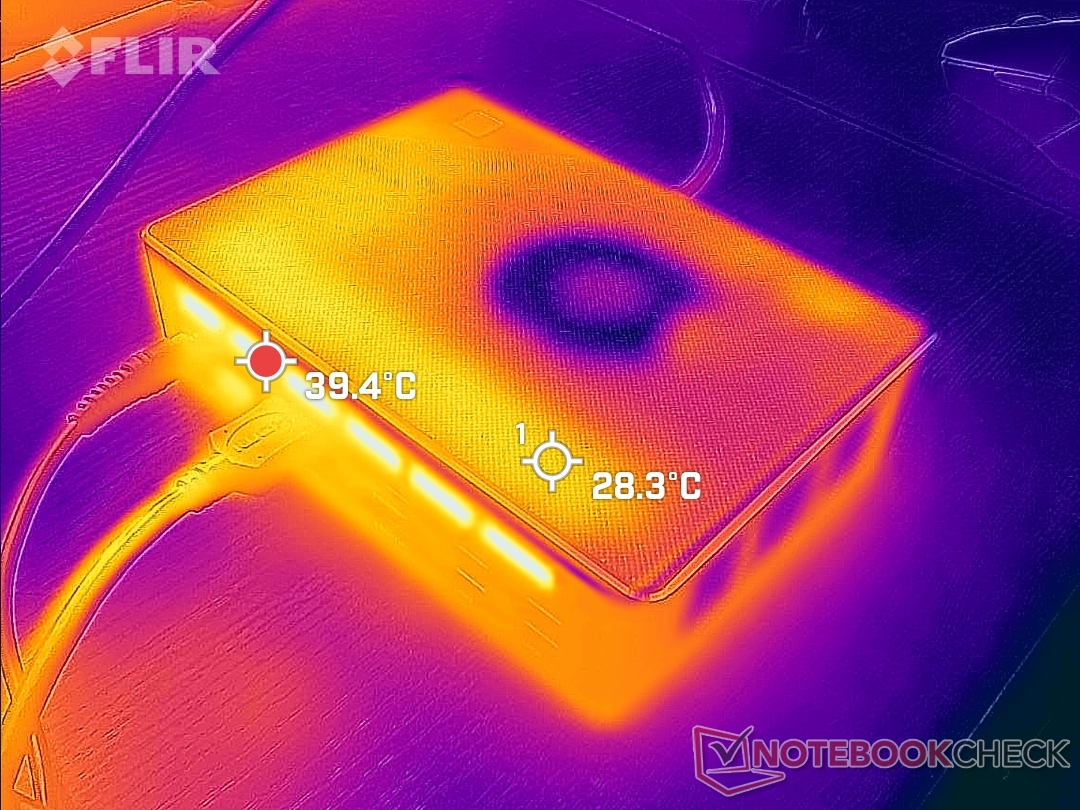
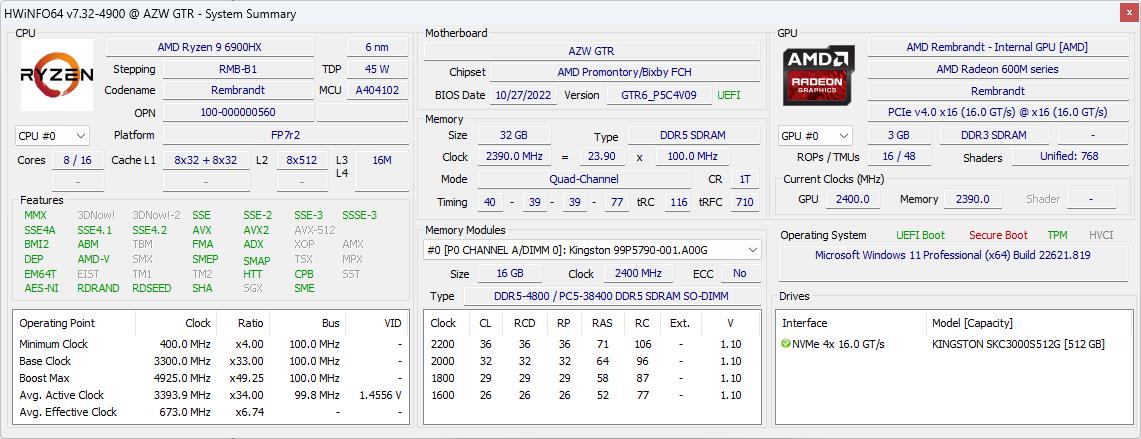
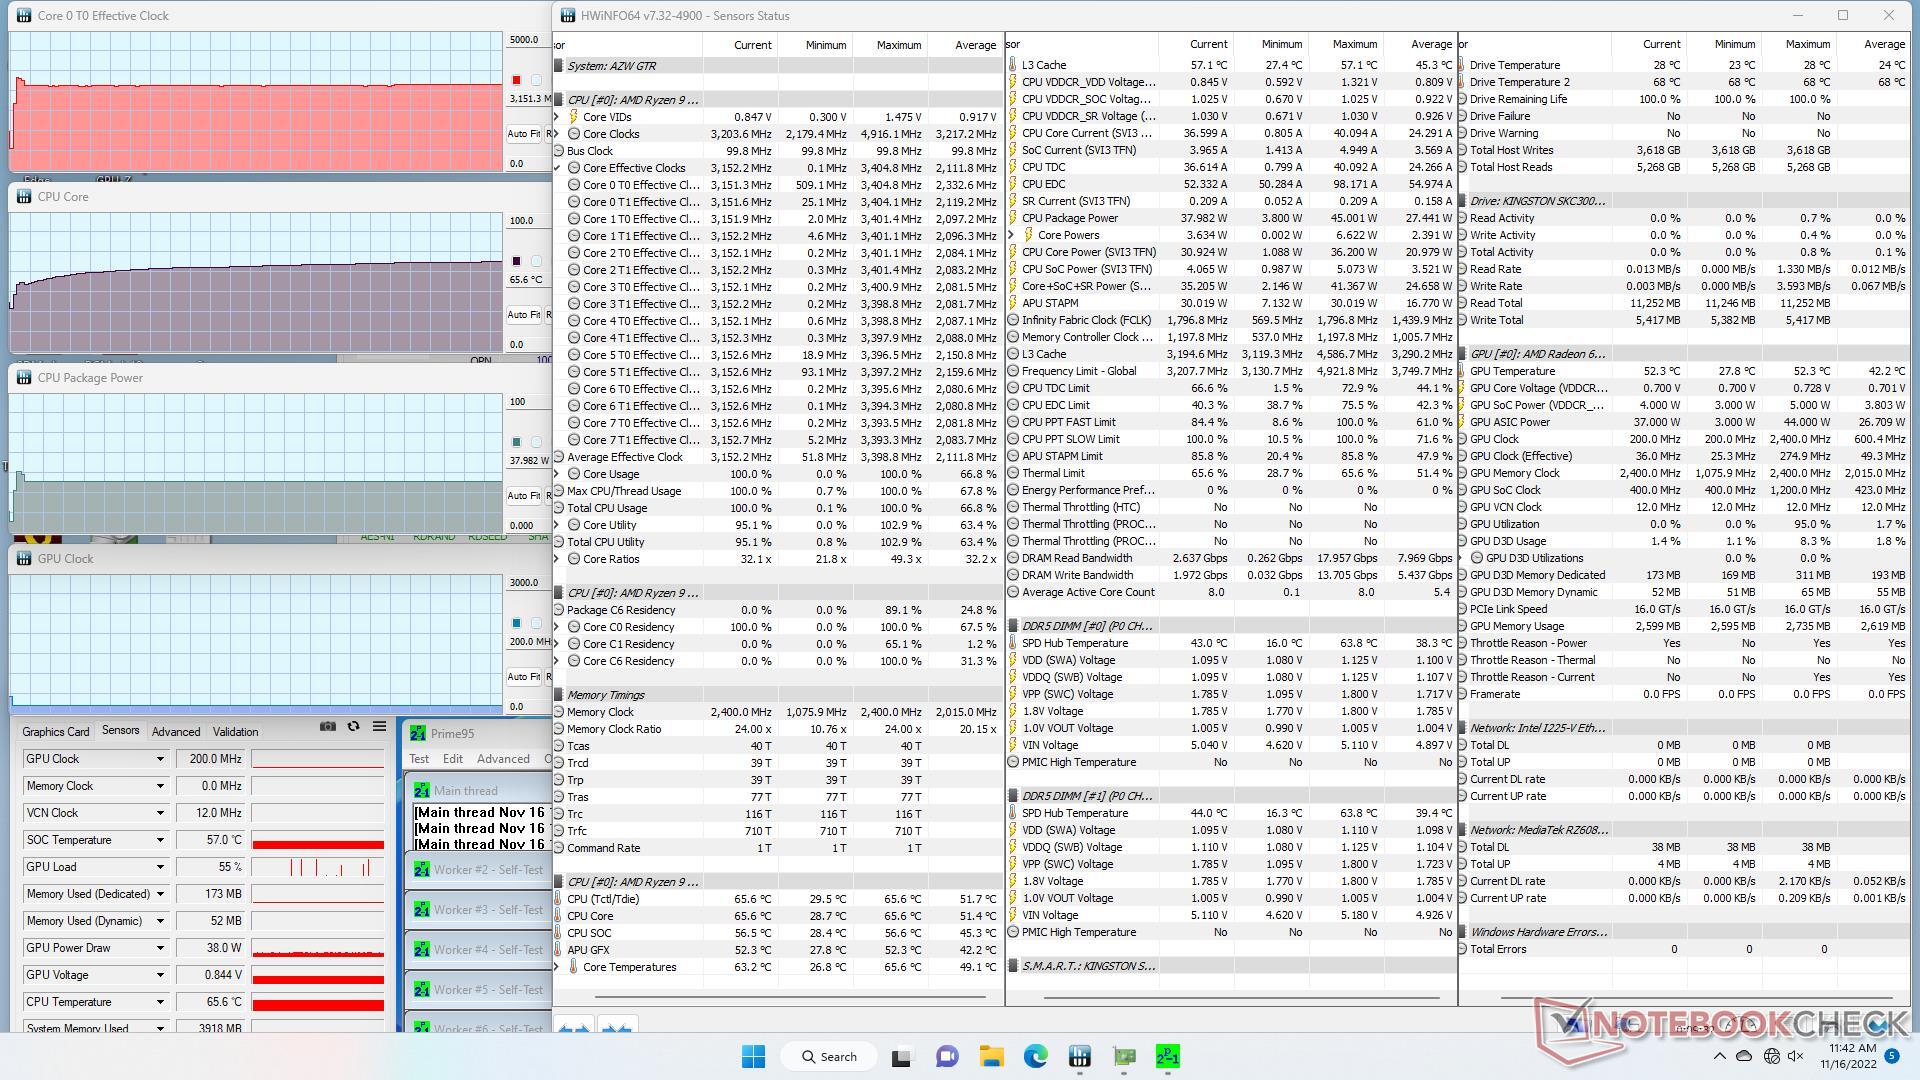
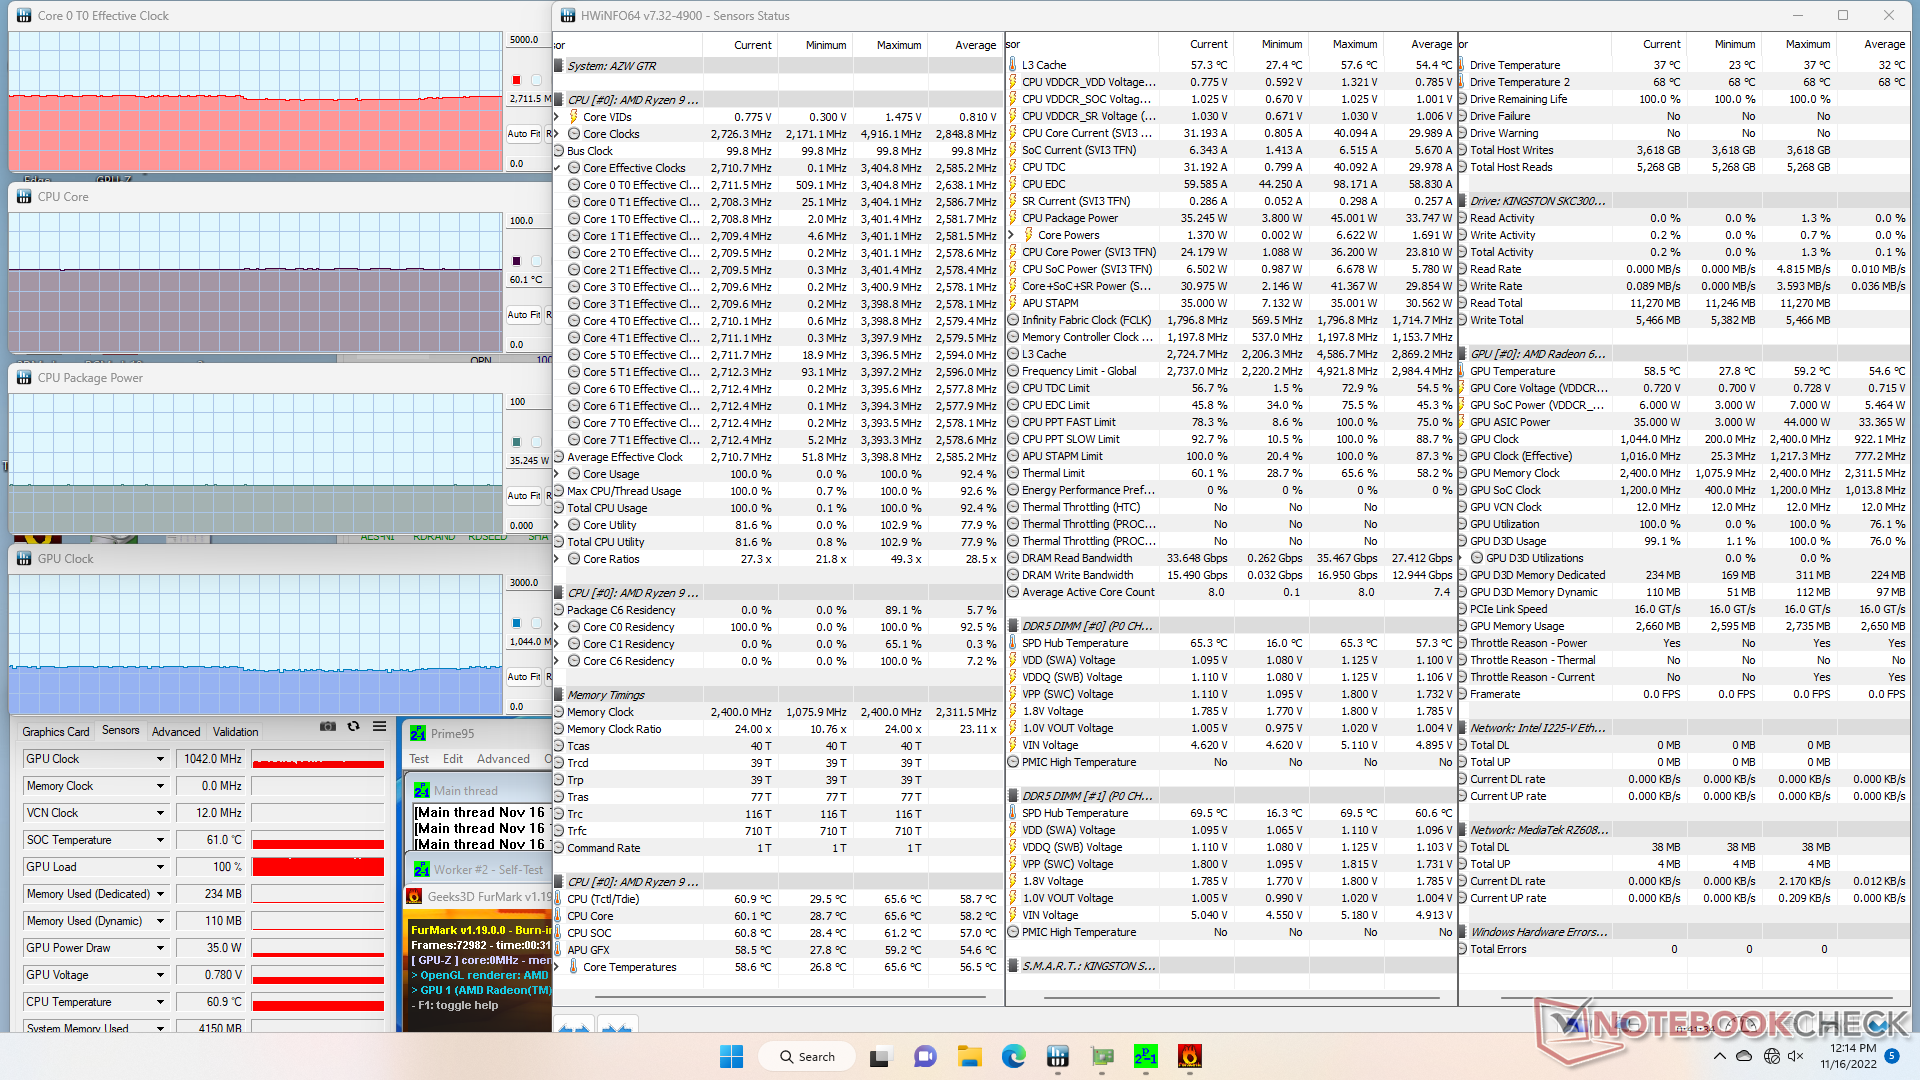
Stress test
Quando è stata sollecitata con Prime95, la CPU ha raggiunto i 3,4 GHz e i 45 W per pochi secondi, prima di stabilizzarsi a 3,1 GHz, 38 W e 66 C. C'è sicuramente spazio per l'overclocking da parte dell'utente finale, dato che il produttore ha apparentemente fissato un tetto massimo di temperatura conservativo con le impostazioni predefinite.
La frequenza di clock della GPU e la temperatura si stabilizzerebbero rispettivamente a 1977 MHz e a 56 C, ragionevolmente freddi, quando si esegue Witcher 3 per rappresentare i carichi di gioco tipici.
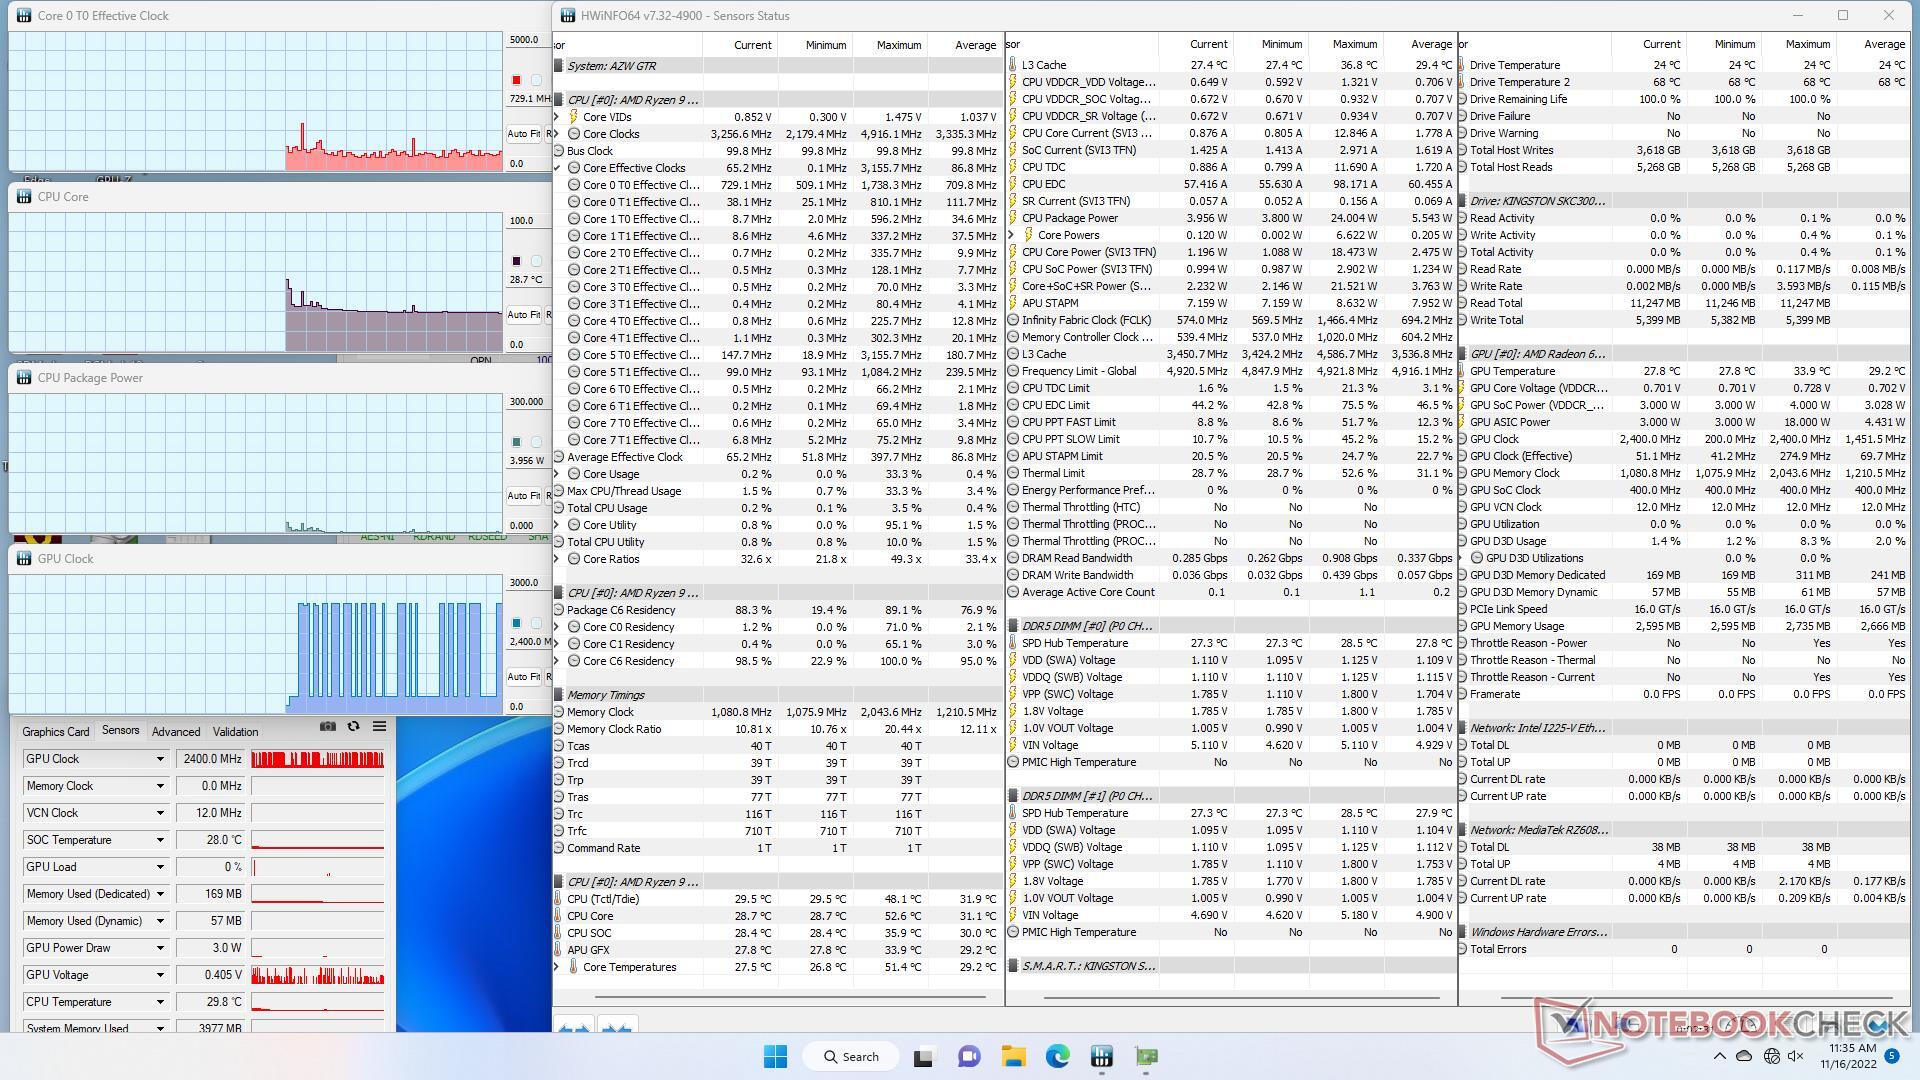
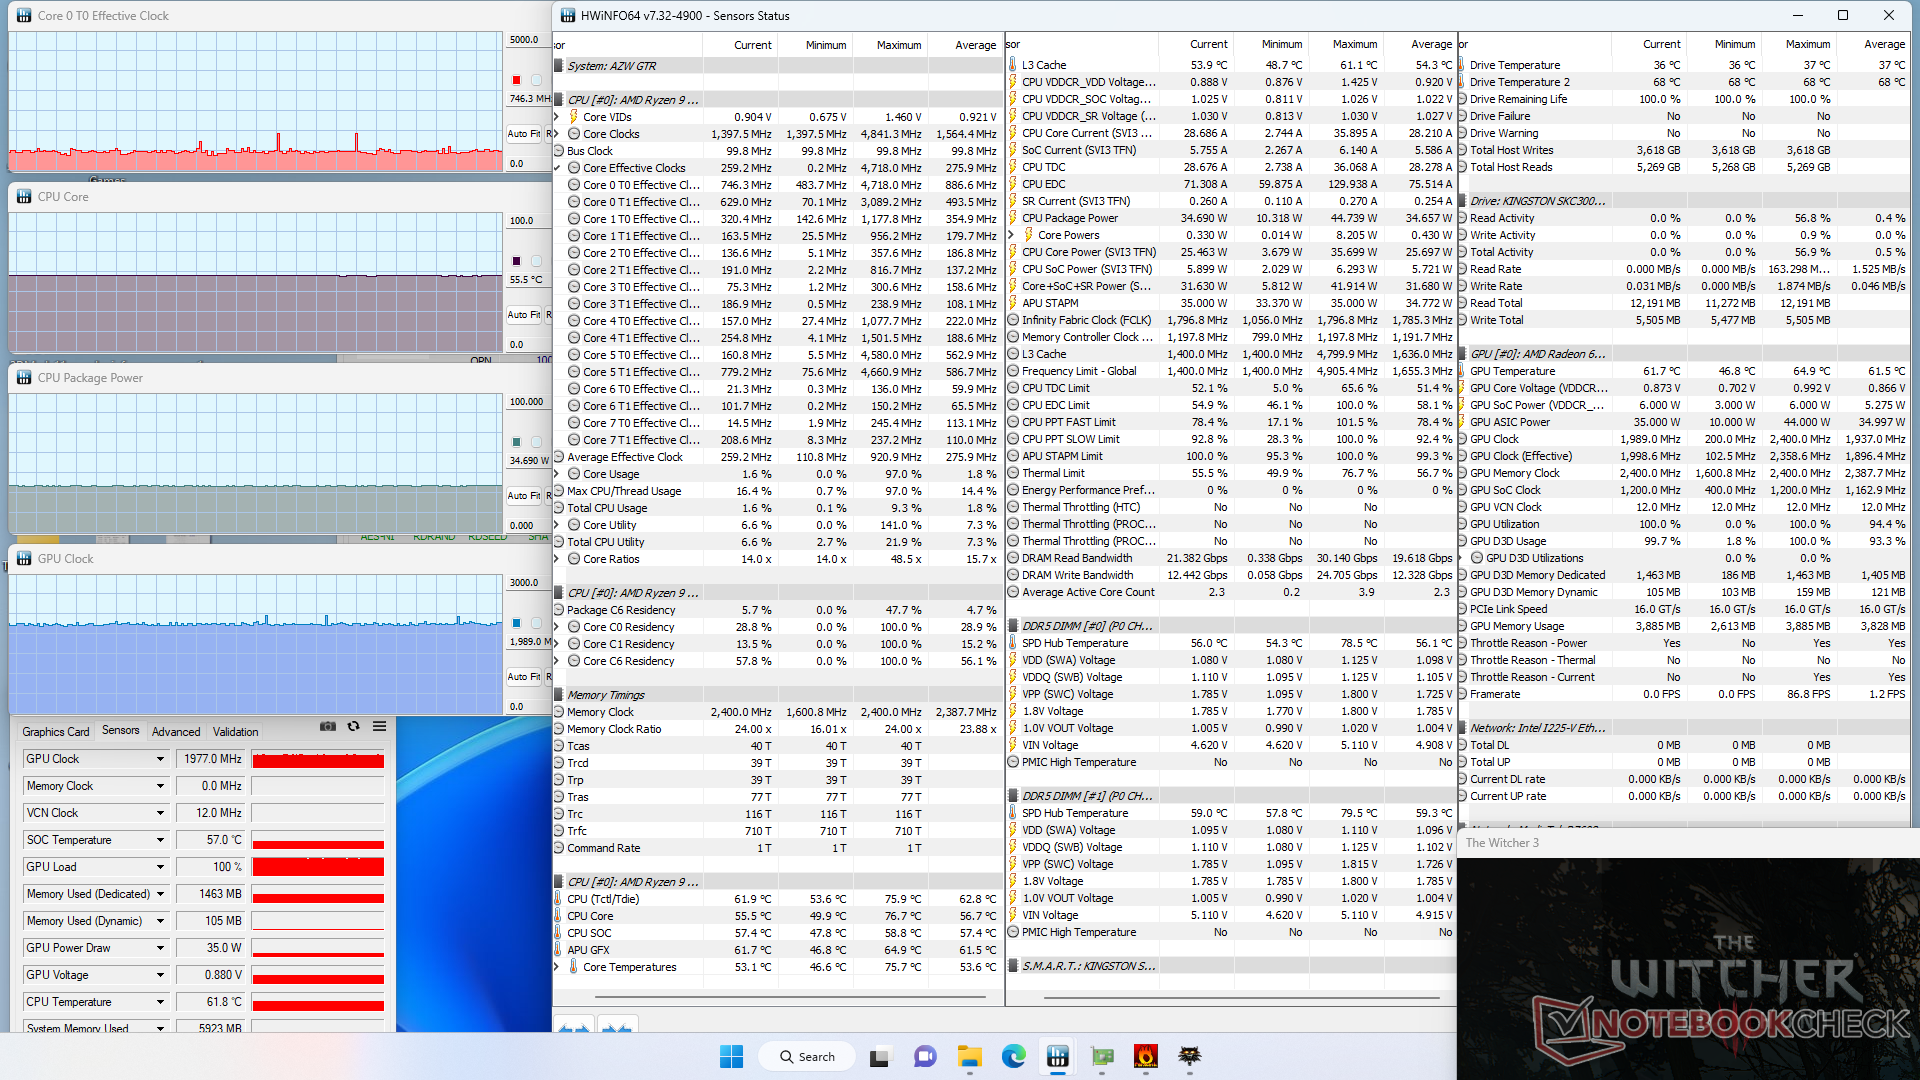
| Clock della CPU (GHz) | Clock della GPU (MHz) | Temperatura media della CPU (°C) | |
| Sistema inattivo | -- | -- | 28 |
| Stress Prime95 | 3,2 | -- | 66 |
| Prime95 + FurMark Stress | 2,7 | 1042 | 60 |
| Witcher 3 Stress | ~0,8 | 1977 | 56 |
Gestione dell'energia
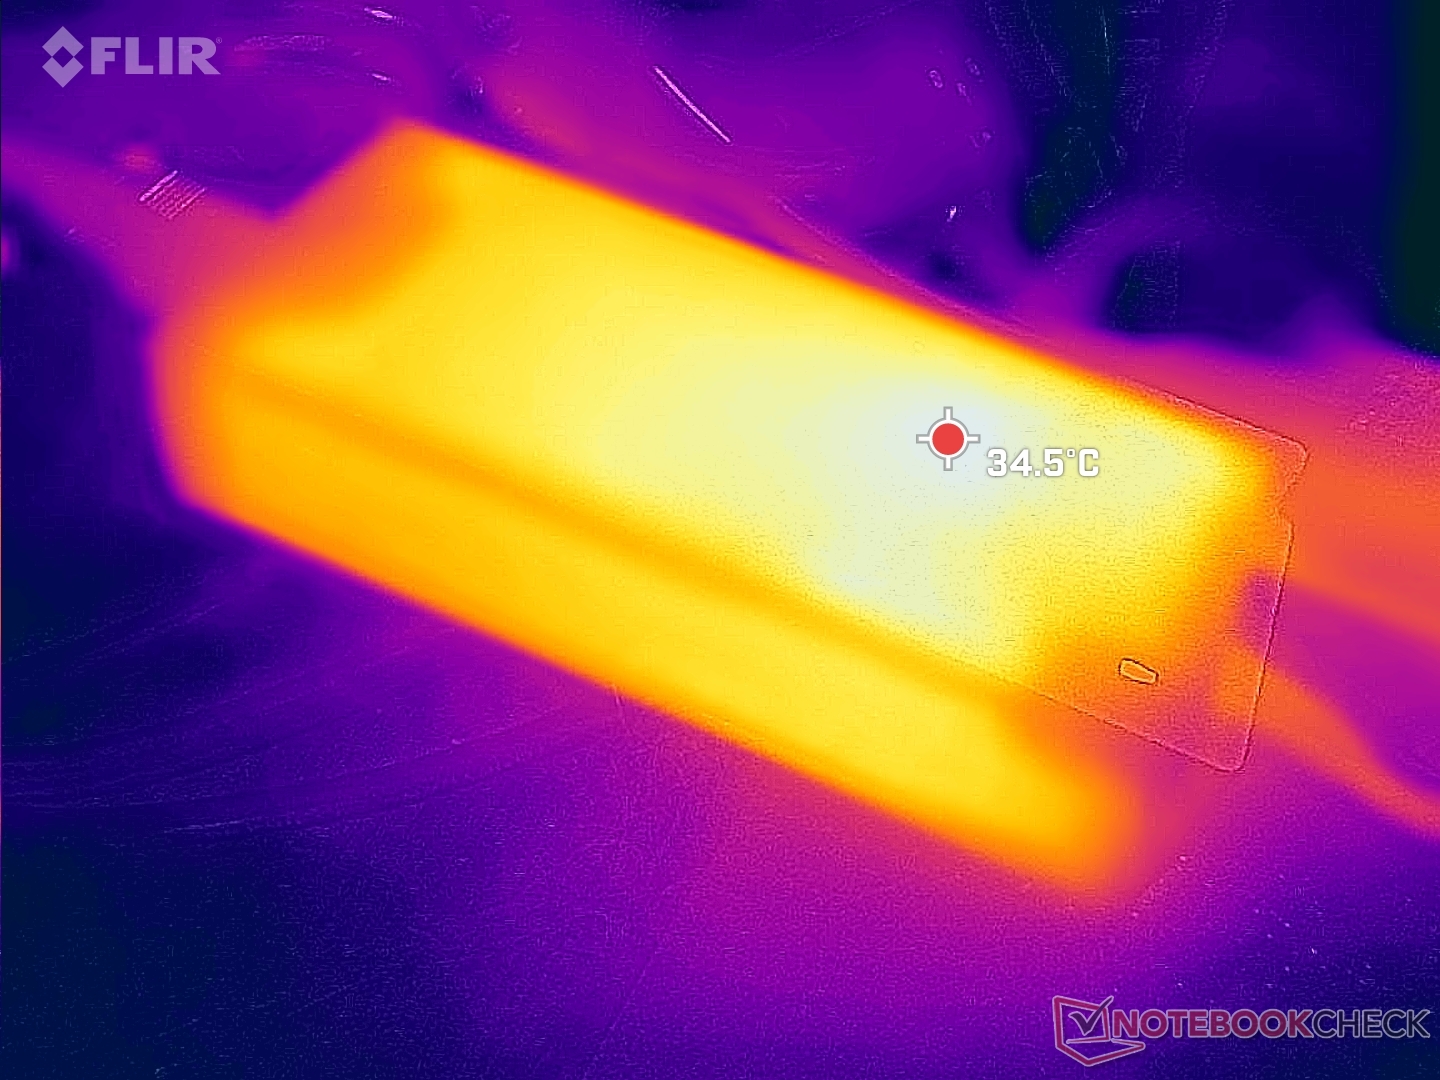
Consumo di energia
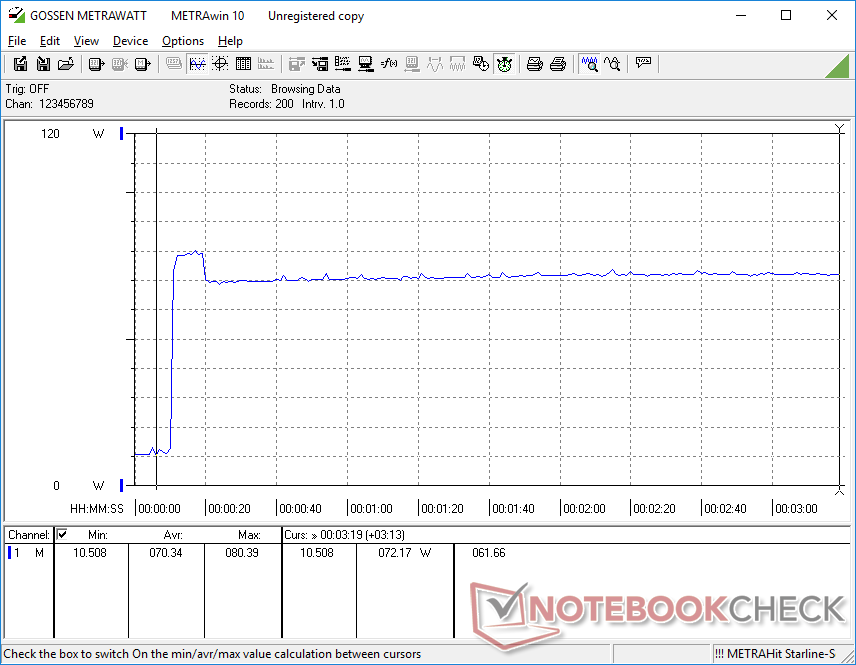
Il consumo complessivo è quasi identico a quello che abbiamo registrato sul GTR5 nonostante l'aumento del 60% delle prestazioni grafiche. In altre parole, il GTR6 è in grado di fornire prestazioni grafiche significativamente più veloci rispetto al suo predecessore a parità di potenza, per prestazioni molto più elevate per watt. Il consumo energetico è comunque molto più elevato rispetto alla maggior parte dei laptop e dei mini PC con CPU Intel Core U e Iris Xe 96 EU, il che spiega le maggiori dimensioni fisiche del GTR6 rispetto a molti NUC Intel.
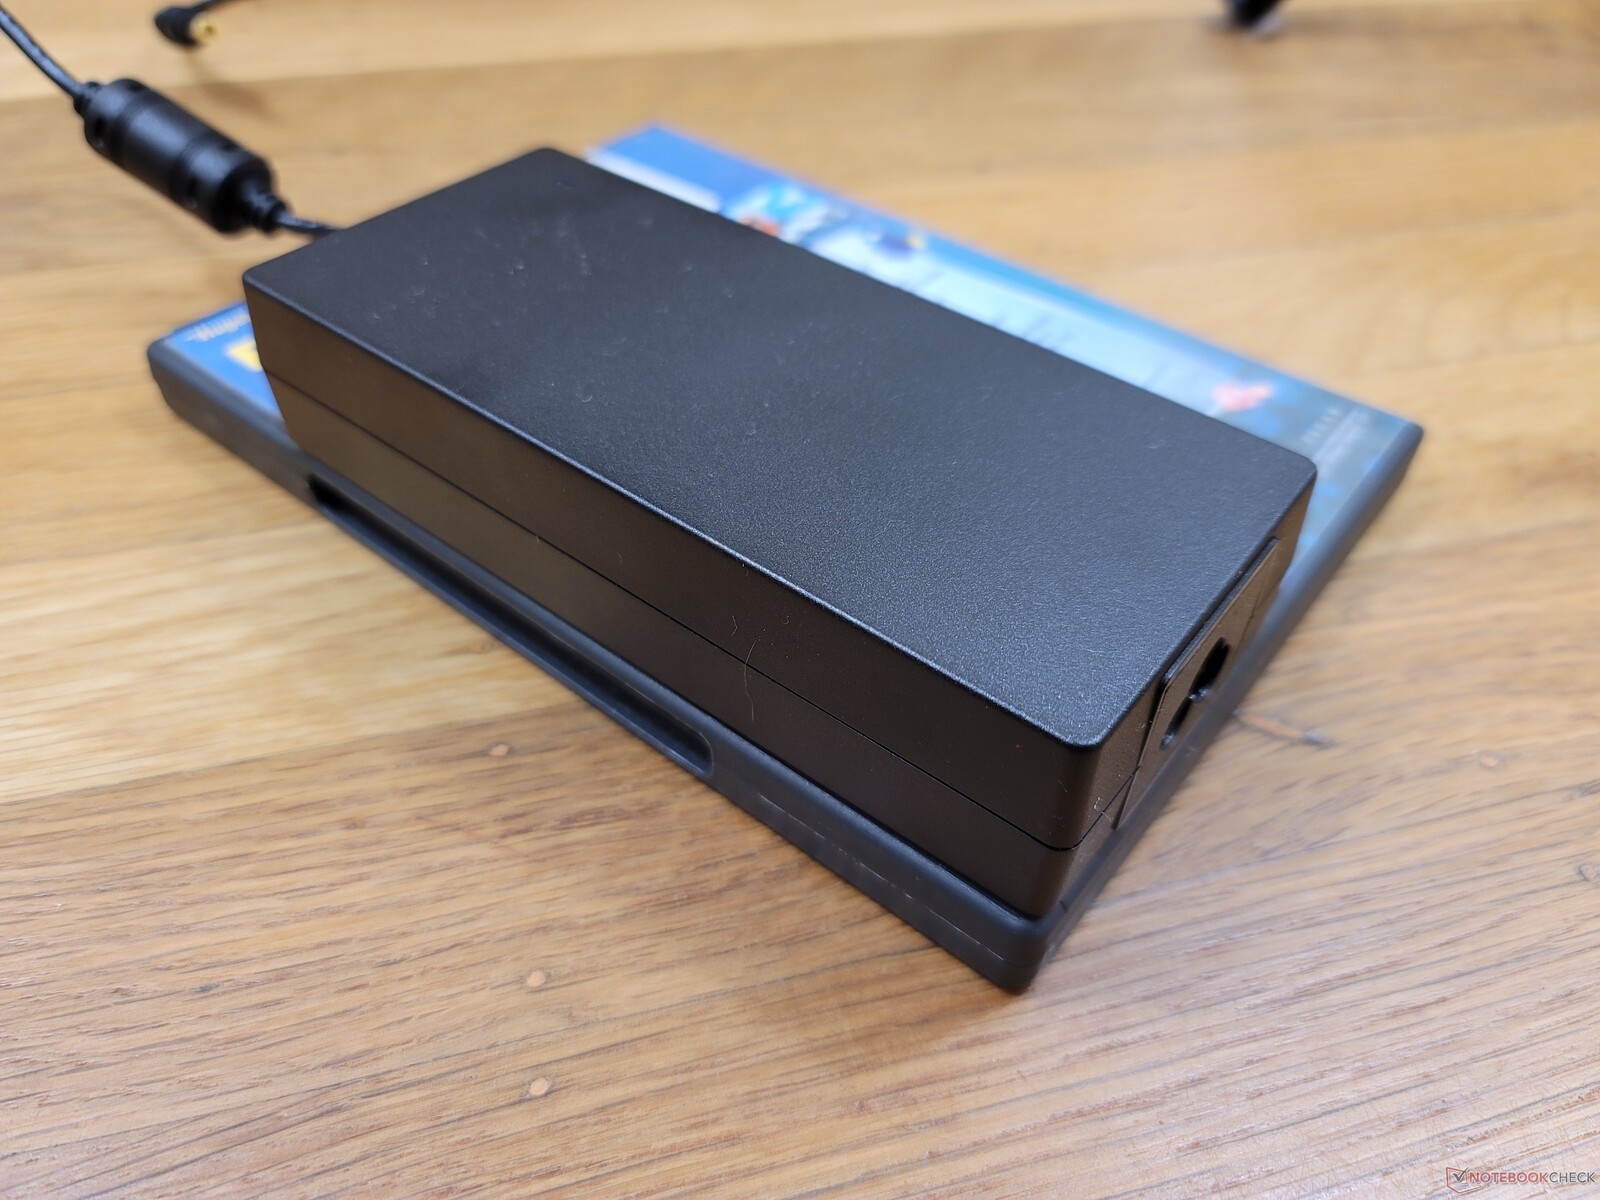
Siamo riusciti a registrare un consumo massimo temporaneo di 81 W dall'adattatore CA di medie dimensioni (~14,4 x 6,3 x 3 cm) da 120 W quando la CPU è al 100% di utilizzo.


| Off / Standby | |
| Idle | |
| Sotto carico |
|
Leggenda:
min: | |
| Beelink GTR6 R9 6900HX, Radeon 680M, Kingston KC3000 512G SKC3000S512G, , x, | Beelink SEi11 Pro i5-11320H, Iris Xe G7 96EUs, Kingston NV1 SNVS/500GCN, , x, | Beelink GTR5 R9 5900HX, Vega 8, Kingston NV1 SNVS/500GCN, , x, | Intel NUC11PHKi7C i7-1165G7, GeForce RTX 2060 Mobile, Samsung SSD 980 Pro 500GB MZ-V8P500BW, , x, | Intel NUC11TNKi5 i5-1135G7, Iris Xe G7 80EUs, Transcend M.2 SSD 430S TS512GMTS430S, , x, | GMK NucBox 2 i5-8259U, Iris Plus Graphics 655, Netac S930E8/256GPN, , x, | |
|---|---|---|---|---|---|---|
| Power Consumption | 6% | 8% | -73% | -3% | 29% | |
| Idle Minimum * (Watt) | 7.6 | 9.8 -29% | 6.2 18% | 5.8 24% | 11.5 -51% | 6.1 20% |
| Idle Average * (Watt) | 9.9 | 10.3 -4% | 8.9 10% | 5.9 40% | 12.4 -25% | 6.8 31% |
| Idle Maximum * (Watt) | 10.6 | 10.5 1% | 9 15% | 20.7 -95% | 12.9 -22% | 7.3 31% |
| Load Average * (Watt) | 64 | 54.2 15% | 66.8 -4% | 130.8 -104% | 40.7 36% | 46.3 28% |
| Witcher 3 ultra * (Watt) | 69 | 53.1 23% | 62.6 9% | 154.4 -124% | 43.9 36% | |
| Load Maximum * (Watt) | 80.4 | 59 27% | 81.6 -1% | 225.2 -180% | 73.5 9% | 50.7 37% |
* ... Meglio usare valori piccoli
Power Consumption Witcher 3 / Stresstest
Power Consumption external Monitor
Pro
Contro
Verdetto - Tutto su quella GPU
Il principale vantaggio di scegliere il Beelink GTR6 rispetto al GTR5 è la grafica integrata notevolmente migliorata. Per il resto, lo Zen 3+ Ryzen 9 6900HX offre prestazioni del processore solo marginalmente più veloci rispetto allo Zen 3 Ryzen 9 5900HX. Se avete intenzione di trasmettere contenuti in streaming sul vostro mini PC con un moderato multitasking occasionale, allora il GTR5 ha una potenza più che sufficiente per i vostri scopi. Se si prevede di eseguire giochi in locale o altre attività ad alta intensità di GPU, allora il GTR6 potrebbe valere l'investimento.
Il prezzo è un altro fattore importante da considerare. Per 750 dollari, il GTR6 viene fornito completo di RAM, SSD, Windows 11 Pro con licenza e una CPU e una GPU integrata più veloci rispetto alla maggior parte delle opzioni NUC di Intel, compresi gli ultimi modelli NUC Pro di 12a generazione https://ark.intel.com/content/www/us/en/ark/products/series/217835/intel-nuc-kit-with-12th-generation-intel-core-processors.html. Beelink offre anche una SKU barebone senza RAM né memoria a soli 540 dollari.
La GPU AMD Radeon 680M è il punto forte del Beelink GTR6. Le prestazioni per dollaro sono elevate rispetto ai NUC Intel della concorrenza nella stessa fascia di prezzo di 750 dollari.
Il rumore della ventola è forse la nostra più grande lamentela riguardo al GTR6, poiché pulsa apparentemente senza motivo quando il sistema è al minimo o esegue carichi non impegnativi. Per il resto, le prestazioni per dollaro e le funzionalità del GTR6 sono entrambe molto competitive.
Prezzo e disponibilità
Il Beelink GTR6 è ora in vendita nella nostra esatta configurazione su Amazon al prezzo di 999 dollari USA o di soli 749 dollari USA se acquistato direttamente dal produttore.
Price comparison

