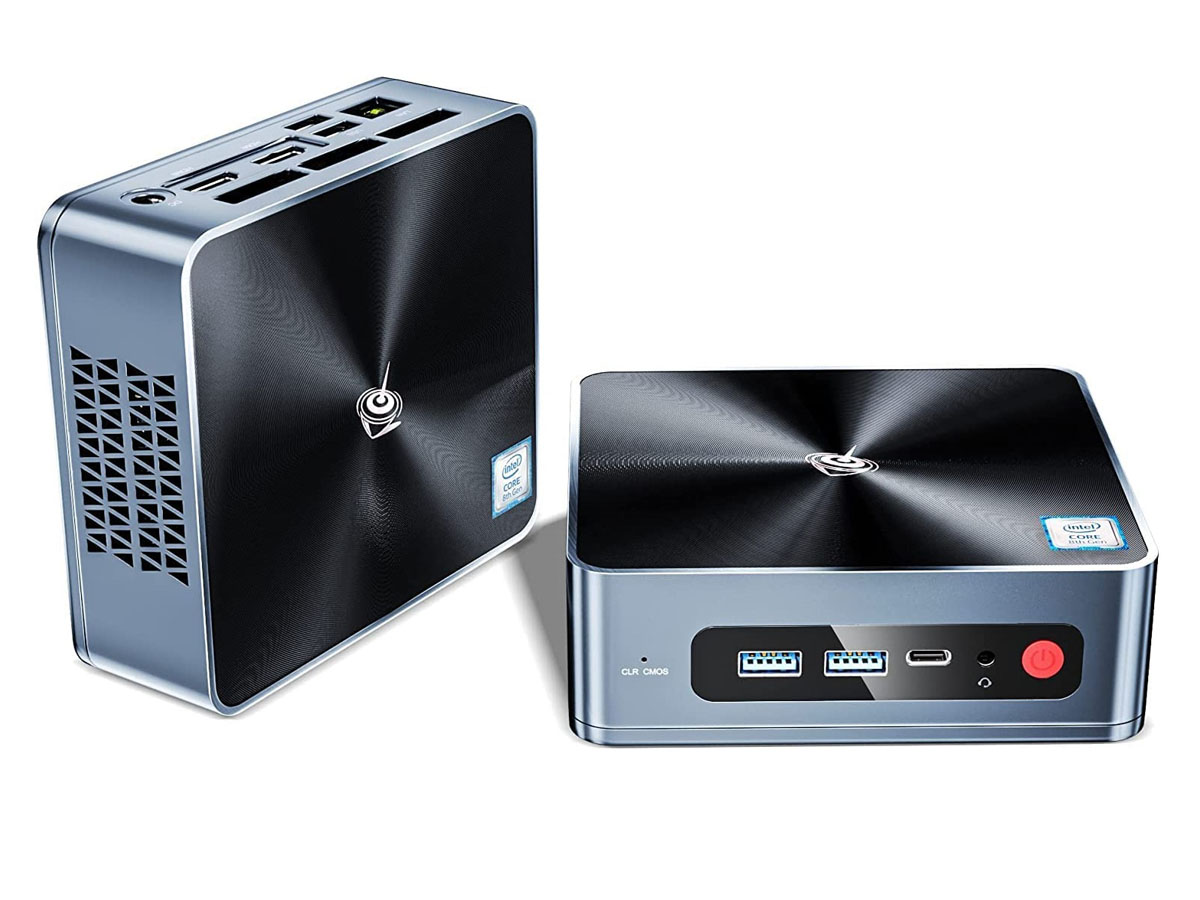
Recensione di Beelink SEi8: Core i3-8109U non comune per un nuovo mini PC
Beelink sta diventando costantemente un'importante alternativa alla serie Intel NUC con la sua crescente gamma di mini PC. Il recente SER4, per esempio, ha dimostrato di essere altrettanto veloce di molti modelli Intel NUC con CPU Core serie U di 11a generazione, pur costando centinaia di dollari in meno
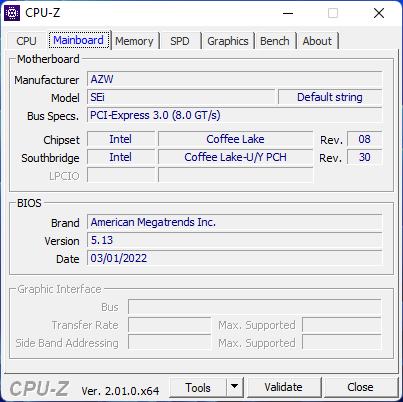
Il SEi8 è dotato di un vecchio Core i3-8109U di 8a generazione o Core i5-8259U, mentre il SEi10 dello scorso anno è dotato di opzioni Core serie U di 10a generazione. Il vecchio Core i3 rende il modello ancora più conveniente e un'alternativa attraente ai NUC Intel con Core i3
Beelink sta attualmente spedendo il SEi8 a partire da 320 dollari con 8 GB di RAM o 380 dollari con 16 GB di RAM. Se configurato con il Core i5-8279U, il prezzo aumenta fino a 400 dollari
Altre recensioni di Beelink:
Potenziali concorrenti a confronto
Punteggio | Data | Modello | Peso | Altezza | Dimensione | Risoluzione | Prezzo |
|---|---|---|---|---|---|---|---|
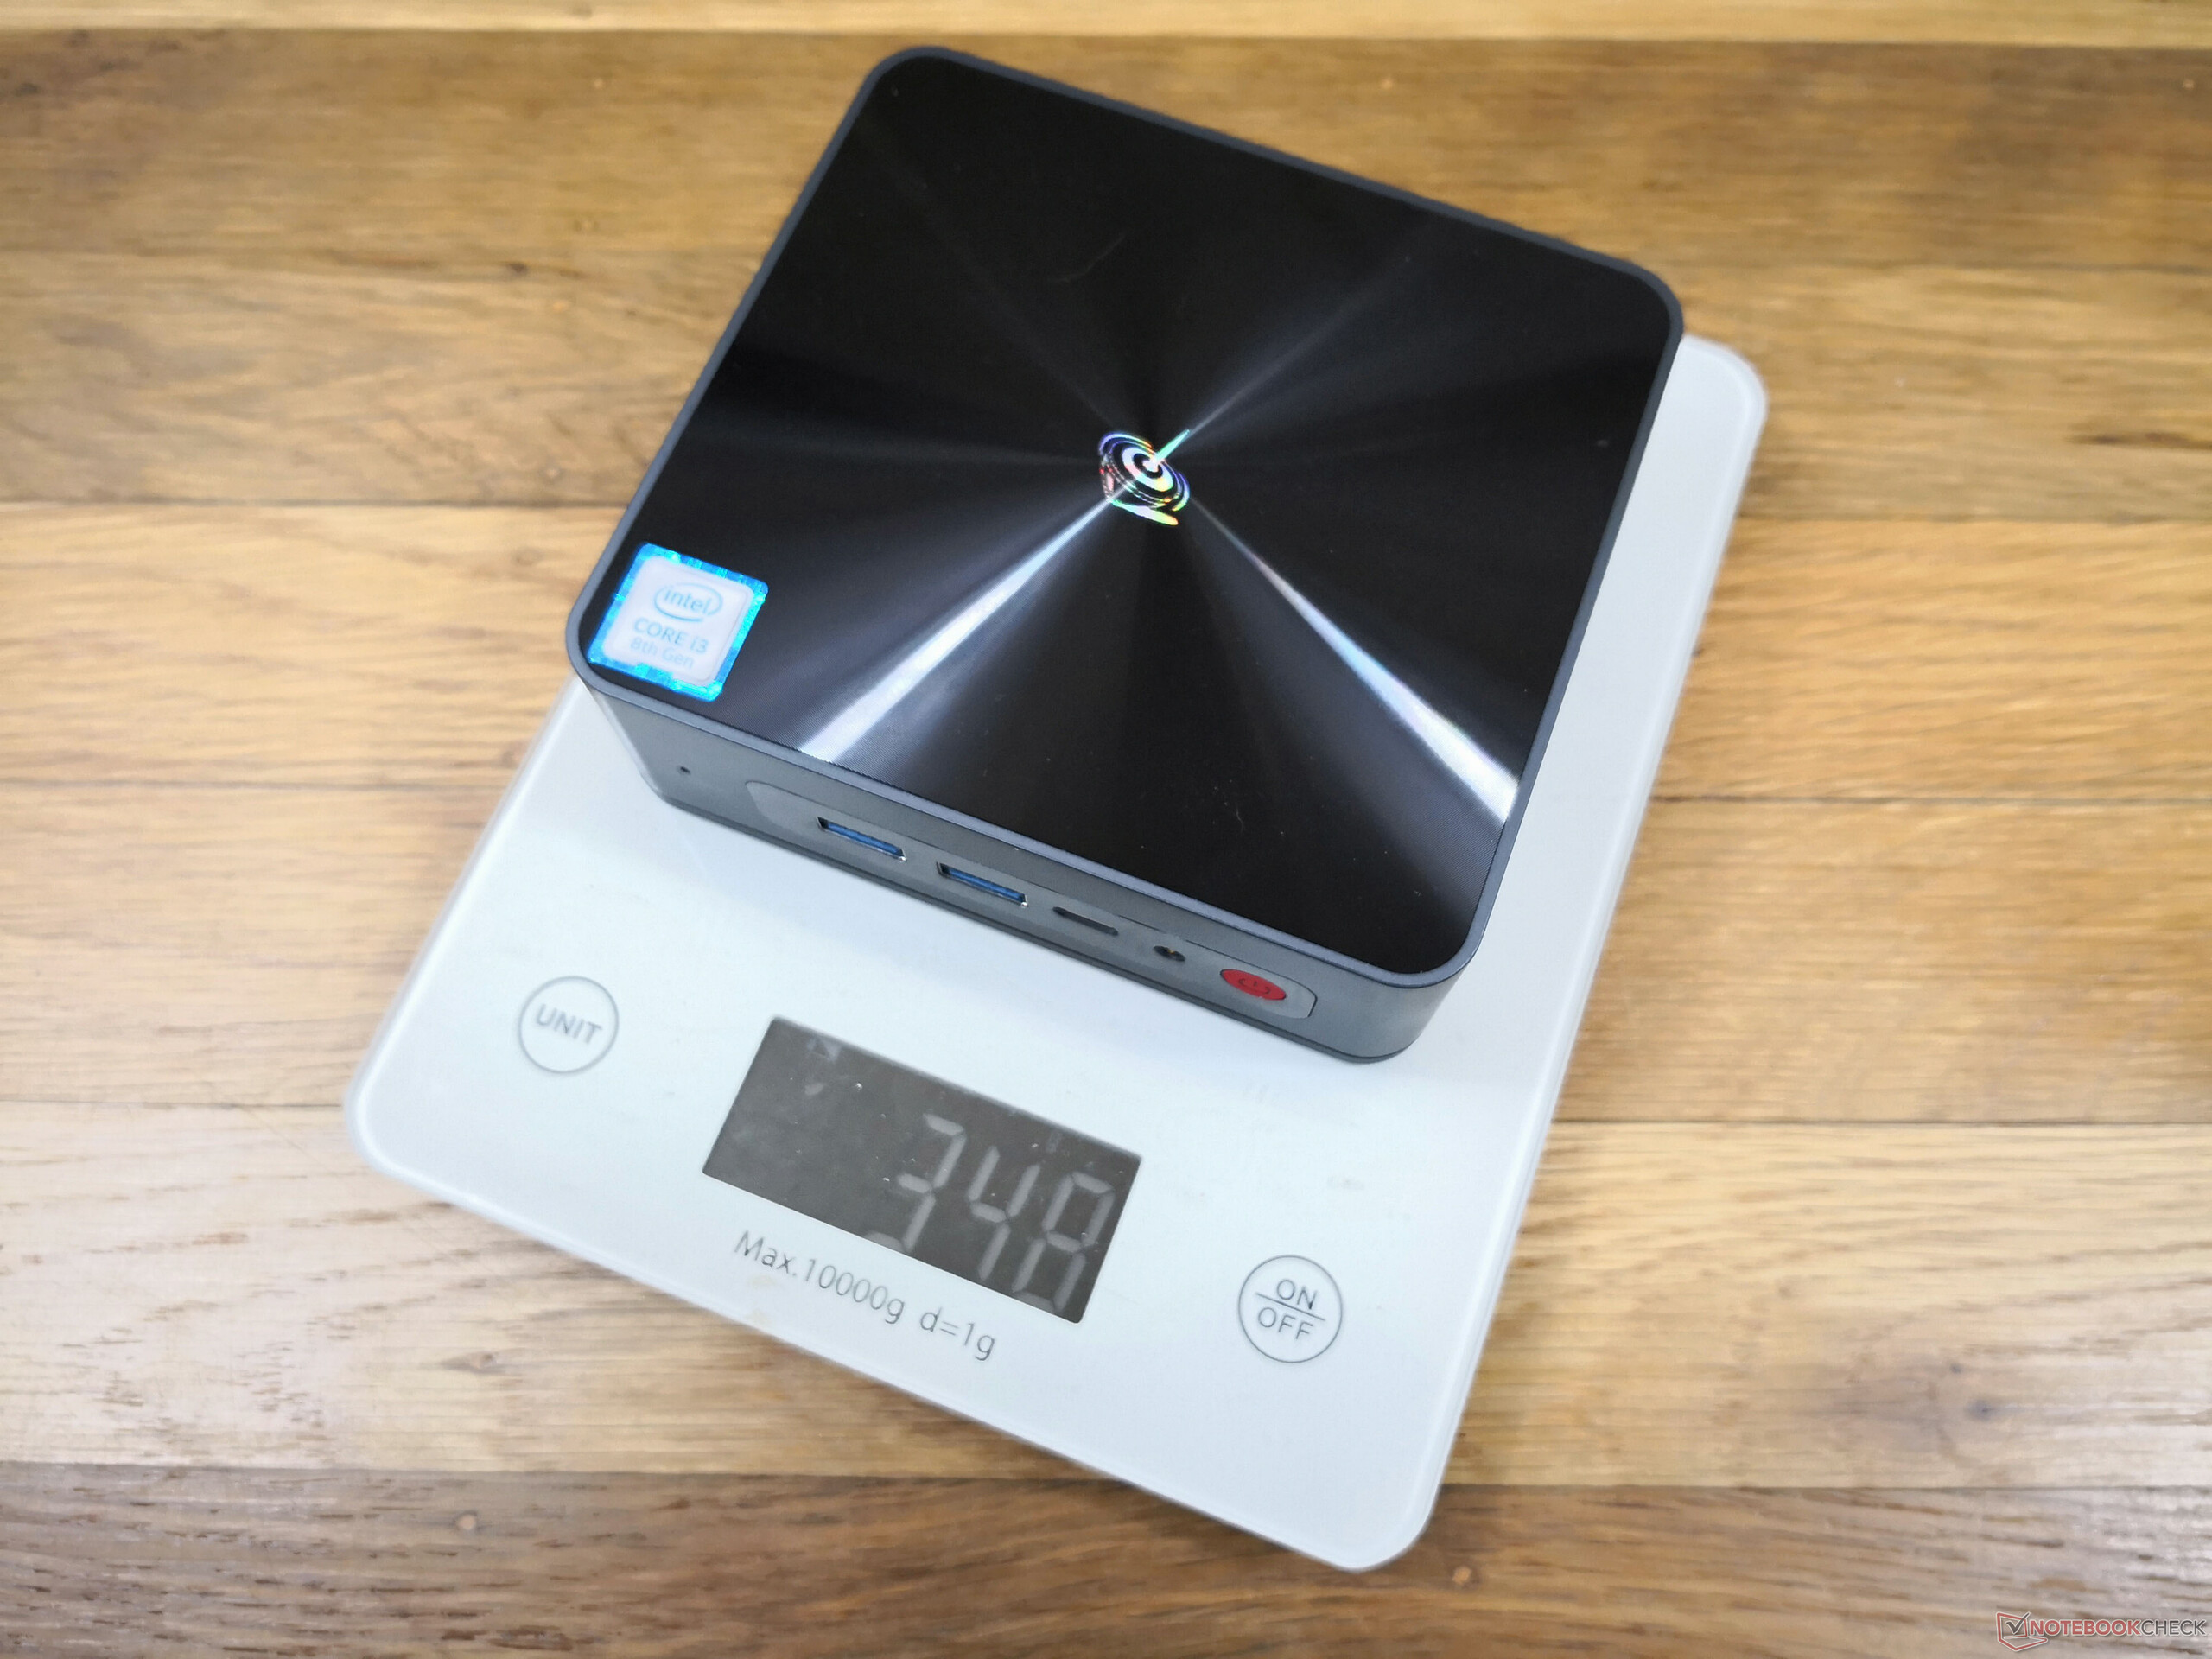
v (old) | 04/2022 | Beelink SEi8 i3-8109U, Iris Plus Graphics 655 | 346 gr | 41 mm | x | ||
v (old) | 12/2020 | Beelink SEi10 i3-1005G1, UHD Graphics G1 (Ice Lake 32 EU) | 350 gr | 41 mm | x | ||
v (old) | 04/2022 | Beelink SER4 R7 4800U, Vega 8 | 494 gr | 40 mm | x | ||
v (old) | 04/2021 | Intel NUC11TNKi5 i5-1135G7, Iris Xe G7 80EUs | 504 gr | 37 mm | x | ||
v (old) | 11/2018 | Intel NUC8i7BE i7-8559U, Iris Plus Graphics 655 | 683 gr | 51 mm | x | ||
v (old) | 03/2021 | GMK NucBox 2 i5-8259U, Iris Plus Graphics 655 | 430 gr | 50 mm | x |
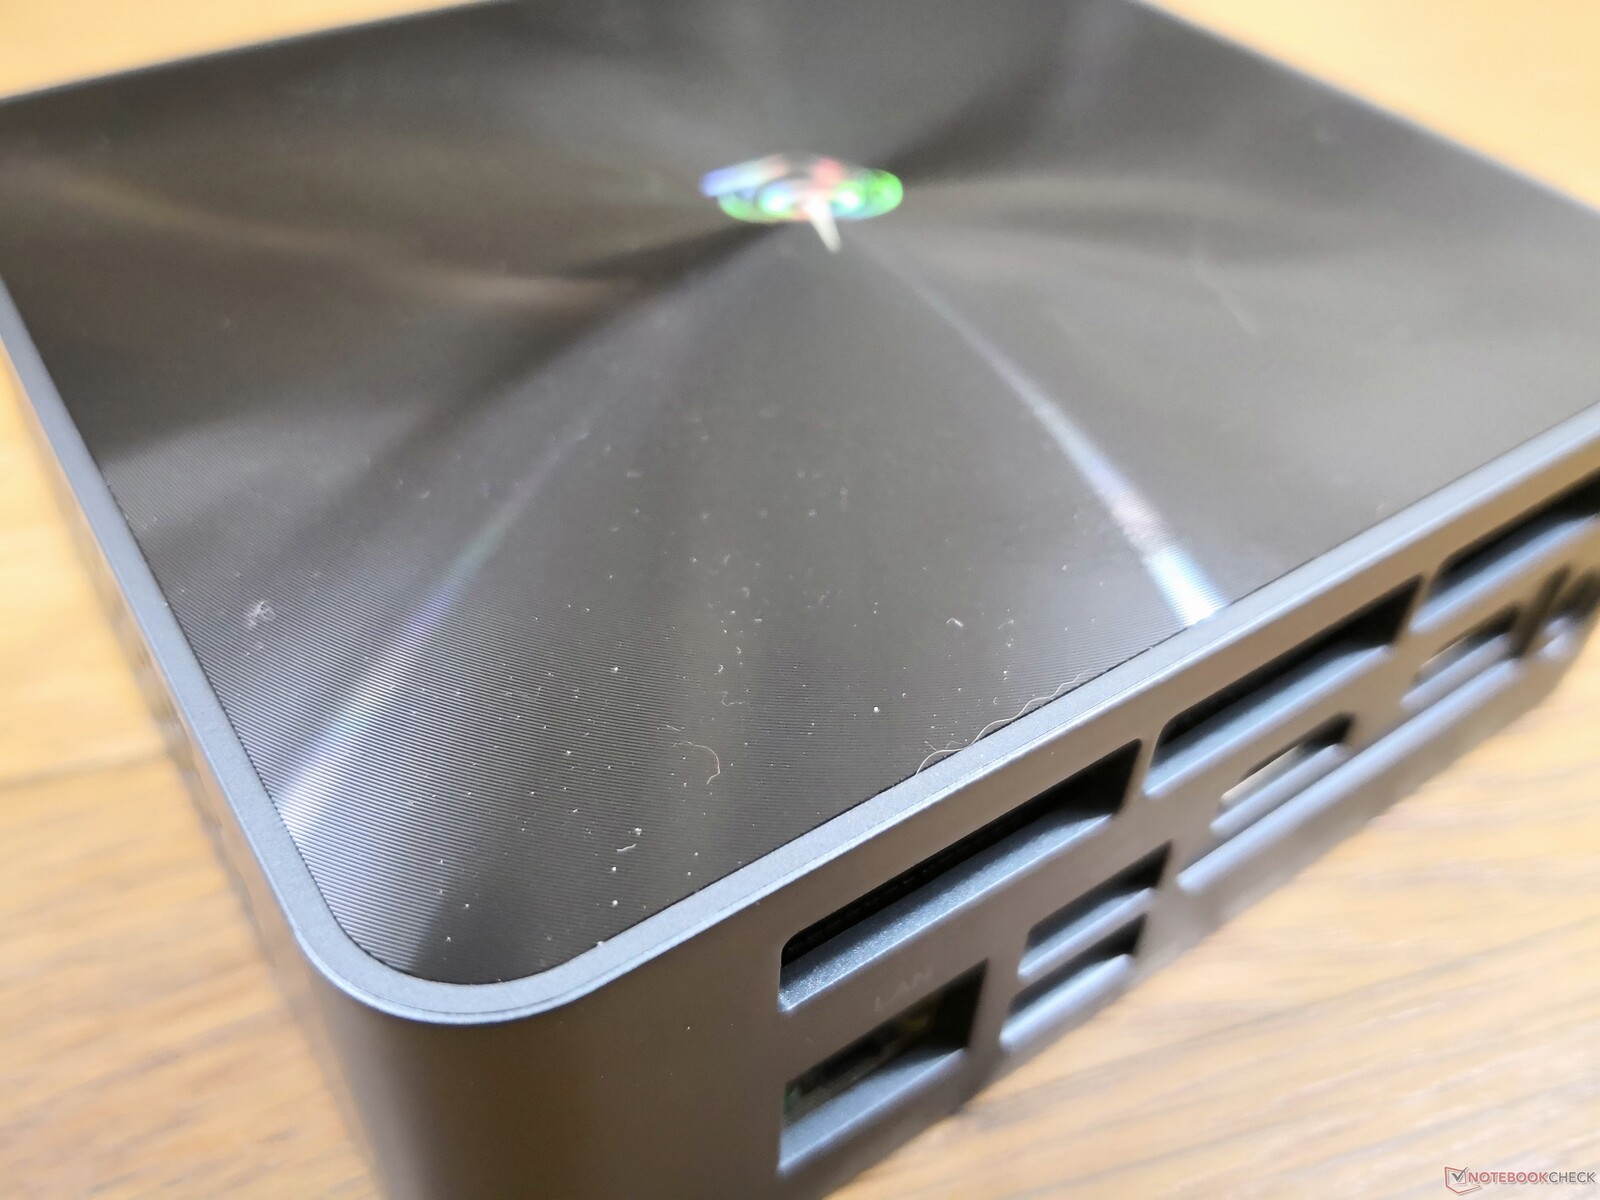
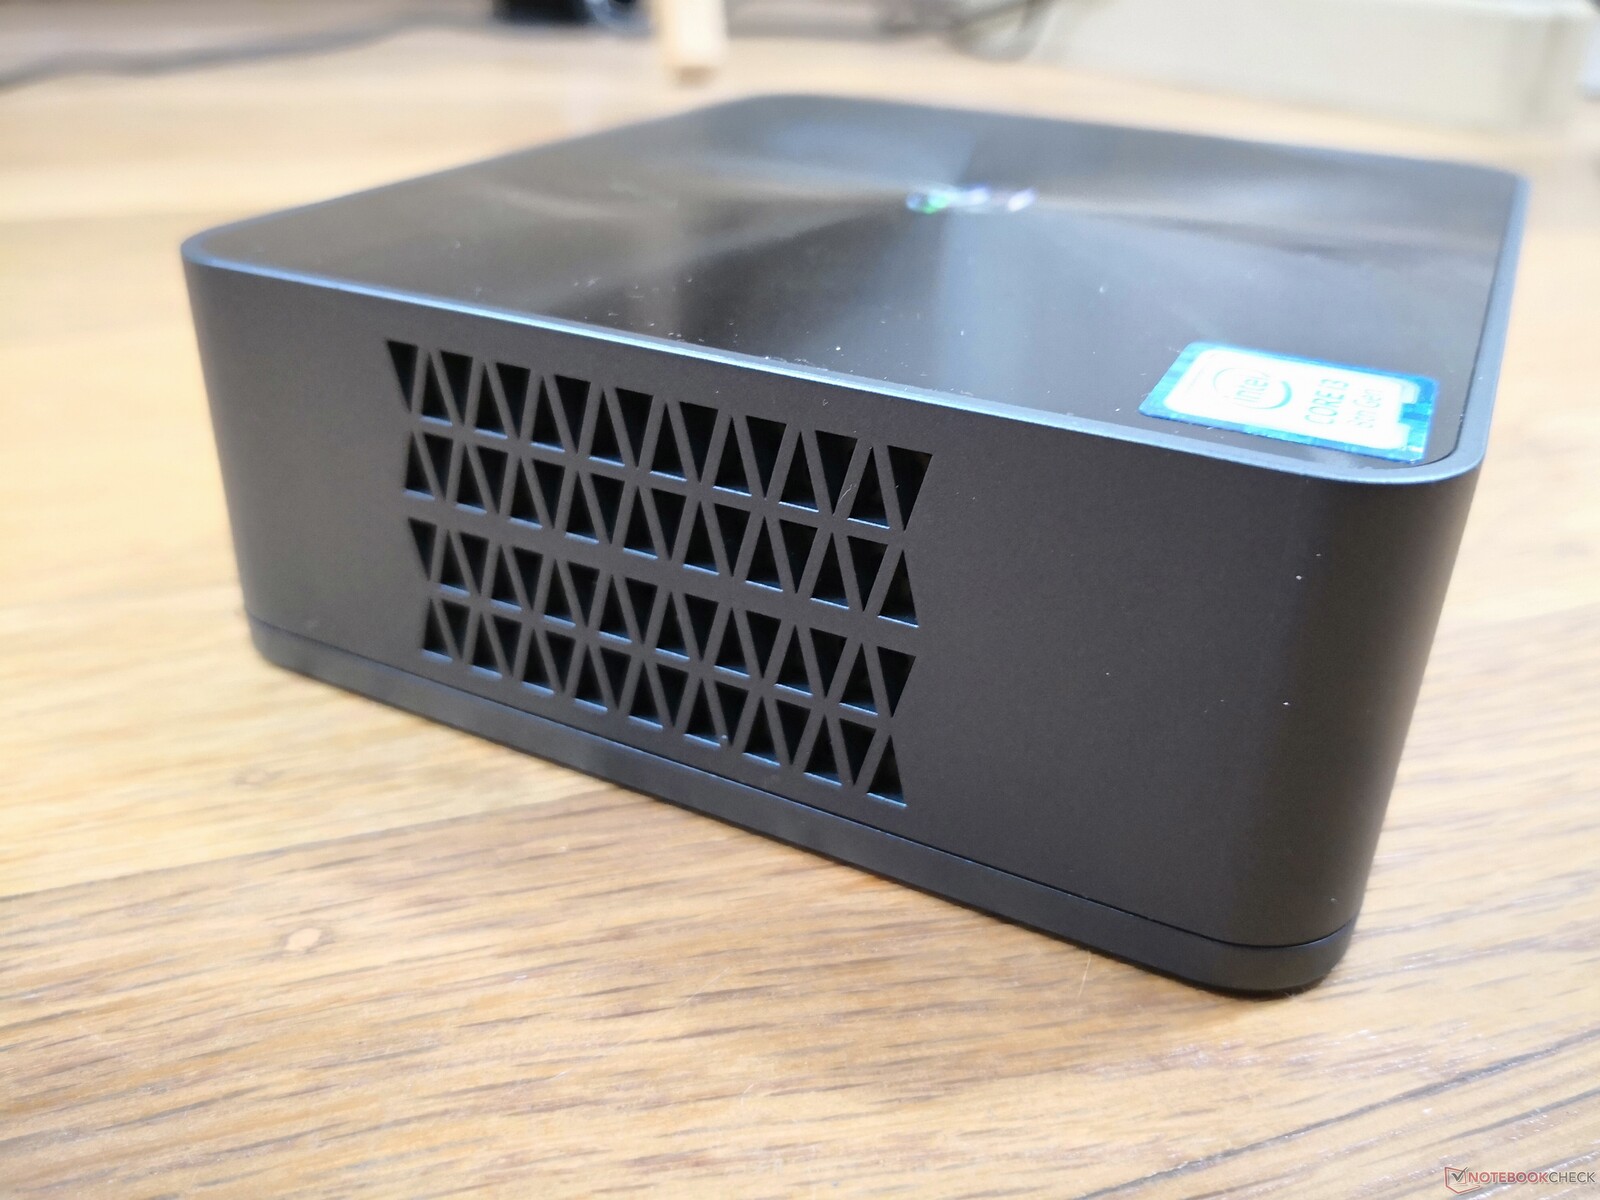
Caso
Lo chassis esterno è identico al SEi10. Il suo design è notevole per essere circa la stessa dimensione di un Intel NUC mentre pesa il 30% in meno. Il materiale dello chassis, anche se ancora rigido, non è così spesso o robusto come un NUC.
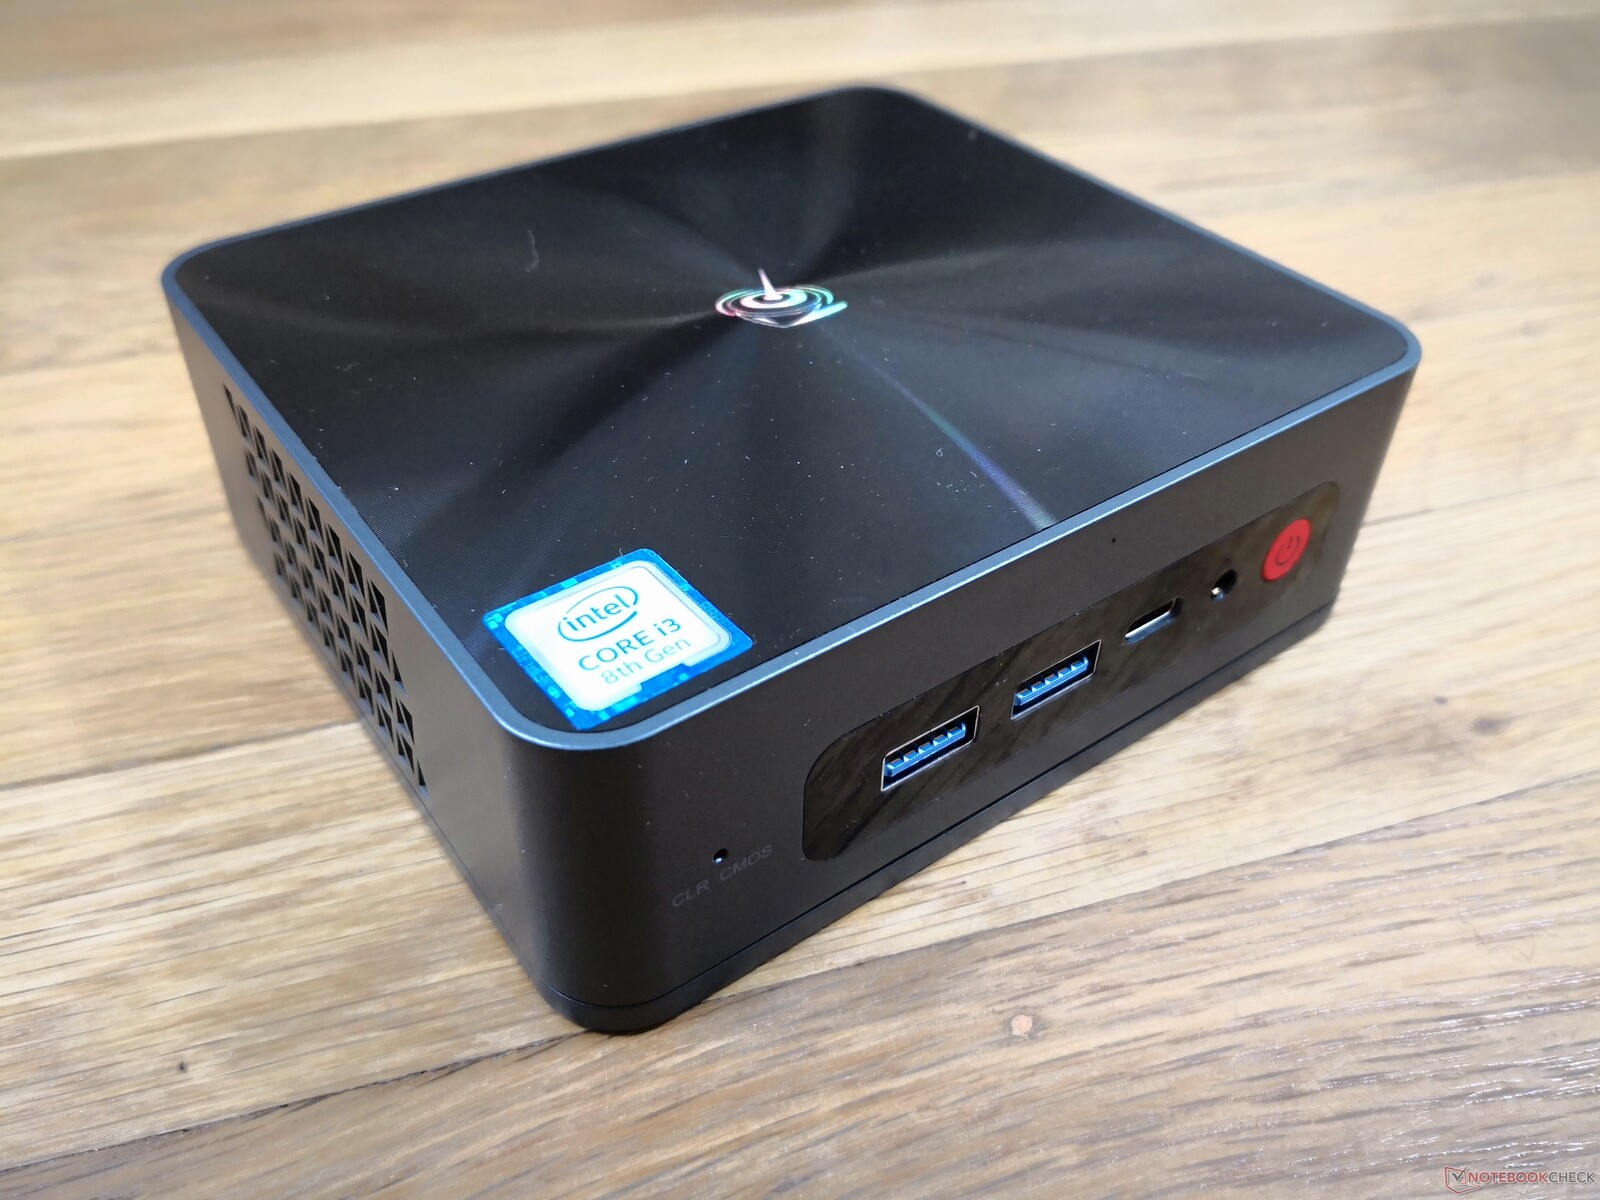
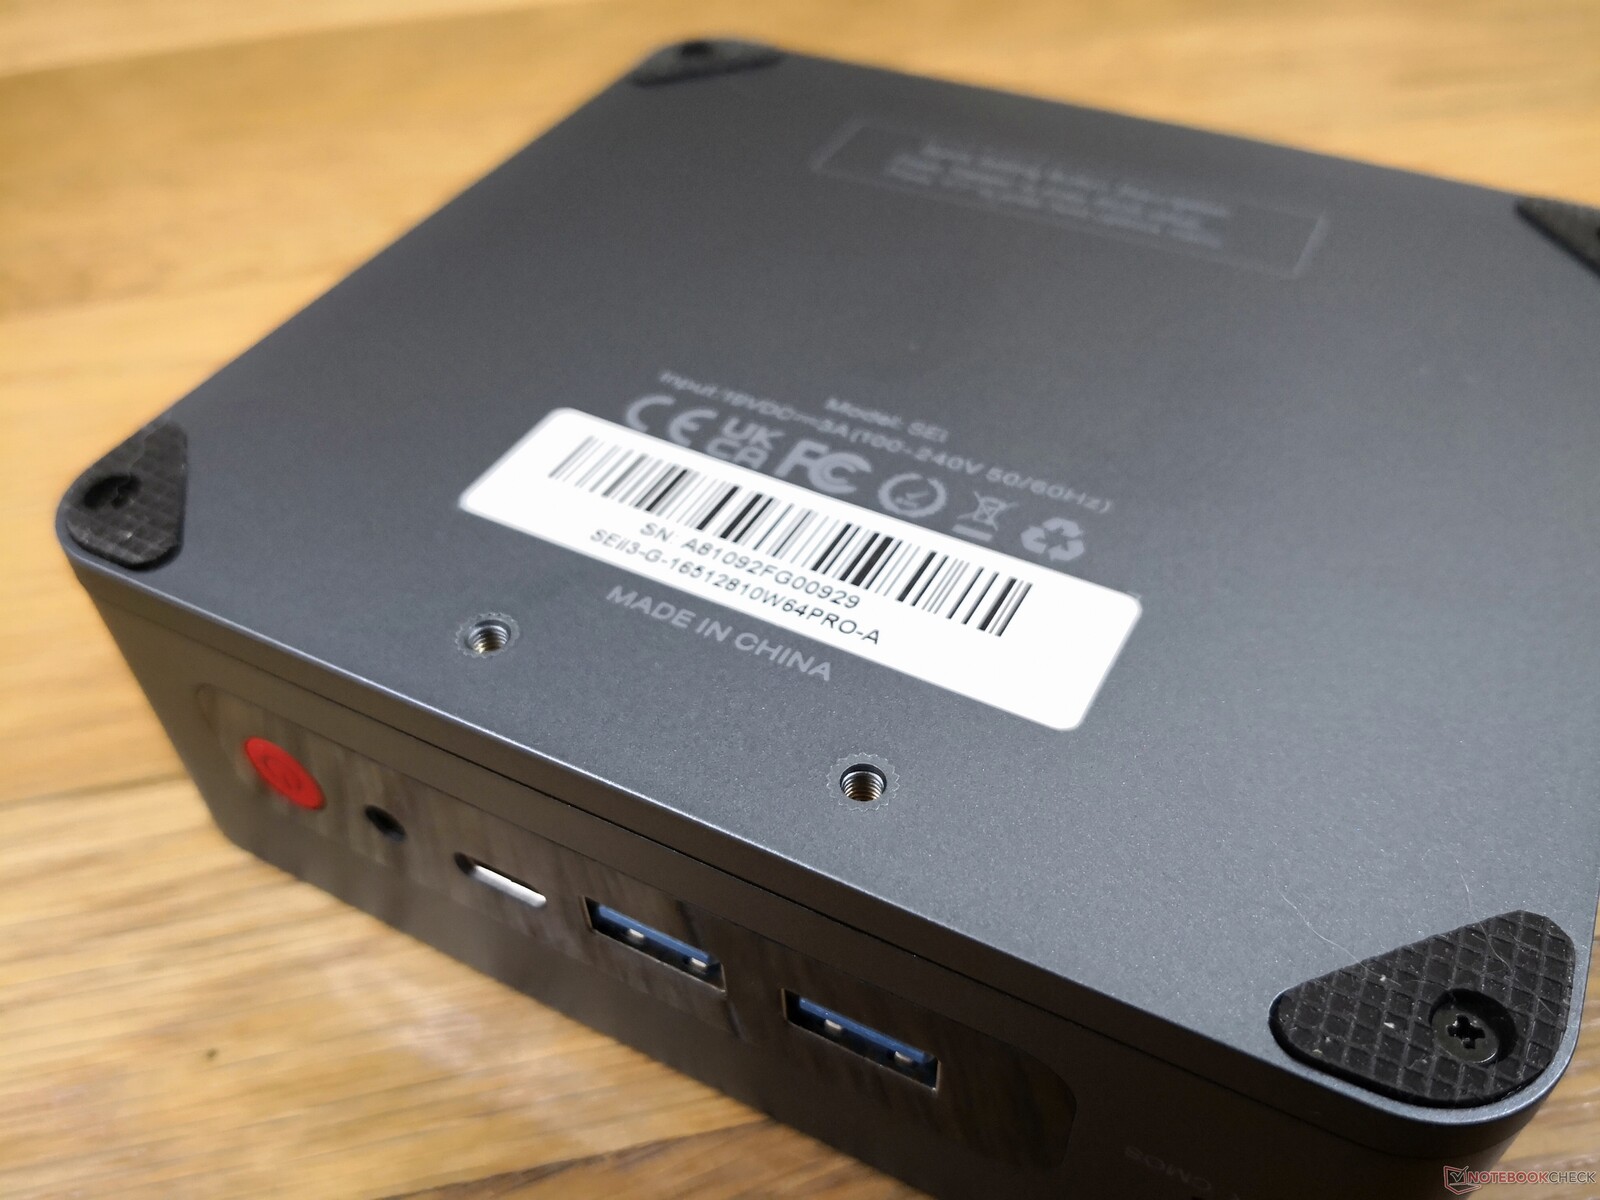
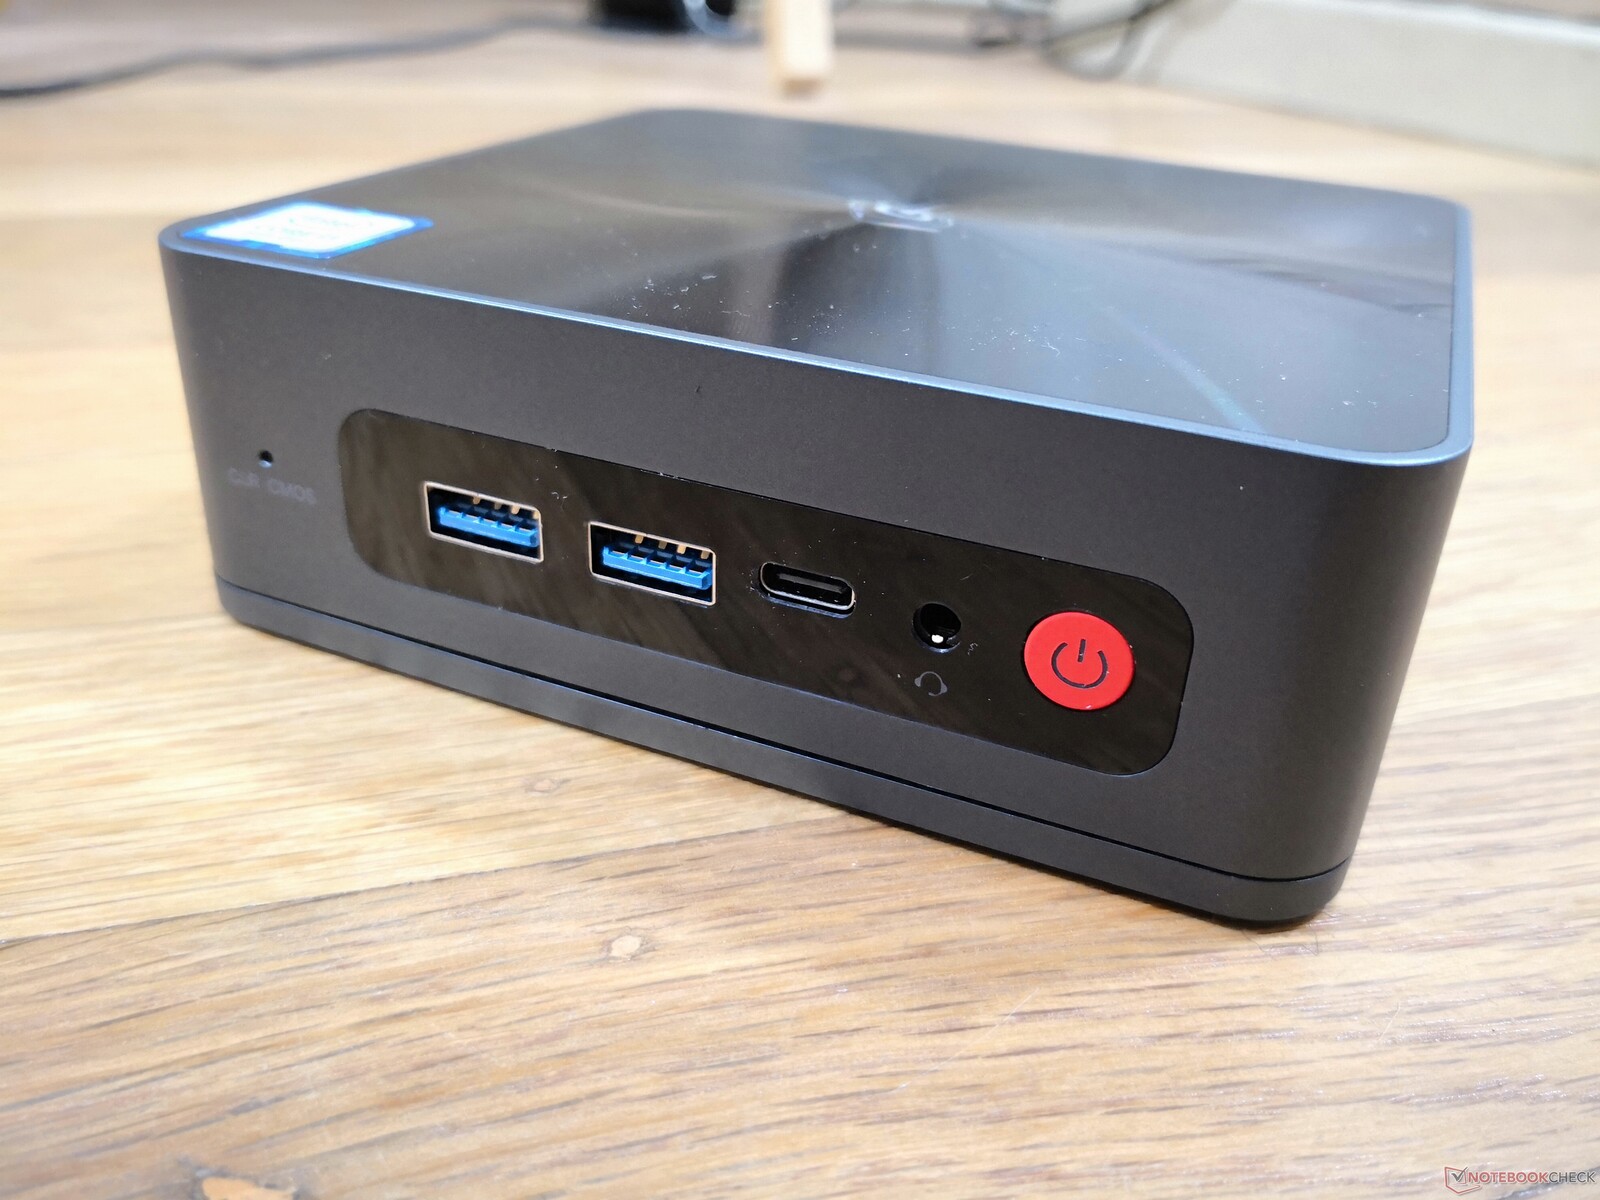
Connettività
Le opzioni delle porte sono identiche al SEi10, tranne che Thunderbolt non è supportato e che non c'è più un lettore di schede SD integrato. Possiamo confermare che la porta USB-C supporta ancora DisplayPort, ma non può essere utilizzata per alimentare il mini PC a differenza del SER4.

Comunicazione
Moduli di comunicazione wired e wireless incorporati, confrontare i dati dei test di rete con quelli della concorrenza, soluzioni alternative disponibili (5G/LTE), irregolarità (ricezione radio)?
| Networking | |
| iperf3 transmit AX12 | |
| Intel NUC11TNKi5 | |
| Beelink SER4 | |
| Beelink SEi10 | |
| Intel NUC8i7BE | |
| GMK NucBox 2 | |
| Beelink SEi8 | |
| iperf3 receive AX12 | |
| Intel NUC11TNKi5 | |
| Beelink SEi10 | |
| Beelink SER4 | |
| GMK NucBox 2 | |
| Intel NUC8i7BE | |
| Beelink SEi8 | |
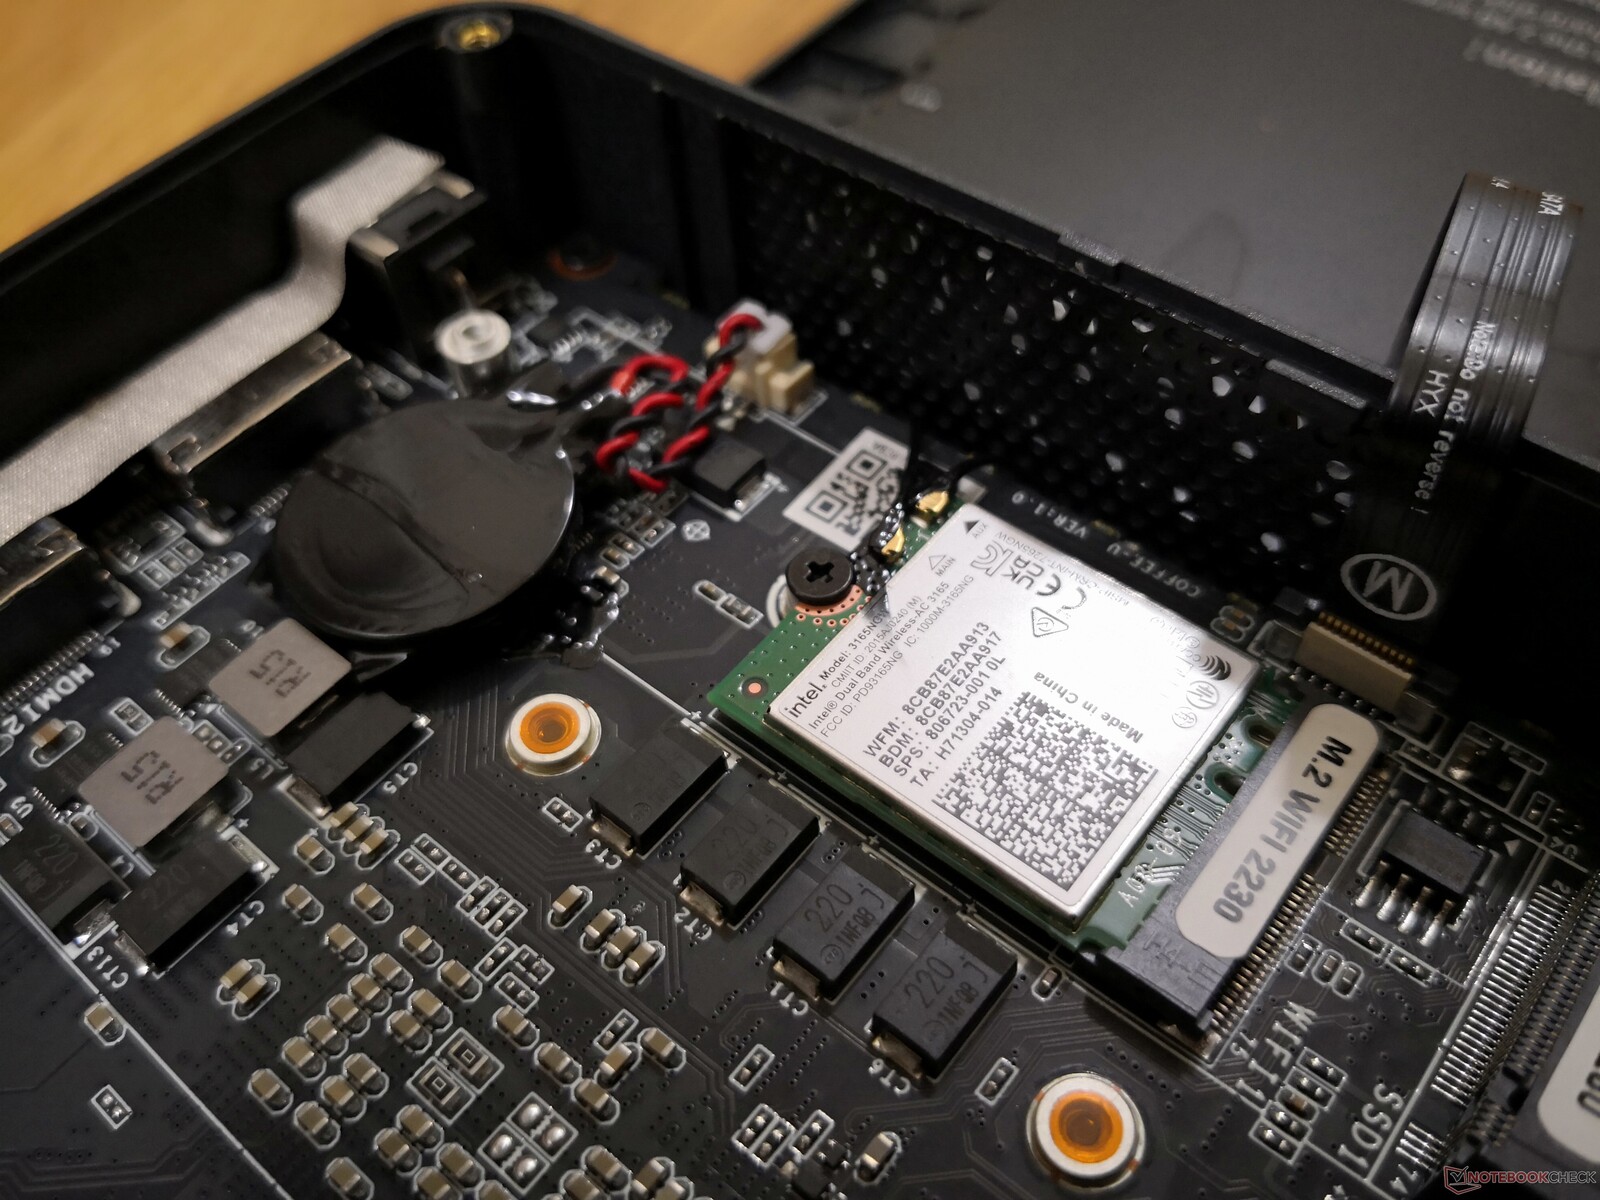
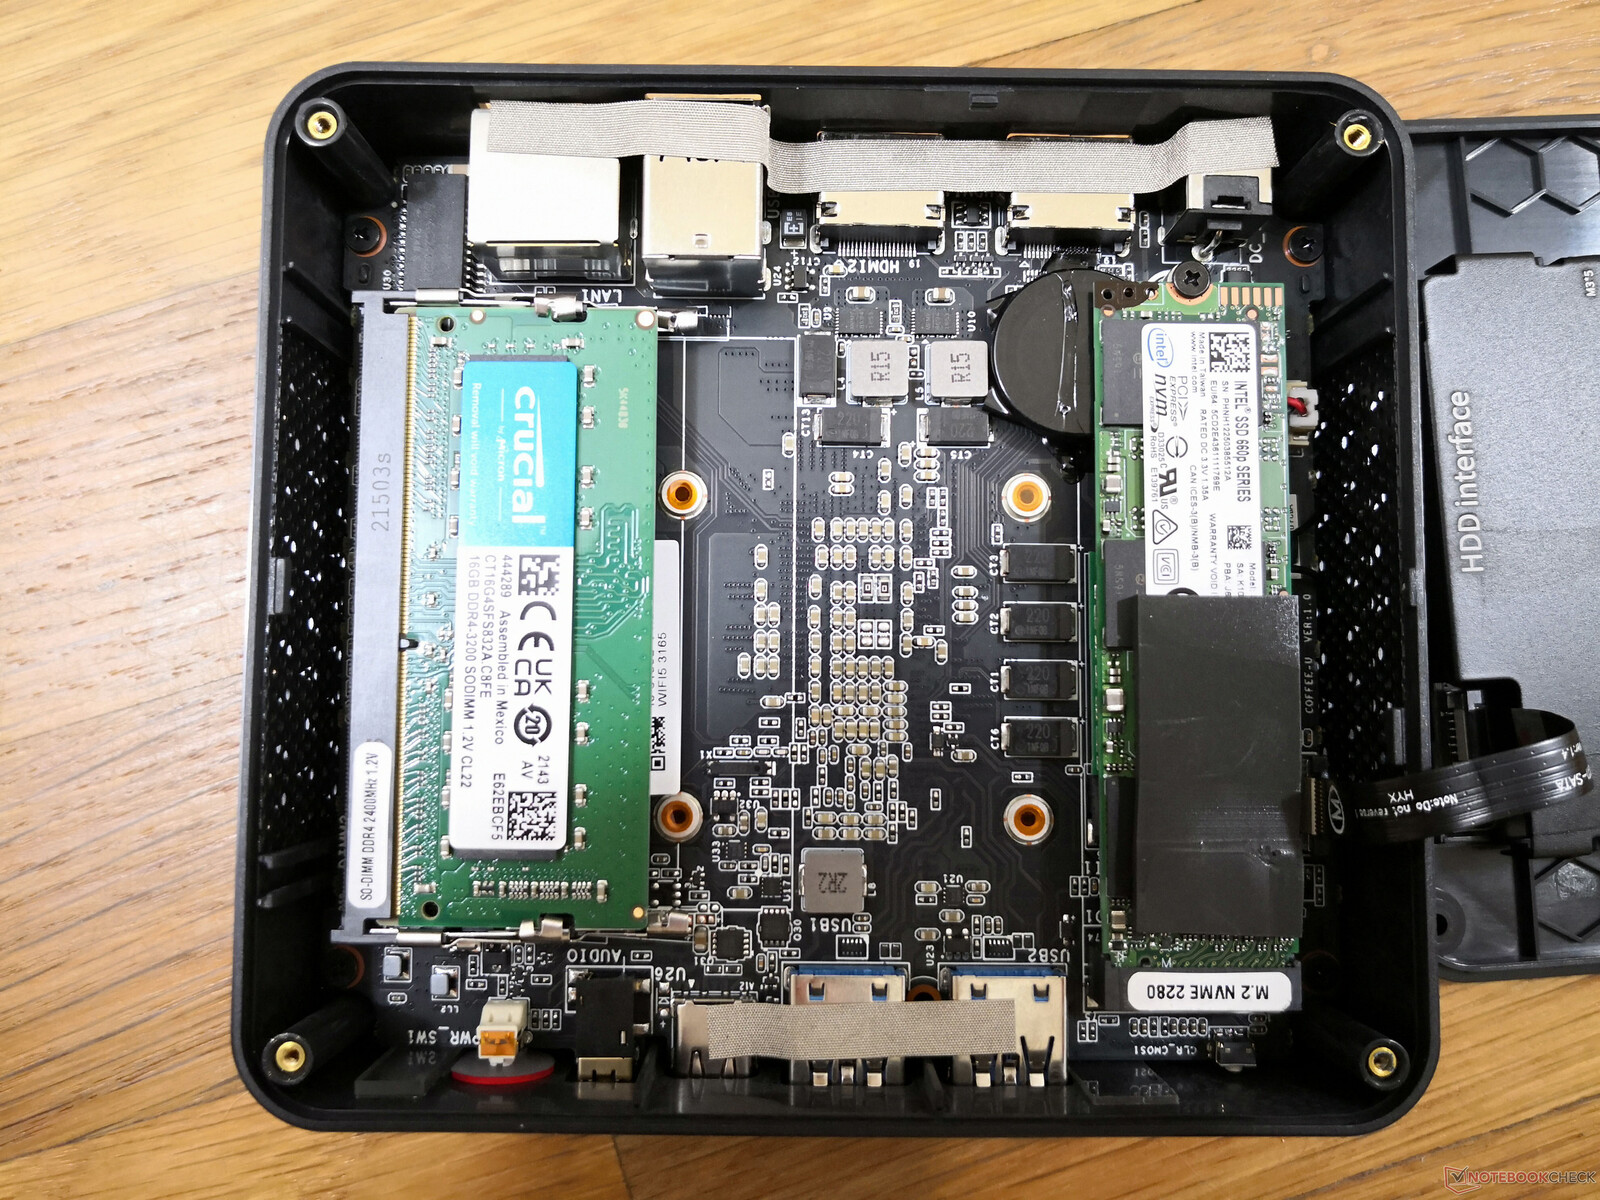
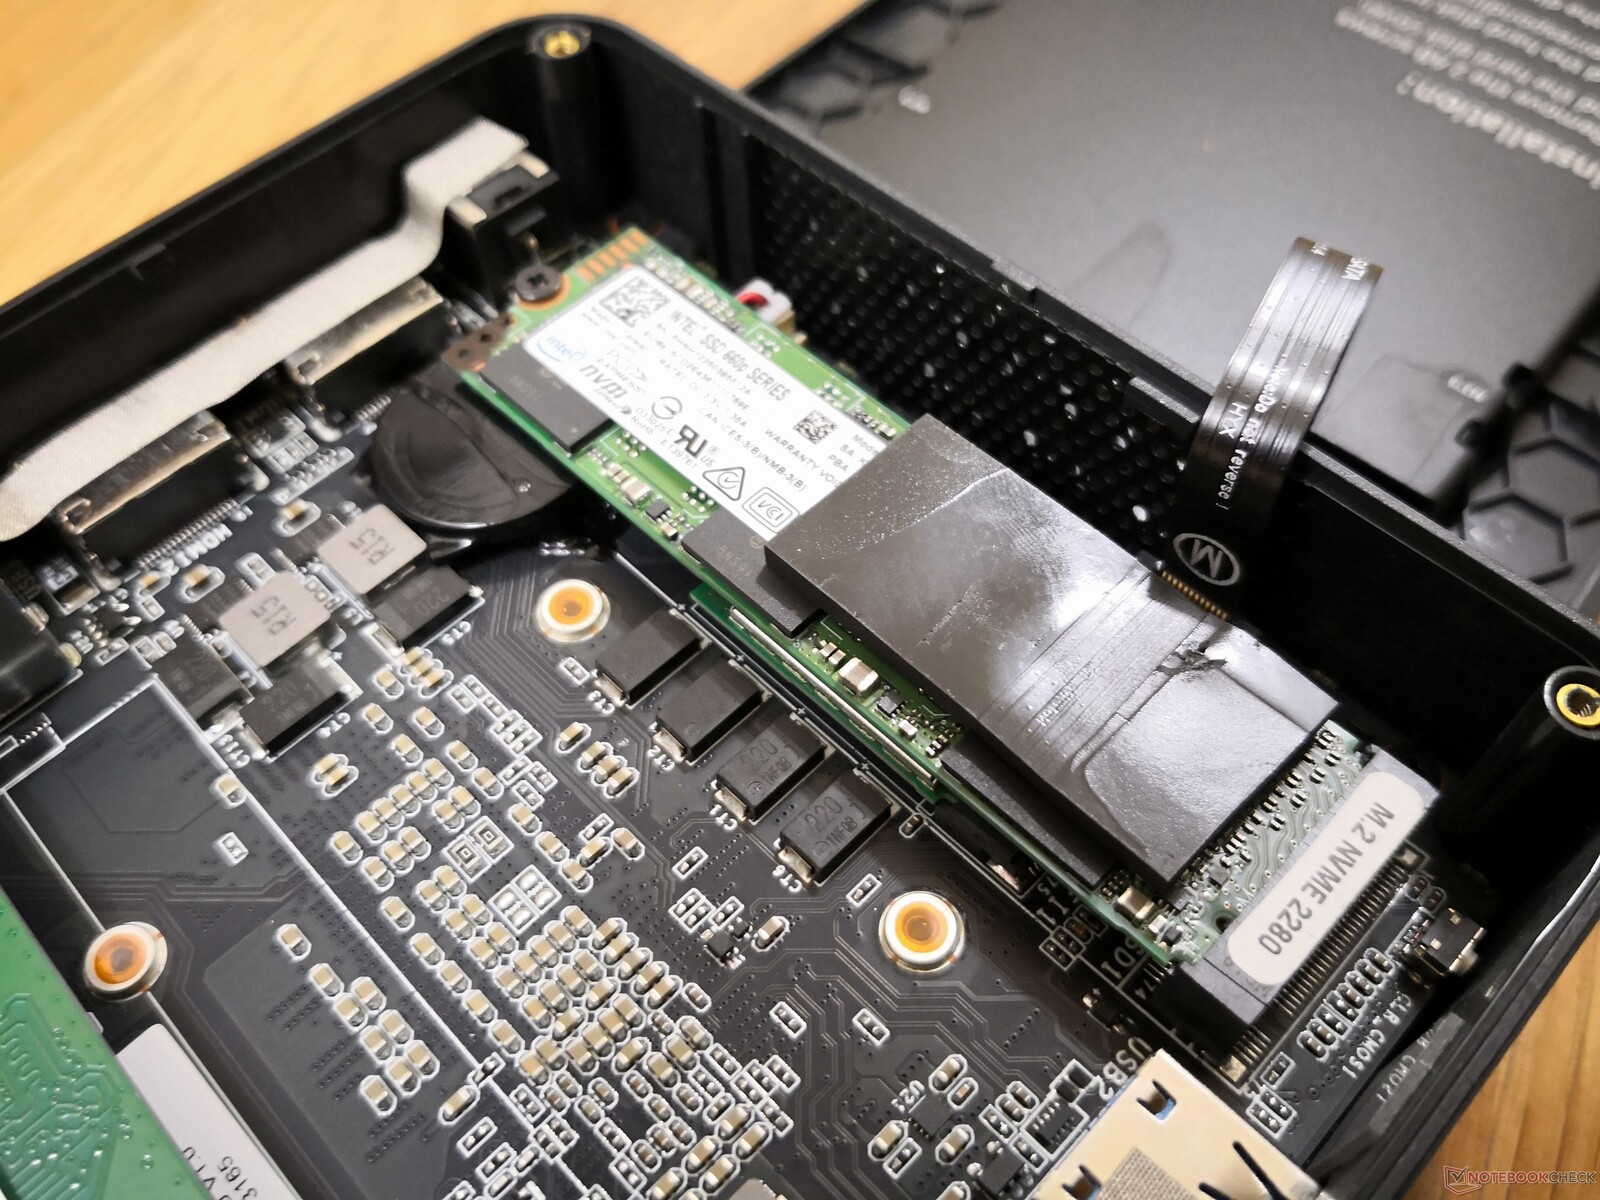
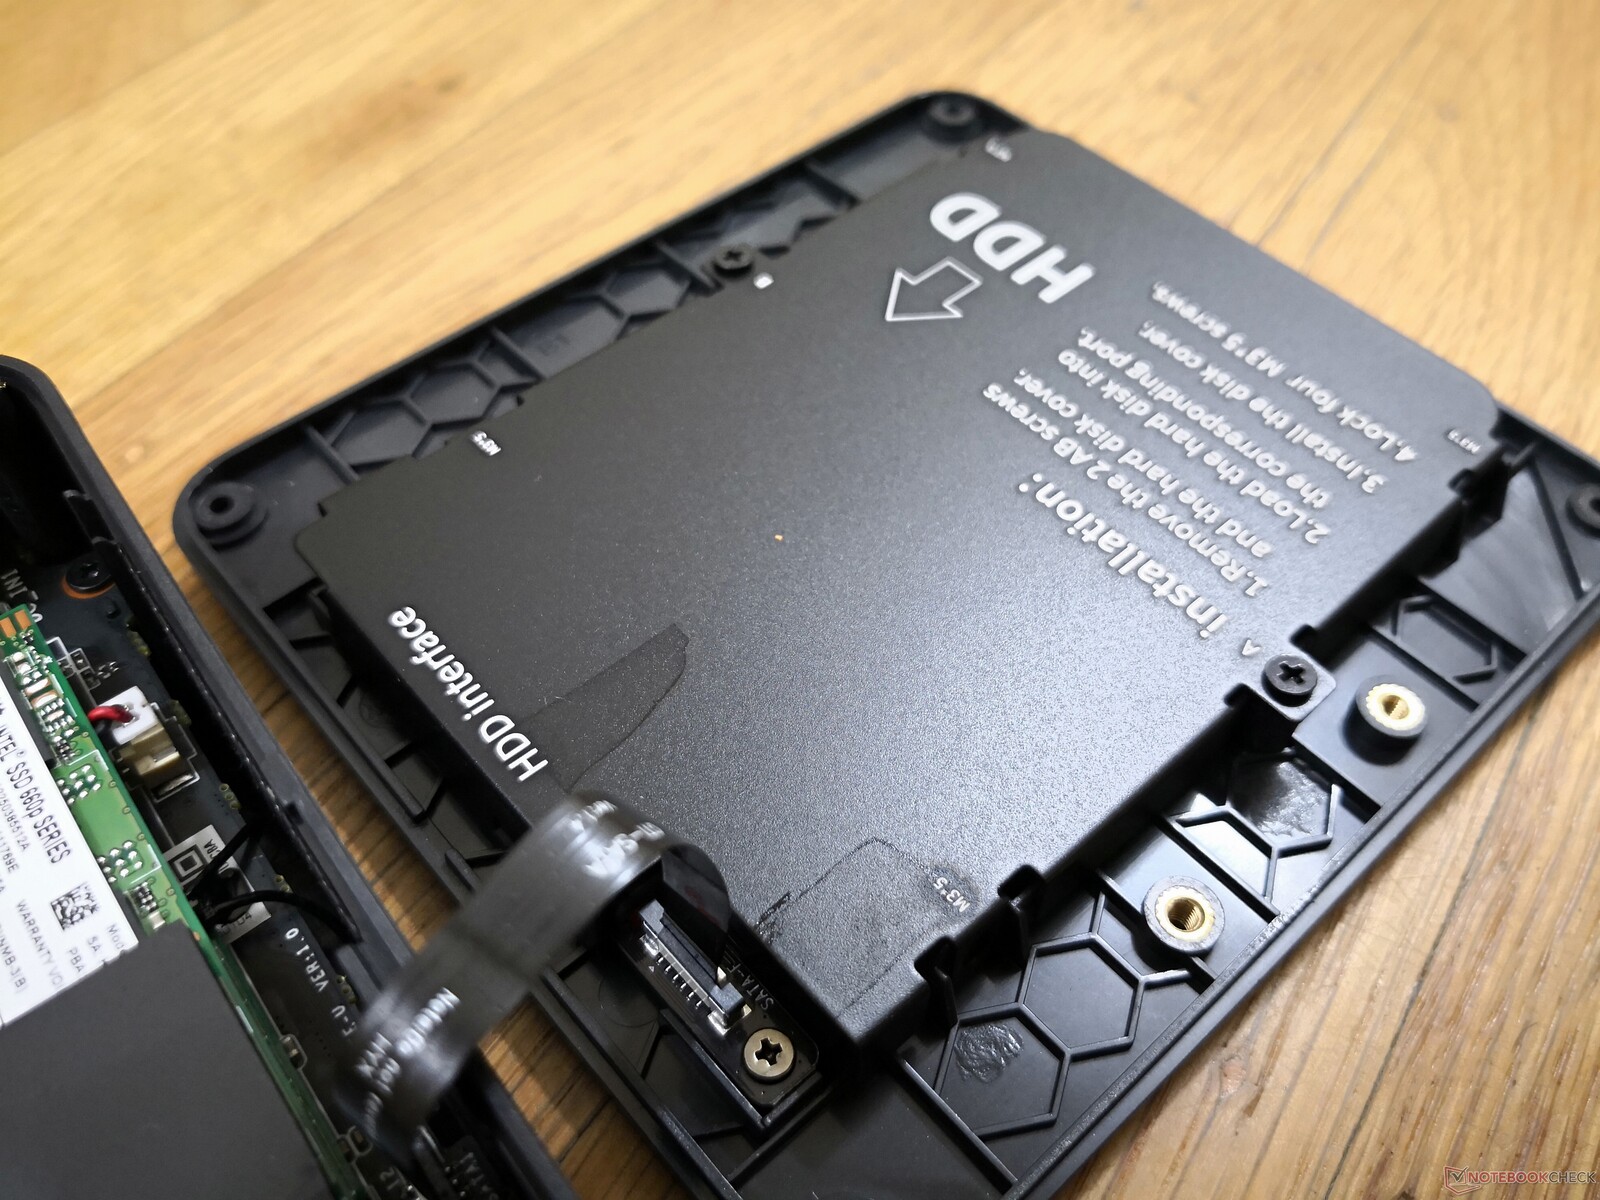
Manutenzione
La scheda madre del SEi8 è leggermente diversa da quella del SEi10. Lo slot SSD M.2, per esempio, è ora rivolto nella direzione opposta mentre la batteria del BIOS è ora più facilmente accessibile.
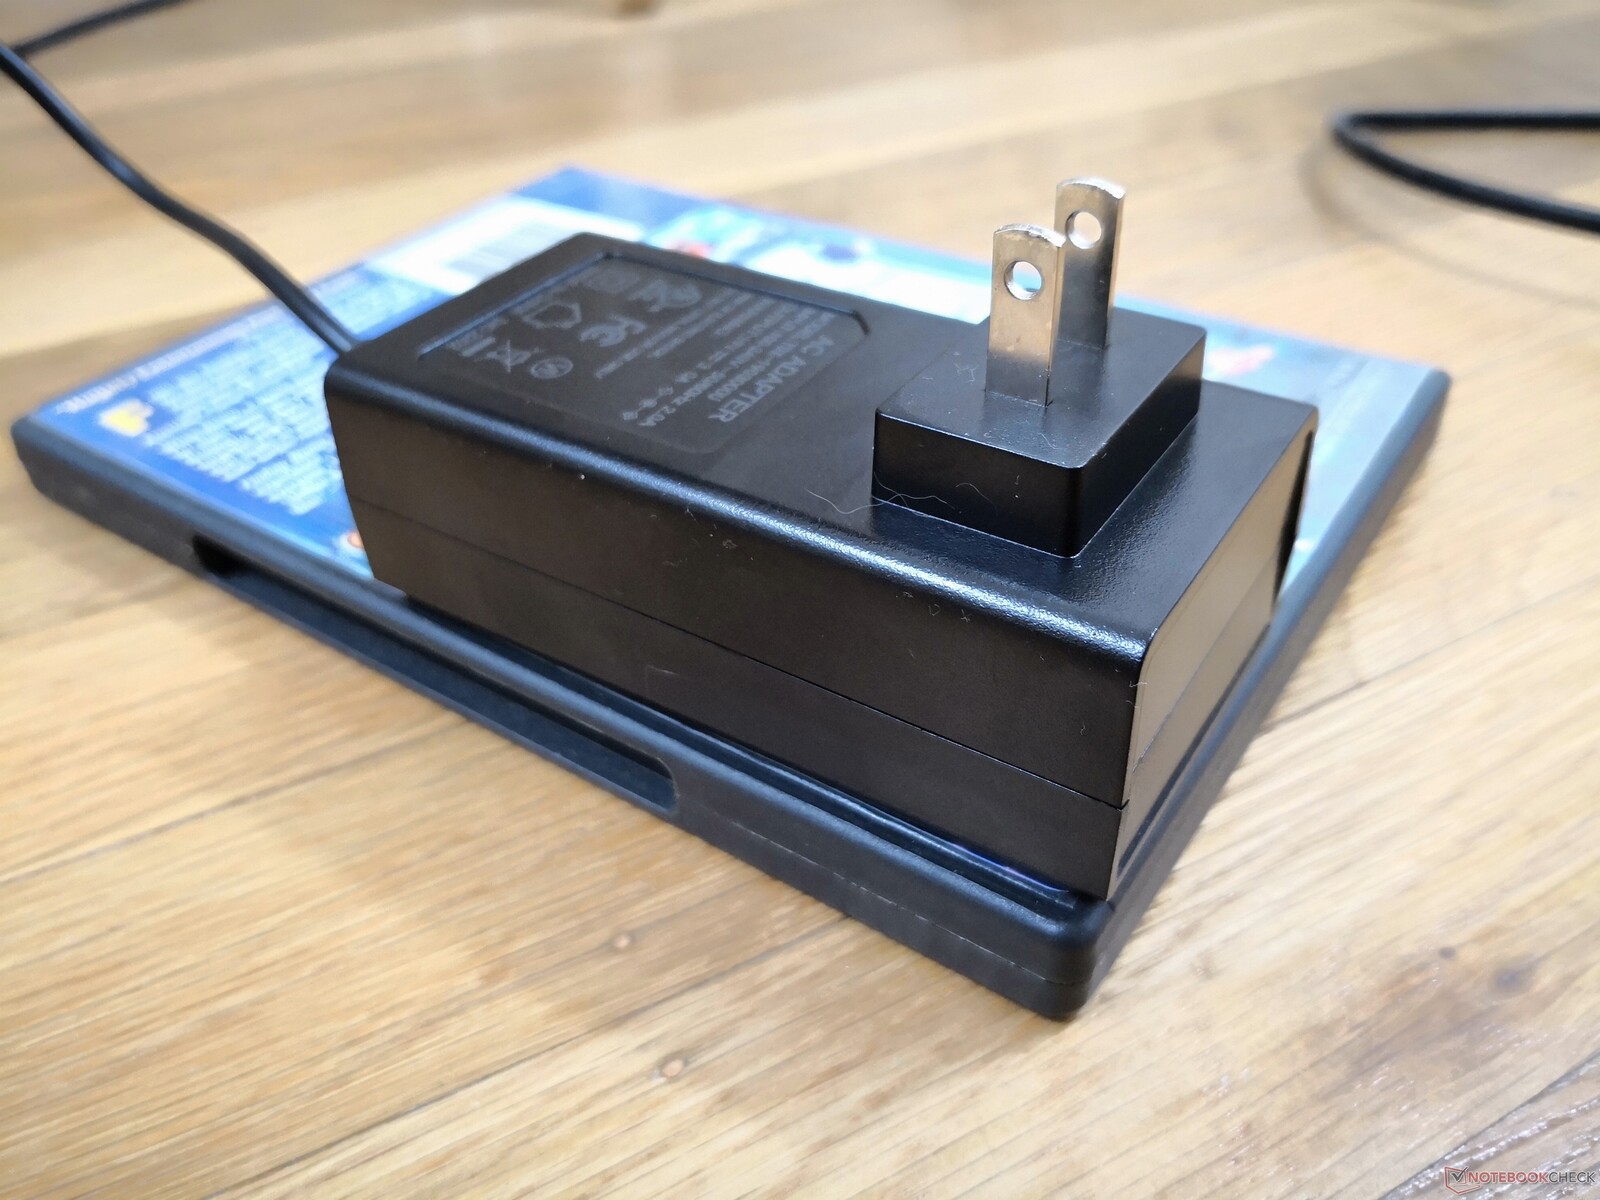
Accessori e garanzia
La scatola di vendita include viti aggiuntive, un manuale e un supporto VESA rimovibile. Richiedere la garanzia può essere difficile in quanto può comportare la spedizione all'estero. Viene fornita solo una garanzia di base di un anno, a differenza dei tre anni della maggior parte dei NUC di Intel.
Performance
Condizioni di test
La nostra unità è stata impostata in modalità Windows Performance prima di eseguire qualsiasi benchmark qui sotto.
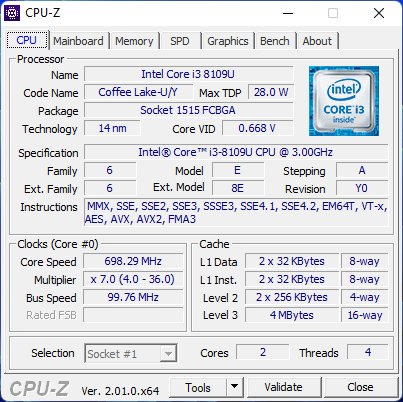
Processore
Le prestazioni grezze della CPU si collocano tra le serie Celeron e Atom e la serie superiore Core i5 U. Forse la cosa più notevole è che è notevolmente più veloce del concorrente Ryzen 3 3200U e del raffreddato passivamente Core i3-10100Y che si trovano sul Microsoft Surface Go 3. Il processore del Surface Go 3 è stato molto criticato per le sue prestazioni lente come la melassa rispetto al Surface Pro
Beelink offre il SEi8 con Core i5-8279U come aggiornamento che fornirebbe circa il 20% di prestazioni più veloci in single-thread e oltre il doppio delle prestazioni multi-thread rispetto al nostro Core i3-8109U.
Cinebench R15 Multi Loop
Cinebench R23: Multi Core | Single Core
Cinebench R15: CPU Multi 64Bit | CPU Single 64Bit
Blender: v2.79 BMW27 CPU
7-Zip 18.03: 7z b 4 | 7z b 4 -mmt1
Geekbench 5.5: Multi-Core | Single-Core
HWBOT x265 Benchmark v2.2: 4k Preset
LibreOffice : 20 Documents To PDF
R Benchmark 2.5: Overall mean
| Cinebench R23 / Multi Core | |
| Beelink SER4 | |
| Intel NUC11TNKi5 | |
| GMK NucBox 2 | |
| Beelink U59 | |
| Beelink SEi8 | |
| Media Intel Core i3-8109U (n=1) | |
| HP 255 G7 159P1EA | |
| Microsoft Surface Go 3 Core i3 | |
| GMK NucBox 3 | |
| Teclast Tbook 16 Power | |
| Cinebench R23 / Single Core | |
| Intel NUC11TNKi5 | |
| Beelink SER4 | |
| GMK NucBox 2 | |
| Beelink SEi8 | |
| Media Intel Core i3-8109U (n=1) | |
| Microsoft Surface Go 3 Core i3 | |
| HP 255 G7 159P1EA | |
| Beelink U59 | |
| GMK NucBox 3 | |
| Teclast Tbook 16 Power | |
| Geekbench 5.5 / Multi-Core | |
| Beelink SER4 | |
| Intel NUC11TNKi5 | |
| Intel NUC8i7BE | |
| GMK NucBox 2 | |
| Acer Swift 3 SF314-42-R27B | |
| Beelink SEi10 | |
| Microsoft Surface Go 3 Core i3 | |
| Beelink SEi8 | |
| Media Intel Core i3-8109U (n=1) | |
| HP 255 G7 159P1EA | |
| GMK NucBox 3 | |
| Teclast Tbook 16 Power | |
| Geekbench 5.5 / Single-Core | |
| Intel NUC11TNKi5 | |
| Beelink SER4 | |
| Beelink SEi10 | |
| Acer Swift 3 SF314-42-R27B | |
| Microsoft Surface Go 3 Core i3 | |
| GMK NucBox 2 | |
| Beelink SEi8 | |
| Media Intel Core i3-8109U (n=1) | |
| HP 255 G7 159P1EA | |
| Intel NUC8i7BE | |
| GMK NucBox 3 | |
| Teclast Tbook 16 Power | |
| LibreOffice / 20 Documents To PDF | |
| Teclast Tbook 16 Power | |
| GMK NucBox 3 | |
| Microsoft Surface Go 3 Core i3 | |
| Beelink U59 | |
| HP 255 G7 159P1EA | |
| Beelink SEi8 | |
| Media Intel Core i3-8109U (n=1) | |
| GMK NucBox 2 | |
| Beelink SER4 | |
| Acer Swift 3 SF314-42-R27B | |
| Beelink SEi10 | |
| Intel NUC11TNKi5 | |
| R Benchmark 2.5 / Overall mean | |
| Teclast Tbook 16 Power | |
| GMK NucBox 3 | |
| Beelink U59 | |
| Microsoft Surface Go 3 Core i3 | |
| Beelink SEi8 | |
| Media Intel Core i3-8109U (n=1) | |
| HP 255 G7 159P1EA | |
| GMK NucBox 2 | |
| Beelink SEi10 | |
| Acer Swift 3 SF314-42-R27B | |
| Intel NUC8i7BE | |
| Intel NUC11TNKi5 | |
| Beelink SER4 | |
Cinebench R23: Multi Core | Single Core
Cinebench R15: CPU Multi 64Bit | CPU Single 64Bit
Blender: v2.79 BMW27 CPU
7-Zip 18.03: 7z b 4 | 7z b 4 -mmt1
Geekbench 5.5: Multi-Core | Single-Core
HWBOT x265 Benchmark v2.2: 4k Preset
LibreOffice : 20 Documents To PDF
R Benchmark 2.5: Overall mean
* ... Meglio usare valori piccoli
AIDA64: FP32 Ray-Trace | FPU Julia | CPU SHA3 | CPU Queen | FPU SinJulia | FPU Mandel | CPU AES | CPU ZLib | FP64 Ray-Trace | CPU PhotoWorxx
| Performance rating | |
| Beelink SER4 | |
| Intel NUC11TNKi5 | |
| Intel NUC8i7BE -1! | |
| GMK NucBox 2 | |
| Beelink SEi8 | |
| AIDA64 / FP32 Ray-Trace | |
| Beelink SER4 | |
| Intel NUC11TNKi5 | |
| Intel NUC8i7BE | |
| GMK NucBox 2 | |
| Beelink SEi8 | |
| AIDA64 / FPU Julia | |
| Beelink SER4 | |
| Intel NUC11TNKi5 | |
| Intel NUC8i7BE | |
| GMK NucBox 2 | |
| Beelink SEi8 | |
| AIDA64 / CPU SHA3 | |
| Intel NUC11TNKi5 | |
| Beelink SER4 | |
| GMK NucBox 2 | |
| Beelink SEi8 | |
| AIDA64 / CPU Queen | |
| Beelink SER4 | |
| Intel NUC8i7BE | |
| Intel NUC11TNKi5 | |
| GMK NucBox 2 | |
| Beelink SEi8 | |
| AIDA64 / FPU SinJulia | |
| Beelink SER4 | |
| Intel NUC8i7BE | |
| Intel NUC11TNKi5 | |
| GMK NucBox 2 | |
| Beelink SEi8 | |
| AIDA64 / FPU Mandel | |
| Beelink SER4 | |
| Intel NUC11TNKi5 | |
| Intel NUC8i7BE | |
| GMK NucBox 2 | |
| Beelink SEi8 | |
| AIDA64 / CPU AES | |
| Intel NUC11TNKi5 | |
| Beelink SER4 | |
| Intel NUC8i7BE | |
| GMK NucBox 2 | |
| Beelink SEi8 | |
| AIDA64 / CPU ZLib | |
| Beelink SER4 | |
| Intel NUC11TNKi5 | |
| Intel NUC8i7BE | |
| GMK NucBox 2 | |
| Beelink SEi8 | |
| AIDA64 / FP64 Ray-Trace | |
| Beelink SER4 | |
| Intel NUC11TNKi5 | |
| Intel NUC8i7BE | |
| GMK NucBox 2 | |
| Beelink SEi8 | |
| AIDA64 / CPU PhotoWorxx | |
| Beelink SER4 | |
| Intel NUC8i7BE | |
| Intel NUC11TNKi5 | |
| Beelink SEi8 | |
| GMK NucBox 2 | |
Prestazioni del sistema
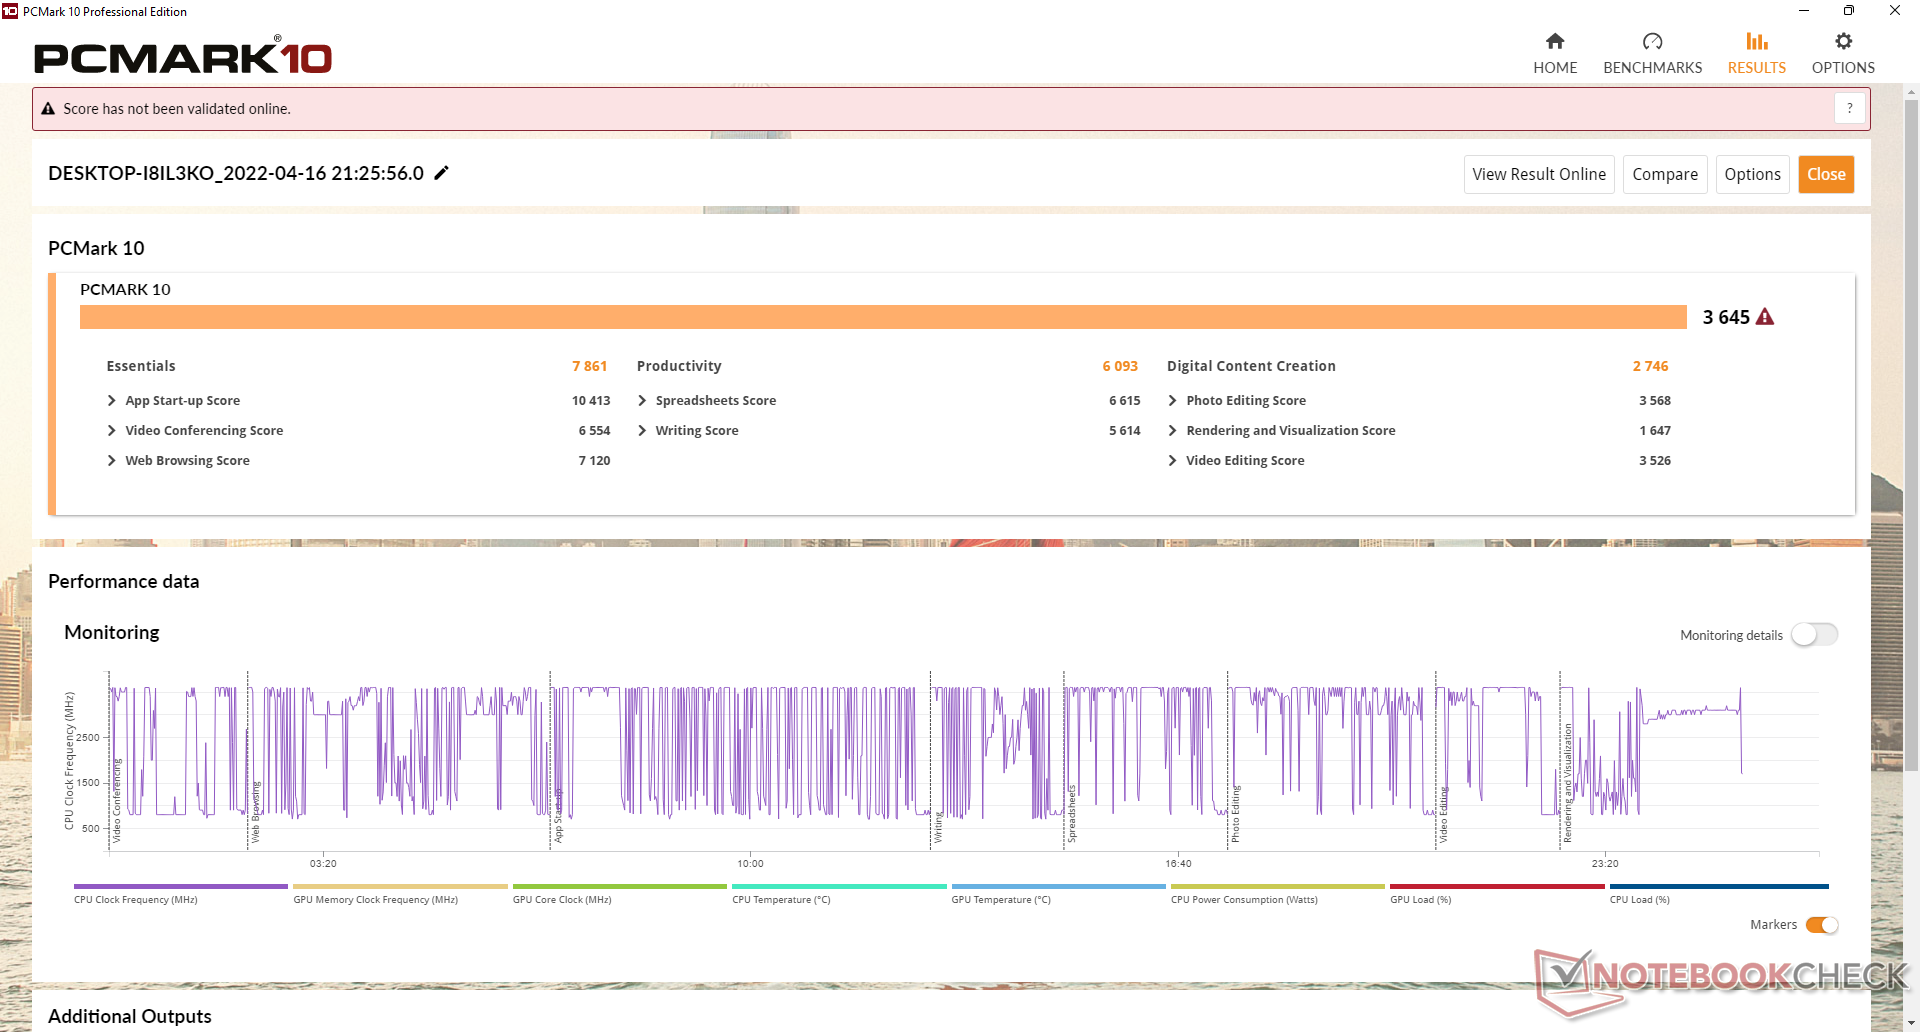
I risultati di PCMark sono leggermente superiori al SEi10 probabilmente a causa della più veloce grafica Iris integrata del nostro SEi8. Non abbiamo riscontrato alcun problema nell'esecuzione di Windows 11 Pro sulla nostra unità di test, a parte un rallentamento occasionale quando si lanciano le applicazioni o durante un multitasking moderato.
| PCMark 10 / Score | |
| Beelink SER4 | |
| Intel NUC8i7BE | |
| Intel NUC11TNKi5 | |
| GMK NucBox 2 | |
| Beelink SEi8 | |
| Beelink SEi10 | |
| PCMark 10 / Essentials | |
| Beelink SER4 | |
| Intel NUC11TNKi5 | |
| Intel NUC8i7BE | |
| GMK NucBox 2 | |
| Beelink SEi8 | |
| Beelink SEi10 | |
| PCMark 10 / Productivity | |
| Beelink SER4 | |
| Intel NUC8i7BE | |
| GMK NucBox 2 | |
| Intel NUC11TNKi5 | |
| Beelink SEi8 | |
| Beelink SEi10 | |
| PCMark 10 / Digital Content Creation | |
| Beelink SER4 | |
| Intel NUC11TNKi5 | |
| Intel NUC8i7BE | |
| GMK NucBox 2 | |
| Beelink SEi8 | |
| Beelink SEi10 | |
| PCMark 10 Score | 3645 punti | |
Aiuto | ||
| AIDA64 / Memory Copy | |
| Intel NUC8i7BE | |
| GMK NucBox 2 | |
| Beelink SER4 | |
| Beelink SEi8 | |
| Intel NUC11TNKi5 | |
| AIDA64 / Memory Read | |
| Intel NUC8i7BE | |
| Beelink SER4 | |
| GMK NucBox 2 | |
| Beelink SEi8 | |
| Intel NUC11TNKi5 | |
| AIDA64 / Memory Write | |
| Intel NUC8i7BE | |
| GMK NucBox 2 | |
| Beelink SER4 | |
| Intel NUC11TNKi5 | |
| Beelink SEi8 | |
| AIDA64 / Memory Latency | |
| Beelink SER4 | |
| Intel NUC11TNKi5 | |
| Beelink SEi8 | |
| GMK NucBox 2 | |
| Intel NUC8i7BE | |
* ... Meglio usare valori piccoli
Latenza DPC
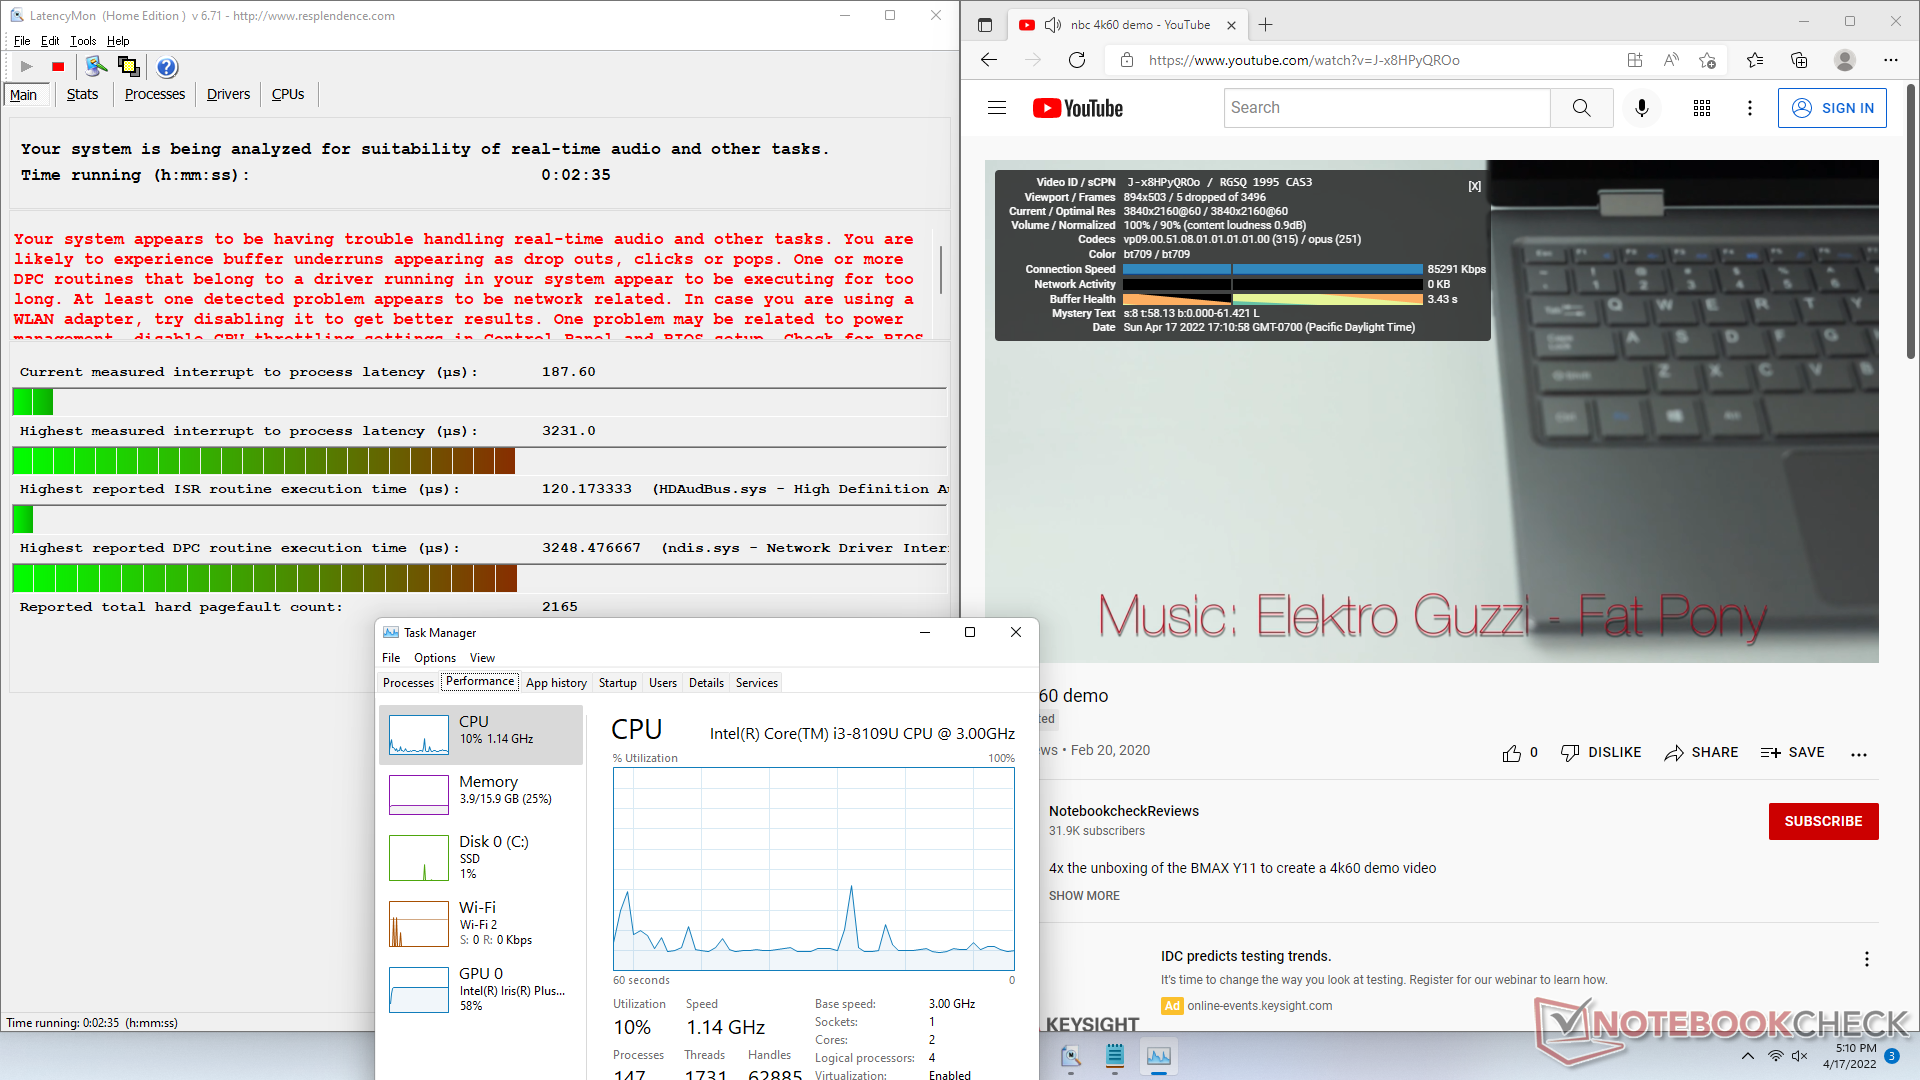
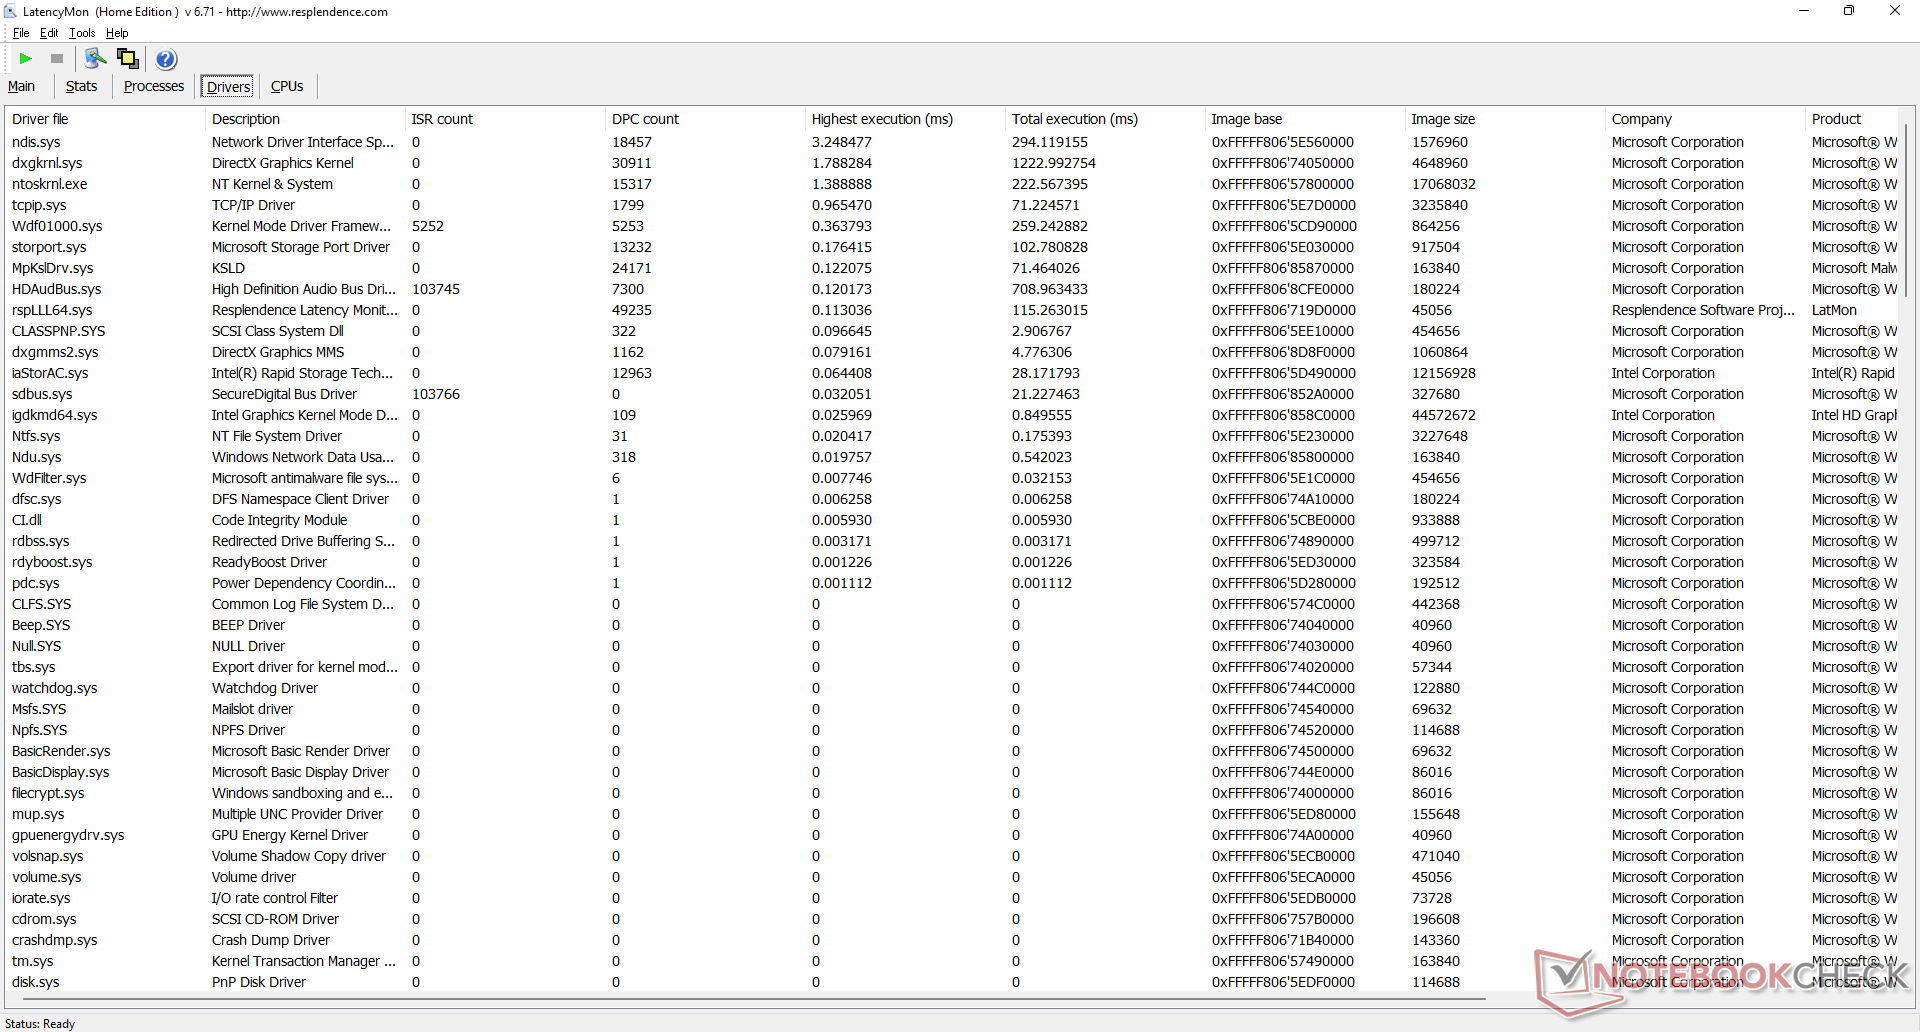
LatencyMon rivela problemi di DPC quando si aprono più schede del browser della nostra homepage. la riproduzione di video 4K è per lo più fluida con solo 5 fotogrammi persi durante il nostro test video di un minuto.
| DPC Latencies / LatencyMon - interrupt to process latency (max), Web, Youtube, Prime95 | |
| Beelink SEi8 | |
| Beelink SEi10 | |
| GMK NucBox 2 | |
| Intel NUC11TNKi5 | |
| Beelink SER4 | |
* ... Meglio usare valori piccoli
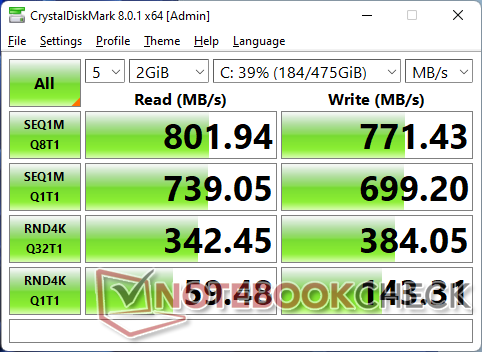
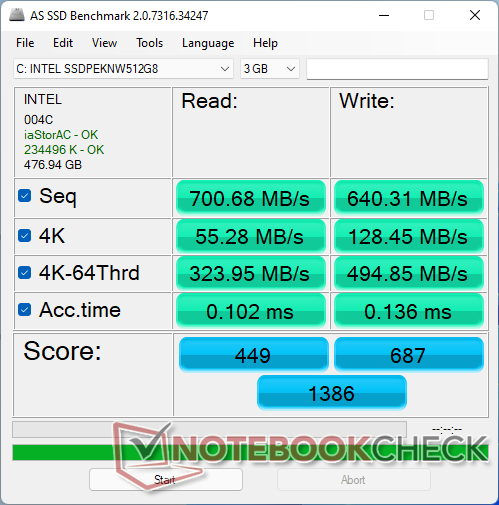
Dispositivi di archiviazione
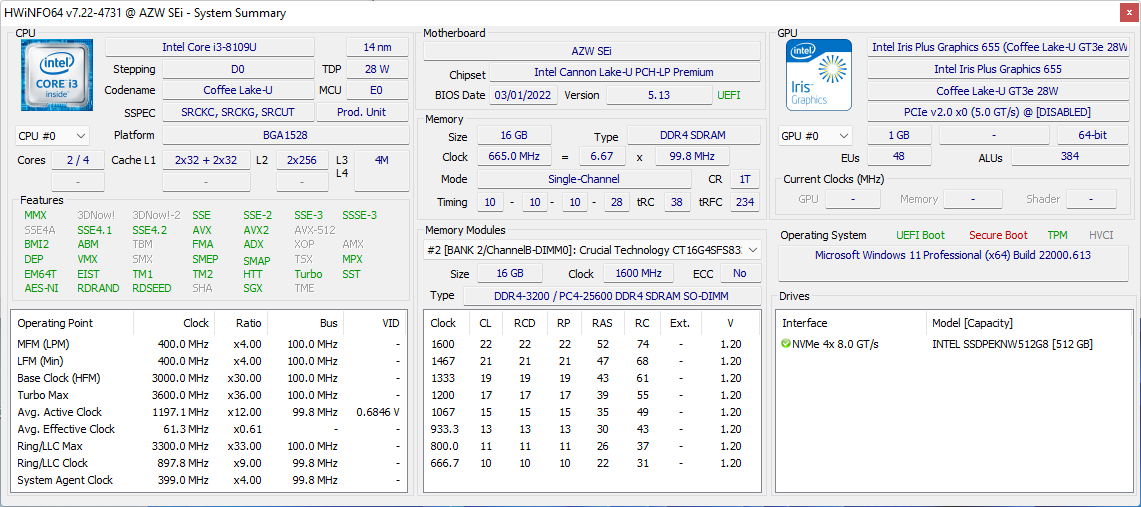
La nostra unità è configurata con un economico 512 GB Intel 660p NVMe SSD. Anche se l'unità stessa è capace di velocità di lettura e scrittura sequenziale fino a 1500 MB/s e 1000 MB/s, rispettivamente, siamo solo in grado di registrare un massimo di 800 MB/s sul nostro SEi8.

| Drive Performance rating - Percent | |
| Beelink SER4 | |
| GMK NucBox 2 | |
| Beelink SEi8 | |
| Beelink SEi10 | |
| Intel NUC11TNKi5 | |
* ... Meglio usare valori piccoli
Disk Throttling: DiskSpd Read Loop, Queue Depth 8
Prestazioni della GPU
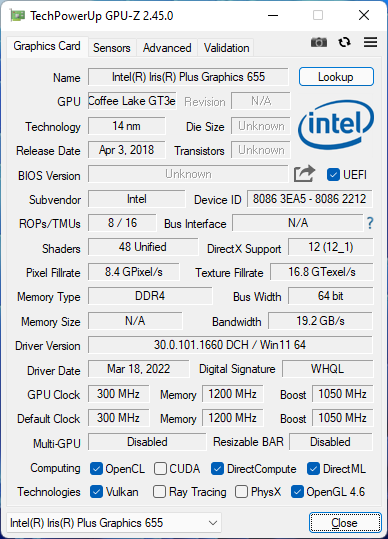
Le prestazioni grafiche grezze della Iris Plus 655 è approssimativamente dal 40 al 50 per cento più veloce della media UHD Graphics 620 che si trova su molti vecchi mini PC alimentati da Intel prima del 10° gen Ice Lake. L'aumento delle prestazioni è rispettabile per compiti come lo streaming e la riproduzione di video 4K, ma non è neanche lontanamente sufficiente per scopi di gioco Witcher 3la nostra unità di test, per esempio, avrebbe avuto problemi a lanciarsi anche dopo aver aggiornato tutti i driver di Windows e della grafica
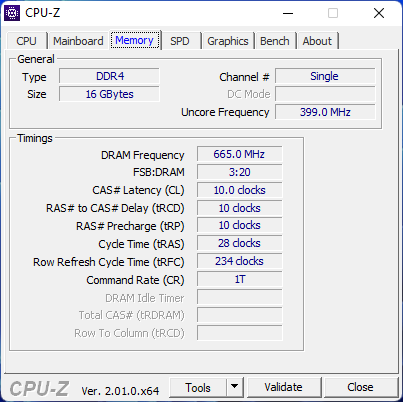
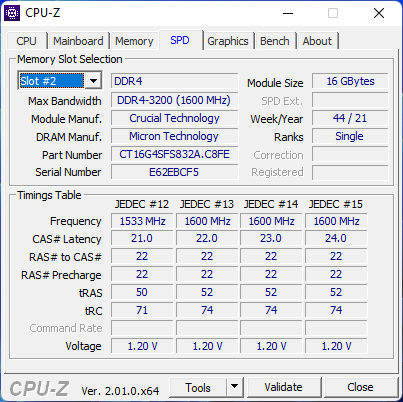
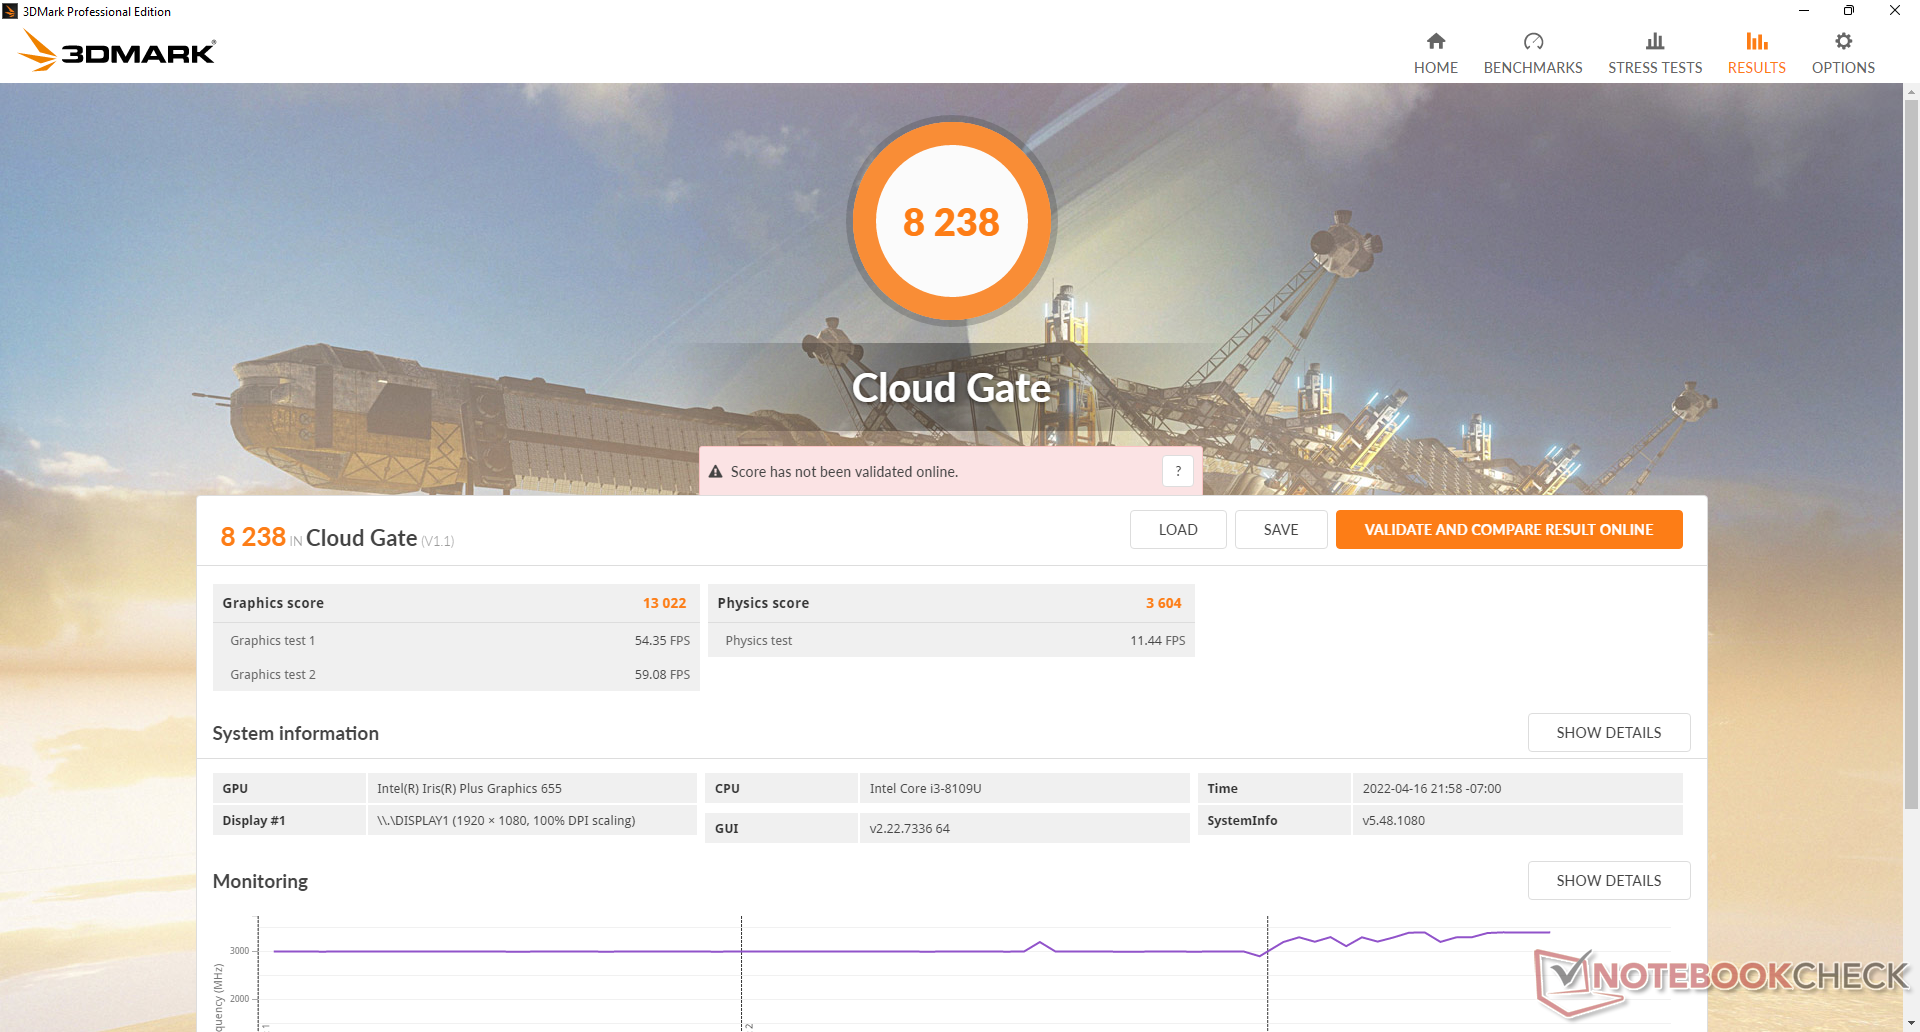
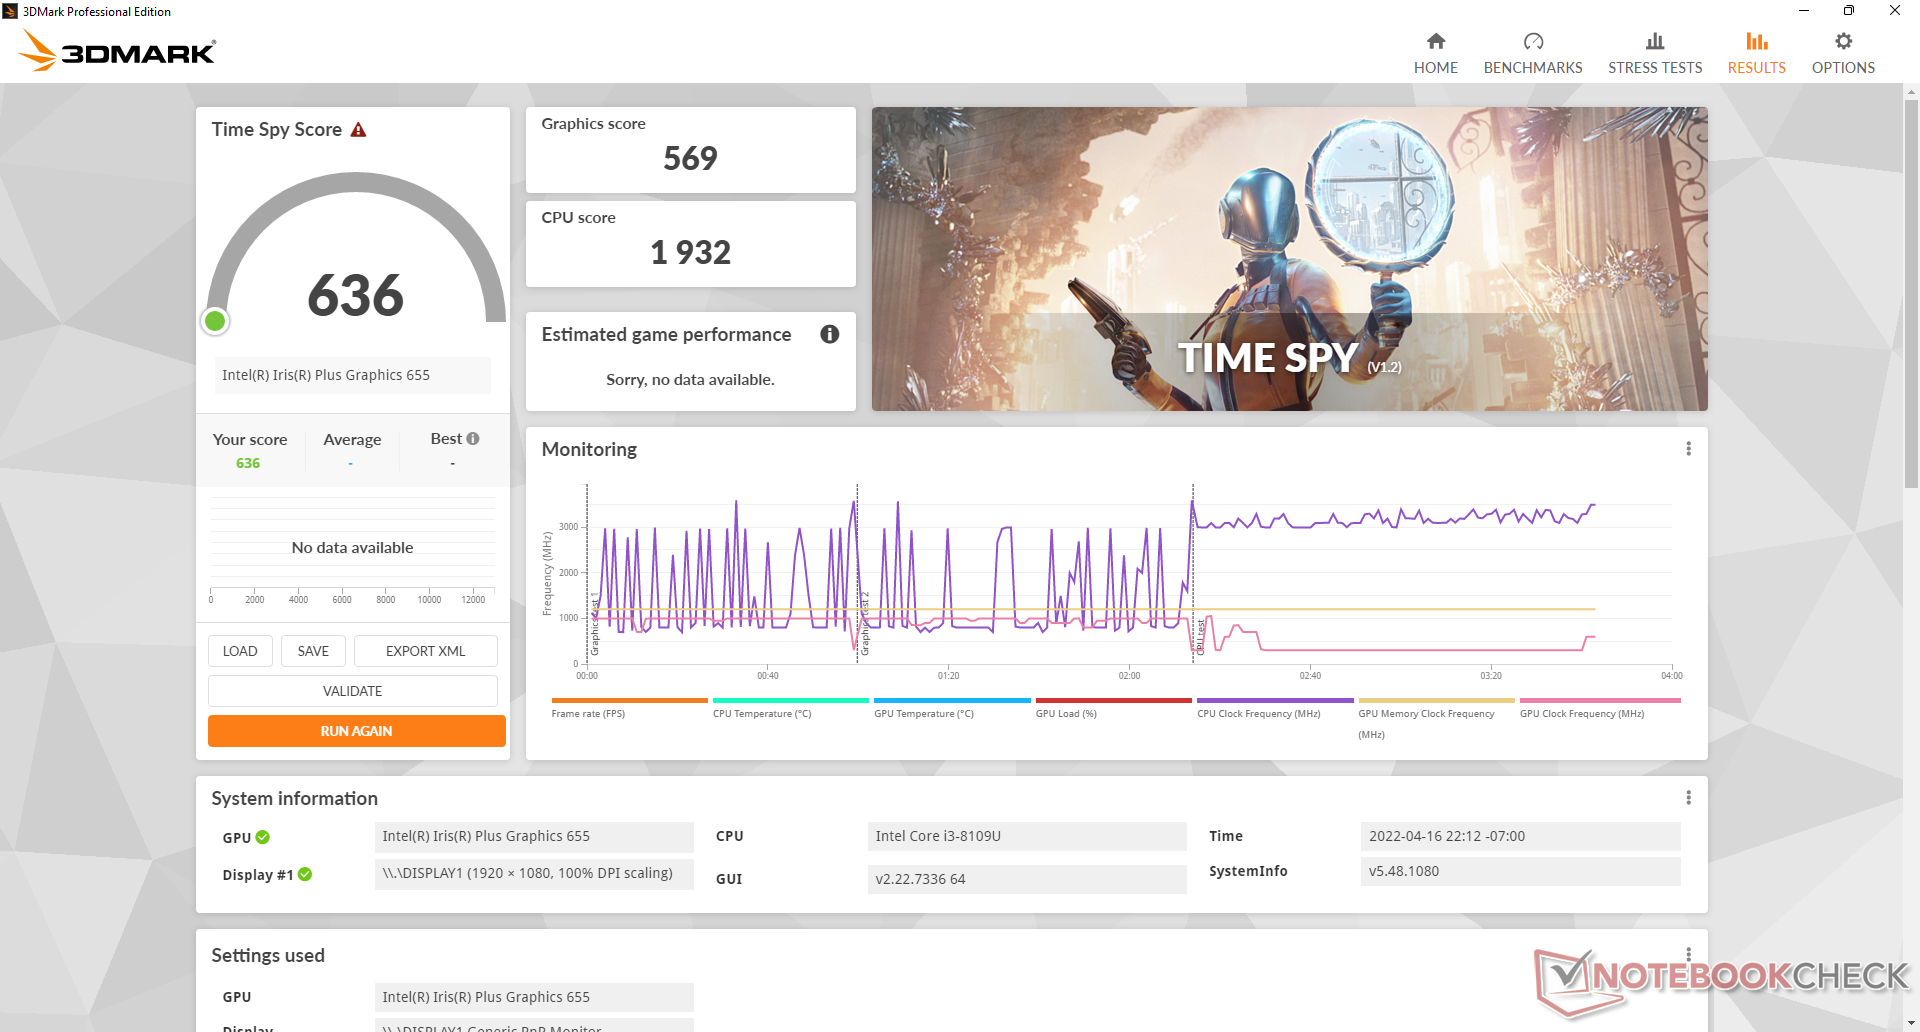
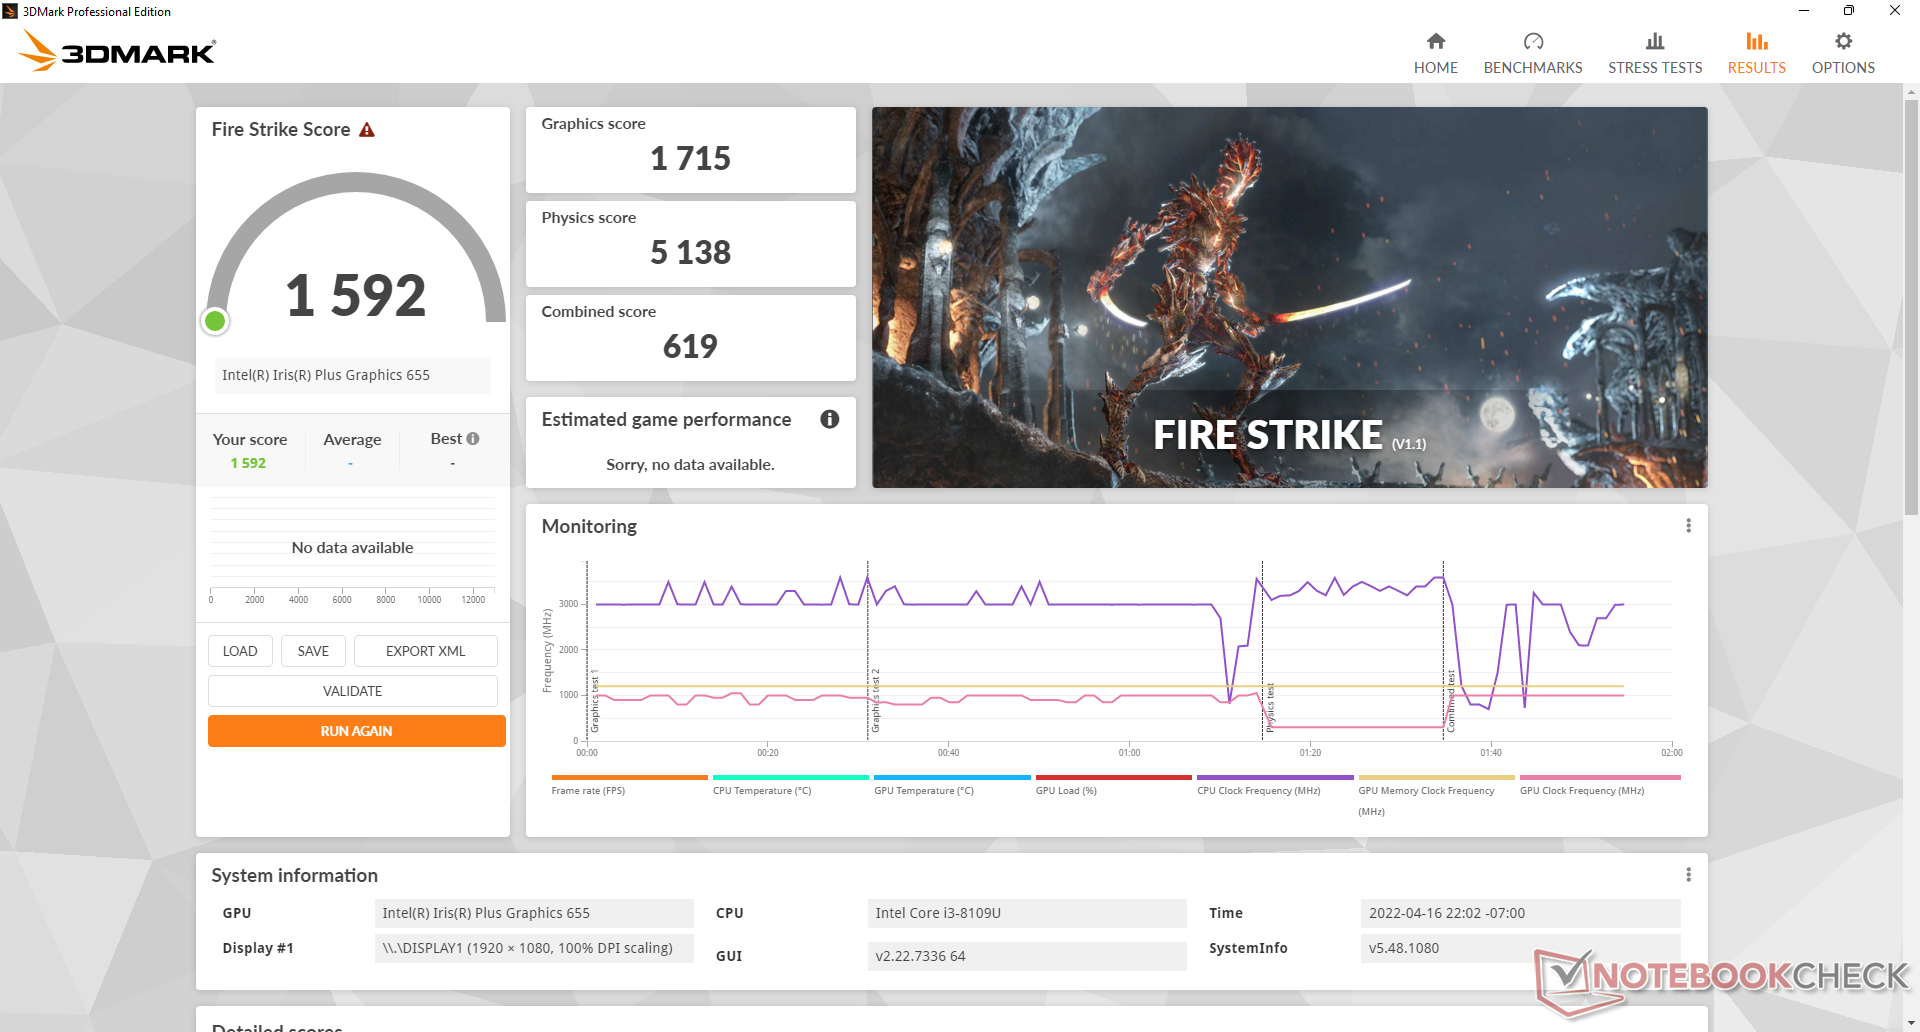
Dal momento che la nostra unità di test è stata spedita solo con memoria a canale singolo, i risultati saranno probabilmente più veloci di quelli che abbiamo registrato qui sotto se configurata con memoria a doppio canale.
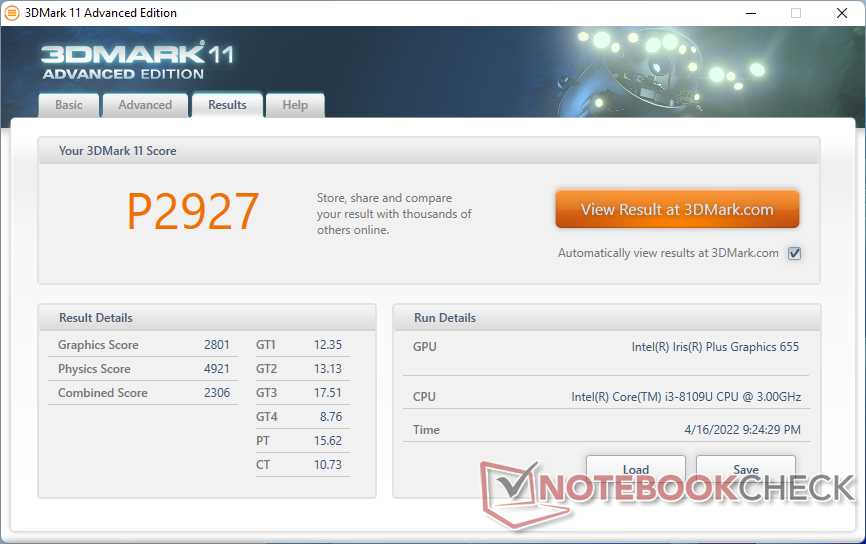
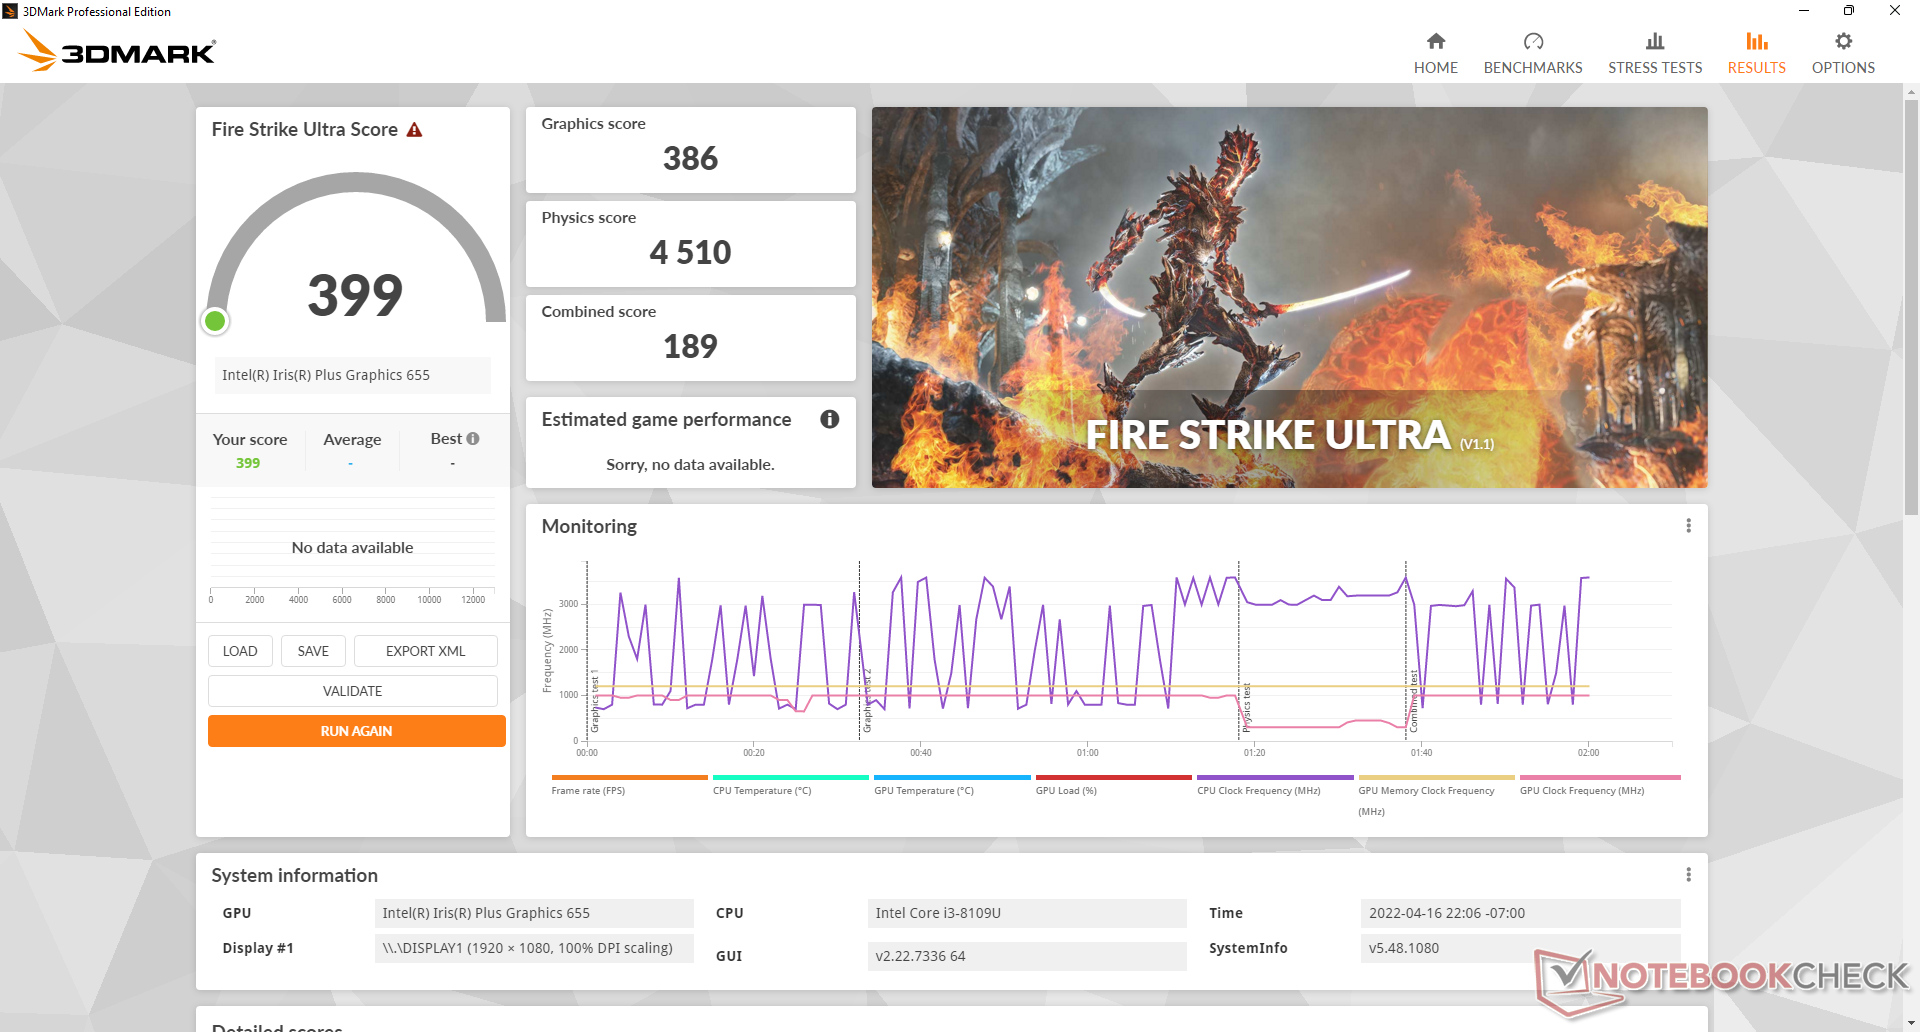
| 3DMark 11 Performance | 2927 punti | |
| 3DMark Cloud Gate Standard Score | 8238 punti | |
| 3DMark Fire Strike Score | 1592 punti | |
| 3DMark Time Spy Score | 636 punti | |
Aiuto | ||
| Final Fantasy XV Benchmark | |
| 1280x720 Lite Quality | |
| Beelink SER4 | |
| Intel NUC11TNKi5 | |
| GMK NucBox 2 | |
| Intel NUC8i7BE | |
| Beelink SEi8 | |
| Media Intel Iris Plus Graphics 655 (9.11 - 18.1, n=8) | |
| Beelink U59 | |
| GMK NucBox 3 | |
| 1920x1080 Standard Quality | |
| Beelink SER4 | |
| Intel NUC11TNKi5 | |
| GMK NucBox 2 | |
| Media Intel Iris Plus Graphics 655 (7.88 - 9.73, n=4) | |
| Beelink SEi8 | |
| 1920x1080 High Quality | |
| Beelink SER4 | |
| Intel NUC11TNKi5 | |
| Beelink SEi8 | |
| GMK NucBox 2 | |
| Media Intel Iris Plus Graphics 655 (5.25 - 6.55, n=4) | |
| basso | medio | alto | ultra | |
|---|---|---|---|---|
| Dota 2 Reborn (2015) | 94.4 | 34.6 | 25.3 | 22.7 |
| Final Fantasy XV Benchmark (2018) | 16.6 | 8.8 | 6.08 | |
| X-Plane 11.11 (2018) | 22.4 | 15 | 12.3 |
Emissioni
Rumore di sistema
Il rumore della ventola è in gran parte binario, nel senso che gli RPM tendono a fluttuare tra il minimo e il massimo con pochissimi passi in mezzo. In altre parole, aspettatevi che la ventola passi da silenziosa a rumorosa abbastanza frequentemente quando si fa multi-tasking o si lanciano applicazioni. Non è così male come sulla più potente serie Beelink GTi11 o SER4, ma i cambiamenti del rumore della ventola sono comunque più evidenti e frequenti rispetto a un NUC.
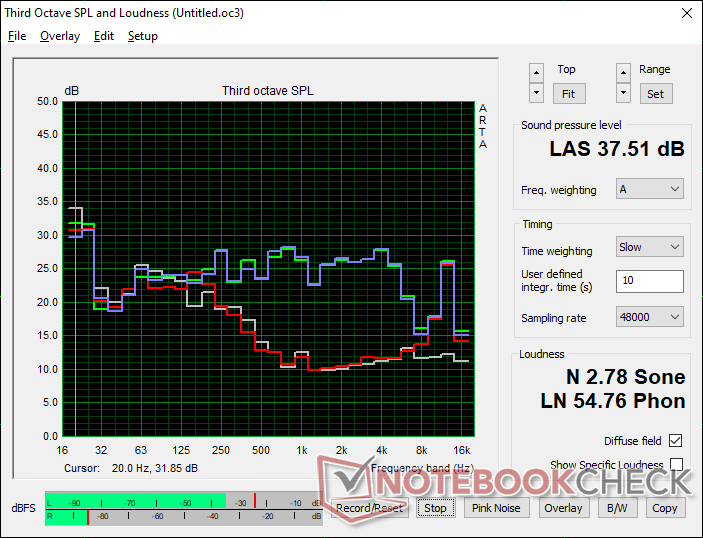
Rumorosità
| Idle |
| 26.5 / 26.5 / 31.1 dB(A) |
| Sotto carico |
| 37.7 / 37.5 dB(A) |
 | ||
30 dB silenzioso 40 dB(A) udibile 50 dB(A) rumoroso |
||
min: | ||
| Beelink SEi8 Iris Plus Graphics 655, i3-8109U, Intel SSD 660p SSDPEKNW512G8 | Beelink SEi10 UHD Graphics G1 (Ice Lake 32 EU), i3-1005G1, Silicon Motion AZW 256G M.2280 NVMe 4X 200725 D | Beelink SER4 Vega 8, R7 4800U, Intel SSD 660p SSDPEKNW512G8 | Intel NUC11TNKi5 Iris Xe G7 80EUs, i5-1135G7, Transcend M.2 SSD 430S TS512GMTS430S | Intel NUC8i7BE Iris Plus Graphics 655, i7-8559U | GMK NucBox 2 Iris Plus Graphics 655, i5-8259U, Netac S930E8/256GPN | |
|---|---|---|---|---|---|---|
| Noise | -17% | -11% | -18% | -9% | 5% | |
| off /ambiente * (dB) | 24.5 | 27.5 -12% | 23.4 4% | 24.8 -1% | 28.7 -17% | 25.6 -4% |
| Idle Minimum * (dB) | 26.5 | 30.9 -17% | 33.2 -25% | 35.6 -34% | 28.7 -8% | 25.7 3% |
| Idle Average * (dB) | 26.5 | 33.5 -26% | 33.2 -25% | 35.6 -34% | 29.3 -11% | 25.7 3% |
| Idle Maximum * (dB) | 31.1 | 33.5 -8% | 33.2 -7% | 35.6 -14% | 31.8 -2% | 25.7 17% |
| Load Average * (dB) | 37.7 | 38.5 -2% | 38.6 -2% | 36.2 4% | 39 -3% | 35.3 6% |
| Load Maximum * (dB) | 37.5 | 51.6 -38% | 40.8 -9% | 47.6 -27% | 41.4 -10% | 35.1 6% |
| Witcher 3 ultra * (dB) | 39.2 | 38 | 39 |
* ... Meglio usare valori piccoli
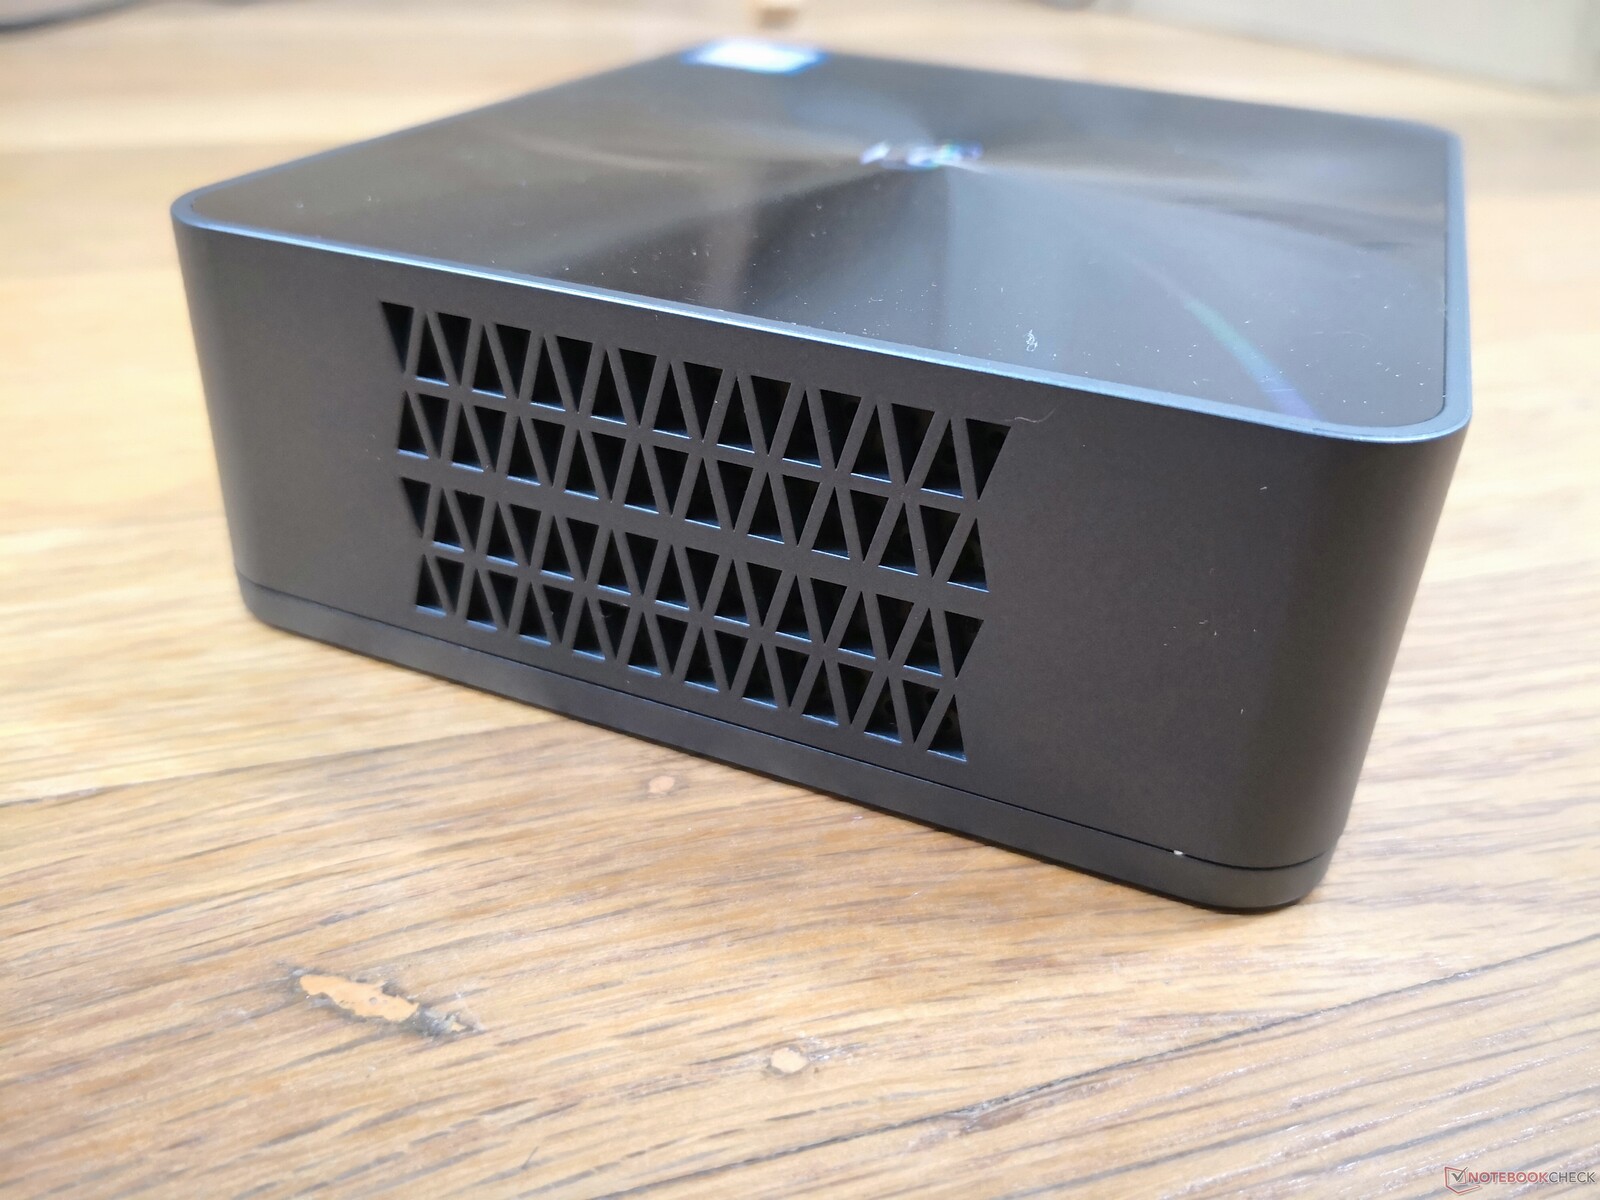
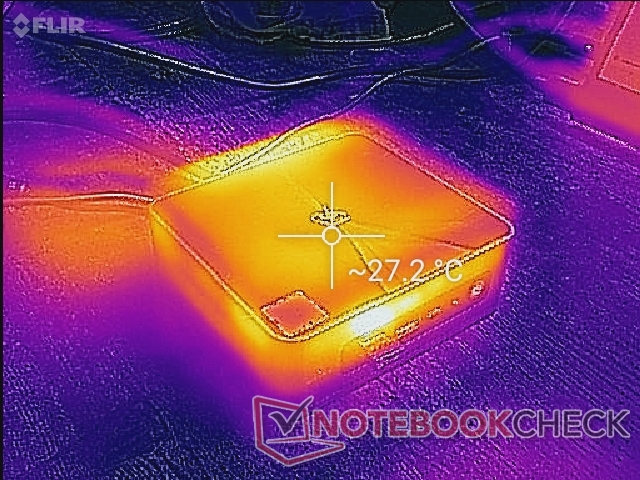
Temperatura
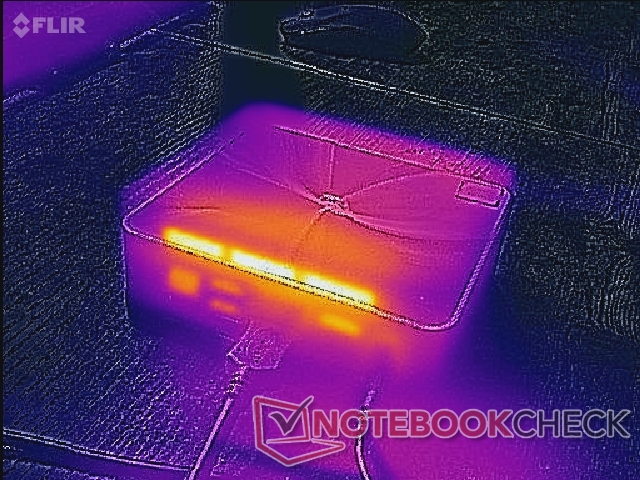
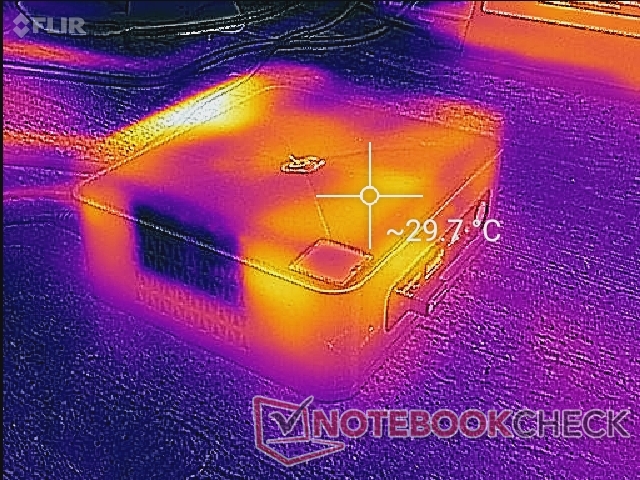
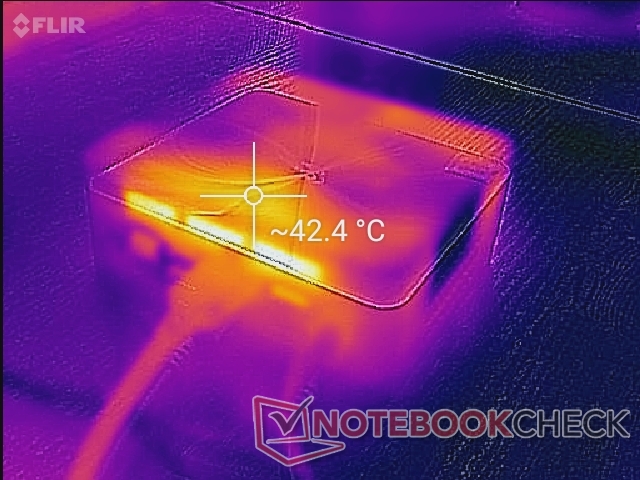
A differenza del più potente SER4, il SEi8 non ha griglie di ventilazione sulla superficie superiore e così gli utenti possono tranquillamente mettere carte e altri oggetti sulla parte superiore senza impattare il raffreddamento. Le prese d'aria sono solo lungo i due lati del telaio. Il punto caldo può raggiungere oltre 42 C sulla parte superiore più vicina alla parte posteriore e vicino alle griglie di scarico.
Test di stress
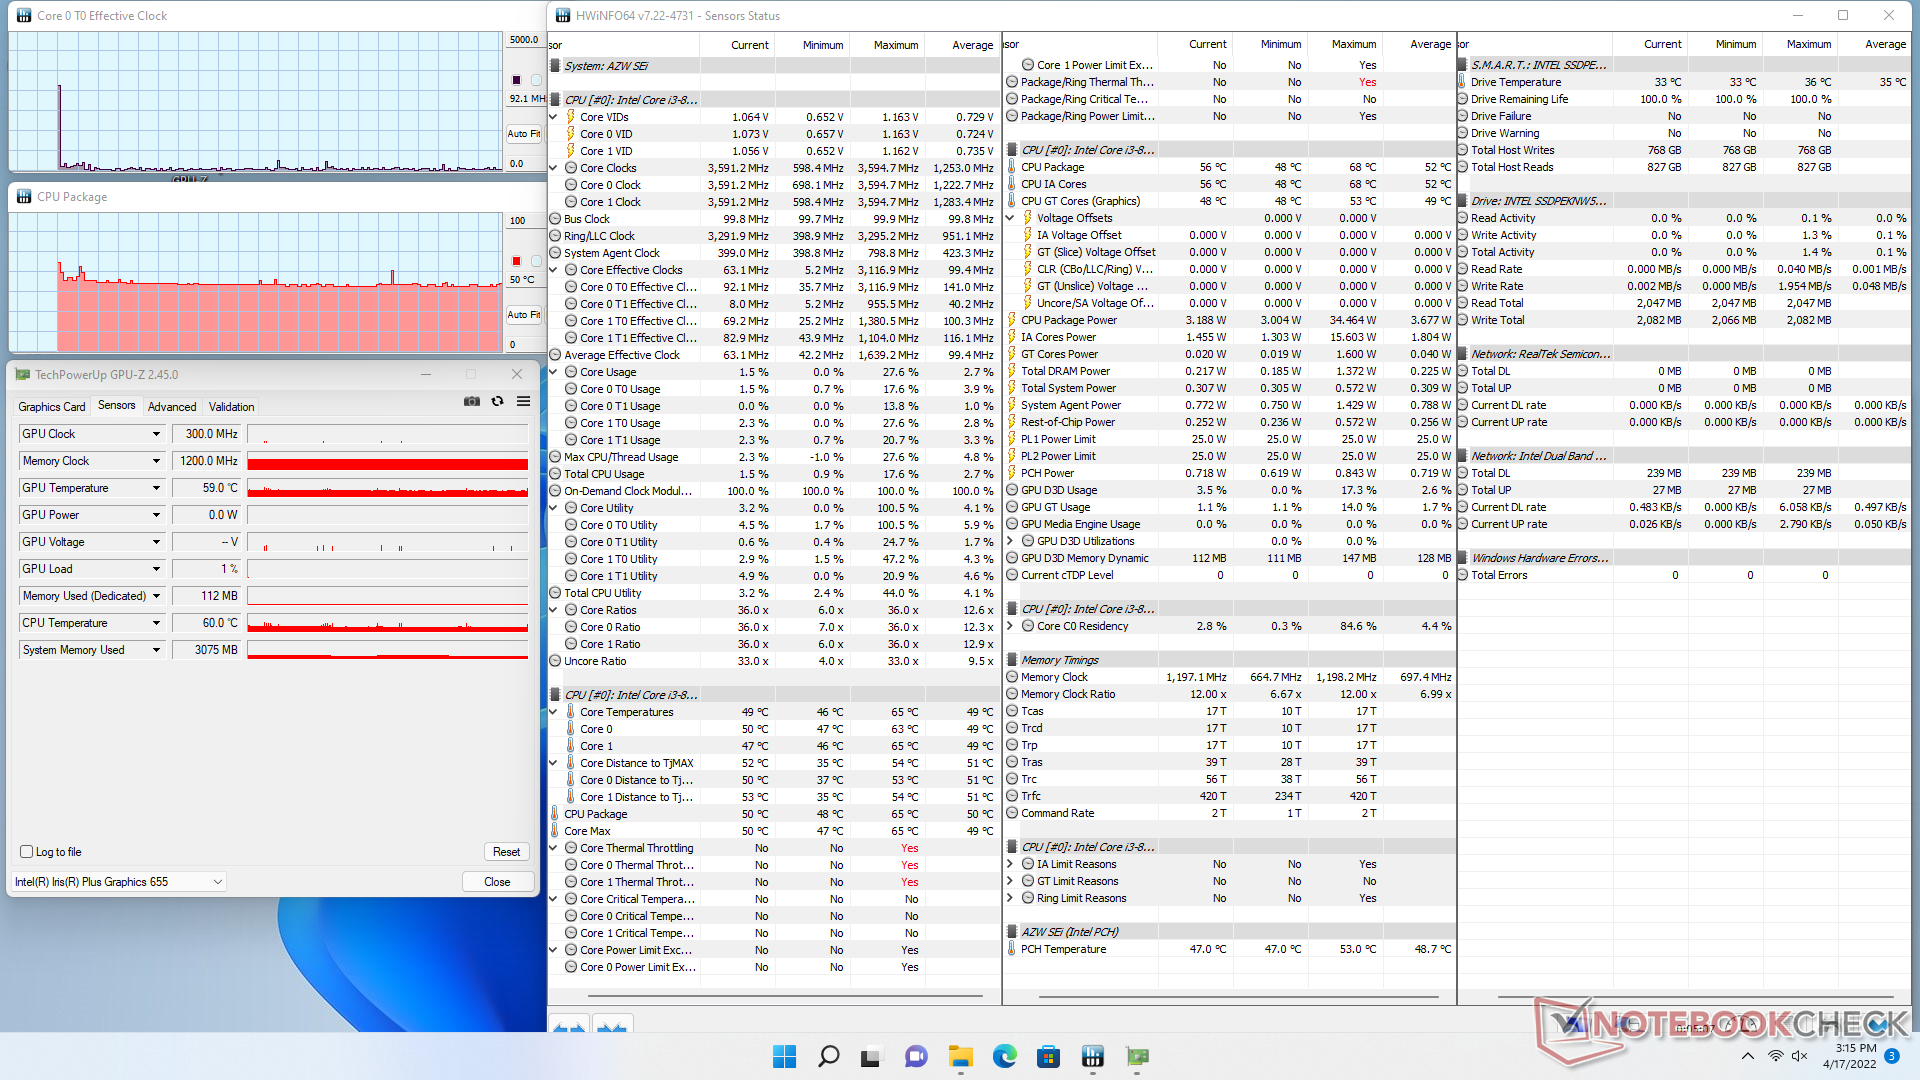
Durante l'esecuzione di Prime95, la CPU aumentava fino a 2,9 GHz prima di stabilizzarsi a 2,8 GHz e 70 C. La potenza del pacchetto CPU raggiungeva anche i 34,4 W durante l'inizio del test prima di scendere e stabilizzarsi a 19,4 W. Eseguendo questo stesso test sul SEi10 con il più recente Core i3-1005G1 vedrebbe sia frequenze di clock più alte che temperature del core di 3,4 GHz e 90 C, rispettivamente.
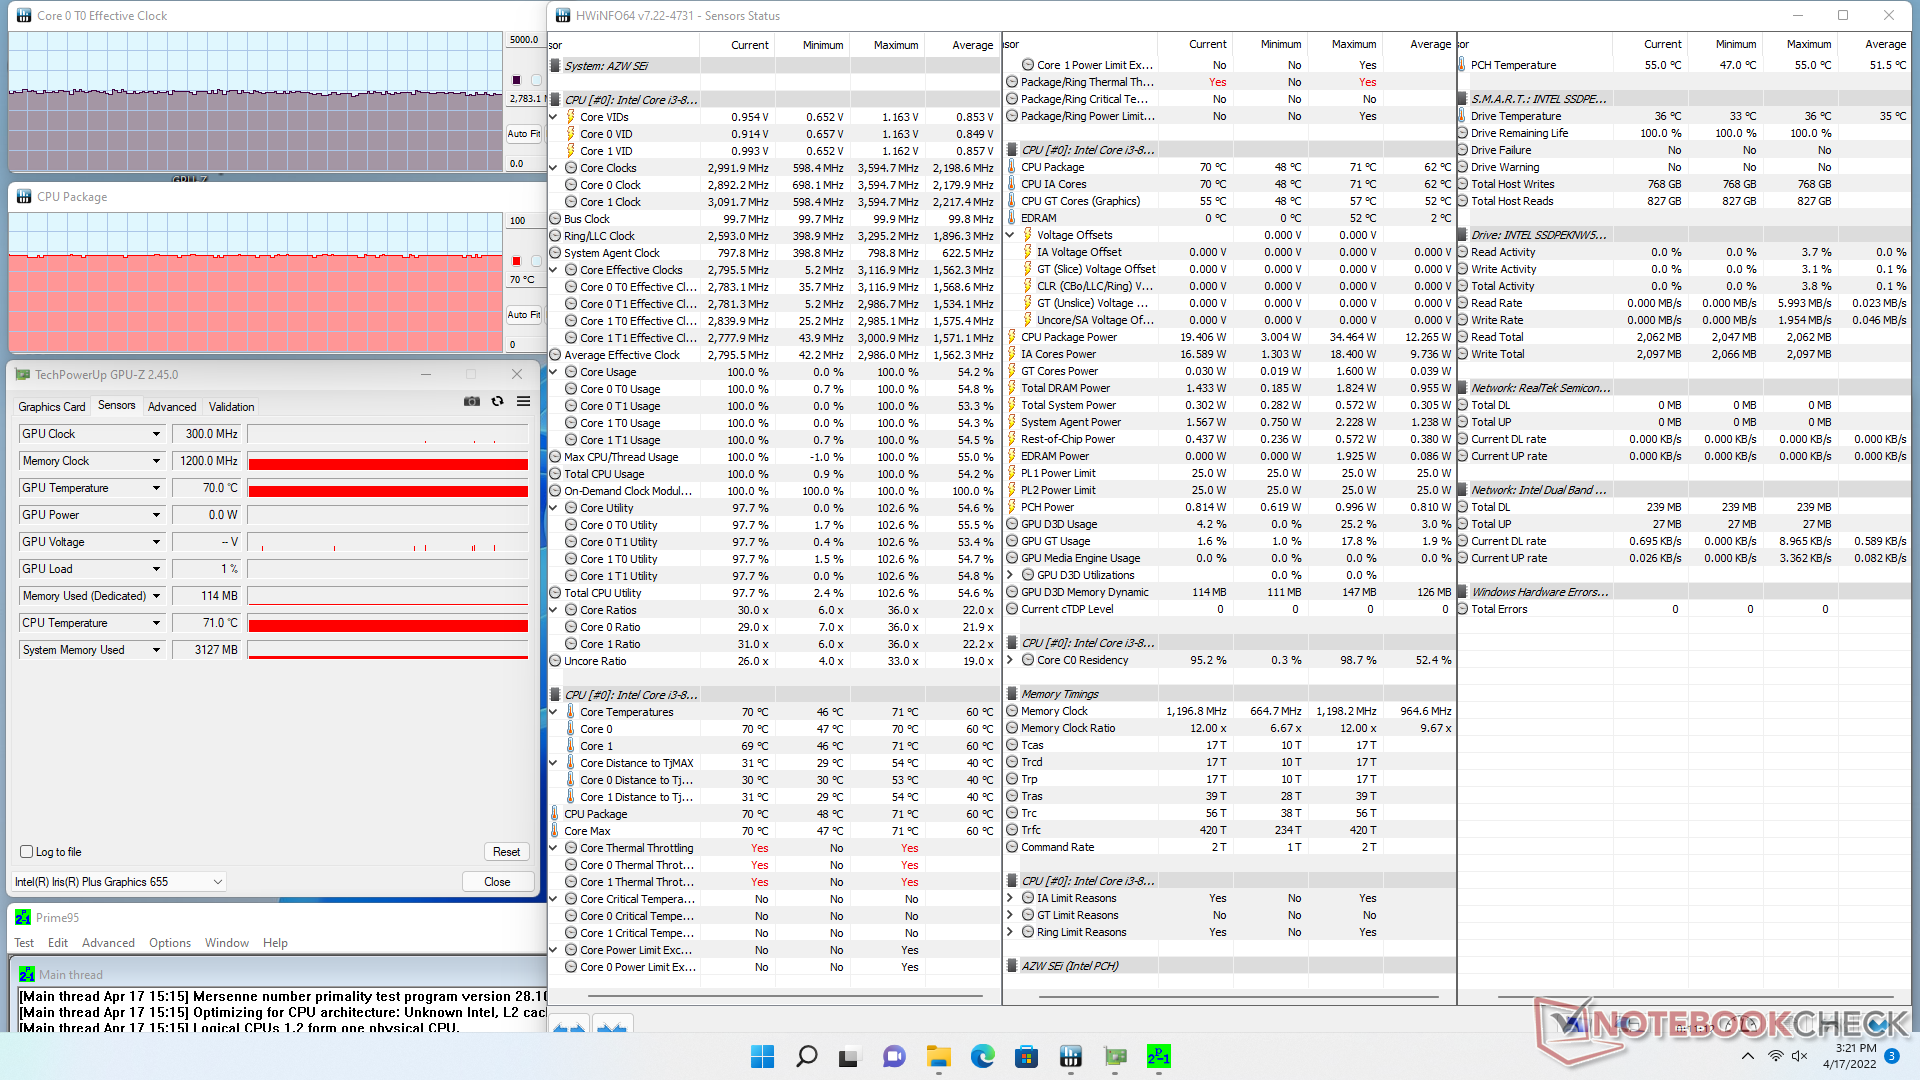
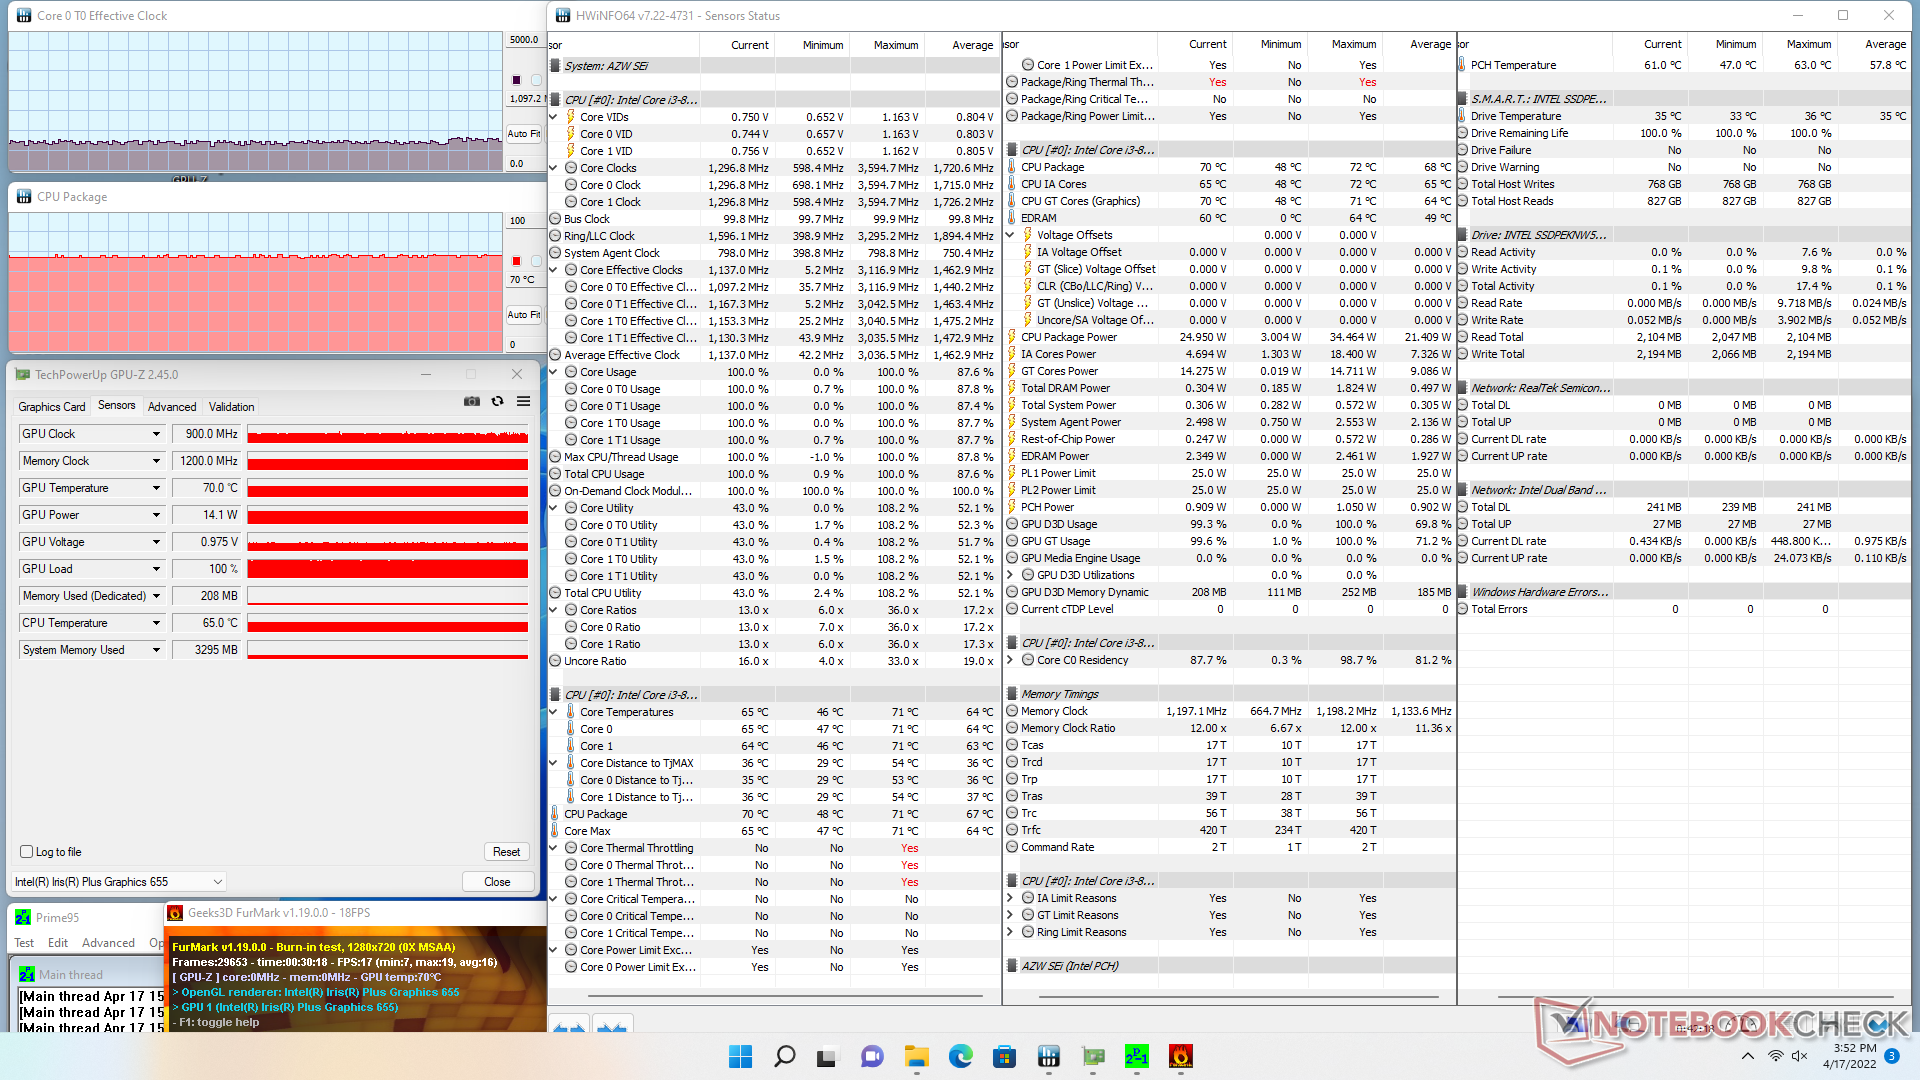
| Clock della CPU (GHz) | Clock della GPU (MHz) | Temperatura media della CPU (°C) | |
| Sistema inattivo | -- | -- | 50 |
| Prime95 Stress | 2.8 | -- | 70 |
| Prime95 + FurMark Stress | 1.1 | 900 | 70 |
Gestione dell'energia
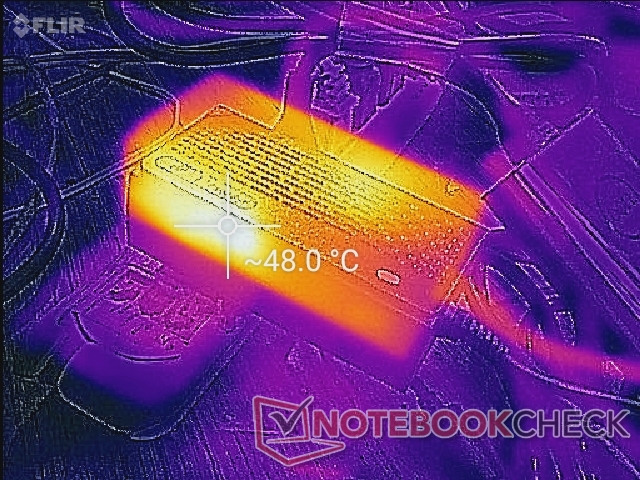
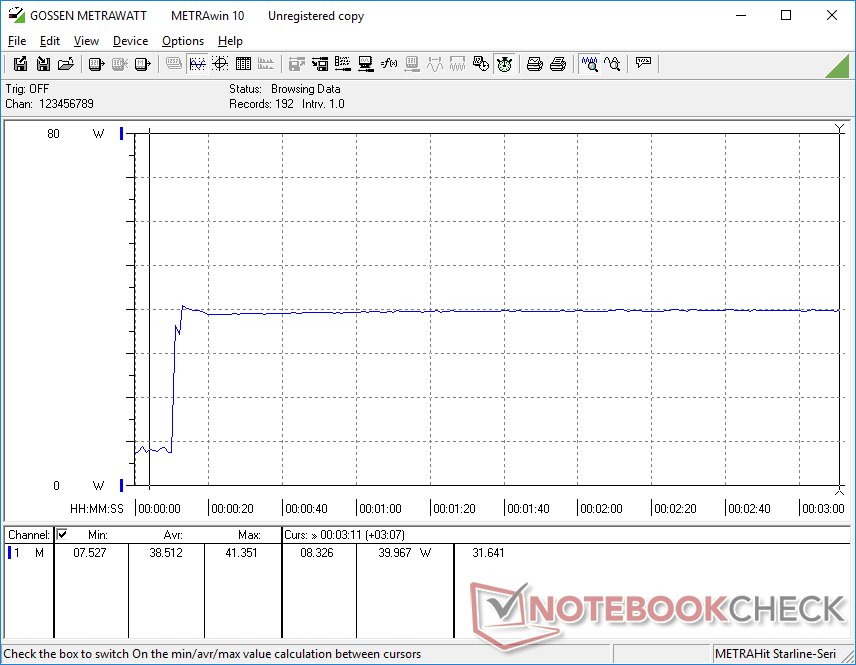
Consumo di energia
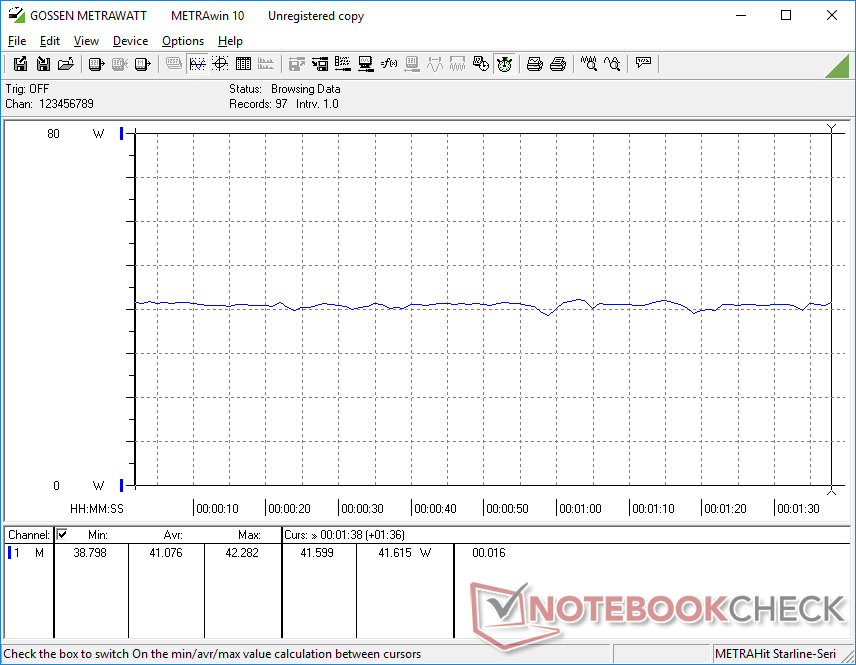
Il SEi8 consuma circa la stessa potenza del NUC 11 con le nuove CPU di 11a generazione, nonostante i vantaggi in termini di prestazioni della serie di CPU di 11a generazione. Questo è dovuto al fatto che la serie 8th gen è molto meno ottimizzata soprattutto in termini di prestazioni grafiche integrate. Per prestazioni più elevate per watt, gli utenti vorranno considerare il SEi8 con il Core i5-8279U o la serie SEi10.
Aspettatevi che il sistema consumi poco più di 40 W quando si eseguono carichi esigenti.

| Off / Standby | |
| Idle | |
| Sotto carico |
|
Leggenda:
min: | |
| Beelink SEi8 i3-8109U, Iris Plus Graphics 655, Intel SSD 660p SSDPEKNW512G8, , x, | Beelink SEi10 i3-1005G1, UHD Graphics G1 (Ice Lake 32 EU), Silicon Motion AZW 256G M.2280 NVMe 4X 200725 D, , x, | Beelink SER4 R7 4800U, Vega 8, Intel SSD 660p SSDPEKNW512G8, , x, | Intel NUC11TNKi5 i5-1135G7, Iris Xe G7 80EUs, Transcend M.2 SSD 430S TS512GMTS430S, , x, | Intel NUC8i7BE i7-8559U, Iris Plus Graphics 655, , , x, | GMK NucBox 2 i5-8259U, Iris Plus Graphics 655, Netac S930E8/256GPN, , x, | |
|---|---|---|---|---|---|---|
| Power Consumption | 16% | 32% | -47% | 4% | 3% | |
| Idle Minimum * (Watt) | 7.5 | 6.3 16% | 4.1 45% | 11.5 -53% | 2.7 64% | 6.1 19% |
| Idle Average * (Watt) | 7.6 | 6.6 13% | 4.1 46% | 12.4 -63% | 3.1 59% | 6.8 11% |
| Idle Maximum * (Watt) | 9.2 | 6.7 27% | 4.6 50% | 12.9 -40% | 6.3 32% | 7.3 21% |
| Load Average * (Watt) | 41.1 | 25.9 37% | 35.6 13% | 40.7 1% | 59.7 -45% | 46.3 -13% |
| Load Maximum * (Watt) | 41.4 | 46.7 -13% | 39.9 4% | 73.5 -78% | 78 -88% | 50.7 -22% |
| Witcher 3 ultra * (Watt) | 35.6 | 43.9 | 47.2 |
* ... Meglio usare valori piccoli
Power Consumption Witcher 3 / Stresstest
Pro
Contro
Verdetto
Come la maggior parte degli altri mini PC di Beelink, il prezzo basso del SEi8 è il suo più grande vantaggio rispetto alla concorrenza. Un SEi8 completamente caricato con la CPU Core i3-3109U, 16 GB di RAM, Windows 11 Pro con licenza e un SSD NVMe da 256 GB è venduto al dettaglio per circa 380 dollari, mentre un Intel NUC8I3BEK con lo stesso processore ma in una configurazione ridotta può essere trovato online per 350 dollari.
Per un processore vecchio di quattro anni, il Core i3-8109U è abbastanza veloce per le applicazioni HTPC di base come la navigazione, lo streaming, la navigazione del sistema operativo e il multi-tasking leggero senza i rallentamenti costanti comunemente sperimentati sulle soluzioni più deboli basate su Celeron o Atom. Se stai cercando di andare il più economico possibile minimizzando l'impatto sull'esperienza UI, allora il SEi8 Core i3 dovrebbe essere vicino alla cima della tua lista. Passare al SEi8 Core i5 aumenterà le prestazioni in modo significativo senza un eccessivo aumento di prezzo per gli utenti che hanno bisogno di un processore più veloce con gambe più lunghe e più potenziale multi-tasking.
Gli svantaggi notevoli dell'Intel NUC includono i materiali dello chassis più sottili, il modulo WLAN più lento, la garanzia più breve, le pulsazioni della ventola più frequenti, nessun lettore di schede SD e opzioni BIOS più limitate. Fortunatamente, gli angoli tagliati non sono abbastanza per essere un motivo di rottura per la configurazione HTPC di bilancio.
Prezzo e disponibilità
Beelink sta ora spedendo il SEi8 in diverse configurazioni a partire da 319 dollari USA. In alternativa, gli utenti possono ordinare da Amazon per $359 USD.
Price comparison

