Recensione del mini PC Beelink SER4: AMD Zen 2 dà ancora del filo da torcere all'Intel NUC
Il SER4 succede direttamente al SER3 dello scorso anno sostituendo la vecchia CPU Zen+ con una più recente Zen 2. In particolare, il SER4 utilizza il velocissimo e relativamente poco comune Ryzen 7 4800U che purtroppo si trova in pochissimi altri prodotti.
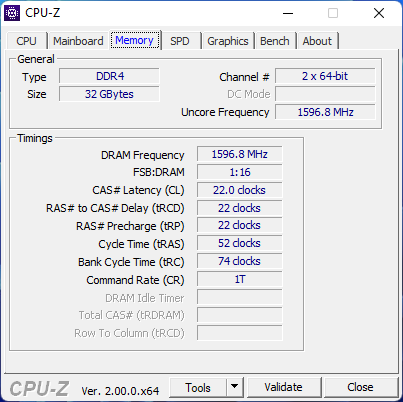
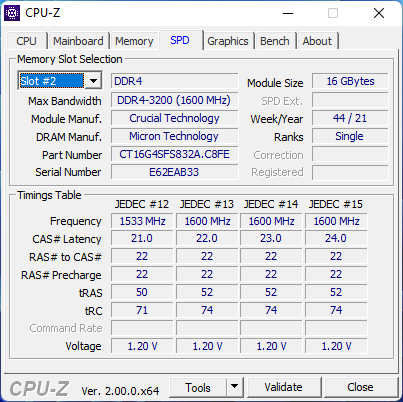
La nostra configurazione recensita viene fornita con la CPU Ryzen 7 4800U, 32 GB di RAM DDR4-3200 e un SSD NVMe da 512 GB per 650 dollari. Una SKU inferiore con metà della RAM è disponibile per 50 dollari in meno. Gli utenti interessati a una versione Intel dovrebbero invece guardare la serie Beelink SEI. Il SER4 compete direttamente con la serie Intel NUC così come altri mini PC alimentati da CPU della serie U
Altre recensioni di Beelink
Potenziali concorrenti a confronto
Punteggio | Data | Modello | Peso | Altezza | Dimensione | Risoluzione | Prezzo |
|---|---|---|---|---|---|---|---|
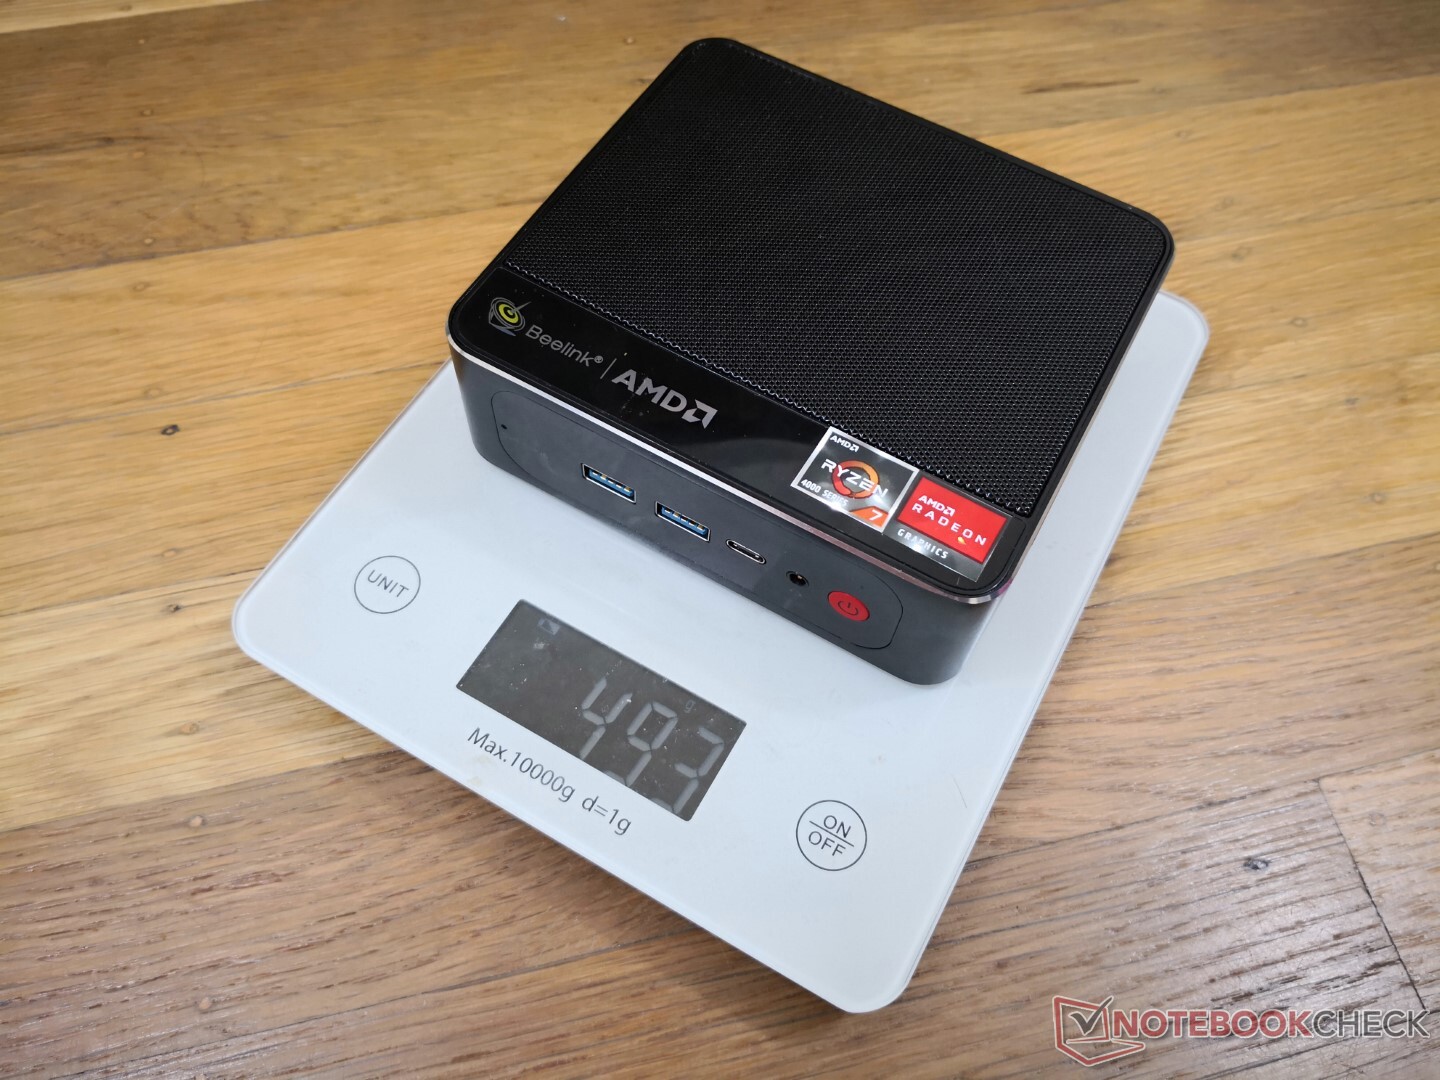
v (old) | 04/2022 | Beelink SER4 R7 4800U, Vega 8 | 494 gr | 40 mm | x | ||
v (old) | 02/2022 | GMK NucBox 3 Celeron J4125, UHD Graphics 600 | 410 gr | 32.5 mm | x | ||
v (old) | 01/2022 | Beelink GTR5 R9 5900HX, Vega 8 | 686 gr | 39 mm | x | ||
v (old) | 02/2021 | Intel NUC11PAQi7 i7-1165G7, Iris Xe G7 96EUs | 647 gr | 56 mm | x | ||
v (old) | 11/2021 | Beelink SER3 R7 3750H, Vega 10 | 492 gr | 40 mm | x | ||
v (old) | 02/2020 | Intel NUC10i5FNK i5-10210U, UHD Graphics 620 | 493 gr | 36 mm | 0.00" | 0x0 |
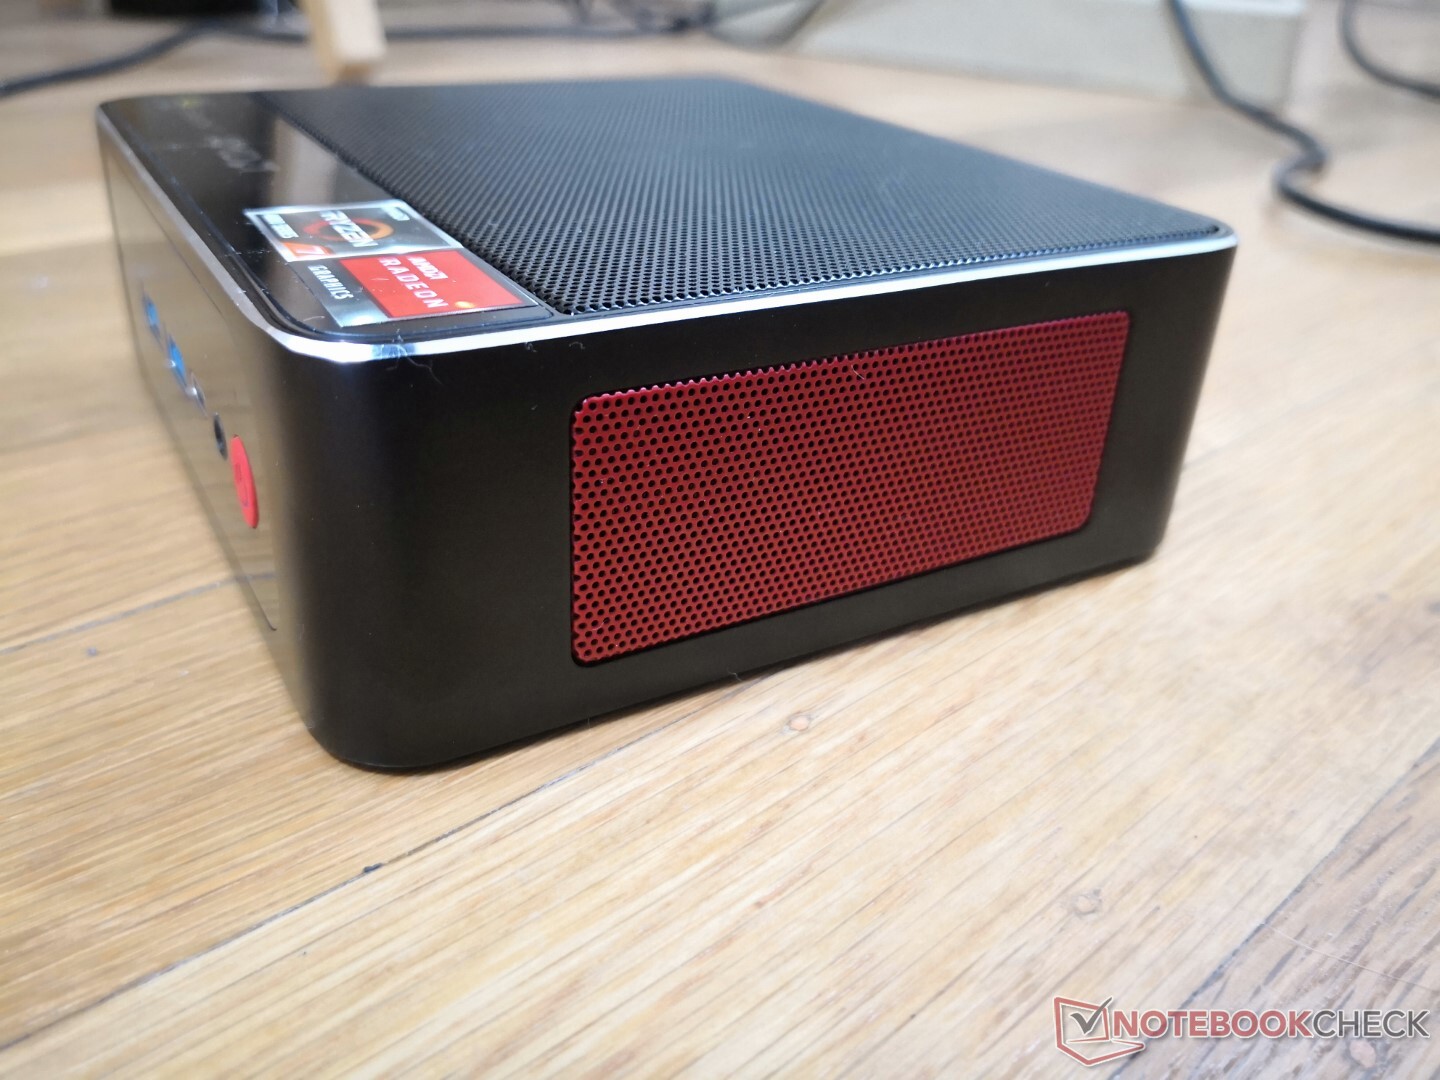
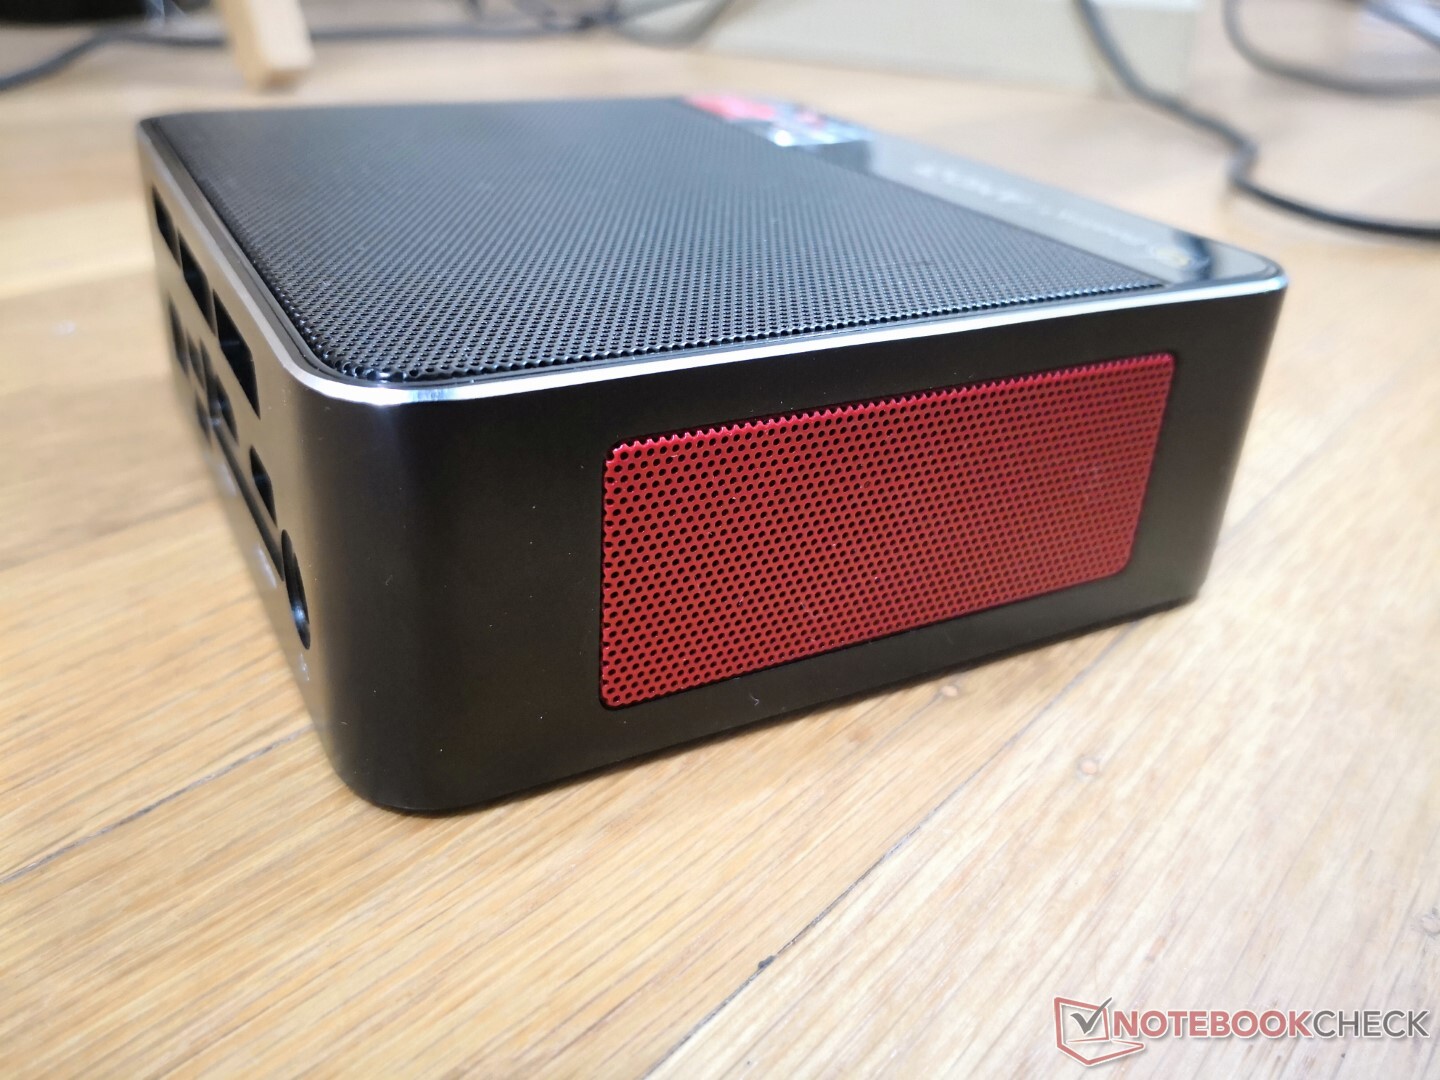
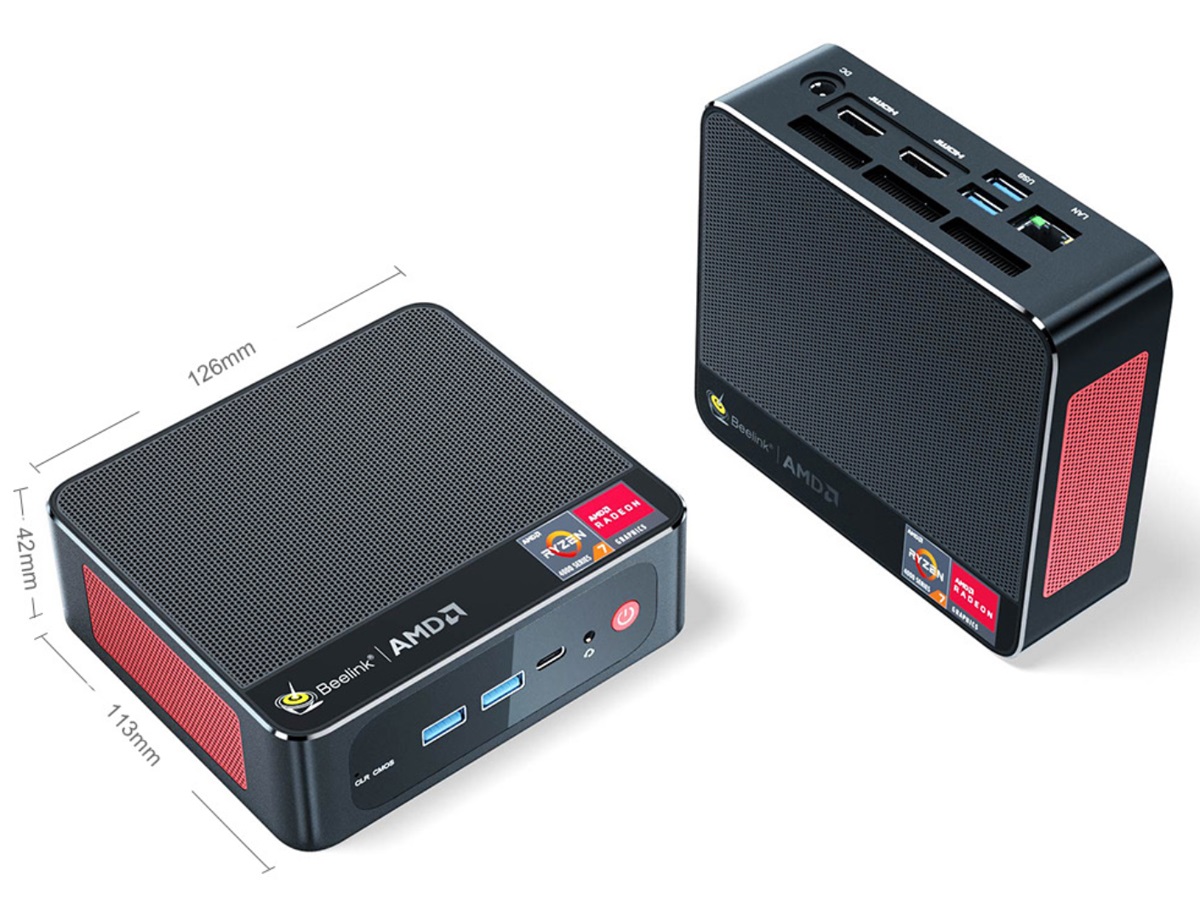
Caso - Molte griglie di ventilazione
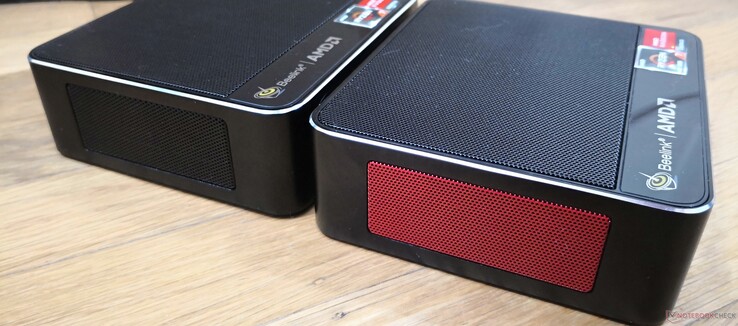
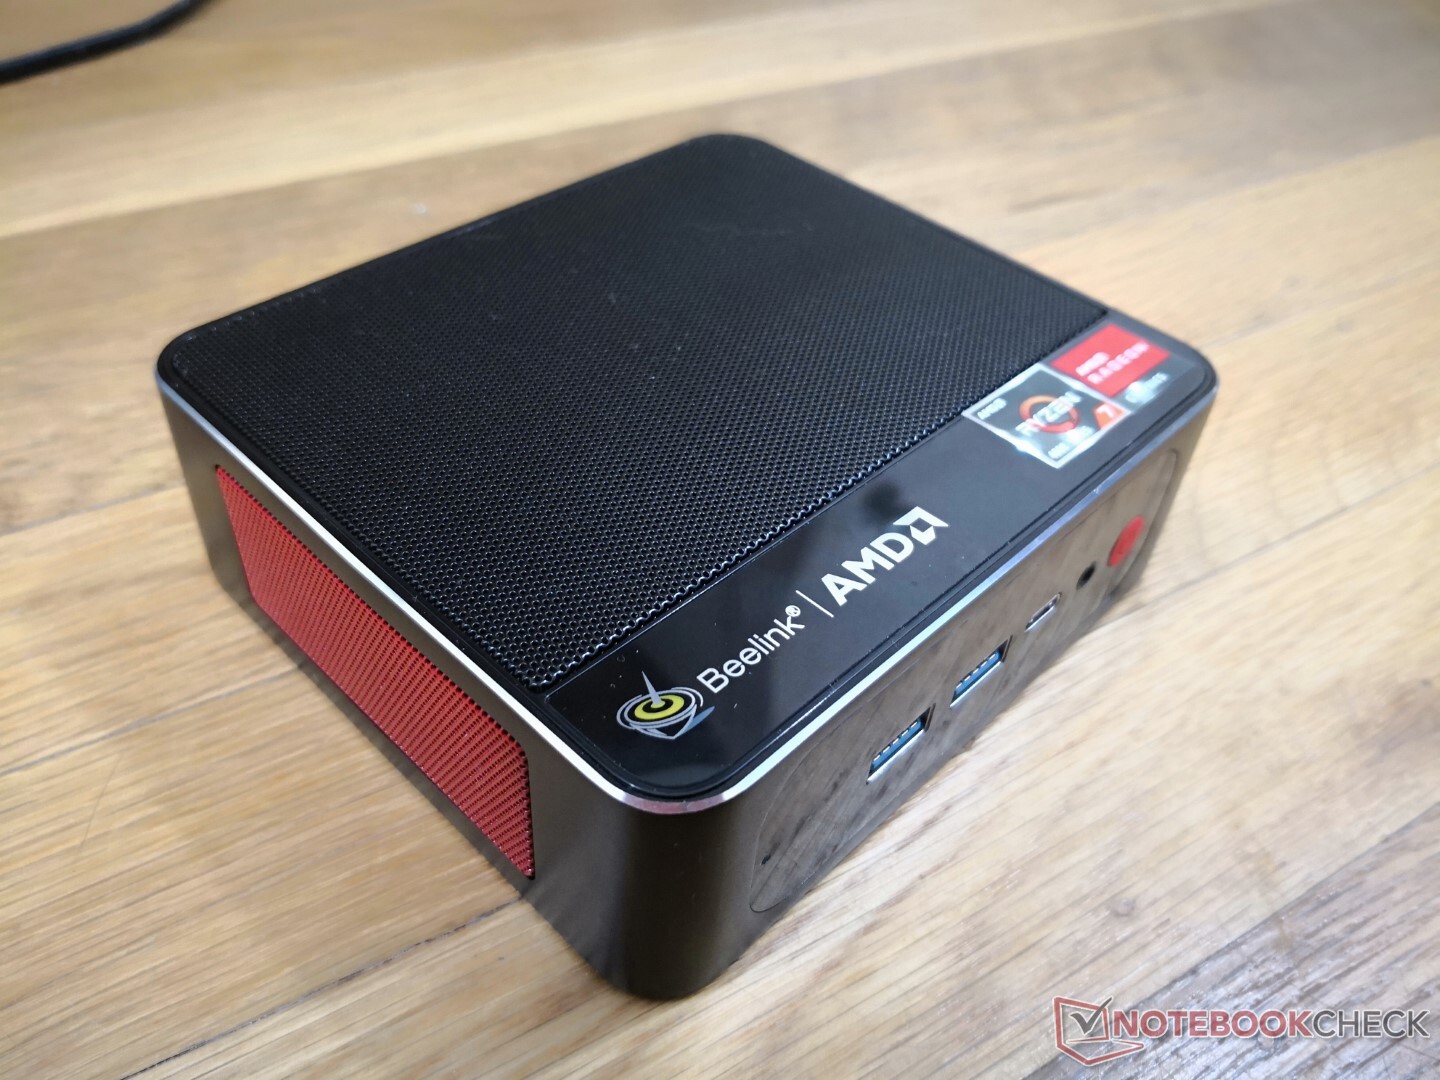
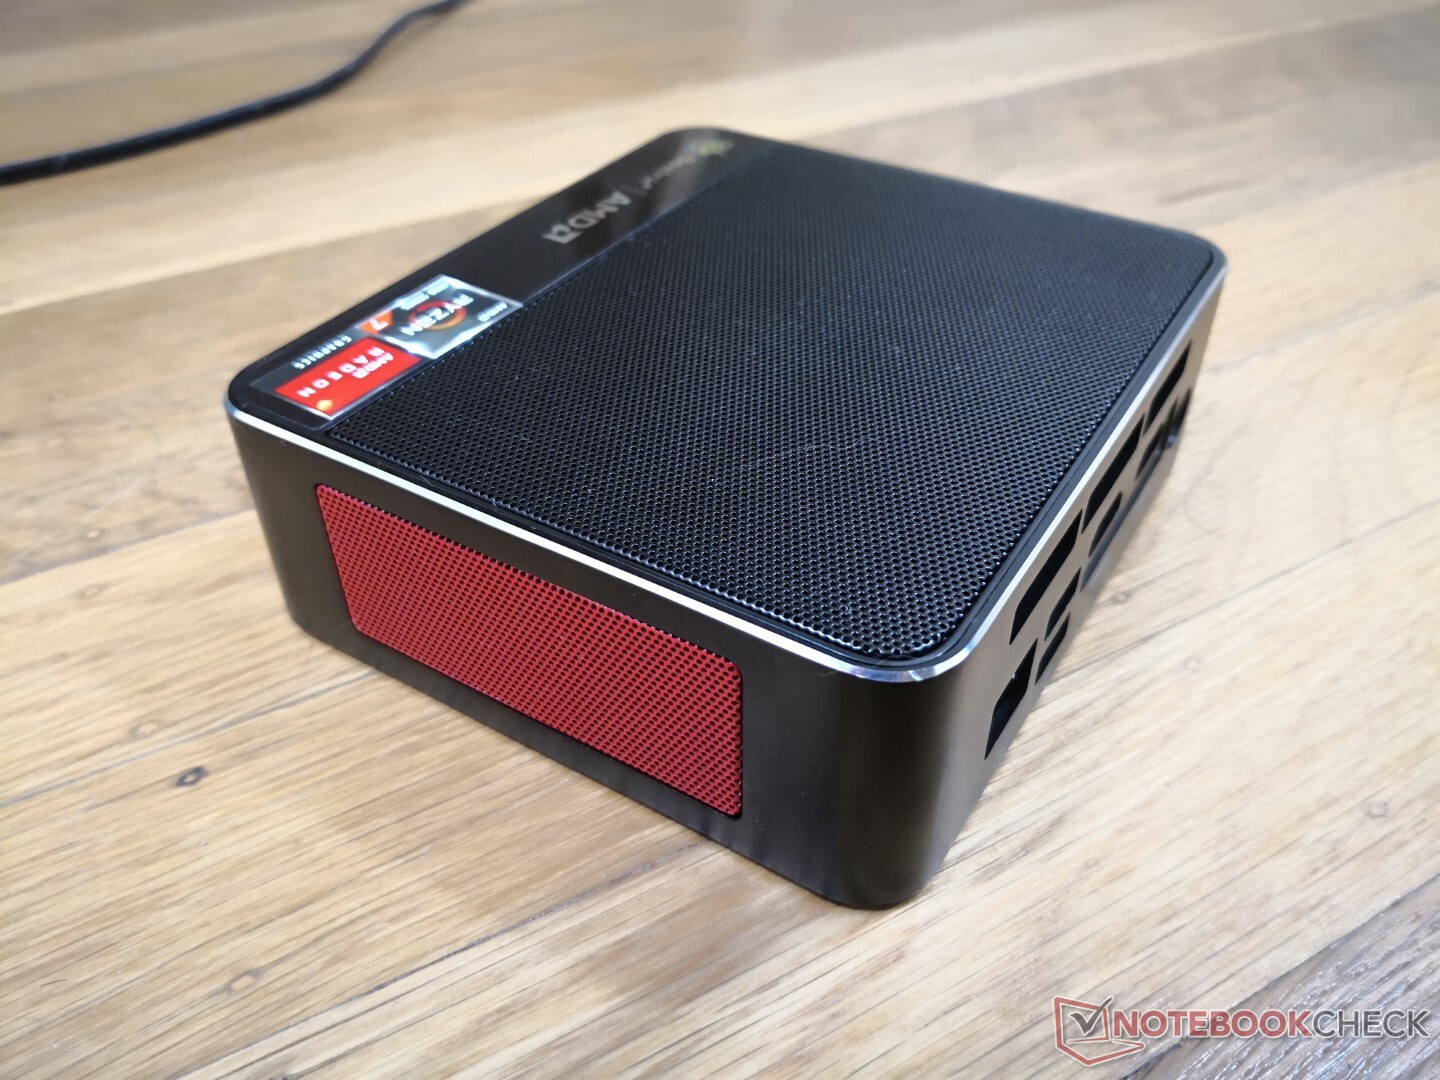
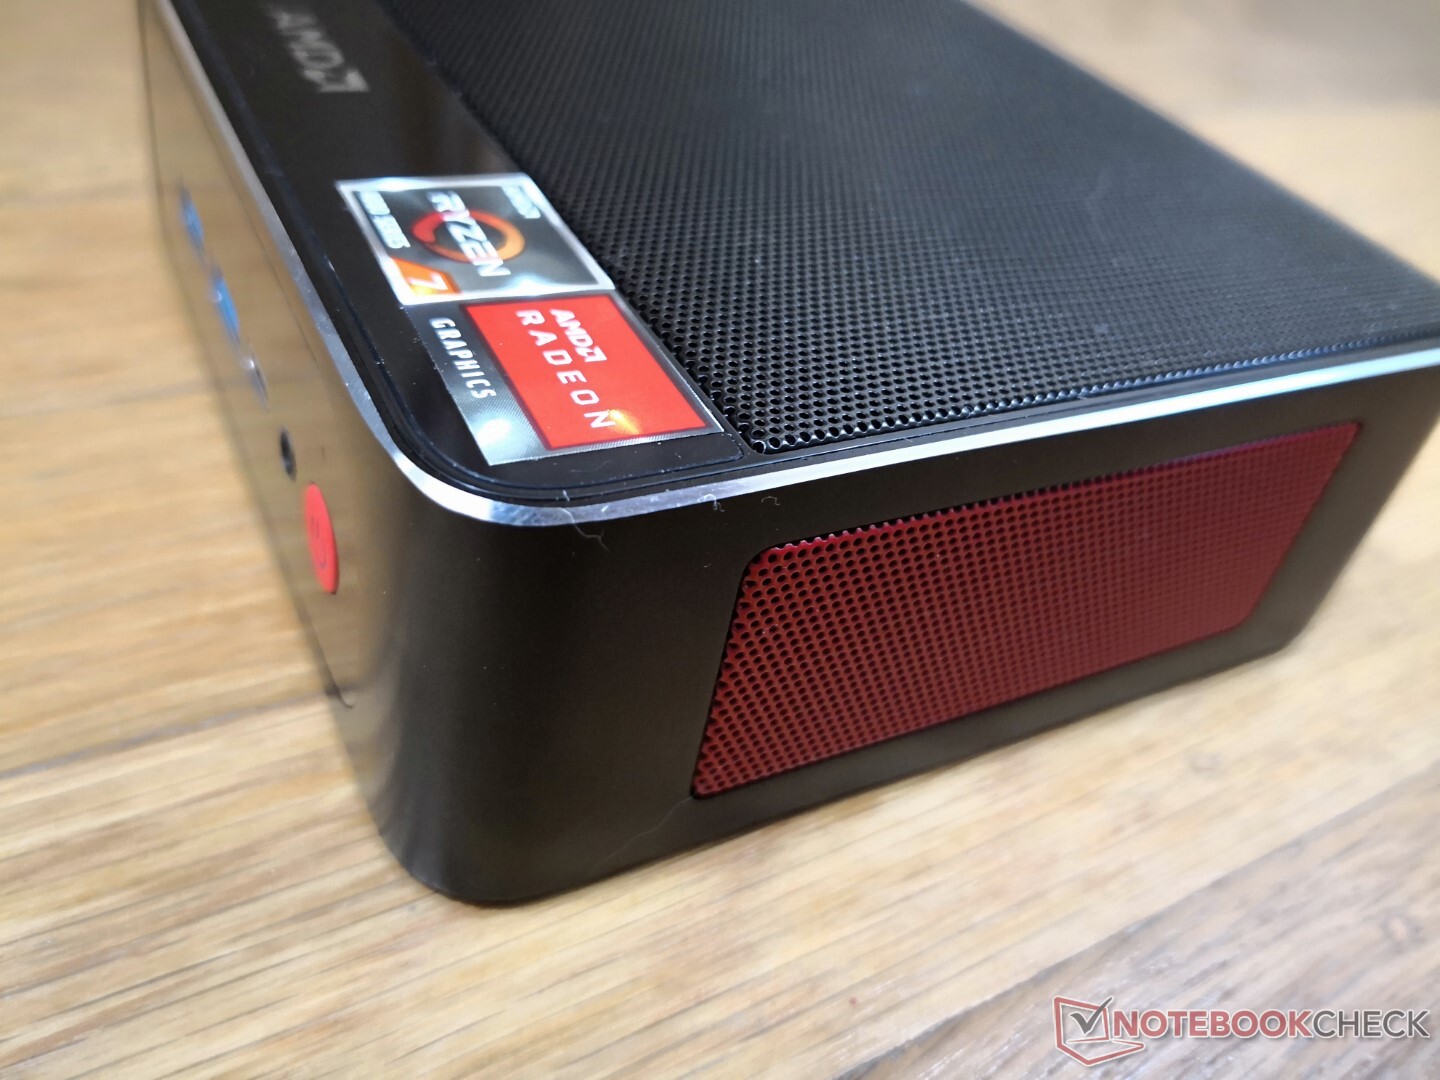
Il SER4 utilizza lo stesso telaio del SER3 ma con un cambiamento superficiale. Più specificamente, le griglie lungo i lati dell'unità sono ora rosse invece che nere come omaggio alla CPU AMD all'interno.
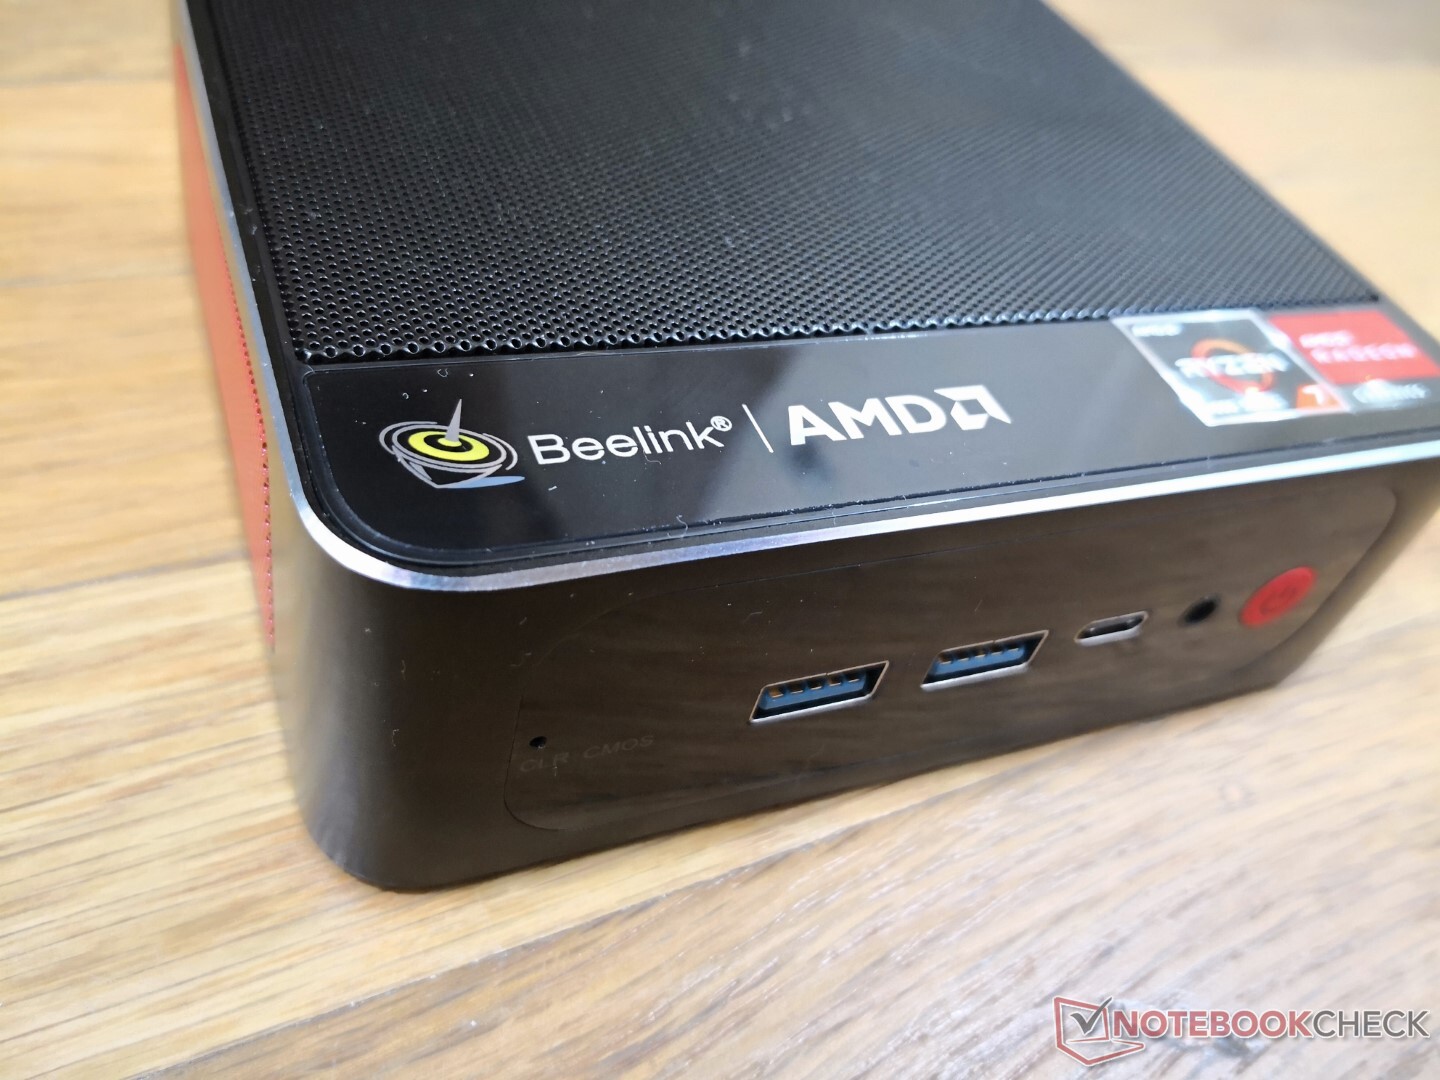
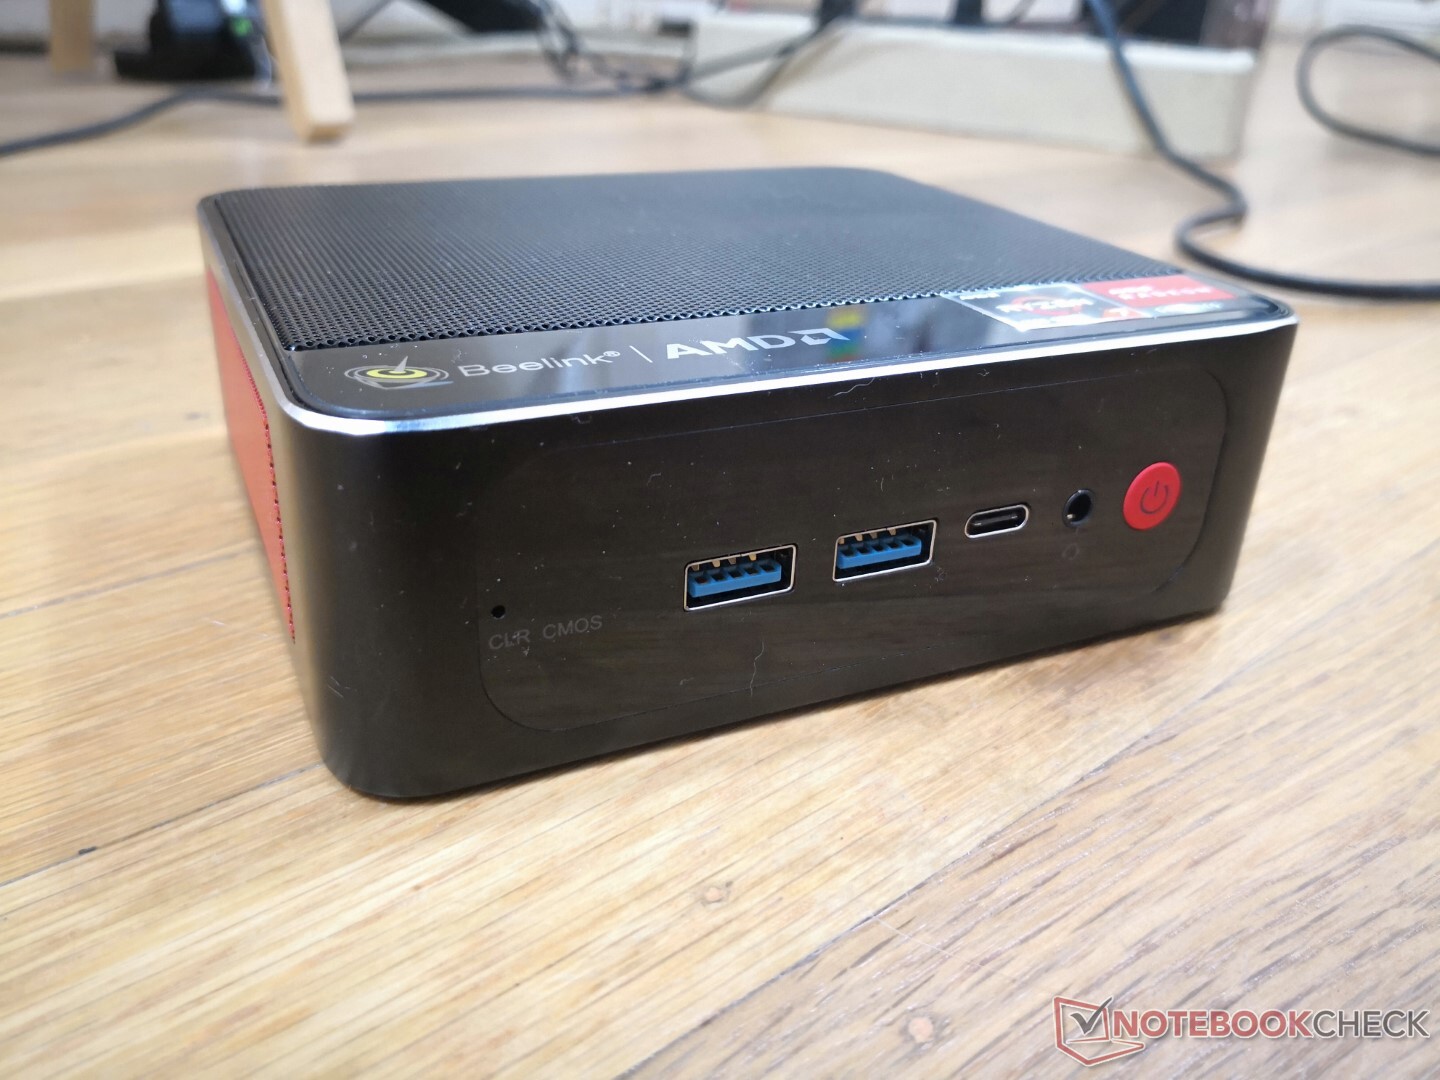
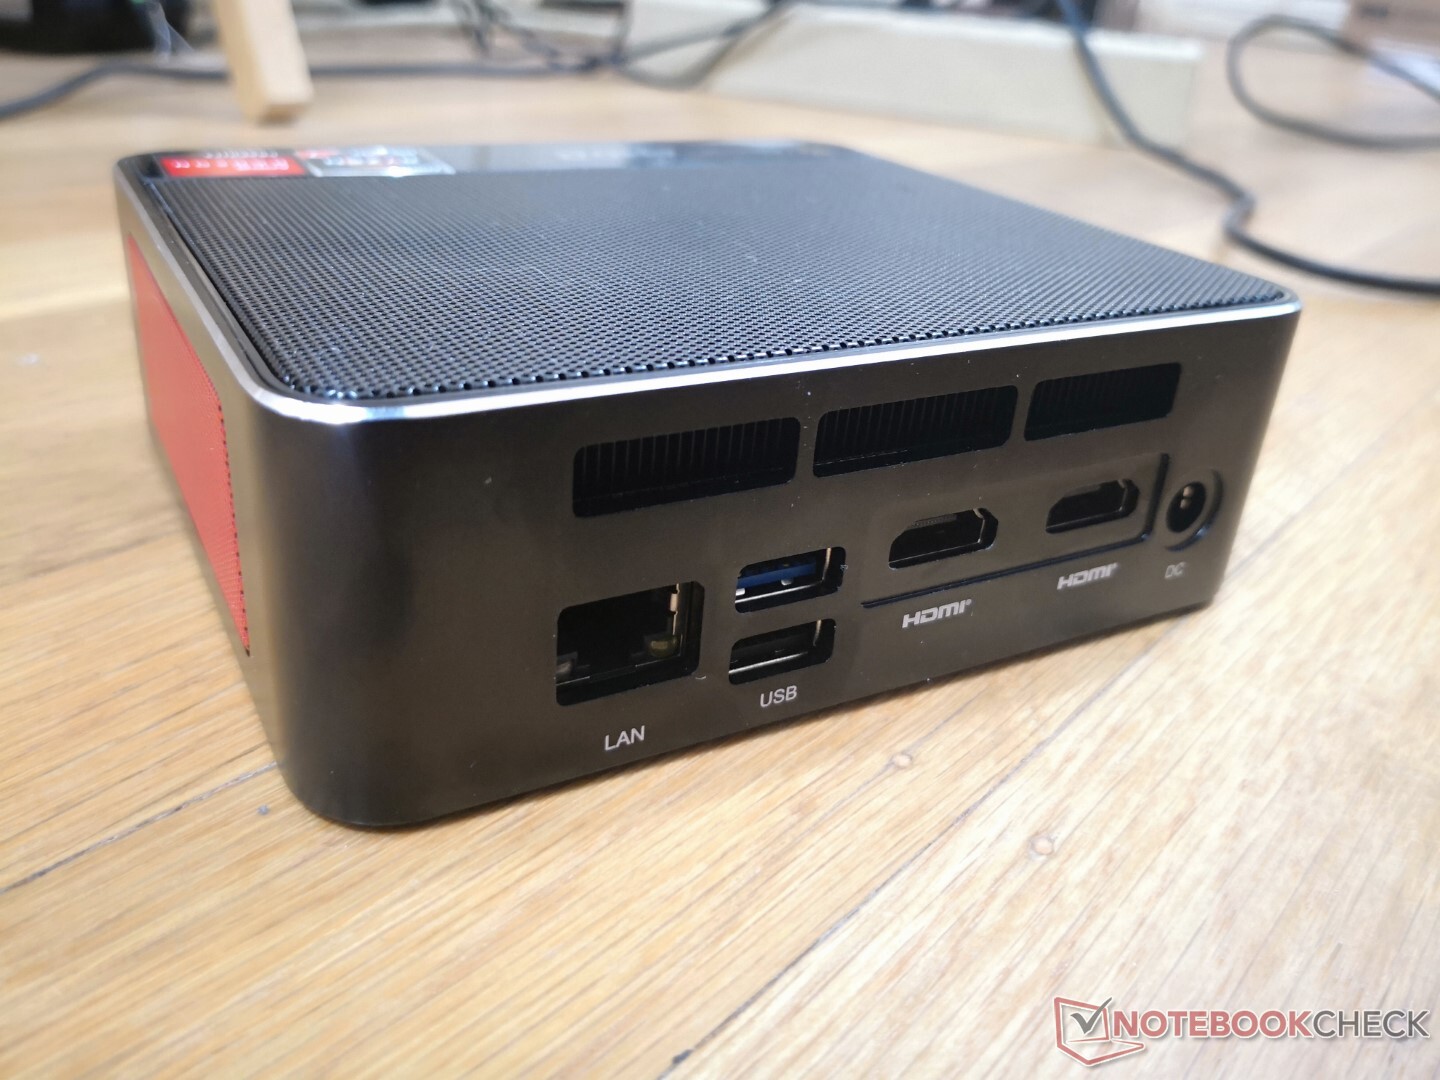
Connettività - Nessun supporto Thunderbolt
Le opzioni delle porte sono identiche a quelle offerte sul SER3. Si noti che è possibile accendere il SER4 con alcuni adattatori AC USB-C se i proprietari perdono il cavo proprietario dell'adattatore AC a barile che viene fornito nella confezione.
Comunicazione
| Networking | |
| iperf3 transmit AX12 | |
| Beelink SER4 | |
| Beelink GTR5 | |
| Intel NUC11PAQi7 | |
| Beelink SER3 | |
| GMK NucBox 3 | |
| iperf3 receive AX12 | |
| Beelink SER4 | |
| Intel NUC11PAQi7 | |
| Beelink GTR5 | |
| GMK NucBox 3 | |
| Beelink SER3 | |
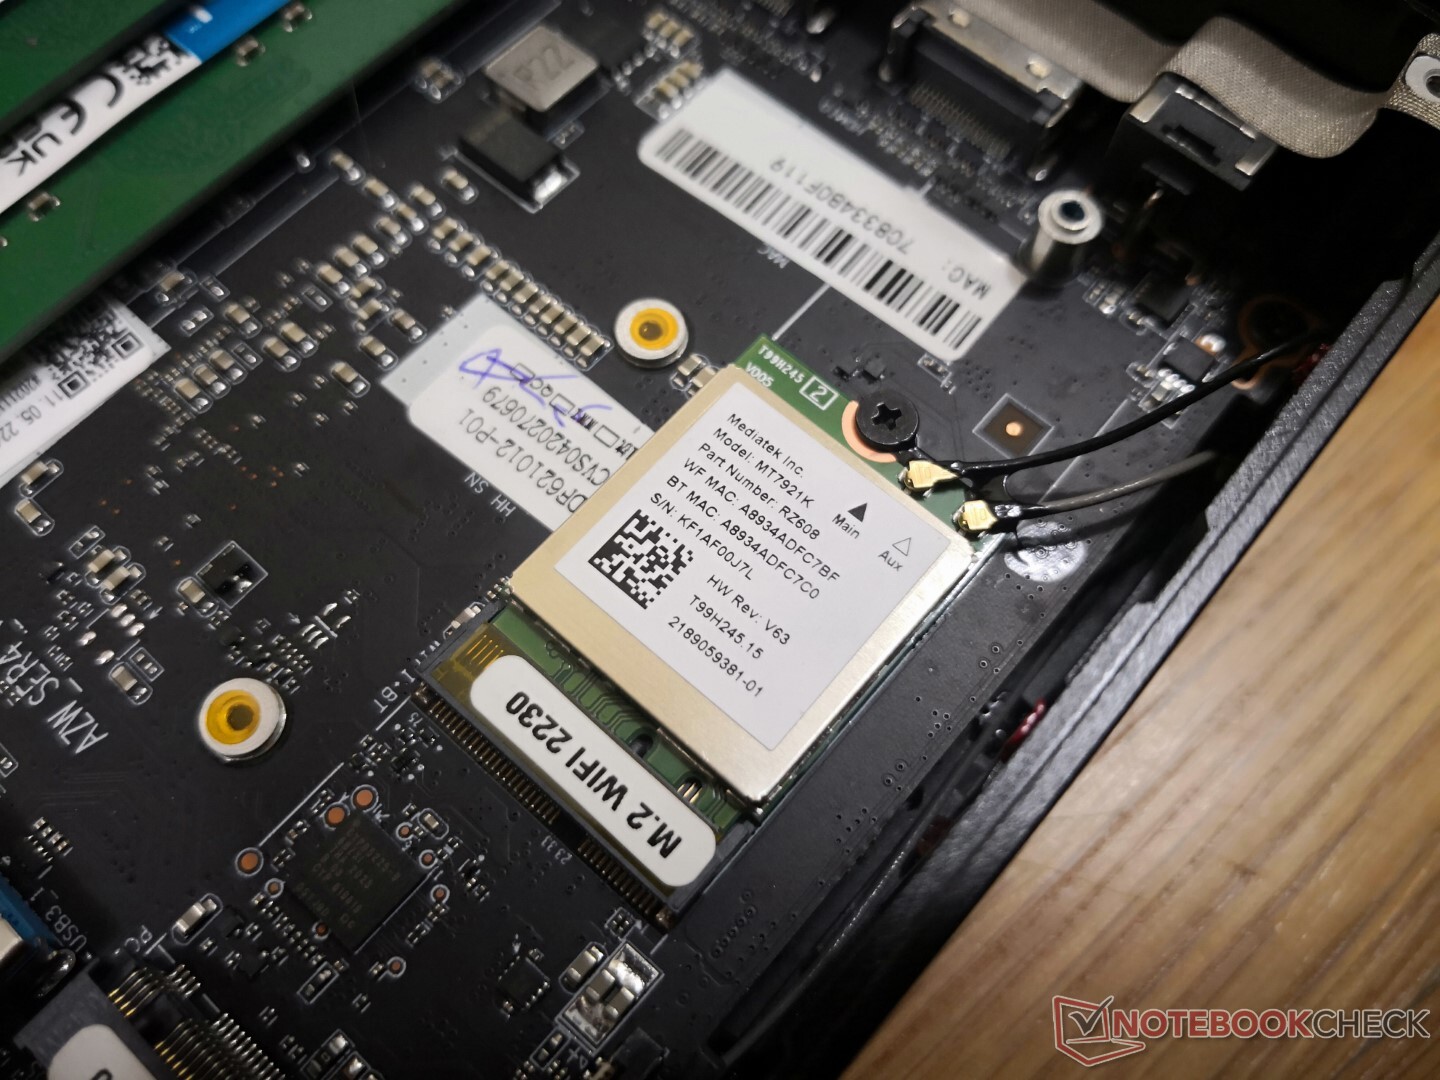
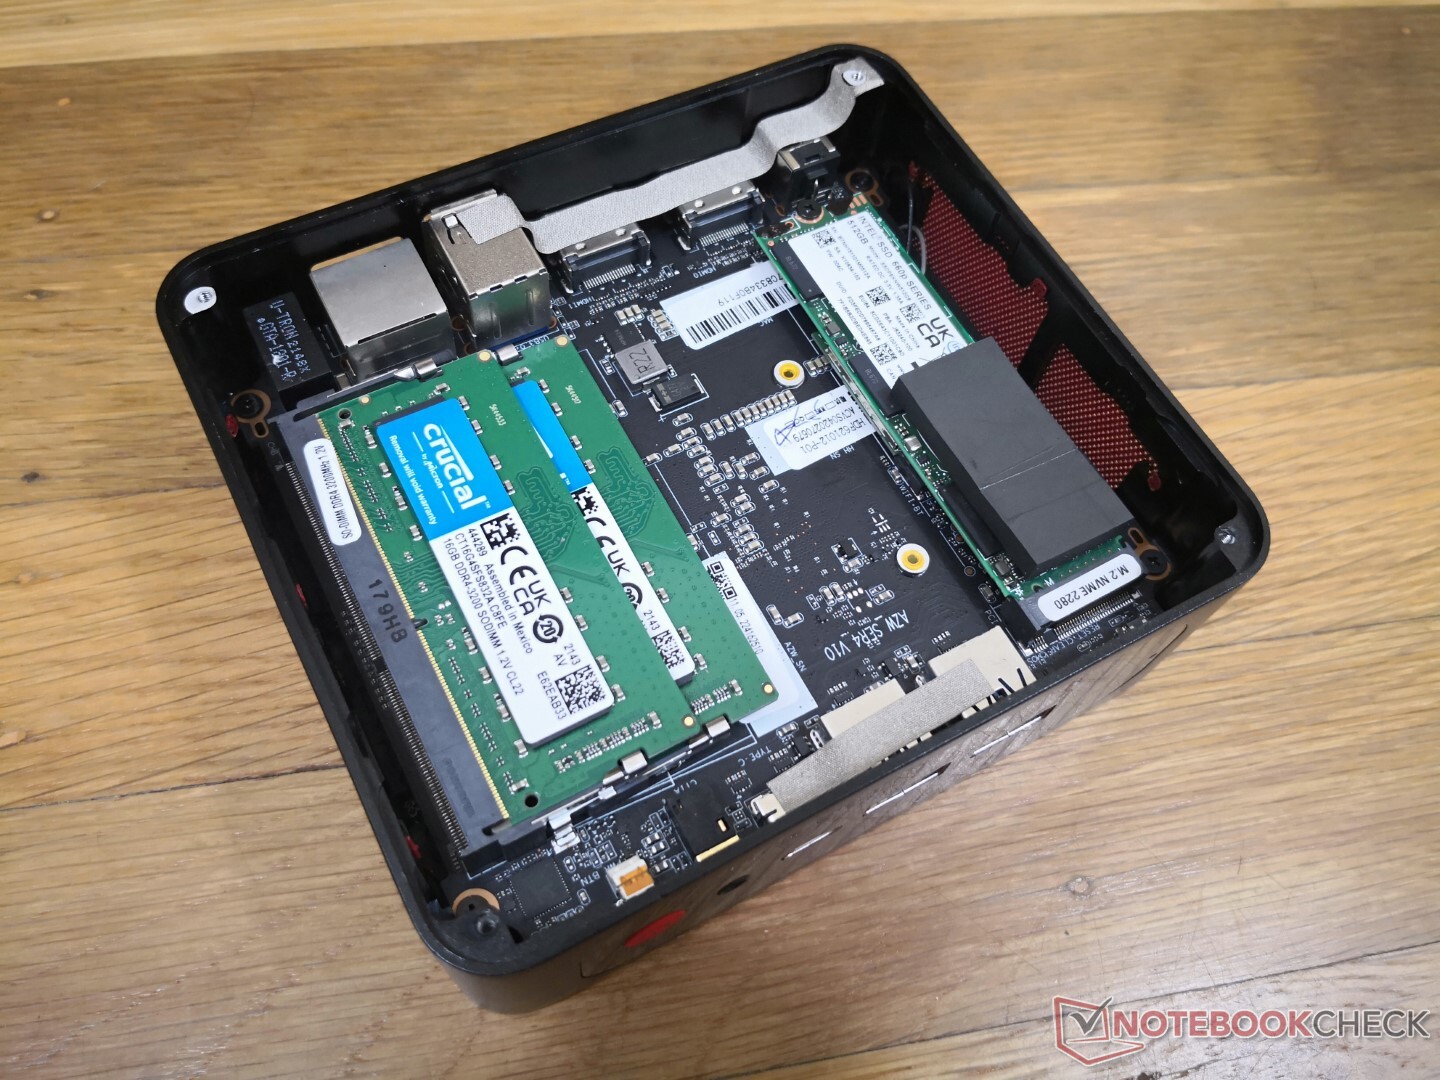
Manutenzione
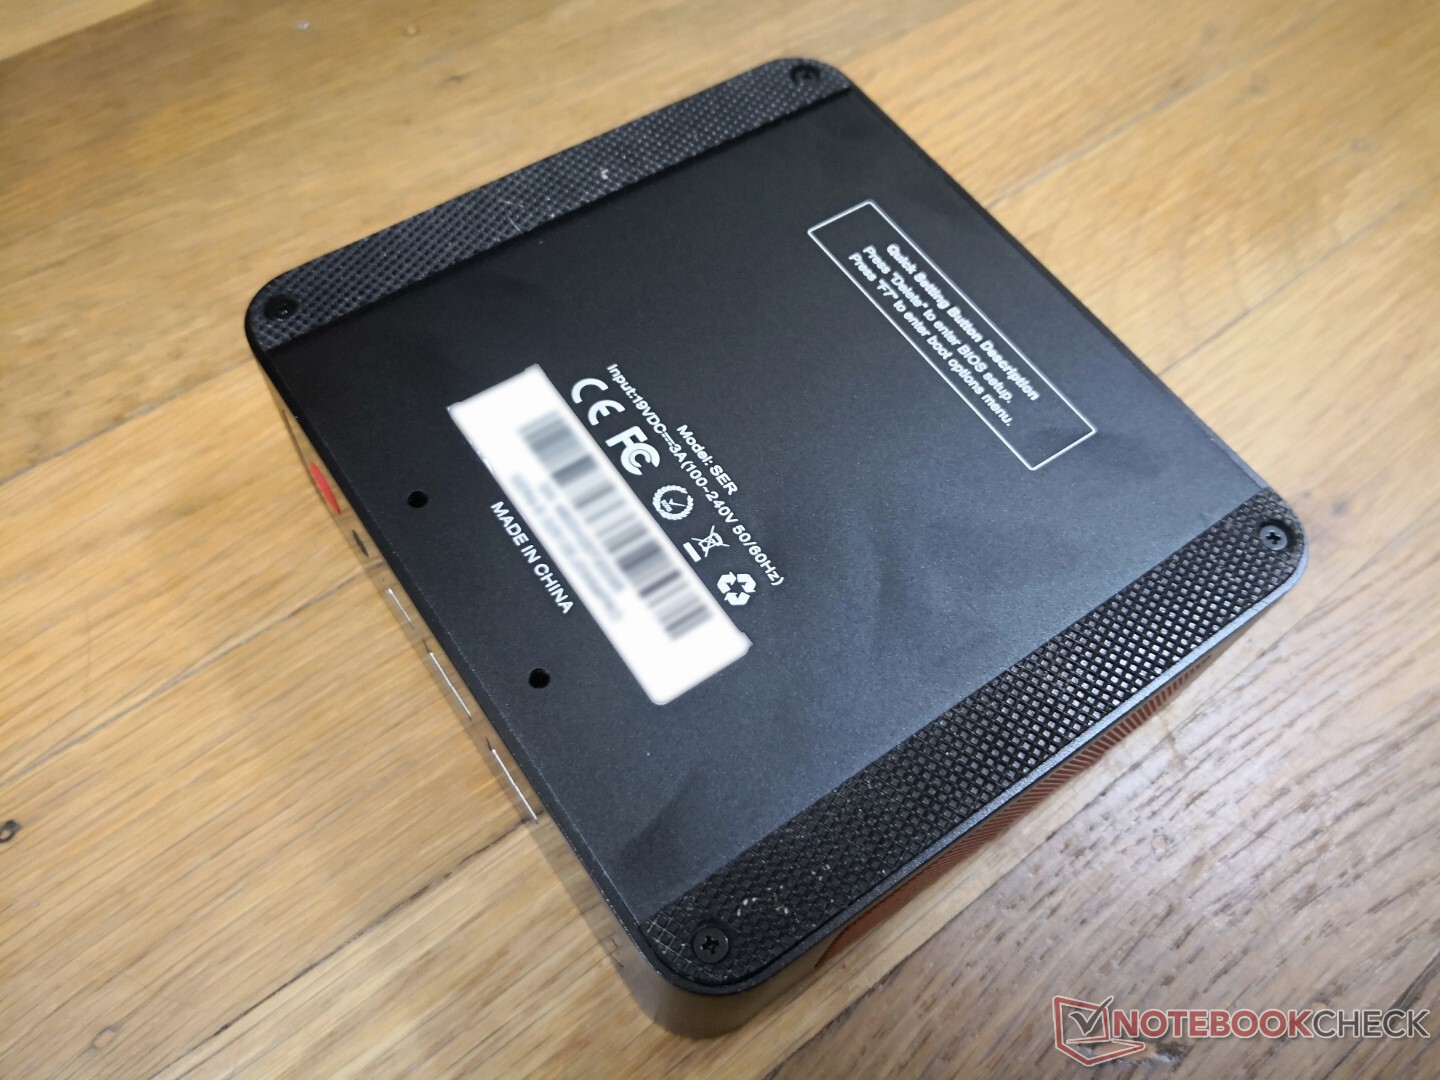
Il pannello inferiore è fissato da quattro viti Philips proprio come sul SER3. Tuttavia, il pannello sulla nostra unità SER4 era bloccato e difficile da rimuovere anche dopo aver svitato tutte le viti. Raccomandiamo di attaccare la piastra di montaggio come ancoraggio per afferrare ed estrarre più facilmente il pannello inferiore.
È interessante notare che la batteria del BIOS manca sul SER4 mentre era presente sul nostro SER3. È possibile che il produttore abbia spostato la batteria sull'altro lato della scheda madre per questa generazione.
Accessori e garanzia
La scatola di vendita include una staffa VESA rimovibile per il montaggio a parete, un adattatore AC, due cavi HDMI corti e un manuale. Si applica la garanzia limitata standard del produttore di un anno, rispetto ai tre anni della maggior parte dei sistemi Intel NUC.
Prestazioni - Più veloce della maggior parte dei mini PC della serie U
Condizioni di test
La nostra unità è stata impostata in modalità Performance tramite Windows prima di eseguire qualsiasi benchmark di prestazioni qui sotto.
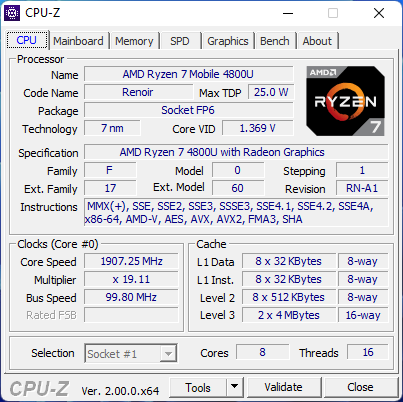
Processore - 8-Core 16-Thread U-Series CPU
Le prestazioni della CPU sono una delle più veloci di qualsiasi mini PC alimentato da una CPU della serie U e un importante aggiornamento rispetto al vecchio Ryzen 7-3750H nel SER3. Il sistema non mostra alcun comportamento di throttling importante, come esemplificato dai nostri risultati del test CineBench R15 xT loop qui sotto. Questo permette effettivamente al Ryzen 7 4800U nel nostro Beelink di superare il più recente Ryzen 7 5800U nel ThinkPad 13s.
Le prestazioni single-thread sono mediocri ma ancora molto buone nel complesso con risultati che sono vicini al Core i5-1135G7.
Cinebench R15 Multi Loop
Cinebench R23: Multi Core | Single Core
Cinebench R15: CPU Multi 64Bit | CPU Single 64Bit
Blender: v2.79 BMW27 CPU
7-Zip 18.03: 7z b 4 | 7z b 4 -mmt1
Geekbench 5.5: Multi-Core | Single-Core
HWBOT x265 Benchmark v2.2: 4k Preset
LibreOffice : 20 Documents To PDF
R Benchmark 2.5: Overall mean
| Cinebench R20 / CPU (Multi Core) | |
| Beelink GTR5 | |
| Beelink SER4 | |
| Media AMD Ryzen 7 4800U (2943 - 3306, n=4) | |
| Lenovo ThinkBook 13s G3 20YA0005GE | |
| Intel NUC11PAQi7 | |
| Intel NUC11TNKi5 | |
| Intel NUC10i5FNK | |
| Beelink SER3 | |
| Infinix INBook X2 | |
| GMK NucBox 3 | |
| Cinebench R20 / CPU (Single Core) | |
| Intel NUC11PAQi7 | |
| Beelink GTR5 | |
| Lenovo ThinkBook 13s G3 20YA0005GE | |
| Intel NUC11TNKi5 | |
| Beelink SER4 | |
| Media AMD Ryzen 7 4800U (474 - 488, n=4) | |
| Intel NUC10i5FNK | |
| Infinix INBook X2 | |
| Beelink SER3 | |
| GMK NucBox 3 | |
| Cinebench R23 / Multi Core | |
| Beelink GTR5 | |
| Media AMD Ryzen 7 4800U (7558 - 9762, n=3) | |
| Beelink SER4 | |
| Lenovo ThinkBook 13s G3 20YA0005GE | |
| Intel NUC11PAQi7 | |
| Intel NUC11TNKi5 | |
| Beelink SER3 | |
| Infinix INBook X2 | |
| GMK NucBox 3 | |
| Cinebench R23 / Single Core | |
| Beelink GTR5 | |
| Lenovo ThinkBook 13s G3 20YA0005GE | |
| Intel NUC11TNKi5 | |
| Beelink SER4 | |
| Media AMD Ryzen 7 4800U (1231 - 1240, n=3) | |
| Infinix INBook X2 | |
| Beelink SER3 | |
| GMK NucBox 3 | |
| Cinebench R15 / CPU Multi 64Bit | |
| Beelink GTR5 | |
| Lenovo ThinkBook 13s G3 20YA0005GE | |
| Lenovo ThinkBook 13s G3 20YA0005GE | |
| Media AMD Ryzen 7 4800U (1281 - 1639, n=3) | |
| Beelink SER4 | |
| Intel NUC11PAQi7 | |
| Intel NUC11TNKi5 | |
| Intel NUC10i5FNK | |
| Beelink SER3 | |
| Infinix INBook X2 | |
| GMK NucBox 3 | |
| Cinebench R15 / CPU Single 64Bit | |
| Beelink GTR5 | |
| Intel NUC11PAQi7 | |
| Lenovo ThinkBook 13s G3 20YA0005GE | |
| Intel NUC11TNKi5 | |
| Beelink SER4 | |
| Media AMD Ryzen 7 4800U (182 - 187, n=3) | |
| Intel NUC10i5FNK | |
| Infinix INBook X2 | |
| Beelink SER3 | |
| GMK NucBox 3 | |
| Blender / v2.79 BMW27 CPU | |
| GMK NucBox 3 | |
| Infinix INBook X2 | |
| Beelink SER3 | |
| Intel NUC11TNKi5 | |
| Intel NUC10i5FNK | |
| Intel NUC11PAQi7 | |
| Lenovo ThinkBook 13s G3 20YA0005GE | |
| Media AMD Ryzen 7 4800U (322 - 374, n=3) | |
| Beelink SER4 | |
| Beelink GTR5 | |
| 7-Zip 18.03 / 7z b 4 | |
| Beelink GTR5 | |
| Media AMD Ryzen 7 4800U (38654 - 44804, n=3) | |
| Beelink SER4 | |
| Lenovo ThinkBook 13s G3 20YA0005GE | |
| Intel NUC11PAQi7 | |
| Intel NUC11TNKi5 | |
| Intel NUC10i5FNK | |
| Beelink SER3 | |
| Infinix INBook X2 | |
| GMK NucBox 3 | |
| 7-Zip 18.03 / 7z b 4 -mmt1 | |
| Beelink GTR5 | |
| Intel NUC11PAQi7 | |
| Lenovo ThinkBook 13s G3 20YA0005GE | |
| Intel NUC11TNKi5 | |
| Beelink SER4 | |
| Media AMD Ryzen 7 4800U (4420 - 4603, n=3) | |
| Intel NUC10i5FNK | |
| Beelink SER3 | |
| Infinix INBook X2 | |
| GMK NucBox 3 | |
| Geekbench 5.5 / Multi-Core | |
| Beelink GTR5 | |
| Lenovo ThinkBook 13s G3 20YA0005GE | |
| Beelink SER4 | |
| Media AMD Ryzen 7 4800U (5798 - 6950, n=4) | |
| Intel NUC11PAQi7 | |
| Intel NUC11TNKi5 | |
| Intel NUC10i5FNK | |
| Infinix INBook X2 | |
| GMK NucBox 3 | |
| Geekbench 5.5 / Single-Core | |
| Beelink GTR5 | |
| Intel NUC11PAQi7 | |
| Lenovo ThinkBook 13s G3 20YA0005GE | |
| Intel NUC11TNKi5 | |
| Beelink SER4 | |
| Infinix INBook X2 | |
| Media AMD Ryzen 7 4800U (1150 - 1192, n=4) | |
| Intel NUC10i5FNK | |
| GMK NucBox 3 | |
| HWBOT x265 Benchmark v2.2 / 4k Preset | |
| Beelink GTR5 | |
| Beelink SER4 | |
| Media AMD Ryzen 7 4800U (9.48 - 10.8, n=3) | |
| Lenovo ThinkBook 13s G3 20YA0005GE | |
| Intel NUC11PAQi7 | |
| Intel NUC11TNKi5 | |
| Intel NUC10i5FNK | |
| Infinix INBook X2 | |
| Beelink SER3 | |
| GMK NucBox 3 | |
| LibreOffice / 20 Documents To PDF | |
| GMK NucBox 3 | |
| Beelink SER3 | |
| Infinix INBook X2 | |
| Beelink SER4 | |
| Media AMD Ryzen 7 4800U (57.8 - 62.6, n=3) | |
| Intel NUC11TNKi5 | |
| Lenovo ThinkBook 13s G3 20YA0005GE | |
| Beelink GTR5 | |
| Intel NUC11PAQi7 | |
| R Benchmark 2.5 / Overall mean | |
| GMK NucBox 3 | |
| Infinix INBook X2 | |
| Beelink SER3 | |
| Intel NUC10i5FNK | |
| Intel NUC11TNKi5 | |
| Media AMD Ryzen 7 4800U (0.576 - 0.613, n=3) | |
| Beelink SER4 | |
| Intel NUC11PAQi7 | |
| Lenovo ThinkBook 13s G3 20YA0005GE | |
| Beelink GTR5 | |
* ... Meglio usare valori piccoli
AIDA64: FP32 Ray-Trace | FPU Julia | CPU SHA3 | CPU Queen | FPU SinJulia | FPU Mandel | CPU AES | CPU ZLib | FP64 Ray-Trace | CPU PhotoWorxx
| Performance rating | |
| Beelink GTR5 | |
| Beelink SER4 | |
| Media AMD Ryzen 7 4800U | |
| Beelink SER3 | |
| GMK NucBox 3 | |
| AIDA64 / FP32 Ray-Trace | |
| Beelink GTR5 | |
| Beelink SER4 | |
| Media AMD Ryzen 7 4800U (9268 - 10046, n=2) | |
| Beelink SER3 | |
| GMK NucBox 3 | |
| AIDA64 / FPU Julia | |
| Beelink GTR5 | |
| Beelink SER4 | |
| Media AMD Ryzen 7 4800U (53257 - 56388, n=2) | |
| Beelink SER3 | |
| GMK NucBox 3 | |
| AIDA64 / CPU SHA3 | |
| Beelink GTR5 | |
| Beelink SER4 | |
| Media AMD Ryzen 7 4800U (1732 - 1840, n=2) | |
| Beelink SER3 | |
| GMK NucBox 3 | |
| AIDA64 / CPU Queen | |
| Beelink GTR5 | |
| Beelink SER4 | |
| Media AMD Ryzen 7 4800U (77333 - 78511, n=2) | |
| Beelink SER3 | |
| GMK NucBox 3 | |
| AIDA64 / FPU SinJulia | |
| Beelink GTR5 | |
| Beelink SER4 | |
| Media AMD Ryzen 7 4800U (11293 - 11799, n=2) | |
| Beelink SER3 | |
| GMK NucBox 3 | |
| AIDA64 / FPU Mandel | |
| Beelink GTR5 | |
| Beelink SER4 | |
| Media AMD Ryzen 7 4800U (27938 - 28667, n=2) | |
| Beelink SER3 | |
| GMK NucBox 3 | |
| AIDA64 / CPU AES | |
| Beelink GTR5 | |
| Beelink SER4 | |
| Media AMD Ryzen 7 4800U (52147 - 54686, n=2) | |
| Beelink SER3 | |
| GMK NucBox 3 | |
| AIDA64 / CPU ZLib | |
| Beelink GTR5 | |
| Beelink SER4 | |
| Media AMD Ryzen 7 4800U (580 - 593, n=2) | |
| Beelink SER3 | |
| GMK NucBox 3 | |
| AIDA64 / FP64 Ray-Trace | |
| Beelink GTR5 | |
| Beelink SER4 | |
| Media AMD Ryzen 7 4800U (4877 - 5555, n=2) | |
| Beelink SER3 | |
| GMK NucBox 3 | |
| AIDA64 / CPU PhotoWorxx | |
| Beelink SER4 | |
| Media AMD Ryzen 7 4800U (22818 - 24254, n=2) | |
| Beelink GTR5 | |
| Beelink SER3 | |
| GMK NucBox 3 | |
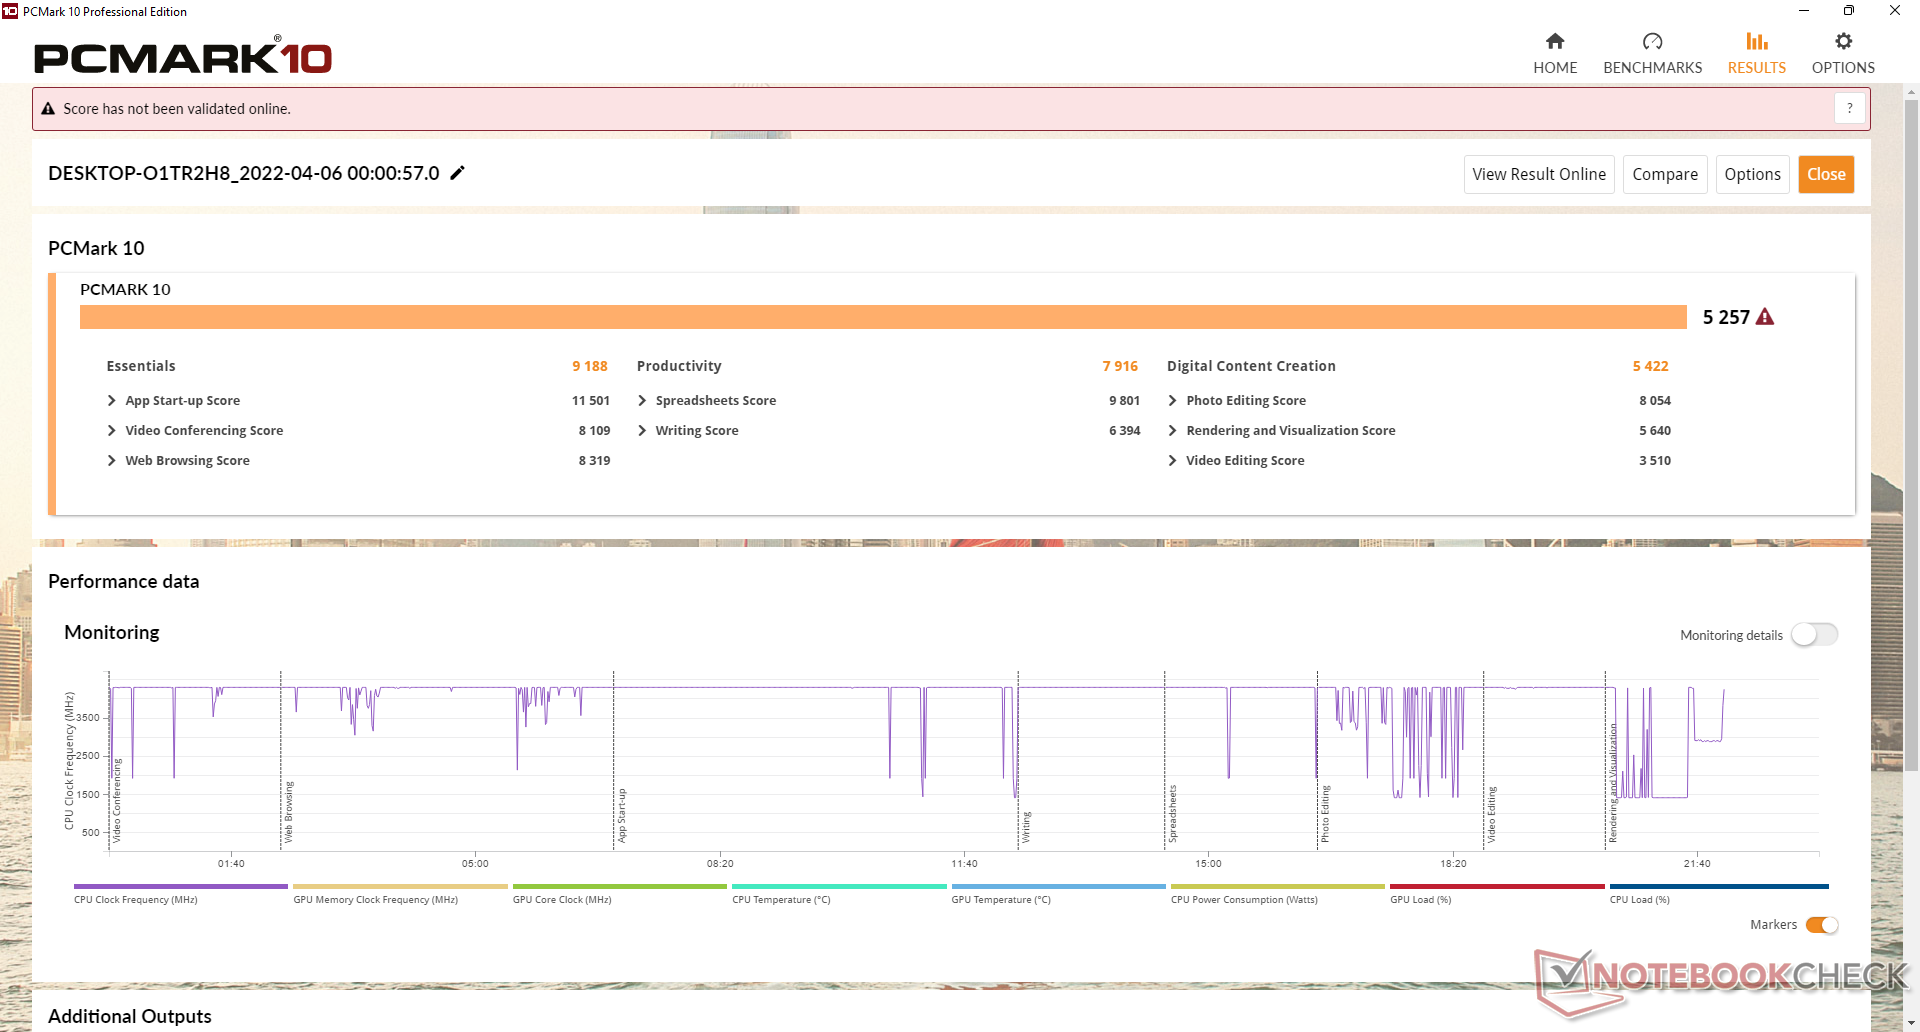
Prestazioni del sistema
I risultati di PCMark 10 sono alla pari se non leggermente superiori a quelli dell'Intel NUC 11 che gira su un Core i7-1165G7 di 11a generazione. Abbiamo il sospetto che il modello Intel avrebbe potuto ottenere un punteggio ancora più alto, tuttavia, se la nostra unità di test Intel non fosse stata limitata alla memoria a canale singolo.
CrossMark: Overall | Productivity | Creativity | Responsiveness
| PCMark 10 / Score | |
| Beelink GTR5 | |
| Media AMD Ryzen 7 4800U, AMD Radeon RX Vega 8 (Ryzen 4000/5000) (5233 - 5383, n=3) | |
| Beelink SER4 | |
| Intel NUC11PAQi7 | |
| Intel NUC10i5FNK | |
| Beelink SER3 | |
| GMK NucBox 3 | |
| PCMark 10 / Essentials | |
| Beelink GTR5 | |
| Intel NUC11PAQi7 | |
| Media AMD Ryzen 7 4800U, AMD Radeon RX Vega 8 (Ryzen 4000/5000) (9188 - 9637, n=3) | |
| Beelink SER4 | |
| Intel NUC10i5FNK | |
| Beelink SER3 | |
| GMK NucBox 3 | |
| PCMark 10 / Productivity | |
| Beelink GTR5 | |
| Beelink SER4 | |
| Media AMD Ryzen 7 4800U, AMD Radeon RX Vega 8 (Ryzen 4000/5000) (7631 - 8091, n=3) | |
| Intel NUC11PAQi7 | |
| Intel NUC10i5FNK | |
| Beelink SER3 | |
| GMK NucBox 3 | |
| PCMark 10 / Digital Content Creation | |
| Beelink GTR5 | |
| Media AMD Ryzen 7 4800U, AMD Radeon RX Vega 8 (Ryzen 4000/5000) (5123 - 5758, n=3) | |
| Beelink SER4 | |
| Intel NUC11PAQi7 | |
| Beelink SER3 | |
| Intel NUC10i5FNK | |
| GMK NucBox 3 | |
| CrossMark / Overall | |
| Beelink GTR5 | |
| CrossMark / Productivity | |
| Beelink GTR5 | |
| CrossMark / Creativity | |
| Beelink GTR5 | |
| CrossMark / Responsiveness | |
| Beelink GTR5 | |
| PCMark 10 Score | 5257 punti | |
Aiuto | ||
| AIDA64 / Memory Copy | |
| Beelink GTR5 | |
| Media AMD Ryzen 7 4800U (37086 - 40961, n=2) | |
| Beelink SER4 | |
| Beelink SER3 | |
| GMK NucBox 3 | |
| AIDA64 / Memory Read | |
| Beelink GTR5 | |
| Media AMD Ryzen 7 4800U (44706 - 46406, n=2) | |
| Beelink SER4 | |
| Beelink SER3 | |
| GMK NucBox 3 | |
| AIDA64 / Memory Write | |
| Beelink SER4 | |
| Media AMD Ryzen 7 4800U (42240 - 43768, n=2) | |
| Beelink GTR5 | |
| Beelink SER3 | |
| GMK NucBox 3 | |
| AIDA64 / Memory Latency | |
| Media AMD Ryzen 7 4800U (94.7 - 115, n=2) | |
| Beelink SER3 | |
| Beelink SER4 | |
| GMK NucBox 3 | |
| Beelink GTR5 | |
* ... Meglio usare valori piccoli
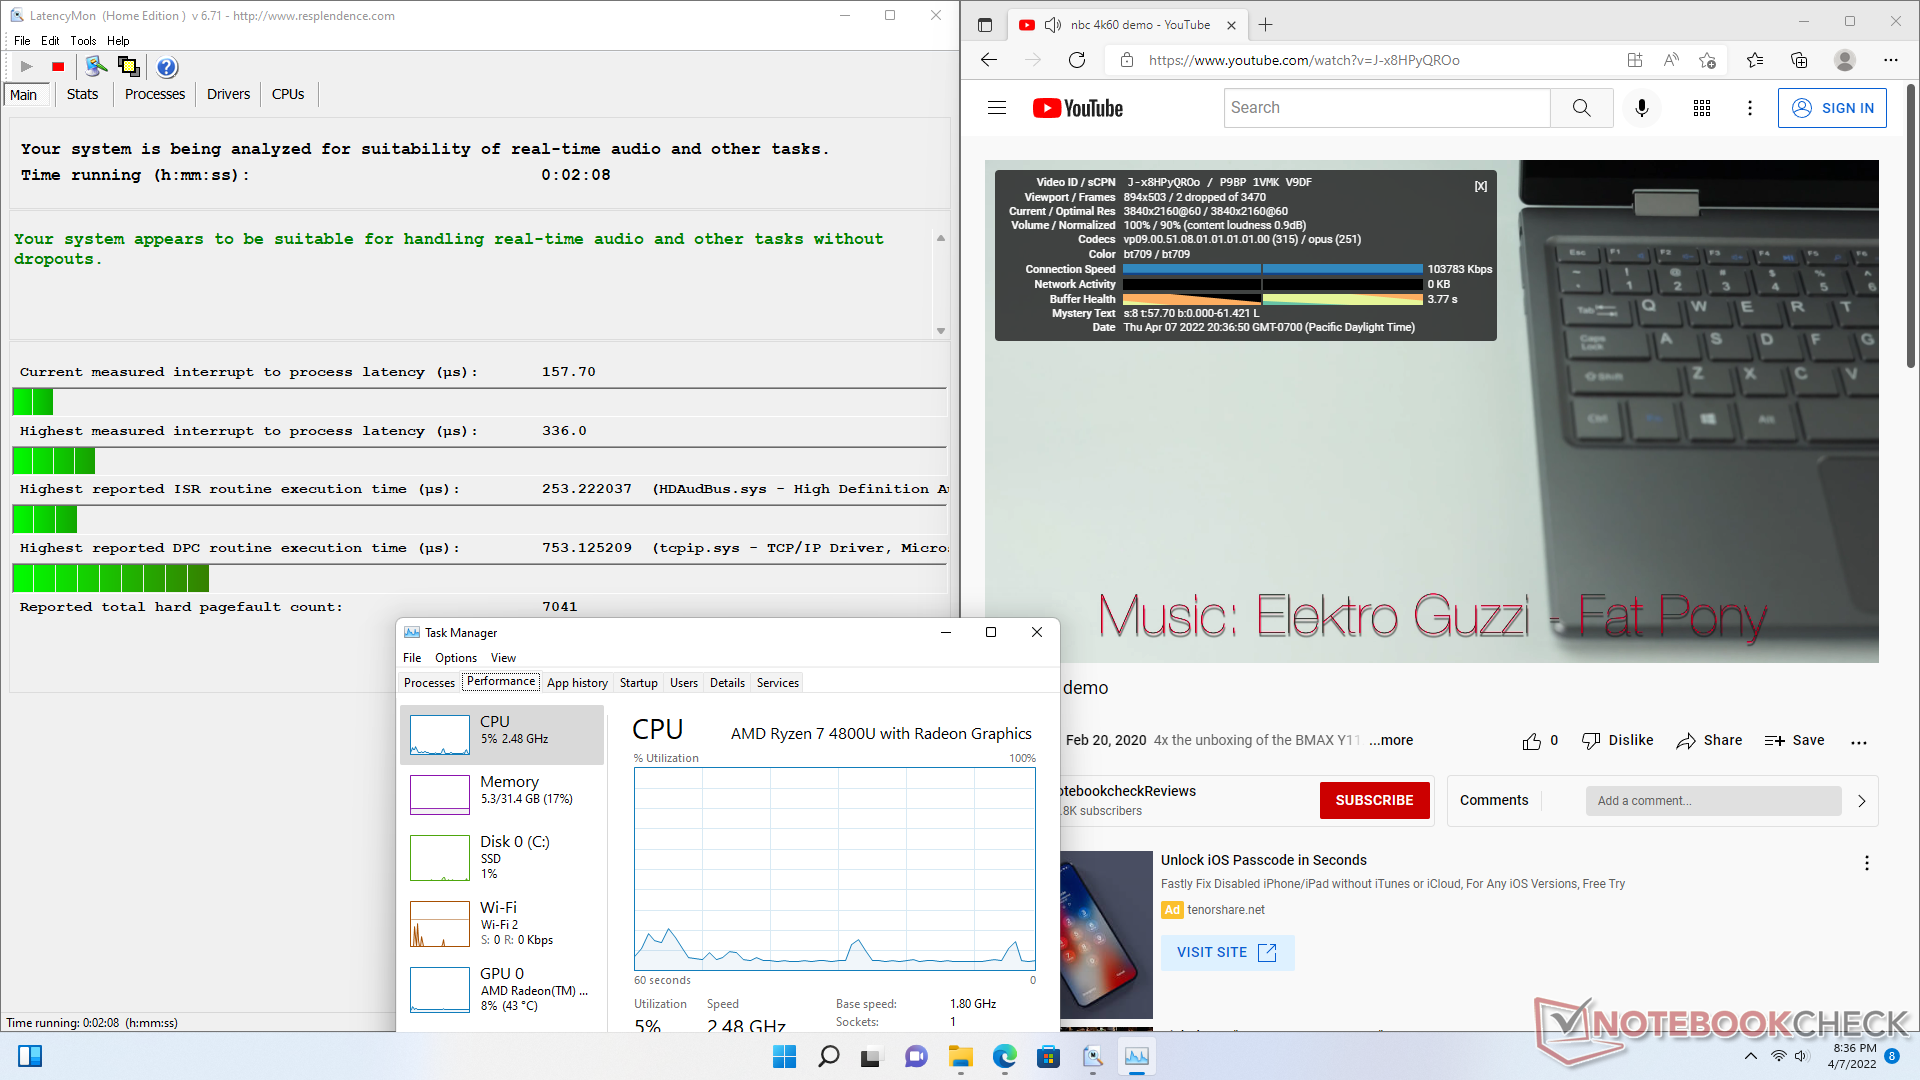
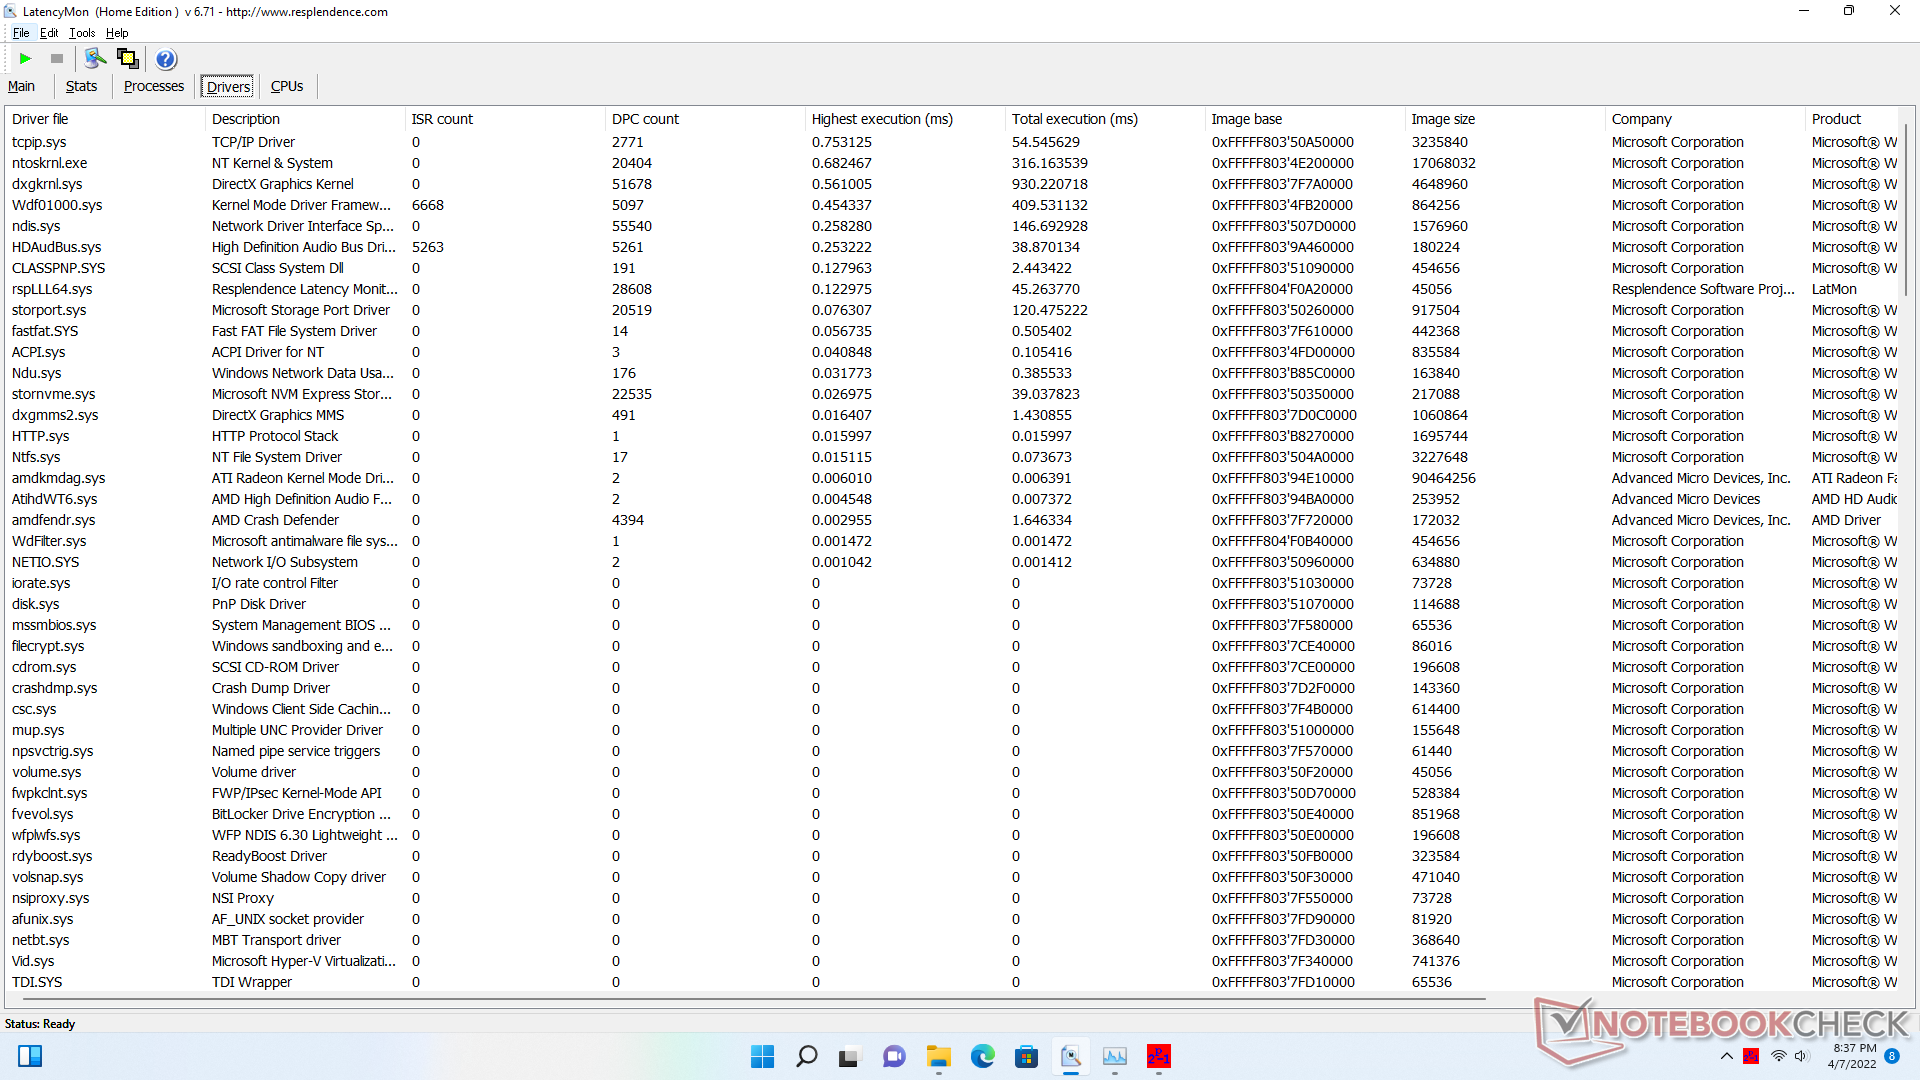
Latenza DPC
LatencyMon non rivela problemi di DPC quando si aprono più schede del browser sulla nostra homepage. la riproduzione di video 4K a 60 FPS è quasi perfetta con solo 2 fotogrammi persi durante il nostro video di un minuto.
| DPC Latencies / LatencyMon - interrupt to process latency (max), Web, Youtube, Prime95 | |
| GMK NucBox 3 | |
| Beelink SER3 | |
| Intel NUC11PAQi7 | |
| Beelink SER4 | |
| Beelink GTR5 | |
* ... Meglio usare valori piccoli
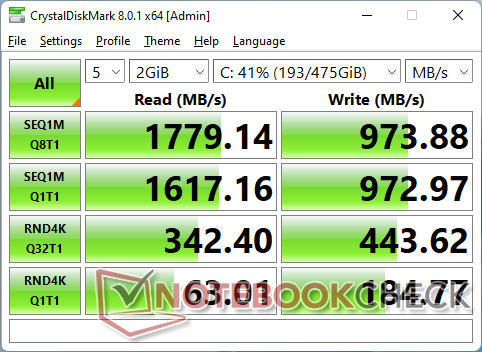
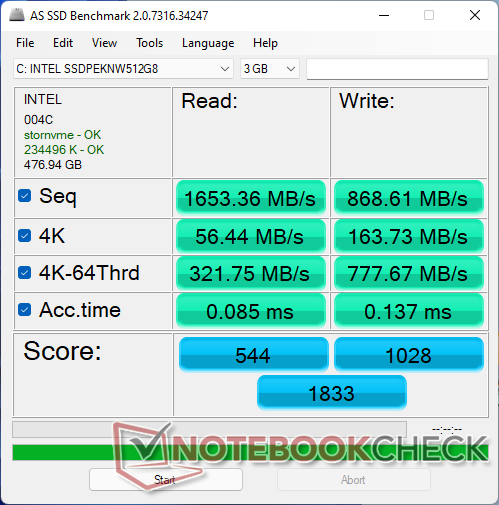
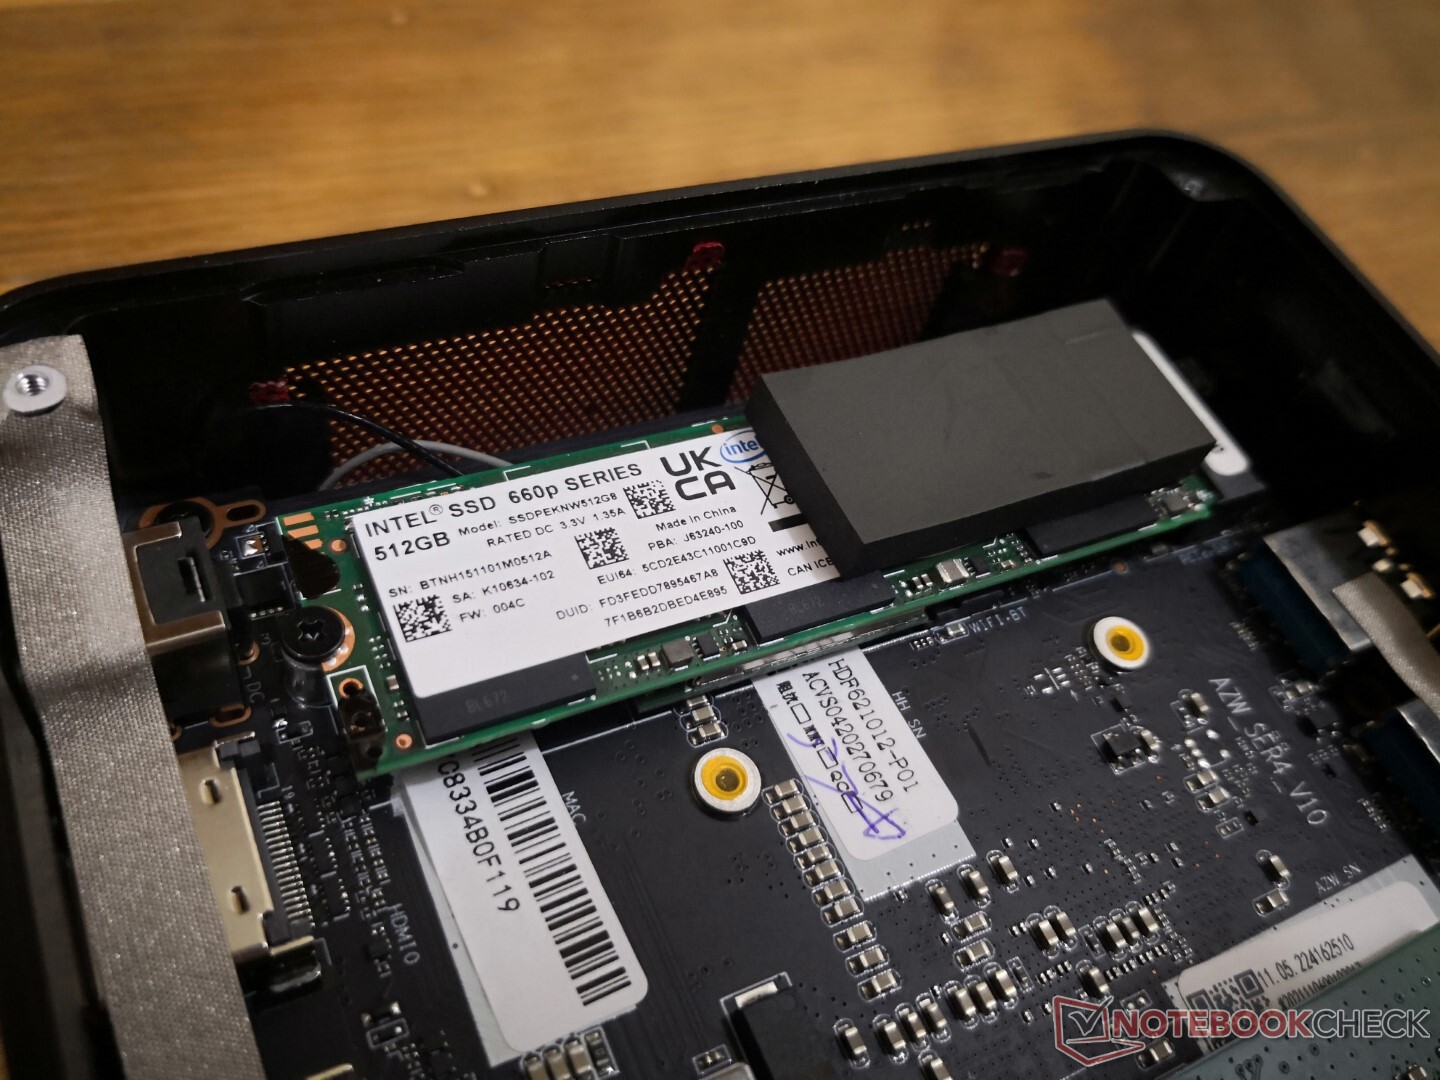
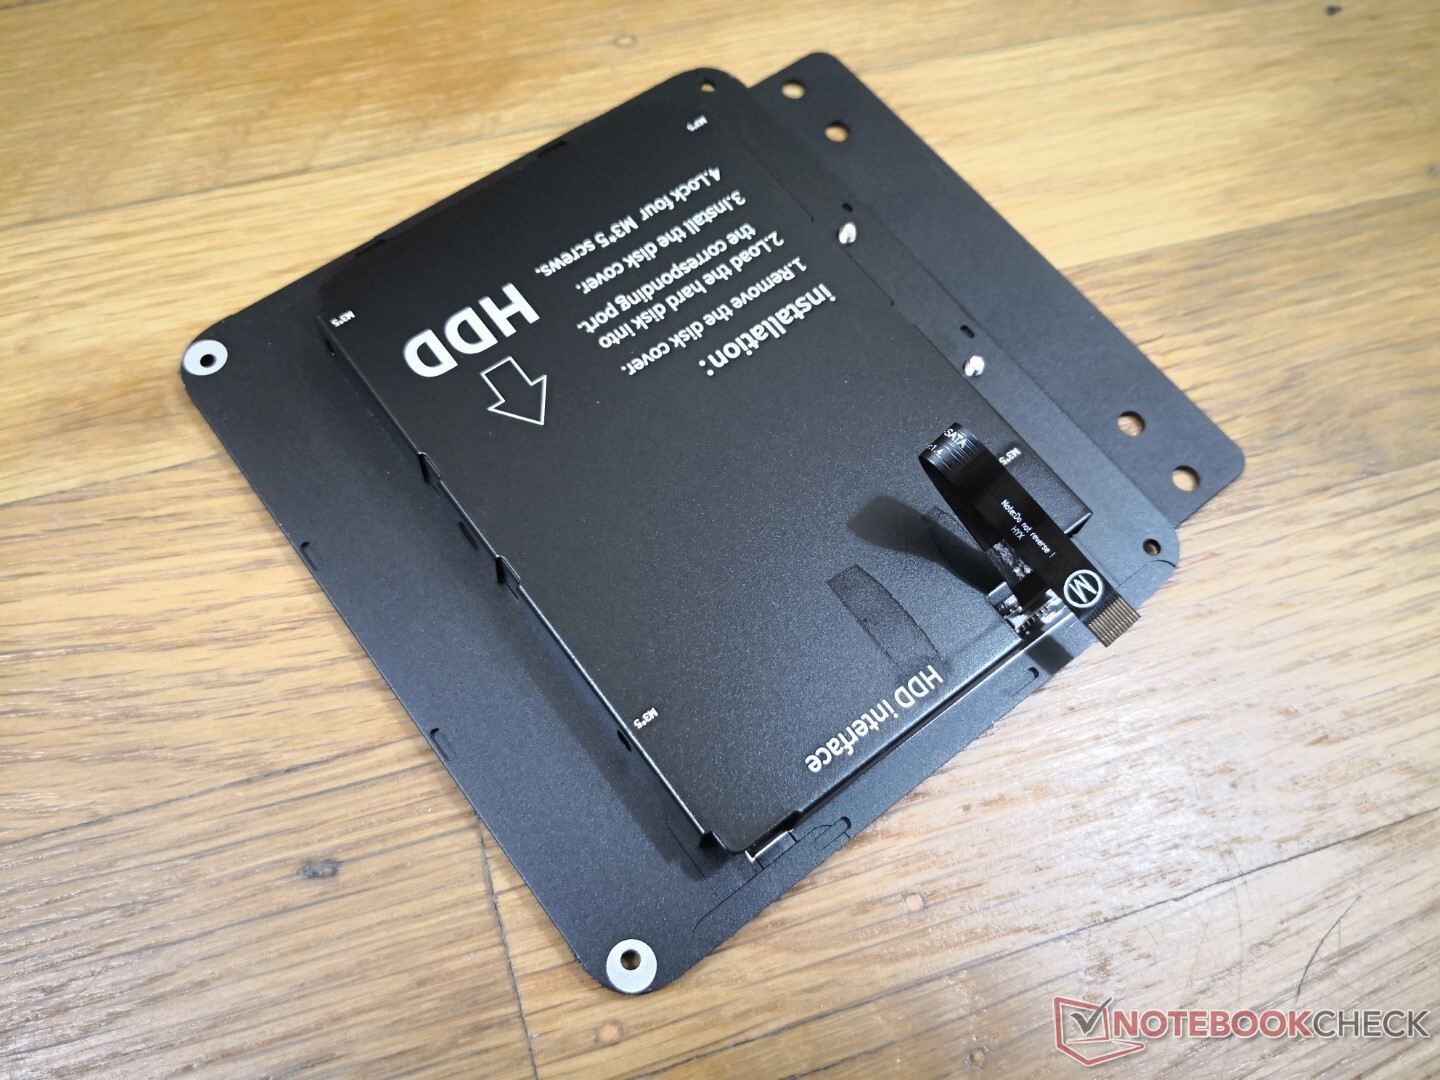
Dispositivi di archiviazione - PCIe3 x4 + 2,5 pollici SATA III
La nostra unità di test include un Intel SSD 660p che è un SSD NVMe PCIe3 x4 economico. I tassi di lettura sequenziale raggiungono solo circa 1400 MB/s rispetto a >3000 MB/s o >7000 MB/s su unità PCIe3 o PCIe4 di fascia alta, rispettivamente. Per il pubblico target, tuttavia, l'Intel 660p sarà sufficiente.

| Drive Performance rating - Percent | |
| Intel NUC11PAQi7 | |
| Beelink GTR5 | |
| Beelink SER4 | |
| Beelink SER3 | |
| Intel NUC10i5FNK | |
| GMK NucBox 3 | |
* ... Meglio usare valori piccoli
Disk Throttling: DiskSpd Read Loop, Queue Depth 8
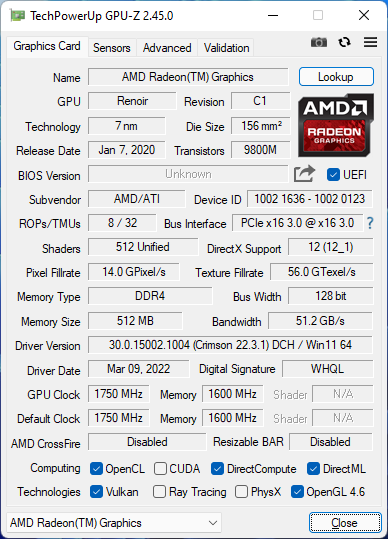
Prestazioni della GPU - Collo a collo con l'Iris Xe 80 EUs
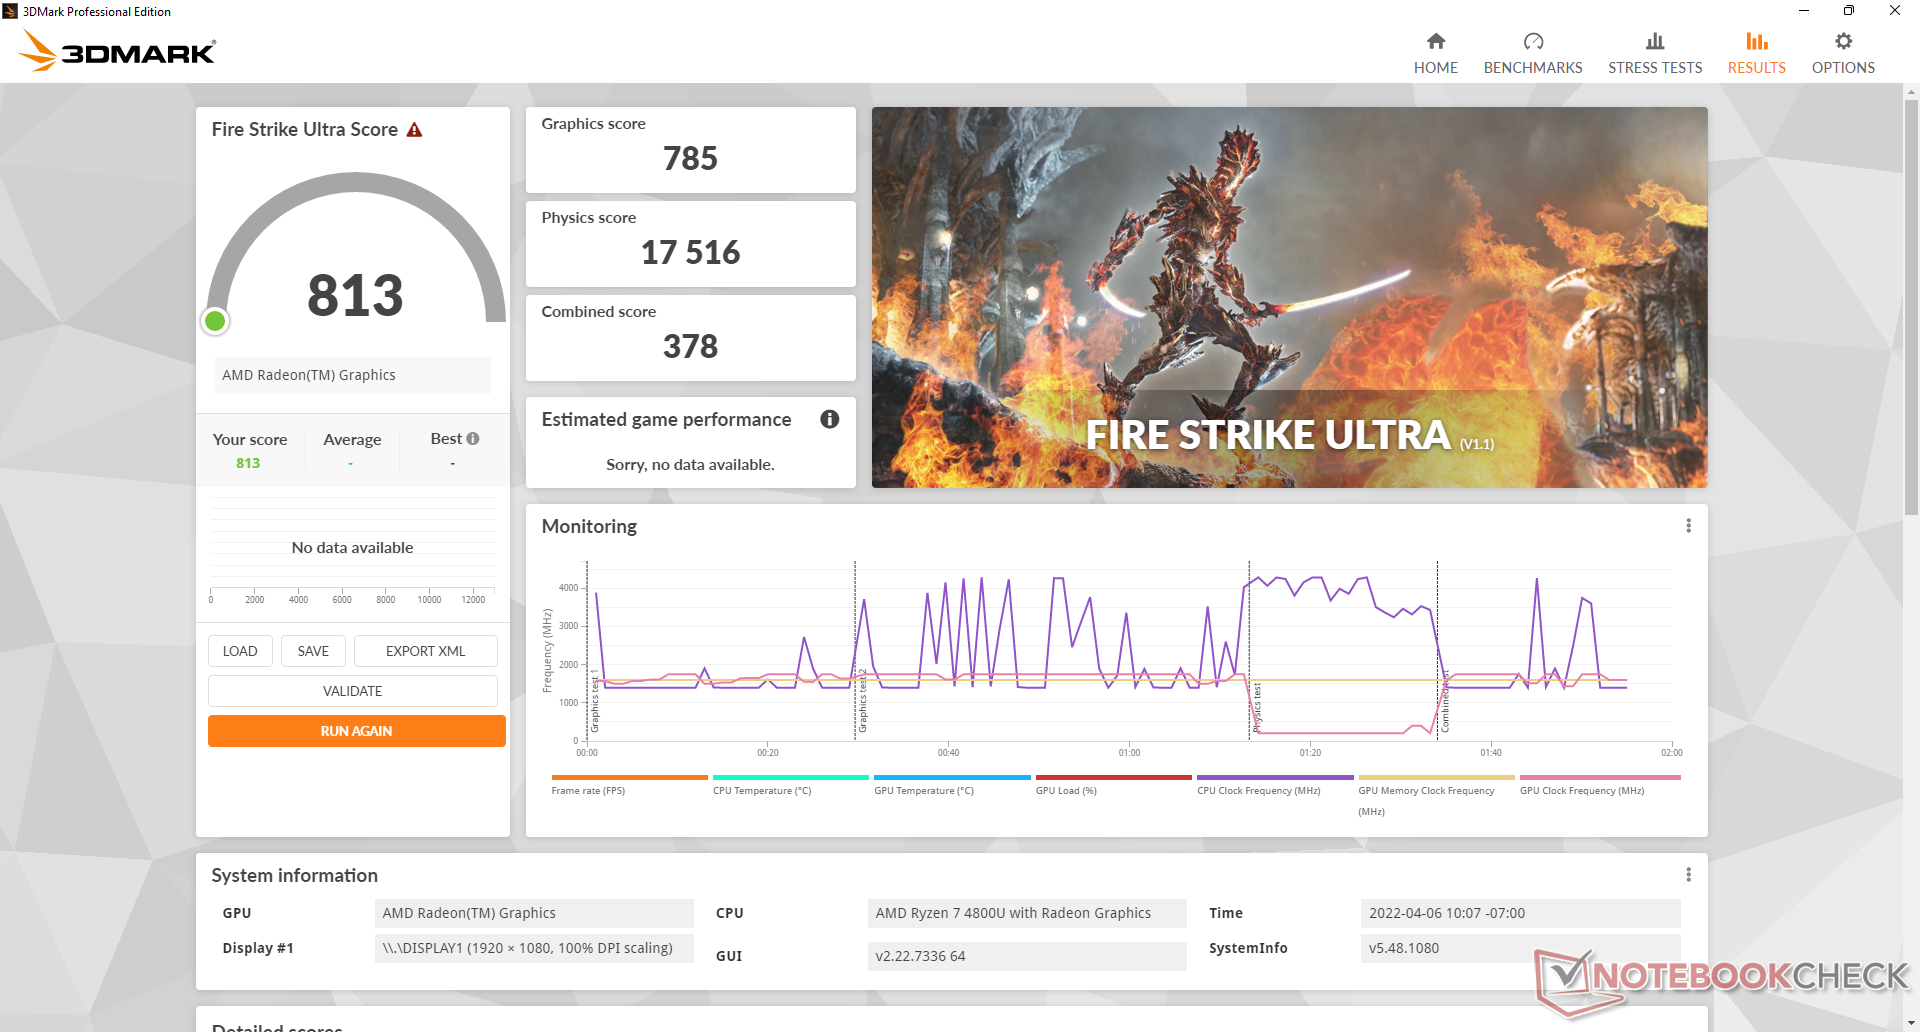
L'integrato Radeon Vega 8 La GPU è ancora molto buona nonostante sia vecchia di una o due generazioni. i risultati di 3DMark sono dal 20 al 30% più lenti della concorrente Iris Xe 96 EU in esecuzione su RAM dual-channel o circa dal 5 al 20 per cento più veloce se detta GPU Intel fosse invece in esecuzione su RAM single-channel. Aspettarsi oltre 30 FPS in impostazioni basse di 1080p o 720p non è irragionevole a seconda del titolo.
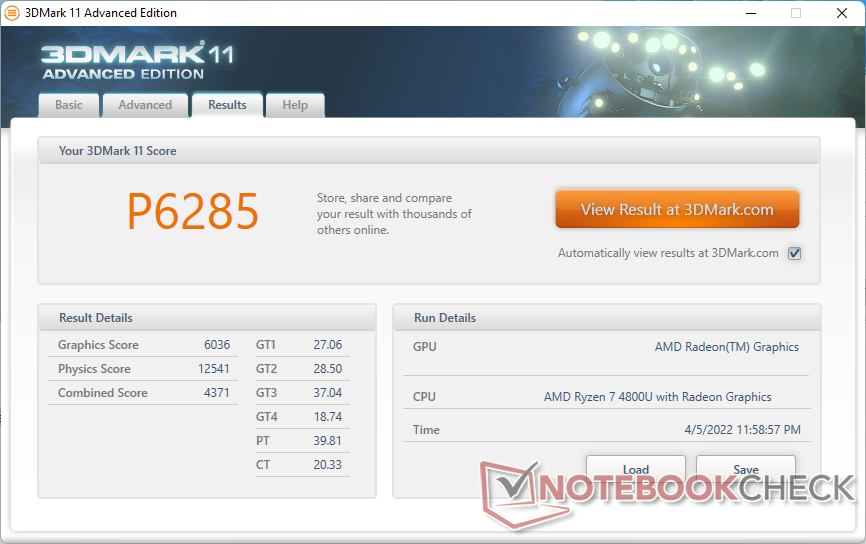
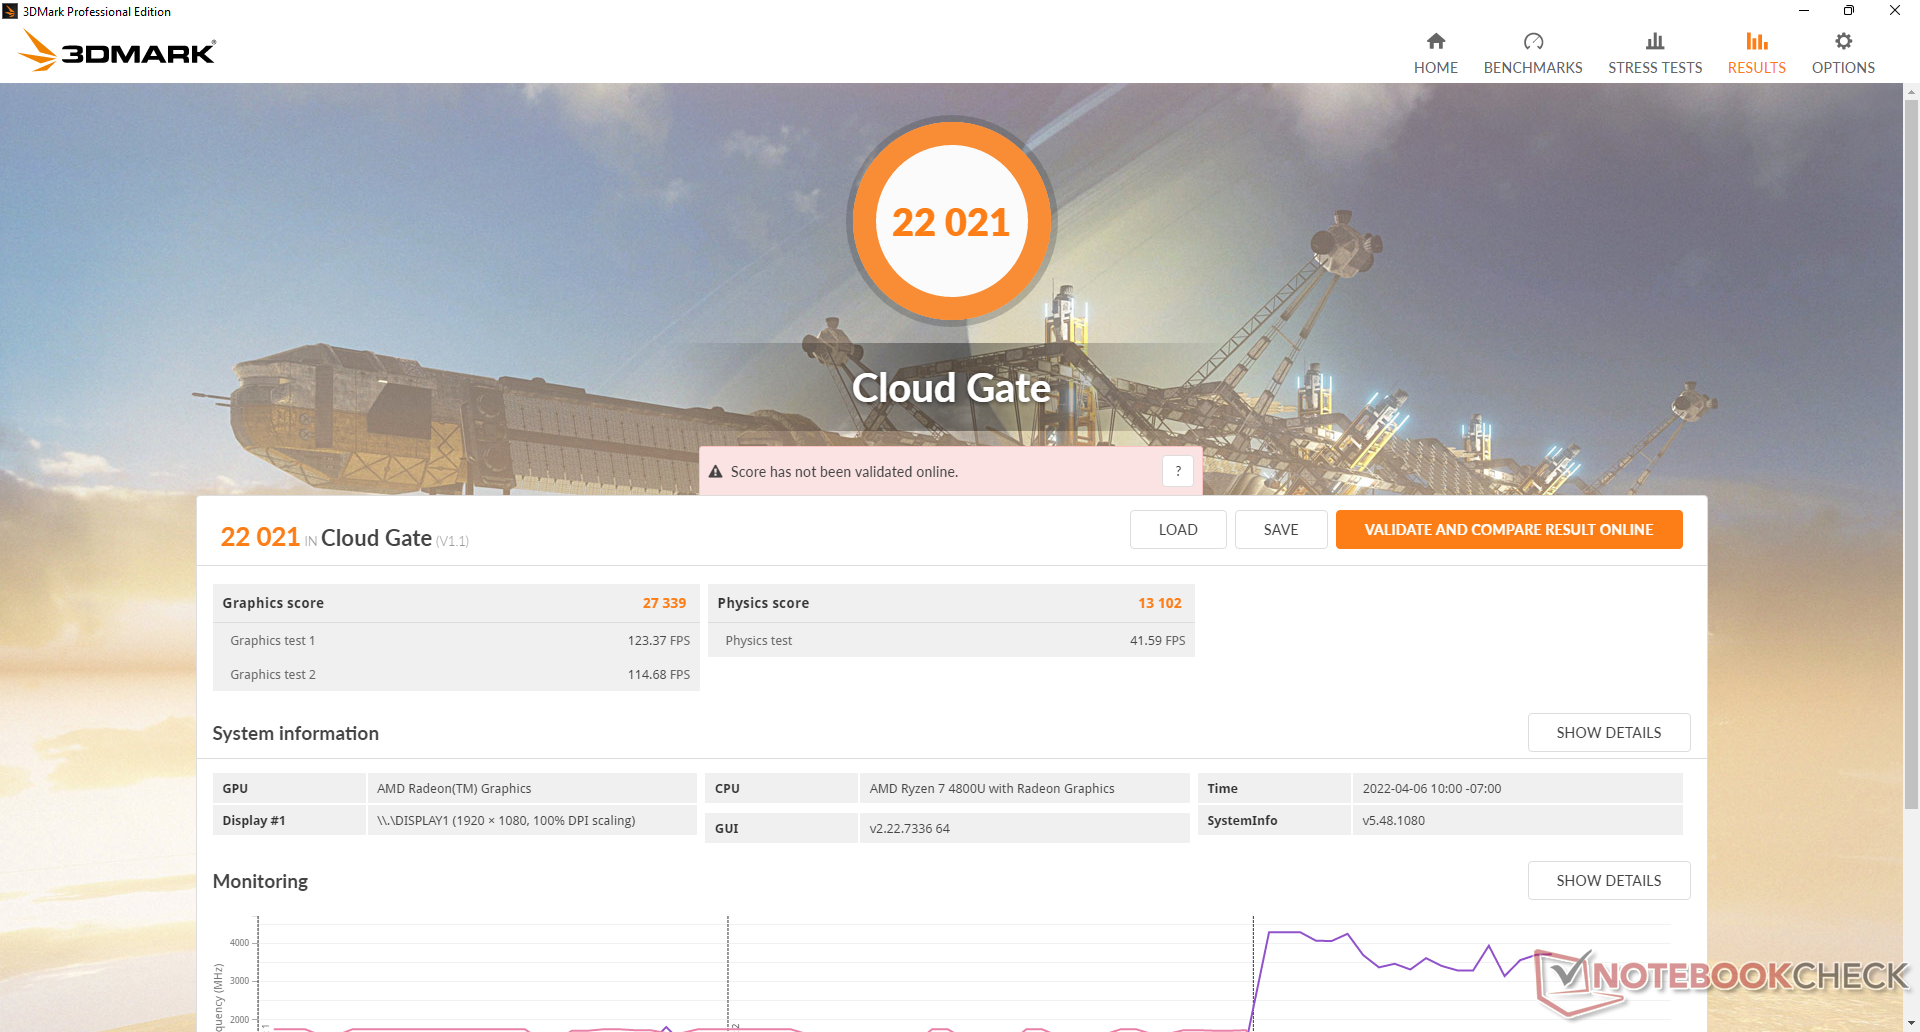
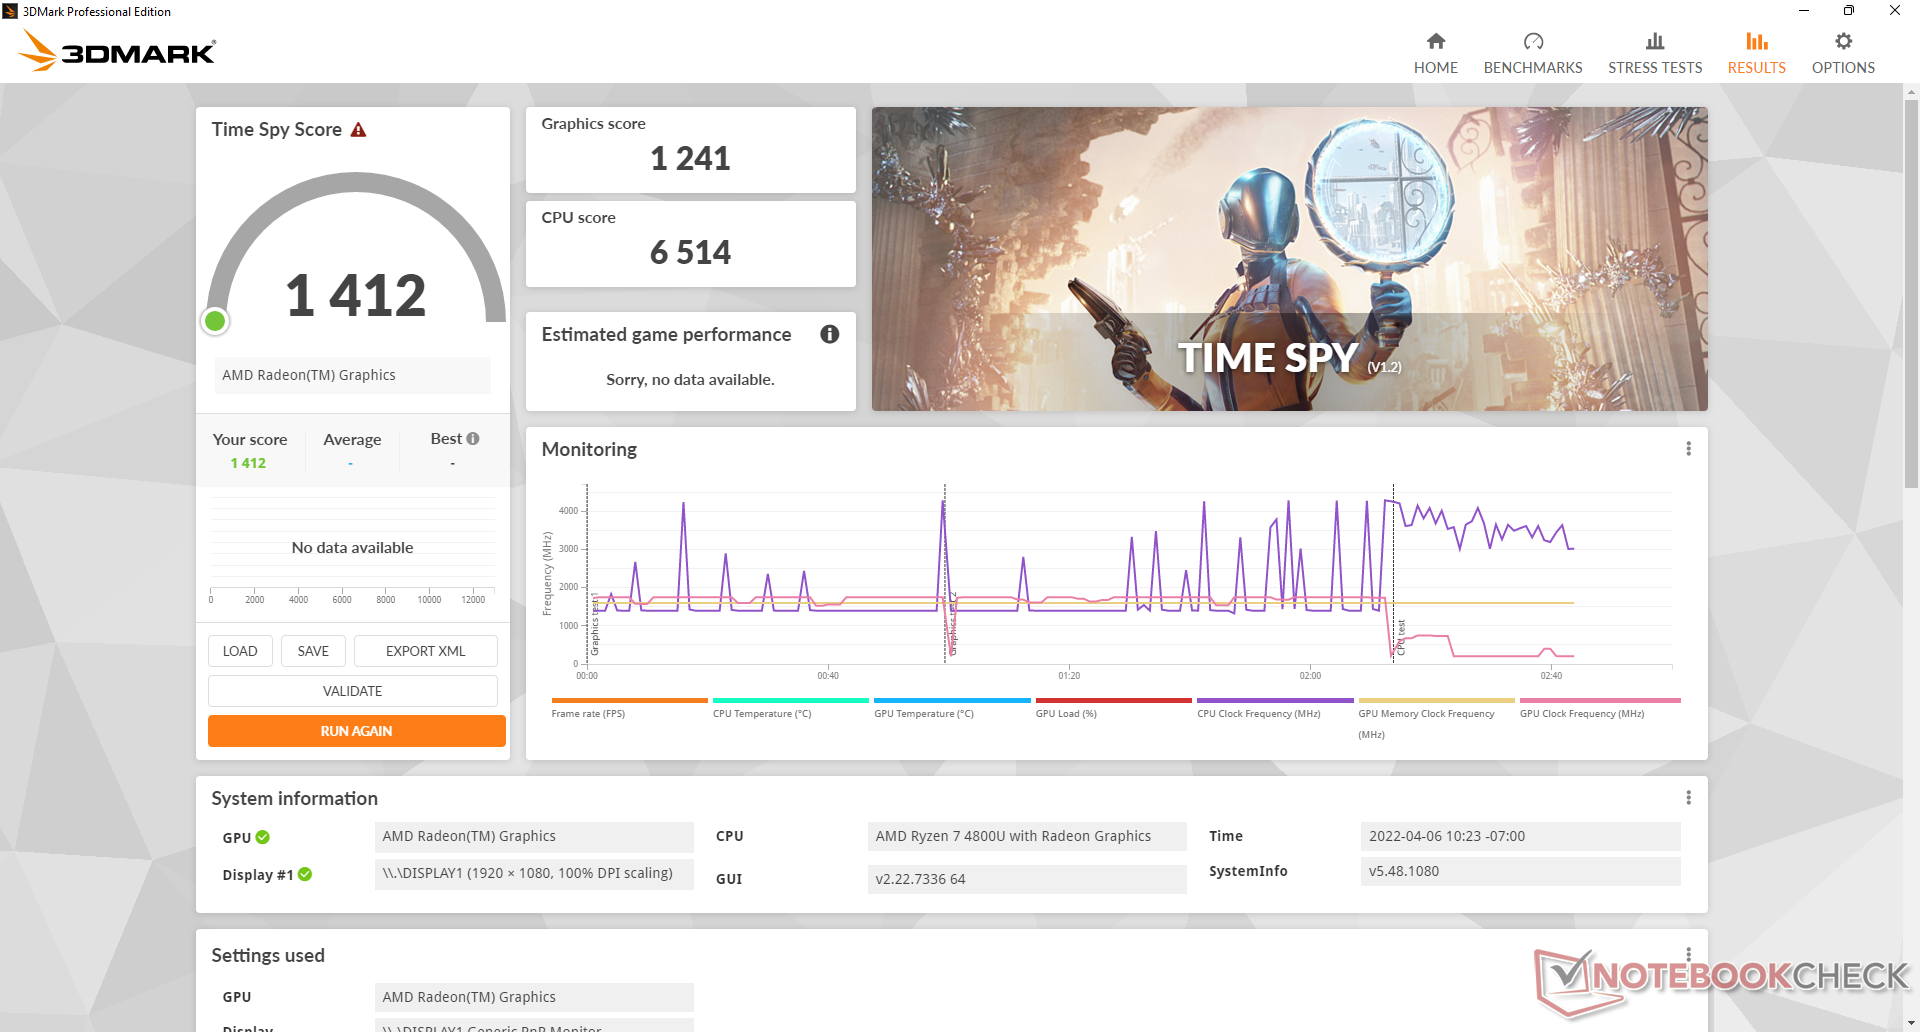
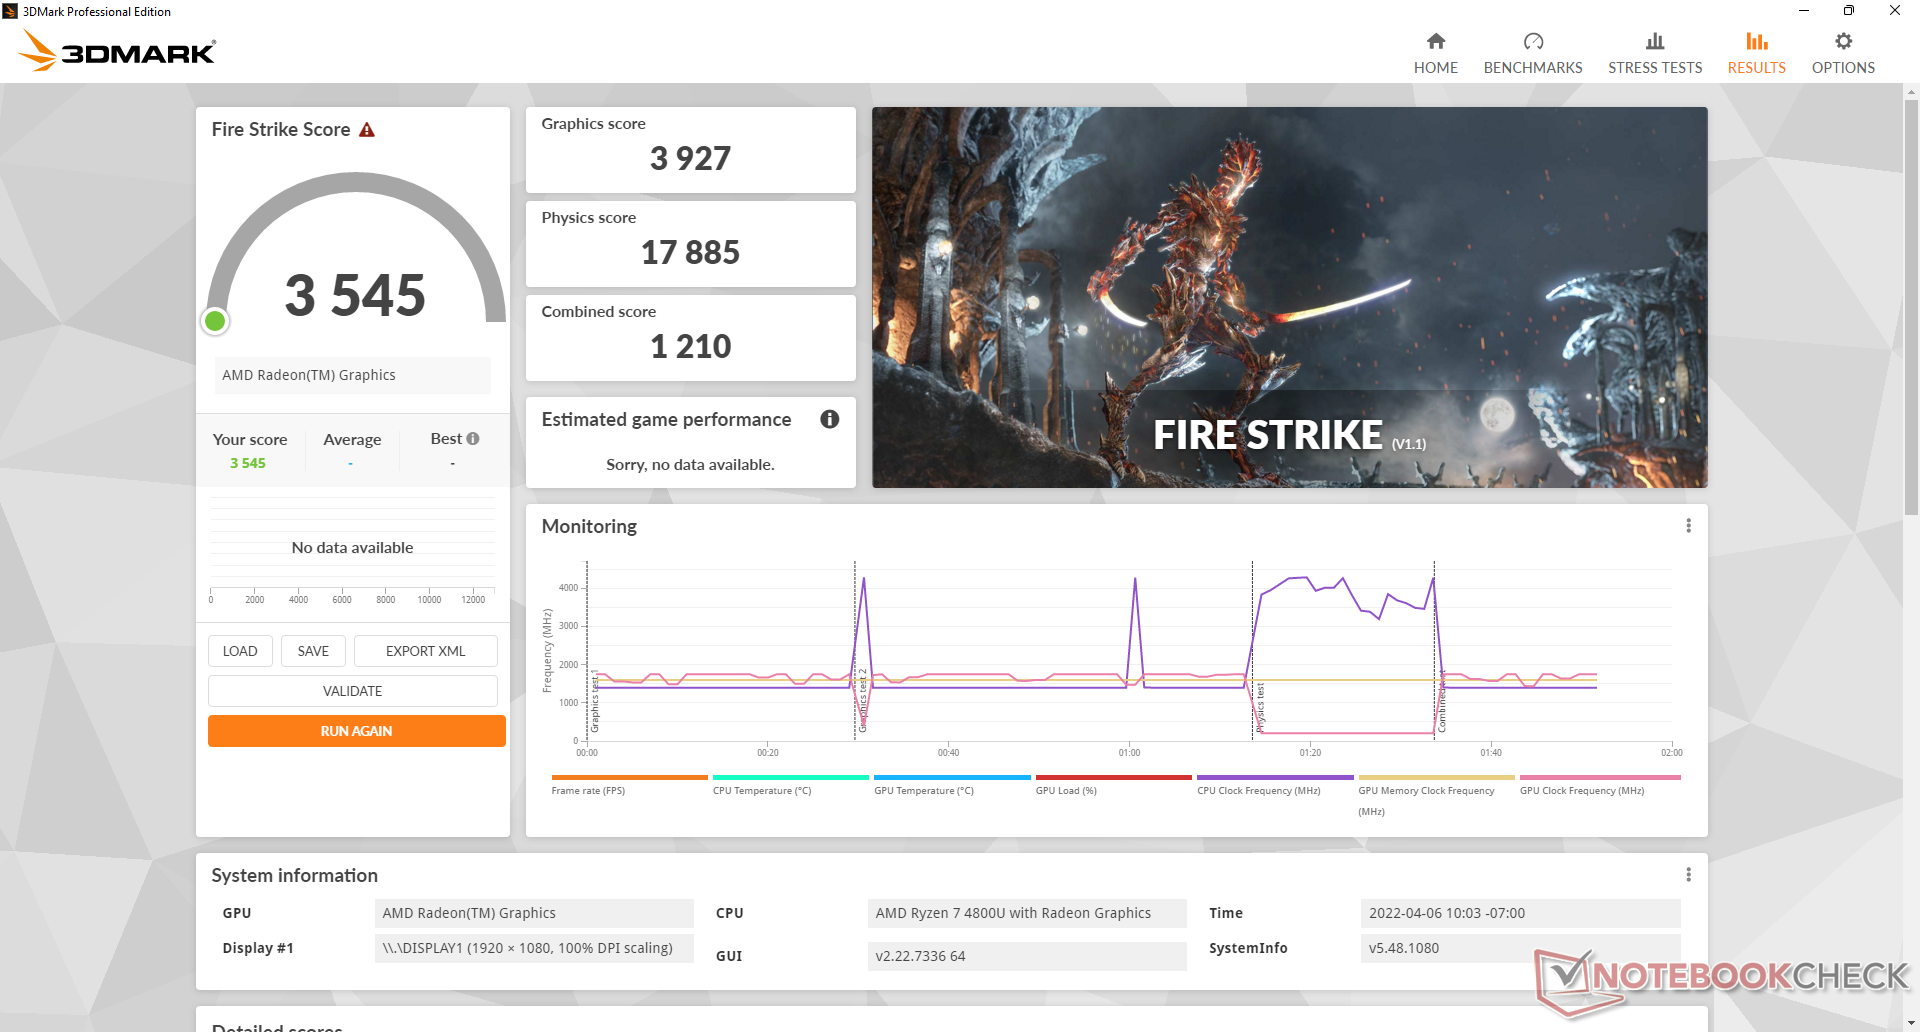
| 3DMark 11 Performance | 6285 punti | |
| 3DMark Cloud Gate Standard Score | 22021 punti | |
| 3DMark Fire Strike Score | 3545 punti | |
| 3DMark Time Spy Score | 1412 punti | |
Aiuto | ||
| The Witcher 3 | |
| 1024x768 Low Graphics & Postprocessing | |
| Samsung Galaxy Book Pro 15 NP950XDB-KC5US | |
| Beelink GTR5 | |
| Intel NUC11PAQi7 | |
| Media AMD Radeon RX Vega 8 (Ryzen 4000/5000) (27.2 - 89, n=47) | |
| Beelink SER4 | |
| Beelink SER3 | |
| 1366x768 Medium Graphics & Postprocessing | |
| Samsung Galaxy Book Pro 15 NP950XDB-KC5US | |
| Beelink GTR5 | |
| Beelink SER4 | |
| Intel NUC11PAQi7 | |
| Media AMD Radeon RX Vega 8 (Ryzen 4000/5000) (19.6 - 55.2, n=35) | |
| Beelink SER3 | |
| 1920x1080 High Graphics & Postprocessing (Nvidia HairWorks Off) | |
| Samsung Galaxy Book Pro 15 NP950XDB-KC5US | |
| Beelink GTR5 | |
| Beelink SER4 | |
| Intel NUC11PAQi7 | |
| Media AMD Radeon RX Vega 8 (Ryzen 4000/5000) (8.7 - 26.8, n=46) | |
| Beelink SER3 | |
| 1920x1080 Ultra Graphics & Postprocessing (HBAO+) | |
| Beelink GTR5 | |
| Samsung Galaxy Book Pro 15 NP950XDB-KC5US | |
| Beelink SER4 | |
| Media AMD Radeon RX Vega 8 (Ryzen 4000/5000) (7.07 - 17.6, n=49) | |
| Intel NUC11PAQi7 | |
| Beelink SER3 | |
Witcher 3 FPS Chart
| basso | medio | alto | ultra | |
|---|---|---|---|---|
| GTA V (2015) | 110 | 98.3 | 29.6 | 13.4 |
| The Witcher 3 (2015) | 64.2 | 45.2 | 22.6 | 14.3 |
| Dota 2 Reborn (2015) | 103 | 83.3 | 53.1 | 51.1 |
| Final Fantasy XV Benchmark (2018) | 37.3 | 19.2 | 13.8 | |
| X-Plane 11.11 (2018) | 41.1 | 33.2 | 29.5 | |
| Far Cry 5 (2018) | 46 | 22 | 20 | 19 |
| Strange Brigade (2018) | 82.3 | 33.3 | 28.1 | 24 |
Emissioni
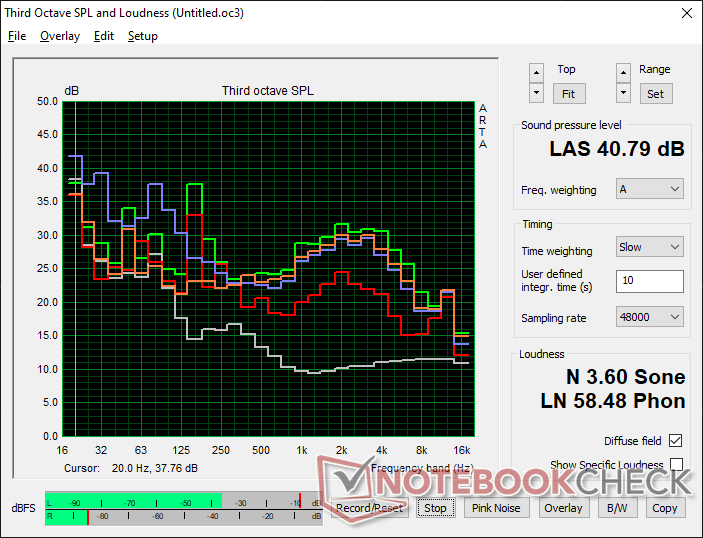
Rumore di sistema - fastidioso comportamento pulsante
Il rumore della ventola è forse l'aspetto peggiore del SER4. Anche se non così forte come il Ryzen 9 H-powered GTR5il SER4 è ancora molto rumoroso per un mini PC della serie U. L'inattività sul desktop, per esempio, è sufficiente a causare un rumore della ventola di 33,2 dB(A) contro uno sfondo silenzioso di 23,4 dB(A). Bassi carichi di elaborazione come la navigazione web o lo streaming video possono fastidiosamente causare una fluttuazione della ventola tra 33 e 39 dB(A). Al contrario, l'Intel NUC 11 è in grado di rimanere più silenzioso o addirittura vicino al silenzio per periodi più lunghi.
Il rumore della ventola può essere forte come 40 dB(A) quando si eseguono carichi di gioco rispetto a soli 34 dB(A) sul NUC 11.
Rumorosità
| Idle |
| 33.2 / 33.2 / 33.2 dB(A) |
| Sotto carico |
| 38.6 / 40.8 dB(A) |
 | ||
30 dB silenzioso 40 dB(A) udibile 50 dB(A) rumoroso |
||
min: | ||
| Beelink SER4 Vega 8, R7 4800U, Intel SSD 660p SSDPEKNW512G8 | Beelink GTR5 Vega 8, R9 5900HX, Kingston NV1 SNVS/500GCN | Intel NUC11PAQi7 Iris Xe G7 96EUs, i7-1165G7, Samsung SSD 980 Pro 500GB MZ-V8P500BW | Beelink SER3 Vega 10, R7 3750H, GSemi AZW GSDFN512TS3F1OGCX | |
|---|---|---|---|---|
| Noise | -6% | 8% | 11% | |
| off /ambiente * (dB) | 23.4 | 23.1 1% | 25.6 -9% | 23.4 -0% |
| Idle Minimum * (dB) | 33.2 | 34.2 -3% | 25.6 23% | 23.4 30% |
| Idle Average * (dB) | 33.2 | 34.2 -3% | 25.6 23% | 23.4 30% |
| Idle Maximum * (dB) | 33.2 | 34.2 -3% | 25.6 23% | 29.4 11% |
| Load Average * (dB) | 38.6 | 44.6 -16% | 33.6 13% | 35.2 9% |
| Witcher 3 ultra * (dB) | 39.2 | 41.4 -6% | 33.6 14% | 37.2 5% |
| Load Maximum * (dB) | 40.8 | 45.1 -11% | 54.5 -34% | 43.3 -6% |
* ... Meglio usare valori piccoli
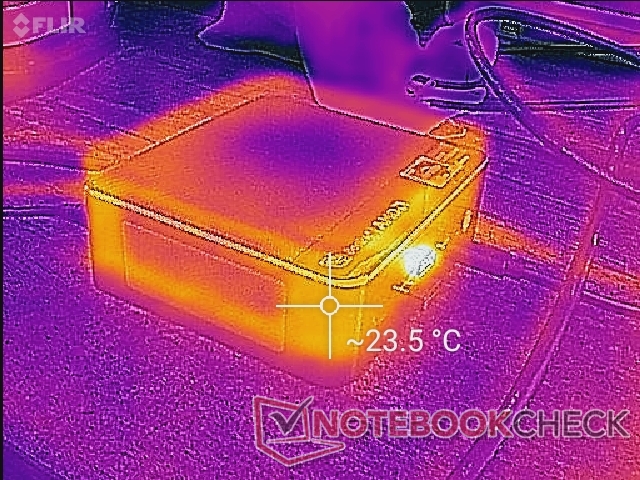
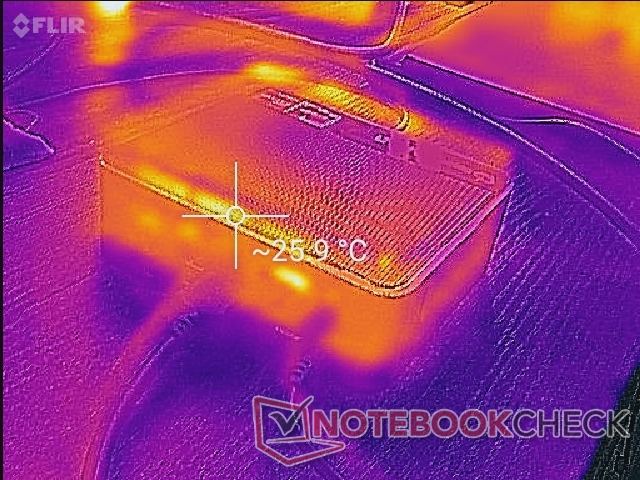
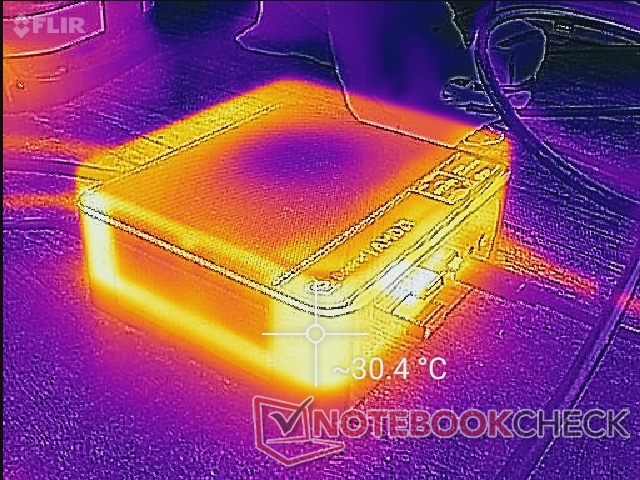
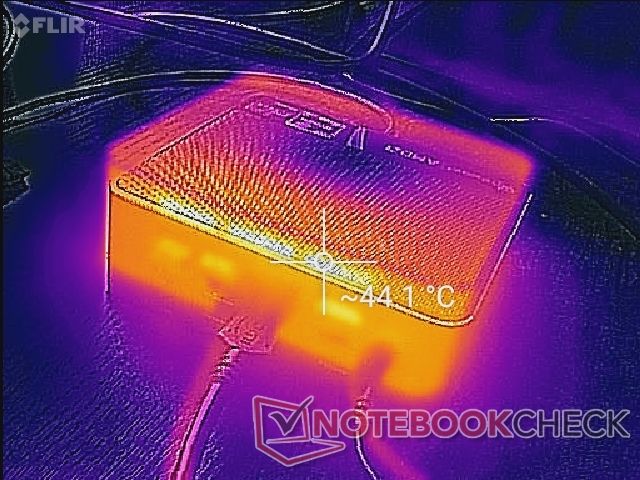
Temperatura - Mantenere la parte superiore libera
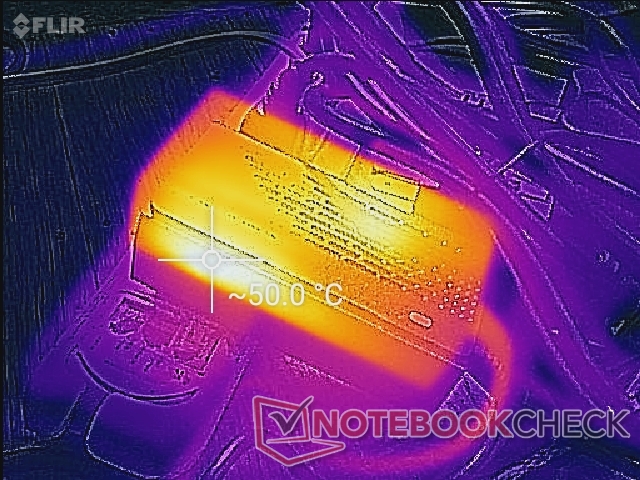
Le temperature di superficie non sono un problema. L'unità ha griglie di ventilazione su quattro dei suoi sei lati per il flusso d'aria. L'aria fredda entra dalla superficie superiore e quindi non si raccomanda di mettere carte o libri sopra l'unità.
Test di stress
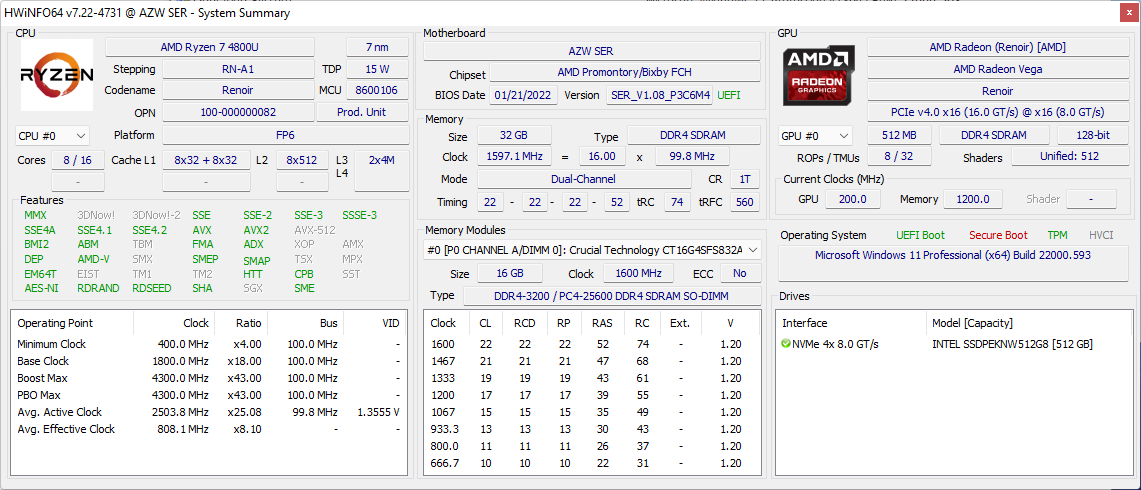
Quando viene stressata sotto Prime95, la CPU aumenta a 2,8 GHz all'infinito e a una temperatura stabile del SoC di 64 C. Eseguendo questo stesso test sull'Intel NUC11PAQi7 si ottiene una temperatura del core più calda, fino a 79 C. I tassi di clock rimangono stabili e senza comportamenti ciclici anche durante il gioco.
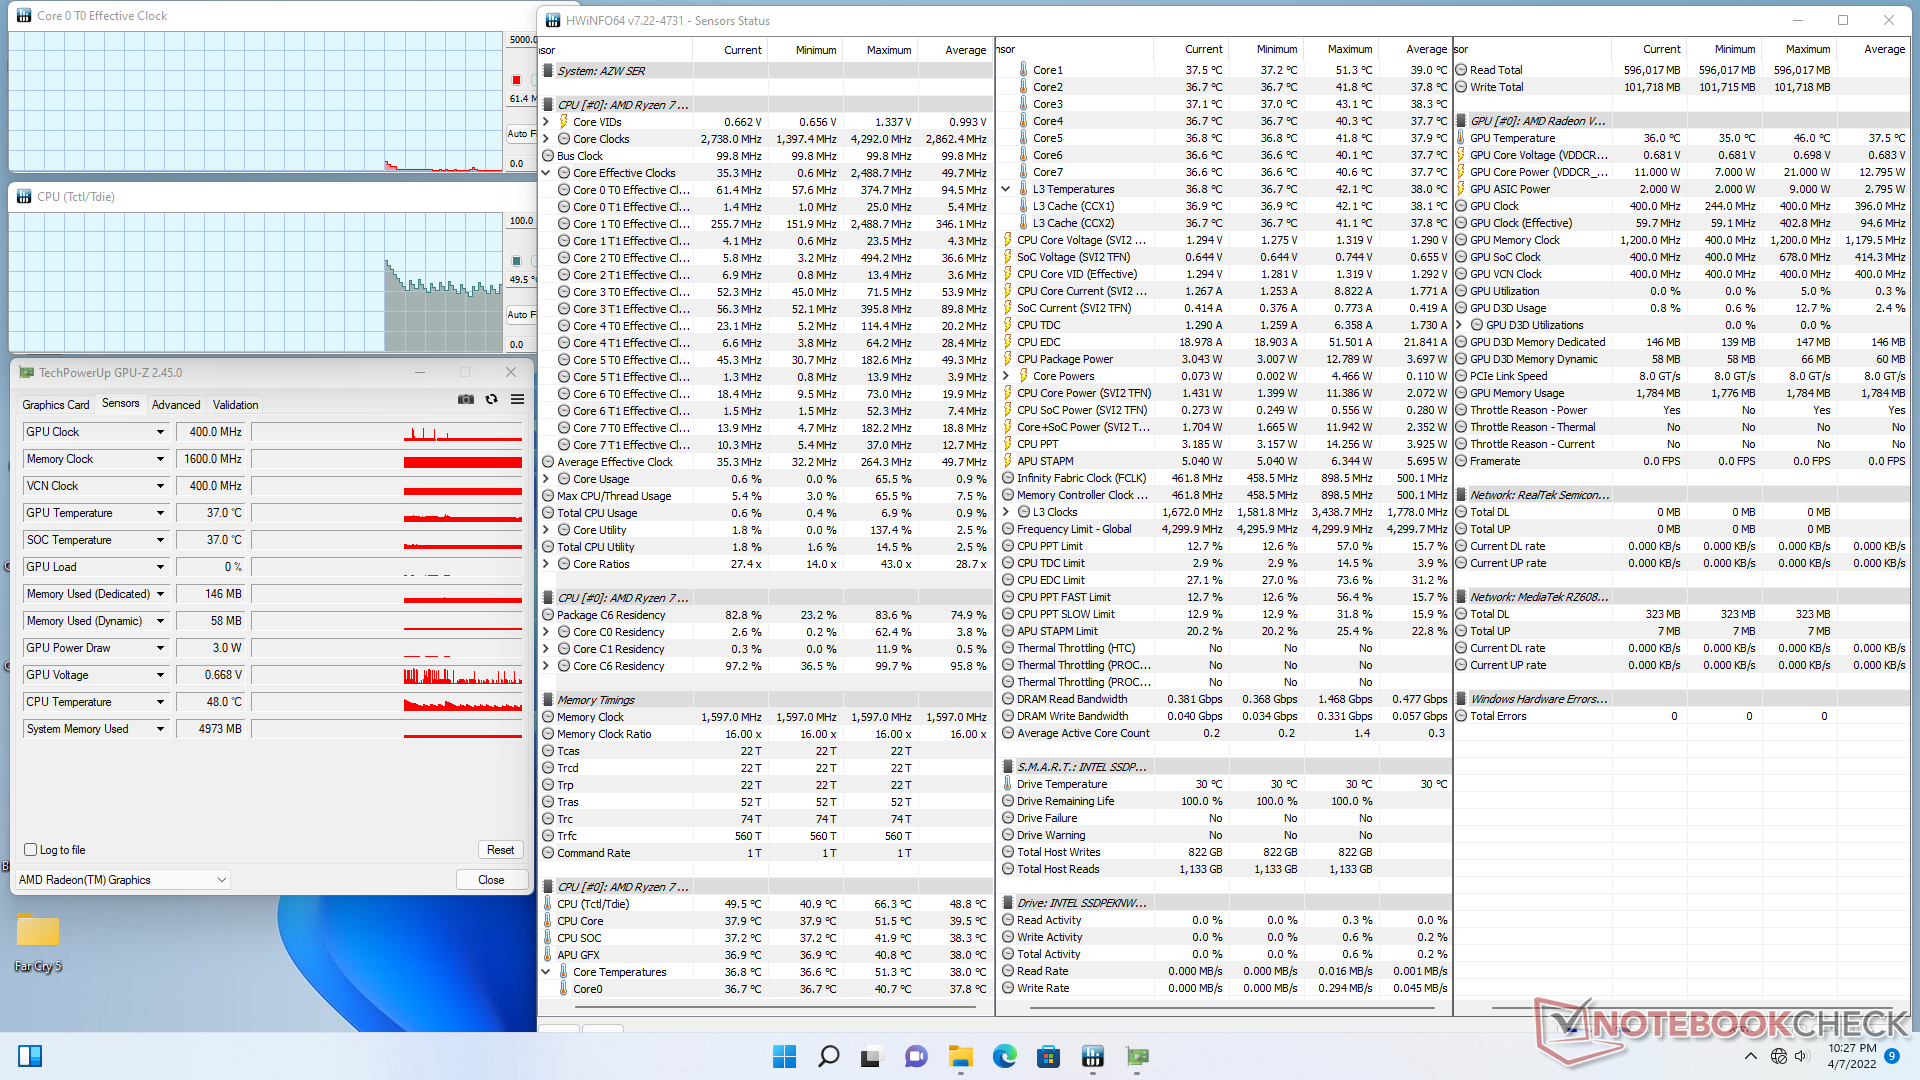
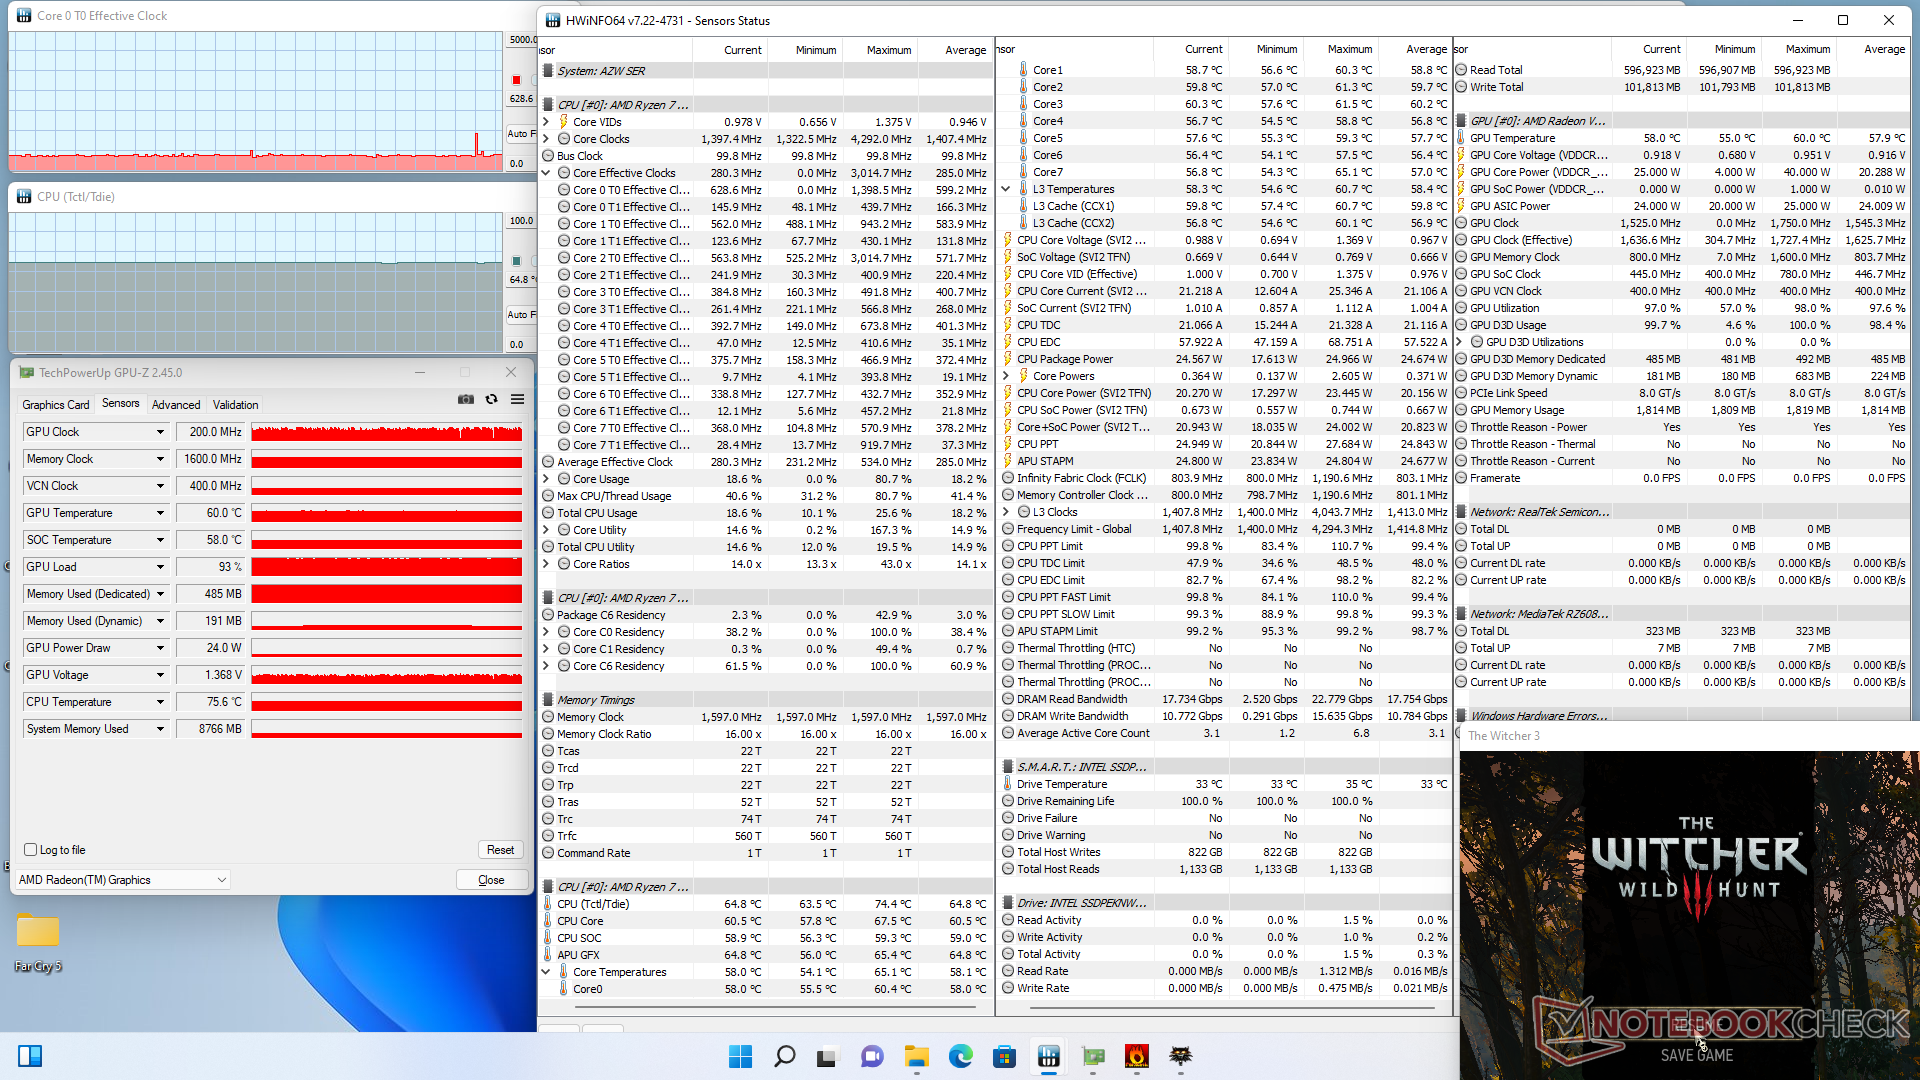
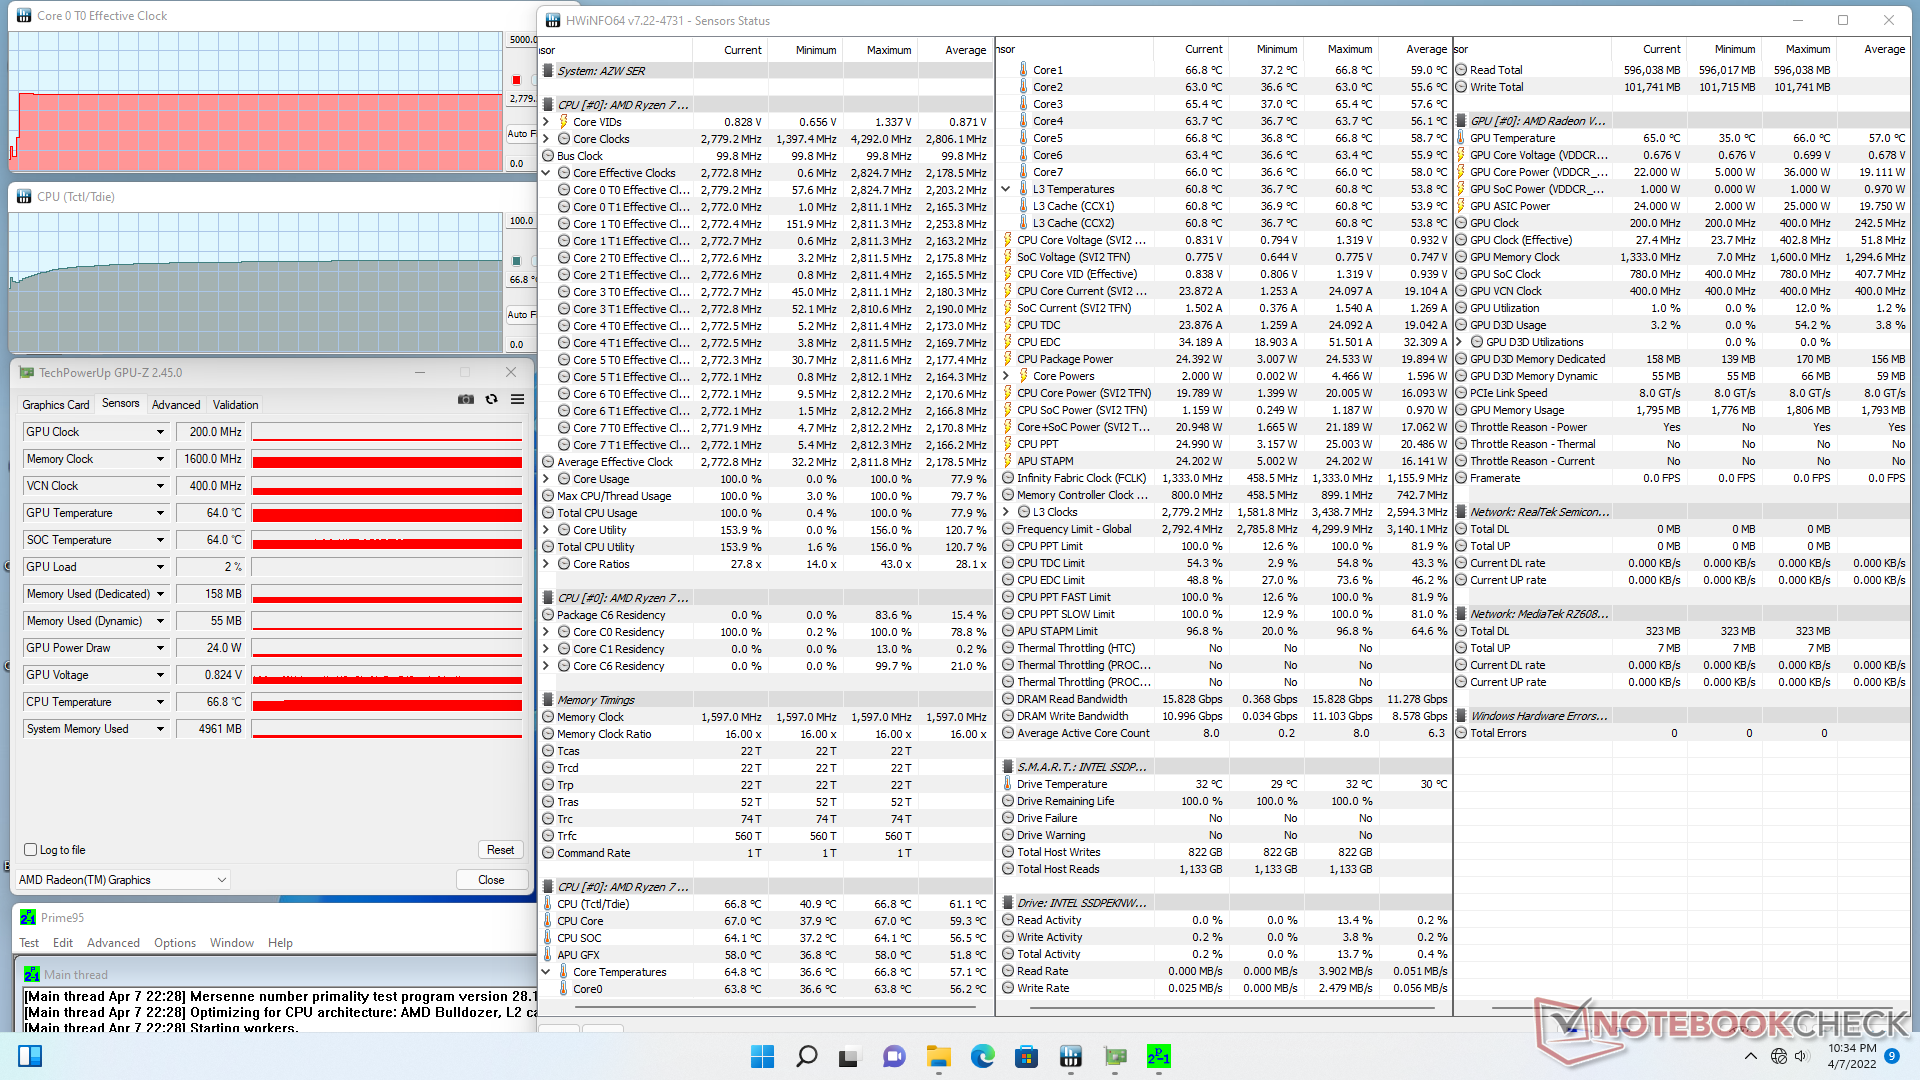
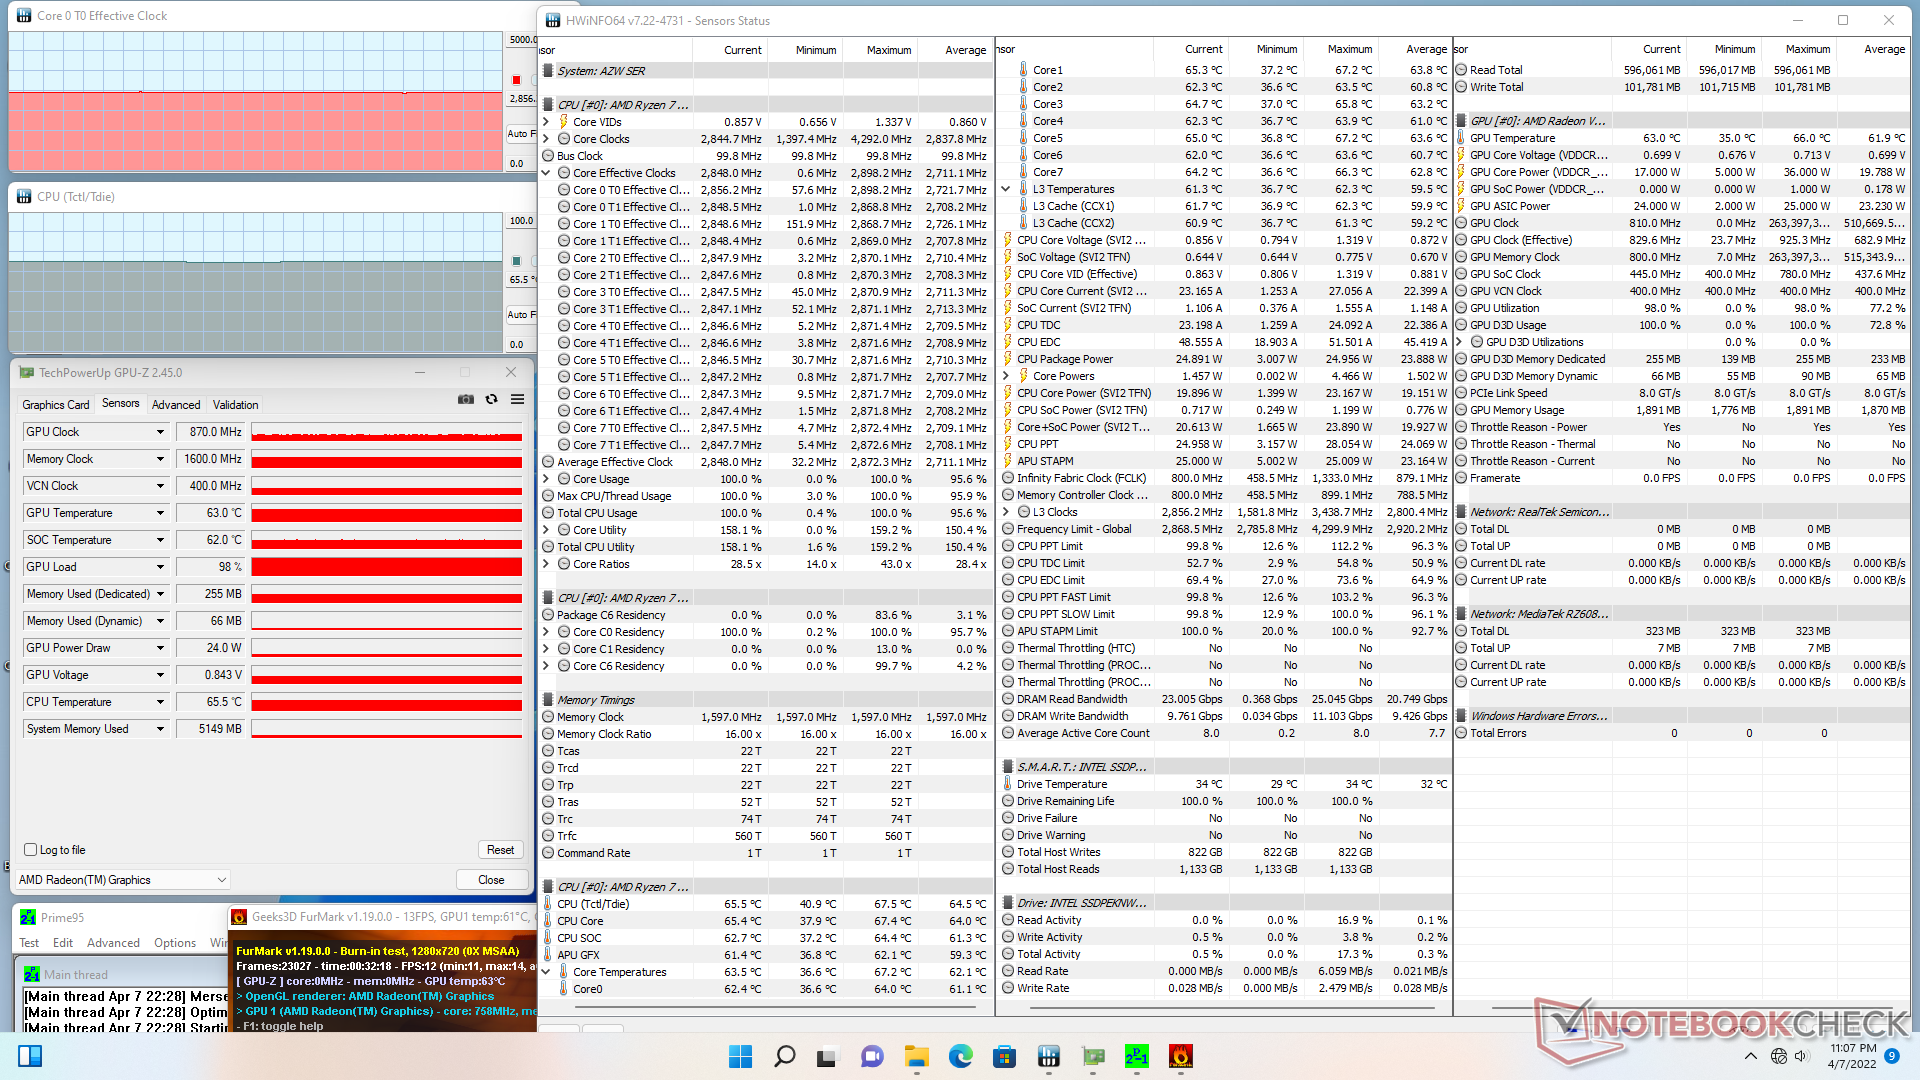
| Clock della CPU (GHz) | Clock della GPU (MHz) | Temperatura media della CPU SoC (°C) | |
| Sistema inattivo | -- | -- | 37 |
| Prime95 Stress | 2.8 | -- | 64 |
| Prime95 + FurMark Stress | 2.9 | 870 | 62 |
| Witcher 3 Stress | 0.6 | 1525 | 58 |
Gestione dell'energia
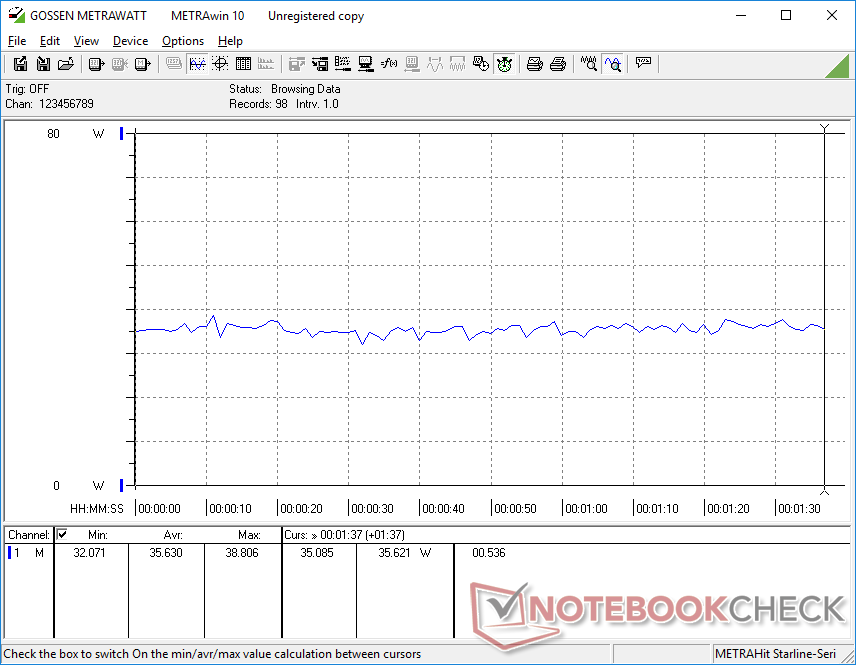
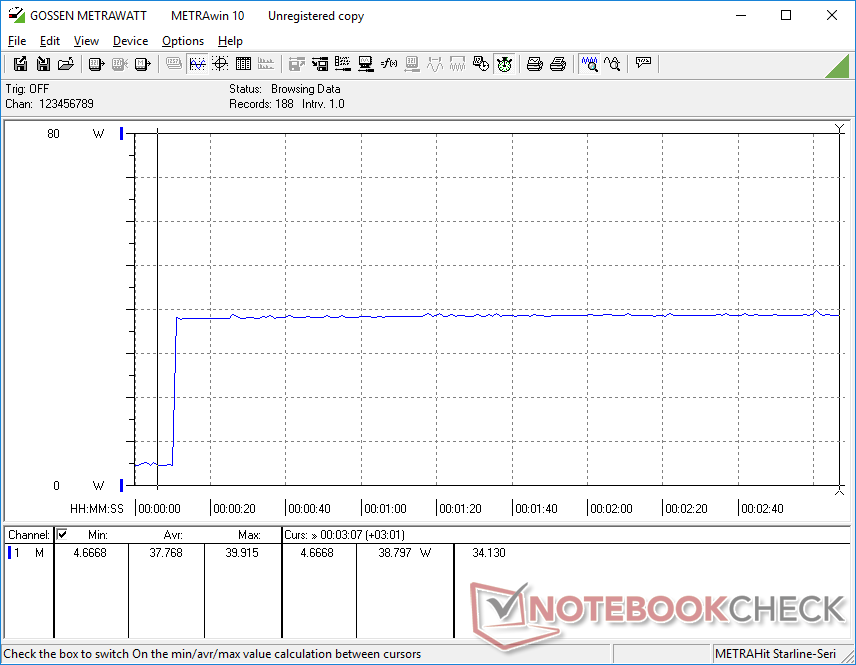
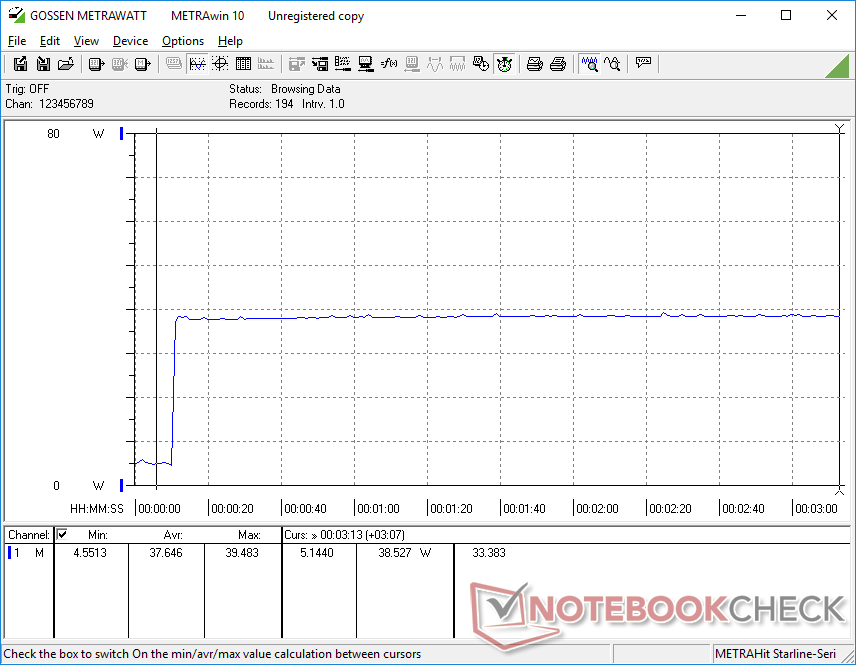
Consumo di energia
Il SER4 richiede circa la stessa potenza dell'Intel NUC11PAQi7 nonostante tutte le loro differenze di prestazioni. In altre parole, il sistema Beelink offre maggiori prestazioni della CPU per watt ma minori prestazioni della GPU per watt rispetto al NUC Core i7-1165G7.
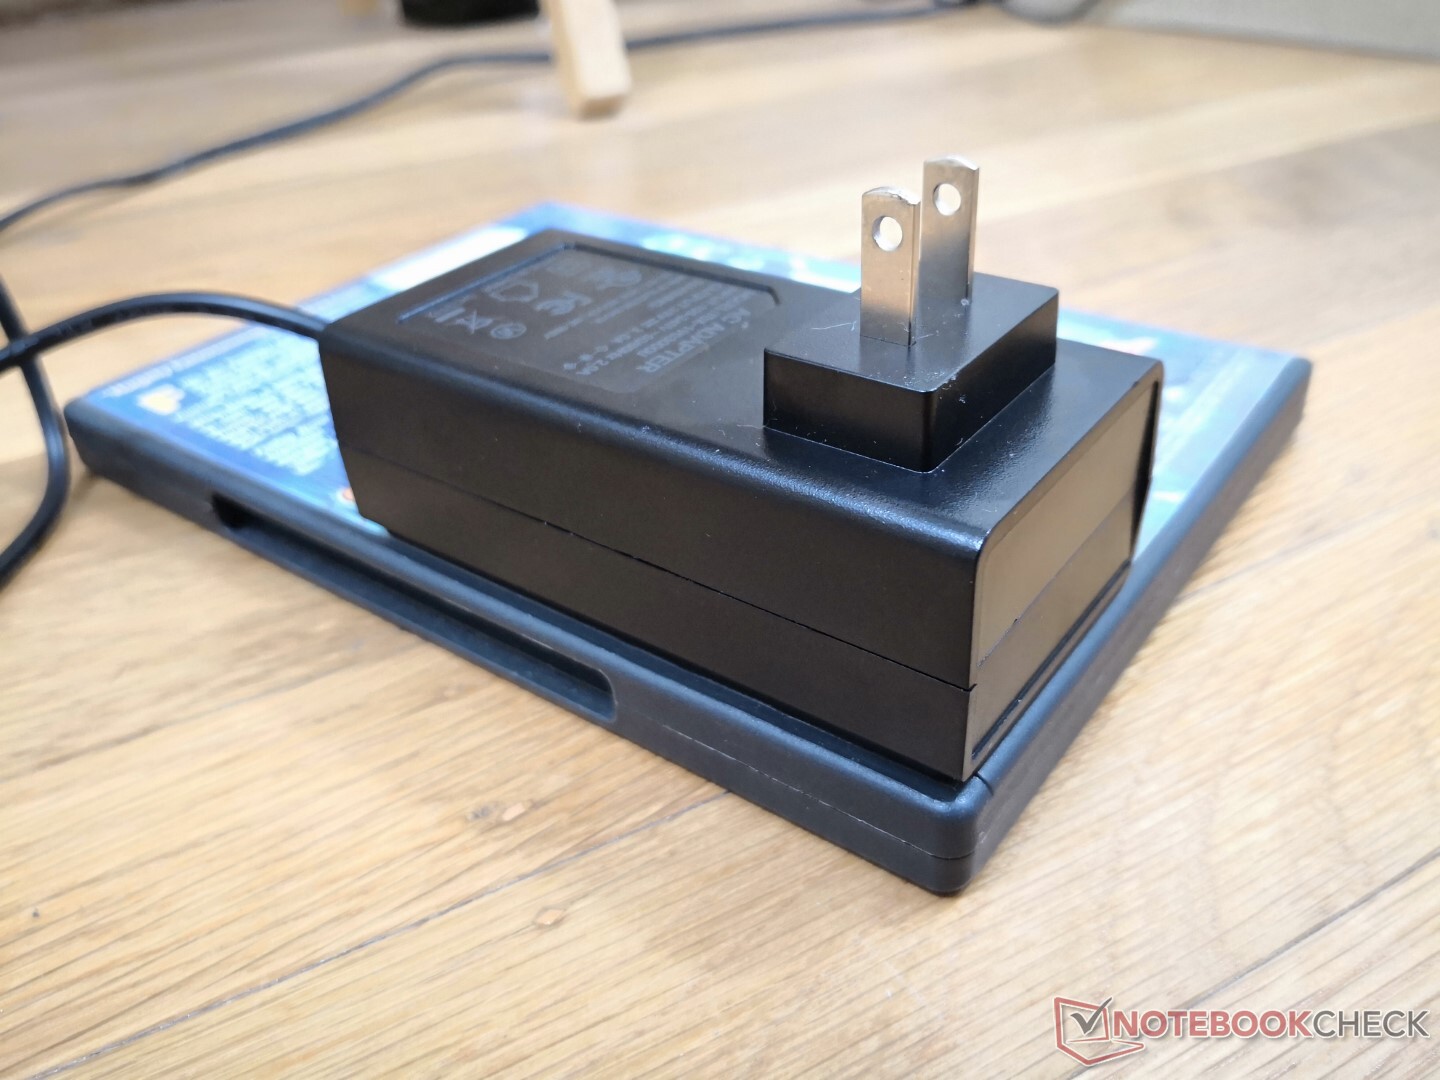
Siamo in grado di registrare un massimo di 49 W dal piccolo ())(() 57 W adattatore AC wall wart quando si eseguono Prime95 e FurMark contemporaneamente. Questo può essere aumentato ancora di più se si collegano ulteriori dispositivi USB come monitor o smartphone.

| Off / Standby | |
| Idle | |
| Sotto carico |
|
Leggenda:
min: | |
| Beelink SER4 R7 4800U, Vega 8, Intel SSD 660p SSDPEKNW512G8, , x, | GMK NucBox 3 Celeron J4125, UHD Graphics 600, Netac S535N8/256GYN, , x, | Beelink GTR5 R9 5900HX, Vega 8, Kingston NV1 SNVS/500GCN, , x, | Intel NUC11PAQi7 i7-1165G7, Iris Xe G7 96EUs, Samsung SSD 980 Pro 500GB MZ-V8P500BW, , x, | Beelink SER3 R7 3750H, Vega 10, GSemi AZW GSDFN512TS3F1OGCX, , x, | Intel NUC10i5FNK i5-10210U, UHD Graphics 620, Kingston RBUSNS8154P3256GJ1, , 0x0, 0" | |
|---|---|---|---|---|---|---|
| Power Consumption | 36% | -89% | -34% | -50% | -165% | |
| Idle Minimum * (Watt) | 4.1 | 3 27% | 6.2 -51% | 5.6 -37% | 7 -71% | |
| Idle Average * (Watt) | 4.1 | 3.1 24% | 8.9 -117% | 5.6 -37% | 9.1 -122% | 15.7 -283% |
| Idle Maximum * (Watt) | 4.6 | 3.6 22% | 9 -96% | 6 -30% | 9.7 -111% | |
| Load Average * (Watt) | 35.6 | 11.1 69% | 66.8 -88% | 31.4 12% | 29.5 17% | |
| Witcher 3 ultra * (Watt) | 35.6 | 62.6 -76% | 39 -10% | 32.5 9% | ||
| Load Maximum * (Watt) | 39.9 | 25.4 36% | 81.6 -105% | 80.5 -102% | 48.7 -22% | 58.6 -47% |
* ... Meglio usare valori piccoli
Power Consumption Witcher 3 / Stresstest
{
Pro
Contro
Verdetto - Prestazioni elevate per dollaro
Per $600 USD su Amazon, gli utenti stanno ottenendo la CPU Ryzen 7 4800U con 16 GB di RAM, una licenza Windows 11 Pro e un SSD da 512 GB. Al contrario, un barebone Intel NUC 11 con il Core i7-1165G7 è venduto al dettaglio per poco più di $700 USD senza OS, RAM o storage. Il SER4 offre prestazioni più veloci della CPU multi-thread ad un prezzo significativamente più basso rispetto all'opzione Intel, che è la sua caratteristica più notevole.
Il SER4 ha reso il SER3 obsoleto. Il suo processore Ryzen 7 4800U non è male, con velocità che rivaleggiano con qualsiasi opzione Intel NUC 11 alimentato da Core U.
Lo svantaggio più evidente del SER4 è il suo rumore di ventola più forte rispetto all'Intel NUC. Abbiamo sperimentato questo su molti altri mini PC Beelink e il SER4 continua questa tendenza. Piccoli svantaggi includono le prestazioni grafiche leggermente più lente rispetto agli Iris Xe 96 EU, un anno di garanzia di base invece di tre, il supporto SSD PCIe3 invece di PCIe4, nessun supporto Thunderbolt, e un'interfaccia utente del BIOS meno sviluppata rispetto a un Intel NUC. Se questi inconvenienti non sono grandi preoccupazioni, allora il SER4 è una forte raccomandazione come alternativa all'Intel NUC.
Prezzo e disponibilità
Price comparison

