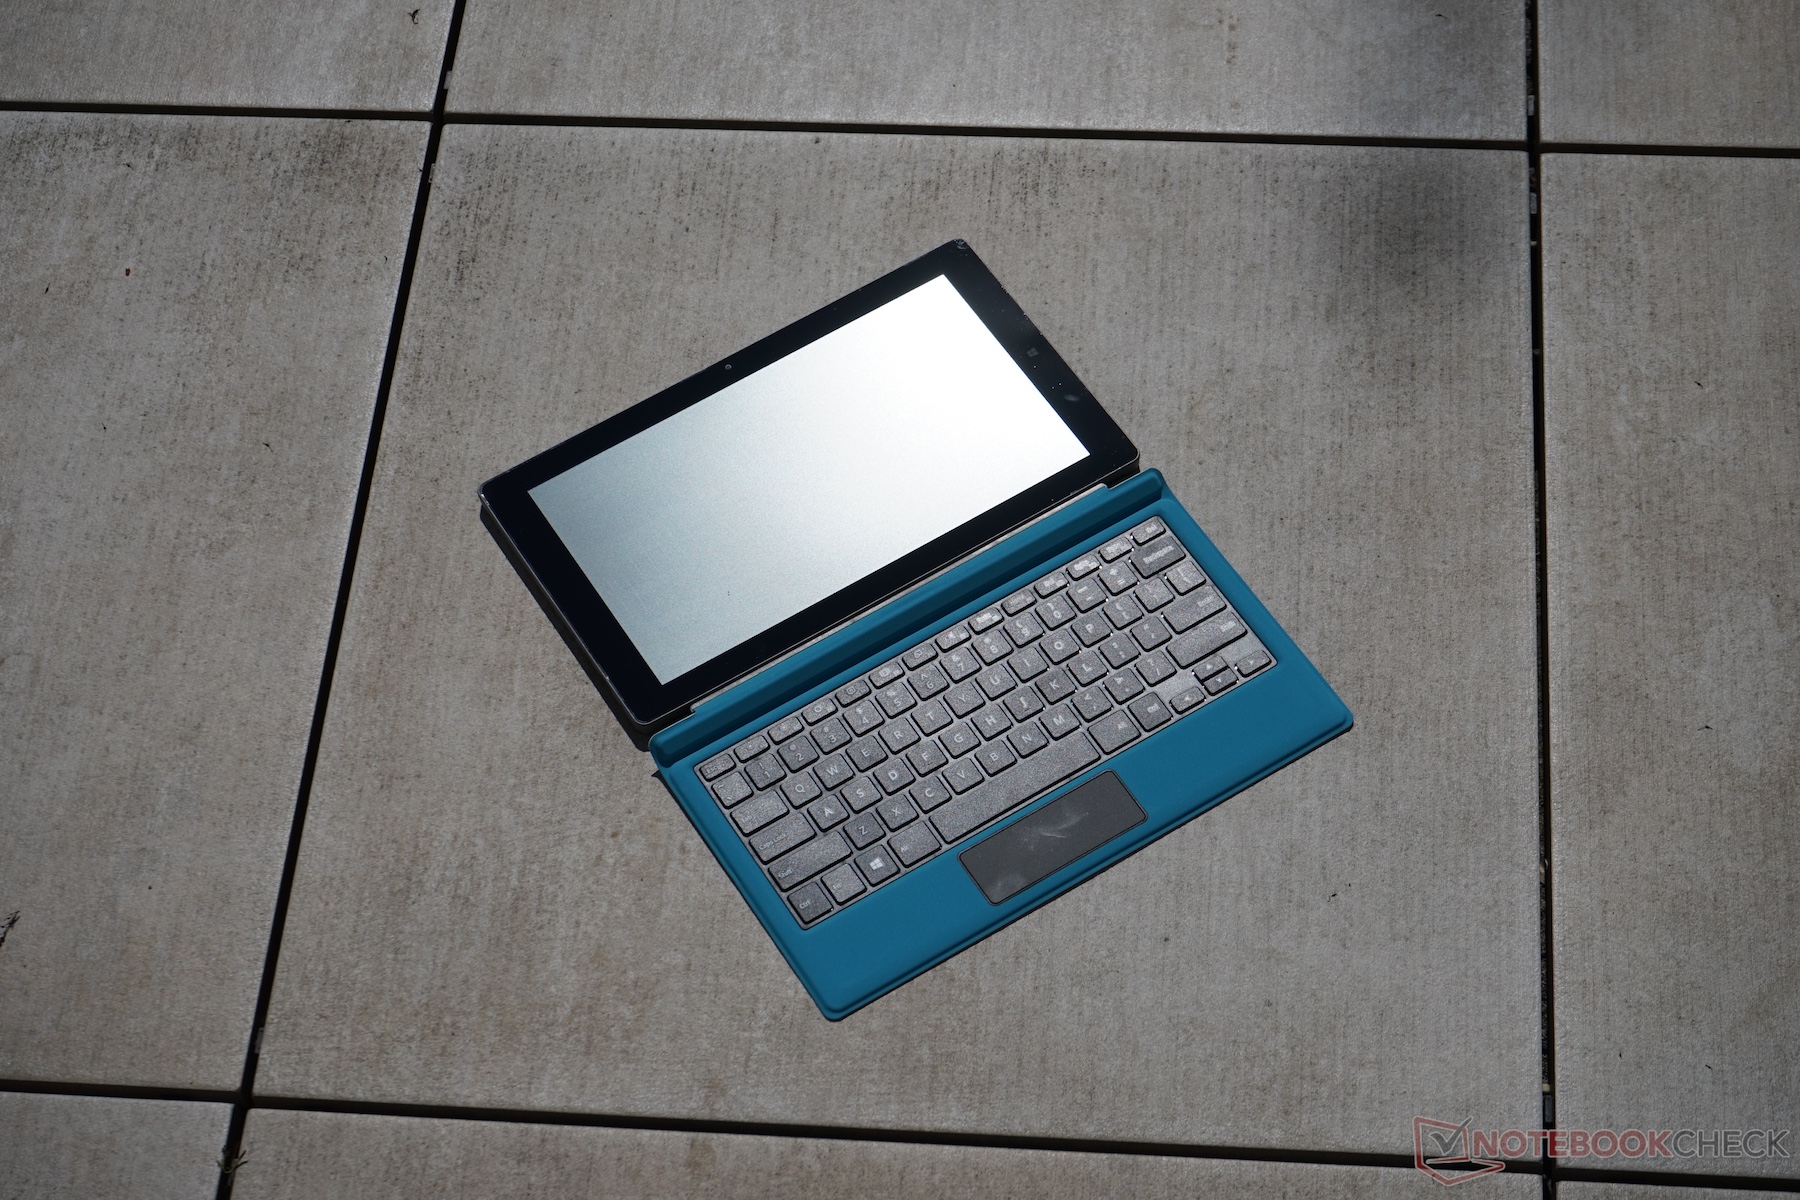
Recensione breve del Teclast Tbook 16 Power 2-in-1 (x7-Z8750, 8 GB)

| SD Card Reader - average JPG Copy Test (av. of 3 runs) | |
| Apple MacBook Pro Retina 13 inch 2013-10 | |
| Acer Aspire S 13 S5-371-71QZ | |
| Teclast Tbook 16 Power | |
| Microsoft Surface Pro 4, Core i5, 256GB | |
| Lenovo ThinkPad Yoga 370-20JJS00100 | |
| Dell Latitude 12 5285 2-in-1 | |
| Asus Zenbook UX3410UA | |
| Chuwi Vi8 Plus (CWI519) | |
| Networking | |
| iperf3 transmit AX12 | |
| Microsoft Surface Pro 4, Core i5, 128GB (Klaus I211) | |
| Microsoft Surface Book with Performance Base | |
| Cube i7 Book CDK09 (Klaus I211) | |
| Teclast Tbook 16 Power | |
| Chuwi Hi10 Pro | |
| iperf3 receive AX12 | |
| Microsoft Surface Book with Performance Base | |
| Microsoft Surface Pro 4, Core i5, 128GB (Klaus I211) | |
| Cube i7 Book CDK09 (Klaus I211) | |
| Teclast Tbook 16 Power | |
| Chuwi Hi10 Pro | |
| |||||||||||||||||||||||||
Distribuzione della luminosità: 79 %
Al centro con la batteria: 244 cd/m²
Contrasto: 642:1 (Nero: 0.38 cd/m²)
ΔE ColorChecker Calman: 6.7 | ∀{0.5-29.43 Ø4.72}
ΔE Greyscale Calman: 7.4 | ∀{0.09-98 Ø4.97}
93% sRGB (Argyll 1.6.3 3D)
60.6% AdobeRGB 1998 (Argyll 1.6.3 3D)
67.4% AdobeRGB 1998 (Argyll 3D)
93.2% sRGB (Argyll 3D)
66.1% Display P3 (Argyll 3D)
Gamma: 2.15
CCT: 8867 K
| Teclast Tbook 16 Power 1920x1080, 11.6" | Microsoft Surface Pro 4 Core i7 Samsung 123YL01-001 ID: SDC3853, , 2736x1824, 12.3" | Cube i9 KDC0000, , 1920x1200, 12.2" | Chuwi Hi12 SEC3542, , 2160x1440, 12" | |
|---|---|---|---|---|
| Display | 3% | -3% | 1% | |
| Display P3 Coverage (%) | 66.1 | 66.9 1% | 65.7 -1% | 66 0% |
| sRGB Coverage (%) | 93.2 | 97.5 5% | 88.7 -5% | 95.3 2% |
| AdobeRGB 1998 Coverage (%) | 67.4 | 68.6 2% | 65.1 -3% | 68.1 1% |
| Response Times | -20% | 14% | 39% | |
| Response Time Grey 50% / Grey 80% * (ms) | 40 ? | 48.4 ? -21% | 37.2 ? 7% | 28 ? 30% |
| Response Time Black / White * (ms) | 30.2 ? | 35.6 ? -18% | 24 ? 21% | 16 ? 47% |
| PWM Frequency (Hz) | 12000 ? | 10420 | 200 ? | |
| Screen | 53% | 16% | 17% | |
| Brightness middle (cd/m²) | 244 | 436.7 79% | 263 8% | 293 20% |
| Brightness (cd/m²) | 215 | 433 101% | 263 22% | 277 29% |
| Brightness Distribution (%) | 79 | 87 10% | 77 -3% | 89 13% |
| Black Level * (cd/m²) | 0.38 | 0.326 14% | 0.28 26% | 0.256 33% |
| Contrast (:1) | 642 | 1340 109% | 939 46% | 1145 78% |
| Colorchecker dE 2000 * | 6.7 | 1.82 73% | 4.1 39% | 5.2 22% |
| Colorchecker dE 2000 max. * | 11.7 | 12.1 -3% | 11.4 3% | |
| Greyscale dE 2000 * | 7.4 | 1.44 81% | 3.8 49% | 8.5 -15% |
| Gamma | 2.15 102% | 2.1 105% | 2.25 98% | 2.21 100% |
| CCT | 8867 73% | 6560 99% | 6433 101% | 7048 92% |
| Color Space (Percent of AdobeRGB 1998) (%) | 60.6 | 62.3 3% | 57.7 -5% | 62 2% |
| Color Space (Percent of sRGB) (%) | 93 | 97.5 5% | 76.2 -18% | 82.5 -11% |
| Media totale (Programma / Settaggio) | 12% /
32% | 9% /
12% | 19% /
17% |
* ... Meglio usare valori piccoli
Tempi di risposta del Display
| ↔ Tempi di risposta dal Nero al Bianco | ||
|---|---|---|
| 30.2 ms ... aumenta ↗ e diminuisce ↘ combinato | ↗ 16.8 ms Incremento | |
| ↘ 13.4 ms Calo | ||
| Lo schermo mostra tempi di risposta lenti nei nostri tests e sarà insoddisfacente per i gamers. In confronto, tutti i dispositivi di test variano da 0.1 (minimo) a 240 (massimo) ms. » 82 % di tutti i dispositivi è migliore. Questo significa che i tempi di risposta rilevati sono peggiori rispetto alla media di tutti i dispositivi testati (19.8 ms). | ||
| ↔ Tempo di risposta dal 50% Grigio all'80% Grigio | ||
| 40 ms ... aumenta ↗ e diminuisce ↘ combinato | ↗ 20 ms Incremento | |
| ↘ 20 ms Calo | ||
| Lo schermo mostra tempi di risposta lenti nei nostri tests e sarà insoddisfacente per i gamers. In confronto, tutti i dispositivi di test variano da 0.165 (minimo) a 636 (massimo) ms. » 61 % di tutti i dispositivi è migliore. Questo significa che i tempi di risposta rilevati sono peggiori rispetto alla media di tutti i dispositivi testati (31 ms). | ||
Sfarfallio dello schermo / PWM (Pulse-Width Modulation)
| flickering dello schermo / PWM rilevato | 12000 Hz | ≤ 26 % settaggio luminosita' |
| ≤ 60 luminosita' cd/m² | ||
Il display sfarfalla a 12000 Hz (Probabilmente a causa dell'uso di PWM) Flickering rilevato ad una luminosita' di 26 % (60 cd/m²) o inferiore. Non dovrebbe verificarsi flickering o PWM sopra questo valore di luminosita'. La frequenza di 12000 Hz è abbastanza alta, quindi la maggioranza degli utenti sensibili al PWM non dovrebbero notare alcun flickering. Poiche' il flickering si verifica solo a valori di luminosità molto bassi, non dovrebbe essere un problema con i settaggi normali. Tuttavia, l'utilizzo con condizioni di luce bassa potrebbe stancare gli occhi. In confronto: 52 % di tutti i dispositivi testati non utilizza PWM per ridurre la luminosita' del display. Se è rilevato PWM, una media di 7769 (minimo: 5 - massimo: 343500) Hz è stata rilevata. | ||
| Cinebench R15 | |
| CPU Single 64Bit | |
| Cube i7 Book CDK09 | |
| Microsoft Surface Pro 4, Core m3 | |
| Cube i9 | |
| Acer TravelMate B117-M-P16Q | |
| Chiligreen Mobilitas SF2600 | |
| Acer Swift 1 SF114-31-P6F6 | |
| HP Pavilion x360 11t T5M27AV | |
| Teclast Tbook 16 Power | |
| Microsoft Surface 3 | |
| Chuwi Hi12 | |
| VOYO VBook V3 | |
| Medion Akoya P2211T MD98602 | |
| CPU Multi 64Bit | |
| Cube i7 Book CDK09 | |
| Microsoft Surface Pro 4, Core m3 | |
| Cube i9 | |
| Acer Swift 1 SF114-31-P6F6 | |
| Acer TravelMate B117-M-P16Q | |
| Chiligreen Mobilitas SF2600 | |
| Microsoft Surface 3 | |
| Teclast Tbook 16 Power | |
| HP Pavilion x360 11t T5M27AV | |
| Teclast Tbook 10s | |
| Chuwi Hi12 | |
| Medion Akoya P2211T MD98602 | |
| VOYO VBook V3 | |
| Chuwi Hi10 Pro | |
| PCMark 8 - Home Score Accelerated v2 | |
| Cube i7 Book CDK09 | |
| Cube i9 | |
| Microsoft Surface Pro 4, Core m3 | |
| Acer Swift 1 SF114-31-P6F6 | |
| Acer TravelMate B117-M-P16Q | |
| Chiligreen Mobilitas SF2600 | |
| Microsoft Surface 3 | |
| HP Pavilion x360 11t T5M27AV | |
| Teclast Tbook 16 Power | |
| VOYO VBook V3 | |
| Acer Switch One 10 SW1-011-14UQ | |
| Medion Akoya E2215T | |
| Teclast Tbook 10s | |
| PCMark 8 Home Score Accelerated v2 | 1499 punti | |
| PCMark 8 Creative Score Accelerated v2 | 1732 punti | |
| PCMark 10 Score | 1006 punti | |
Aiuto | ||
| Performance rating - Percent | |
| Microsoft Surface Pro 4, Core m3 | |
| Cube i9 | |
| Cube i7 Book CDK09 | |
| Microsoft Surface 3 | |
| Teclast Tbook 16 Power | |
| Medion Akoya P2211T MD98602 | |

| 3DMark 11 - 1280x720 Performance GPU | |
| Acer Aspire ES1-731G-P5UR | |
| Cube i9 | |
| Acer Swift 1 SF114-31-P6F6 | |
| Chiligreen Mobilitas SF2600 | |
| Acer TravelMate B117-M-P16Q | |
| HP Pavilion x360 11t T5M27AV | |
| Lenovo Yoga Book 2016 Windows 64GB LTE | |
| Teclast Tbook 16 Power | |
| HP 250 G5 Y1V08UT | |
| Acer Switch One 10 SW1-011-14UQ | |
| 3DMark | |
| 1280x720 Cloud Gate Standard Graphics | |
| Acer Aspire ES1-731G-P5UR | |
| Cube i9 | |
| Acer TravelMate B117-M-P16Q | |
| Lenovo Yoga Book 2016 Windows 64GB LTE | |
| Chiligreen Mobilitas SF2600 | |
| HP 250 G5 Y1V08UT | |
| HP Pavilion x360 11t T5M27AV | |
| Teclast Tbook 16 Power | |
| 1920x1080 Fire Strike Graphics | |
| Acer Aspire ES1-731G-P5UR | |
| Acer TravelMate B117-M-P16Q | |
| HP Pavilion x360 11t T5M27AV | |
| 3DMark 06 Standard Score | 2274 punti | |
| 3DMark 11 Performance | 451 punti | |
| 3DMark Cloud Gate Standard Score | 1743 punti | |
Aiuto | ||
| Dota 2 Reborn - 1280x720 min (0/3) fastest | |
| Cube i9 | |
| Acer Swift 1 SF114-31-P6F6 | |
| Teclast Tbook 16 Power | |
| Chuwi Hi12 | |
| World of Warships - 1366x768 Low Preset AF:Trilinear | |
| Cube i9 | |
| Acer TravelMate B117-M-P16Q | |
| Teclast Tbook 16 Power | |
| Chuwi Hi12 | |
| Farming Simulator 17 - 1280x720 Low Preset | |
| Cube i9 | |
| Acer Swift 1 SF114-31-P6F6 | |
| Chuwi Hi12 | |
| Teclast Tbook 16 Power | |
| basso | medio | alto | ultra | |
|---|---|---|---|---|
| Dota 2 Reborn (2015) | 22.1 | 13.7 | ||
| World of Warships (2015) | 15 | |||
| Farming Simulator 17 (2016) | 17.6 | |||
| Rocket League (2017) | 18.7 | |||
| Team Fortress 2 (2017) | 19.6 | |||
| Battle Bay (2018) | 37 | |||
| World of Tanks Blitz (2018) | 37 | 24 | ||
| Arena of Valor (2018) | 25 | |||
| Shadow Fight 3 (2018) | 30 | |||
| PUBG Mobile (2018) | 0 il gioco non si è avviato (Hangs after a few minutes) | |||
| League of Legends (2019) | 23.6 | 18 | 13.9 | |
| Hearthstone (2020) | 17.8 | 18 | 9.91 |
(±) La temperatura massima sul lato superiore è di 43 °C / 109 F, rispetto alla media di 35.4 °C / 96 F, che varia da 19.6 a 60 °C per questa classe Convertible.
(±) Il lato inferiore si riscalda fino ad un massimo di 40 °C / 104 F, rispetto alla media di 36.9 °C / 98 F
(+) In idle, la temperatura media del lato superiore è di 27.9 °C / 82 F, rispetto alla media deld ispositivo di 30.3 °C / 87 F.
(-) I poggiapolsi e il touchpad possono diventare molto caldi al tatto con un massimo di 41 °C / 105.8 F.
(-) La temperatura media della zona del palmo della mano di dispositivi simili e'stata di 28 °C / 82.4 F (-13 °C / -23.4 F).
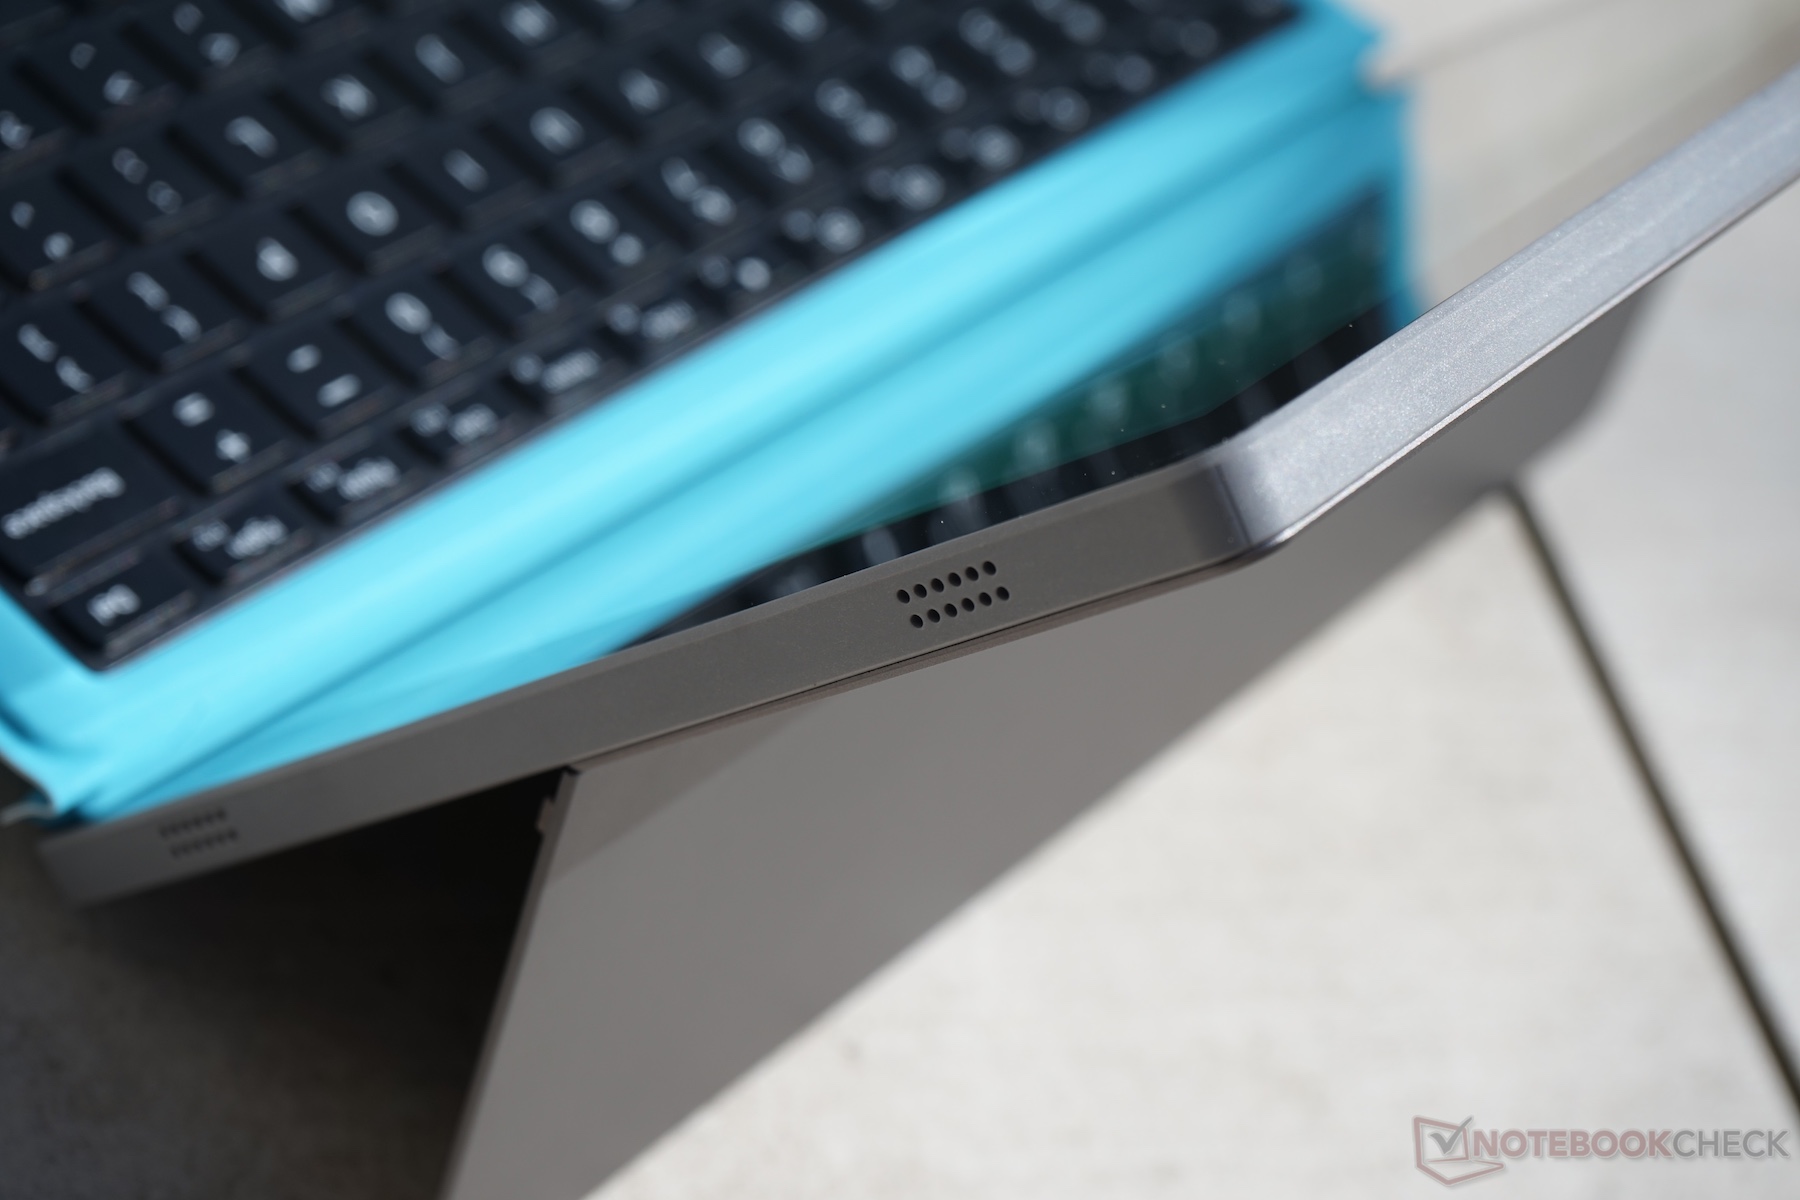
Teclast Tbook 16 Power analisi audio
(-) | altoparlanti non molto potenti (70.6 dB)
Bassi 100 - 315 Hz
(±) | bassi ridotti - in media 14.3% inferiori alla media
(±) | la linearità dei bassi è media (8.4% delta rispetto alla precedente frequenza)
Medi 400 - 2000 Hz
(±) | medi elevati - circa 13.2% superiore alla media
(-) | medi non in linea (26.2% delta rispetto alla precedente frequenza)
Alti 2 - 16 kHz
(±) | alti elevati - circa 12.2% superiori alla media
(-) | alti non lineari (22.3% delta rispetto alla precedente frequenza)
Nel complesso 100 - 16.000 Hz
(-) | suono nel complesso non lineare (56.8% di differenza rispetto alla media
Rispetto alla stessa classe
» 100% di tutti i dispositivi testati in questa classe è stato migliore, 0% simile, 0% peggiore
» Il migliore ha avuto un delta di 6%, medio di 20%, peggiore di 57%
Rispetto a tutti i dispositivi testati
» 96% di tutti i dispositivi testati in questa classe è stato migliore, 0% similare, 4% peggiore
» Il migliore ha avuto un delta di 4%, medio di 24%, peggiore di 134%
Apple MacBook 12 (Early 2016) 1.1 GHz analisi audio
(+) | gli altoparlanti sono relativamente potenti (83.6 dB)
Bassi 100 - 315 Hz
(±) | bassi ridotti - in media 11.3% inferiori alla media
(±) | la linearità dei bassi è media (14.2% delta rispetto alla precedente frequenza)
Medi 400 - 2000 Hz
(+) | medi bilanciati - solo only 2.4% rispetto alla media
(+) | medi lineari (5.5% delta rispetto alla precedente frequenza)
Alti 2 - 16 kHz
(+) | Alti bilanciati - appena 2% dalla media
(+) | alti lineari (4.5% delta rispetto alla precedente frequenza)
Nel complesso 100 - 16.000 Hz
(+) | suono nel complesso lineare (10.2% differenza dalla media)
Rispetto alla stessa classe
» 7% di tutti i dispositivi testati in questa classe è stato migliore, 2% simile, 91% peggiore
» Il migliore ha avuto un delta di 5%, medio di 18%, peggiore di 53%
Rispetto a tutti i dispositivi testati
» 5% di tutti i dispositivi testati in questa classe è stato migliore, 1% similare, 94% peggiore
» Il migliore ha avuto un delta di 4%, medio di 24%, peggiore di 134%
| Off / Standby | |
| Idle | |
| Sotto carico |
|
Leggenda:
min: | |
| Teclast Tbook 16 Power Z8750, HD Graphics 405 (Braswell), 64 GB eMMC Flash, IPS, 1920x1080, 11.6" | Chuwi Hi12 Z8300, HD Graphics (Cherry Trail), Hynix HCG8E 64 GB, IPS, 2160x1440, 12" | Cube i7 Book CDK09 6Y30, HD Graphics 515, FORESEE 64GB O1229B, IPS, 1920x1080, 10.6" | Cube i9 6Y30, HD Graphics 515, FORESEE 128GB O1229B, IPS, 1920x1200, 12.2" | Microsoft Surface 3 Z8700, HD Graphics (Cherry Trail), 128 GB eMMC Flash, IPS, 1920x1280, 10.8" | Acer Swift 1 SF114-31-P6F6 N3710, HD Graphics 405 (Braswell), 128 GB eMMC Flash, TN LED, 1366x768, 14" | |
|---|---|---|---|---|---|---|
| Power Consumption | 21% | -180% | -132% | -70% | -100% | |
| Idle Minimum * (Watt) | 2.6 | 1.7 35% | 6.6 -154% | 4.6 -77% | 2.5 4% | 4.1 -58% |
| Idle Average * (Watt) | 2.7 | 1.7 37% | 10 -270% | 9.6 -256% | 7 -159% | 8.3 -207% |
| Idle Maximum * (Watt) | 2.7 | 3.3 -22% | 12 -344% | 9.6 -256% | 8.4 -211% | 8.6 -219% |
| Load Average * (Watt) | 12.7 | 7.9 38% | 21.1 -66% | 18.6 -46% | 11.2 12% | 13.5 -6% |
| Load Maximum * (Watt) | 13.1 | 10.8 18% | 22 -68% | 16.3 -24% | 12.4 5% | 14.5 -11% |
* ... Meglio usare valori piccoli
| Battery Runtime - WiFi Websurfing | |
| Acer Swift 1 SF114-31-P6F6 | |
| Acer Switch One 10 SW1-011-14UQ | |
| Microsoft Surface Pro 4, Core m3 | |
| Chuwi Vi10 Ultimate 64GB | |
| Chuwi Hi12 | |
| Teclast Tbook 16 Power | |
| Chuwi Hi10 Pro | |
| Cube i7 Book CDK09 | |
| Cube i9 | |
| Teclast Tbook 10s | |
Pro
Contro
Il principale punto di forza del Teclast Tbook 16 Power è il suo veloce microprocessore Atom x7. Sebbene superi la concorrenza Atom x5, è risultato molto più lento dei concorrenti Core m3 e Pentium N3710.Specialmente con i giochi, l'Intel HD Graphics 405 è stata una grande delusione.
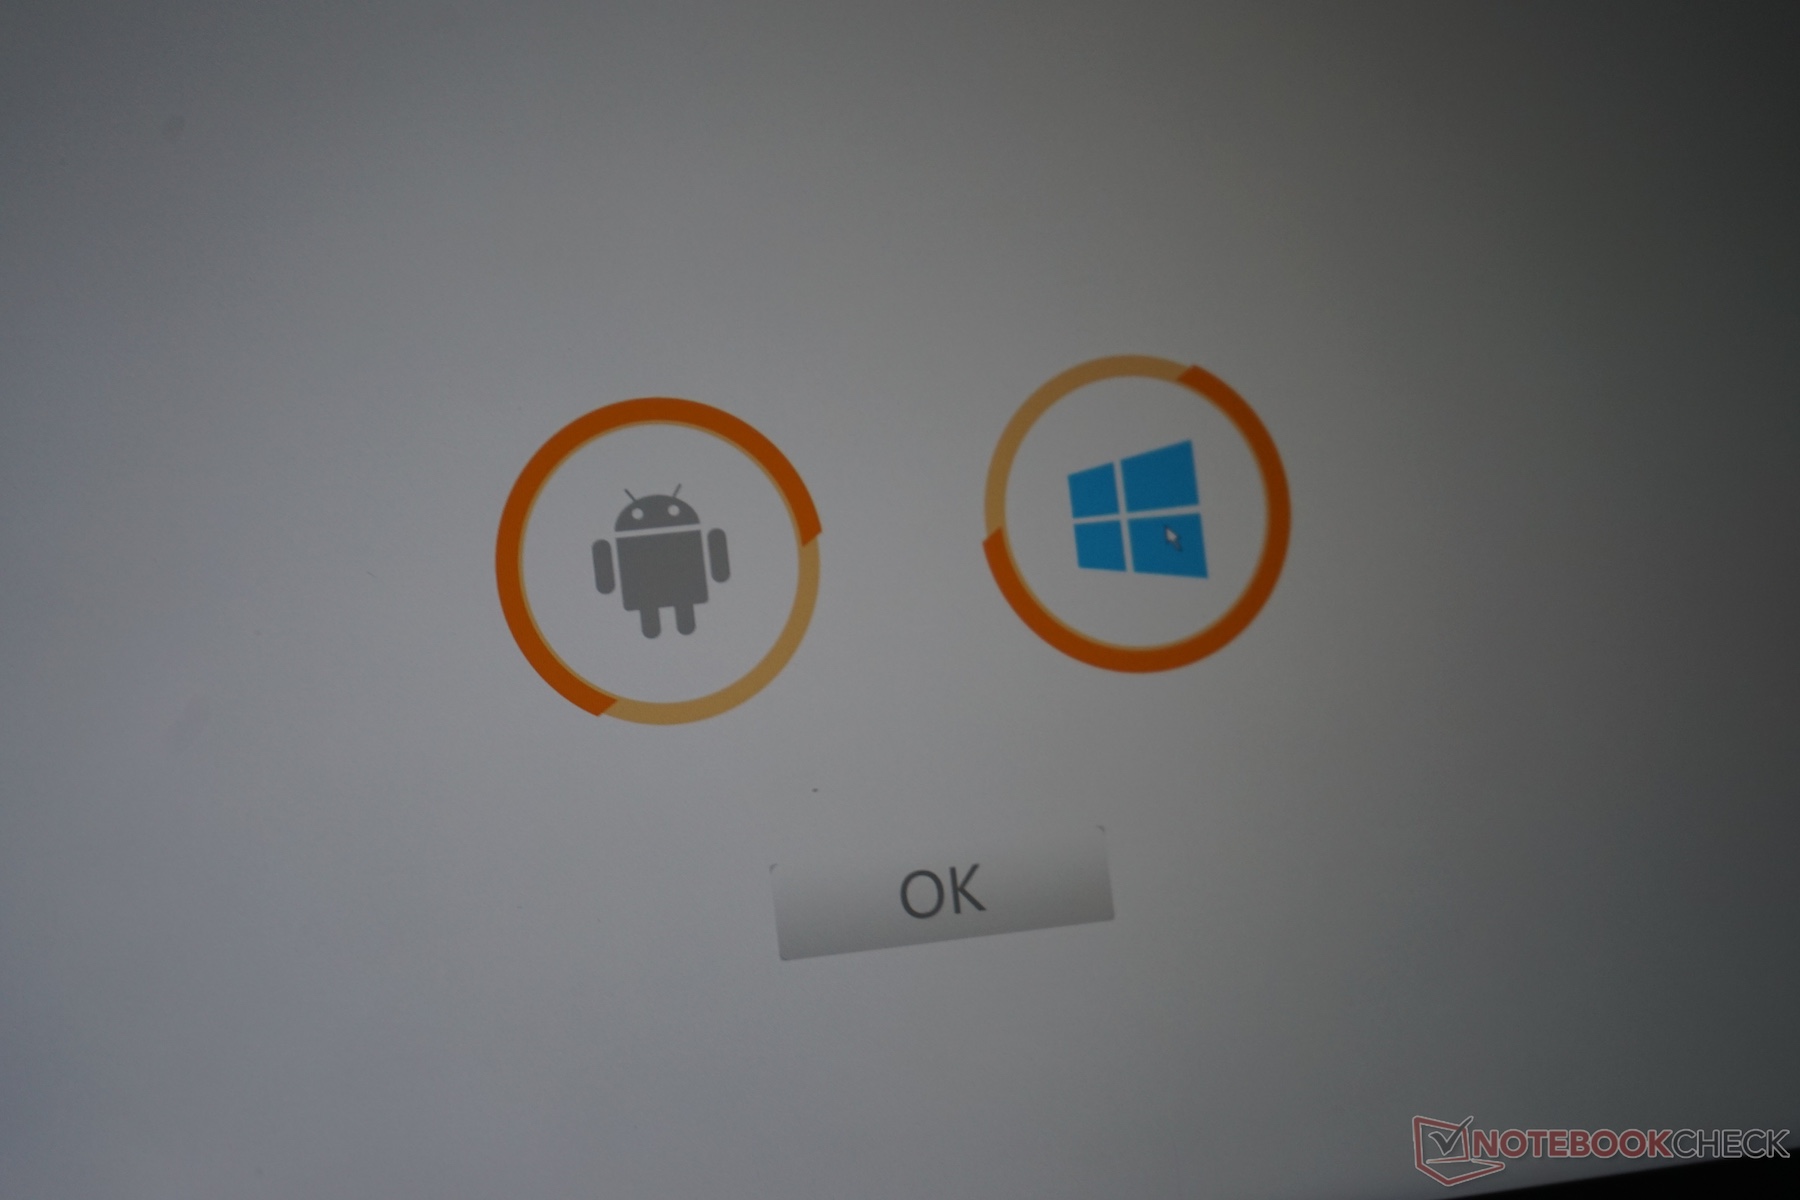
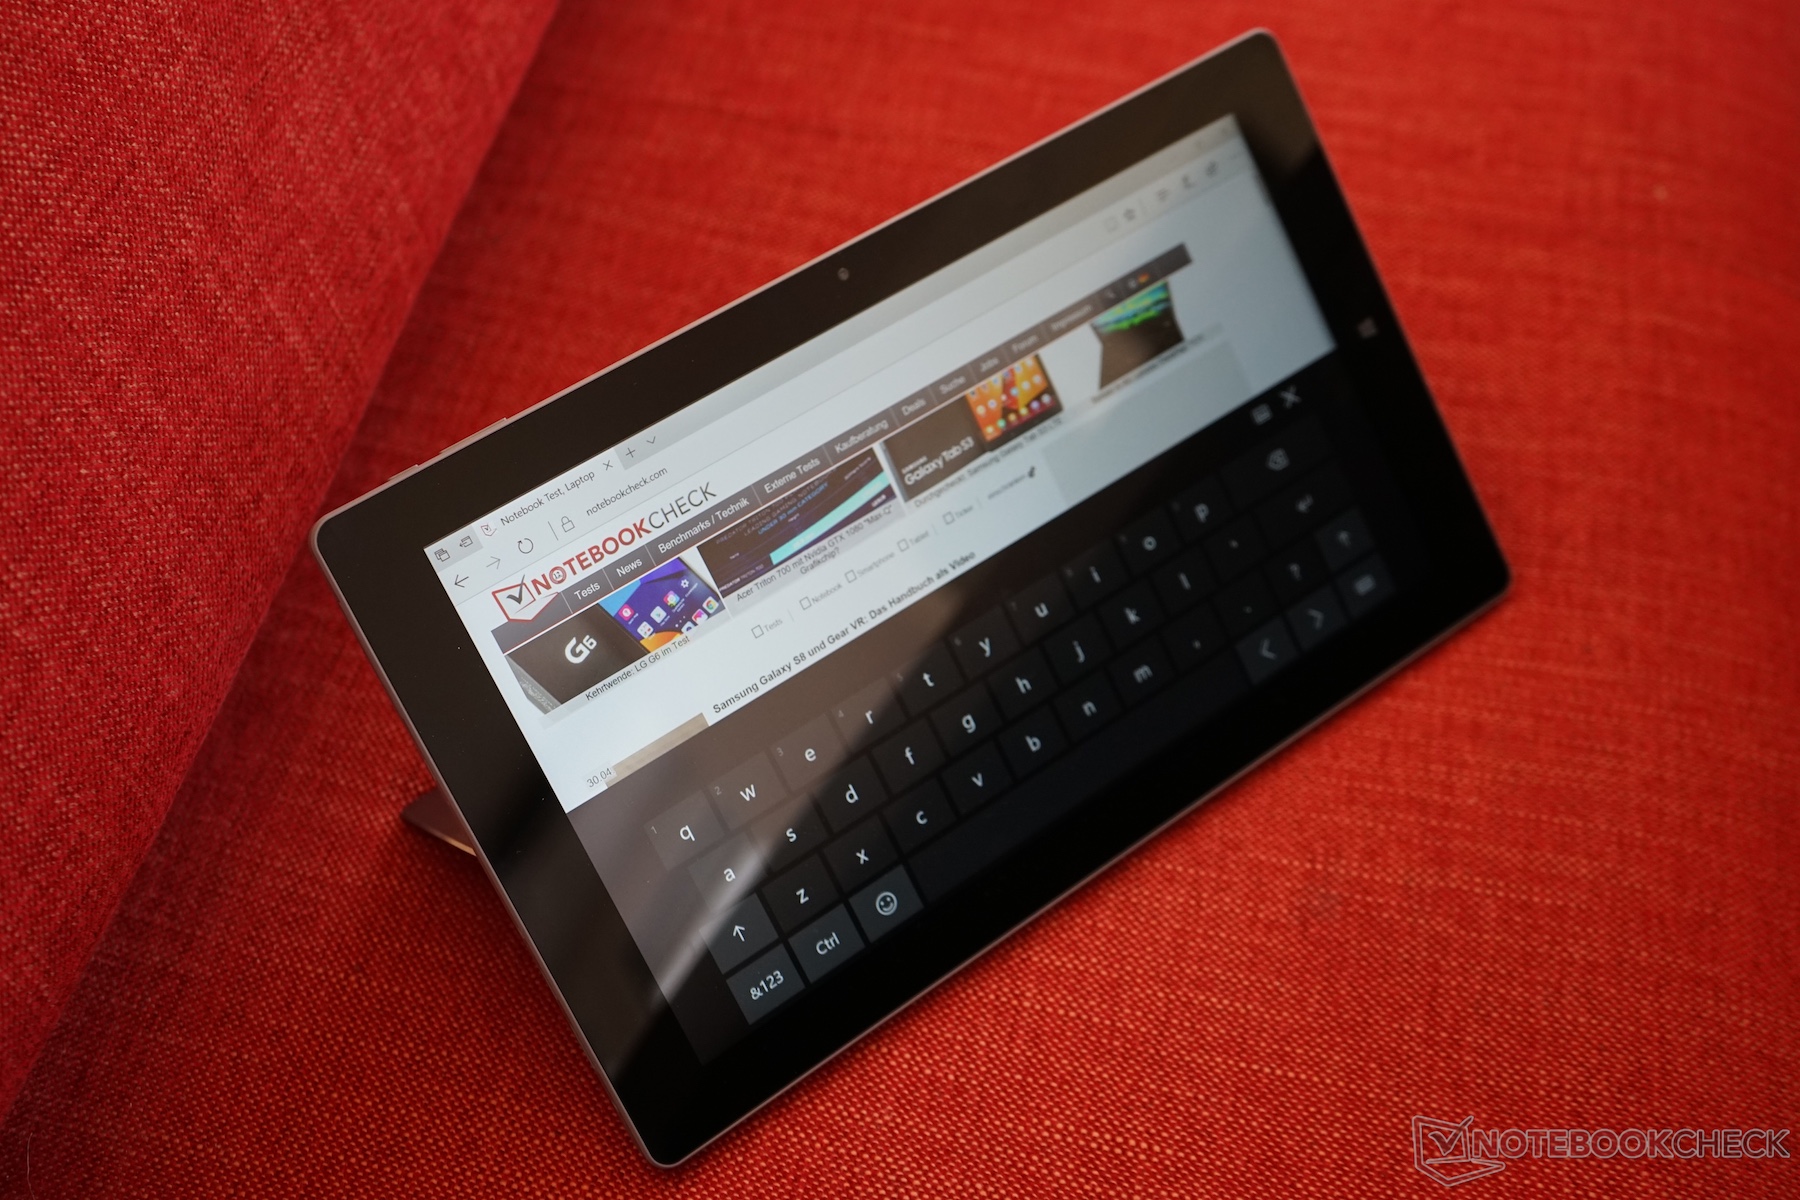
Un altro punto di forza è il sistema operativo Android 6. Nel breve periodo che abbiamo utilizzato il dispositivo, si è comportato molto bene e ha mostrato una certa fluidità. Sfortunatamente, l'opzione dual-boot è scomparsa dopo aver fatto un update di Windows, quindi non abbiamo potuto testarlo oltre.
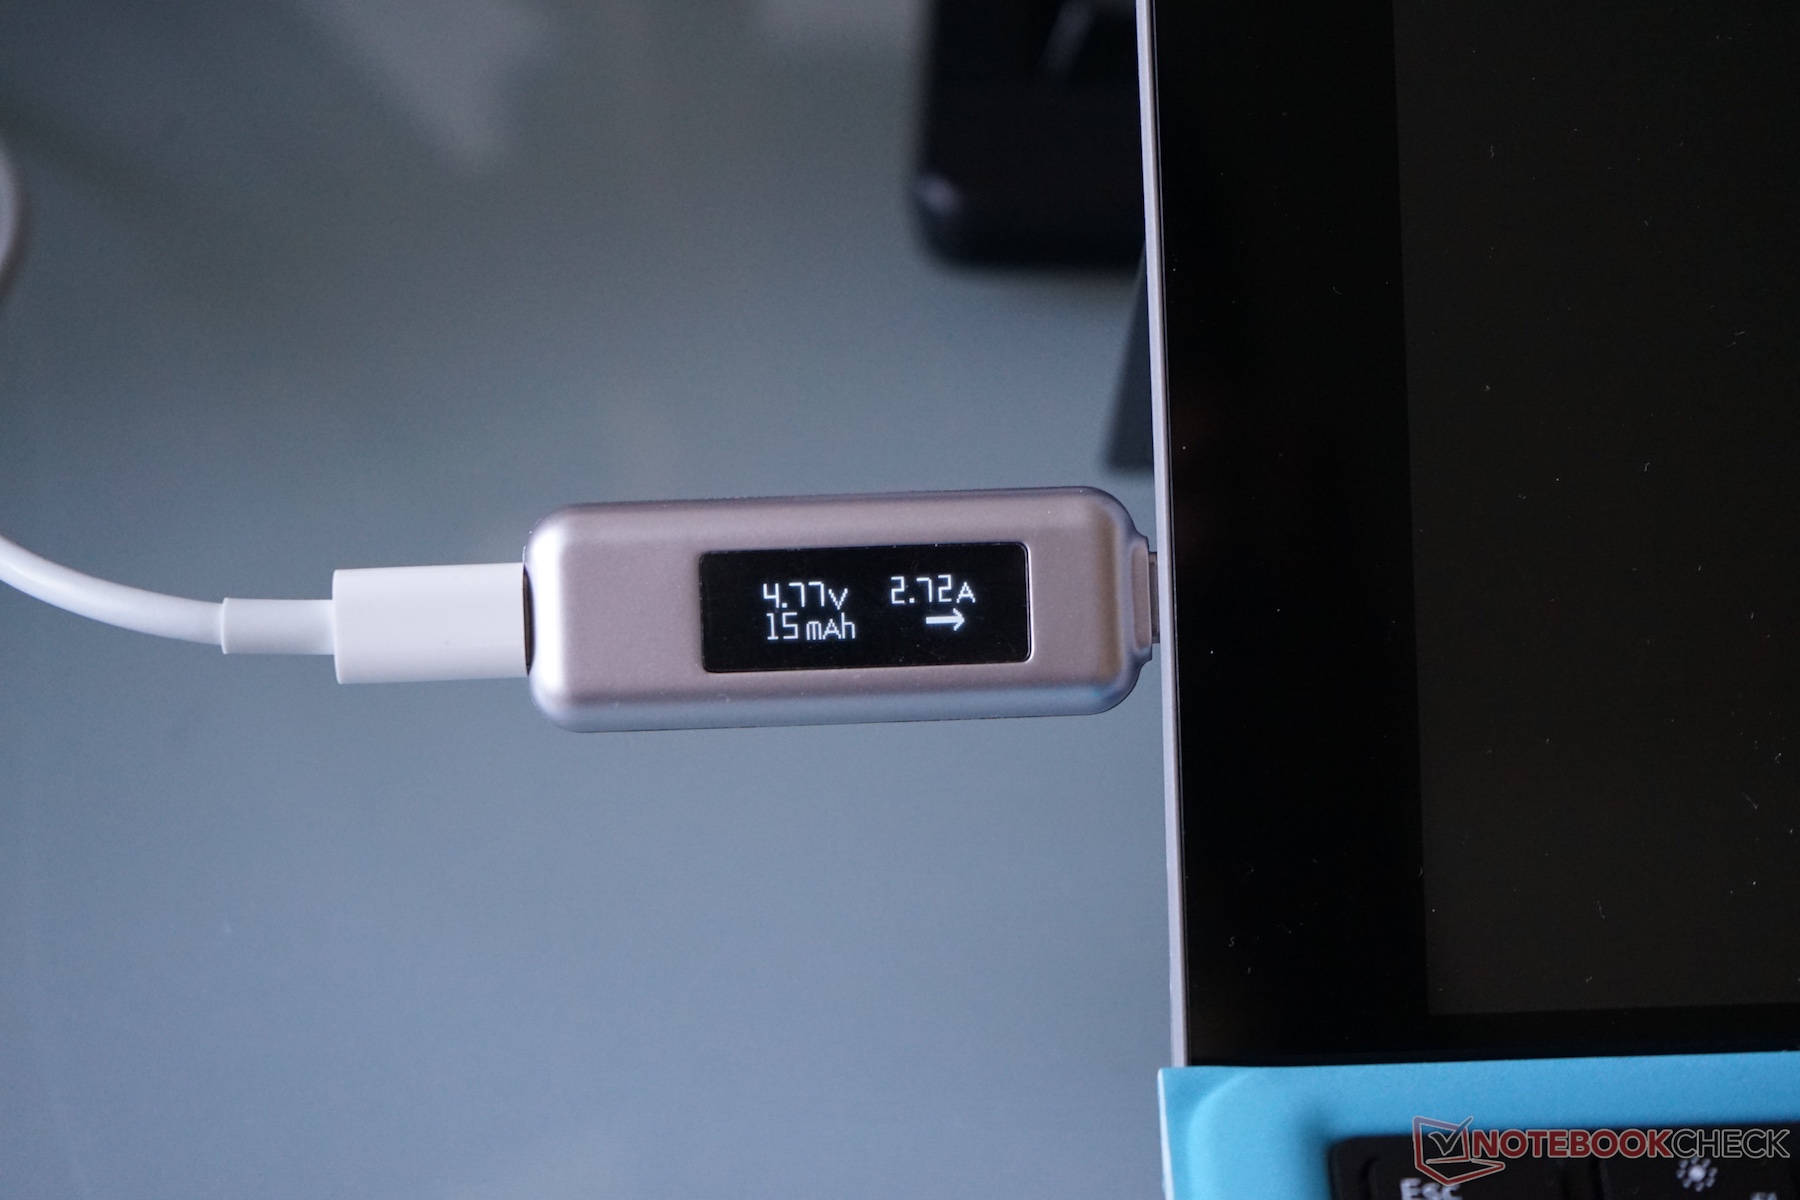
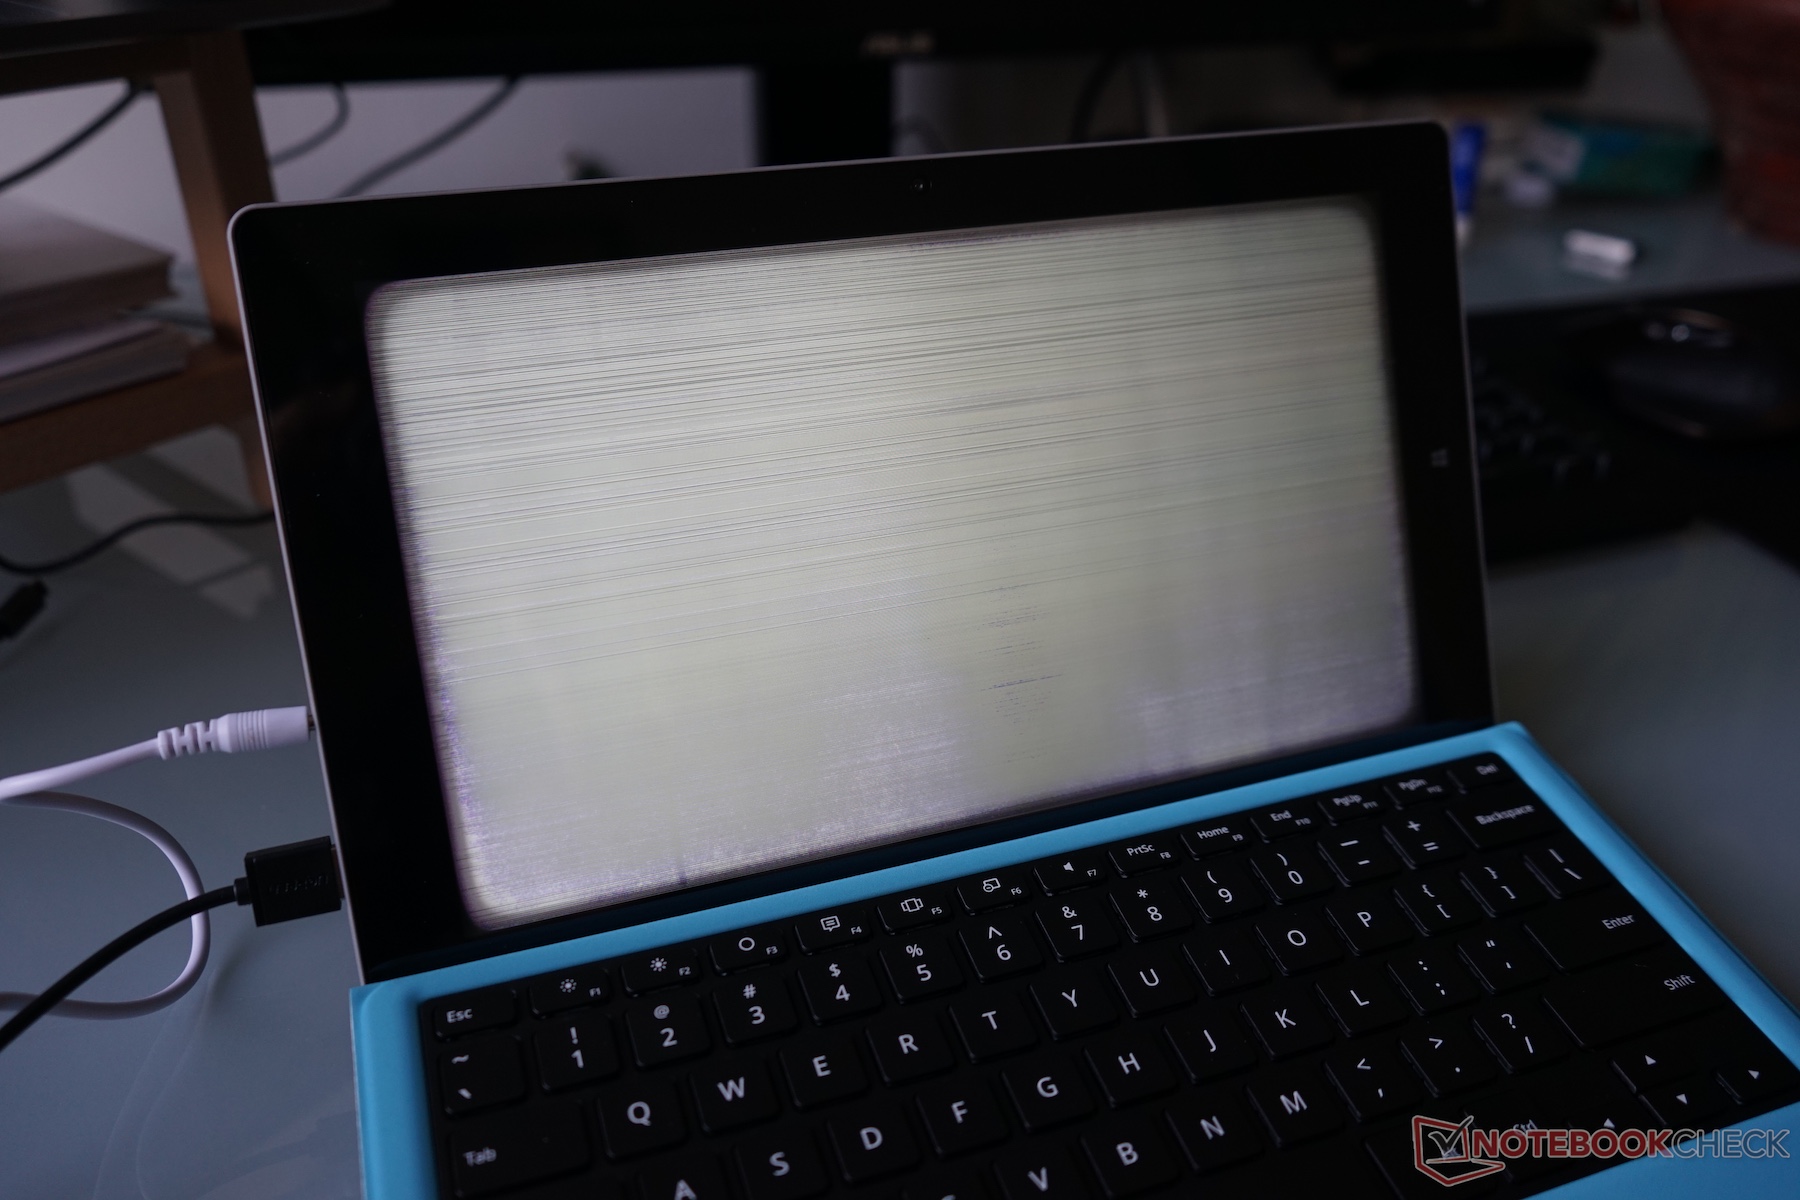
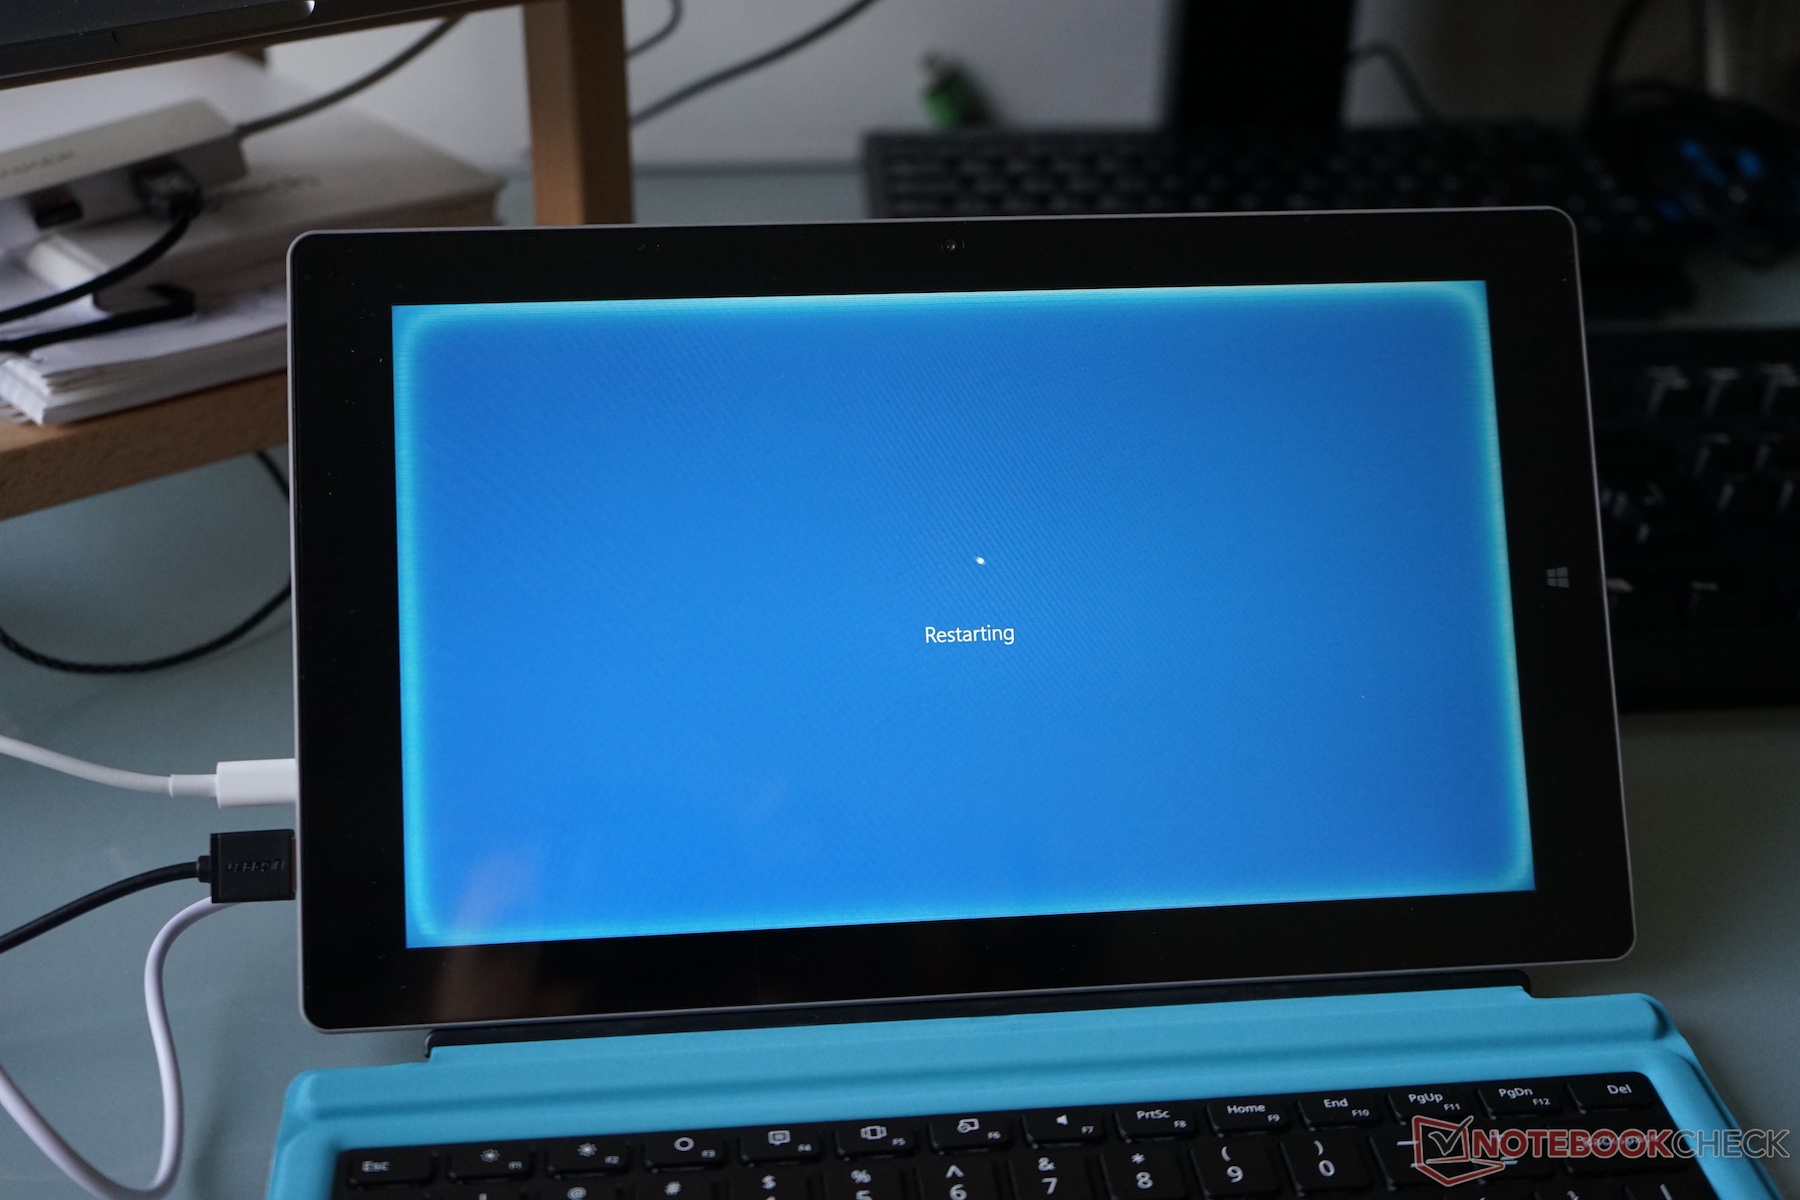
Nel complesso, abbiamo rilevato diversi problemi grandi e piccoli. Una mattina il display non mostrava nulla tranne un disturbo bianco e abbiamo dovuto riavviare il dispositivo. Per qualche motivo le estremità restavano più luminose rispetto al resto del display un paio di ore dopo. L'assenza di un caricatore può far venire mal di testa, in quanto non hanno funzionato caricatori USB Apple né Inateck né Anker’s ci sono stati sempre problemi. A volte non ricaricavano per nulla; altre si perdeva la connessione subito dopo che veniva completata la ricarica.
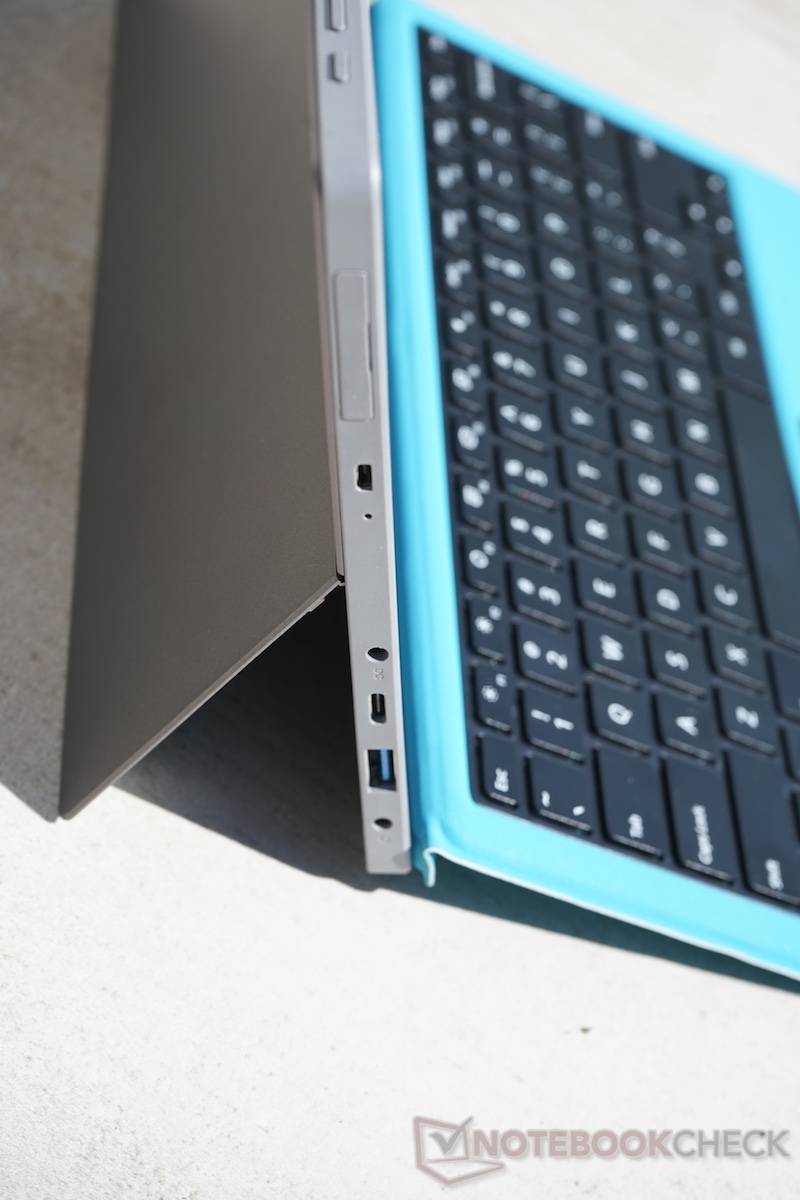
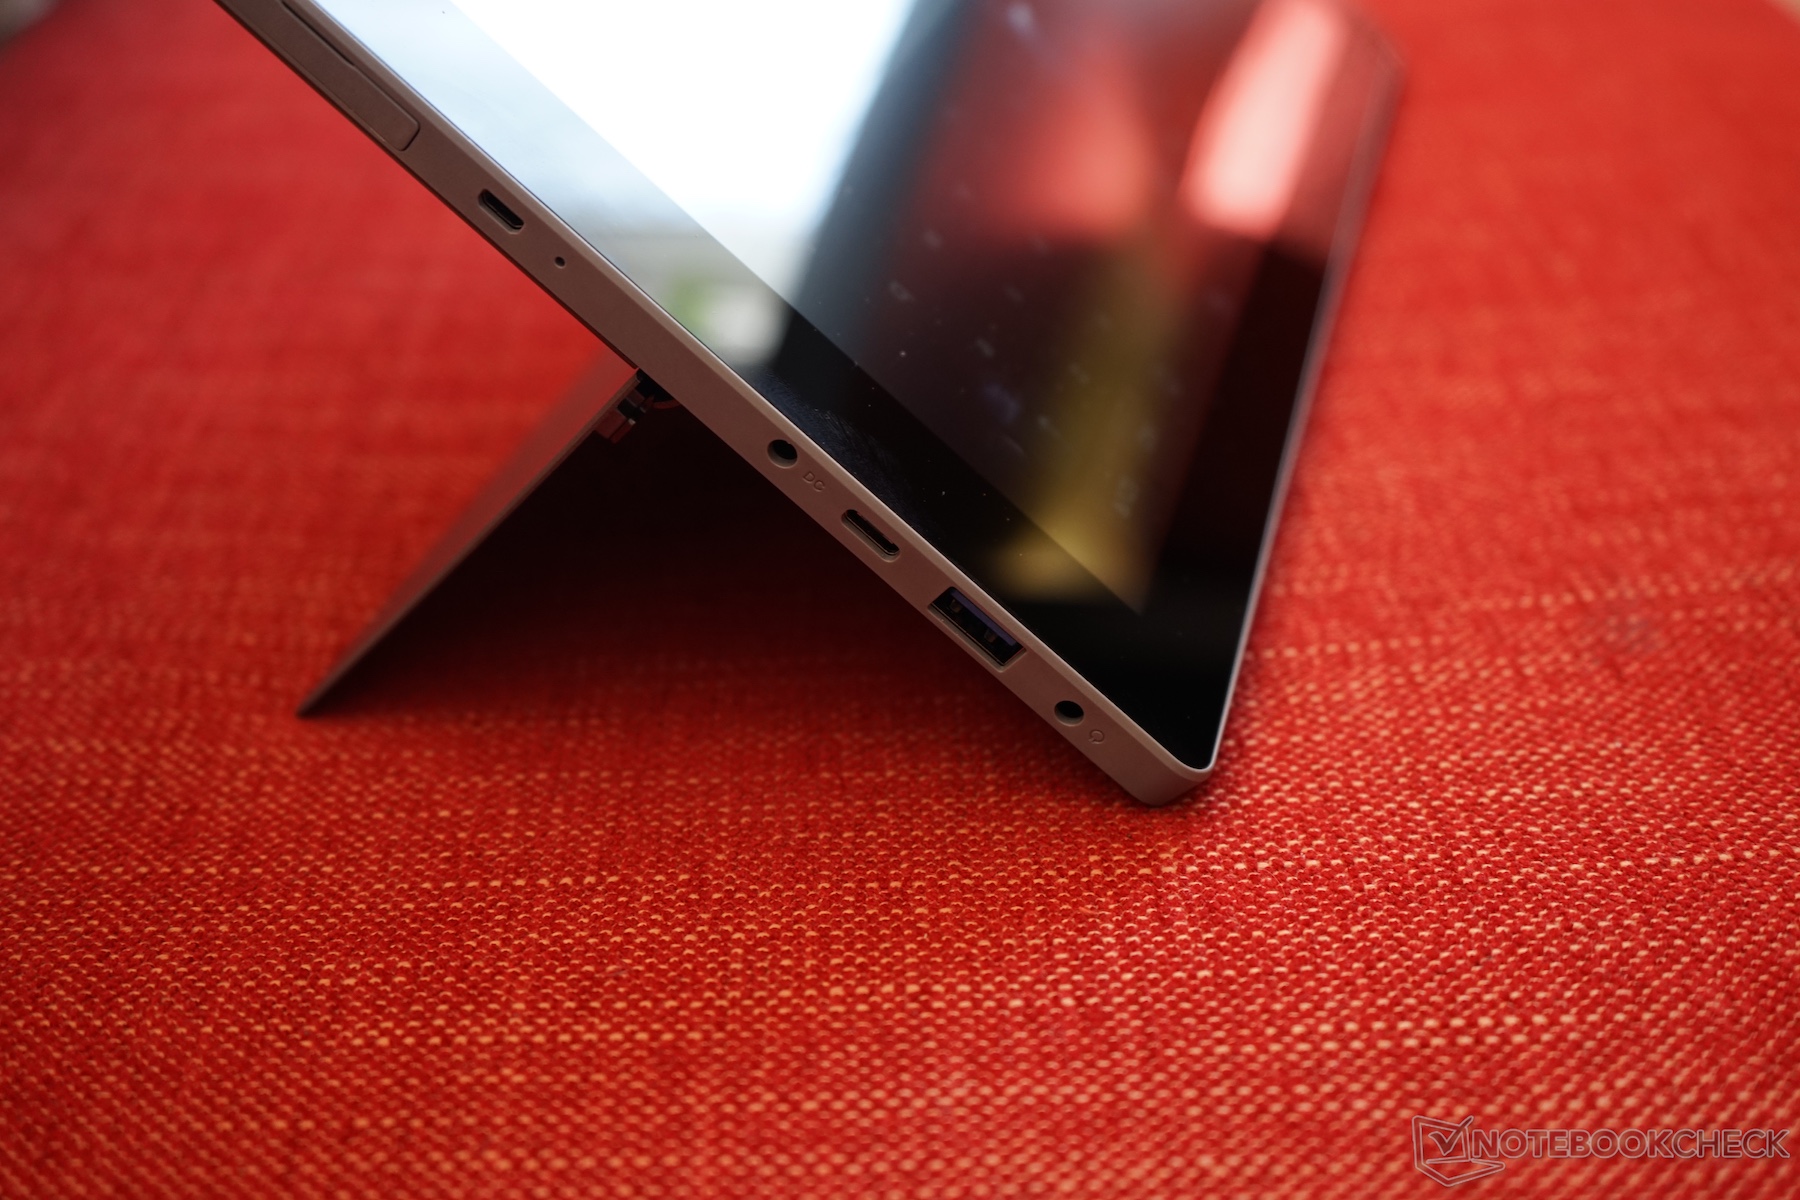
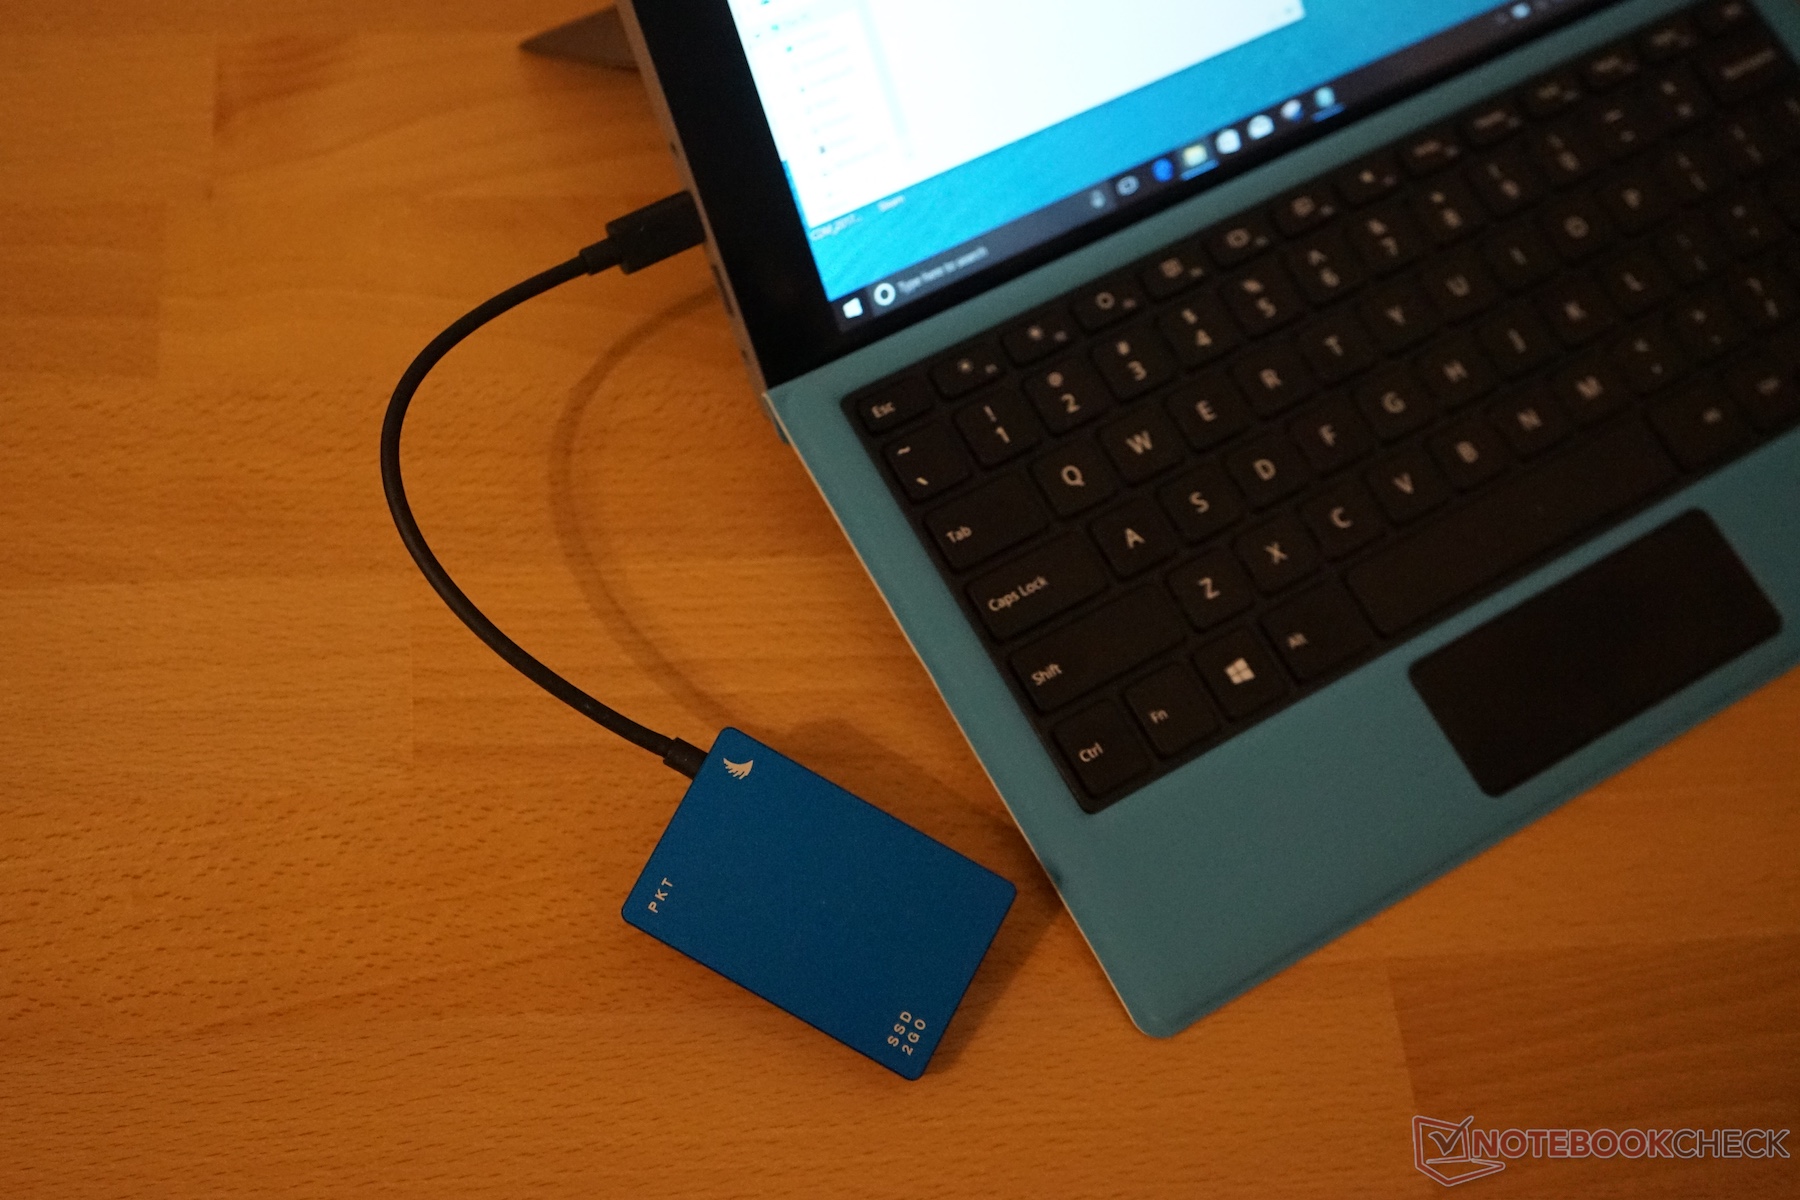
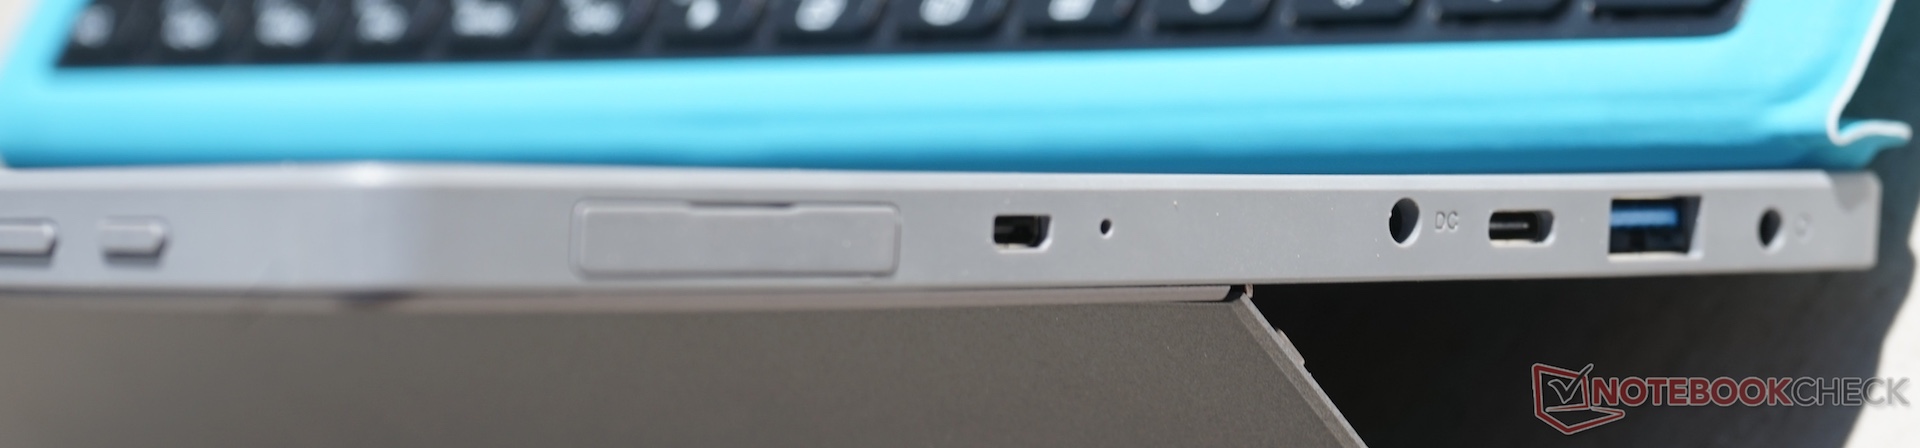
Le porte USB integrate non hanno funzionato secondo le attese, e non siamo stati in grado di usare un SSD esterno, come il Drive, l'Angelbird, o lo OCZ. Altri dispositivi, come un hard drive esterno o il SanDisk Extreme 900, hanno funzionato in modo impeccabile. Il nostro dubbio è che le porte USB non siano abbastanza potenti. Lo standby è stato un altro problema con il dispositivo. Oltre al consumo elevato in standby il tablet a volte restava acceso con lo schermo spento e con alcuni processi in background che caricavano la CPU assorbendo molta energia. Non siamo stati in grado di rilevare la causa; probabilmente un errore o un bug nei driver del dispositivo.
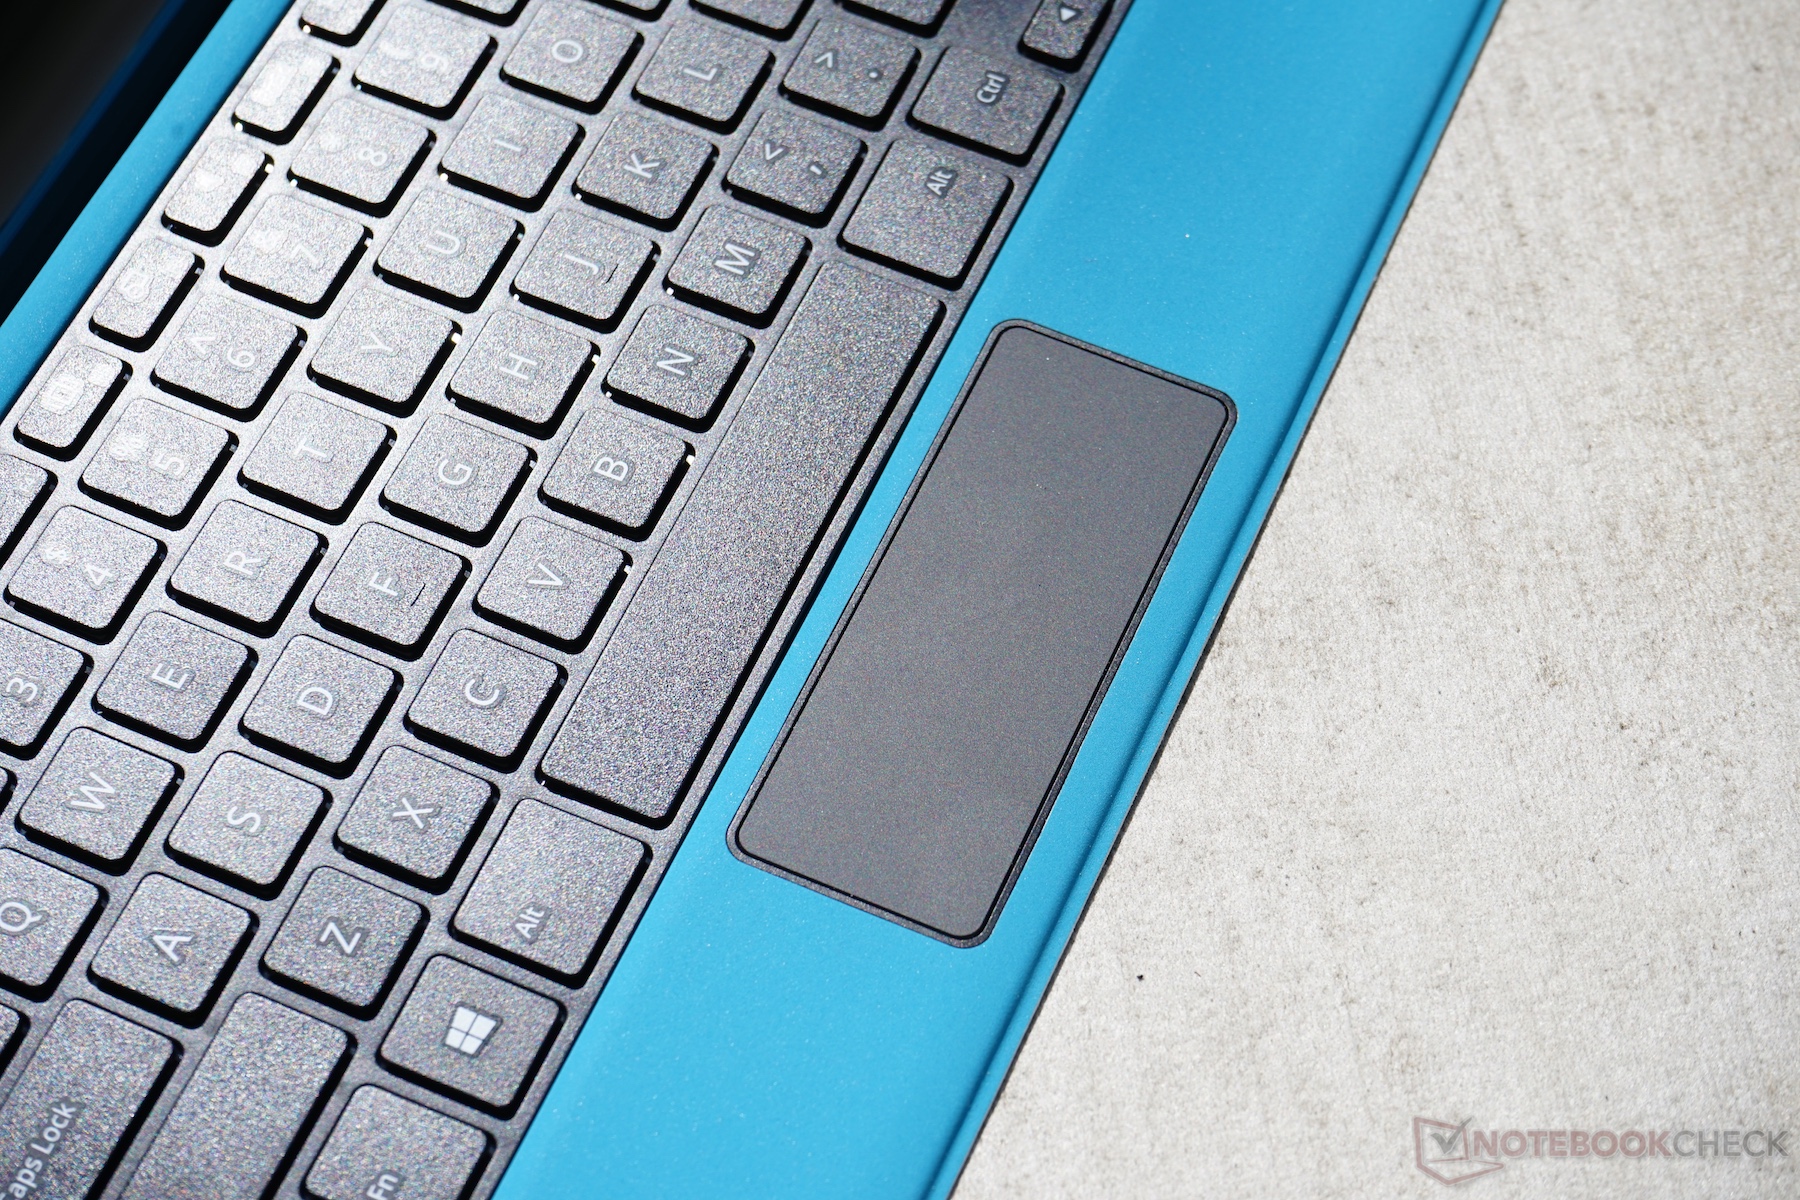
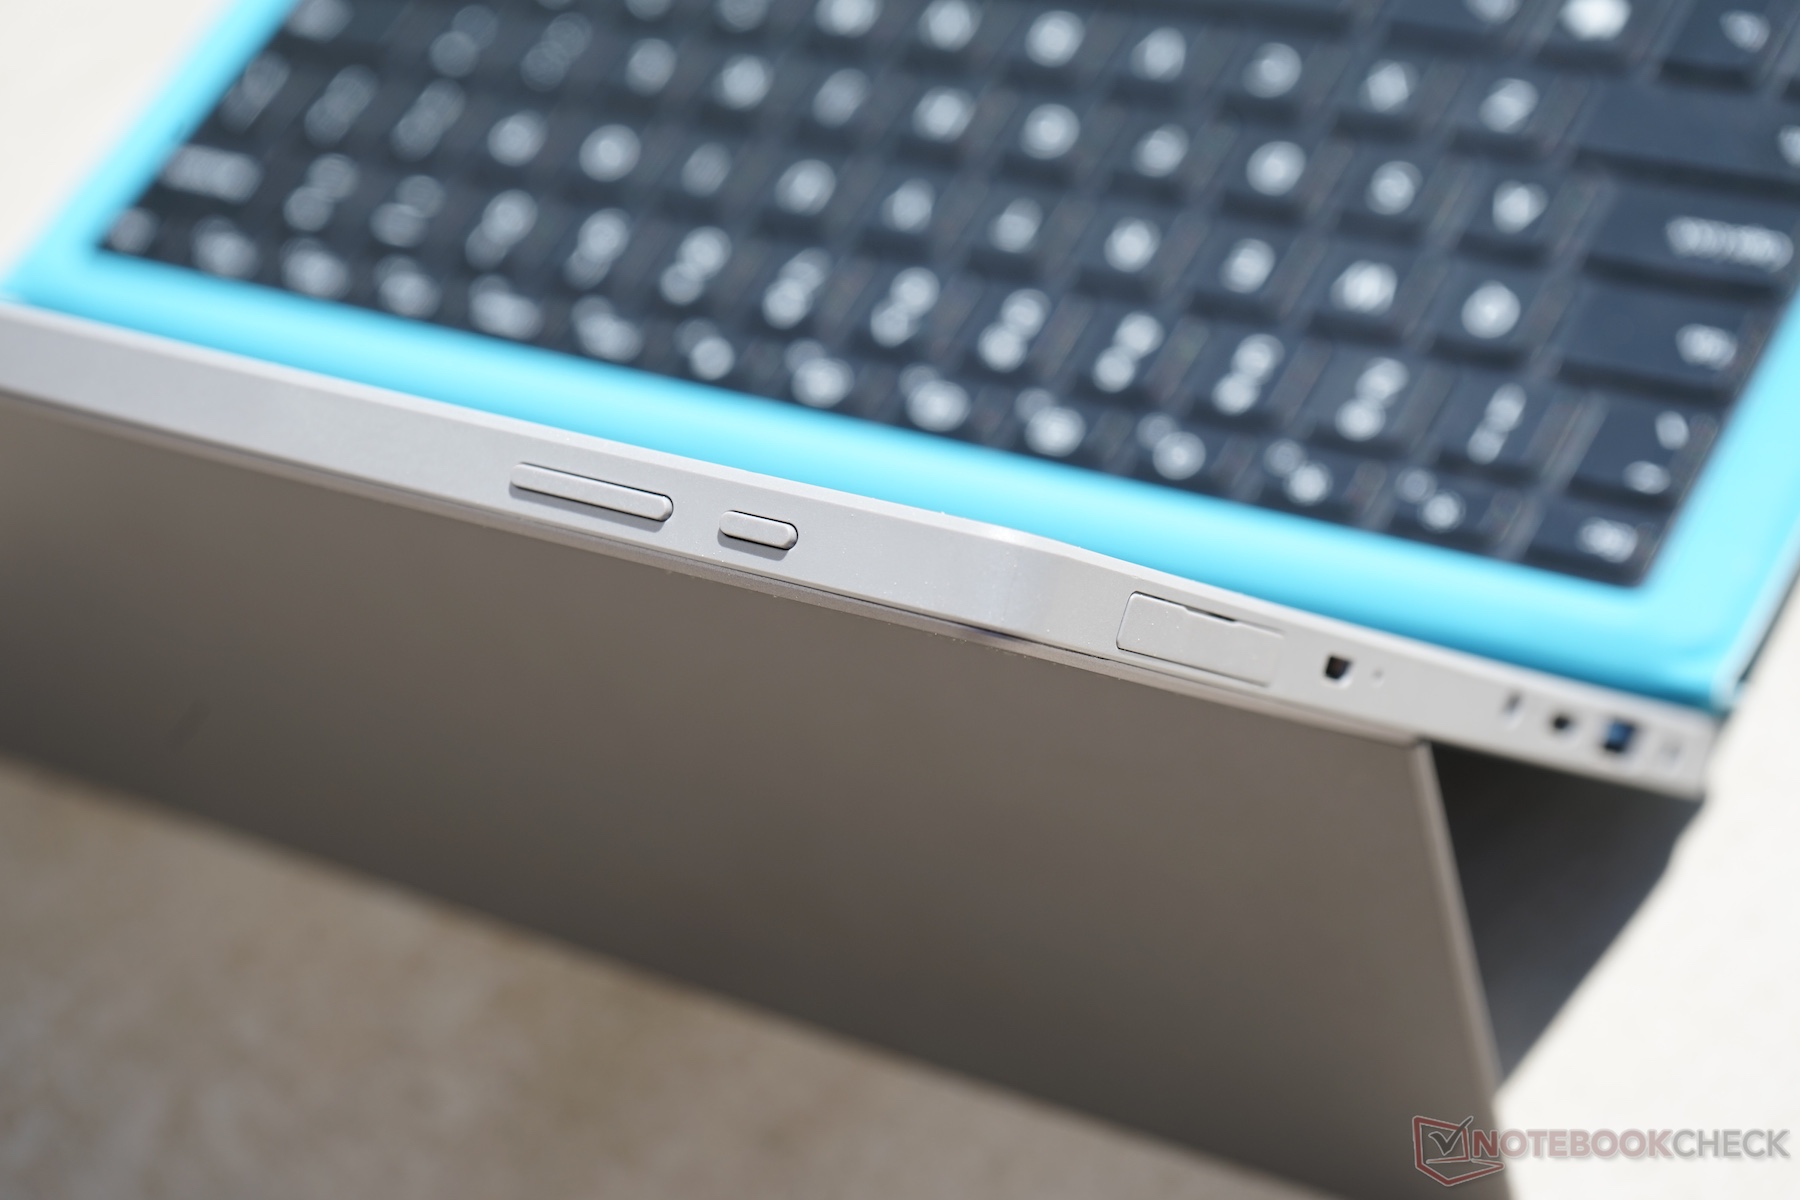
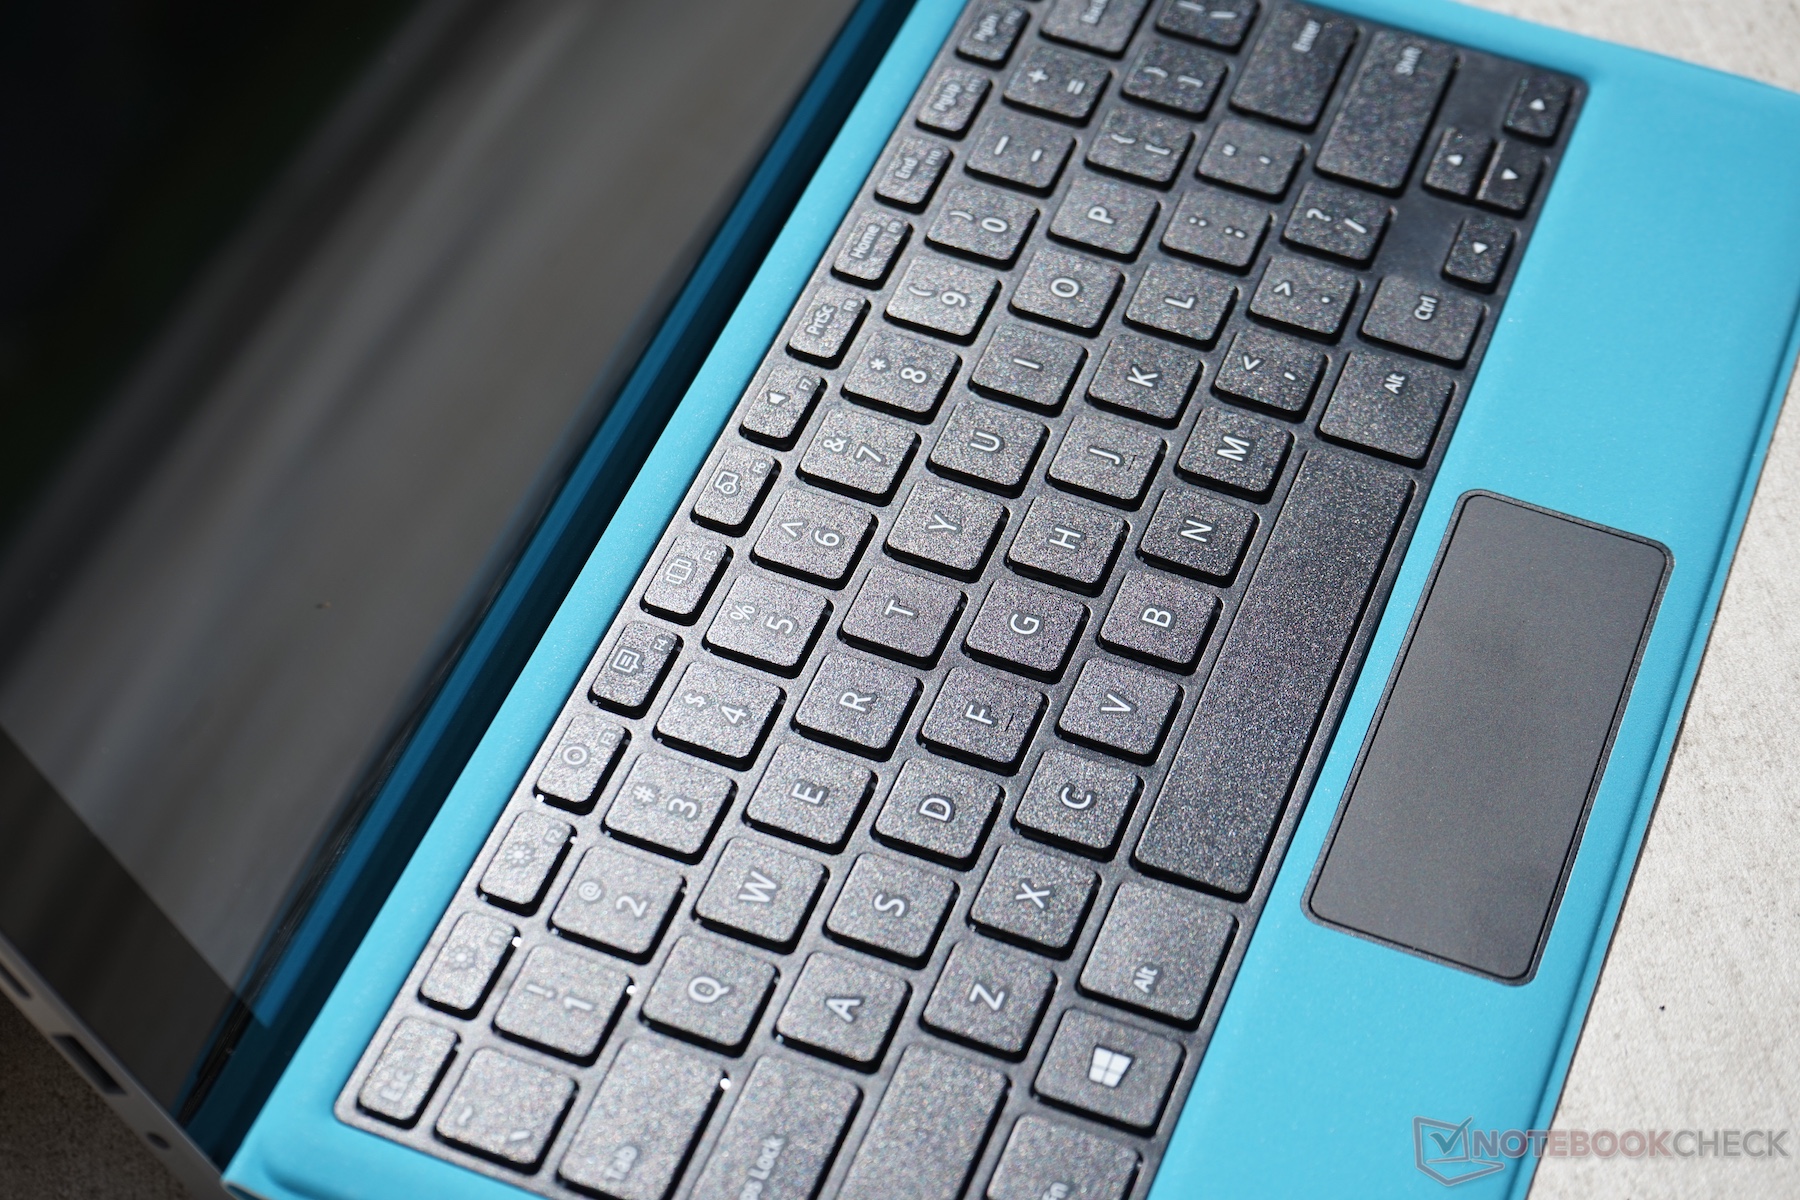
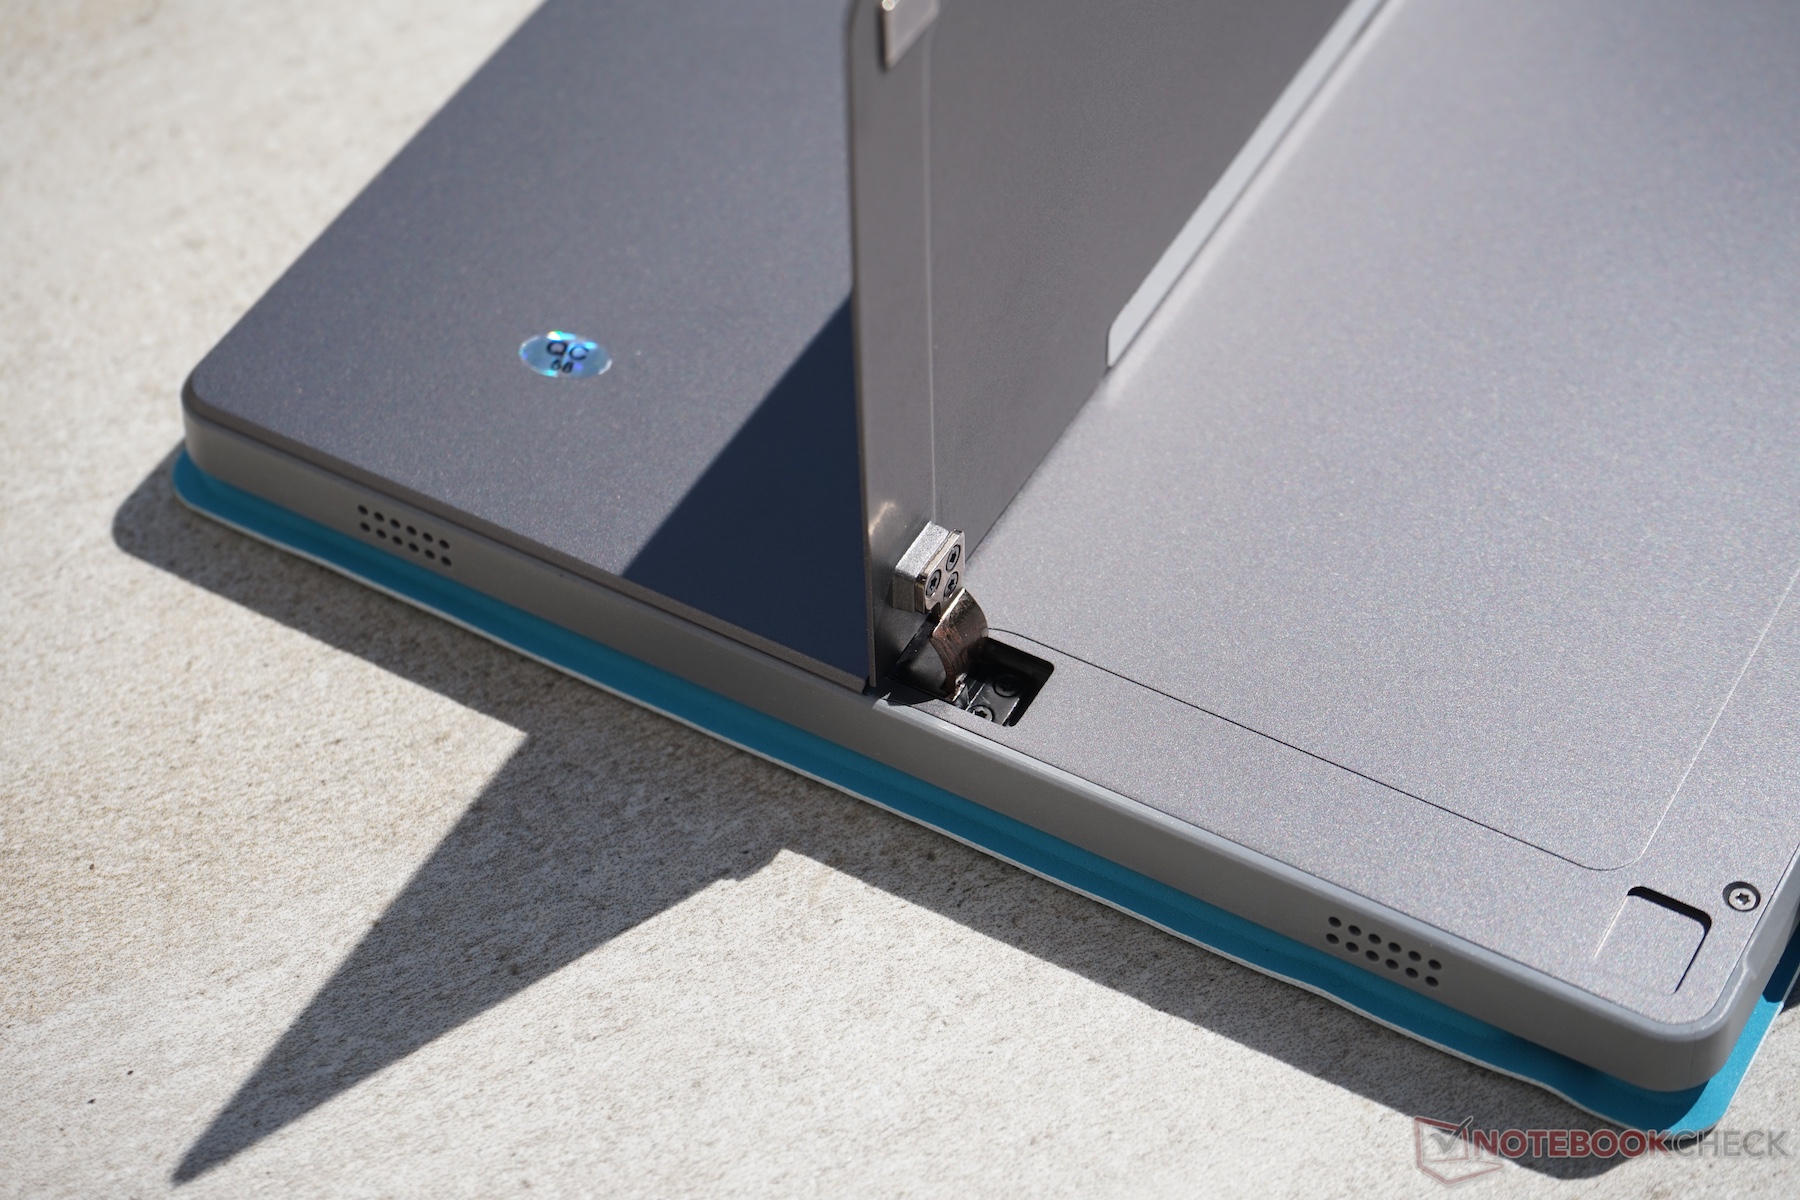
Oltre tutti questi problemi, il tablet ha un paio di pecche nel designo; fotocamere, casse e touchpad. In aggiunta, il dispositivo non è ancora disponibile in Europa a causa dell'assenza del certificato CE, e può essere solo importato dalla Cina in questo momento. Garanzia e supporto pertanto dipendono direttamente dal rivenditore, e prevedono dei costi di spedizione non indifferenti.
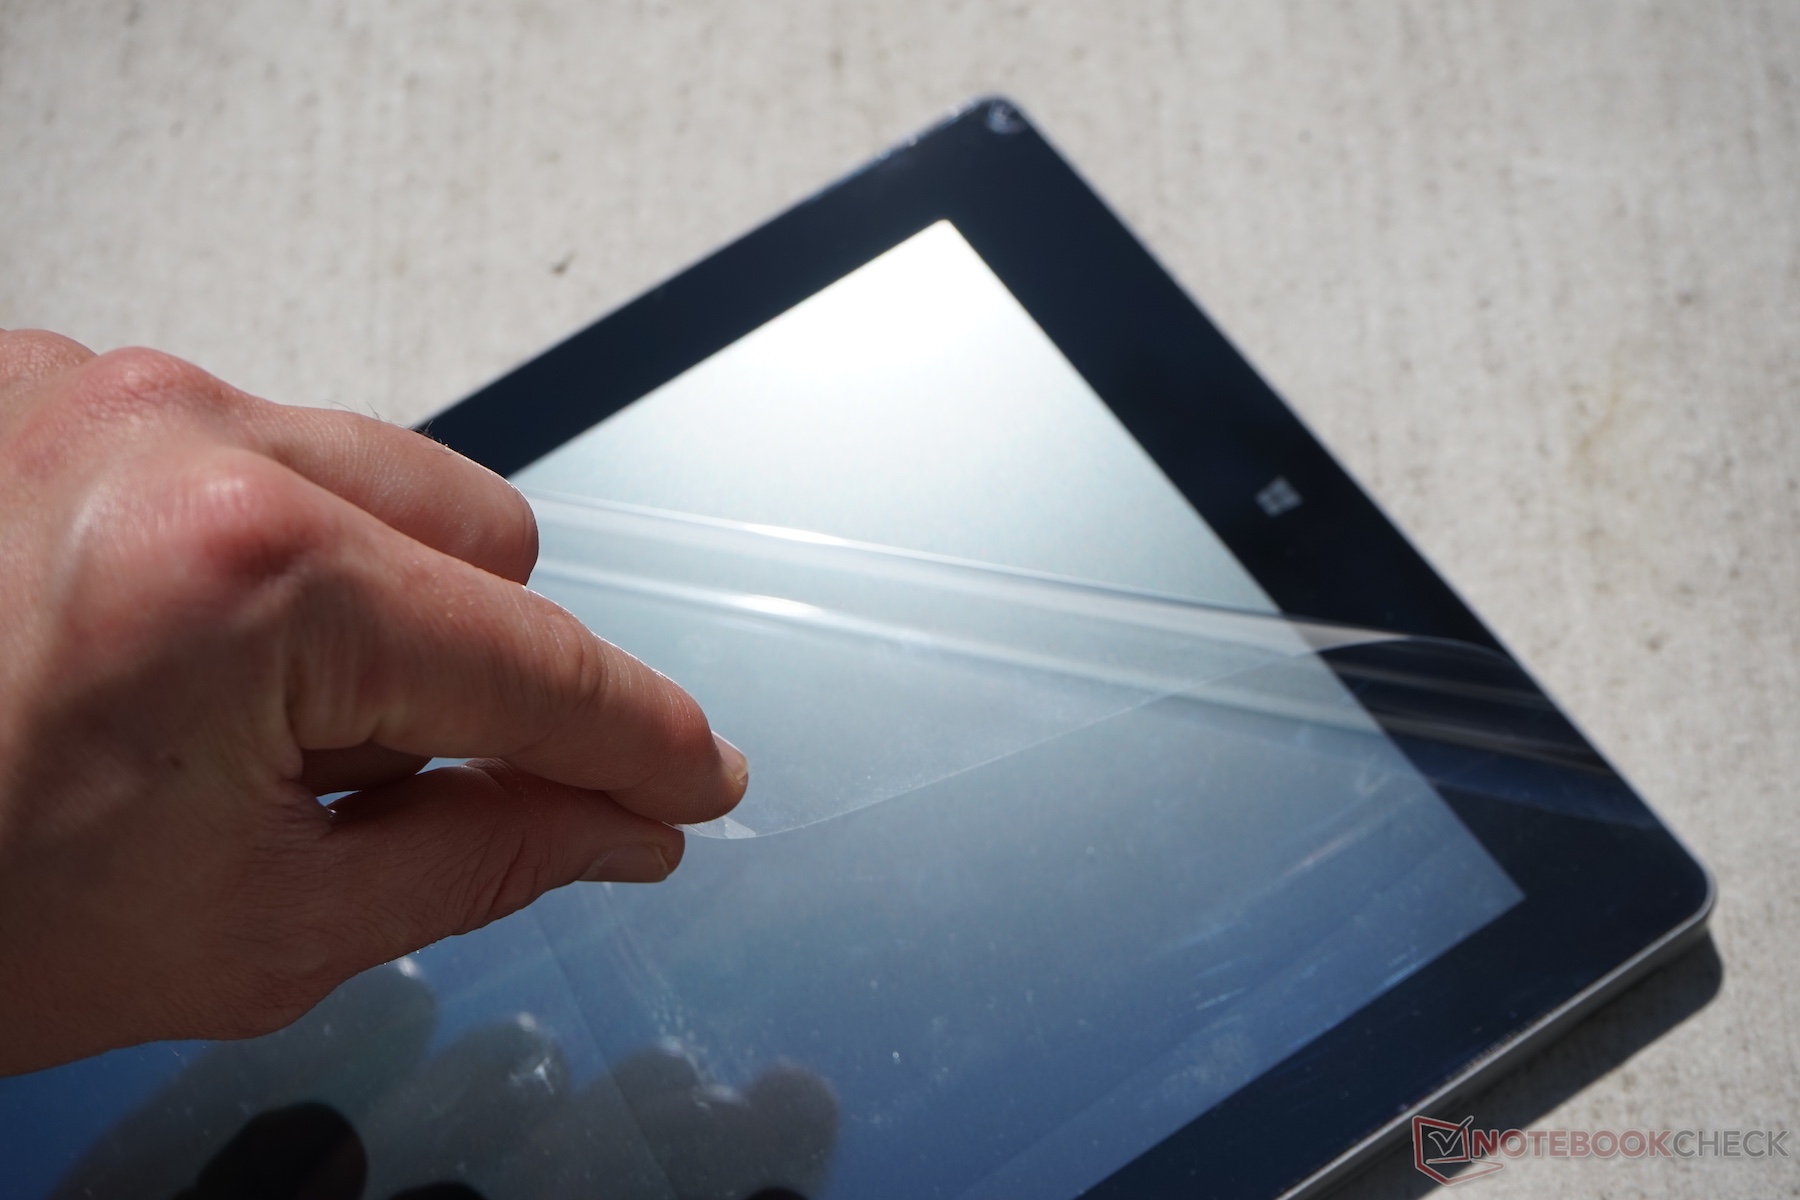
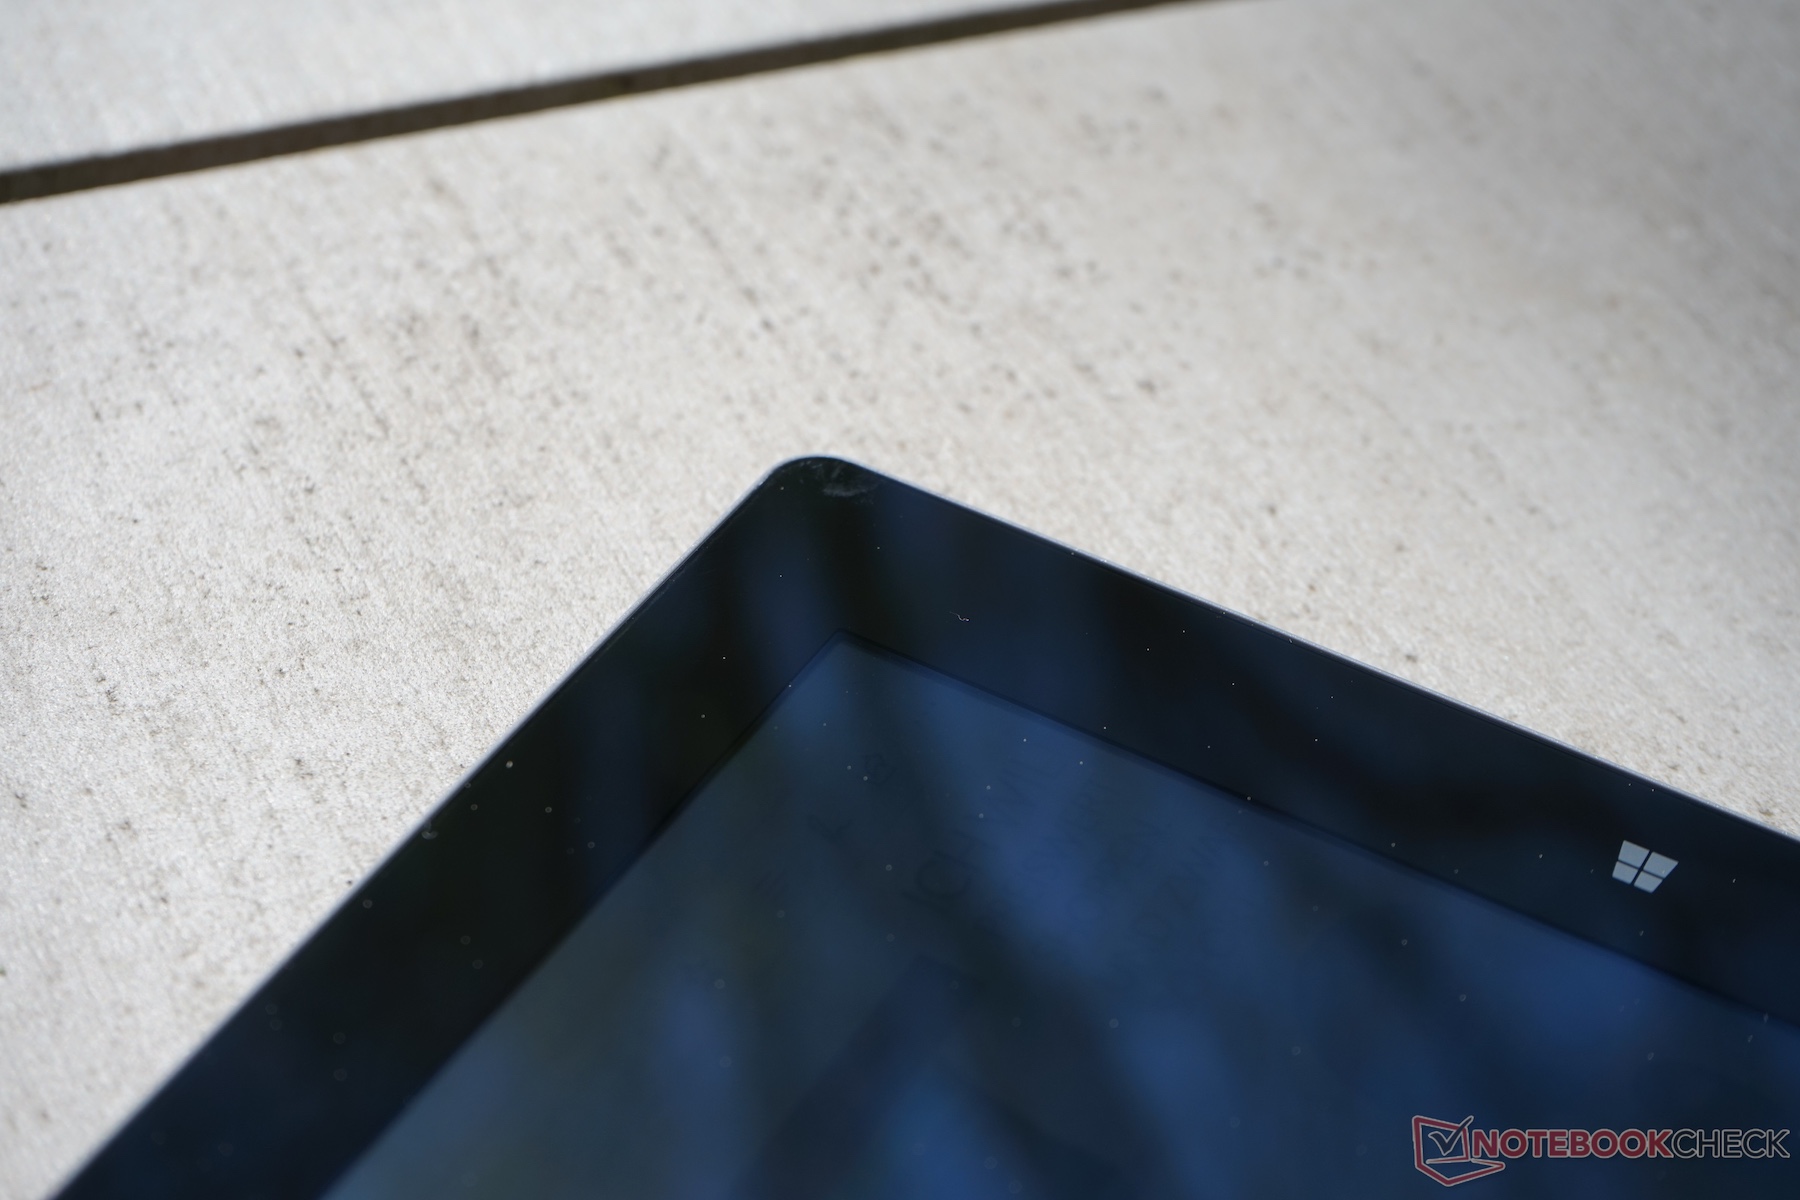
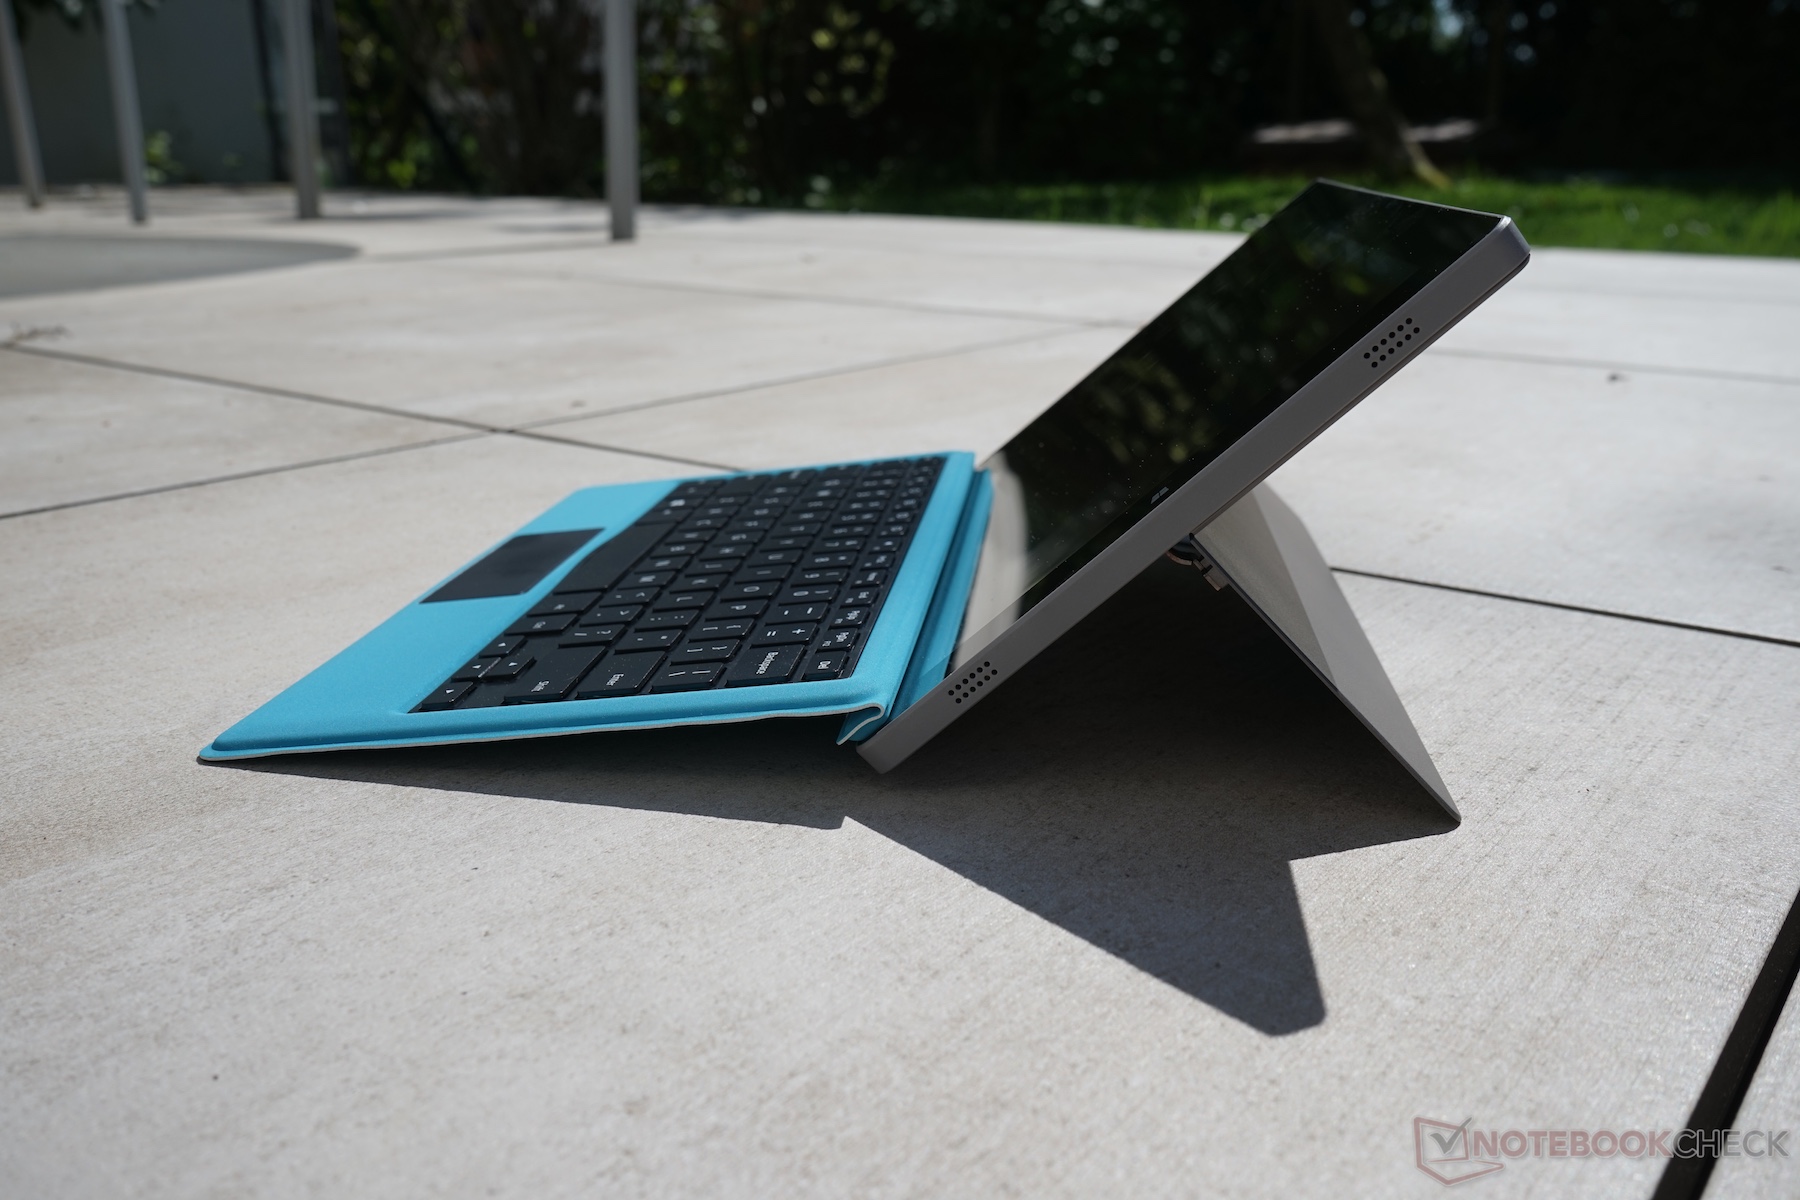
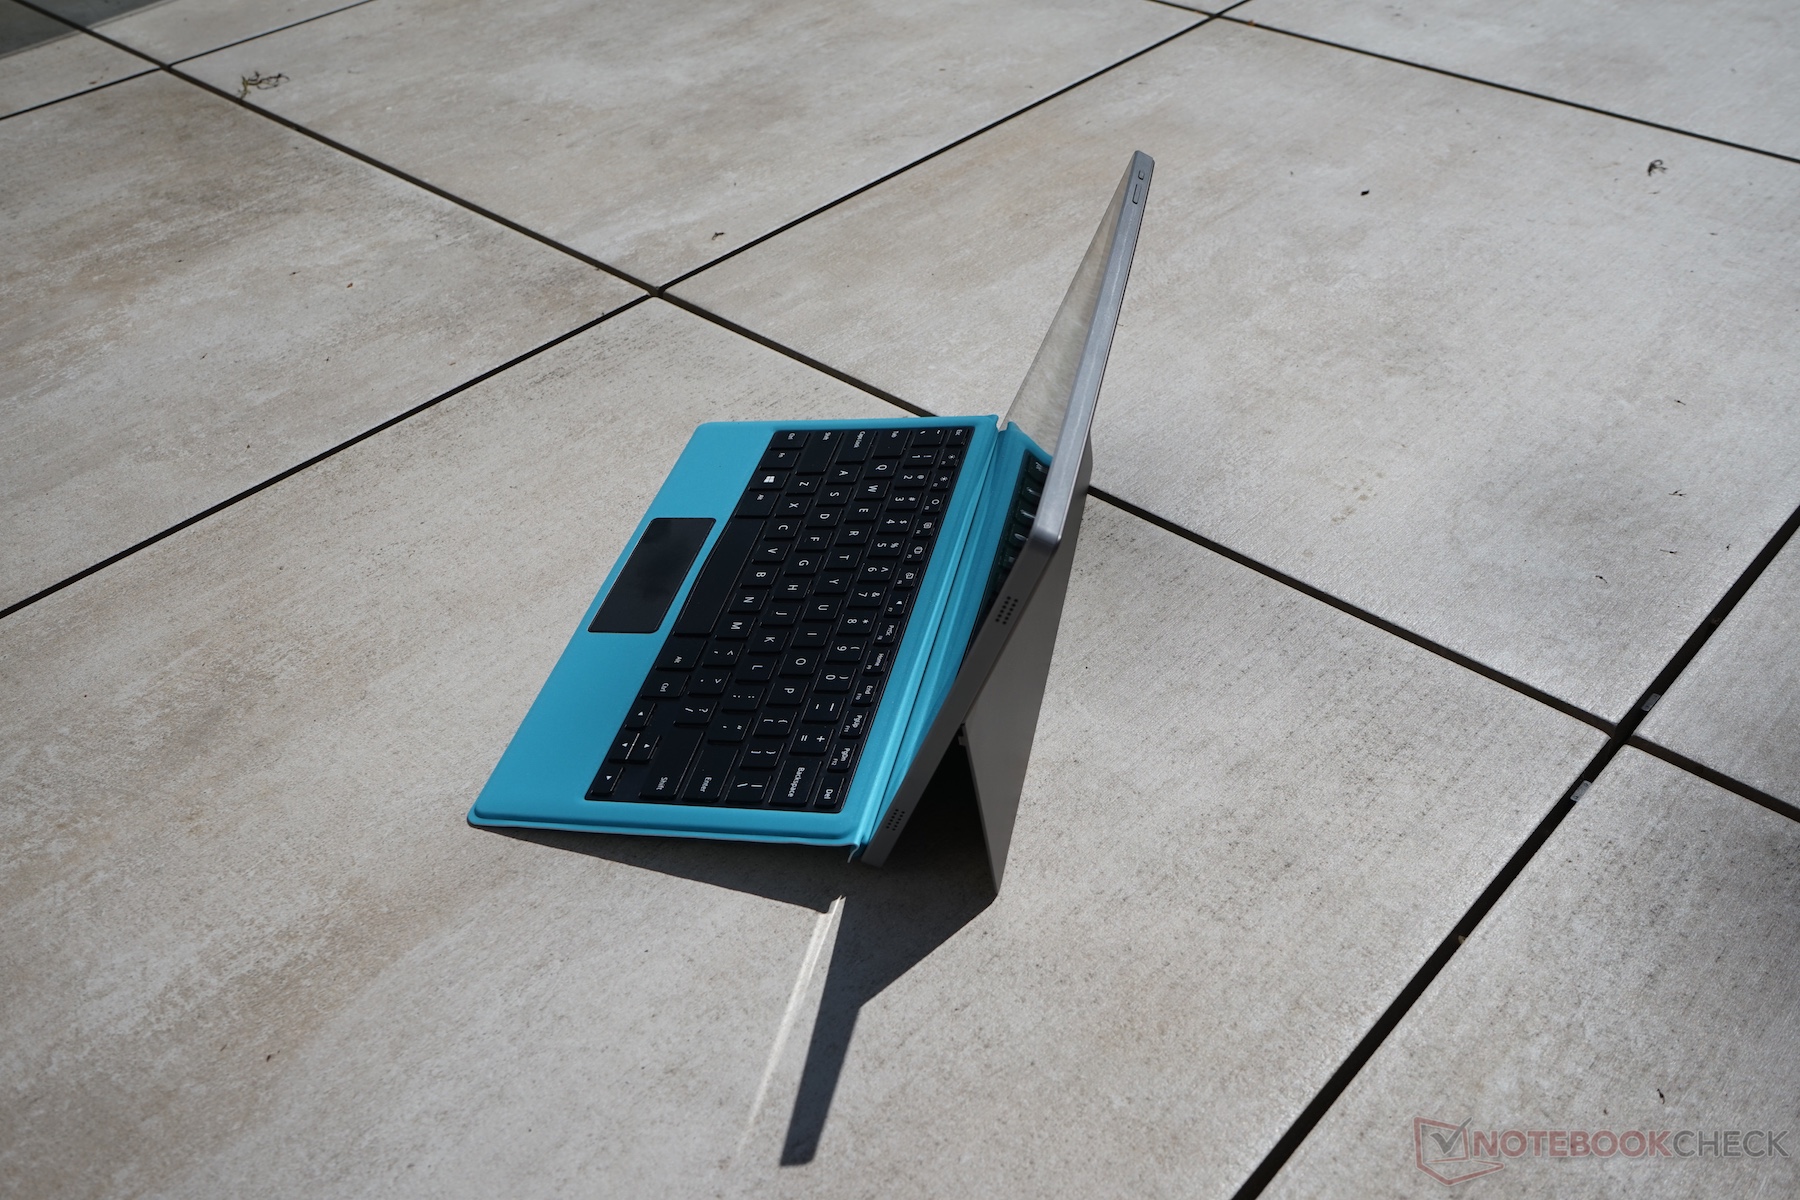
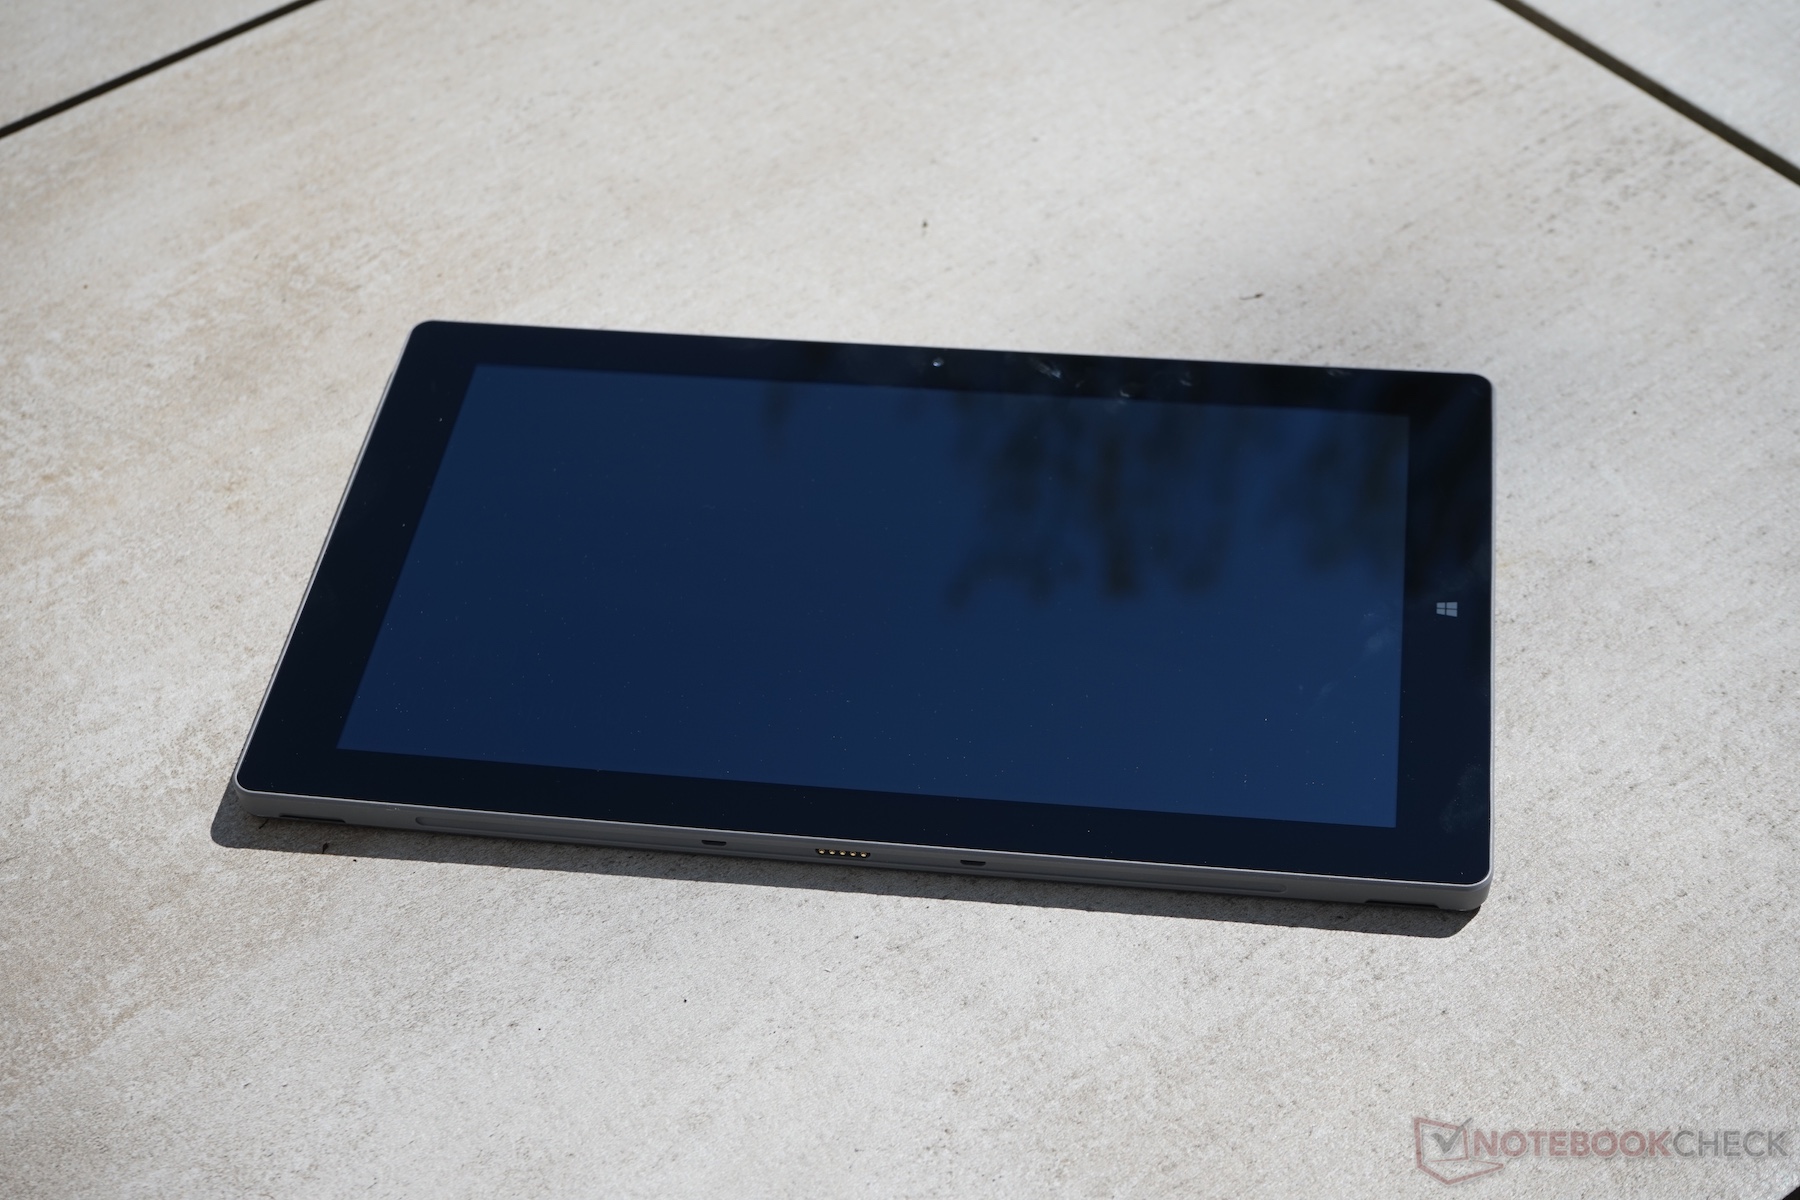
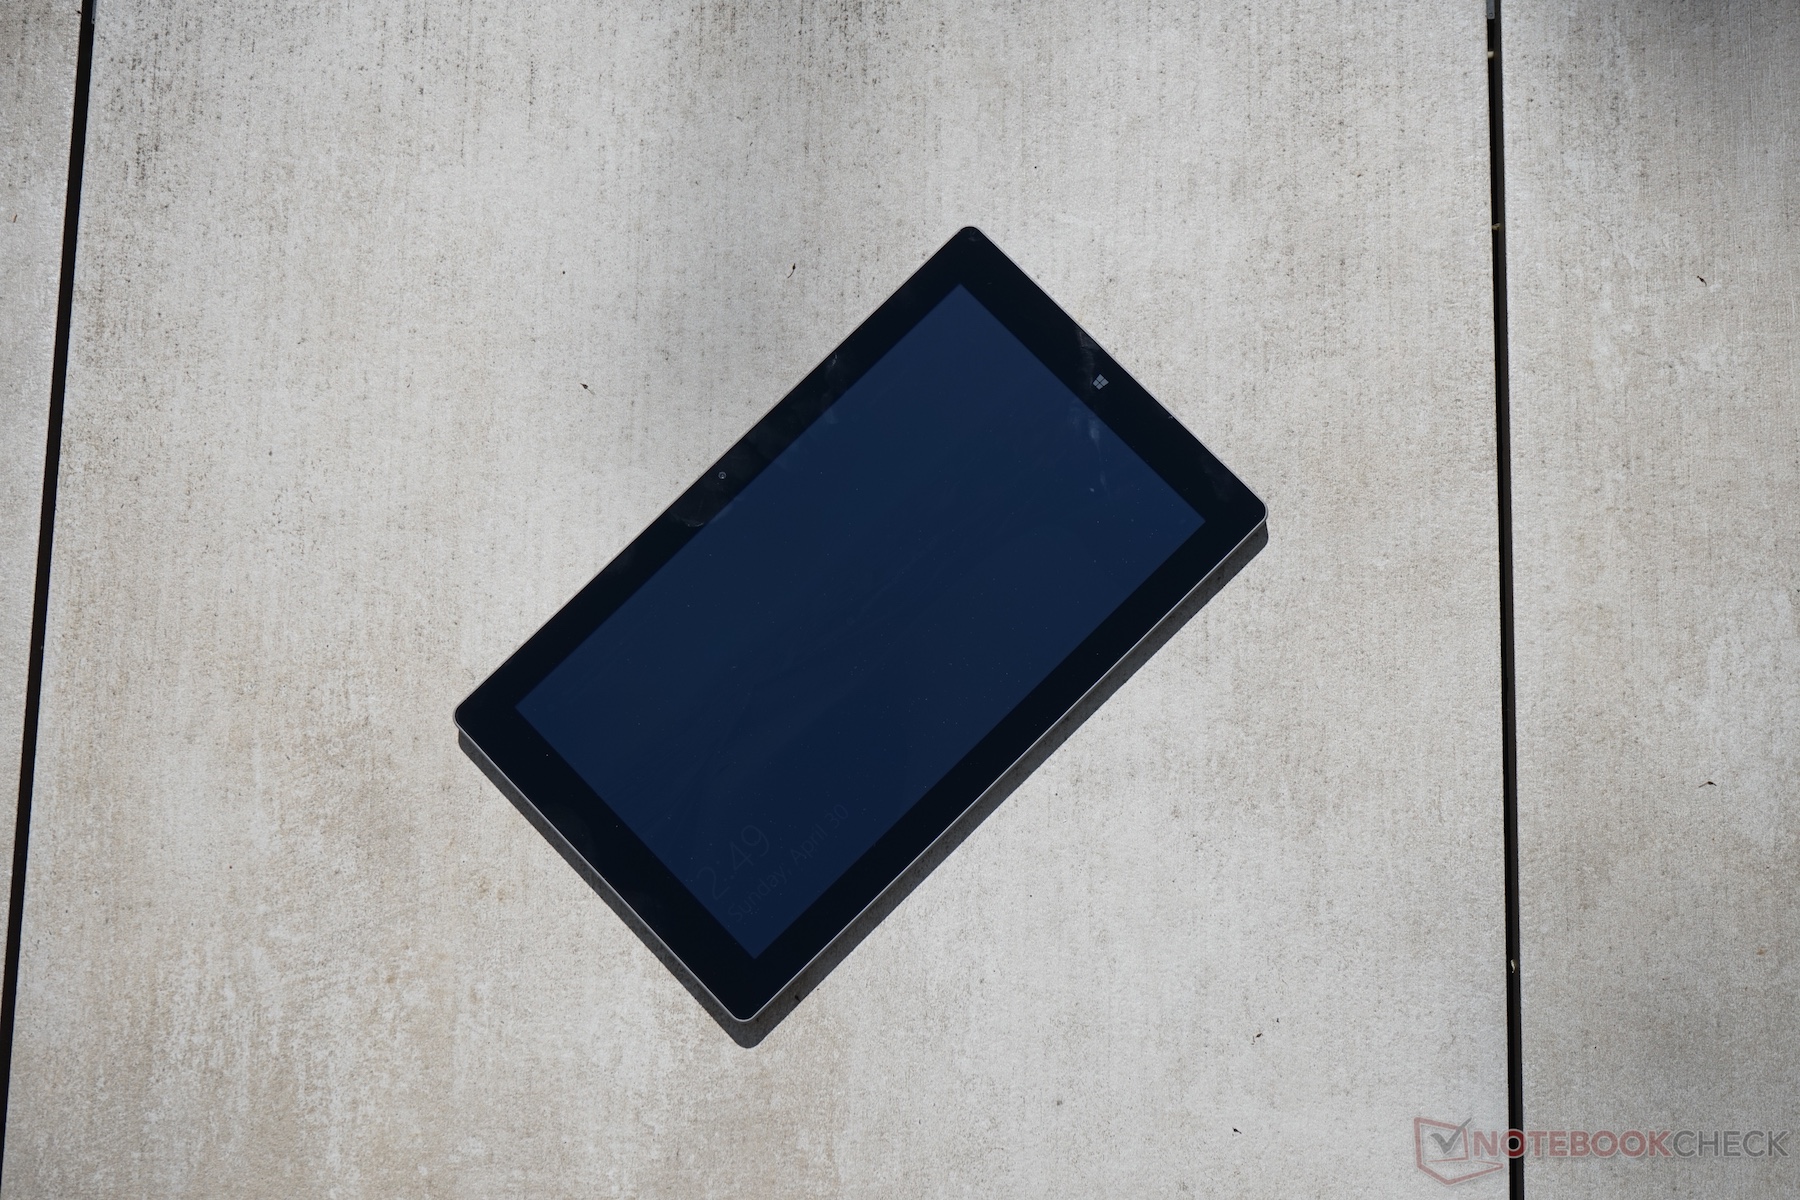
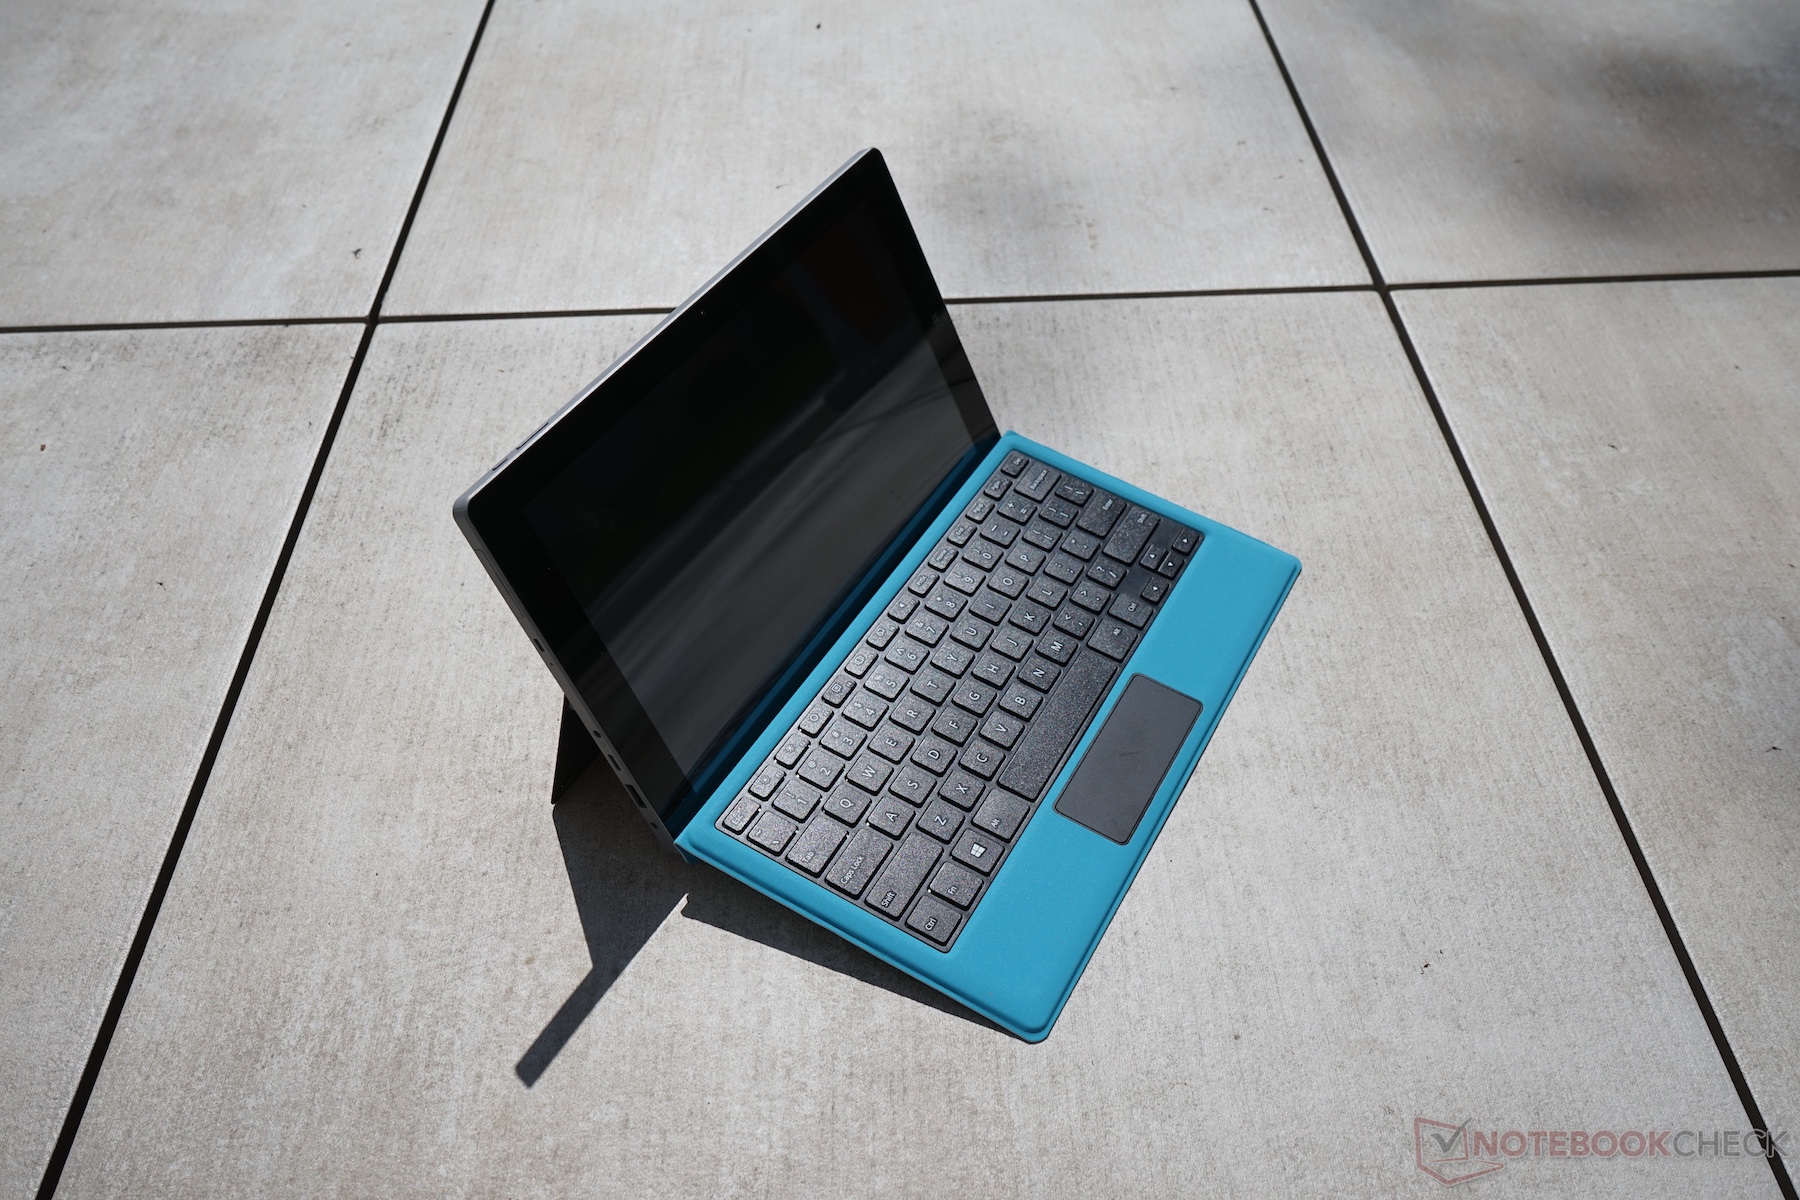
Tuttavia, ci sono anche alcuni aspetti positivi. Nonostante non sia adatto all'utilizzo all'aperto, il display non è troppo scuro. La rigidità del case è eccellente, ed offre una piacevole sensazione al tatto. Abbiamo apprezzato l'assenza di rumori (ventola), e il lettore MicroSD-card è relativamente veloce.
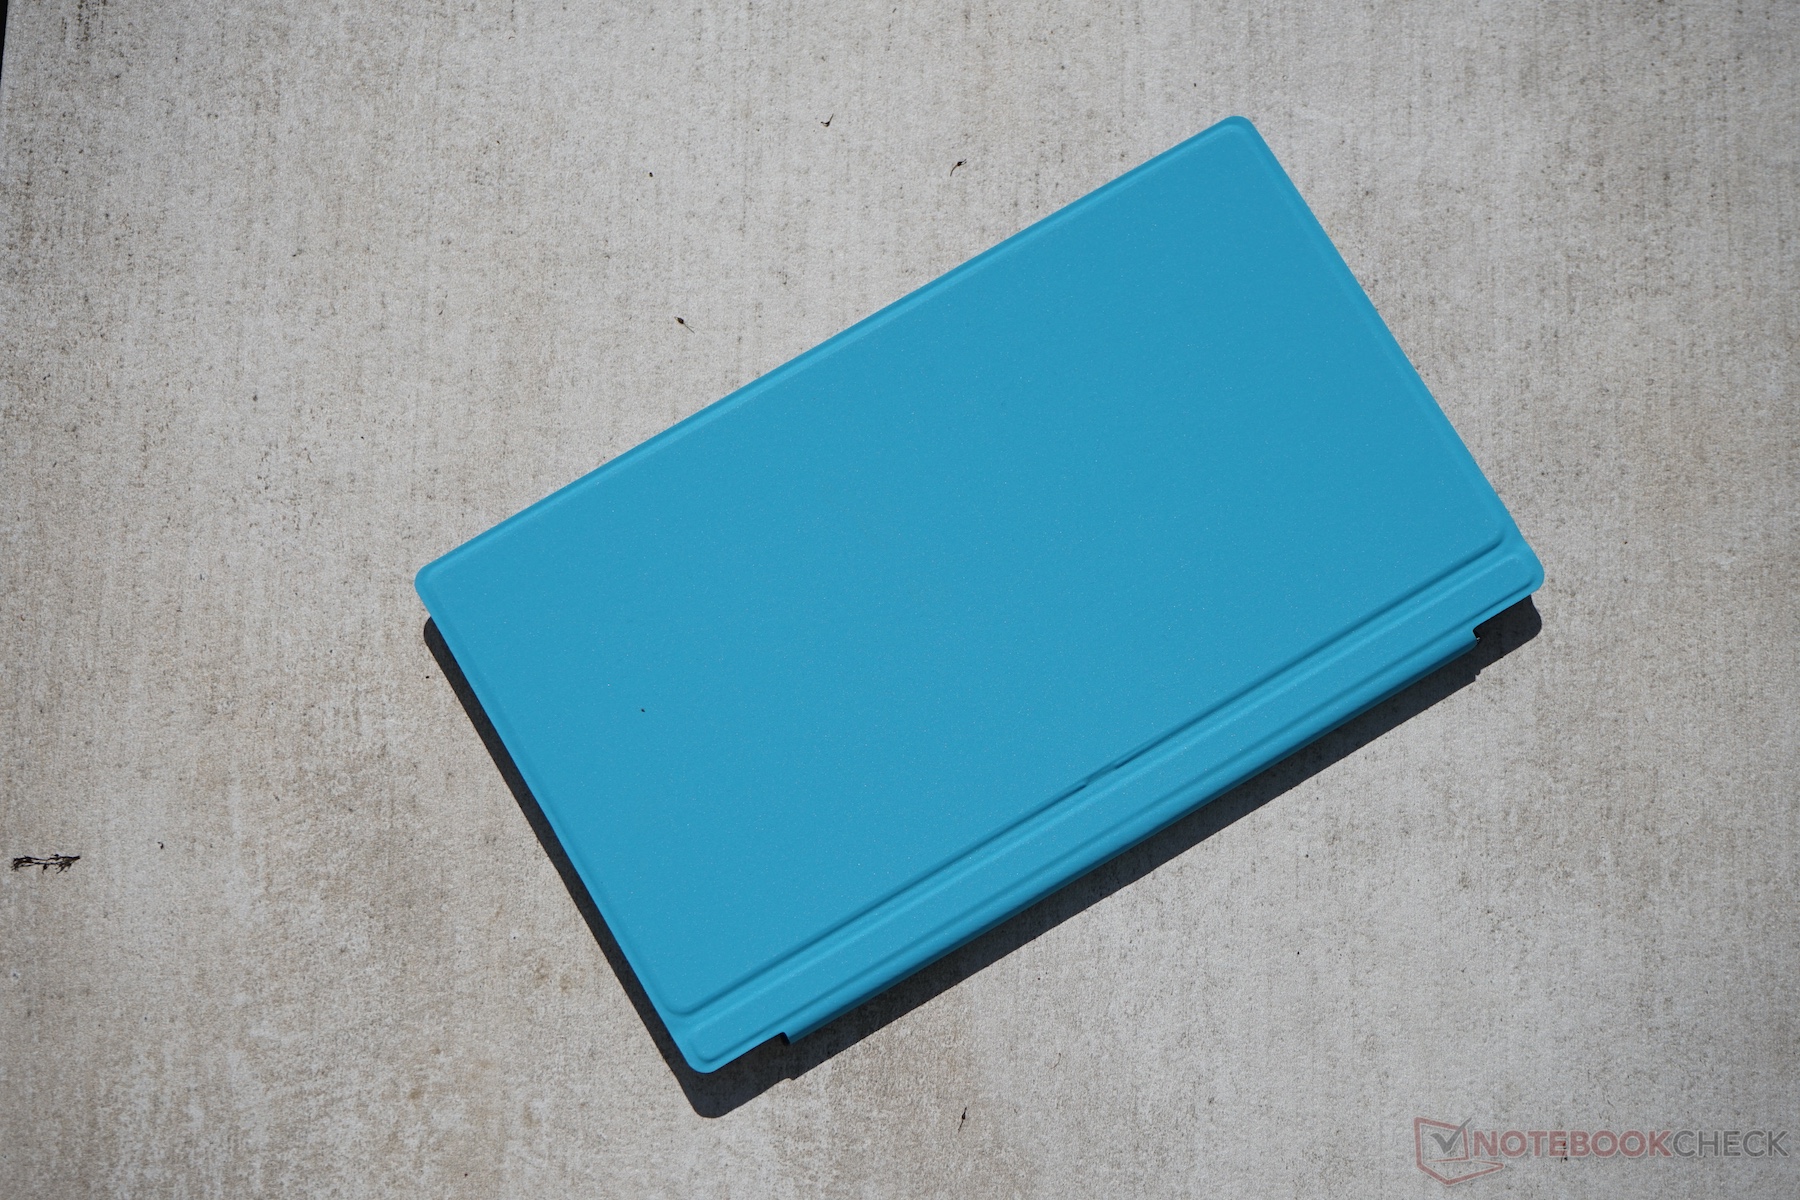
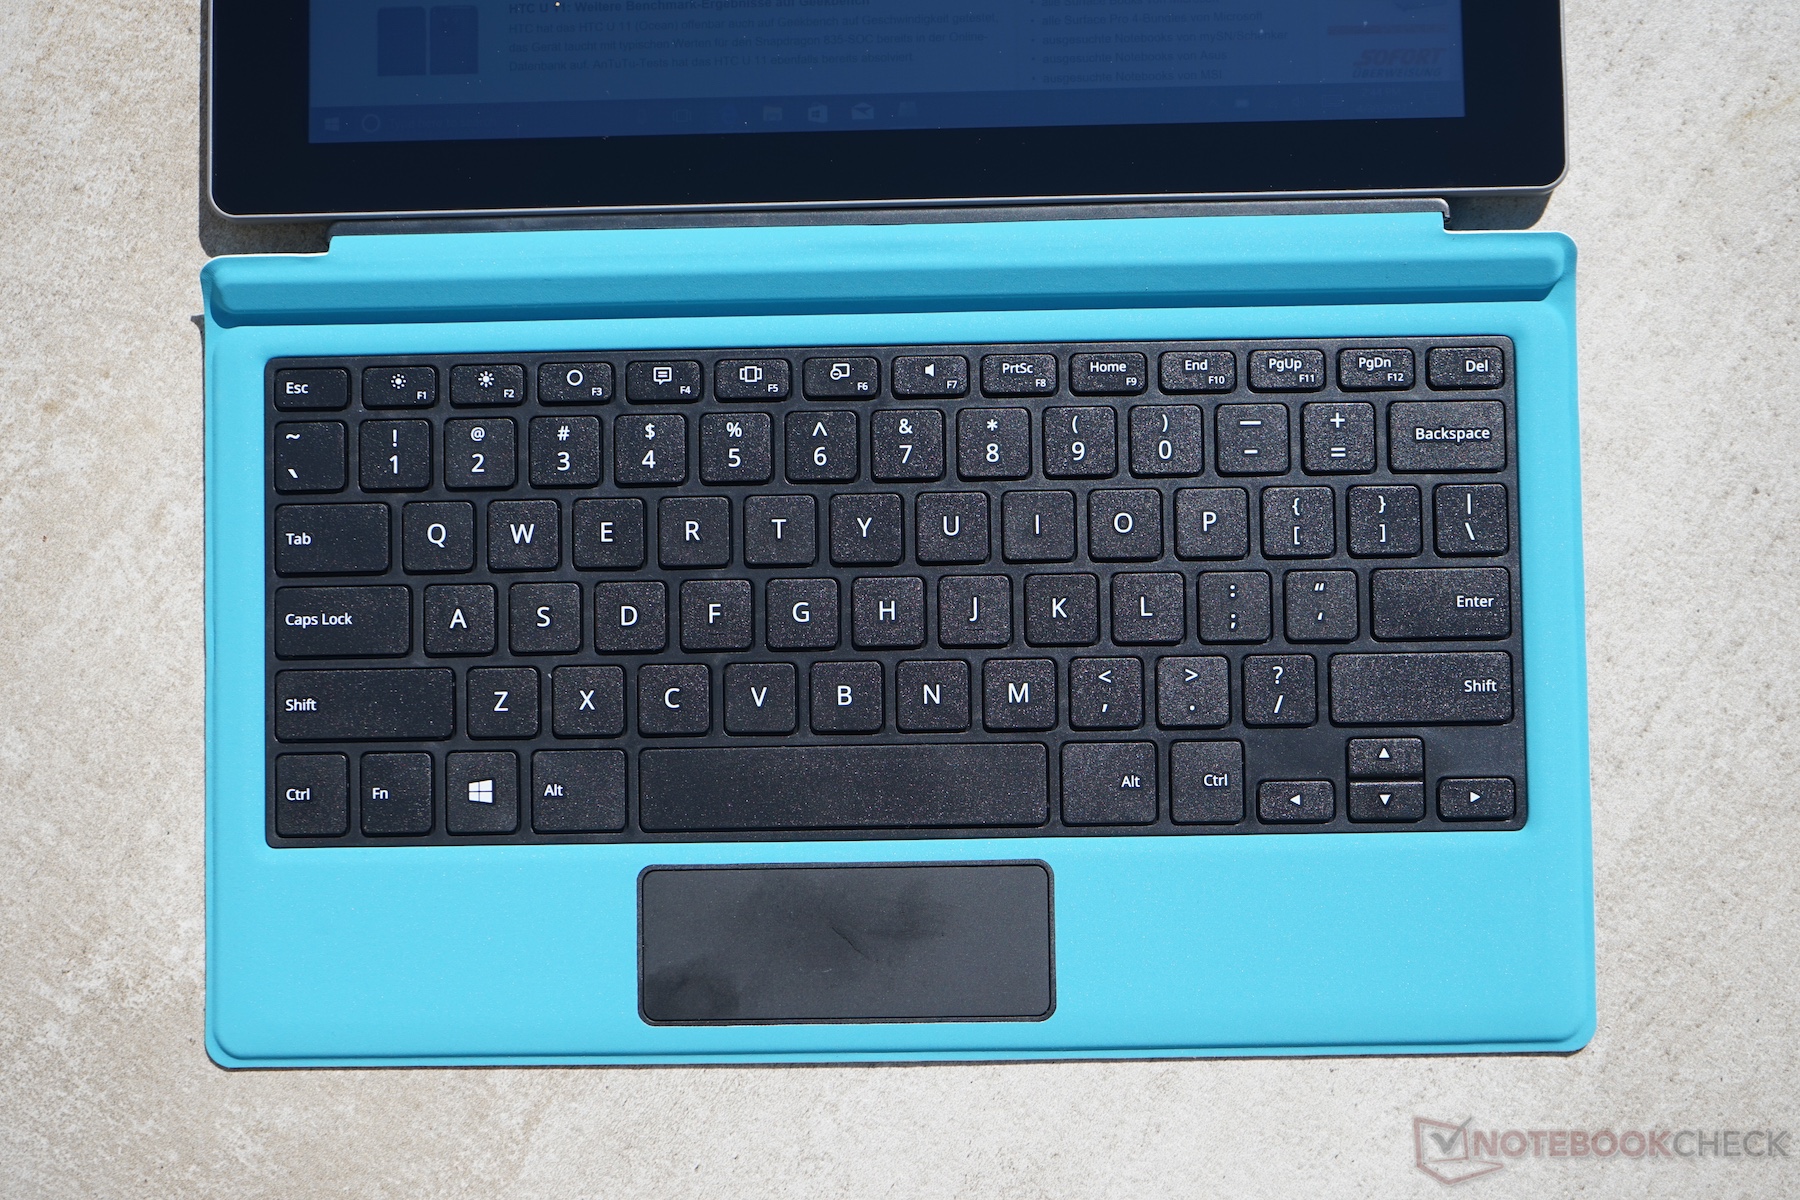
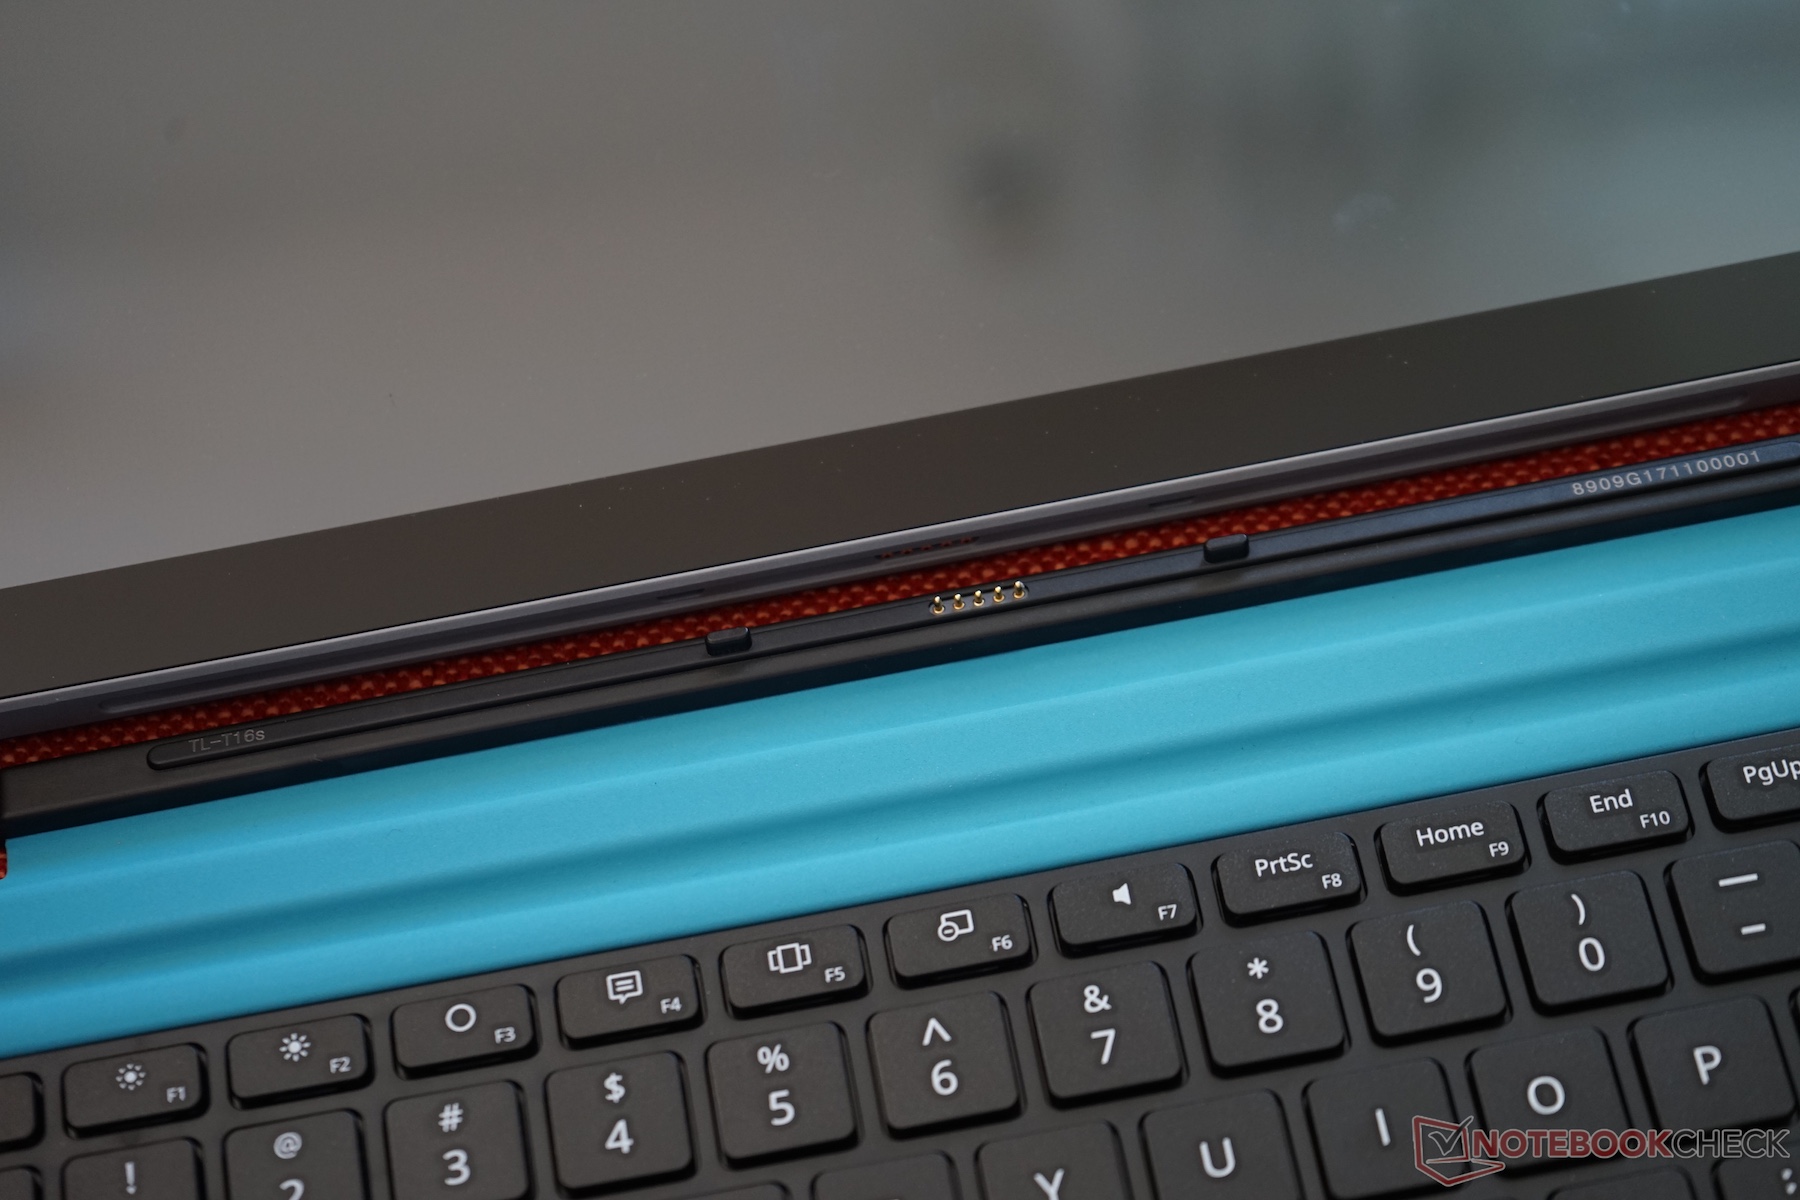
Abbiamo ricevuto il nostro dispositivo da Gearbest direttamente dalla Cina, dove attualmente costa circa $310. La keyboard dock costa altri $35 ed è, nonostante le sue pecche, sicuramente raccomandabile.
Nota: si tratta di una recensione breve, con alcune sezioni non tradotte, per la versione integrale in inglese guardate qui.
Teclast Tbook 16 Power
- 05/15/2017 v6 (old)
Klaus Hinum
Price comparison
