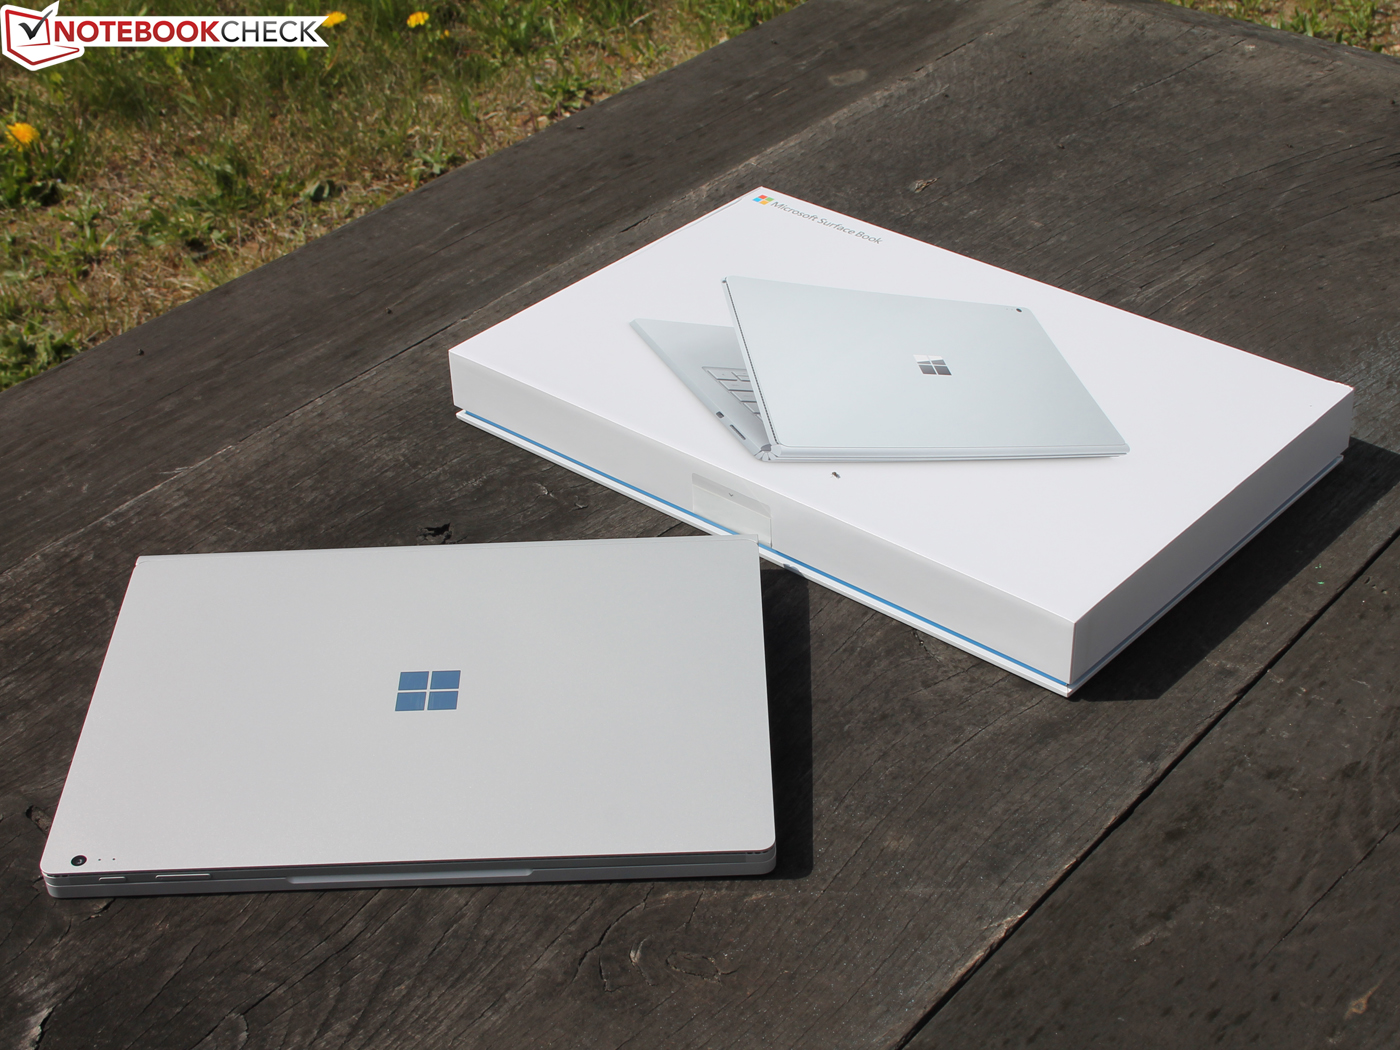
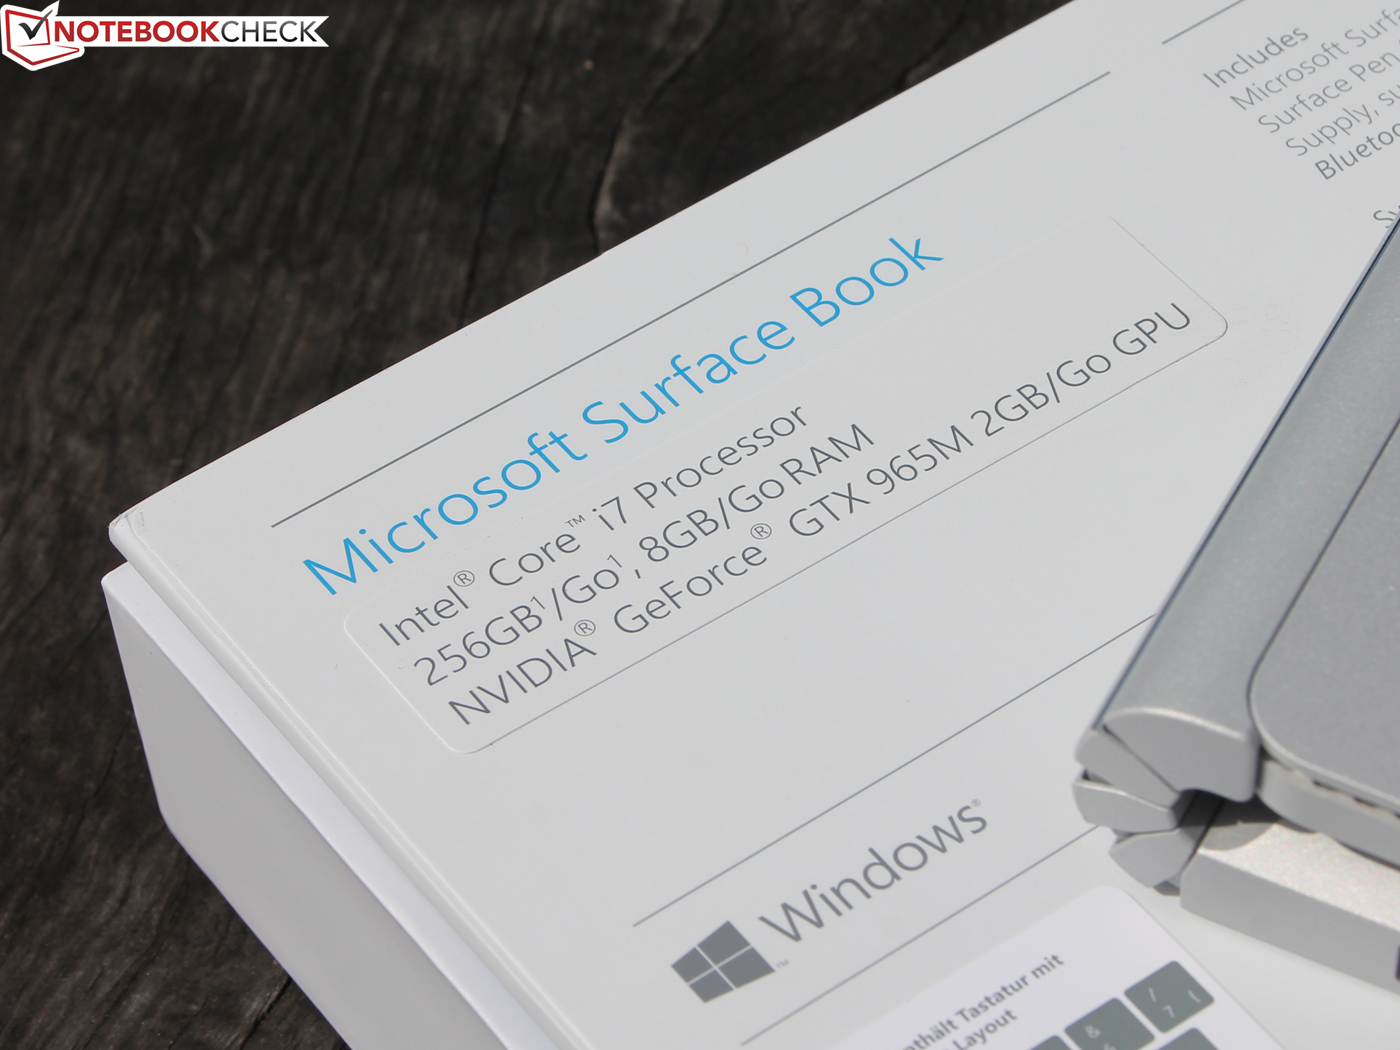
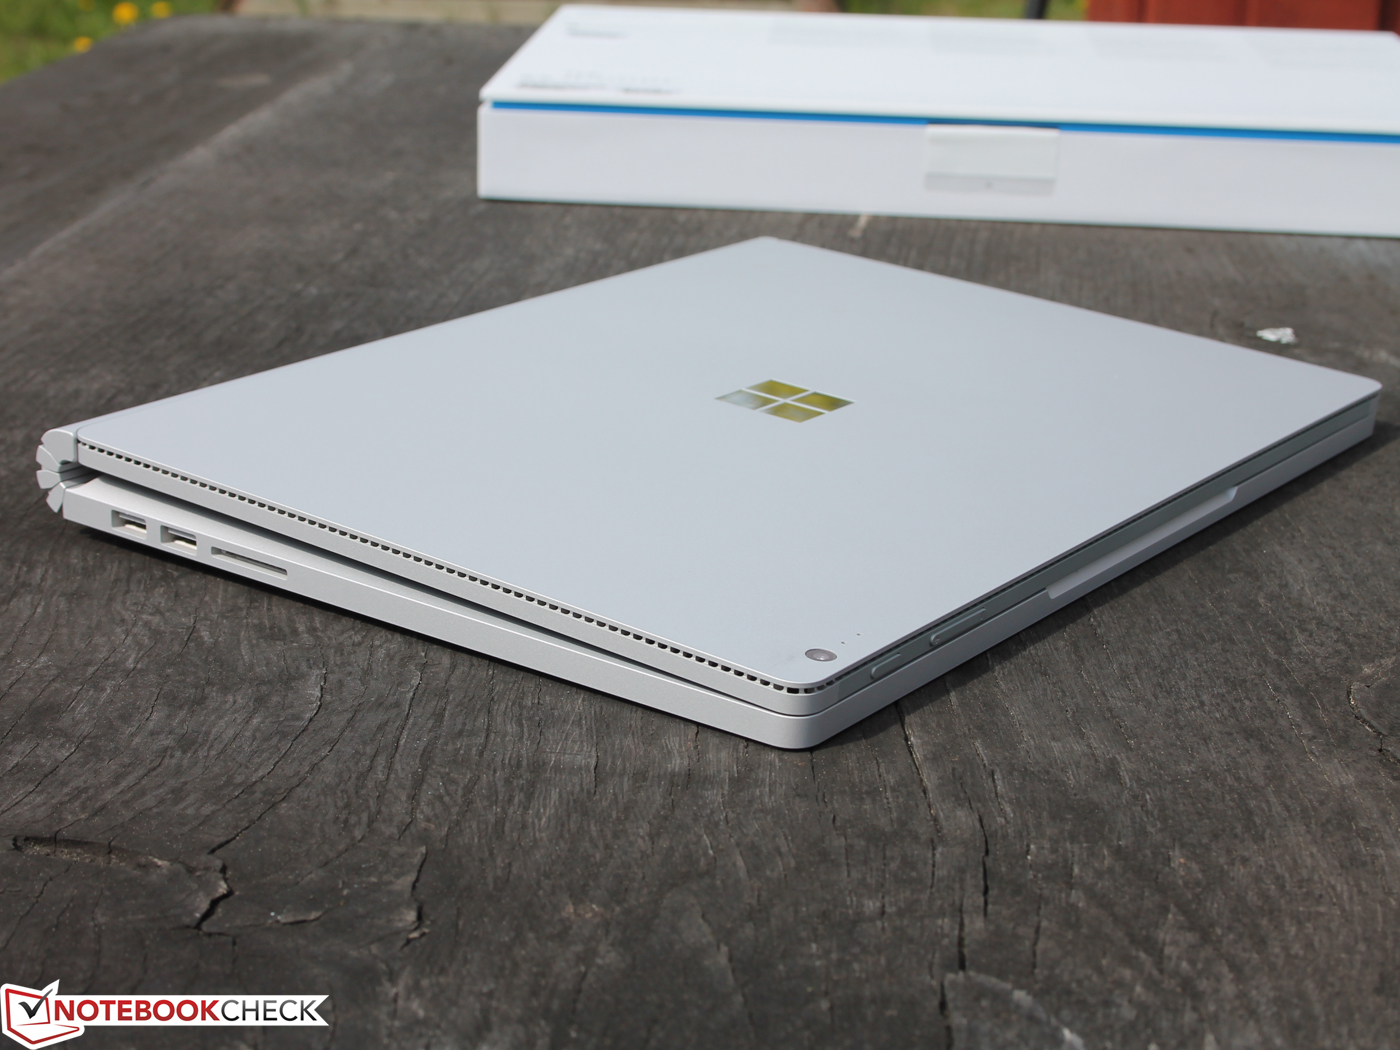
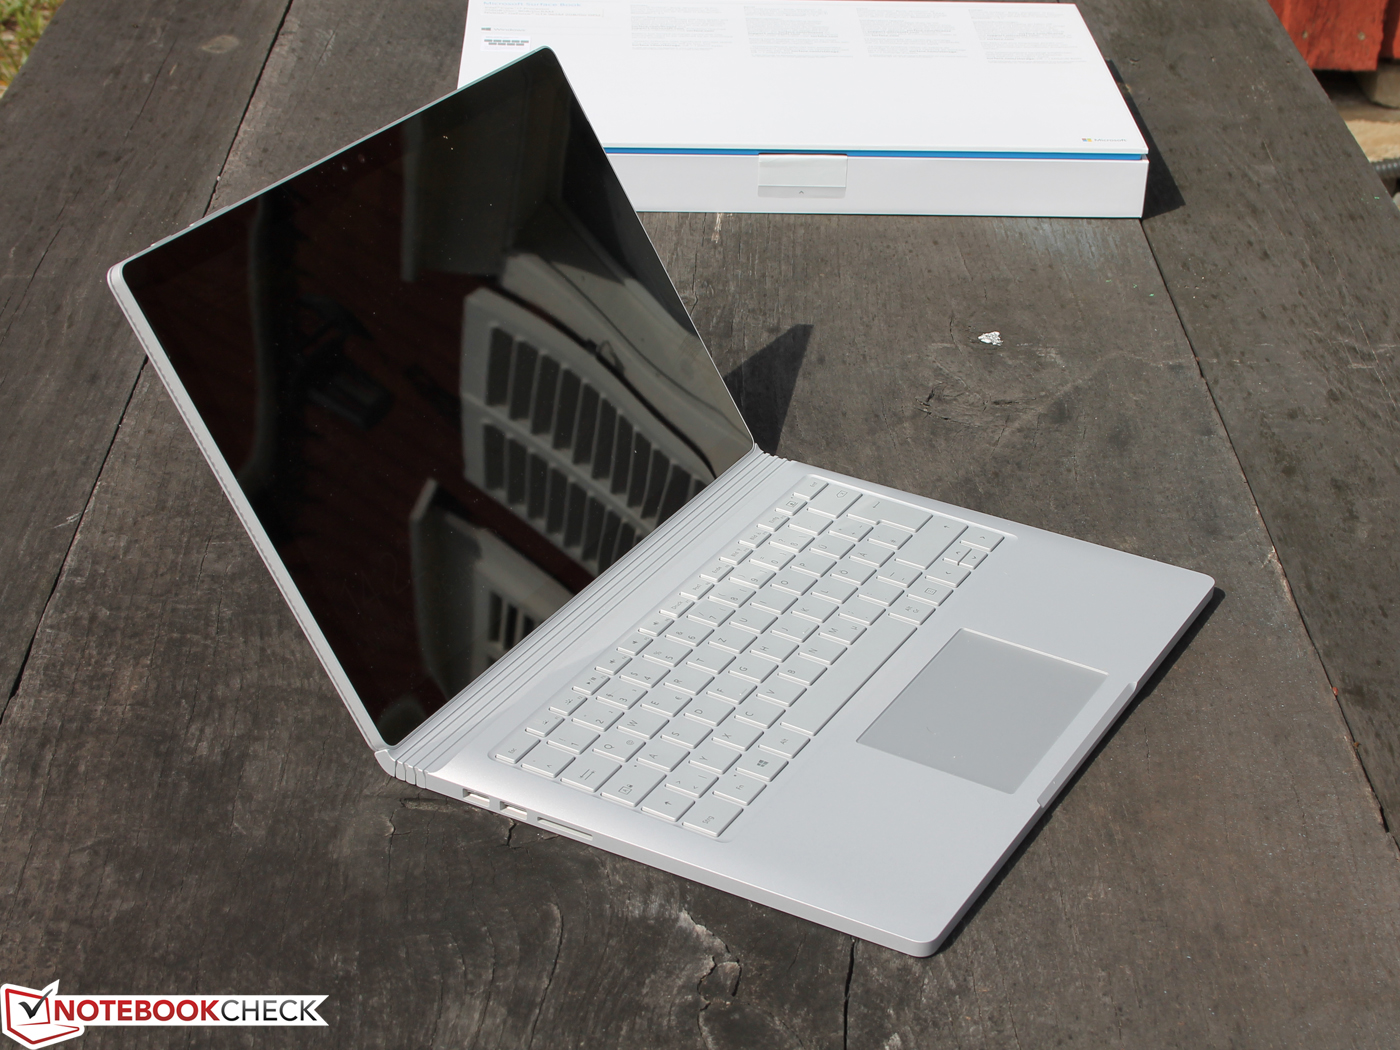
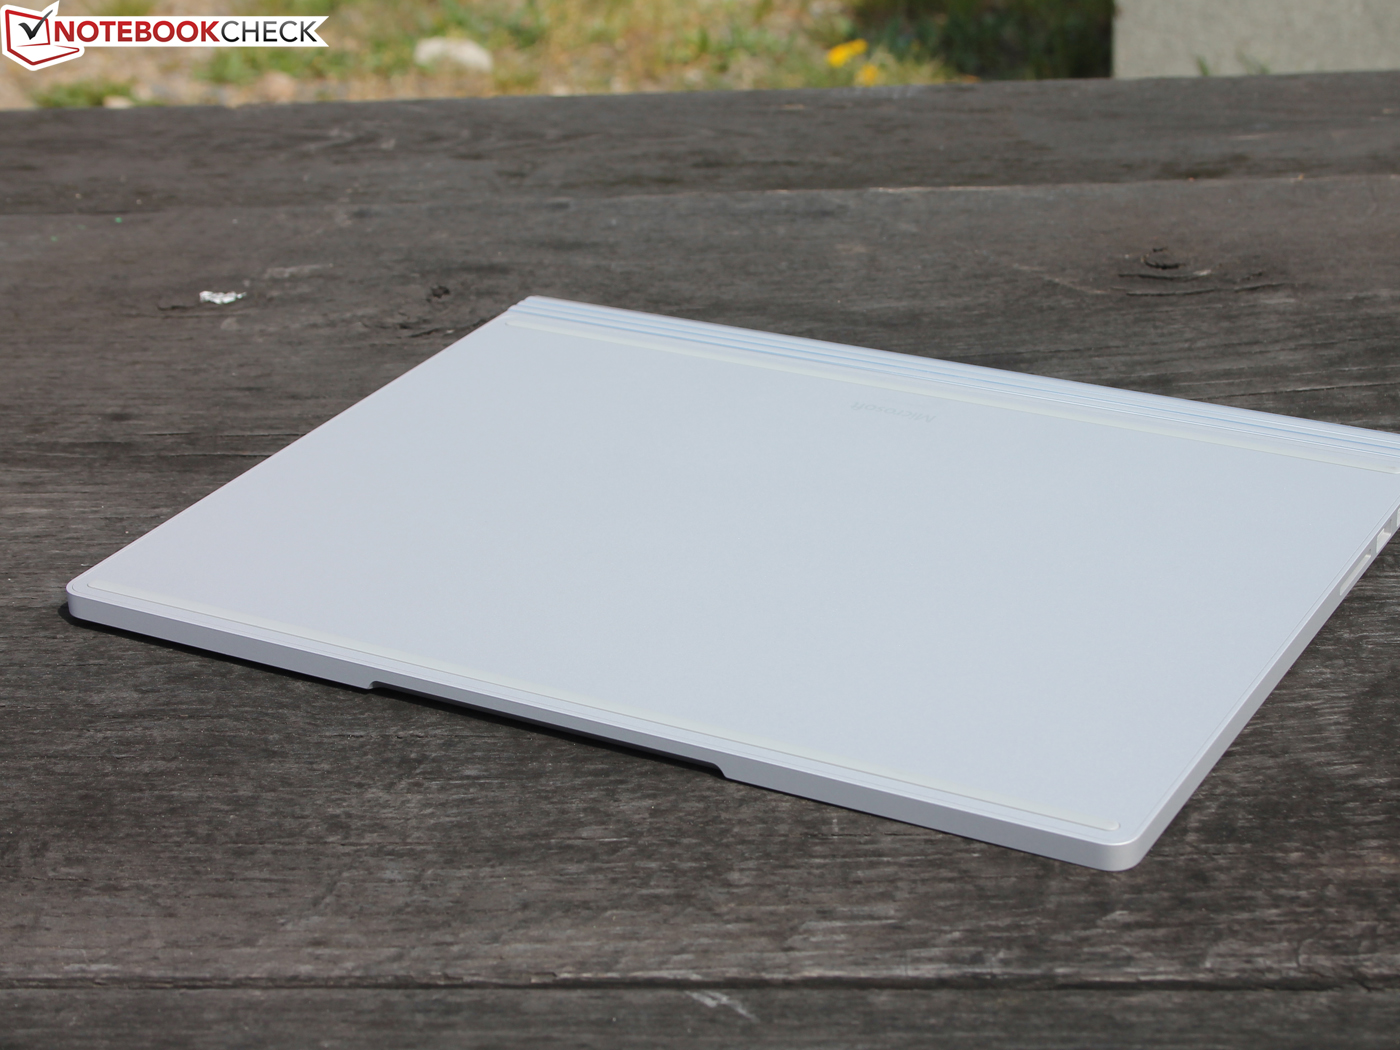
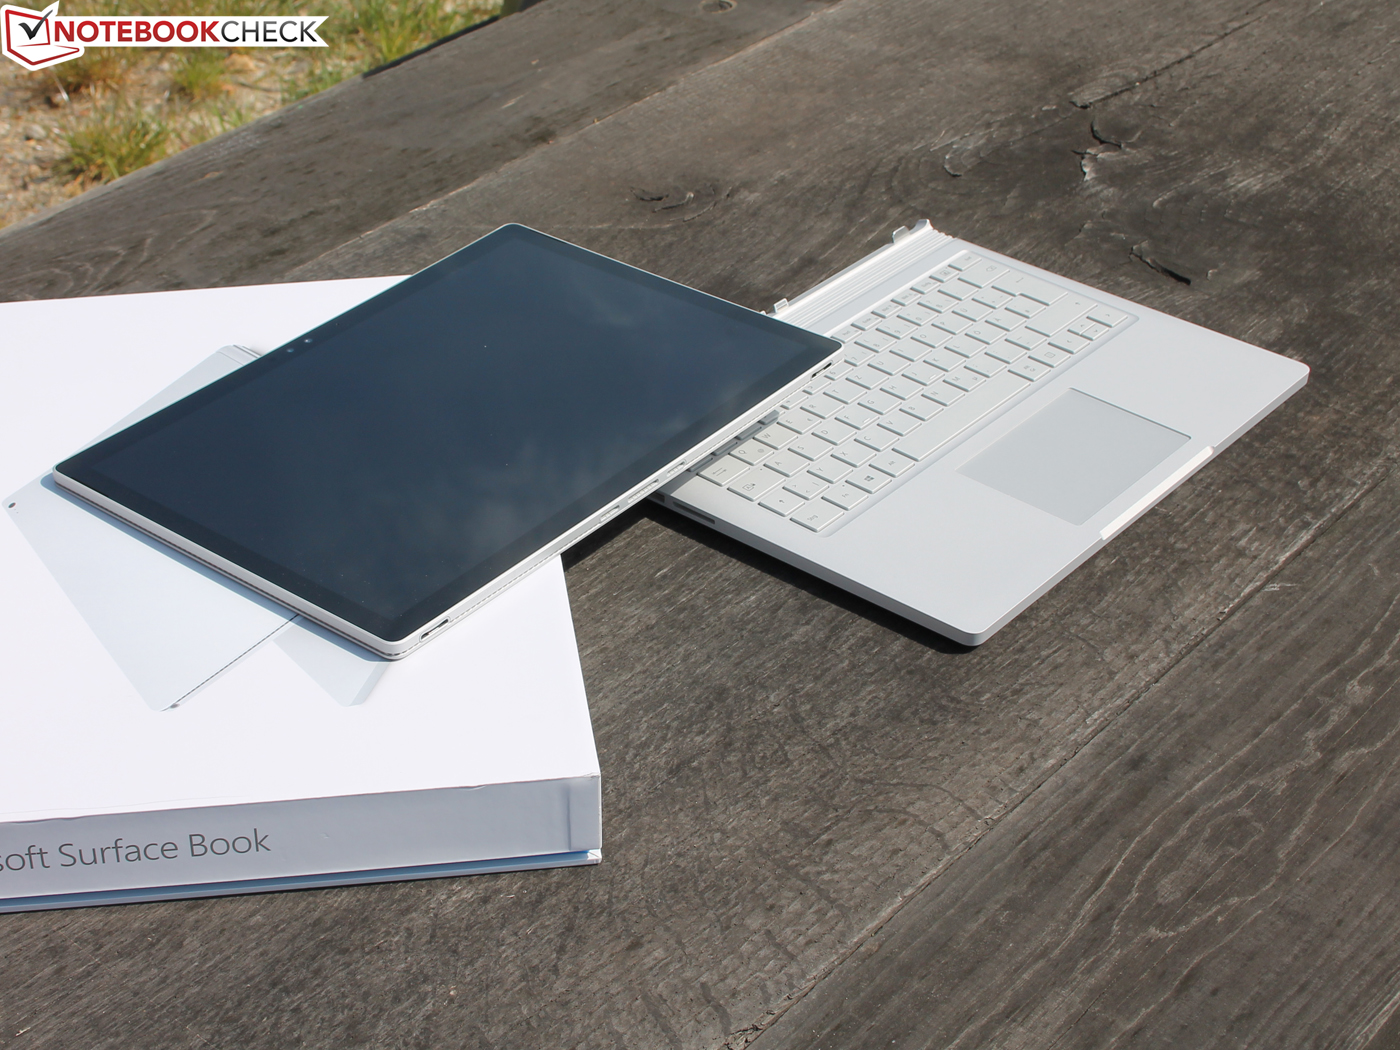
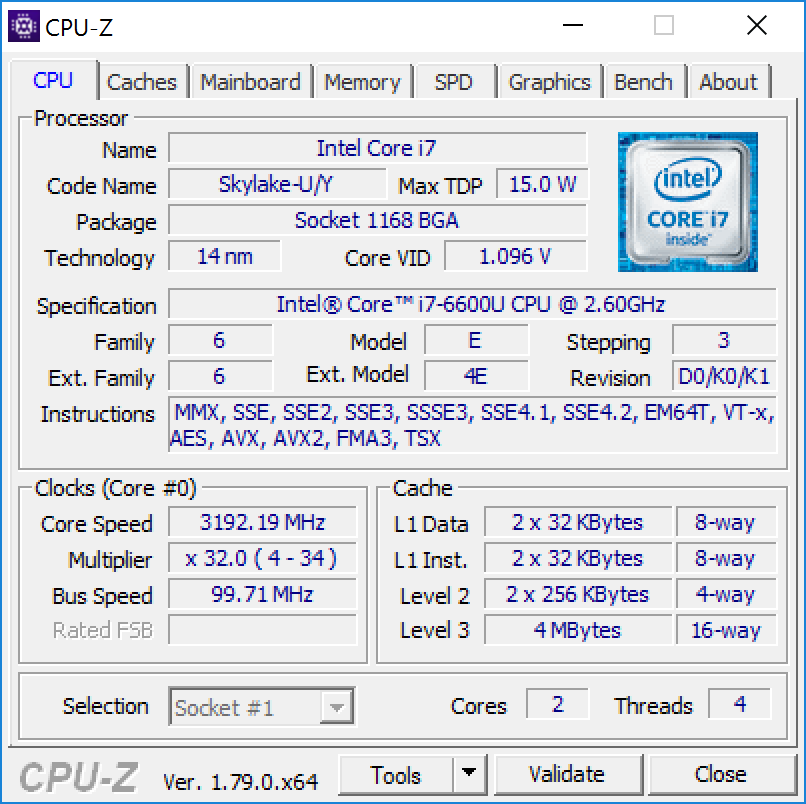
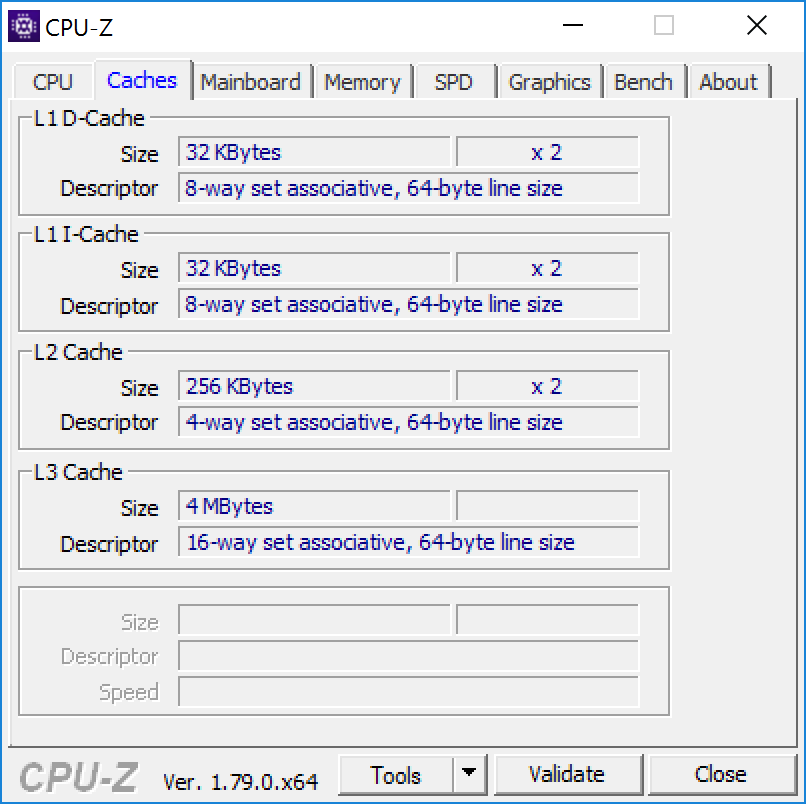
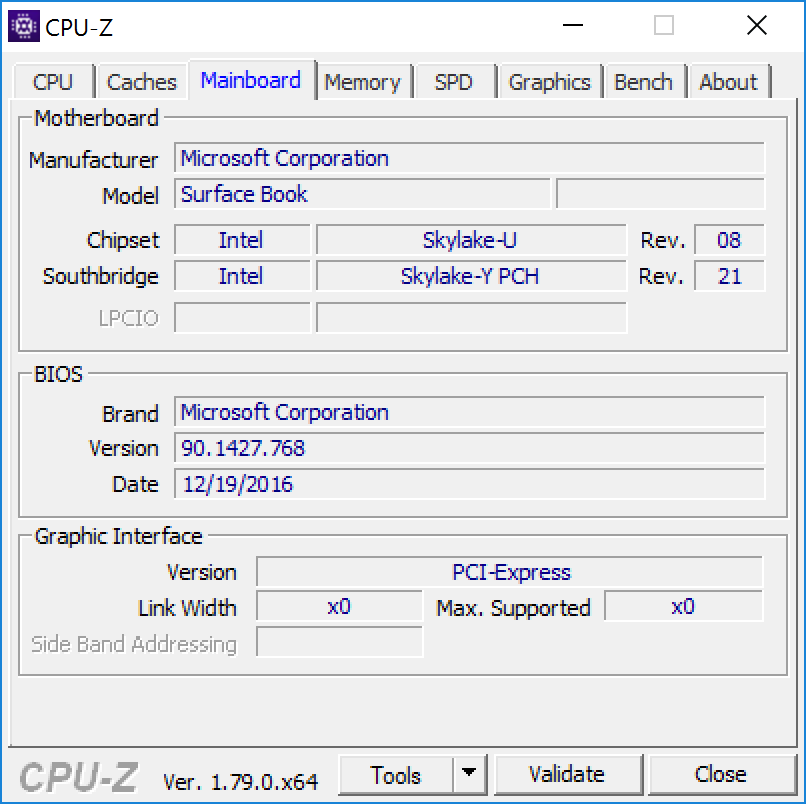
Recensione breve del Convertibile Microsoft Surface Book con Performance Base (GTX 965M)
| |||||||||||||||||||||||||
Distribuzione della luminosità: 86 %
Al centro con la batteria: 459 cd/m²
Contrasto: 1241:1 (Nero: 0.37 cd/m²)
ΔE ColorChecker Calman: 2.28 | ∀{0.5-29.43 Ø4.71}
ΔE Greyscale Calman: 2.48 | ∀{0.09-98 Ø4.96}
96% sRGB (Argyll 1.6.3 3D)
62% AdobeRGB 1998 (Argyll 1.6.3 3D)
67.6% AdobeRGB 1998 (Argyll 3D)
95.4% sRGB (Argyll 3D)
66.4% Display P3 (Argyll 3D)
Gamma: 2.5
CCT: 8602 K
| Microsoft Surface Book with Performance Base Panasonic MEI96A2, , 3000x2000, 13.5" | Microsoft Surface Book Core i5 3000x2000, 13.5" | Microsoft Surface Pro 4, Core i5, 128GB Samsung 123YL01-001 ID: SDC3853, , 2736x1824, 12.3" | HP Spectre x360 15-bl002xx UHD UWVA eDP BrightView WLED-backlit , , 3840x2160, 15.6" | Lenovo Yoga 710-14IKB 80V4002HGE AU Optronics B140HAN03.0, , 1920x1080, 14" | Asus UX310UQ-FC396T AU Optronics AUO272D, , 1920x1080, 13.3" | Apple MacBook Pro 13 2016 (2.9 GHz) APPA033, , 2560x1600, 13.3" | |
|---|---|---|---|---|---|---|---|
| Display | 1% | -1% | -4% | -6% | -3% | 28% | |
| Display P3 Coverage (%) | 66.4 | 67 1% | 65 -2% | 67.9 2% | 62 -7% | 64.1 -3% | 99.2 49% |
| sRGB Coverage (%) | 95.4 | 95.8 0% | 96.5 1% | 88.2 -8% | 89.5 -6% | 92.2 -3% | 99.9 5% |
| AdobeRGB 1998 Coverage (%) | 67.6 | 68.9 2% | 67 -1% | 64.4 -5% | 63.3 -6% | 65.3 -3% | 87.6 30% |
| Response Times | 16% | 21% | 12% | 12% | 46% | -10% | |
| Response Time Grey 50% / Grey 80% * (ms) | 61 ? | 48.4 ? 21% | 46 ? 25% | 44 ? 28% | 53 ? 13% | 31 ? 49% | 47.2 ? 23% |
| Response Time Black / White * (ms) | 37 ? | 32.8 ? 11% | 31.2 ? 16% | 38.8 ? -5% | 33 ? 11% | 21 ? 43% | 53 ? -43% |
| PWM Frequency (Hz) | 50 ? | 1000 ? | 50 ? | 192 ? | |||
| Screen | 10% | -13% | -12% | -76% | -43% | 10% | |
| Brightness middle (cd/m²) | 459 | 430.9 -6% | 413 -10% | 351.5 -23% | 340 -26% | 362 -21% | 569 24% |
| Brightness (cd/m²) | 423 | 410 -3% | 396 -6% | 336 -21% | 302 -29% | 343 -19% | 542 28% |
| Brightness Distribution (%) | 86 | 93 8% | 87 1% | 83 -3% | 77 -10% | 92 7% | 90 5% |
| Black Level * (cd/m²) | 0.37 | 0.254 31% | 0.36 3% | 0.24 35% | 0.31 16% | 0.28 24% | 0.56 -51% |
| Contrast (:1) | 1241 | 1696 37% | 1147 -8% | 1465 18% | 1097 -12% | 1293 4% | 1016 -18% |
| Colorchecker dE 2000 * | 2.28 | 2.06 10% | 3.09 -36% | 3.3 -45% | 6.75 -196% | 5.08 -123% | 1.4 39% |
| Colorchecker dE 2000 max. * | 3.61 | 7.3 -102% | 12.4 -243% | 8.95 -148% | 2.9 20% | ||
| Greyscale dE 2000 * | 2.48 | 2.22 10% | 3.92 -58% | 1.9 23% | 8.47 -242% | 6.21 -150% | 1.8 27% |
| Gamma | 2.5 88% | 2.13 103% | 2.3 96% | 2.09 105% | 2.22 99% | 2.4 92% | 2.16 102% |
| CCT | 8602 76% | 6520 100% | 7333 89% | 6784 96% | 6557 99% | 6817 95% | 6877 95% |
| Color Space (Percent of AdobeRGB 1998) (%) | 62 | 64 3% | 61 -2% | 64.4 4% | 58 -6% | 60 -3% | 78.4 26% |
| Color Space (Percent of sRGB) (%) | 96 | 96 0% | 97 1% | 88.2 -8% | 89 -7% | 92 -4% | 99.3 3% |
| Media totale (Programma / Settaggio) | 9% /
9% | 2% /
-5% | -1% /
-7% | -23% /
-50% | 0% /
-23% | 9% /
11% |
* ... Meglio usare valori piccoli
Tempi di risposta del Display
| ↔ Tempi di risposta dal Nero al Bianco | ||
|---|---|---|
| 37 ms ... aumenta ↗ e diminuisce ↘ combinato | ↗ 21 ms Incremento |  |
| ↘ 16 ms Calo | ||
| Lo schermo mostra tempi di risposta lenti nei nostri tests e sarà insoddisfacente per i gamers. In confronto, tutti i dispositivi di test variano da 0.1 (minimo) a 240 (massimo) ms. » 95 % di tutti i dispositivi è migliore. Questo significa che i tempi di risposta rilevati sono peggiori rispetto alla media di tutti i dispositivi testati (19.8 ms). | ||
| ↔ Tempo di risposta dal 50% Grigio all'80% Grigio | ||
| 61 ms ... aumenta ↗ e diminuisce ↘ combinato | ↗ 28 ms Incremento | 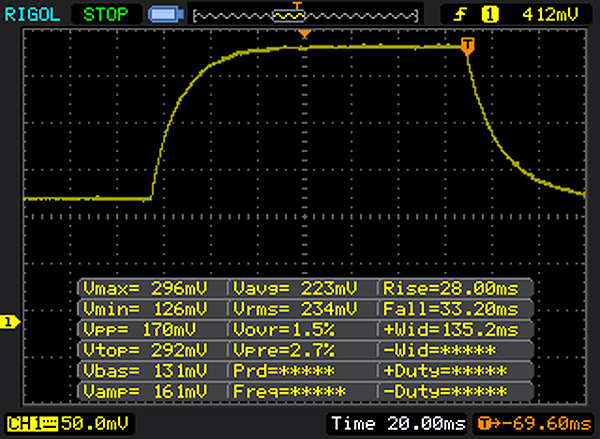 |
| ↘ 33 ms Calo | ||
| Lo schermo mostra tempi di risposta lenti nei nostri tests e sarà insoddisfacente per i gamers. In confronto, tutti i dispositivi di test variano da 0.165 (minimo) a 636 (massimo) ms. » 96 % di tutti i dispositivi è migliore. Questo significa che i tempi di risposta rilevati sono peggiori rispetto alla media di tutti i dispositivi testati (31 ms). | ||
Sfarfallio dello schermo / PWM (Pulse-Width Modulation)
| flickering dello schermo / PWM non rilevato | ||
In confronto: 52 % di tutti i dispositivi testati non utilizza PWM per ridurre la luminosita' del display. Se è rilevato PWM, una media di 7754 (minimo: 5 - massimo: 343500) Hz è stata rilevata. | ||
| PCMark 8 Home Score Accelerated v2 | 3040 punti | |
| PCMark 8 Creative Score Accelerated v2 | 4136 punti | |
| PCMark 8 Work Score Accelerated v2 | 3949 punti | |
Aiuto | ||
| Microsoft Surface Book with Performance Base Toshiba NVMe THNSN5256GPU7 | Microsoft Surface Book Core i7 Samsung MZFLV512 NVMe | Lenovo Yoga 710-14IKB 80V4002HGE Samsung MZYTY256HDHP | HP Spectre x360 15-bl002xx Toshiba XG4 NVMe (THNSN5512GPUK) | Asus UX310UQ-FC396T SanDisk SD8SN8U512G1002 | Apple MacBook Pro 13 2016 (2.9 GHz) Apple SSD AP0256 | |
|---|---|---|---|---|---|---|
| CrystalDiskMark 3.0 | 11% | -35% | 21% | -37% | 36% | |
| Read Seq (MB/s) | 1017 | 953 -6% | 490.5 -52% | 1266 24% | 519 -49% | 1662 63% |
| Write Seq (MB/s) | 861 | 592 -31% | 452.3 -47% | 982 14% | 468 -46% | 1336 55% |
| Read 512 (MB/s) | 687 | 520 -24% | 386.2 -44% | 834 21% | 344.8 -50% | 1183 72% |
| Write 512 (MB/s) | 698 | 591 -15% | 219.9 -68% | 714 2% | 458 -34% | 1481 112% |
| Read 4k (MB/s) | 40.91 | 42.66 4% | 34.35 -16% | 40.72 0% | 28.45 -30% | 16.1 -61% |
| Write 4k (MB/s) | 108.6 | 136.3 26% | 91.2 -16% | 139.4 28% | 56.2 -48% | 23.5 -78% |
| Read 4k QD32 (MB/s) | 326.9 | 615 88% | 378.9 16% | 527 61% | 286 -13% | 657 101% |
| Write 4k QD32 (MB/s) | 347.1 | 517 49% | 152.2 -56% | 395.2 14% | 257.7 -26% | 419 21% |

| 3DMark 11 - 1280x720 Performance GPU | |
| Acer Aspire VN7-593G-73HP V15 Nitro BE | |
| HP Omen 15-ax007ng | |
| HP Omen 17-w010ng | |
| Asus G752VL-T7023T | |
| Microsoft Surface Book with Performance Base | |
| Acer TravelMate P658-M-59J7 Graphics Dock | |
| Asus Zenbook UX510UW-CN044T | |
| Acer Aspire V5-591G-50NC | |
| Asus F756UX-T7013T | |
| Apple MacBook Pro 13 2016 (2.9 GHz) | |
| HP Spectre x360 15-bl002xx | |
| Microsoft Surface Book Core i5 | |
| Asus UX310UQ-FC396T | |
| Lenovo Yoga 710-14IKB 80V4002HGE | |
| 3DMark | |
| 1280x720 Cloud Gate Standard Graphics | |
| Acer Aspire VN7-593G-73HP V15 Nitro BE | |
| HP Omen 15-ax007ng | |
| HP Omen 17-w010ng | |
| Dell XPS 15 9560 (i7-7700HQ, UHD) | |
| Dell XPS 15 9550 i7 FHD | |
| Acer TravelMate P658-M-59J7 Graphics Dock | |
| Asus Zenbook UX510UW-CN044T | |
| Acer Aspire V5-591G-50NC | |
| Asus F756UX-T7013T | |
| Asus G752VL-T7023T | |
| Microsoft Surface Book with Performance Base | |
| Apple MacBook Pro 13 2016 (2.9 GHz) | |
| HP Spectre x360 15-bl002xx | |
| Microsoft Surface Book Core i5 | |
| Asus UX310UQ-FC396T | |
| Lenovo Yoga 710-14IKB 80V4002HGE | |
| 1920x1080 Fire Strike Graphics | |
| Acer Aspire VN7-593G-73HP V15 Nitro BE | |
| Dell XPS 15 9560 (i7-7700HQ, UHD) | |
| HP Omen 15-ax007ng | |
| HP Omen 17-w010ng | |
| Asus G752VL-T7023T | |
| Microsoft Surface Book with Performance Base | |
| Dell XPS 15 9550 i7 FHD | |
| Asus Zenbook UX510UW-CN044T | |
| Acer TravelMate P658-M-59J7 Graphics Dock | |
| Acer Aspire V5-591G-50NC | |
| Asus F756UX-T7013T | |
| HP Spectre x360 15-bl002xx | |
| Microsoft Surface Book Core i5 | |
| Apple MacBook Pro 13 2016 (2.9 GHz) | |
| Asus UX310UQ-FC396T | |
| Lenovo Yoga 710-14IKB 80V4002HGE | |
| 3DMark 11 Performance | 5941 punti | |
| 3DMark Cloud Gate Standard Score | 8836 punti | |
| 3DMark Fire Strike Score | 4395 punti | |
Aiuto | ||
| Rise of the Tomb Raider - 1920x1080 High Preset AA:FX AF:4x | |
| Acer Aspire VN7-593G-73HP V15 Nitro BE | |
| Dell XPS 15 9560 (i7-7700HQ, UHD) | |
| HP Omen 15-ax007ng | |
| Microsoft Surface Book with Performance Base | |
| Acer TravelMate P658-M-59J7 Graphics Dock | |
| Dell XPS 15 9550 i7 FHD | |
| HP Spectre x360 15-bl002xx | |
| Lenovo Yoga 710-14IKB 80V4002HGE | |
| Deus Ex Mankind Divided - 1920x1080 High Preset AF:4x | |
| Acer Aspire VN7-593G-73HP V15 Nitro BE | |
| Microsoft Surface Book with Performance Base | |
| Asus Zenbook UX510UW-CN044T | |
| The Witcher 3 - 1920x1080 Ultra Graphics & Postprocessing (HBAO+) | |
| Acer Aspire VN7-593G-73HP V15 Nitro BE | |
| Dell XPS 15 9560 (i7-7700HQ, UHD) | |
| Asus G752VL-T7023T | |
| Microsoft Surface Book with Performance Base | |
| Asus UX310UQ-FC396T | |
| basso | medio | alto | ultra | |
|---|---|---|---|---|
| BioShock Infinite (2013) | 128 | 118 | 49.9 | |
| The Witcher 3 (2015) | 31.3 | 17.4 | ||
| Rise of the Tomb Raider (2016) | 34.6 | 22.4 | ||
| Deus Ex Mankind Divided (2016) | 49 | 26.4 | 11.4 |
Rumorosità
| Idle |
| 29.4 / 29.4 / 29.7 dB(A) |
| Sotto carico |
| 39 / 40.2 dB(A) |
 | ||
30 dB silenzioso 40 dB(A) udibile 50 dB(A) rumoroso |
||
min: | ||
(-) La temperatura massima sul lato superiore è di 47 °C / 117 F, rispetto alla media di 35.4 °C / 96 F, che varia da 19.6 a 60 °C per questa classe Convertible.
(-) Il lato inferiore si riscalda fino ad un massimo di 47 °C / 117 F, rispetto alla media di 36.9 °C / 98 F
(+) In idle, la temperatura media del lato superiore è di 28.1 °C / 83 F, rispetto alla media deld ispositivo di 30.3 °C / 87 F.
(±) Riproducendo The Witcher 3, la temperatura media per il lato superiore e' di 33.7 °C / 93 F, rispetto alla media del dispositivo di 30.3 °C / 87 F.
(-) I poggiapolsi e il touchpad possono diventare molto caldi al tatto con un massimo di 47 °C / 116.6 F.
(-) La temperatura media della zona del palmo della mano di dispositivi simili e'stata di 28 °C / 82.4 F (-19 °C / -34.2 F).
Microsoft Surface Book with Performance Base analisi audio
(-) | altoparlanti non molto potenti (63 dB)
Bassi 100 - 315 Hz
(±) | bassi ridotti - in media 5.9% inferiori alla media
(±) | la linearità dei bassi è media (7.1% delta rispetto alla precedente frequenza)
Medi 400 - 2000 Hz
(+) | medi bilanciati - solo only 4.3% rispetto alla media
(±) | linearità dei medi adeguata (8.1% delta rispetto alla precedente frequenza)
Alti 2 - 16 kHz
(+) | Alti bilanciati - appena 4.7% dalla media
(±) | la linearità degli alti è media (8% delta rispetto alla precedente frequenza)
Nel complesso 100 - 16.000 Hz
(±) | la linearità complessiva del suono è media (19% di differenza rispetto alla media
Rispetto alla stessa classe
» 45% di tutti i dispositivi testati in questa classe è stato migliore, 7% simile, 48% peggiore
» Il migliore ha avuto un delta di 6%, medio di 20%, peggiore di 57%
Rispetto a tutti i dispositivi testati
» 45% di tutti i dispositivi testati in questa classe è stato migliore, 7% similare, 47% peggiore
» Il migliore ha avuto un delta di 4%, medio di 23%, peggiore di 134%
Apple MacBook Pro 13 2016 (2.9 GHz) analisi audio
(+) | gli altoparlanti sono relativamente potenti (86.9 dB)
Bassi 100 - 315 Hz
(±) | bassi ridotti - in media 13.2% inferiori alla media
(±) | la linearità dei bassi è media (10.7% delta rispetto alla precedente frequenza)
Medi 400 - 2000 Hz
(+) | medi bilanciati - solo only 4.1% rispetto alla media
(+) | medi lineari (6.3% delta rispetto alla precedente frequenza)
Alti 2 - 16 kHz
(+) | Alti bilanciati - appena 2.9% dalla media
(+) | alti lineari (4% delta rispetto alla precedente frequenza)
Nel complesso 100 - 16.000 Hz
(+) | suono nel complesso lineare (12.2% differenza dalla media)
Rispetto alla stessa classe
» 15% di tutti i dispositivi testati in questa classe è stato migliore, 5% simile, 80% peggiore
» Il migliore ha avuto un delta di 5%, medio di 18%, peggiore di 53%
Rispetto a tutti i dispositivi testati
» 10% di tutti i dispositivi testati in questa classe è stato migliore, 2% similare, 88% peggiore
» Il migliore ha avuto un delta di 4%, medio di 23%, peggiore di 134%
HP Spectre x360 15-bl002xx analisi audio
(±) | potenza degli altiparlanti media ma buona (72.9 dB)
Bassi 100 - 315 Hz
(±) | bassi ridotti - in media 14.8% inferiori alla media
(±) | la linearità dei bassi è media (14% delta rispetto alla precedente frequenza)
Medi 400 - 2000 Hz
(+) | medi bilanciati - solo only 4.4% rispetto alla media
(±) | linearità dei medi adeguata (10.1% delta rispetto alla precedente frequenza)
Alti 2 - 16 kHz
(+) | Alti bilanciati - appena 1.2% dalla media
(+) | alti lineari (4.9% delta rispetto alla precedente frequenza)
Nel complesso 100 - 16.000 Hz
(±) | la linearità complessiva del suono è media (20.3% di differenza rispetto alla media
Rispetto alla stessa classe
» 68% di tutti i dispositivi testati in questa classe è stato migliore, 9% simile, 24% peggiore
» Il migliore ha avuto un delta di 5%, medio di 17%, peggiore di 45%
Rispetto a tutti i dispositivi testati
» 53% di tutti i dispositivi testati in questa classe è stato migliore, 8% similare, 39% peggiore
» Il migliore ha avuto un delta di 4%, medio di 23%, peggiore di 134%
| Off / Standby | |
| Idle | |
| Sotto carico |
|
Leggenda:
min: | |
| Microsoft Surface Book with Performance Base 6600U, GeForce GTX 965M, Toshiba NVMe THNSN5256GPU7, IPS, 3000x2000, 13.5" | Microsoft Surface Book Core i7 6600U, Maxwell GPU (940M, GDDR5), Samsung MZFLV512 NVMe, IPS, 3000x2000, 13.5" | Microsoft Surface Pro 4, Core i5, 128GB 6300U, HD Graphics 520, Samsung MZFLV128 NVMe, IPS, 2736x1824, 12.3" | Lenovo Yoga 710-14IKB 80V4002HGE i5-7200U, HD Graphics 620, Samsung MZYTY256HDHP, a-Si WLED TFT, IPS, 1920x1080, 14" | Apple MacBook Pro 13 2016 (2.9 GHz) 6267U, Iris Graphics 550, Apple SSD AP0256, , 2560x1600, 13.3" | |
|---|---|---|---|---|---|
| Power Consumption | 5% | 27% | 33% | 24% | |
| Idle Minimum * (Watt) | 4.15 | 4.5 -8% | 4.4 -6% | 3.7 11% | 2.1 49% |
| Idle Average * (Watt) | 8 | 9.8 -23% | 9 -13% | 7.16 10% | 7.6 5% |
| Idle Maximum * (Watt) | 11.9 | 12.2 -3% | 10.7 10% | 8.3 30% | 8.2 31% |
| Load Average * (Watt) | 67 | 46 31% | 19.6 71% | 30.4 55% | 56.4 16% |
| Witcher 3 ultra * (Watt) | 58 | ||||
| Load Maximum * (Watt) | 76 | 56 26% | 19.9 74% | 30.3 60% | 59.8 21% |
* ... Meglio usare valori piccoli
| Microsoft Surface Book with Performance Base 6600U, GeForce GTX 965M, 78 Wh | Microsoft Surface Book Core i5 6300U, Maxwell GPU (940M, GDDR5), 78 Wh | Microsoft Surface Book Core i7 6600U, Maxwell GPU (940M, GDDR5), 78 Wh | Microsoft Surface Pro 4, Core i5, 128GB 6300U, HD Graphics 520, 38 Wh | Lenovo Yoga 710-14IKB 80V4002HGE i5-7200U, HD Graphics 620, 53 Wh | HP Spectre x360 15-bl002xx i7-7500U, GeForce 940MX, 79.2 Wh | Apple MacBook Pro 13 2016 (2.9 GHz) 6267U, Iris Graphics 550, 49.2 Wh | |
|---|---|---|---|---|---|---|---|
| Autonomia della batteria | 4% | 13% | -13% | 0% | 5% | -15% | |
| Reader / Idle (h) | 25.5 | 17.8 -30% | 15 -41% | 16 -37% | 14.4 -44% | ||
| WiFi v1.3 (h) | 9.6 | 6.7 -30% | 10.8 13% | 7.1 -26% | 9.4 -2% | 8.9 -7% | 9.4 -2% |
| Load (h) | 1.5 | 2.6 73% | 1.9 27% | 2.1 40% | 2.5 67% | 1.1 -27% | |
| H.264 (h) | 10.1 | 8.7 | 8.1 |
Nota: si tratta di una recensione breve, con alcune sezioni non tradotte, per la versione integrale in inglese guardate qui.
Pro
Contro
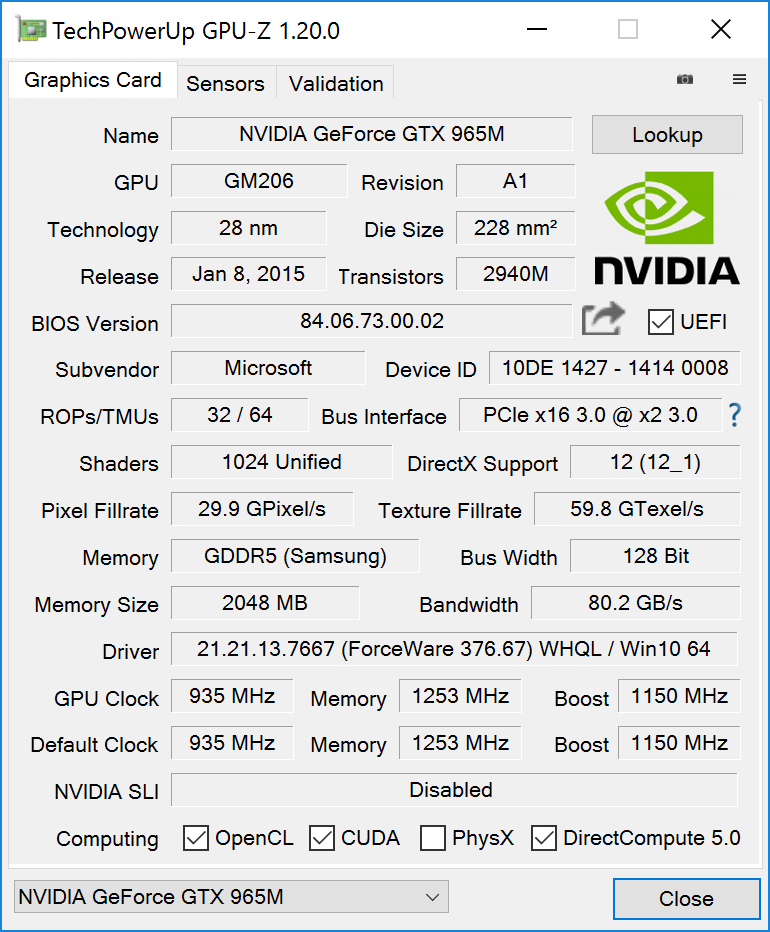
The GeForce chip inside the keyboard is barely able to utilize its full turbo boost potential, and it remains at its default 950 MHz frequency when running The Witcher 3. While the impact on actual games will be rather limited, the impact on synthetic benchmarks is very noticeable: it's the reason why the device is seemingly slower than other GTX 965M-powered laptops.
Most modern games will be unplayable in FHD at high details. If you're ok with this you get above-average performance for this level of mobility. Don't, however, expect the Surface Book to keep up with 45 W multimedia notebooks - in order to achieve that Microsoft would have to improve the cooling and replace the GPU with Nvidia's Pascal.
Gamers will have to think twice before purchasing the device. Our review unit will set you back around 2,600 Euros in Europe and around $2,400 plus taxes in the United States. In comparison, the same amount of money will get you two Acer V15 notebooks with GTX 1060 GPU. Gamers aren't Microsoft's target audience for the device, though, and the company's focus is on design, architecture, CAD, video, and preprint professionals that require plenty of GPU power for work.
Not a Workstation
The Surface Book certainly isn't a real workstation. Not only does it lack the necessary CAD/CAM certifications, but it also features a 15 W CPU, which is a no-go in this particular market. Thus, HP, Dell, and Lenovo won't have to fear any real competition here.
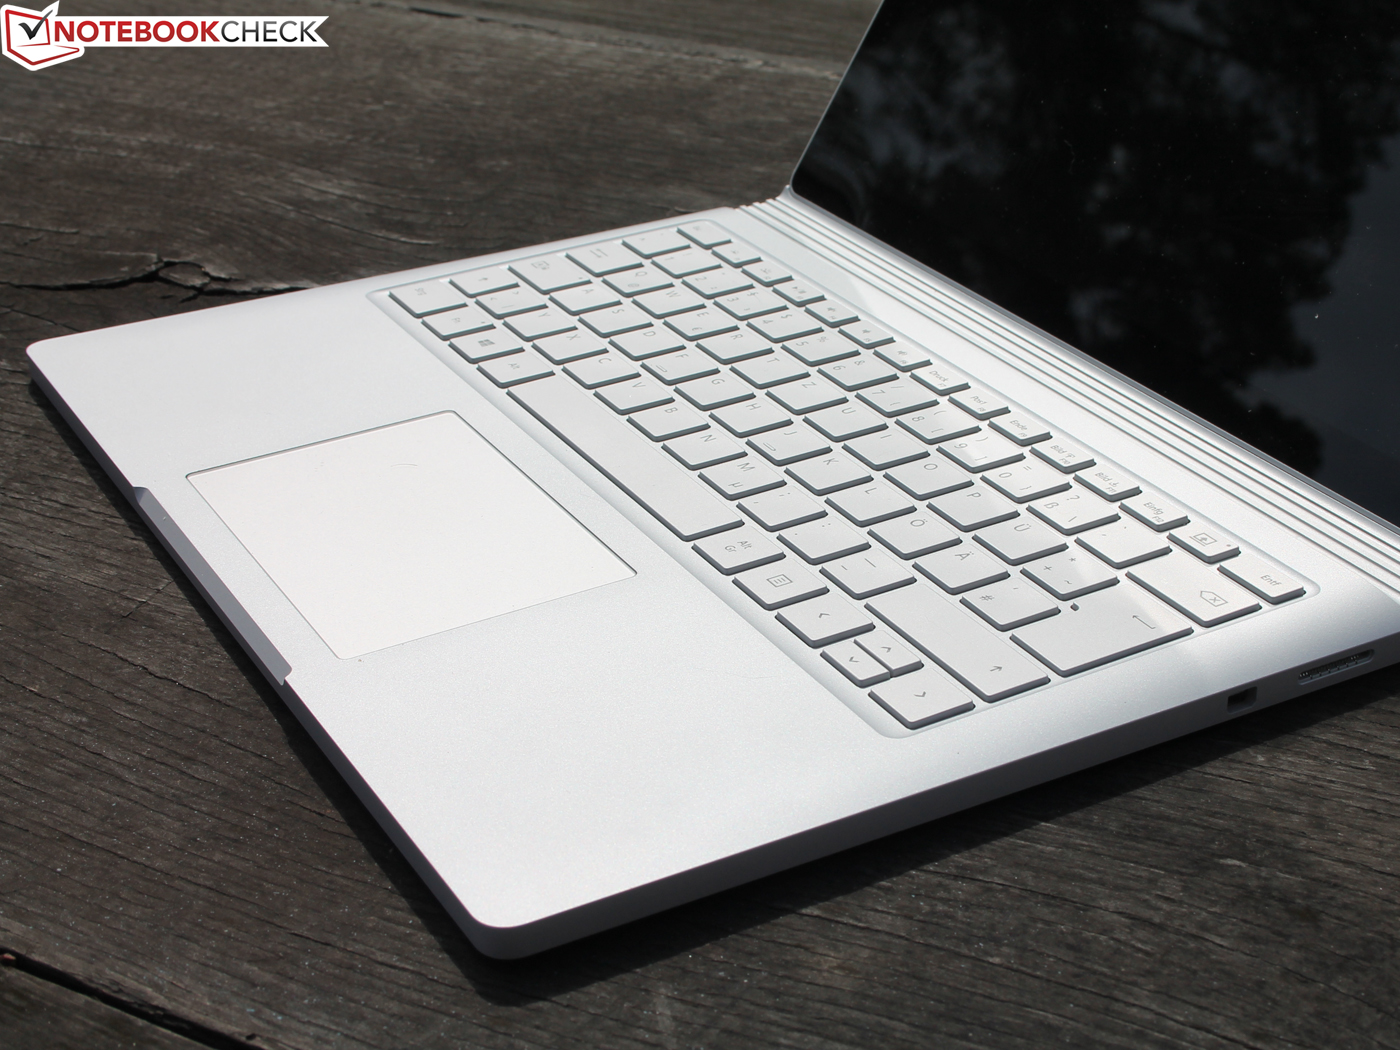
The Surface Book's strength is its mobility: Undocking and taking the 13-inch tablet and stylus with you wherever you go. This is where the Surface Book truly and literally shines, with its very bright IPS display (almost 100% sRGB-coverage), its excellent input devices, its high-quality case, its very good cameras and microphone, and an impressive battery life to boot. Docking and undocking worked flawlessly during our tests.
Its weaknesses are the lack of ports and LTE and its high price, which puts it way beyond the realm of what consumers are willing to spend for a notebook. A model with FHD display, integrated graphics, and a 256 GB SSD for $1,000 could take the market by storm. Unfortunately, the cheapest Surface Book with Core i5-6300U and a 128 GB SSD is at least $1,499 plus taxes.
External Thunderbolt 3 GPU
In theory, every notebook/tablet/2-in-1 convertible with Thunderbolt 3 can be upgraded with an external graphics dock offered by the likes of Razer, Acer, and Asus. That way, even ultraportable devices such as the Dell XPS 13 2-in-1 or the regular XPS 13 can be transformed into gaming powerhouses. If you want to read more, take a look at our Razer review. Unfortunately, Acer has stopped selling their eGPU enclosure, and Asus and Razer are asking for $500 and $600 for their models, respectively ($450 for the Razer model when bundled with a notebook). That's without a graphics card, mind you.
- Razer Core (GPU replaceable)
- Acer Graphics Dock (GTX 960M, not replaceable)
- Asus ROG XG Station 2 (GPU replaceable)
The following alternatives are based on the newer TI3-Controller which, however, still suffers from various bugs and compatibility issues (see here for more details):
- Manitz Venus
- AKiTiO Node
- PowerColor Devil Box
Alternative 2-in-1 with dedicated graphics?
There are no other docking solutions that include a GPU underneath the keyboard available on the market as we speak. The often-mentioned Lenovo Yoga 710-14 might seem like a low-cost alternative but, at least according to the Lenovo Forums, it drives its users crazy with its obnoxious fan. HP's 15-inch Spectre x360 is far from portable.
Microsoft Surface Book with Performance Base
- 05/03/2017 v6 (old)
Sebastian Jentsch
Price comparison
