Recensione breve del Portatile Acer Aspire V15 Nitro BE VN7-593G (7700HQ, GTX 1060)
| |||||||||||||||||||||||||
Distribuzione della luminosità: 86 %
Al centro con la batteria: 322 cd/m²
Contrasto: 1039:1 (Nero: 0.31 cd/m²)
ΔE ColorChecker Calman: 4.73 | ∀{0.5-29.43 Ø4.73}
ΔE Greyscale Calman: 2.99 | ∀{0.09-98 Ø4.97}
85% sRGB (Argyll 1.6.3 3D)
56% AdobeRGB 1998 (Argyll 1.6.3 3D)
62.2% AdobeRGB 1998 (Argyll 3D)
85.1% sRGB (Argyll 3D)
65.8% Display P3 (Argyll 3D)
Gamma: 2.32
CCT: 6905 K
| Acer Aspire VN7-593G-73HP V15 Nitro BE LG Display LP156WF6-SPP1, , 1920x1080, 15.6" | Acer Aspire V15 Nitro BE VN7-592G-79DV Sharp LQ156D1JW02D, , 3840x2160, 15.6" | Asus Strix GL502VM-FY039T LG Philips LP156WF6-SPB6 (LGD046F), , 1920x1080, 15.6" | MSI GT62VR 7RE-223 LG Philips LP156WF6 (LGD046F), , 1920x1080, 15.6" | Gigabyte P55W v7 LG Philips LP156WF6 (LGD046F), , 1920x1080, 15.6" | Dell XPS 15 2017 9560 (7300HQ, Full-HD) Sharp SHP1453 LQ156M1, , 1920x1080, 15.6" | Acer Aspire VX5-591G-75C4 VX15 LG Philips LGD0550 / LP156WF6-SPK4, , 1920x1080, 15.6" | Dell Inspiron 15 7000 7567 AU Optronics AUO38ED B156HTN 28H80, , 1920x1080, 15.6" | MSI GL62M 7RD-077 Chi Mei N156HGE-EAL, , 1920x1080, 15.6" | |
|---|---|---|---|---|---|---|---|---|---|
| Display | 36% | -2% | -2% | -4% | 12% | -36% | -40% | 28% | |
| Display P3 Coverage (%) | 65.8 | 86.2 31% | 64.5 -2% | 63.9 -3% | 63.5 -3% | 68.9 5% | 38.88 -41% | 36.42 -45% | 85.4 30% |
| sRGB Coverage (%) | 85.1 | 100 18% | 83.4 -2% | 83.1 -2% | 82 -4% | 98.9 16% | 58.2 -32% | 54.9 -35% | 100 18% |
| AdobeRGB 1998 Coverage (%) | 62.2 | 99.5 60% | 60.9 -2% | 60.8 -2% | 59.9 -4% | 70.9 14% | 40.2 -35% | 37.62 -40% | 83.8 35% |
| Response Times | 3% | 14% | 18% | 18% | -43% | 39% | 3% | 4% | |
| Response Time Grey 50% / Grey 80% * (ms) | 41 ? | 49 ? -20% | 40 ? 2% | 37 ? 10% | 37 ? 10% | 54 ? -32% | 22 ? 46% | 36 ? 12% | 44 ? -7% |
| Response Time Black / White * (ms) | 34 ? | 25 ? 26% | 25 ? 26% | 25 ? 26% | 25 ? 26% | 52.4 ? -54% | 23 ? 32% | 36 ? -6% | 29 ? 15% |
| PWM Frequency (Hz) | 1000 ? | 198 ? | |||||||
| Screen | 26% | 0% | -2% | -4% | 2% | -15% | -86% | -54% | |
| Brightness middle (cd/m²) | 322 | 303 -6% | 321 0% | 310 -4% | 287 -11% | 400 24% | 281 -13% | 246 -24% | 258 -20% |
| Brightness (cd/m²) | 297 | 291 -2% | 296 0% | 311 5% | 289 -3% | 392 32% | 257 -13% | 235 -21% | 234 -21% |
| Brightness Distribution (%) | 86 | 83 -3% | 88 2% | 85 -1% | 87 1% | 89 3% | 85 -1% | 75 -13% | 79 -8% |
| Black Level * (cd/m²) | 0.31 | 0.22 29% | 0.33 -6% | 0.3 3% | 0.29 6% | 0.26 16% | 0.32 -3% | 0.55 -77% | 0.54 -74% |
| Contrast (:1) | 1039 | 1377 33% | 973 -6% | 1033 -1% | 990 -5% | 1538 48% | 878 -15% | 447 -57% | 478 -54% |
| Colorchecker dE 2000 * | 4.73 | 3.47 27% | 4.42 7% | 4.82 -2% | 4.92 -4% | 4.9 -4% | 5.16 -9% | 10.97 -132% | 9.74 -106% |
| Colorchecker dE 2000 max. * | 12.37 | 6.79 45% | 9.78 21% | 10.14 18% | 11 11% | 11 11% | 9.09 27% | 14.6 -18% | |
| Greyscale dE 2000 * | 2.99 | 1.17 61% | 3.34 -12% | 3.94 -32% | 3.66 -22% | 7.2 -141% | 4.57 -53% | 14.25 -377% | 11.59 -288% |
| Gamma | 2.32 95% | 2.35 94% | 2.4 92% | 2.45 90% | 2.32 95% | 2.11 104% | 2.59 85% | 1.83 120% | 2.19 100% |
| CCT | 6905 94% | 6658 98% | 6213 105% | 6877 95% | 6482 100% | 6911 94% | 6931 94% | 11200 58% | 11851 55% |
| Color Space (Percent of AdobeRGB 1998) (%) | 56 | 86 54% | 55 -2% | 54 -4% | 54 -4% | 64.2 15% | 37 -34% | 35 -37% | 76 36% |
| Color Space (Percent of sRGB) (%) | 85 | 100 18% | 83 -2% | 83 -2% | 82 -4% | 98.9 16% | 58 -32% | 55 -35% | 100 18% |
| Media totale (Programma / Settaggio) | 22% /
25% | 4% /
2% | 5% /
1% | 3% /
-1% | -10% /
-2% | -4% /
-12% | -41% /
-63% | -7% /
-30% |
* ... Meglio usare valori piccoli
Tempi di risposta del Display
| ↔ Tempi di risposta dal Nero al Bianco | ||
|---|---|---|
| 34 ms ... aumenta ↗ e diminuisce ↘ combinato | ↗ 21 ms Incremento | 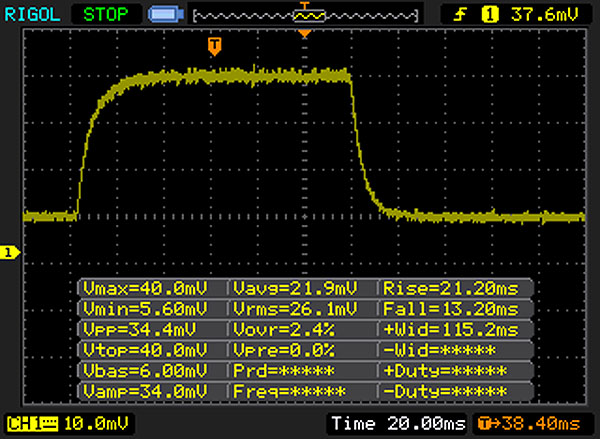 |
| ↘ 13 ms Calo | ||
| Lo schermo mostra tempi di risposta lenti nei nostri tests e sarà insoddisfacente per i gamers. In confronto, tutti i dispositivi di test variano da 0.1 (minimo) a 240 (massimo) ms. » 91 % di tutti i dispositivi è migliore. Questo significa che i tempi di risposta rilevati sono peggiori rispetto alla media di tutti i dispositivi testati (19.9 ms). | ||
| ↔ Tempo di risposta dal 50% Grigio all'80% Grigio | ||
| 41 ms ... aumenta ↗ e diminuisce ↘ combinato | ↗ 21 ms Incremento | 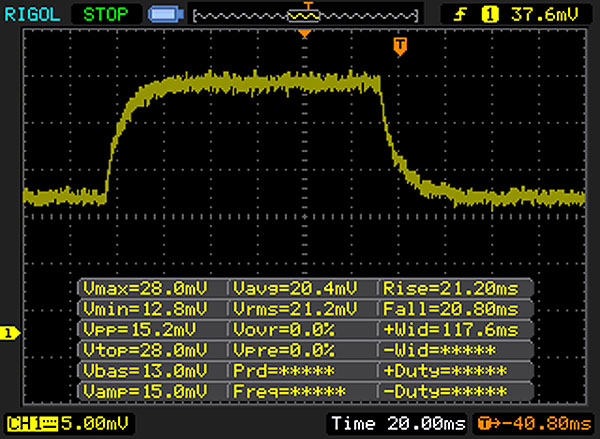 |
| ↘ 20 ms Calo | ||
| Lo schermo mostra tempi di risposta lenti nei nostri tests e sarà insoddisfacente per i gamers. In confronto, tutti i dispositivi di test variano da 0.165 (minimo) a 636 (massimo) ms. » 65 % di tutti i dispositivi è migliore. Questo significa che i tempi di risposta rilevati sono peggiori rispetto alla media di tutti i dispositivi testati (31.1 ms). | ||
Sfarfallio dello schermo / PWM (Pulse-Width Modulation)
| flickering dello schermo / PWM non rilevato | 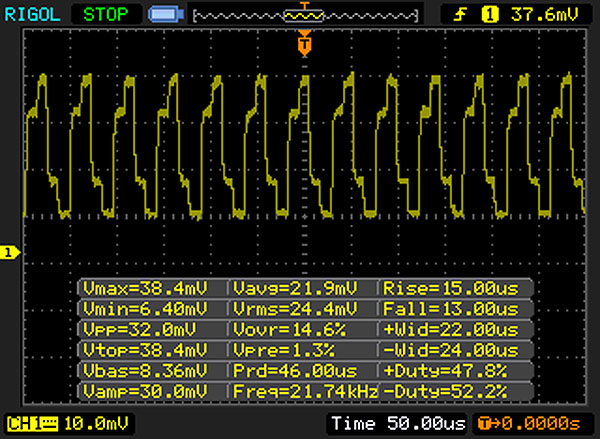 | ||
In confronto: 52 % di tutti i dispositivi testati non utilizza PWM per ridurre la luminosita' del display. Se è rilevato PWM, una media di 7798 (minimo: 5 - massimo: 343500) Hz è stata rilevata. | |||
| Acer Aspire VN7-593G-73HP V15 Nitro BE Seagate Mobile HDD 1TB ST1000LM035 | Acer Aspire V15 Nitro BE VN7-592G-79DV Lite-On CV1-8B512 M.2 512 GB | Asus Strix GL502VM-FY039T Micron SSD 1100 (MTFDDAV256TBN) | MSI GL62M 7RD-077 HGST Travelstar 7K1000 HTS721010A9E630 | |
|---|---|---|---|---|
| CrystalDiskMark 3.0 | 18615% | 20775% | 74% | |
| Read Seq (MB/s) | 120.9 | 531 339% | 462.5 283% | 112.4 -7% |
| Write Seq (MB/s) | 101.8 | 415.6 308% | 462.7 355% | 107.3 5% |
| Read 512 (MB/s) | 37.83 | 338.9 796% | 335 786% | 43.19 14% |
| Write 512 (MB/s) | 84.4 | 415.6 392% | 407.1 382% | 57 -32% |
| Read 4k (MB/s) | 0.473 | 24.77 5137% | 25.61 5314% | 0.494 4% |
| Write 4k (MB/s) | 0.313 | 78.4 24948% | 86.3 27472% | 1.122 258% |
| Read 4k QD32 (MB/s) | 1.133 | 278.8 24507% | 246.7 21674% | 1.088 -4% |
| Write 4k QD32 (MB/s) | 0.274 | 253.7 92491% | 301.5 109936% | 1.234 350% |

| 3DMark 11 Performance | 12181 punti | |
| 3DMark Cloud Gate Standard Score | 23269 punti | |
| 3DMark Fire Strike Score | 9621 punti | |
| 3DMark Time Spy Score | 3594 punti | |
Aiuto | ||
| BioShock Infinite - 1920x1080 Ultra Preset, DX11 (DDOF) | |
| MSI GT62VR 7RE-223 | |
| Asus Strix GL502VM-FY039T | |
| HP Omen 17-w100ng | |
| Acer Aspire VN7-593G-73HP V15 Nitro BE | |
| Dell Inspiron 15 7000 7567 | |
| MSI GL62M 7RD-077 | |
| Acer Aspire V15 Nitro BE VN7-592G-79DV | |
| Thief - 1920x1080 Very High Preset AA:FXAA & High SS AF:8x | |
| Acer Aspire VN7-593G-73HP V15 Nitro BE | |
| MSI GL62M 7RD-077 | |
| The Witcher 3 - 1920x1080 Ultra Graphics & Postprocessing (HBAO+) | |
| Gigabyte P55W v7 | |
| Acer Aspire VN7-593G-73HP V15 Nitro BE | |
| Acer Aspire VX5-591G-75C4 VX15 | |
| Dell XPS 15 2017 9560 (7300HQ, Full-HD) | |
| Rise of the Tomb Raider - 1920x1080 Very High Preset AA:FX AF:16x | |
| Gigabyte P55W v7 | |
| Acer Aspire VN7-593G-73HP V15 Nitro BE | |
| Dell Inspiron 15 7000 7567 | |
| MSI GL62M 7RD-077 | |
| Acer Aspire V15 Nitro BE VN7-592G-79DV | |
| Deus Ex Mankind Divided - 1920x1080 Ultra Preset AA:2xMS AF:8x | |
| MSI GT62VR 7RE-223 | |
| Acer Aspire VN7-593G-73HP V15 Nitro BE | |
| HP Omen 17-w100ng | |
| MSI GL62M 7RD-077 | |
| Battlefield 1 - 1920x1080 Ultra Preset AA:T | |
| MSI GT62VR 7RE-223 | |
| HP Omen 17-w100ng | |
| Gigabyte P55W v7 | |
| Acer Aspire VN7-593G-73HP V15 Nitro BE | |
| Dell Inspiron 15 7000 7567 | |
| Dell XPS 15 2017 9560 (7300HQ, Full-HD) | |
| MSI GL62M 7RD-077 | |
| Titanfall 2 - 1920x1080 Very High (Insane Texture Quality) / Enabled AA:TS AF:16x | |
| MSI GT62VR 7RE-223 | |
| Acer Aspire VN7-593G-73HP V15 Nitro BE | |
| HP Omen 17-w100ng | |
| Asus Strix GL502VM-FY039T | |
| Dell Inspiron 15 7000 7567 | |
| Dell XPS 15 2017 9560 (7300HQ, Full-HD) | |
| MSI GL62M 7RD-077 | |
| Dishonored 2 - 1920x1080 Ultra Preset AA:TX | |
| Asus Strix GL502VM-FY039T | |
| Acer Aspire VN7-593G-73HP V15 Nitro BE | |
| Gigabyte P55W v7 | |
| Dell Inspiron 15 7000 7567 | |
| basso | medio | alto | ultra | |
|---|---|---|---|---|
| BioShock Infinite (2013) | 142 | 128 | 88 | |
| Thief (2014) | 63.8 | |||
| The Witcher 3 (2015) | 68 | 38.3 | ||
| Rise of the Tomb Raider (2016) | 74.5 | 60.7 | ||
| Deus Ex Mankind Divided (2016) | 55.9 | 29.4 | ||
| Battlefield 1 (2016) | 60 | 57 | ||
| Titanfall 2 (2016) | 143.5 | 124.2 | 99.4 | |
| Dishonored 2 (2016) | 60.5 | 53.9 |
Rumorosità
| Idle |
| 30.9 / 30.9 / 31.5 dB(A) |
| HDD |
| 32.3 dB(A) |
| Sotto carico |
| 40.7 / 43.9 dB(A) |
 | ||
30 dB silenzioso 40 dB(A) udibile 50 dB(A) rumoroso |
||
min: | ||
(-) La temperatura massima sul lato superiore è di 51.9 °C / 125 F, rispetto alla media di 36.8 °C / 98 F, che varia da 21 a 71 °C per questa classe Multimedia.
(-) Il lato inferiore si riscalda fino ad un massimo di 54.6 °C / 130 F, rispetto alla media di 39.1 °C / 102 F
(+) In idle, la temperatura media del lato superiore è di 26.3 °C / 79 F, rispetto alla media deld ispositivo di 31.3 °C / 88 F.
(-) Riproducendo The Witcher 3, la temperatura media per il lato superiore e' di 39.4 °C / 103 F, rispetto alla media del dispositivo di 31.3 °C / 88 F.
(+) I poggiapolsi e il touchpad raggiungono la temperatura massima della pelle (34 °C / 93.2 F) e quindi non sono caldi.
(-) La temperatura media della zona del palmo della mano di dispositivi simili e'stata di 28.7 °C / 83.7 F (-5.3 °C / -9.5 F).
Acer Aspire VN7-593G-73HP V15 Nitro BE analisi audio
(±) | potenza degli altiparlanti media ma buona (80 dB)
Bassi 100 - 315 Hz
(±) | bassi ridotti - in media 11.8% inferiori alla media
(±) | la linearità dei bassi è media (13.5% delta rispetto alla precedente frequenza)
Medi 400 - 2000 Hz
(±) | medi elevati - circa 5.5% superiore alla media
(+) | medi lineari (6.6% delta rispetto alla precedente frequenza)
Alti 2 - 16 kHz
(+) | Alti bilanciati - appena 1.1% dalla media
(+) | alti lineari (4% delta rispetto alla precedente frequenza)
Nel complesso 100 - 16.000 Hz
(+) | suono nel complesso lineare (14.6% differenza dalla media)
Rispetto alla stessa classe
» 35% di tutti i dispositivi testati in questa classe è stato migliore, 4% simile, 61% peggiore
» Il migliore ha avuto un delta di 5%, medio di 17%, peggiore di 45%
Rispetto a tutti i dispositivi testati
» 19% di tutti i dispositivi testati in questa classe è stato migliore, 4% similare, 77% peggiore
» Il migliore ha avuto un delta di 4%, medio di 24%, peggiore di 134%
Asus Strix GL502VM-FY039T analisi audio
(±) | potenza degli altiparlanti media ma buona (76 dB)
Bassi 100 - 315 Hz
(-) | quasi nessun basso - in media 19.1% inferiori alla media
(-) | bassi non lineari (18.1% delta rispetto alla precedente frequenza)
Medi 400 - 2000 Hz
(+) | medi bilanciati - solo only 2.9% rispetto alla media
(+) | medi lineari (4% delta rispetto alla precedente frequenza)
Alti 2 - 16 kHz
(±) | alti elevati - circa 5.6% superiori alla media
(±) | la linearità degli alti è media (8% delta rispetto alla precedente frequenza)
Nel complesso 100 - 16.000 Hz
(±) | la linearità complessiva del suono è media (23% di differenza rispetto alla media
Rispetto alla stessa classe
» 83% di tutti i dispositivi testati in questa classe è stato migliore, 5% simile, 12% peggiore
» Il migliore ha avuto un delta di 6%, medio di 18%, peggiore di 132%
Rispetto a tutti i dispositivi testati
» 69% di tutti i dispositivi testati in questa classe è stato migliore, 5% similare, 26% peggiore
» Il migliore ha avuto un delta di 4%, medio di 24%, peggiore di 134%
| Off / Standby | |
| Idle | |
| Sotto carico |
|
Leggenda:
min: | |
| Acer Aspire VN7-593G-73HP V15 Nitro BE i7-7700HQ, GeForce GTX 1060 Mobile, Seagate Mobile HDD 1TB ST1000LM035, AH-IPS, Normally Black, Transmissive, 1920x1080, 15.6" | Acer Aspire V15 Nitro BE VN7-592G-79DV 6700HQ, GeForce GTX 960M, Lite-On CV1-8B512 M.2 512 GB, IPS, 3840x2160, 15.6" | Asus Strix GL502VM-FY039T 6700HQ, GeForce GTX 1060 Mobile, Micron SSD 1100 (MTFDDAV256TBN), IPS, 1920x1080, 15.6" | MSI GT62VR 7RE-223 i7-7700HQ, GeForce GTX 1070 Mobile, Samsung SSD PM871a MZNLN256HMHQ, IPS, 1920x1080, 15.6" | Gigabyte P55W v7 i7-7700HQ, GeForce GTX 1060 Mobile, Liteonit CV3-8D256, IPS, 1920x1080, 15.6" | Dell XPS 15 2017 9560 (7300HQ, Full-HD) i5-7300HQ, GeForce GTX 1050 Mobile, WDC WD10SPCX-75KHST0 + SanDisk Z400s M.2 2242 32 GB Cache, LED IGZO IPS InfinityEdge, 1920x1080, 15.6" | Acer Aspire VX5-591G-75C4 VX15 i7-7700HQ, GeForce GTX 1050 Ti Mobile, Toshiba MQ01ABD100, IPS, 1920x1080, 15.6" | Dell Inspiron 15 7000 7567 i7-7700HQ, GeForce GTX 1050 Ti Mobile, Intel SSDSCKKF256H6, TN, 1920x1080, 15.6" | MSI GL62M 7RD-077 i7-7700HQ, GeForce GTX 1050 Mobile, HGST Travelstar 7K1000 HTS721010A9E630, TN LED, 1920x1080, 15.6" | |
|---|---|---|---|---|---|---|---|---|---|
| Power Consumption | -8% | -46% | -83% | -7% | 15% | 8% | 28% | -15% | |
| Idle Minimum * (Watt) | 7.2 | 8.9 -24% | 16 -122% | 20 -178% | 8 -11% | 6.6 8% | 7 3% | 4.4 39% | 10.6 -47% |
| Idle Average * (Watt) | 10.5 | 13.9 -32% | 19 -81% | 24 -129% | 13 -24% | 9 14% | 10.2 3% | 6.8 35% | 14.5 -38% |
| Idle Maximum * (Watt) | 16 | 15.6 2% | 23 -44% | 29 -81% | 18 -13% | 10.7 33% | 14 12% | 8.3 48% | 15 6% |
| Load Average * (Watt) | 82 | 89 -9% | 68 17% | 82 -0% | 76 7% | 77.5 5% | 78 5% | 81 1% | 90 -10% |
| Witcher 3 ultra * (Watt) | 124 | ||||||||
| Load Maximum * (Watt) | 155 | 118 24% | 157 -1% | 193 -25% | 143 8% | 130 16% | 127 18% | 127 18% | 135 13% |
* ... Meglio usare valori piccoli
| Acer Aspire VN7-593G-73HP V15 Nitro BE i7-7700HQ, GeForce GTX 1060 Mobile, 69 Wh | Acer Aspire V15 Nitro BE VN7-592G-79DV 6700HQ, GeForce GTX 960M, 52 Wh | Asus Strix GL502VM-FY039T 6700HQ, GeForce GTX 1060 Mobile, 64 Wh | MSI GT62VR 7RE-223 i7-7700HQ, GeForce GTX 1070 Mobile, 75 Wh | Gigabyte P55W v7 i7-7700HQ, GeForce GTX 1060 Mobile, 63 Wh | Dell XPS 15 2017 9560 (7300HQ, Full-HD) i5-7300HQ, GeForce GTX 1050 Mobile, 56 Wh | Acer Aspire VX5-591G-75C4 VX15 i7-7700HQ, GeForce GTX 1050 Ti Mobile, 52.5 Wh | Dell Inspiron 15 7000 7567 i7-7700HQ, GeForce GTX 1050 Ti Mobile, 74 Wh | MSI GL62M 7RD-077 i7-7700HQ, GeForce GTX 1050 Mobile, 41 Wh | |
|---|---|---|---|---|---|---|---|---|---|
| Autonomia della batteria | -27% | -37% | -30% | 7% | -12% | -32% | 55% | -44% | |
| Reader / Idle (h) | 8.4 | 8.8 5% | 5.3 -37% | 6.3 -25% | 13.2 57% | 9.4 12% | 5.4 -36% | 19.6 133% | 6.5 -23% |
| WiFi v1.3 (h) | 6 | 3.6 -40% | 3.7 -38% | 4.1 -32% | 5.8 -3% | 5.6 -7% | 5 -17% | 10.4 73% | 3.8 -37% |
| Load (h) | 2.4 | 1.3 -46% | 1.5 -37% | 1.6 -33% | 1.6 -33% | 1.4 -42% | 1.4 -42% | 1.4 -42% | 0.7 -71% |
| H.264 (h) | 3.9 | 3.9 | 4.2 | 7.6 | 3.6 |
Pro
Contro

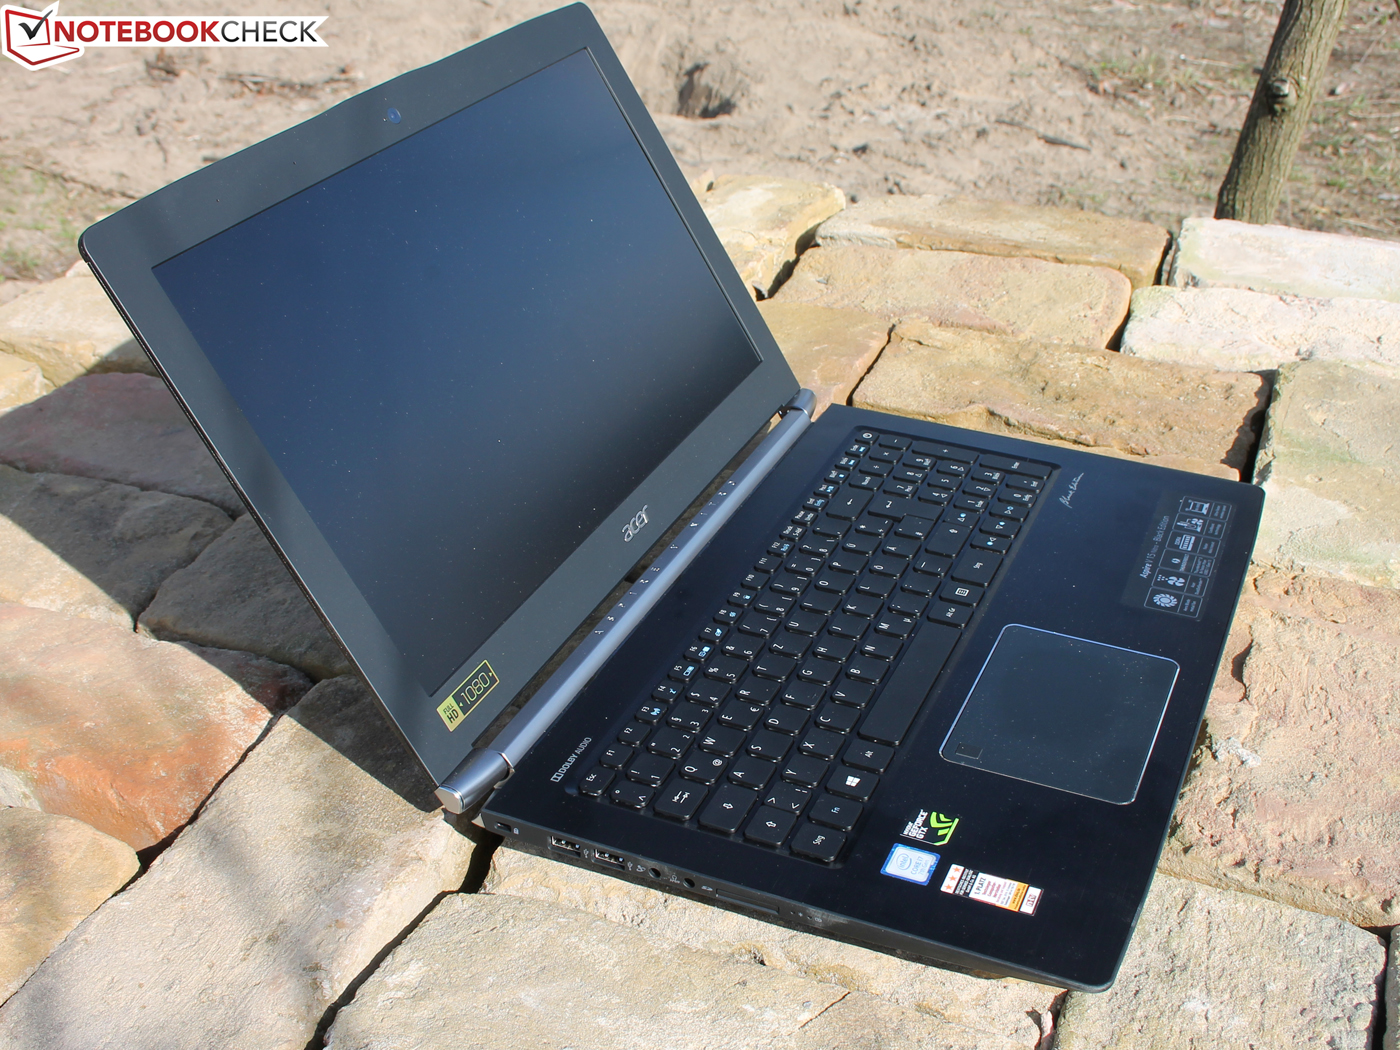
Acer dimostra ancora una volta le sue capacità e crea una macchina da 15 pollici che è adatta tanto per il gioco, quanto per l'intrattenimento domestico o per il lavoro. Ma andiamo con ordine.
Le performance la fanno da padrone. Grazie alla GeForce GTX 1060 i giochi up-to-date possono essere riprodotti in alta definizione. Il sistema di raffreddamento con due ventole garantisce costantemente elevati frame rate durante lo stress di gioco. Si consiglia la GTX 1060 ai giocatori alla ricerca di un laptop portatile che offra il miglior rapporto prezzo-perfomance.
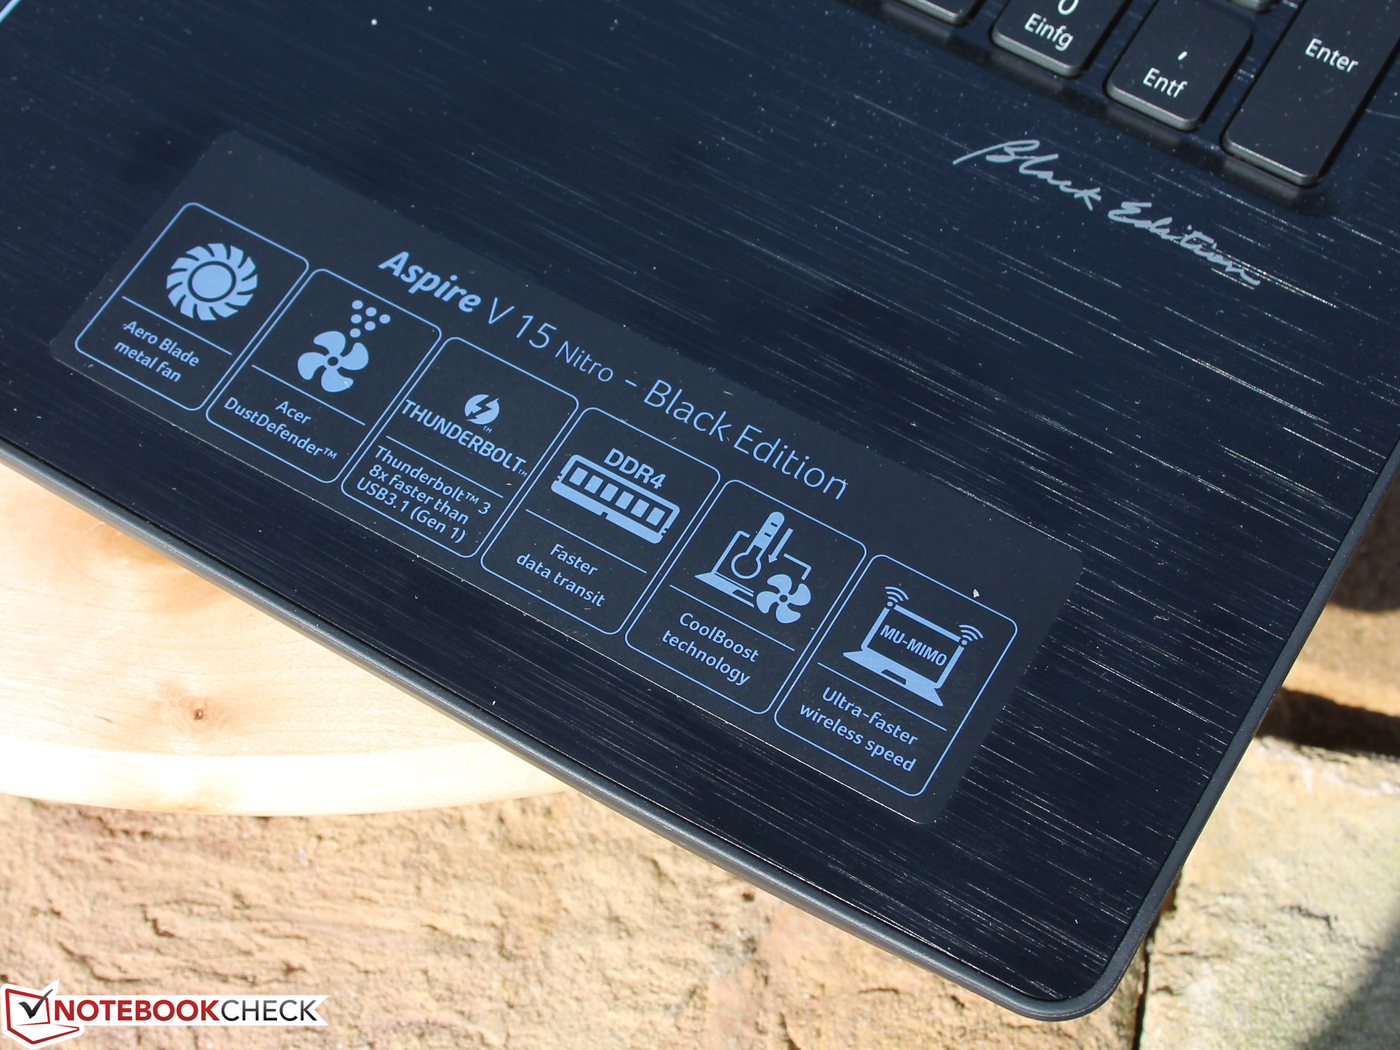
Il 2017 Aspire V15 Nitro Black Edition porta tutta la potenza gaming sulla scrivania.
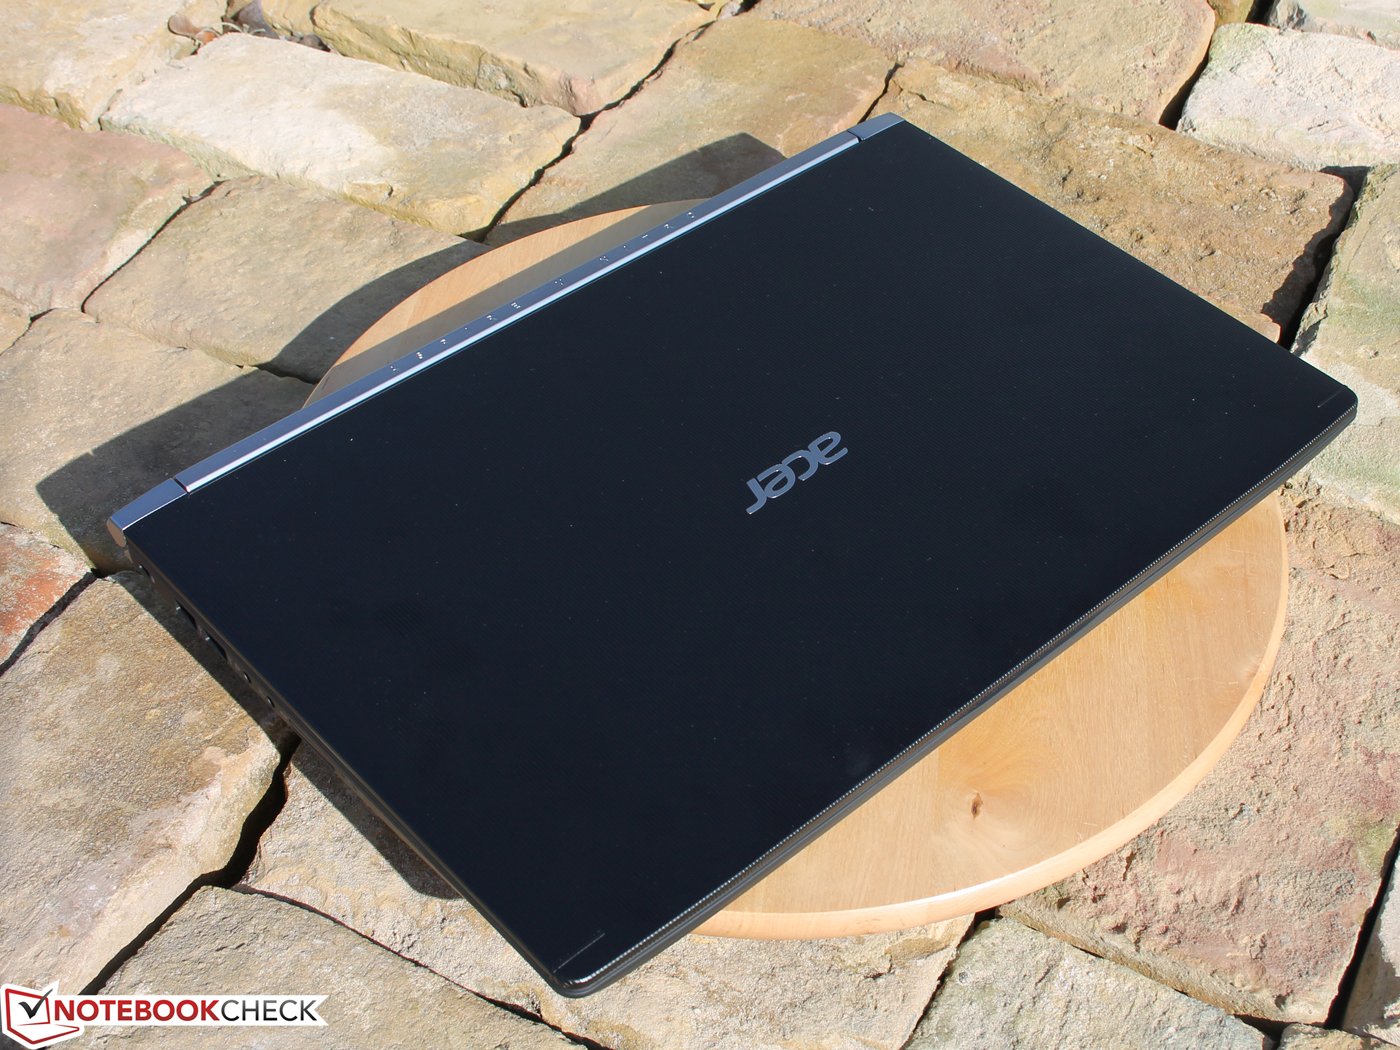
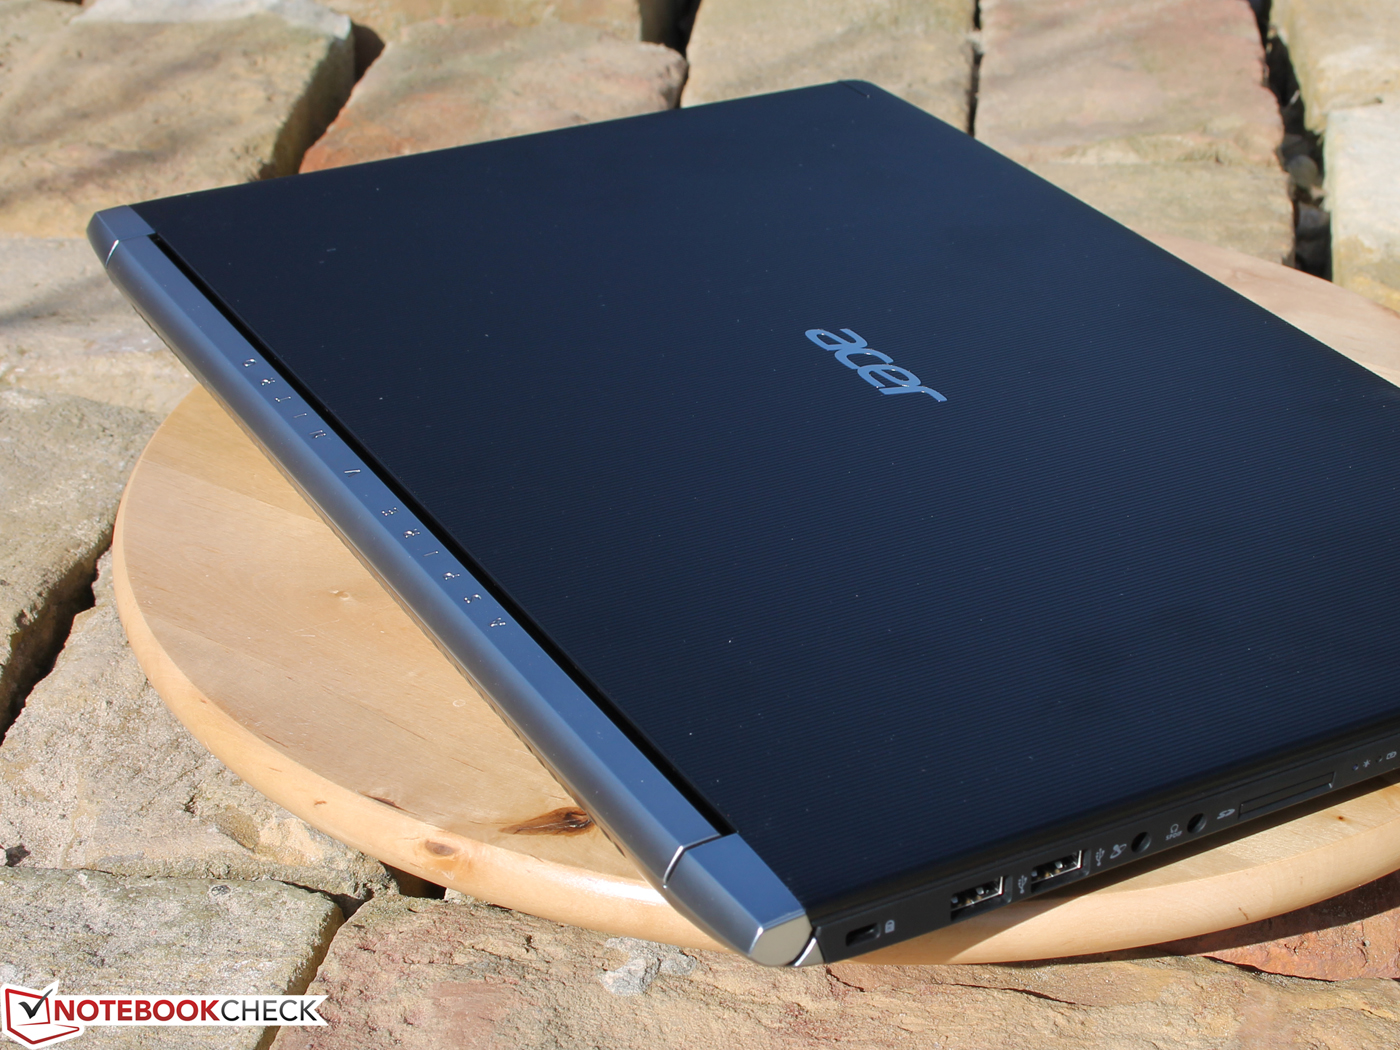
Mentre il V15 difficilmente produce rumore in modalità di stand-by, questo è abbastanza forte durante le partite. Gli ottimi altoparlanti con toni alti e bassi possono però facilmente coprire questo rumore. I dispositivi di input sono relativamente decenti e le opzioni di manutenzione sono quasi esemplari. Un pannello IPS opaco, ad alto contrasto completa il quadro. Anche se non copre tutti gli spazi di colore, non fa uso di PWM.
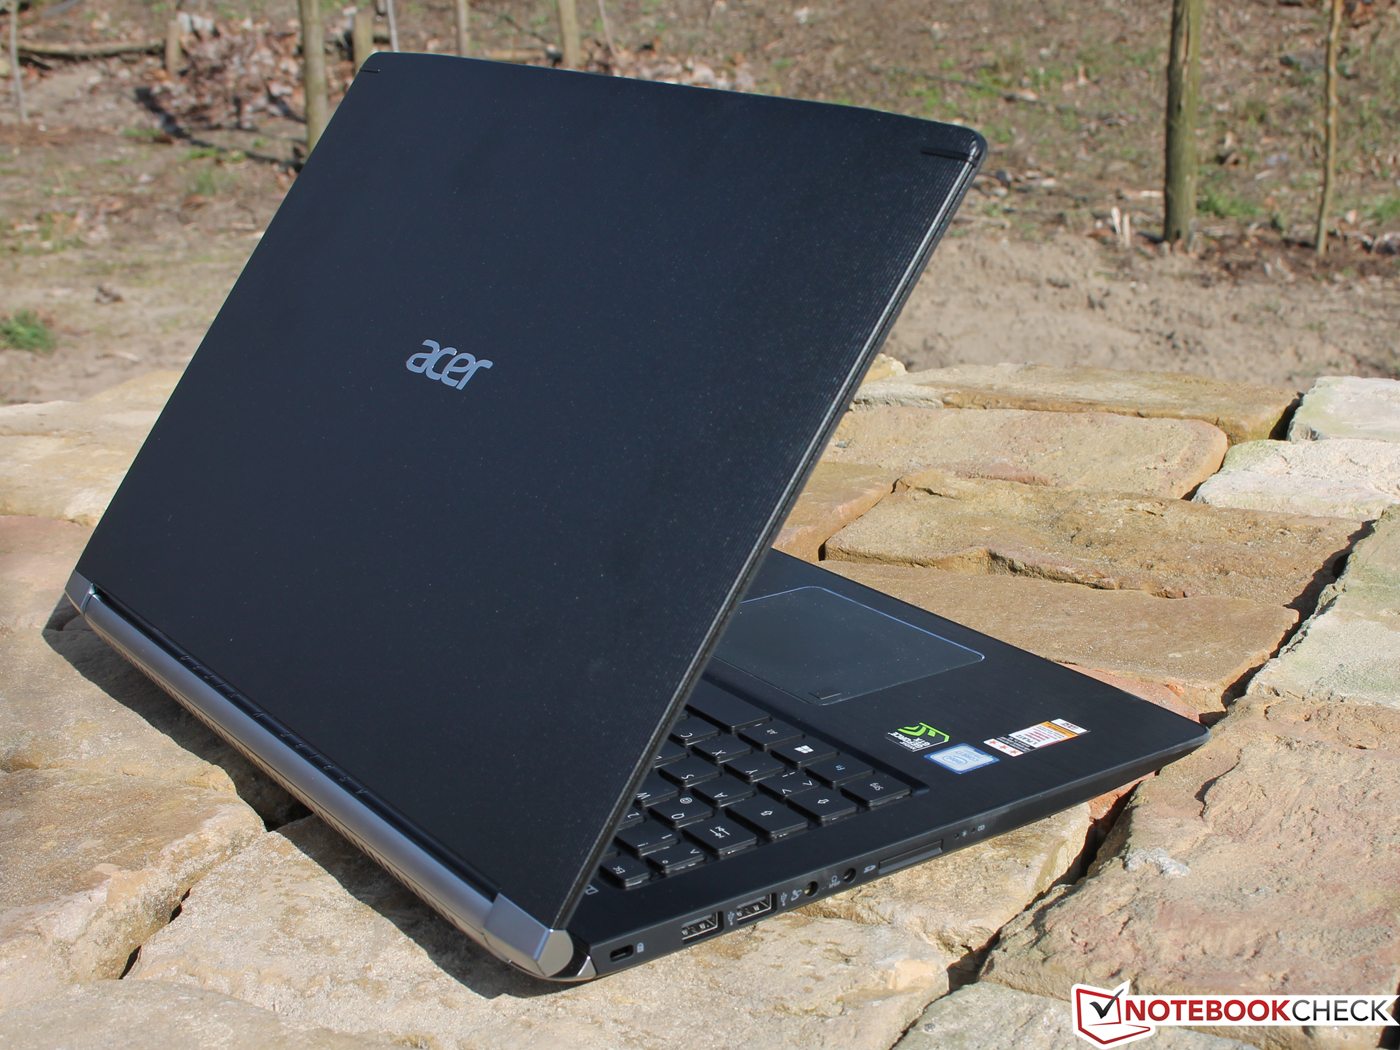
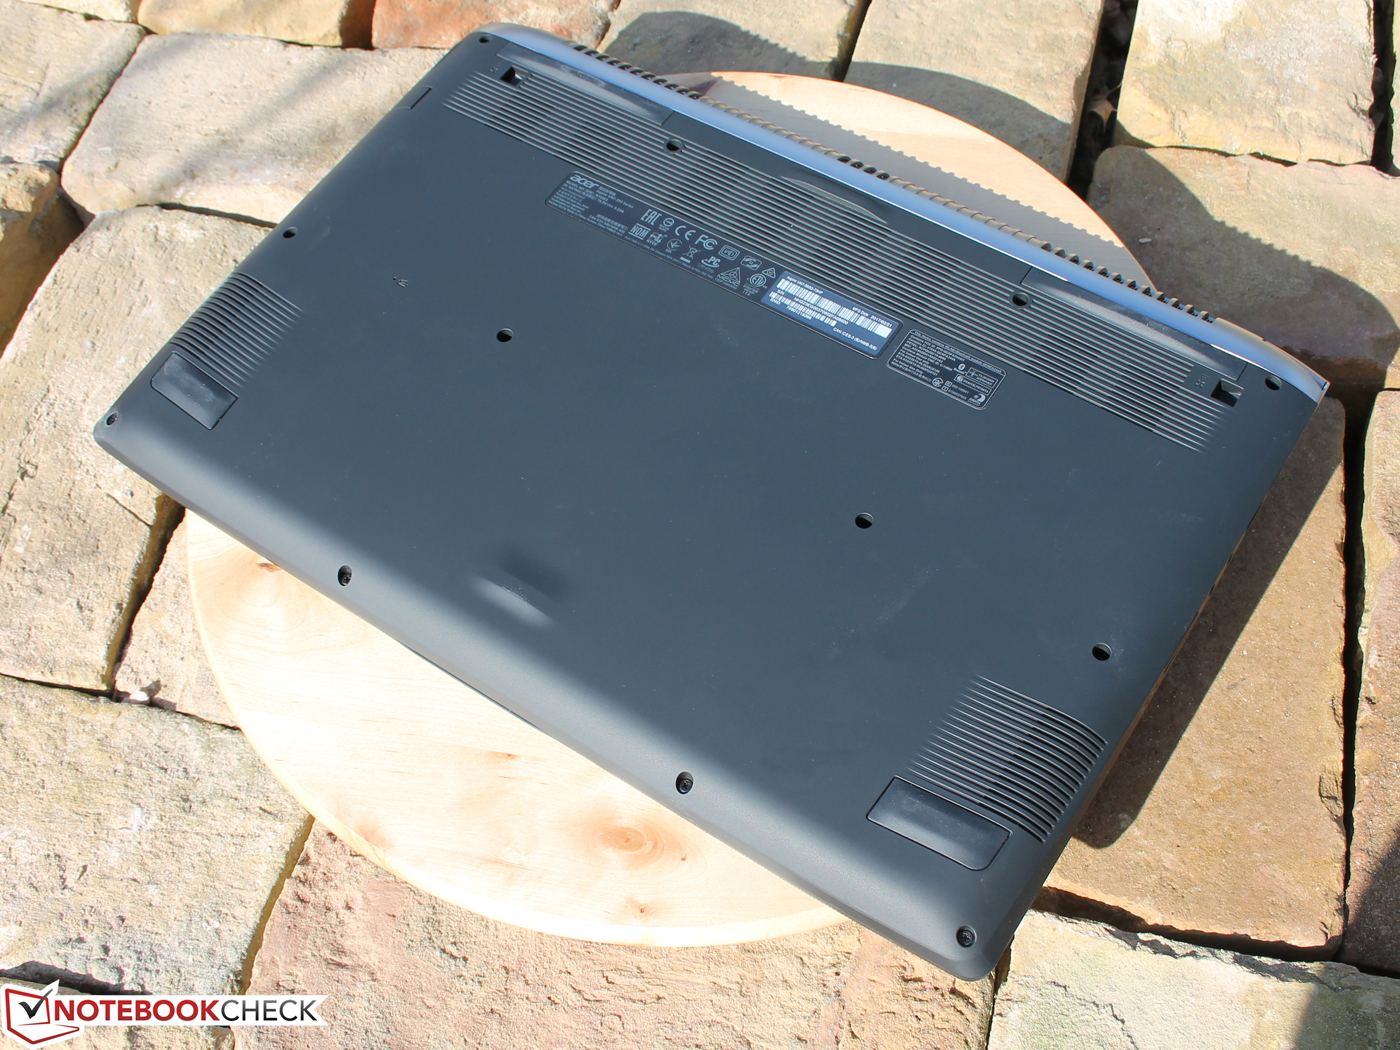
L'efficienza energetica e la lunga durata della batteria di sei ore possono competere con gli altrettanto forti rivali. Questo ora ci porta alle carenze: Troviamo il coperchio sottile e le cerniere traballanti come un po' instabili. Inoltre, la webcam è scarsa, e il disco rigido è lento e fa rumore. Quest'ultimo problema può essere eliminato optando per un modello V15 con un SSD.
Nonostante il casing sia in parte in alluminio in alcune parti resta instabile. In cambio, non è mai stato così facile sostituire i componenti.
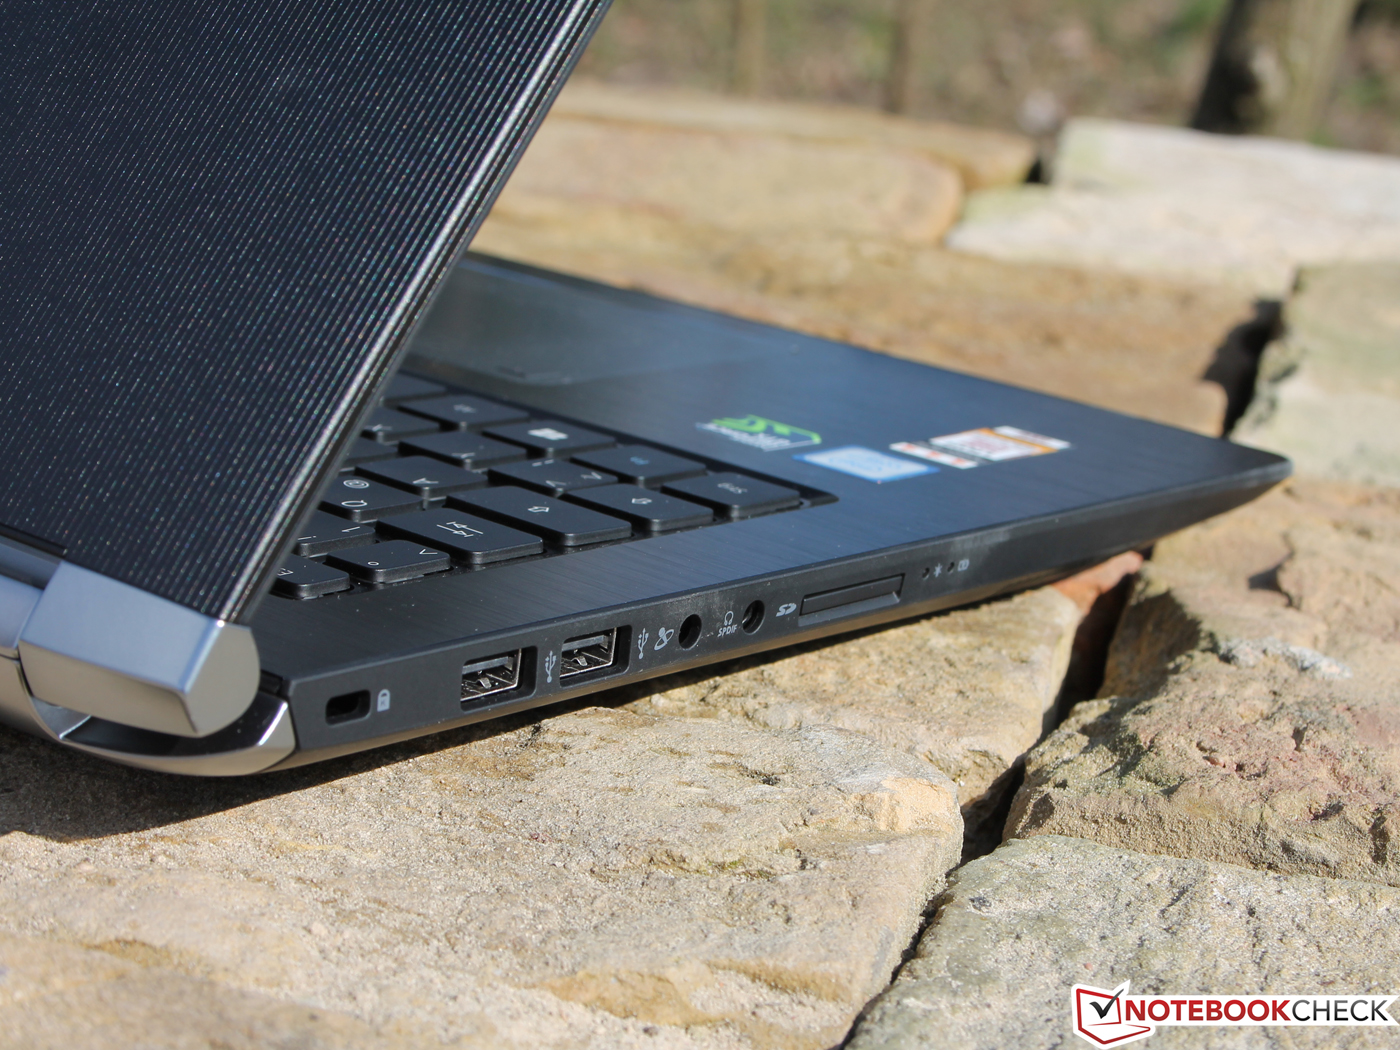
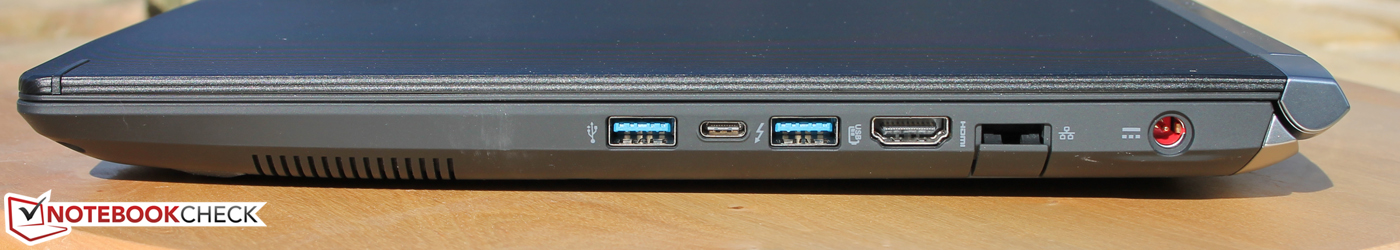
I giocatori devono assolutamente guardare anche l'Asus Strix GL502VM come alternativa. Anche se è ancora dotato di un Broadwell quad-core, costa tanto quanto il nostro Aspire VN7-593G-73hp, ma viene fornito con un SSD (1400 euro). Non è migliore in ogni aspetto: lo Strix GL502VM non dispone di Thunderbolt 3 e ha solo una C-USB 3.0 standard.
Nota: si tratta di una recensione breve, con alcune sezioni non tradotte, per la versione integrale in inglese guardate qui.
Acer Aspire VN7-593G-73HP V15 Nitro BE
- 03/18/2017 v6 (old)
Sebastian Jentsch