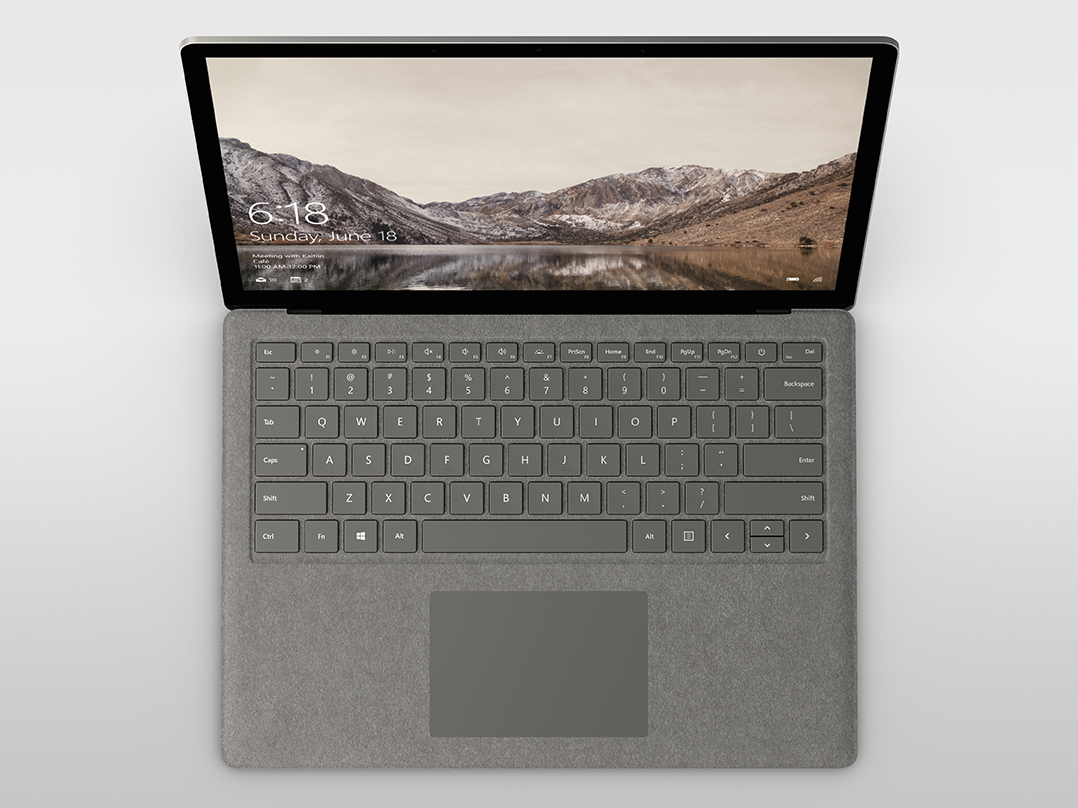
Recensione Breve del Portatile Microsoft Surface (i5-7200U)
| Networking | |
| iperf3 transmit AX12 | |
| Microsoft Surface Book with Performance Base | |
| Dell XPS 13 9360 FHD i5 | |
| Microsoft Surface Laptop i5 | |
| iperf3 receive AX12 | |
| Microsoft Surface Laptop i5 | |
| Dell XPS 13 9360 FHD i5 | |
| Microsoft Surface Book with Performance Base | |
| |||||||||||||||||||||||||
Distribuzione della luminosità: 90 %
Al centro con la batteria: 384.1 cd/m²
Contrasto: 1067:1 (Nero: 0.36 cd/m²)
ΔE ColorChecker Calman: 1.8 | ∀{0.5-29.43 Ø4.71}
ΔE Greyscale Calman: 1.2 | ∀{0.09-98 Ø4.96}
94.2% sRGB (Argyll 1.6.3 3D)
63.7% AdobeRGB 1998 (Argyll 1.6.3 3D)
69.5% AdobeRGB 1998 (Argyll 3D)
94.3% sRGB (Argyll 3D)
67.8% Display P3 (Argyll 3D)
Gamma: 2.21
CCT: 6708 K
| Microsoft Surface Laptop i5 ID: MEI96A2, Name: Panasonic VVX14T092N00, IPS, 13.5", 2256x1504 | Microsoft Surface Book with Performance Base Panasonic MEI96A2, IPS, 13.5", 3000x2000 | Microsoft Surface Pro 4, Core i5, 128GB Samsung 123YL01-001 ID: SDC3853, IPS, 12.3", 2736x1824 | Apple MacBook Pro 13 2016 (2.9 GHz) APPA033, , 13.3", 2560x1600 | Dell XPS 13 9360 FHD i5 Sharp SHP1449 LQ133M1, IPS, 13.3", 1920x1080 | |
|---|---|---|---|---|---|
| Display | -1% | -2% | 26% | -26% | |
| Display P3 Coverage (%) | 67.8 | 66.4 -2% | 65 -4% | 99.2 46% | 48.94 -28% |
| sRGB Coverage (%) | 94.3 | 95.4 1% | 96.5 2% | 99.9 6% | 73.3 -22% |
| AdobeRGB 1998 Coverage (%) | 69.5 | 67.6 -3% | 67 -4% | 87.6 26% | 50.5 -27% |
| Response Times | -10% | 13% | -18% | 23% | |
| Response Time Grey 50% / Grey 80% * (ms) | 50.8 ? | 61 ? -20% | 46 ? 9% | 47.2 ? 7% | 32.8 ? 35% |
| Response Time Black / White * (ms) | 37.2 ? | 37 ? 1% | 31.2 ? 16% | 53 ? -42% | 33.2 ? 11% |
| PWM Frequency (Hz) | 50 ? | ||||
| Screen | -8% | -32% | 6% | -84% | |
| Brightness middle (cd/m²) | 384.2 | 459 19% | 413 7% | 569 48% | 351.2 -9% |
| Brightness (cd/m²) | 378 | 423 12% | 396 5% | 542 43% | 325 -14% |
| Brightness Distribution (%) | 90 | 86 -4% | 87 -3% | 90 0% | 89 -1% |
| Black Level * (cd/m²) | 0.36 | 0.37 -3% | 0.36 -0% | 0.56 -56% | 0.195 46% |
| Contrast (:1) | 1067 | 1241 16% | 1147 7% | 1016 -5% | 1801 69% |
| Colorchecker dE 2000 * | 1.8 | 2.28 -27% | 3.09 -72% | 1.4 22% | 7.4 -311% |
| Colorchecker dE 2000 max. * | 4.2 | 3.61 14% | 2.9 31% | 9.08 -116% | |
| Greyscale dE 2000 * | 1.2 | 2.48 -107% | 3.92 -227% | 1.8 -50% | 6.71 -459% |
| Gamma | 2.21 100% | 2.5 88% | 2.3 96% | 2.16 102% | 2.74 80% |
| CCT | 6708 97% | 8602 76% | 7333 89% | 6877 95% | 7222 90% |
| Color Space (Percent of AdobeRGB 1998) (%) | 63.7 | 62 -3% | 61 -4% | 78.4 23% | 50.48 -21% |
| Color Space (Percent of sRGB) (%) | 94.2 | 96 2% | 97 3% | 99.3 5% | 73.31 -22% |
| Media totale (Programma / Settaggio) | -6% /
-7% | -7% /
-19% | 5% /
7% | -29% /
-58% |
* ... Meglio usare valori piccoli
Tempi di risposta del Display
| ↔ Tempi di risposta dal Nero al Bianco | ||
|---|---|---|
| 37.2 ms ... aumenta ↗ e diminuisce ↘ combinato | ↗ 20 ms Incremento | 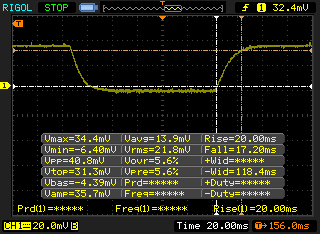 |
| ↘ 17.2 ms Calo | ||
| Lo schermo mostra tempi di risposta lenti nei nostri tests e sarà insoddisfacente per i gamers. In confronto, tutti i dispositivi di test variano da 0.1 (minimo) a 240 (massimo) ms. » 95 % di tutti i dispositivi è migliore. Questo significa che i tempi di risposta rilevati sono peggiori rispetto alla media di tutti i dispositivi testati (19.8 ms). | ||
| ↔ Tempo di risposta dal 50% Grigio all'80% Grigio | ||
| 50.8 ms ... aumenta ↗ e diminuisce ↘ combinato | ↗ 25.6 ms Incremento | 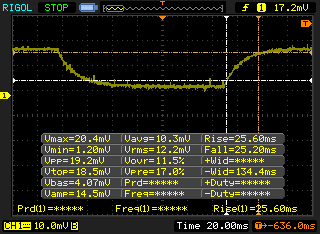 |
| ↘ 25.2 ms Calo | ||
| Lo schermo mostra tempi di risposta lenti nei nostri tests e sarà insoddisfacente per i gamers. In confronto, tutti i dispositivi di test variano da 0.165 (minimo) a 636 (massimo) ms. » 87 % di tutti i dispositivi è migliore. Questo significa che i tempi di risposta rilevati sono peggiori rispetto alla media di tutti i dispositivi testati (31 ms). | ||
Sfarfallio dello schermo / PWM (Pulse-Width Modulation)
| flickering dello schermo / PWM non rilevato | 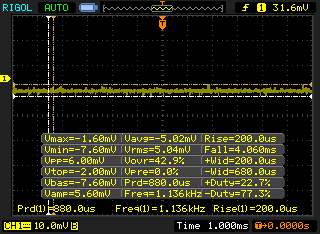 | ||
In confronto: 52 % di tutti i dispositivi testati non utilizza PWM per ridurre la luminosita' del display. Se è rilevato PWM, una media di 7754 (minimo: 5 - massimo: 343500) Hz è stata rilevata. | |||
| wPrime 2.10 - 1024m | |
| Microsoft Surface Pro 4, Core m3 | |
| Lenovo Thinkpad 13-20J1001BUS | |
| Apple MacBook Pro 13 2016 | |
| Dell Latitude 5280 | |
| Microsoft Surface Laptop i5 | |
| Samsung Notebook 9 NP900X5N-X01US | |
* ... Meglio usare valori piccoli
| PCMark 8 | |
| Home Score Accelerated v2 | |
| Apple MacBook Pro 13 2016 | |
| Microsoft Surface Laptop i5 | |
| Microsoft Surface Book with Performance Base | |
| Work Score Accelerated v2 | |
| Microsoft Surface Laptop i5 | |
| Microsoft Surface Book with Performance Base | |
| Apple MacBook Pro 13 2016 | |
| Creative Score Accelerated v2 | |
| Apple MacBook Pro 13 2016 | |
| Microsoft Surface Book with Performance Base | |
| Microsoft Surface Laptop i5 | |
| PCMark 8 Home Score Accelerated v2 | 3071 punti | |
| PCMark 8 Creative Score Accelerated v2 | 3962 punti | |
| PCMark 8 Work Score Accelerated v2 | 4106 punti | |
Aiuto | ||
| Microsoft Surface Laptop i5 Toshiba THNSN0128GTYA | Microsoft Surface Book with Performance Base Toshiba NVMe THNSN5256GPU7 | Microsoft Surface Pro 4, Core i5, 128GB Samsung MZFLV128 NVMe | Apple MacBook Pro 13 2016 (2.9 GHz) Apple SSD AP0256 | Dell XPS 13 9360 FHD i5 Toshiba NVMe THNSN5256GPUK | |
|---|---|---|---|---|---|
| CrystalDiskMark 3.0 | 328% | 115% | 527% | 294% | |
| Read Seq (MB/s) | 425.6 | 1017 139% | 666 56% | 1662 291% | 1233 190% |
| Write Seq (MB/s) | 128.2 | 861 572% | 154.2 20% | 1336 942% | 733 472% |
| Read 512 (MB/s) | 278.5 | 687 147% | 266.3 -4% | 1183 325% | 1036 272% |
| Write 512 (MB/s) | 126.7 | 698 451% | 154.2 22% | 1481 1069% | 439.9 247% |
| Read 4k (MB/s) | 22.15 | 40.91 85% | 28.51 29% | 16.1 -27% | 29.31 32% |
| Write 4k (MB/s) | 40.45 | 108.6 168% | 101.5 151% | 23.5 -42% | 116.9 189% |
| Read 4k QD32 (MB/s) | 77.8 | 326.9 320% | 368.3 373% | 657 744% | 479.2 516% |
| Write 4k QD32 (MB/s) | 41.18 | 347.1 743% | 153.6 273% | 419 917% | 218.3 430% |

| 3DMark 11 Performance | 1586 punti | |
| 3DMark Ice Storm Standard Score | 48984 punti | |
| 3DMark Cloud Gate Standard Score | 5454 punti | |
| 3DMark Fire Strike Score | 743 punti | |
Aiuto | ||
| basso | medio | alto | ultra | |
|---|---|---|---|---|
| BioShock Infinite (2013) | 45.8 | 27.4 | 22.7 | 7 |
| Rise of the Tomb Raider (2016) | 18.5 |
Rumorosità
| Idle |
| 28.2 / 28.2 / 29 dB(A) |
| Sotto carico |
| 30.3 / 39.3 dB(A) |
 | ||
30 dB silenzioso 40 dB(A) udibile 50 dB(A) rumoroso |
||
min: | ||
| Microsoft Surface Laptop i5 HD Graphics 620, i5-7200U, Toshiba THNSN0128GTYA | Microsoft Surface Book with Performance Base GeForce GTX 965M, 6600U, Toshiba NVMe THNSN5256GPU7 | Microsoft Surface Pro 4, Core i5, 128GB HD Graphics 520, 6300U, Samsung MZFLV128 NVMe | Apple MacBook Pro 13 2016 (2.9 GHz) Iris Graphics 550, 6267U, Apple SSD AP0256 | Dell XPS 13 9360 FHD i5 HD Graphics 620, i5-7200U, Toshiba NVMe THNSN5256GPUK | |
|---|---|---|---|---|---|
| Noise | -8% | -14% | -4% | 2% | |
| off /ambiente * (dB) | 28.2 | 29.4 -4% | 30.2 -7% | ||
| Idle Minimum * (dB) | 28.2 | 29.4 -4% | 31.5 -12% | 30.2 -7% | 28.9 -2% |
| Idle Average * (dB) | 28.2 | 29.4 -4% | 31.5 -12% | 30.2 -7% | 28.9 -2% |
| Idle Maximum * (dB) | 29 | 29.7 -2% | 31.5 -9% | 30.2 -4% | 28.9 -0% |
| Load Average * (dB) | 30.3 | 39 -29% | 40.5 -34% | 33 -9% | 30.9 -2% |
| Load Maximum * (dB) | 39.3 | 40.2 -2% | 40.7 -4% | 36.2 8% | 33.5 15% |
| Witcher 3 ultra * (dB) | 39.5 |
* ... Meglio usare valori piccoli
(+) La temperatura massima sul lato superiore è di 36.4 °C / 98 F, rispetto alla media di 35.9 °C / 97 F, che varia da 21.4 a 59 °C per questa classe Subnotebook.
(-) Il lato inferiore si riscalda fino ad un massimo di 45.2 °C / 113 F, rispetto alla media di 39.2 °C / 103 F
(+) In idle, la temperatura media del lato superiore è di 26.7 °C / 80 F, rispetto alla media deld ispositivo di 30.8 °C / 87 F.
(+) I poggiapolsi e il touchpad sono piu' freddi della temperatura della pelle con un massimo di 26.4 °C / 79.5 F e sono quindi freddi al tatto.
(±) La temperatura media della zona del palmo della mano di dispositivi simili e'stata di 28.2 °C / 82.8 F (+1.8 °C / 3.3 F).
Microsoft Surface Laptop i5 analisi audio
(-) | altoparlanti non molto potenti (64.6 dB)
Bassi 100 - 315 Hz
(±) | bassi ridotti - in media 7.1% inferiori alla media
(±) | la linearità dei bassi è media (11.8% delta rispetto alla precedente frequenza)
Medi 400 - 2000 Hz
(+) | medi bilanciati - solo only 4.1% rispetto alla media
(+) | medi lineari (5.6% delta rispetto alla precedente frequenza)
Alti 2 - 16 kHz
(+) | Alti bilanciati - appena 1.2% dalla media
(+) | alti lineari (4.7% delta rispetto alla precedente frequenza)
Nel complesso 100 - 16.000 Hz
(±) | la linearità complessiva del suono è media (15.6% di differenza rispetto alla media
Rispetto alla stessa classe
» 36% di tutti i dispositivi testati in questa classe è stato migliore, 5% simile, 58% peggiore
» Il migliore ha avuto un delta di 5%, medio di 18%, peggiore di 53%
Rispetto a tutti i dispositivi testati
» 23% di tutti i dispositivi testati in questa classe è stato migliore, 5% similare, 72% peggiore
» Il migliore ha avuto un delta di 4%, medio di 23%, peggiore di 134%
Apple MacBook 12 (Early 2016) 1.1 GHz analisi audio
(+) | gli altoparlanti sono relativamente potenti (83.6 dB)
Bassi 100 - 315 Hz
(±) | bassi ridotti - in media 11.3% inferiori alla media
(±) | la linearità dei bassi è media (14.2% delta rispetto alla precedente frequenza)
Medi 400 - 2000 Hz
(+) | medi bilanciati - solo only 2.4% rispetto alla media
(+) | medi lineari (5.5% delta rispetto alla precedente frequenza)
Alti 2 - 16 kHz
(+) | Alti bilanciati - appena 2% dalla media
(+) | alti lineari (4.5% delta rispetto alla precedente frequenza)
Nel complesso 100 - 16.000 Hz
(+) | suono nel complesso lineare (10.2% differenza dalla media)
Rispetto alla stessa classe
» 7% di tutti i dispositivi testati in questa classe è stato migliore, 2% simile, 90% peggiore
» Il migliore ha avuto un delta di 5%, medio di 18%, peggiore di 53%
Rispetto a tutti i dispositivi testati
» 5% di tutti i dispositivi testati in questa classe è stato migliore, 1% similare, 94% peggiore
» Il migliore ha avuto un delta di 4%, medio di 23%, peggiore di 134%
| Off / Standby | |
| Idle | |
| Sotto carico |
|
Leggenda:
min: | |
| Microsoft Surface Laptop i5 i5-7200U, HD Graphics 620, Toshiba THNSN0128GTYA, IPS, 2256x1504, 13.5" | Microsoft Surface Book with Performance Base 6600U, GeForce GTX 965M, Toshiba NVMe THNSN5256GPU7, IPS, 3000x2000, 13.5" | Microsoft Surface Pro 4, Core i5, 128GB 6300U, HD Graphics 520, Samsung MZFLV128 NVMe, IPS, 2736x1824, 12.3" | Apple MacBook Pro 13 2016 (2.9 GHz) 6267U, Iris Graphics 550, Apple SSD AP0256, , 2560x1600, 13.3" | Dell XPS 13 9360 FHD i5 i5-7200U, HD Graphics 620, Toshiba NVMe THNSN5256GPUK, IPS, 1920x1080, 13.3" | |
|---|---|---|---|---|---|
| Power Consumption | -75% | -12% | -34% | 14% | |
| Idle Minimum * (Watt) | 3.2 | 4.15 -30% | 4.4 -38% | 2.1 34% | 4.1 -28% |
| Idle Average * (Watt) | 6.5 | 8 -23% | 9 -38% | 7.6 -17% | 4.2 35% |
| Idle Maximum * (Watt) | 6.8 | 11.9 -75% | 10.7 -57% | 8.2 -21% | 5.1 25% |
| Load Average * (Watt) | 28.2 | 67 -138% | 19.6 30% | 56.4 -100% | 22.1 22% |
| Load Maximum * (Watt) | 36 | 76 -111% | 19.9 45% | 59.8 -66% | 29.4 18% |
| Witcher 3 ultra * (Watt) | 58 |
* ... Meglio usare valori piccoli
| Microsoft Surface Laptop i5 i5-7200U, HD Graphics 620, 45 Wh | Microsoft Surface Book with Performance Base 6600U, GeForce GTX 965M, 78 Wh | Microsoft Surface Pro 4, Core i5, 128GB 6300U, HD Graphics 520, 38 Wh | Apple MacBook Pro 13 2016 (2.9 GHz) 6267U, Iris Graphics 550, 49.2 Wh | Dell XPS 13 9360 FHD i5 i5-7200U, HD Graphics 620, 60 Wh | Asus Zenbook UX3410UQ-GV077T i7-7500U, GeForce 940MX, 48 Wh | |
|---|---|---|---|---|---|---|
| Autonomia della batteria | -7% | -24% | -27% | 11% | -15% | |
| Reader / Idle (h) | 22.5 | 25.5 13% | 15 -33% | 21.6 -4% | ||
| WiFi v1.3 (h) | 10 | 9.6 -4% | 7.1 -29% | 9.4 -6% | 11.3 13% | 8.5 -15% |
| Load (h) | 2.1 | 1.5 -29% | 1.9 -10% | 1.1 -48% | 2.6 24% |
Pro
Contro
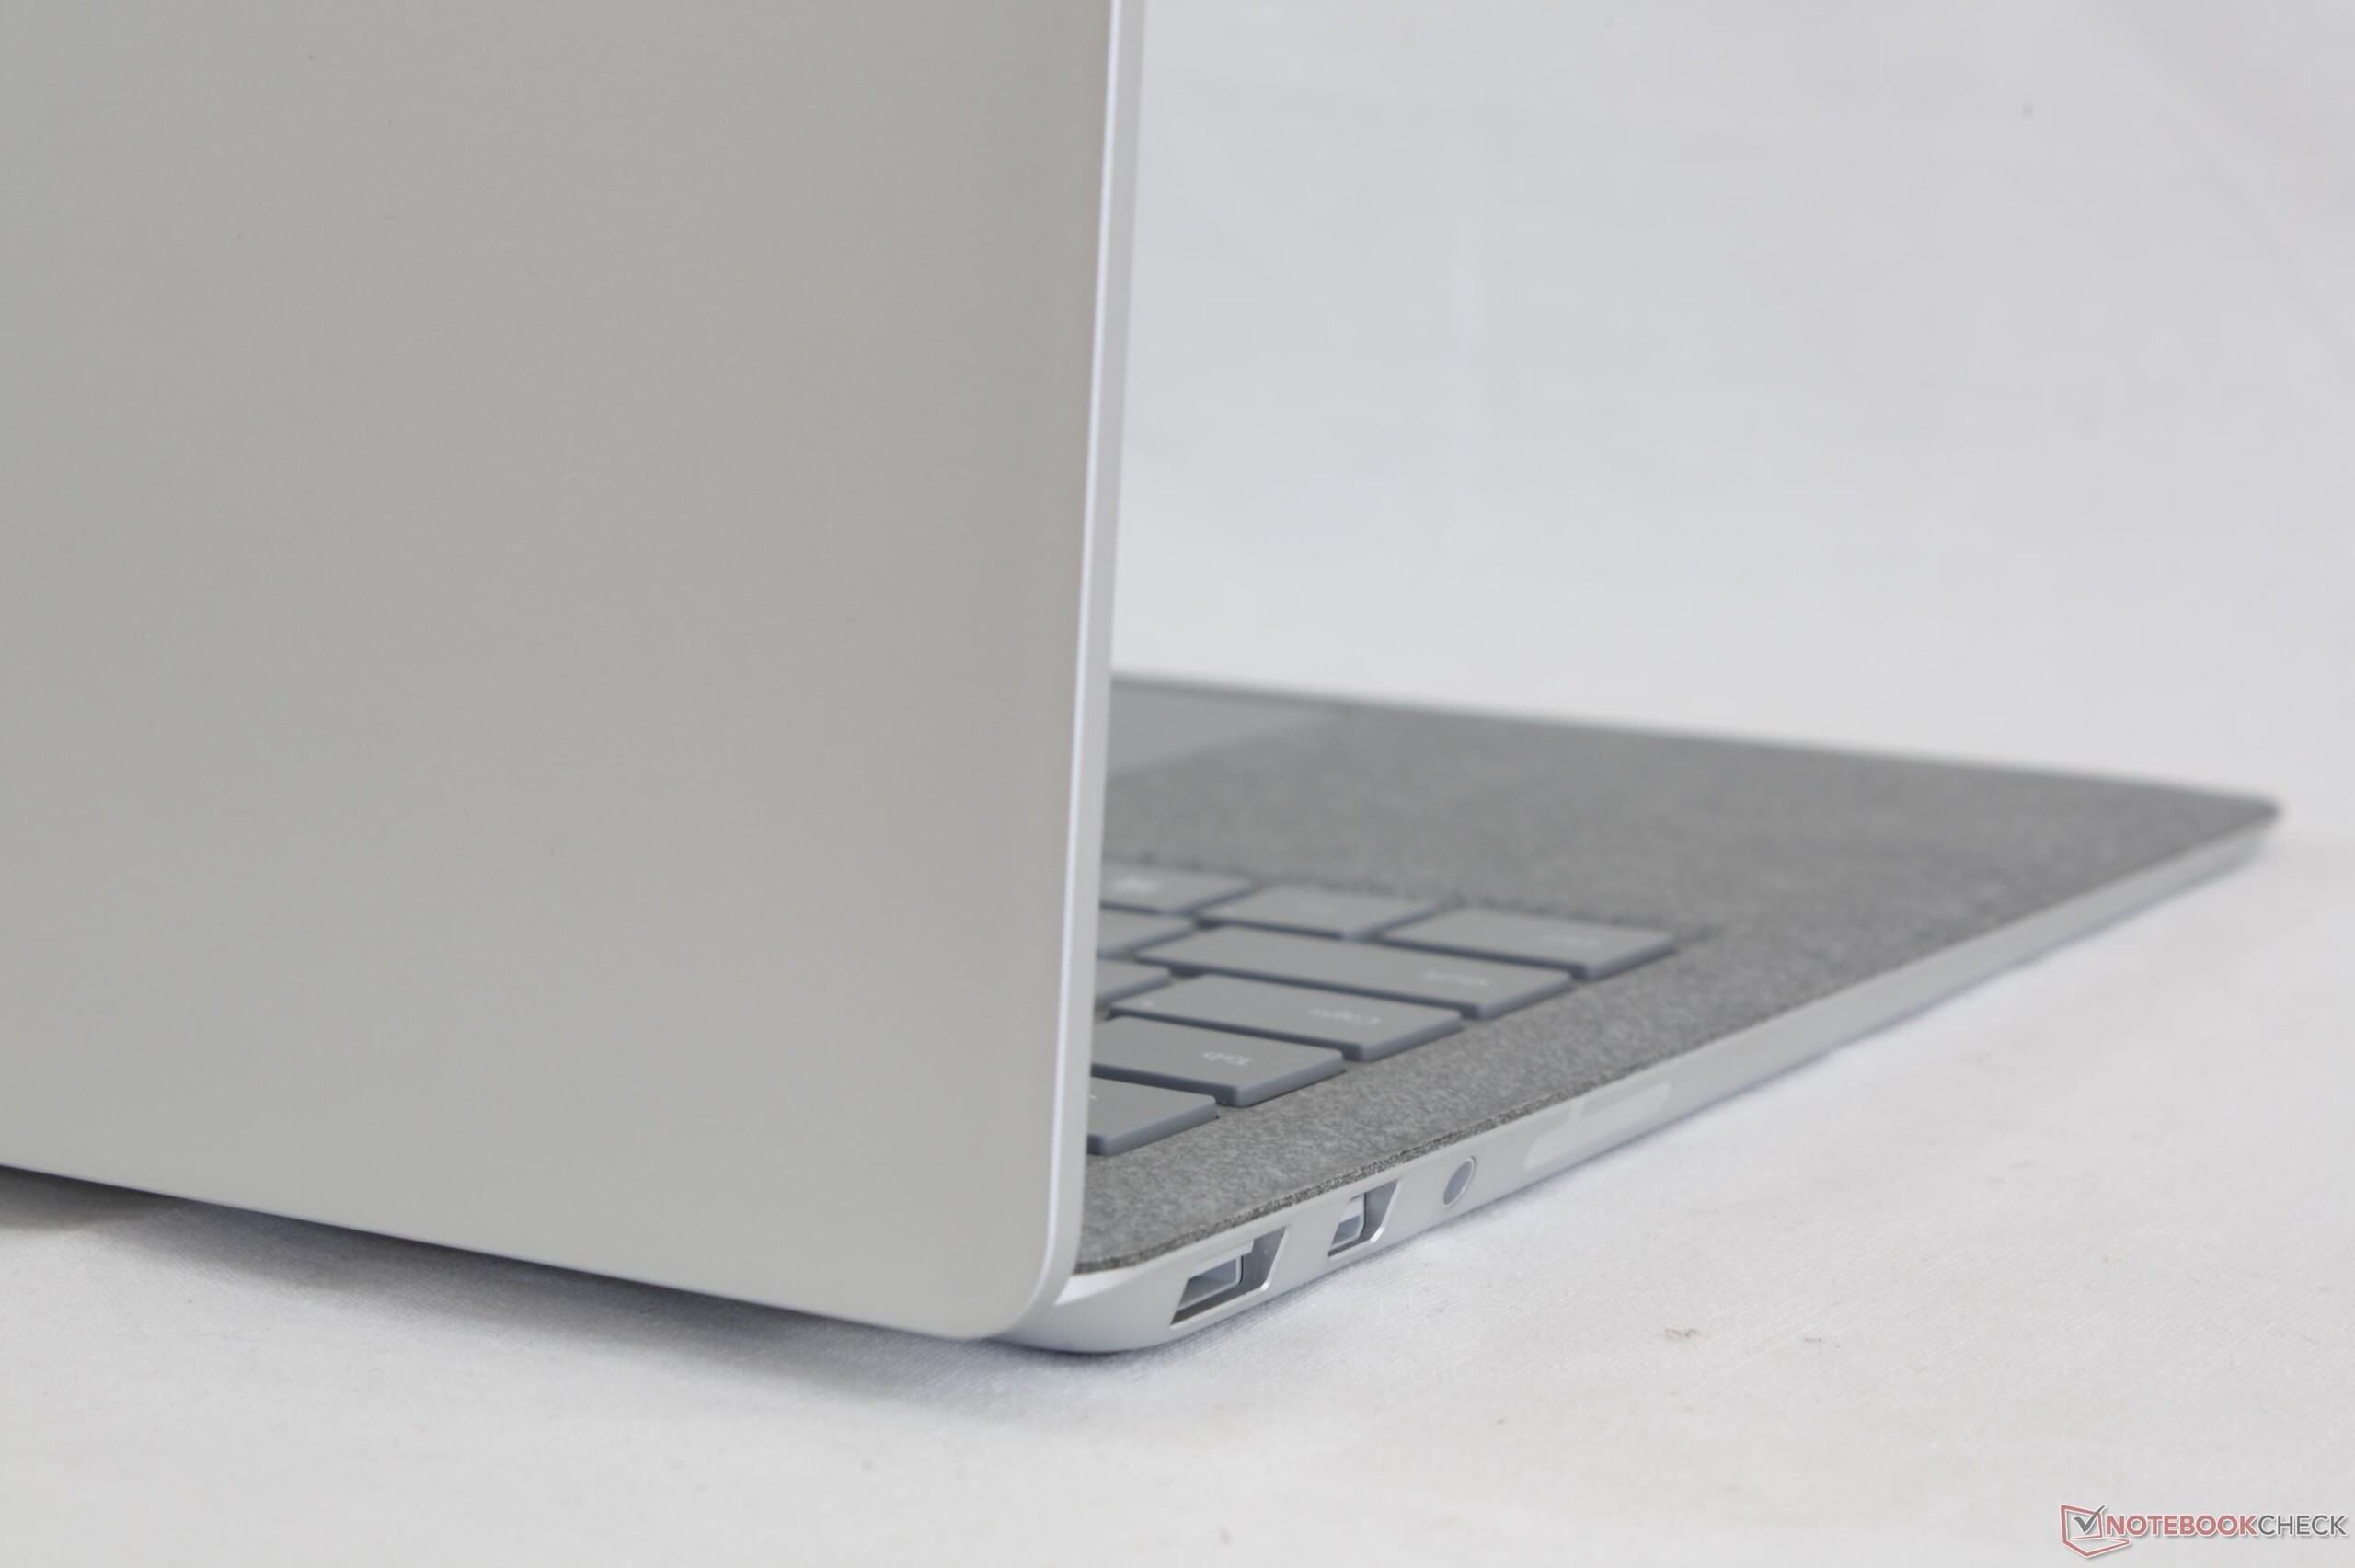
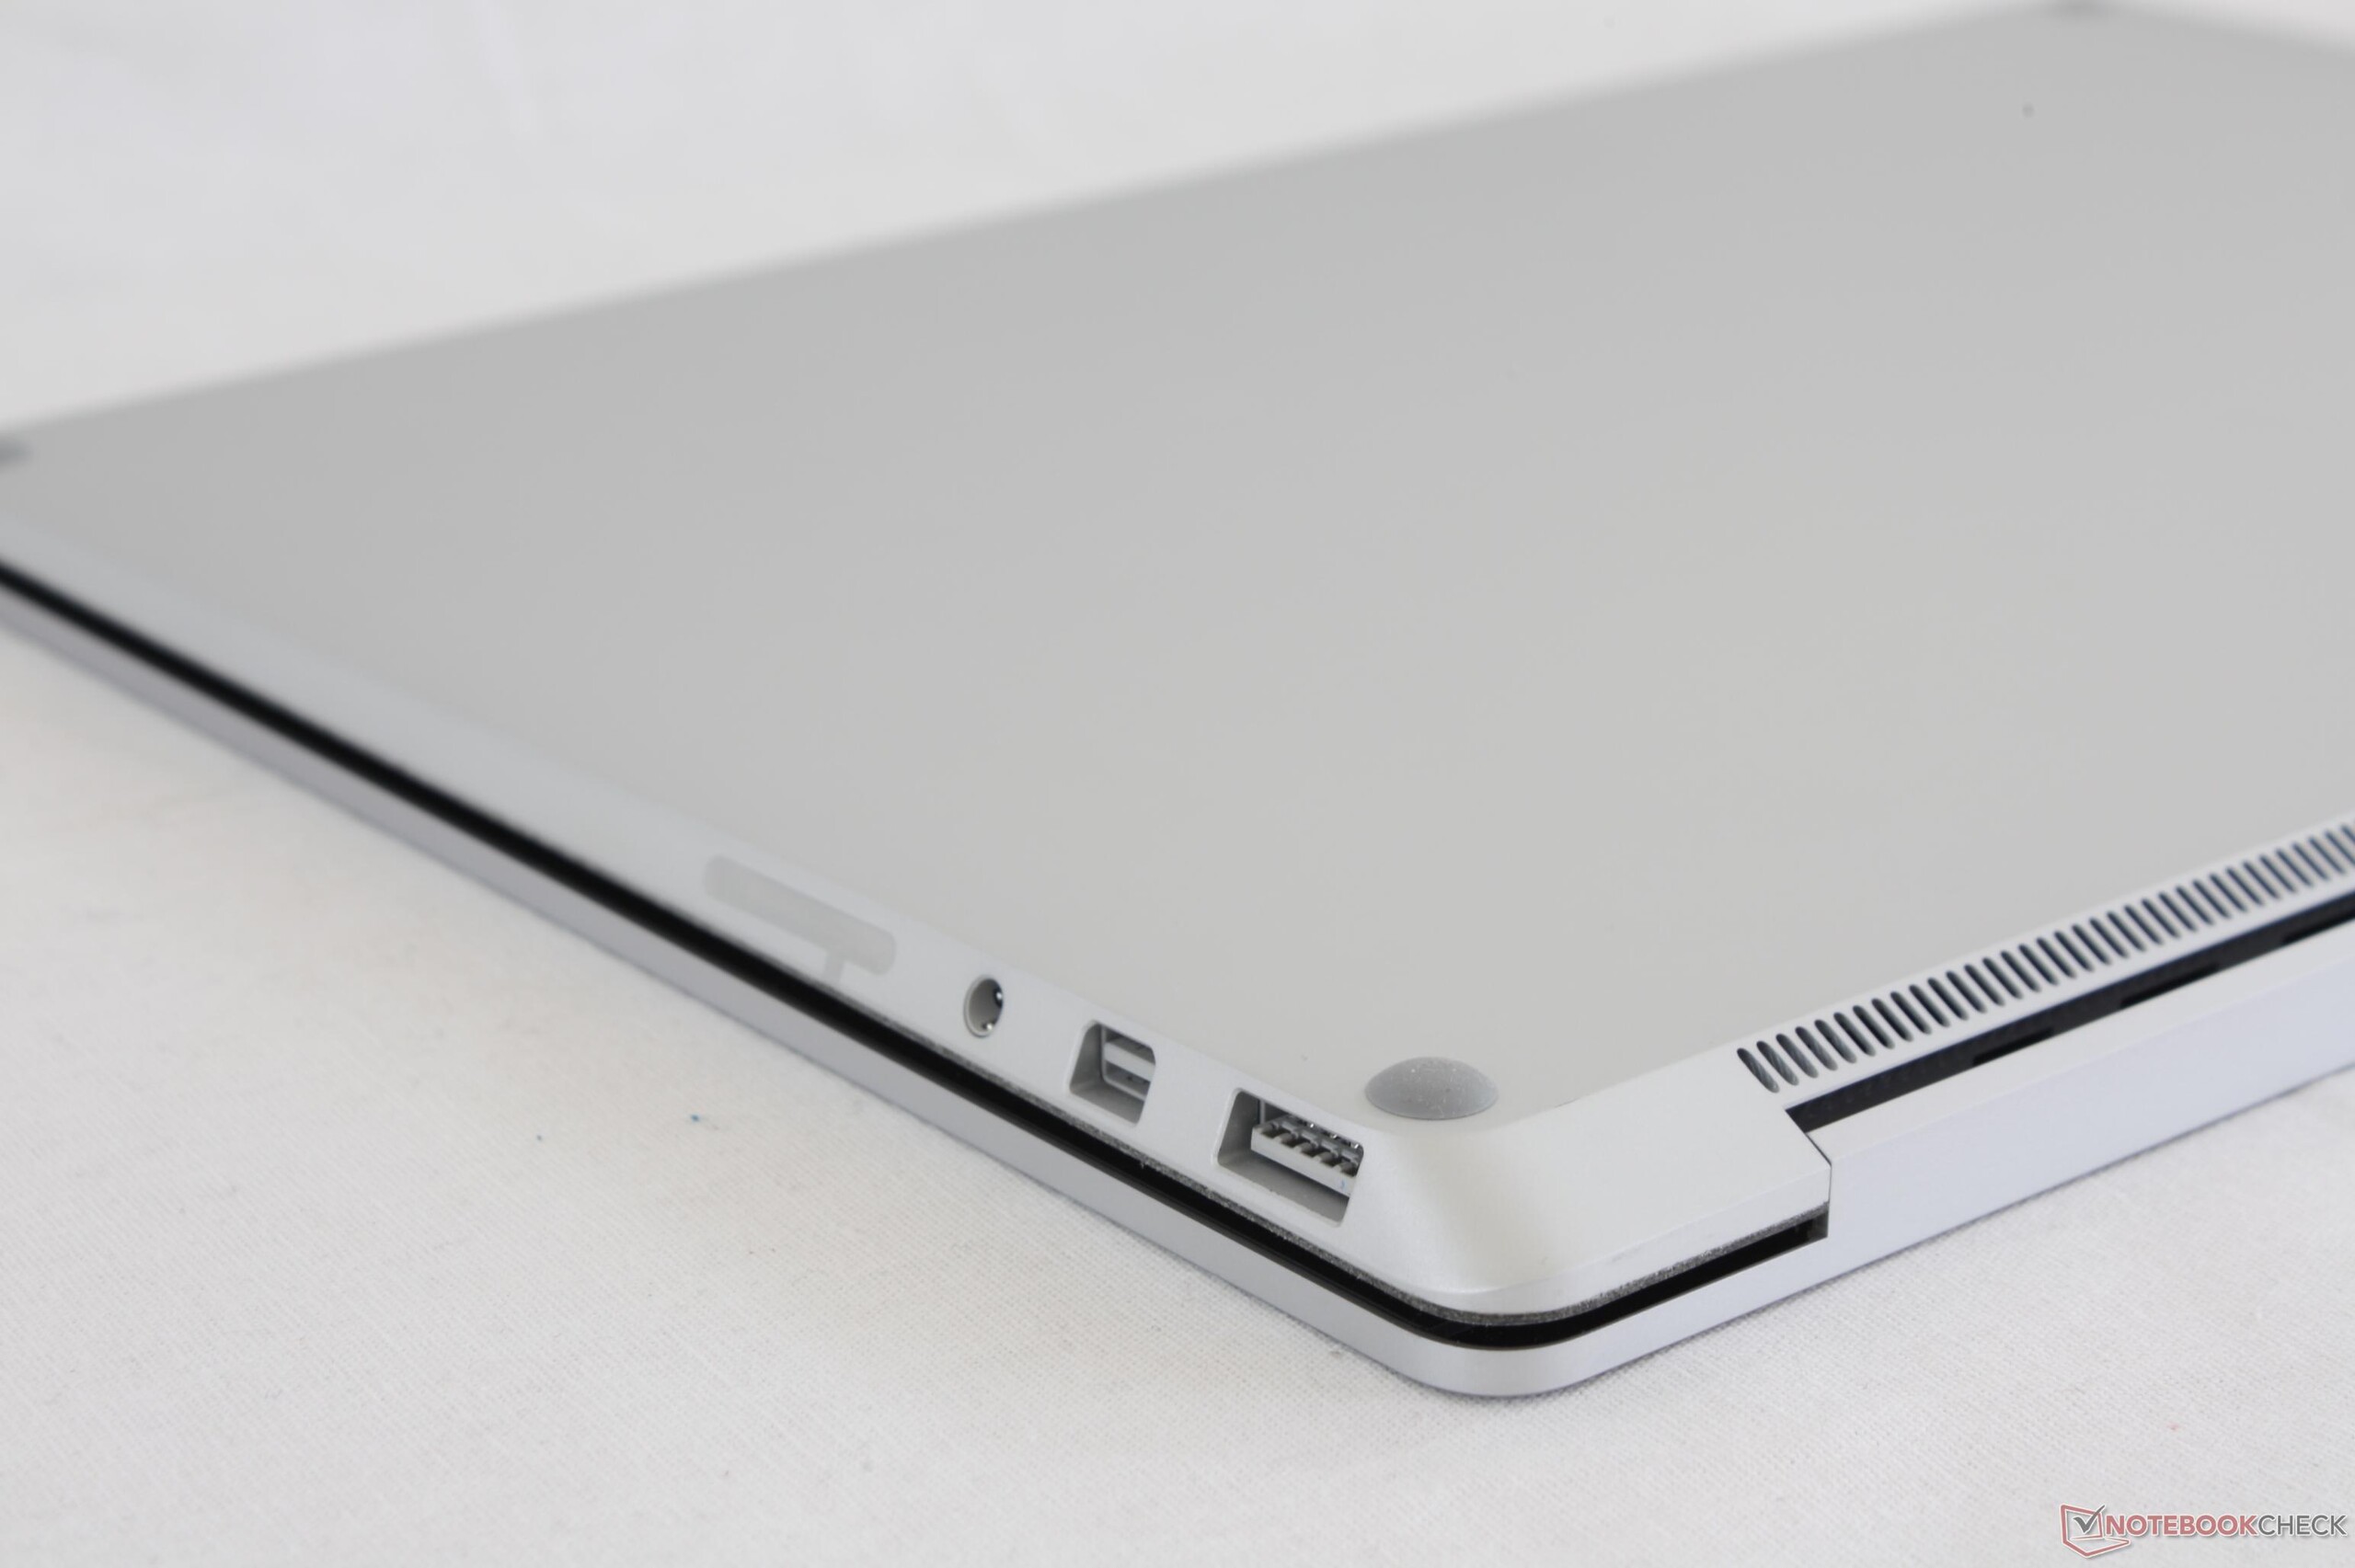
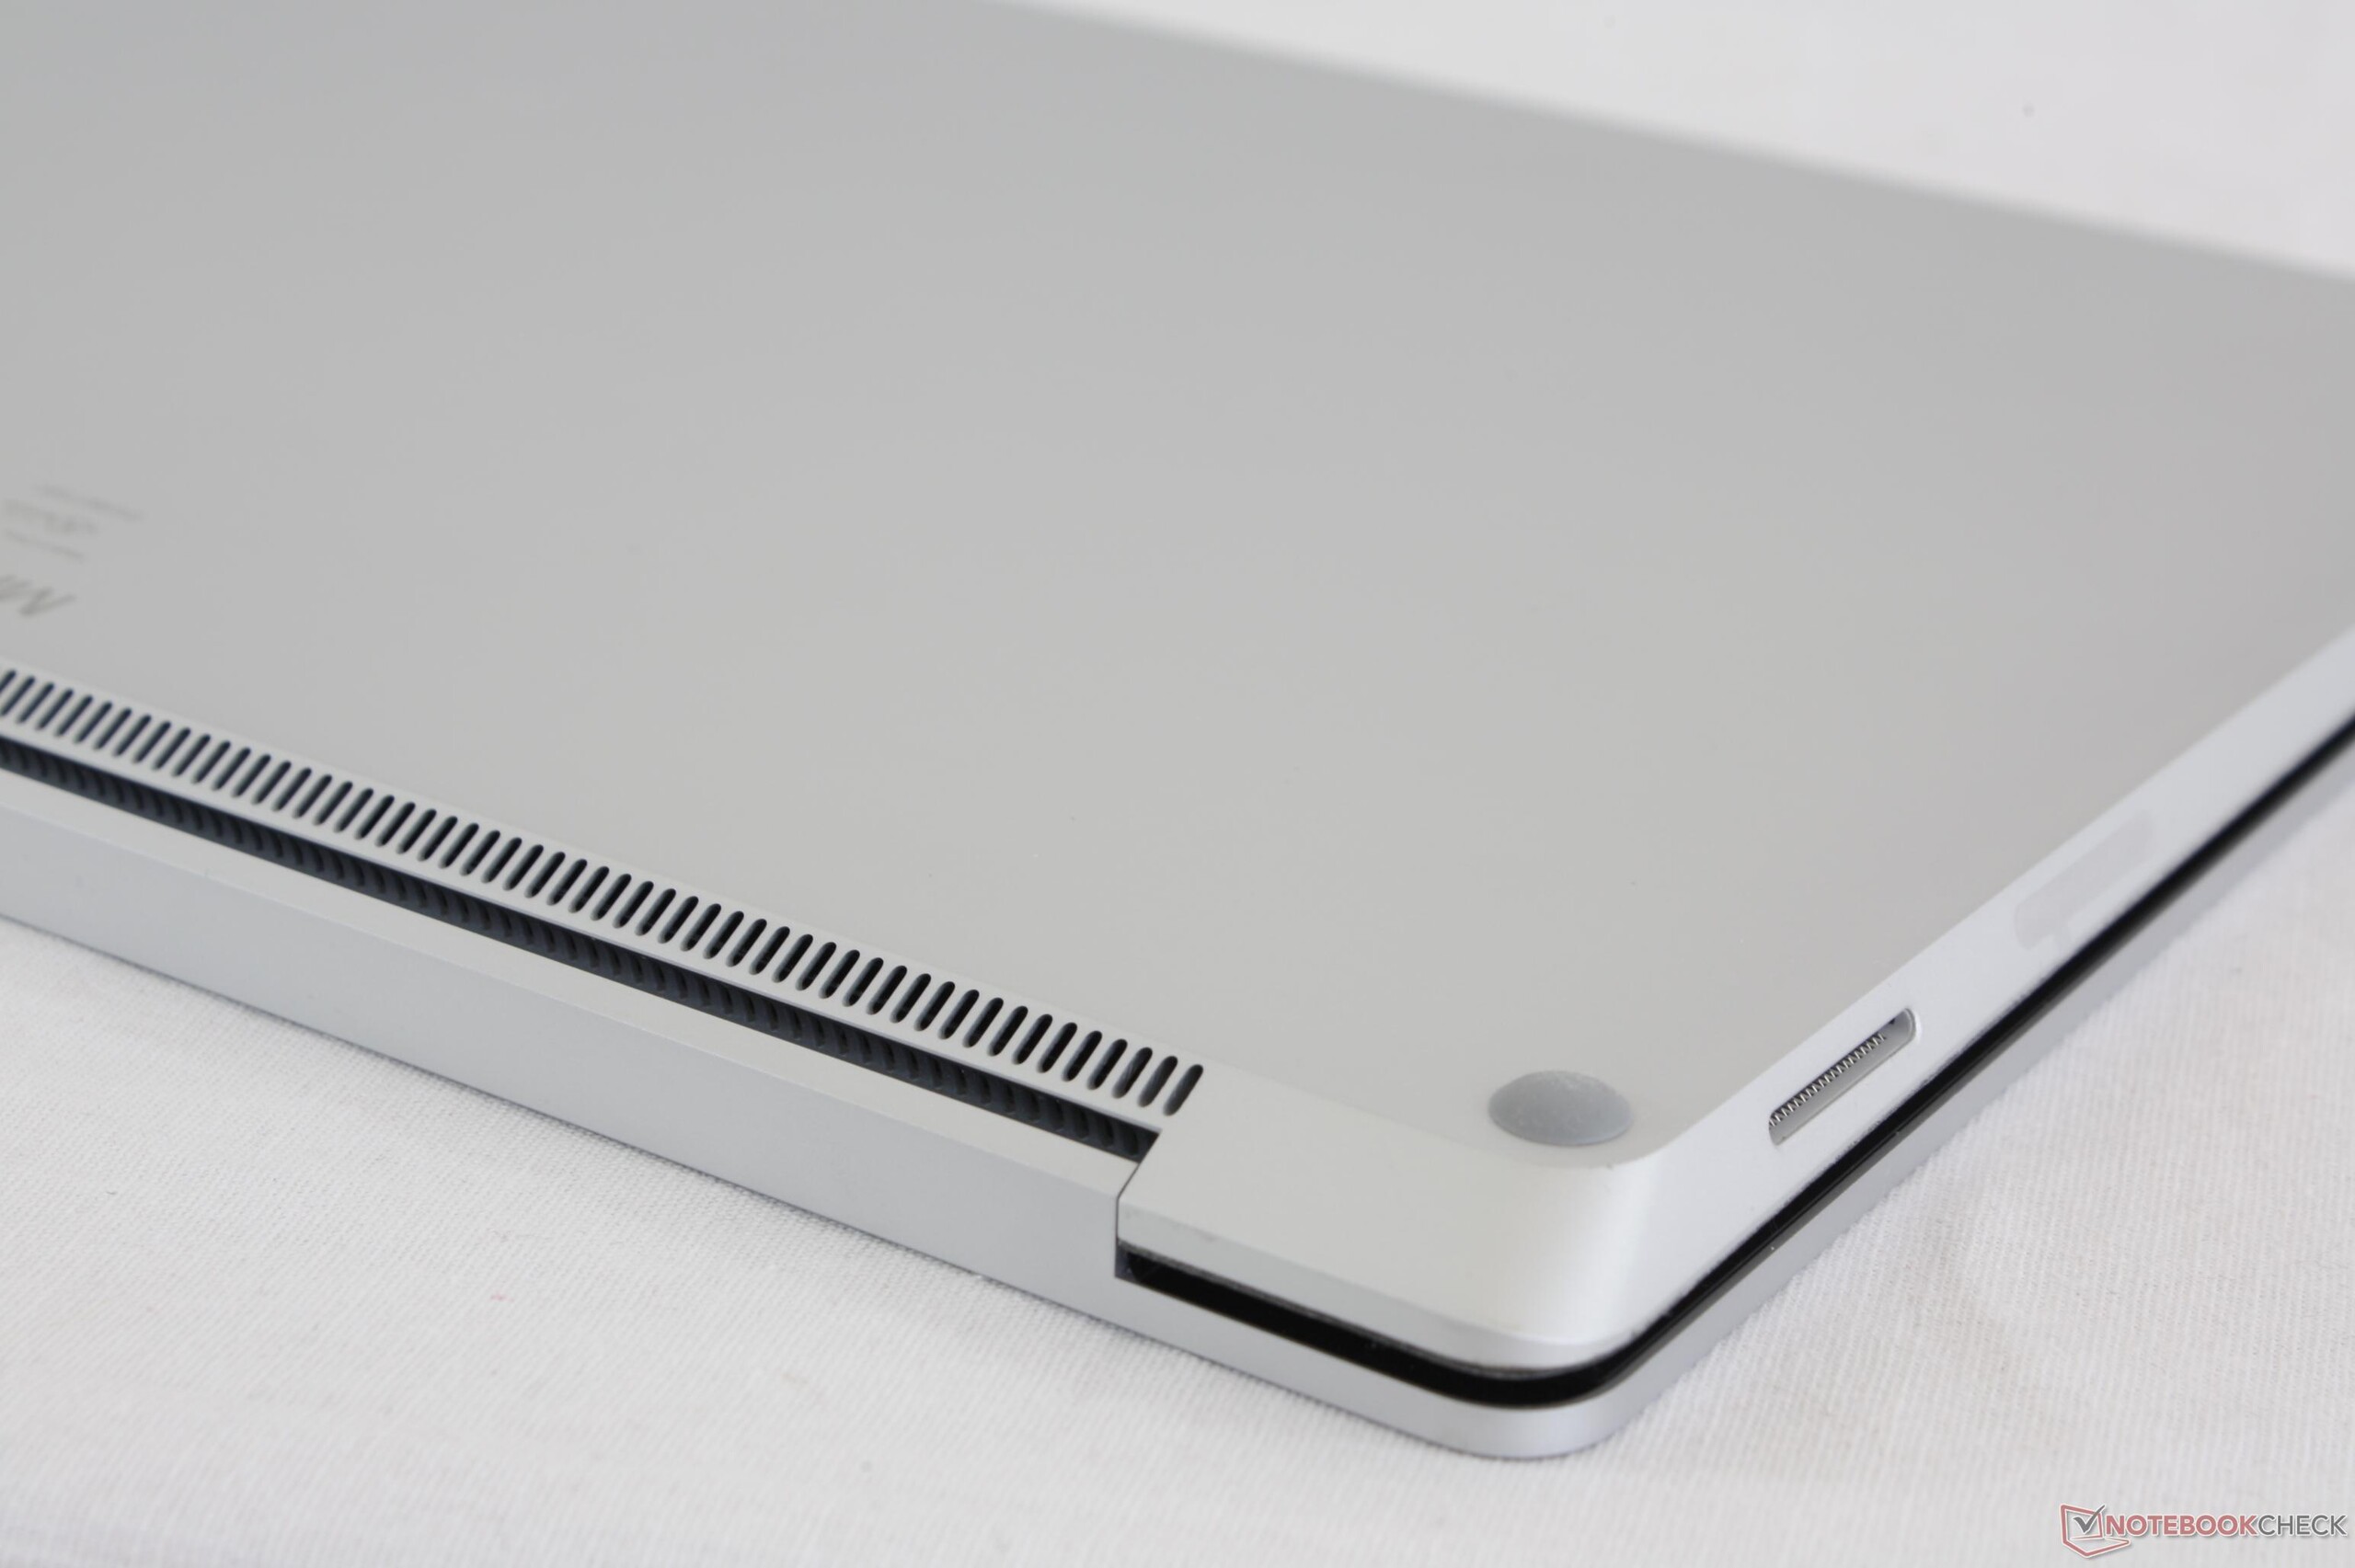
Microsoft pubblicizza il portatile Surface come "più di un portatile tradizionale", ma la nostra esperienza è stata l'esatto opposto. Se features come USB Type-C, lettore SD, e NVMe sono importanti, allora gli attuali Ultrabooks ammiraglia Lenovo, HP, e Dell hanno di più di quanto possa offrire l'ultimo dispositivo Microsoft Surface. La base Alcantara è sicuramente particolare ed è un punto di forza del marketing, ma il suo utilizzo appare superficiale e poco significativo per gli aspetti pratici degli utenti.
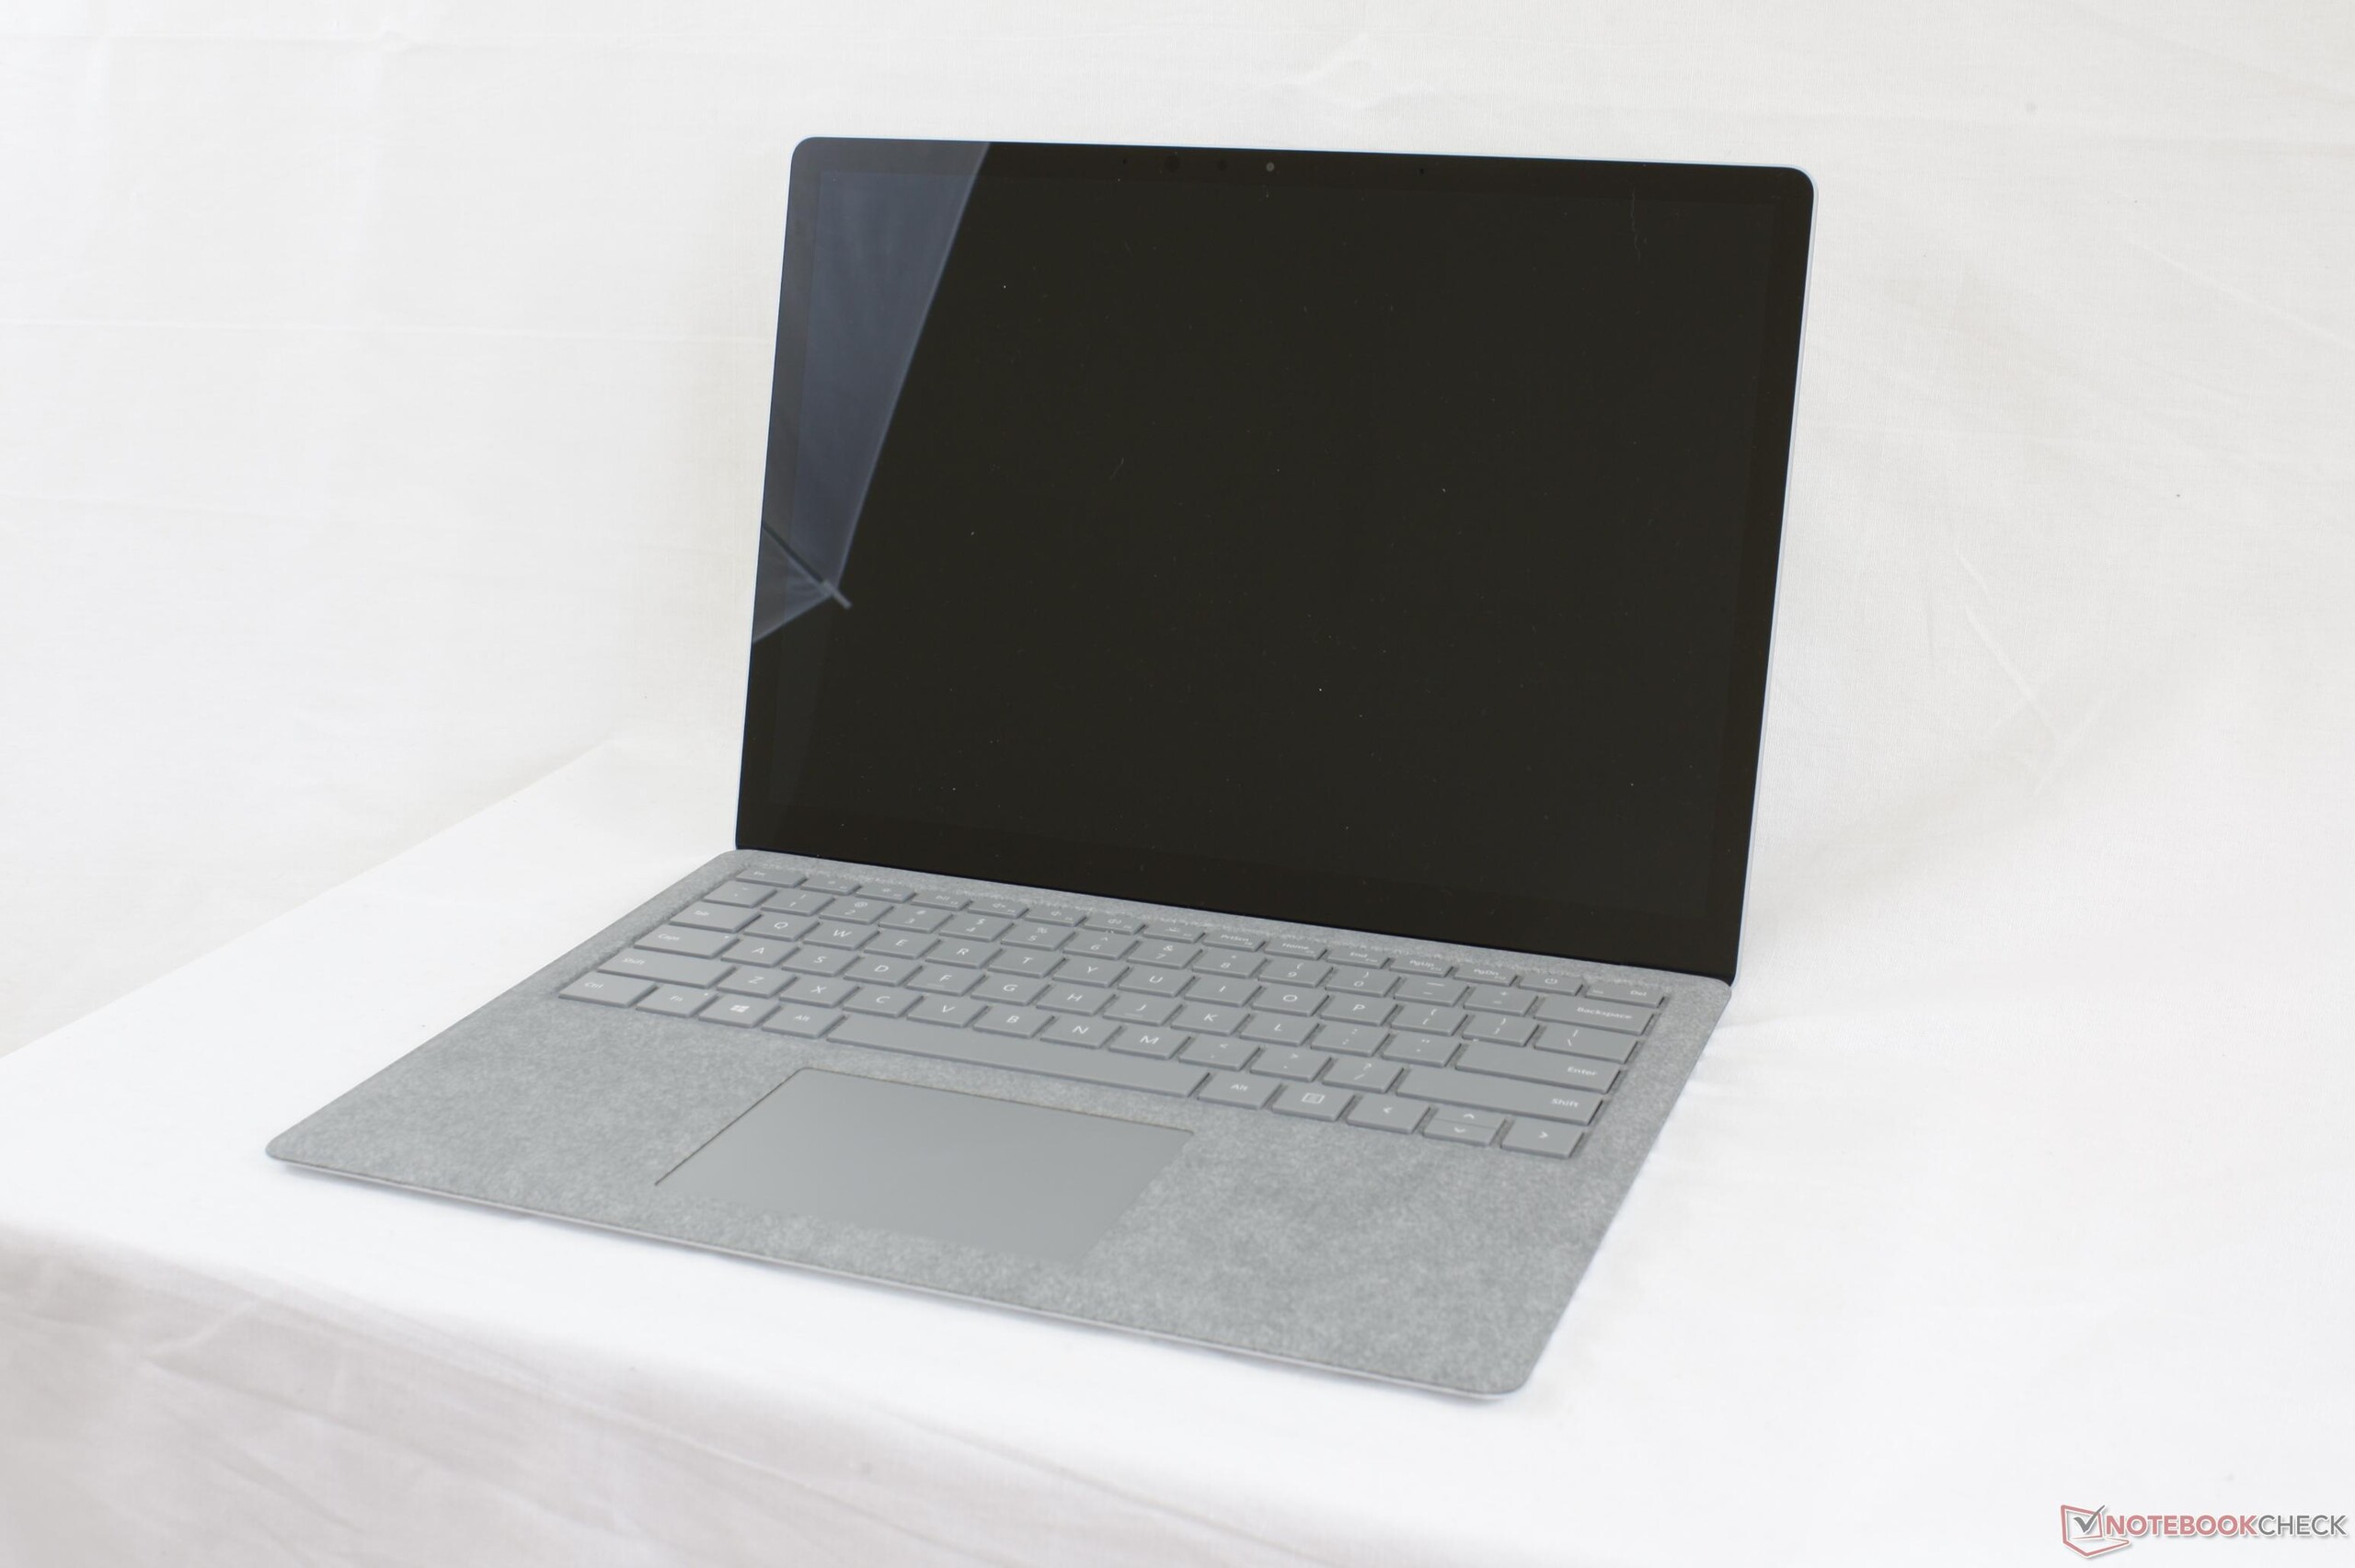
Il motivo principale per scegliere un portatile Surface è il suo display da 13,5" in quanto per tutto il resto il notebook è abbastanza deludente. Se il pannello 3:2 o la SKU Iris Graphics non sono un must-have, allora il portatile diventa meno interessante rispetto alla quantità di alternative da 13 e 14" a disposizione. L'ampia autonomia, la silenziosità della ventola, e l'ampia gamma di colore del portatile Microsoft si trovano anche in competitors come l'XPS 13 9360 QHD o il Notebook 9.
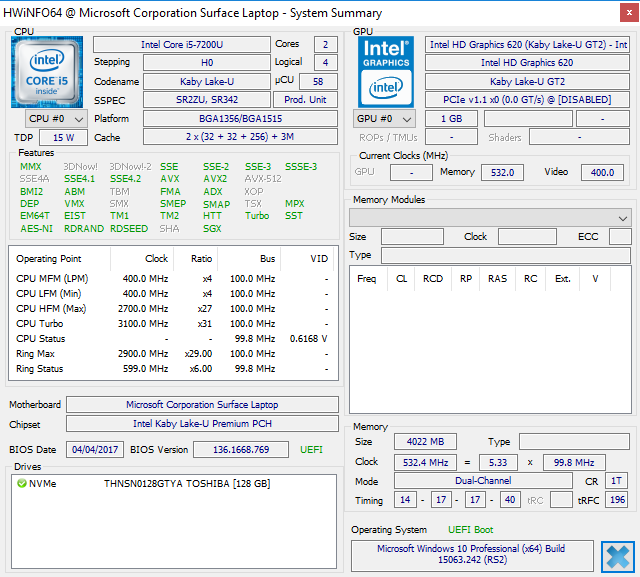
Come la SKU Core i7 si comporterà sotto stress lo vedremo in futuro. Se la nostra configurazione Core i5 difficilmente mantiene il clock rate Turbo Boost nella fascia 2.7 - 2.8 GHz, allora ci chiediamo come la SKU Core i7 più impegnativa riuscirà a mantenere il Turbo Boost massimo di 4.0 GHz. Siamo anche curiosi di sapere se la RAM DDR3 riesce a gestire il pieno potenziale della GPU Iris Plus Graphics 640 visto che la nostra GPU HD Graphics 620 non è pienamente performante con la configurazione Core i5.
Microsoft lancia il suo portatile per gli studenti e dobbiamo apprezzare che le qualità del dispositivo non sembrano aver subito tagli. Detto questo, c'è una lunga lista di features mancanti che limita molto la versatilità del portatile Surface e diventa complicato raccomandarlo sia a studenti che ad utenti generici.
Too little, too late. Il portatile Surface è solido e senza fronzoli con un eccellente display. Sfortunatamente, non offre molto altro e non è molto versatile rispetto al Surface Pro 4 o alla maggioranza di Ultrabooks attualmente sul mercato.
Nota: si tratta di una recensione breve, con alcune sezioni non tradotte, per la versione integrale in inglese guardate qui.
Microsoft Surface Laptop i5
- 06/18/2017 v6 (old)
Allen Ngo
Price comparison
