Recensione breve della Workstation Lenovo ThinkPad P51s (Core i7, 4K)
| SD Card Reader | |
| average JPG Copy Test (av. of 3 runs) | |
| Dell Precision 5520 UHD | |
| HP ZBook Studio G3 | |
| Lenovo ThinkPad P51s 20HB000SGE | |
| Lenovo ThinkPad T570-20HAS01E00 | |
| Lenovo ThinkPad P50s-20FKS00400 | |
| maximum AS SSD Seq Read Test (1GB) | |
| Dell Precision 5520 UHD | |
| HP ZBook Studio G3 | |
| Lenovo ThinkPad T570-20HAS01E00 | |
| Lenovo ThinkPad P50s-20FKS00400 | |
| Lenovo ThinkPad P51s 20HB000SGE | |
| Networking | |
| iperf3 transmit AX12 | |
| Lenovo ThinkPad P51s 20HB000SGE | |
| Dell Precision 5520 UHD | |
| Lenovo ThinkPad T570-20HAS01E00 | |
| iperf3 receive AX12 | |
| Lenovo ThinkPad P51s 20HB000SGE | |
| Lenovo ThinkPad T570-20HAS01E00 | |
| Dell Precision 5520 UHD | |
| |||||||||||||||||||||||||
Distribuzione della luminosità: 85 %
Al centro con la batteria: 318 cd/m²
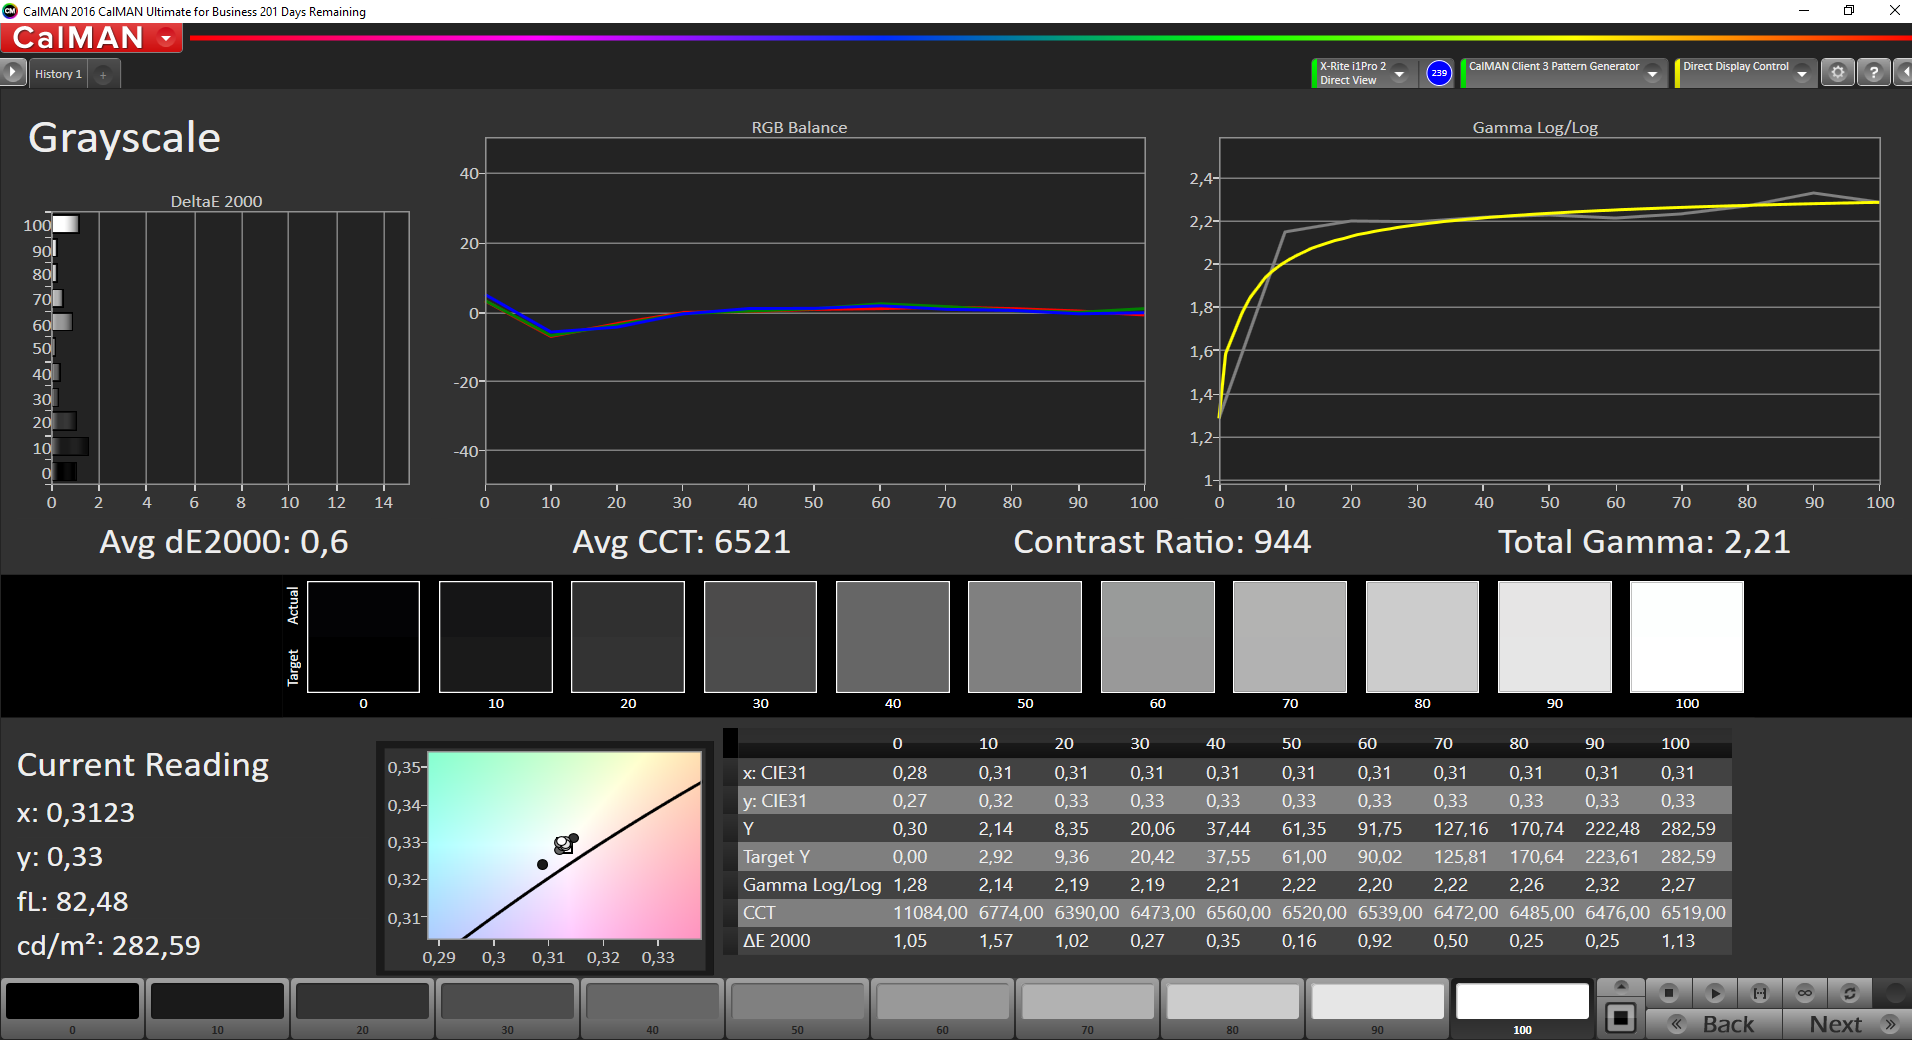
Contrasto: 991:1 (Nero: 0.32 cd/m²)
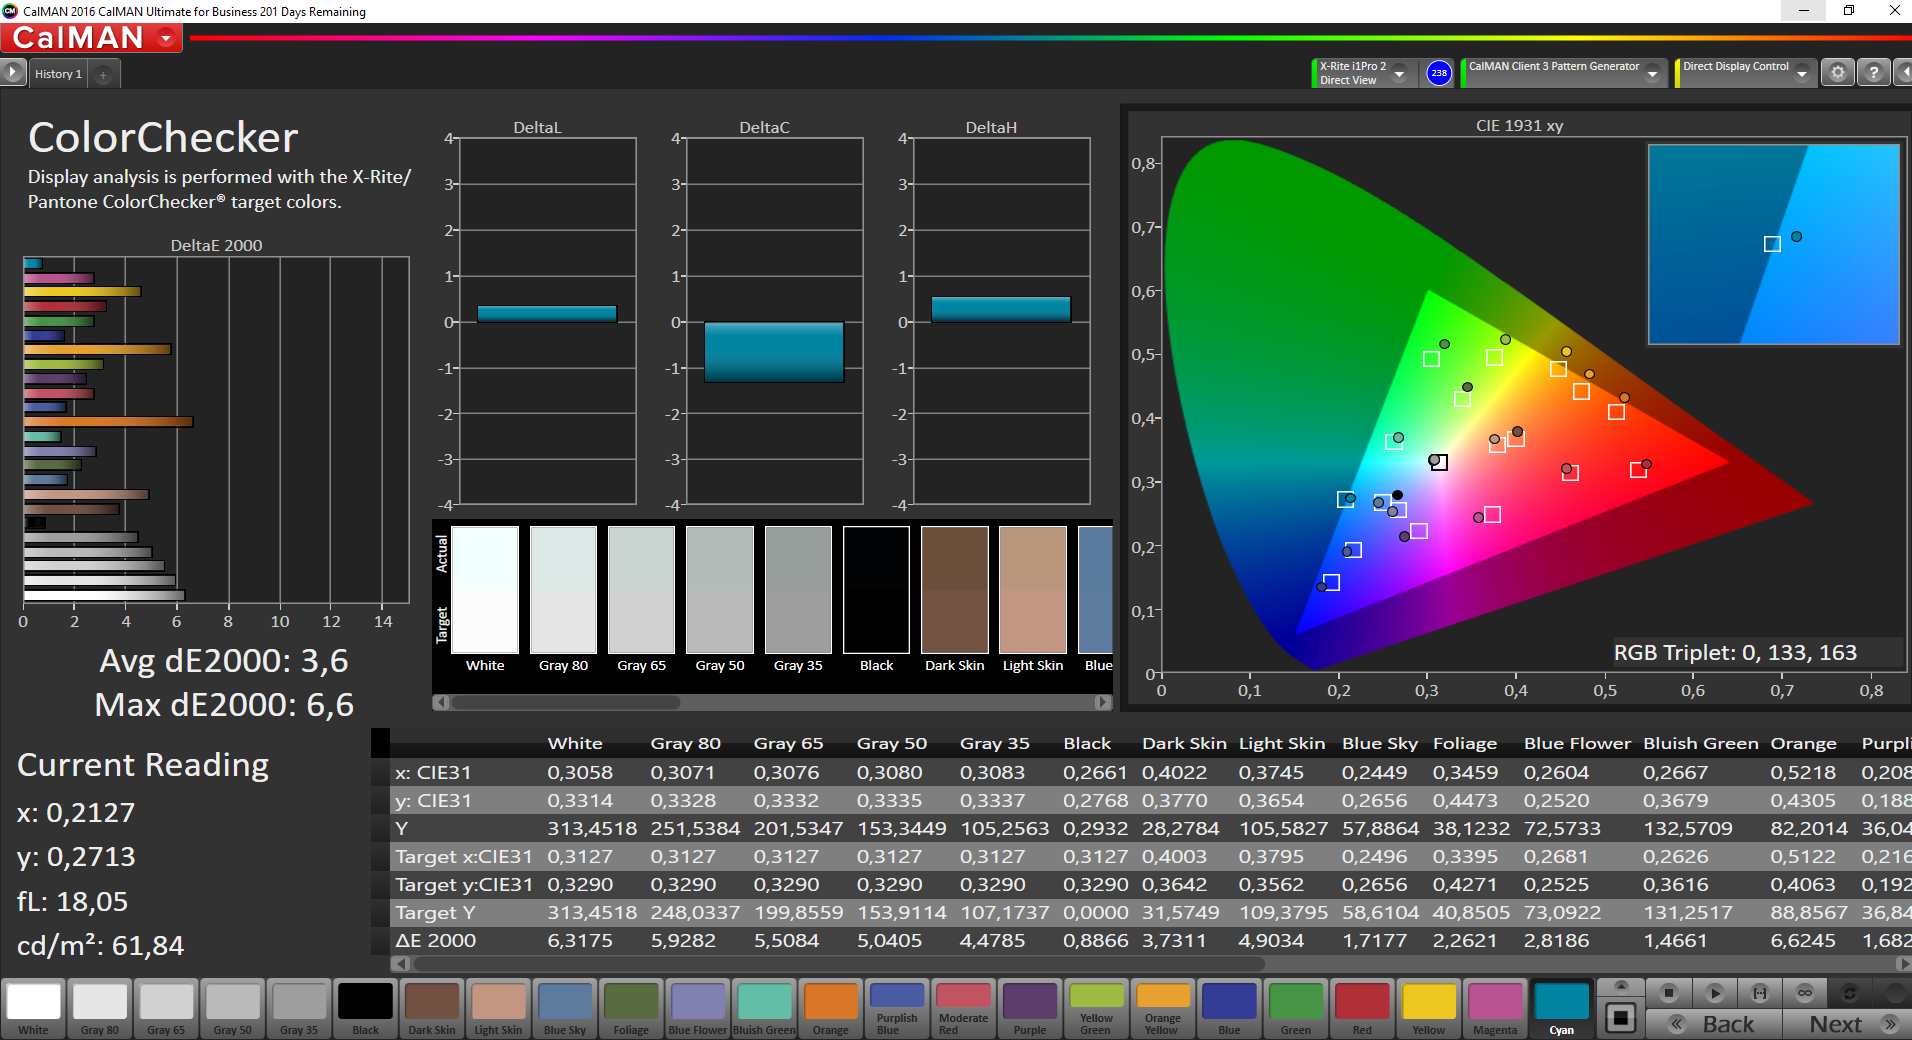
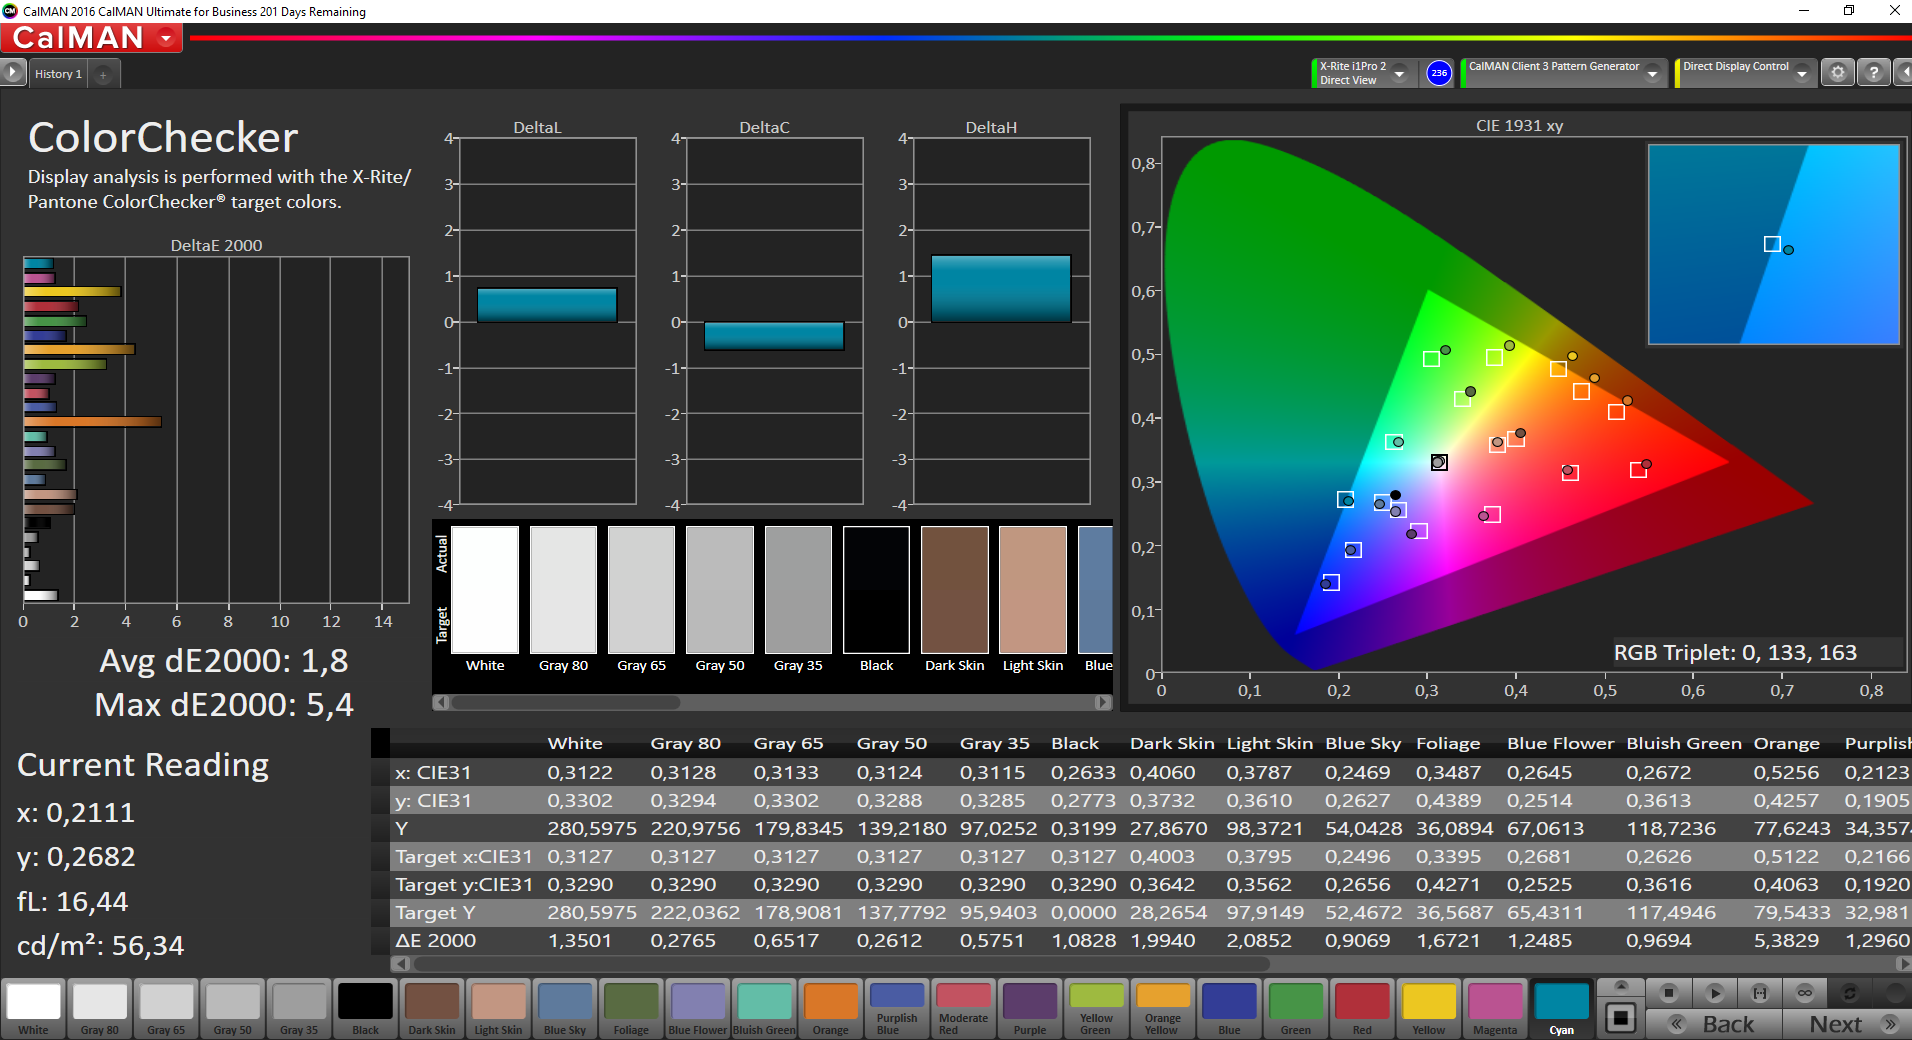
ΔE ColorChecker Calman: 3.6 | ∀{0.5-29.43 Ø4.73}
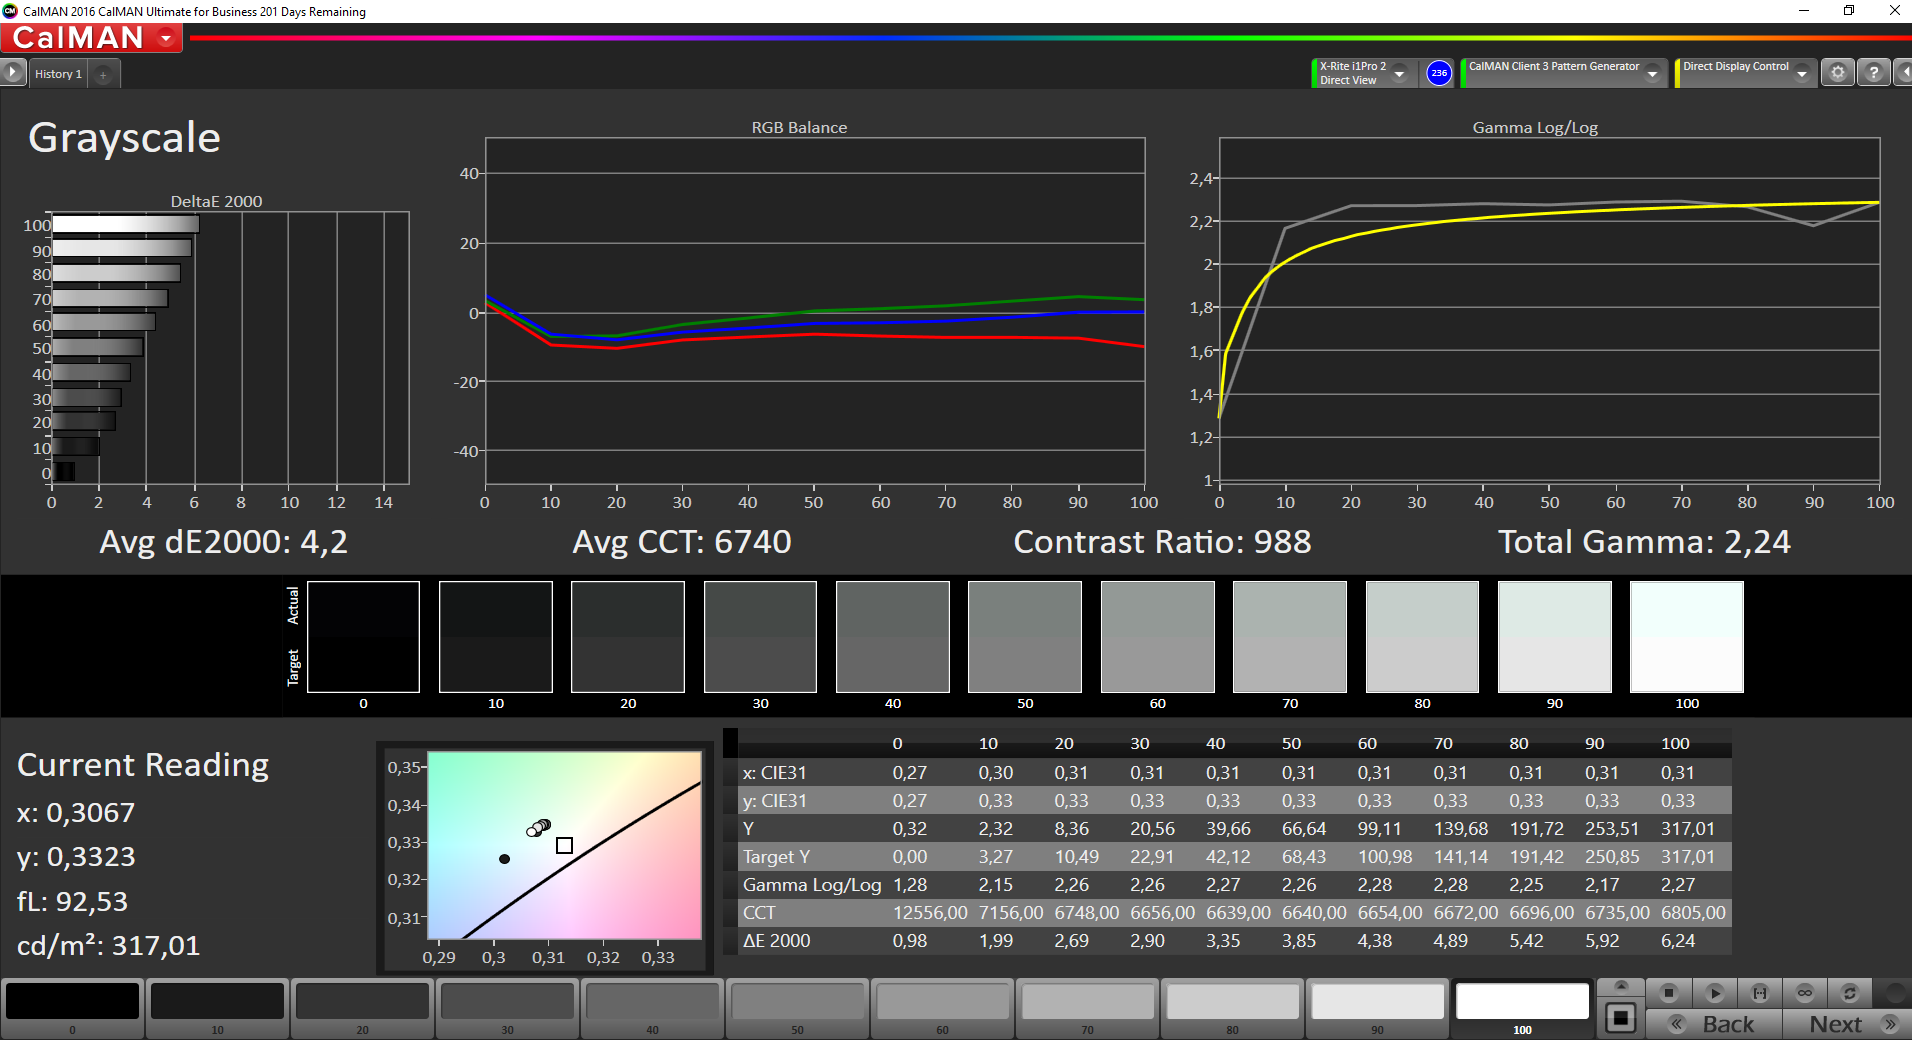
ΔE Greyscale Calman: 4.2 | ∀{0.09-98 Ø4.97}
91.1% sRGB (Argyll 1.6.3 3D)
59.5% AdobeRGB 1998 (Argyll 1.6.3 3D)
66.8% AdobeRGB 1998 (Argyll 3D)
91.2% sRGB (Argyll 3D)
69.7% Display P3 (Argyll 3D)
Gamma: 2.24
CCT: 6740 K
| Lenovo ThinkPad P51s 20HB000SGE IPS, 3840x2160, 15.6", BOE NV156QUM-N44 | Lenovo ThinkPad P50s-20FKS00400 IPS, 2880x1620, 15.5", WX16T028J00, LEN40B5 | Lenovo ThinkPad T570-20HAS01E00 IPS, 3840x2160, 15.6", BOE NV156QUM-N44 | Dell Precision 5520 UHD IPS, 3840x2160, 15.6", SHP1476 | HP ZBook Studio G3 IPS, 3840x2160, 15.6", Sharp SPH1445 | |
|---|---|---|---|---|---|
| Display | -6% | 0% | 3% | 26% | |
| Display P3 Coverage (%) | 69.7 | 63.7 -9% | 70 0% | 67.4 -3% | 86 23% |
| sRGB Coverage (%) | 91.2 | 87.6 -4% | 91.1 0% | 98.5 8% | 98.9 8% |
| AdobeRGB 1998 Coverage (%) | 66.8 | 63.8 -4% | 66.7 0% | 68.9 3% | 98 47% |
| Response Times | -8% | 16% | -61% | -5% | |
| Response Time Grey 50% / Grey 80% * (ms) | 38.4 ? | 38 ? 1% | 41.6 ? -8% | 59.2 ? -54% | 44 ? -15% |
| Response Time Black / White * (ms) | 24.8 ? | 28.8 ? -16% | 15.2 ? 39% | 41.6 ? -68% | 23.2 ? 6% |
| PWM Frequency (Hz) | 980 ? | 219 ? | 926 ? | 200 ? | |
| Screen | -9% | -5% | 5% | -9% | |
| Brightness middle (cd/m²) | 317 | 319 1% | 339 7% | 372.4 17% | 310 -2% |
| Brightness (cd/m²) | 290 | 290 0% | 314 8% | 368 27% | 299 3% |
| Brightness Distribution (%) | 85 | 82 -4% | 89 5% | 90 6% | 86 1% |
| Black Level * (cd/m²) | 0.32 | 0.31 3% | 0.36 -13% | 0.48 -50% | 0.29 9% |
| Contrast (:1) | 991 | 1029 4% | 942 -5% | 776 -22% | 1069 8% |
| Colorchecker dE 2000 * | 3.6 | 4.8 -33% | 4.2 -17% | 2.6 28% | 5.9 -64% |
| Colorchecker dE 2000 max. * | 6.6 | 7.8 -18% | 7.8 -18% | 5.6 15% | 10.7 -62% |
| Greyscale dE 2000 * | 4.2 | 5.7 -36% | 5.1 -21% | 3.7 12% | 5.5 -31% |
| Gamma | 2.24 98% | 2.07 106% | 2.16 102% | 2.14 103% | 2.09 105% |
| CCT | 6740 96% | 6260 104% | 6569 99% | 7096 92% | 5980 109% |
| Color Space (Percent of AdobeRGB 1998) (%) | 59.5 | 56.9 -4% | 59.4 0% | 63 6% | 85 43% |
| Color Space (Percent of sRGB) (%) | 91.1 | 87.4 -4% | 91 0% | 99 9% | 99 9% |
| Media totale (Programma / Settaggio) | -8% /
-8% | 4% /
-2% | -18% /
-4% | 4% /
-1% |
* ... Meglio usare valori piccoli
Sfarfallio dello schermo / PWM (Pulse-Width Modulation)
| flickering dello schermo / PWM rilevato | 980 Hz | ≤ 90 % settaggio luminosita' | 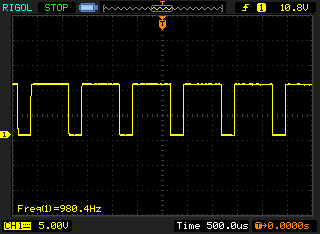 |
Il display sfarfalla a 980 Hz (Probabilmente a causa dell'uso di PWM) Flickering rilevato ad una luminosita' di 90 % o inferiore. Non dovrebbe verificarsi flickering o PWM sopra questo valore di luminosita'. La frequenza di 980 Hz è abbastanza alta, quindi la maggioranza degli utenti sensibili al PWM non dovrebbero notare alcun flickering. In confronto: 52 % di tutti i dispositivi testati non utilizza PWM per ridurre la luminosita' del display. Se è rilevato PWM, una media di 7798 (minimo: 5 - massimo: 343500) Hz è stata rilevata. | |||
Tempi di risposta del Display
| ↔ Tempi di risposta dal Nero al Bianco | ||
|---|---|---|
| 24.8 ms ... aumenta ↗ e diminuisce ↘ combinato | ↗ 13.6 ms Incremento | 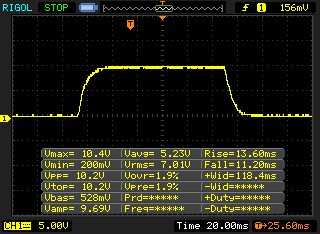 |
| ↘ 11.2 ms Calo | ||
| Lo schermo mostra buoni tempi di risposta durante i nostri tests, ma potrebbe essere troppo lento per i gamers competitivi. In confronto, tutti i dispositivi di test variano da 0.1 (minimo) a 240 (massimo) ms. » 58 % di tutti i dispositivi è migliore. Questo significa che i tempi di risposta rilevati sono peggiori rispetto alla media di tutti i dispositivi testati (19.9 ms). | ||
| ↔ Tempo di risposta dal 50% Grigio all'80% Grigio | ||
| 38.4 ms ... aumenta ↗ e diminuisce ↘ combinato | ↗ 20.4 ms Incremento |  |
| ↘ 18 ms Calo | ||
| Lo schermo mostra tempi di risposta lenti nei nostri tests e sarà insoddisfacente per i gamers. In confronto, tutti i dispositivi di test variano da 0.165 (minimo) a 636 (massimo) ms. » 57 % di tutti i dispositivi è migliore. Questo significa che i tempi di risposta rilevati sono peggiori rispetto alla media di tutti i dispositivi testati (31.1 ms). | ||
| Cinebench R10 | |
| Rendering Single 32Bit | |
| Lenovo ThinkPad P51 20HH0016GE | |
| Lenovo ThinkPad P51s 20HB000SGE | |
| HP ZBook Studio G3 | |
| Lenovo ThinkPad P50s-20FKS00400 | |
| Rendering Multiple CPUs 32Bit | |
| Lenovo ThinkPad P51 20HH0016GE | |
| HP ZBook Studio G3 | |
| Lenovo ThinkPad P51s 20HB000SGE | |
| Lenovo ThinkPad P50s-20FKS00400 | |
| Geekbench 3 | |
| 32 Bit Multi-Core Score | |
| Lenovo ThinkPad P51 20HH0016GE | |
| Lenovo ThinkPad P51s 20HB000SGE | |
| 32 Bit Single-Core Score | |
| Lenovo ThinkPad P51 20HH0016GE | |
| Lenovo ThinkPad P51s 20HB000SGE | |
| Geekbench 4.0 | |
| 64 Bit Multi-Core Score | |
| Lenovo ThinkPad P51s 20HB000SGE | |
| 64 Bit Single-Core Score | |
| Lenovo ThinkPad P51s 20HB000SGE | |
| Geekbench 4.4 | |
| 64 Bit Multi-Core Score | |
| Lenovo ThinkPad P51s 20HB000SGE | |
| 64 Bit Single-Core Score | |
| Lenovo ThinkPad P51s 20HB000SGE | |
| JetStream 1.1 - 1.1 Total | |
| Lenovo ThinkPad P51 20HH0016GE | |
| Dell Precision 5520 UHD | |
| Lenovo ThinkPad P51s 20HB000SGE | |
| PCMark 7 Score | 5568 punti | |
| PCMark 8 Home Score Accelerated v2 | 3232 punti | |
| PCMark 8 Creative Score Accelerated v2 | 4640 punti | |
| PCMark 8 Work Score Accelerated v2 | 4193 punti | |
Aiuto | ||

| Lenovo ThinkPad P51s 20HB000SGE Samsung SSD PM961 1TB M.2 PCIe 3.0 x4 NVMe (MZVLW1T0) | Lenovo ThinkPad P50s-20FKS00400 Samsung PM871 MZYLN256HCHP | Dell Precision 5520 UHD Samsung SM961 MZVKW512HMJP m.2 PCI-e | HP ZBook Studio G3 Samsung SM951 MZVPV512HDGL m.2 PCI-e | Lenovo ThinkPad T570-20HAS01E00 Samsung PM961 NVMe MZVLW512HMJP | Lenovo ThinkPad P51 20HH0016GE Samsung PM961 NVMe MZVLW512HMJP | |
|---|---|---|---|---|---|---|
| CrystalDiskMark 3.0 | -54% | 20% | 29% | -4% | 20% | |
| Read Seq (MB/s) | 1189 | 475.5 -60% | 2253 89% | 1578 33% | 1210 2% | 1705 43% |
| Write Seq (MB/s) | 1138 | 304.7 -73% | 1662 46% | 1557 37% | 1134 0% | 1541 35% |
| Read 512 (MB/s) | 782 | 379.3 -51% | 459.1 -41% | 1234 58% | 789 1% | 1038 33% |
| Write 512 (MB/s) | 959 | 303.4 -68% | 1611 68% | 1391 45% | 903 -6% | 1157 21% |
| Read 4k (MB/s) | 54.8 | 34.31 -37% | 56.1 2% | 59.9 9% | 58.4 7% | 61.3 12% |
| Write 4k (MB/s) | 161.4 | 89.4 -45% | 169.4 5% | 225.6 40% | 144.1 -11% | 176 9% |
| Read 4k QD32 (MB/s) | 642 | 319.9 -50% | 633 -1% | 946 47% | 559 -13% | 664 3% |
| Write 4k QD32 (MB/s) | 549 | 279.4 -49% | 506 -8% | 359 -35% | 474.4 -14% | 560 2% |
| 3DMark 06 Standard Score | 17305 punti | |
| 3DMark Vantage P Result | 11278 punti | |
| 3DMark 11 Performance | 2884 punti | |
| 3DMark Ice Storm Standard Score | 32374 punti | |
| 3DMark Cloud Gate Standard Score | 8544 punti | |
| 3DMark Fire Strike Score | 2139 punti | |
| 3DMark Fire Strike Extreme Score | 1058 punti | |
| 3DMark Time Spy Score | 684 punti | |
Aiuto | ||
| Geekbench 4.0 - Compute OpenCL Score | |
| Lenovo ThinkPad P51s 20HB000SGE | |
| Geekbench 4.4 - Compute OpenCL Score | |
| Lenovo ThinkPad P51s 20HB000SGE | |
| GFXBench (DX / GLBenchmark) 2.7 | |
| 1920x1080 T-Rex Offscreen | |
| Lenovo ThinkPad P51s 20HB000SGE | |
| Lenovo ThinkPad P50s-20FKS00400 | |
| T-Rex Onscreen | |
| Lenovo ThinkPad P51s 20HB000SGE | |
| Lenovo ThinkPad P50s-20FKS00400 | |
| GFXBench 3.0 | |
| 1920x1080 1080p Manhattan Offscreen | |
| Lenovo ThinkPad P51s 20HB000SGE | |
| Lenovo ThinkPad P50s-20FKS00400 | |
| on screen Manhattan Onscreen OGL | |
| Lenovo ThinkPad P50s-20FKS00400 | |
| Lenovo ThinkPad P51s 20HB000SGE | |
| GFXBench 3.1 | |
| 1920x1080 Manhattan ES 3.1 Offscreen | |
| Lenovo ThinkPad P51s 20HB000SGE | |
| Lenovo ThinkPad P50s-20FKS00400 | |
| on screen Manhattan ES 3.1 Onscreen | |
| Lenovo ThinkPad P50s-20FKS00400 | |
| Lenovo ThinkPad P51s 20HB000SGE | |
| GFXBench | |
| 1920x1080 Car Chase Offscreen | |
| Lenovo ThinkPad P51s 20HB000SGE | |
| Lenovo ThinkPad P50s-20FKS00400 | |
| on screen Car Chase Onscreen | |
| Lenovo ThinkPad P50s-20FKS00400 | |
| Lenovo ThinkPad P51s 20HB000SGE | |
| ComputeMark v2.1 - 1024x600 Normal, Score | |
| Lenovo ThinkPad P51s 20HB000SGE | |
| Lenovo ThinkPad P50s-20FKS00400 | |
| Dell Precision 5520 UHD | |
| Unigine Heaven 2.1 - 1280x1024 high, Tesselation (normal), DirectX11 AA:off AF:1x | |
| HP ZBook Studio G3 | |
| Lenovo ThinkPad P51s 20HB000SGE | |
| Lenovo ThinkPad P50s-20FKS00400 | |
| Unigine Heaven 3.0 | |
| 1920x1080 OpenGL, Normal Tessellation, High Shaders AA:Off AF:Off | |
| HP ZBook Studio G3 | |
| Lenovo ThinkPad P51s 20HB000SGE | |
| Lenovo ThinkPad P50s-20FKS00400 | |
| 1920x1080 DX 11, Normal Tessellation, High Shaders AA:Off AF:Off | |
| HP ZBook Studio G3 | |
| Lenovo ThinkPad P51s 20HB000SGE | |
| Lenovo ThinkPad P50s-20FKS00400 | |
| Unigine Heaven 4.0 | |
| Extreme Preset OpenGL | |
| Lenovo ThinkPad P51 20HH0016GE | |
| Lenovo ThinkPad P51s 20HB000SGE | |
| Extreme Preset DX11 | |
| Lenovo ThinkPad P51 20HH0016GE | |
| Lenovo ThinkPad P51s 20HB000SGE | |
| Unigine Valley 1.0 | |
| 1920x1080 Extreme HD DirectX AA:x8 | |
| Lenovo ThinkPad P51 20HH0016GE | |
| HP ZBook Studio G3 | |
| Lenovo ThinkPad P51s 20HB000SGE | |
| Lenovo ThinkPad P50s-20FKS00400 | |
| 1920x1080 Extreme HD Preset OpenGL AA:x8 | |
| Lenovo ThinkPad P51 20HH0016GE | |
| HP ZBook Studio G3 | |
| Lenovo ThinkPad P51s 20HB000SGE | |
| Lenovo ThinkPad P50s-20FKS00400 | |
| SiSoft Sandra 2016 | |
| GP Financial Analysis (FP High/Double Precision) | |
| Lenovo ThinkPad P51 20HH0016GE | |
| HP ZBook Studio G3 | |
| Lenovo ThinkPad P51s 20HB000SGE | |
| Lenovo ThinkPad P50s-20FKS00400 | |
| GP Cryptography (Higher Security AES256+SHA2-512) | |
| Lenovo ThinkPad P51 20HH0016GE | |
| HP ZBook Studio G3 | |
| Lenovo ThinkPad P50s-20FKS00400 | |
| Lenovo ThinkPad P51s 20HB000SGE | |
| Image Processing | |
| Lenovo ThinkPad P51 20HH0016GE | |
| HP ZBook Studio G3 | |
| Lenovo ThinkPad P51s 20HB000SGE | |
| Lenovo ThinkPad P50s-20FKS00400 | |
| basso | medio | alto | ultra | 4K | |
|---|---|---|---|---|---|
| Tomb Raider (2013) | 188.1 | 97.9 | 59.5 | 28.8 | |
| BioShock Infinite (2013) | 138.2 | 76.9 | 64.1 | 24.2 | |
| Middle-earth: Shadow of Mordor (2014) | 54.6 | 32.9 | 22.8 | 16.2 | |
| Dragon Age: Inquisition (2014) | 68.2 | 51.7 | 18.3 | 12.2 | |
| Battlefield Hardline (2015) | 81.1 | 74.2 | 30.4 | 19.6 | |
| Dirt Rally (2015) | 145.6 | 75.1 | 40.5 | 18.7 | 14.7 |
| World of Warships (2015) | 135.6 | 108.1 | 54 | 36.7 | 11 |
| Anno 2205 (2015) | 60.1 | 36.2 | 17.7 | 7.4 | |
| Star Wars Battlefront (2015) | 78.2 | 48.9 | 22.3 | 19.1 | |
| Rainbow Six Siege (2015) | 94.5 | 60.1 | 31.8 | 22.8 | 8.1 |
| Rise of the Tomb Raider (2016) | 30 | 21.5 | 13.3 | 11.7 | |
| Far Cry Primal (2016) | 46 | 20 | 18 | 12 | |
| The Division (2016) | 52.2 | 31.8 | 14.8 | 11.2 | |
| Ashes of the Singularity (2016) | 23.6 | 14.3 | 12 | ||
| Deus Ex Mankind Divided (2016) | 27.2 | 21 | 11.6 | 5.3 | |
| Battlefield 1 (2016) | 56.4 | 43.9 | 33 | 28.2 | |
| Civilization 6 (2016) | 50.8 | 30.4 | 15.2 | 11.7 | |
| Farming Simulator 17 (2016) | 183.1 | 120.6 | 49.8 | 32.1 | 13.7 |
| Titanfall 2 (2016) | 72.2 | 52.5 | 21.3 | 17.3 | |
| Resident Evil 7 (2017) | 84 | 40 | 22.1 | 6.6 | |
| For Honor (2017) | 64.6 | 23 | 21.9 | 15.9 | |
| Ghost Recon Wildlands (2017) | 38.1 | 14.3 | 12 | 3.6 | |
| Prey (2017) | 85.4 | 32.8 | 26.7 | 22 |
| BioShock Infinite - 1366x768 High Preset | |
| Dell Precision 5520 UHD | |
| HP ZBook Studio G3 | |
| Lenovo ThinkPad T570-20HAS01E00 | |
| Lenovo ThinkPad P51s 20HB000SGE | |
| Lenovo ThinkPad P50s-20FKS00400 | |
Rumorosità
| Idle |
| 29.2 / 29.2 / 31.1 dB(A) |
| Sotto carico |
| 36.7 / 39.4 dB(A) |
 | ||
30 dB silenzioso 40 dB(A) udibile 50 dB(A) rumoroso |
||
min: | ||
| Lenovo ThinkPad P51s 20HB000SGE i7-7600U, Quadro M520 | Lenovo ThinkPad P50s-20FKS00400 6500U, Quadro M500M | Dell Precision 5520 UHD E3-1505M v6, Quadro M1200 | HP ZBook Studio G3 6820HQ, Quadro M1000M | Lenovo ThinkPad T570-20HAS01E00 i7-7500U, GeForce 940MX | |
|---|---|---|---|---|---|
| Noise | 0% | -6% | -13% | -0% | |
| off /ambiente * (dB) | 29.2 | 28.7 2% | 30 -3% | 29.3 -0% | |
| Idle Minimum * (dB) | 29.2 | 30 -3% | 28.7 2% | 30 -3% | 29.3 -0% |
| Idle Average * (dB) | 29.2 | 30 -3% | 32.1 -10% | 30 -3% | 29.3 -0% |
| Idle Maximum * (dB) | 31.1 | 30 4% | 32.1 -3% | 30 4% | 31.1 -0% |
| Load Average * (dB) | 36.7 | 33.5 9% | 41.3 -13% | 51 -39% | 35.2 4% |
| Load Maximum * (dB) | 39.4 | 41.9 -6% | 45.5 -15% | 52.8 -34% | 41.3 -5% |
| Witcher 3 ultra * (dB) | 45.5 |
* ... Meglio usare valori piccoli
(±) La temperatura massima sul lato superiore è di 43.6 °C / 110 F, rispetto alla media di 38.2 °C / 101 F, che varia da 22.2 a 69.8 °C per questa classe Workstation.
(-) Il lato inferiore si riscalda fino ad un massimo di 60.8 °C / 141 F, rispetto alla media di 41.1 °C / 106 F
(+) In idle, la temperatura media del lato superiore è di 26.5 °C / 80 F, rispetto alla media deld ispositivo di 32 °C / 90 F.
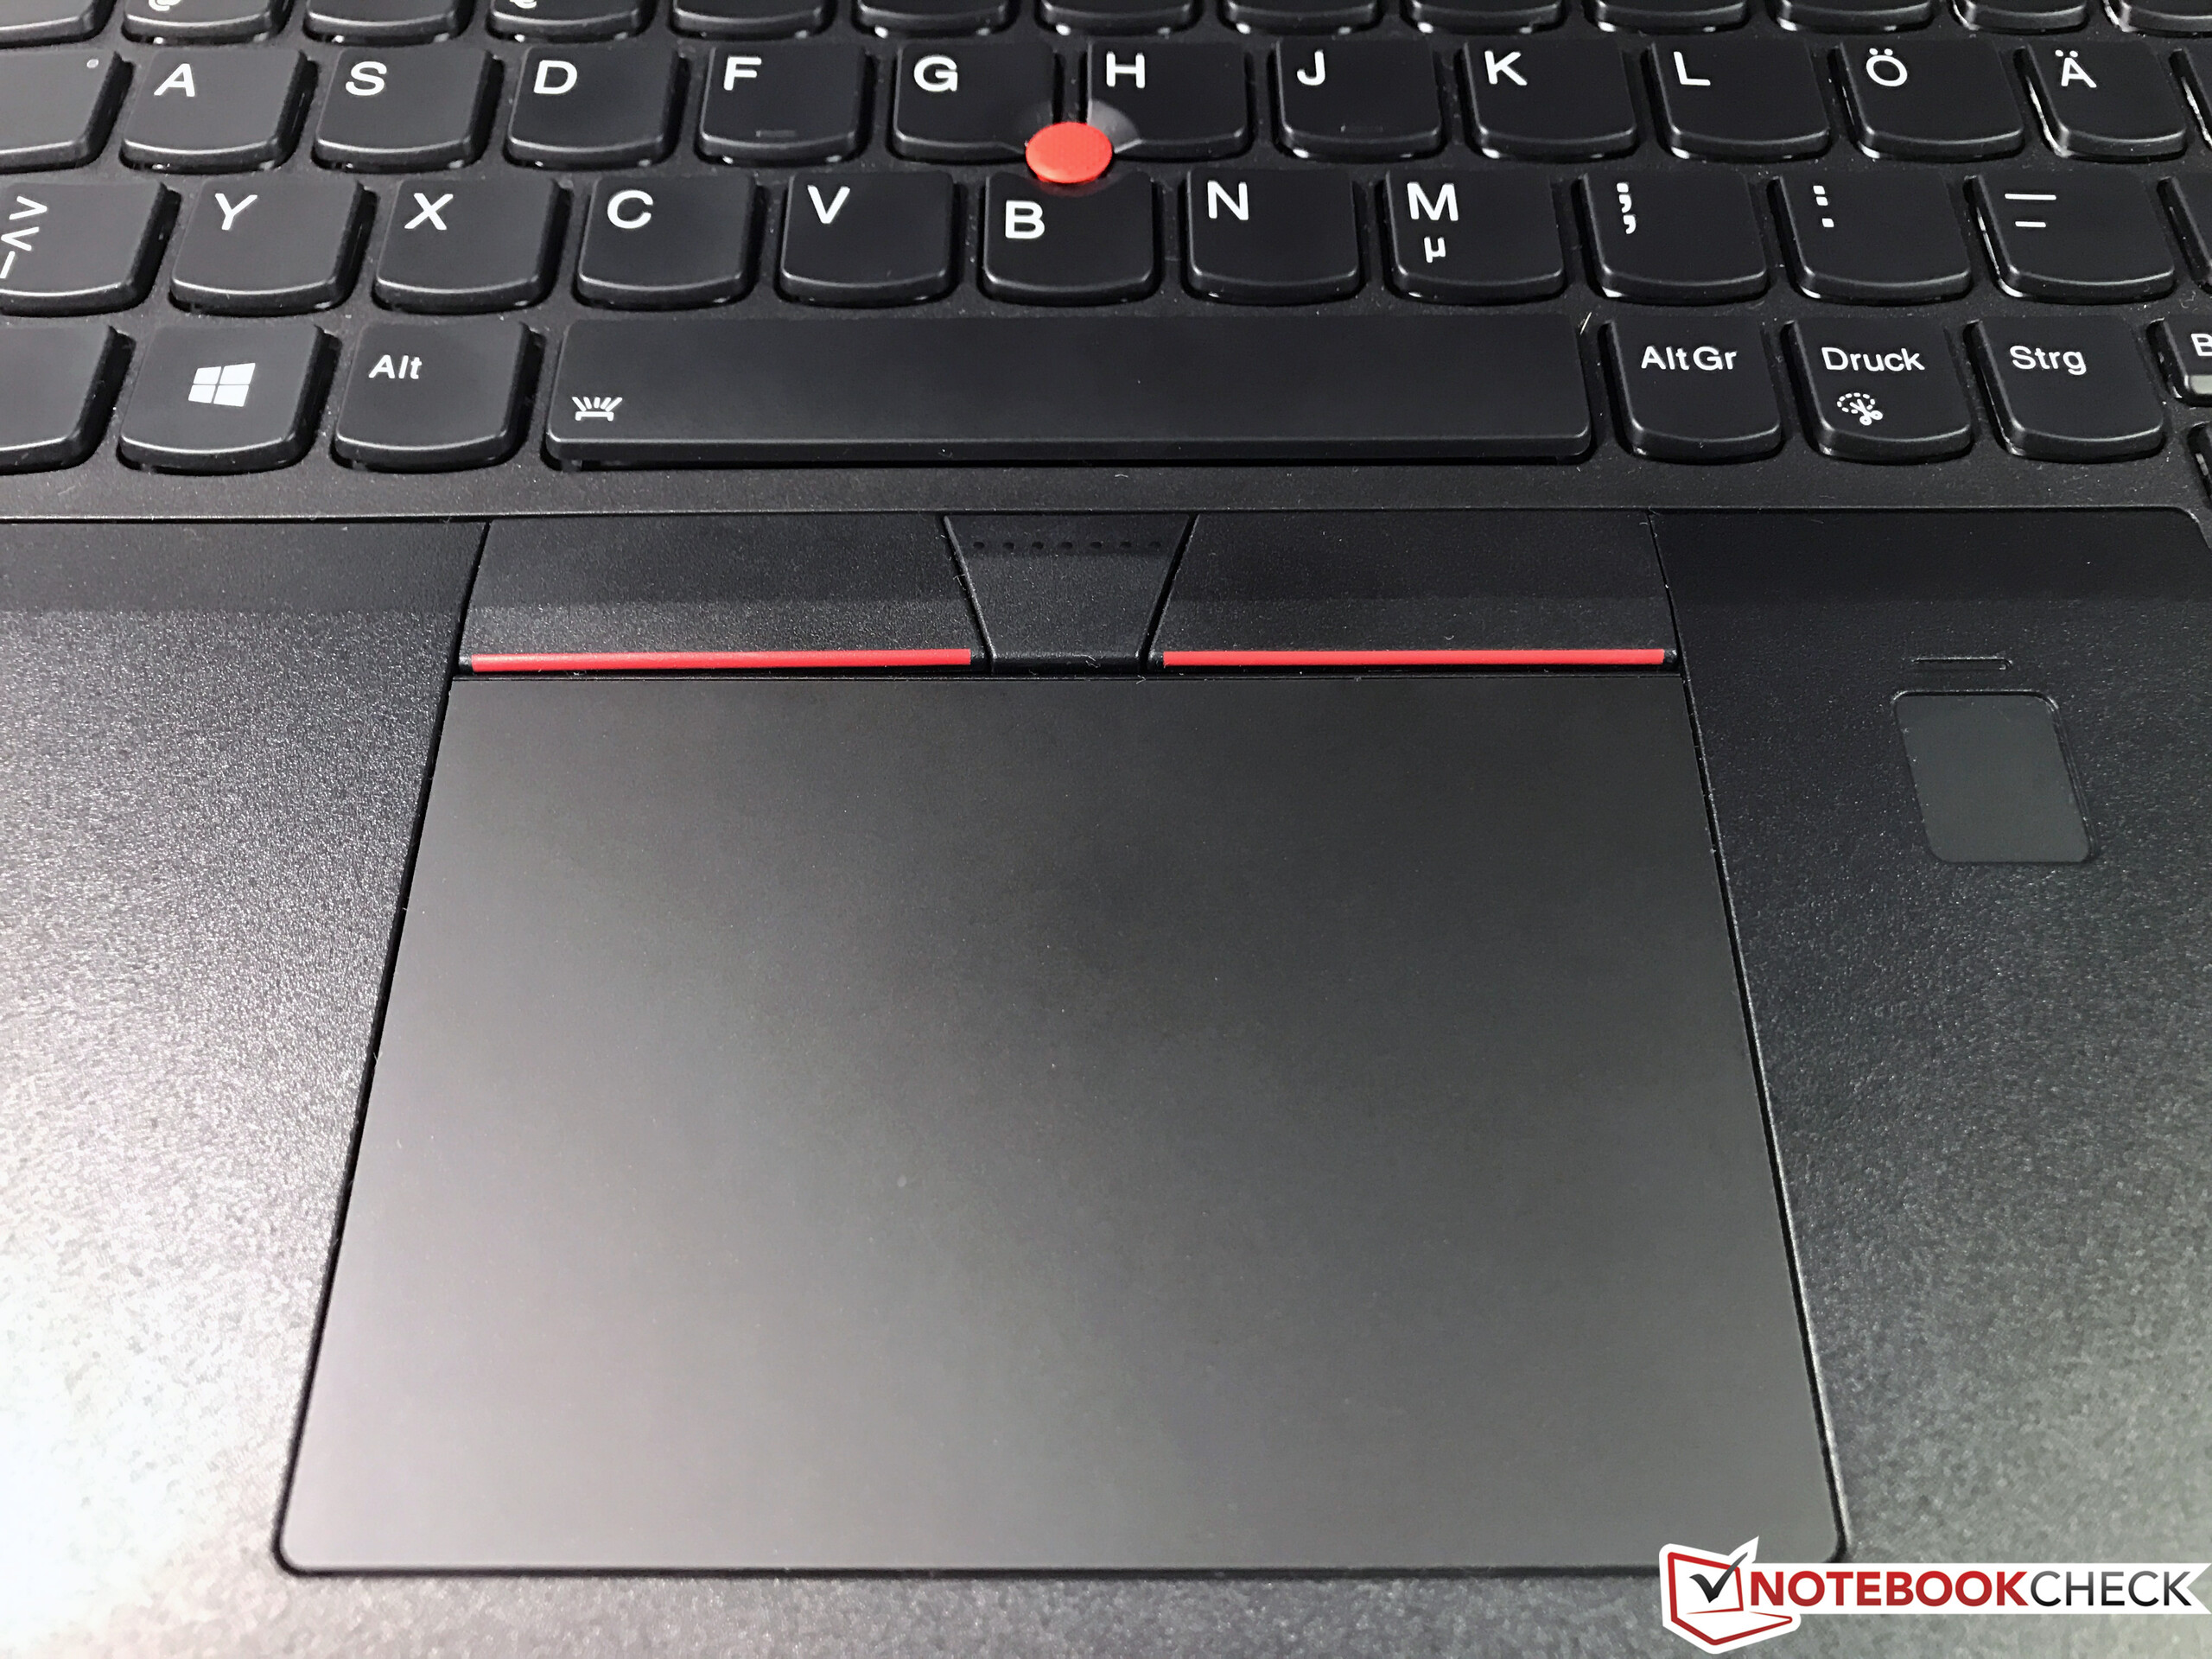
(±) I poggiapolsi e il touchpad possono diventare molto caldi al tatto con un massimo di 39 °C / 102.2 F.
(-) La temperatura media della zona del palmo della mano di dispositivi simili e'stata di 27.8 °C / 82 F (-11.2 °C / -20.2 F).
| Lenovo ThinkPad P51s 20HB000SGE i7-7600U, Quadro M520 | Lenovo ThinkPad P50s-20FKS00400 6500U, Quadro M500M | Dell Precision 5520 UHD E3-1505M v6, Quadro M1200 | HP ZBook Studio G3 6820HQ, Quadro M1000M | Lenovo ThinkPad T570-20HAS01E00 i7-7500U, GeForce 940MX | |
|---|---|---|---|---|---|
| Heat | 3% | 6% | -33% | 9% | |
| Maximum Upper Side * (°C) | 43.6 | 44.2 -1% | 51.6 -18% | 69.8 -60% | 43.1 1% |
| Maximum Bottom * (°C) | 60.8 | 57.8 5% | 43.6 28% | 77.3 -27% | 55.4 9% |
| Idle Upper Side * (°C) | 27.3 | 26.4 3% | 26.6 3% | 37.8 -38% | 24.3 11% |
| Idle Bottom * (°C) | 29 | 28.1 3% | 26.2 10% | 31.4 -8% | 25 14% |
* ... Meglio usare valori piccoli
Lenovo ThinkPad P51s 20HB000SGE analisi audio
(±) | potenza degli altiparlanti media ma buona (75.2 dB)
Bassi 100 - 315 Hz
(±) | bassi ridotti - in media 10.7% inferiori alla media
(±) | la linearità dei bassi è media (11% delta rispetto alla precedente frequenza)
Medi 400 - 2000 Hz
(+) | medi bilanciati - solo only 3.9% rispetto alla media
(±) | linearità dei medi adeguata (10.5% delta rispetto alla precedente frequenza)
Alti 2 - 16 kHz
(+) | Alti bilanciati - appena 3.1% dalla media
(±) | la linearità degli alti è media (7.1% delta rispetto alla precedente frequenza)
Nel complesso 100 - 16.000 Hz
(±) | la linearità complessiva del suono è media (15.6% di differenza rispetto alla media
Rispetto alla stessa classe
» 35% di tutti i dispositivi testati in questa classe è stato migliore, 11% simile, 54% peggiore
» Il migliore ha avuto un delta di 7%, medio di 17%, peggiore di 35%
Rispetto a tutti i dispositivi testati
» 23% di tutti i dispositivi testati in questa classe è stato migliore, 5% similare, 72% peggiore
» Il migliore ha avuto un delta di 4%, medio di 24%, peggiore di 134%
Dell Precision 5520 UHD analisi audio
(±) | potenza degli altiparlanti media ma buona (79.6 dB)
Bassi 100 - 315 Hz
(±) | bassi ridotti - in media 12.8% inferiori alla media
(±) | la linearità dei bassi è media (14.2% delta rispetto alla precedente frequenza)
Medi 400 - 2000 Hz
(+) | medi bilanciati - solo only 4% rispetto alla media
(±) | linearità dei medi adeguata (9.9% delta rispetto alla precedente frequenza)
Alti 2 - 16 kHz
(+) | Alti bilanciati - appena 3.3% dalla media
(±) | la linearità degli alti è media (12% delta rispetto alla precedente frequenza)
Nel complesso 100 - 16.000 Hz
(±) | la linearità complessiva del suono è media (16.7% di differenza rispetto alla media
Rispetto alla stessa classe
» 46% di tutti i dispositivi testati in questa classe è stato migliore, 9% simile, 45% peggiore
» Il migliore ha avuto un delta di 7%, medio di 17%, peggiore di 35%
Rispetto a tutti i dispositivi testati
» 29% di tutti i dispositivi testati in questa classe è stato migliore, 7% similare, 64% peggiore
» Il migliore ha avuto un delta di 4%, medio di 24%, peggiore di 134%
| Off / Standby | |
| Idle | |
| Sotto carico |
|
Leggenda:
min: | |
| Lenovo ThinkPad P51s 20HB000SGE i7-7600U, Quadro M520 | Lenovo ThinkPad P50s-20FKS00400 6500U, Quadro M500M | Dell Precision 5520 UHD E3-1505M v6, Quadro M1200 | HP ZBook Studio G3 6820HQ, Quadro M1000M | Lenovo ThinkPad T570-20HAS01E00 i7-7500U, GeForce 940MX | |
|---|---|---|---|---|---|
| Power Consumption | 22% | -44% | -42% | 10% | |
| Idle Minimum * (Watt) | 5.8 | 4.3 26% | 8.9 -53% | 8.7 -50% | 4.7 19% |
| Idle Average * (Watt) | 10.4 | 9.7 7% | 13.6 -31% | 14.2 -37% | 9.9 5% |
| Idle Maximum * (Watt) | 13.5 | 10.2 24% | 14.1 -4% | 14.4 -7% | 10.9 19% |
| Load Average * (Watt) | 62.4 | 45.7 27% | 100.3 -61% | 85.6 -37% | 56.1 10% |
| Load Maximum * (Watt) | 73.1 | 55.8 24% | 126.3 -73% | 129.7 -77% | 75 -3% |
| Witcher 3 ultra * (Watt) | 100.2 |
* ... Meglio usare valori piccoli
| Lenovo ThinkPad P51s 20HB000SGE i7-7600U, Quadro M520, 104 Wh | Lenovo ThinkPad P50s-20FKS00400 6500U, Quadro M500M, 67 Wh | Dell Precision 5520 UHD E3-1505M v6, Quadro M1200, 97 Wh | HP ZBook Studio G3 6820HQ, Quadro M1000M, 64 Wh | Lenovo ThinkPad T570-20HAS01E00 i7-7500U, GeForce 940MX, 56 Wh | |
|---|---|---|---|---|---|
| Autonomia della batteria | -39% | -67% | -72% | -42% | |
| Reader / Idle (h) | 26.4 | 18.5 -30% | 12.1 -54% | 8.5 -68% | 13.3 -50% |
| H.264 (h) | 11.7 | 9 -23% | 3.8 -68% | 8.1 -31% | |
| WiFi v1.3 (h) | 11.9 | 6.8 -43% | 4.2 -65% | 3.5 -71% | 6.9 -42% |
| Load (h) | 5.4 | 2.2 -59% | 1 -81% | 1.1 -80% | 2.9 -46% |
Pro
Contro
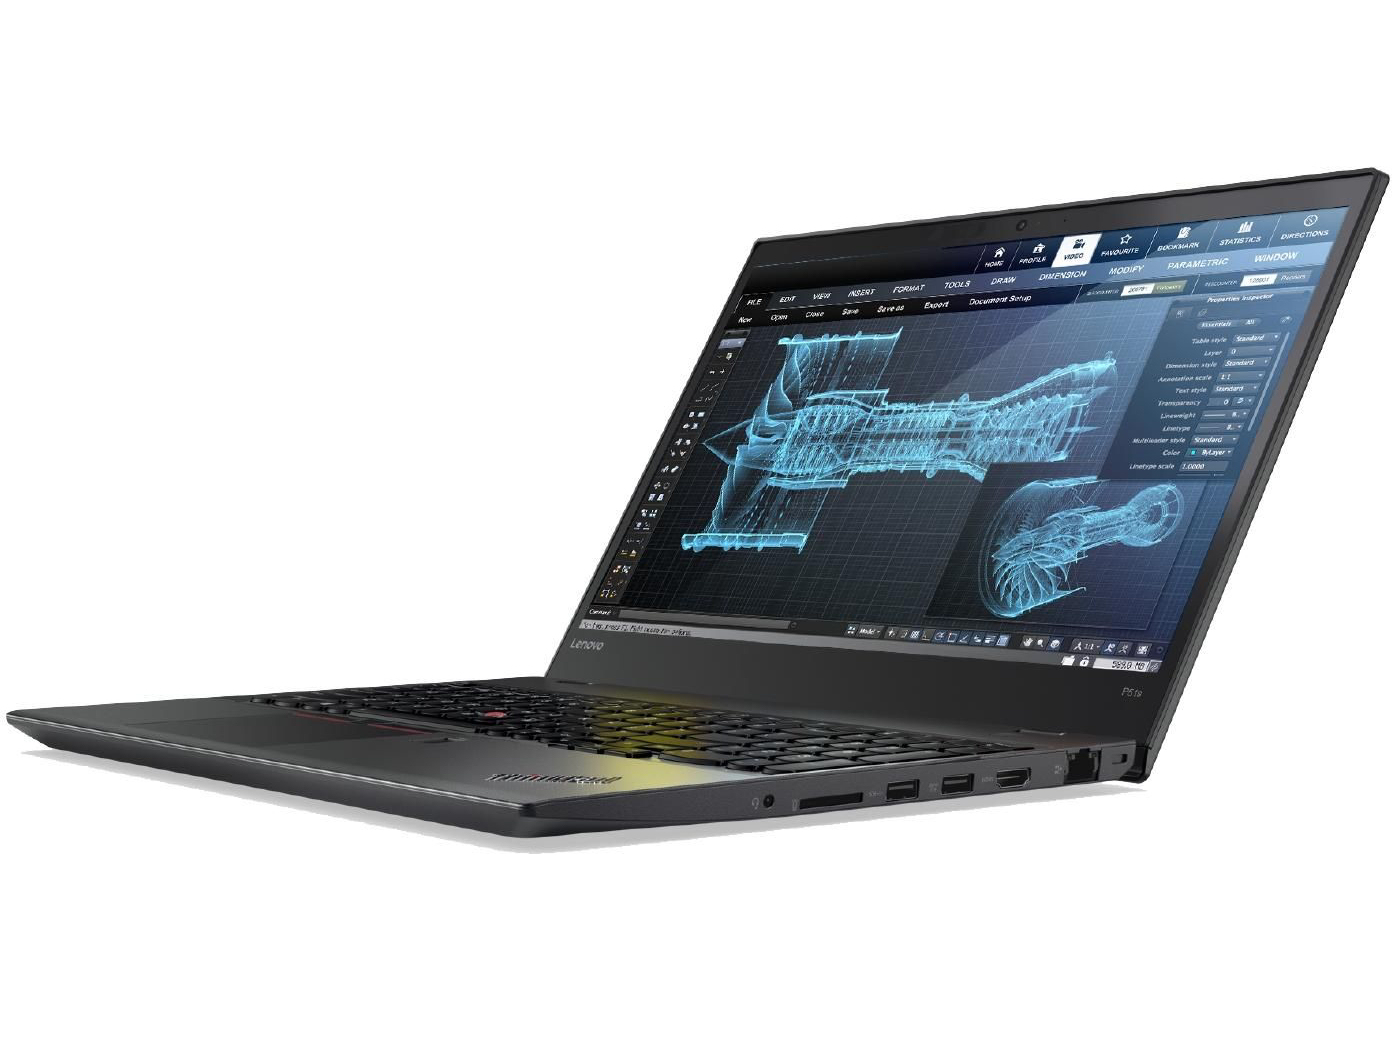
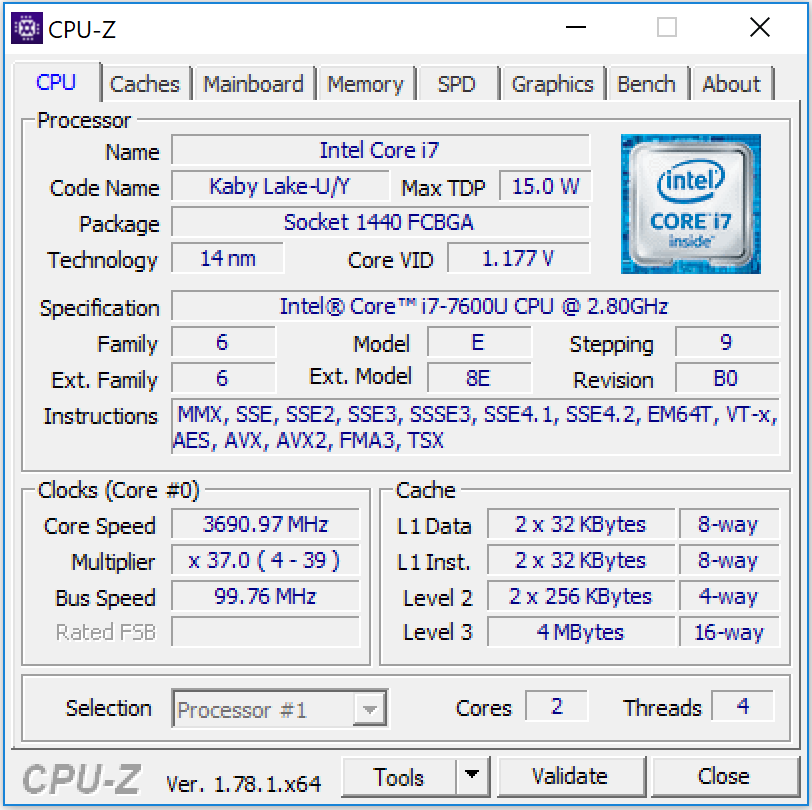
Lenovo realizza una workstation compatta mobile da 15,6" con la ThinkPad P51s. Tuttavia, gli acquirenti dovrebbero sapere che le prestazioni della workstation sono limitate a causa del processore ULV. Una workstation con un processore quad-core sarebbe stata più indicata per avere prestazioni maggiori - come ad esempio, il ThinkPad P51.
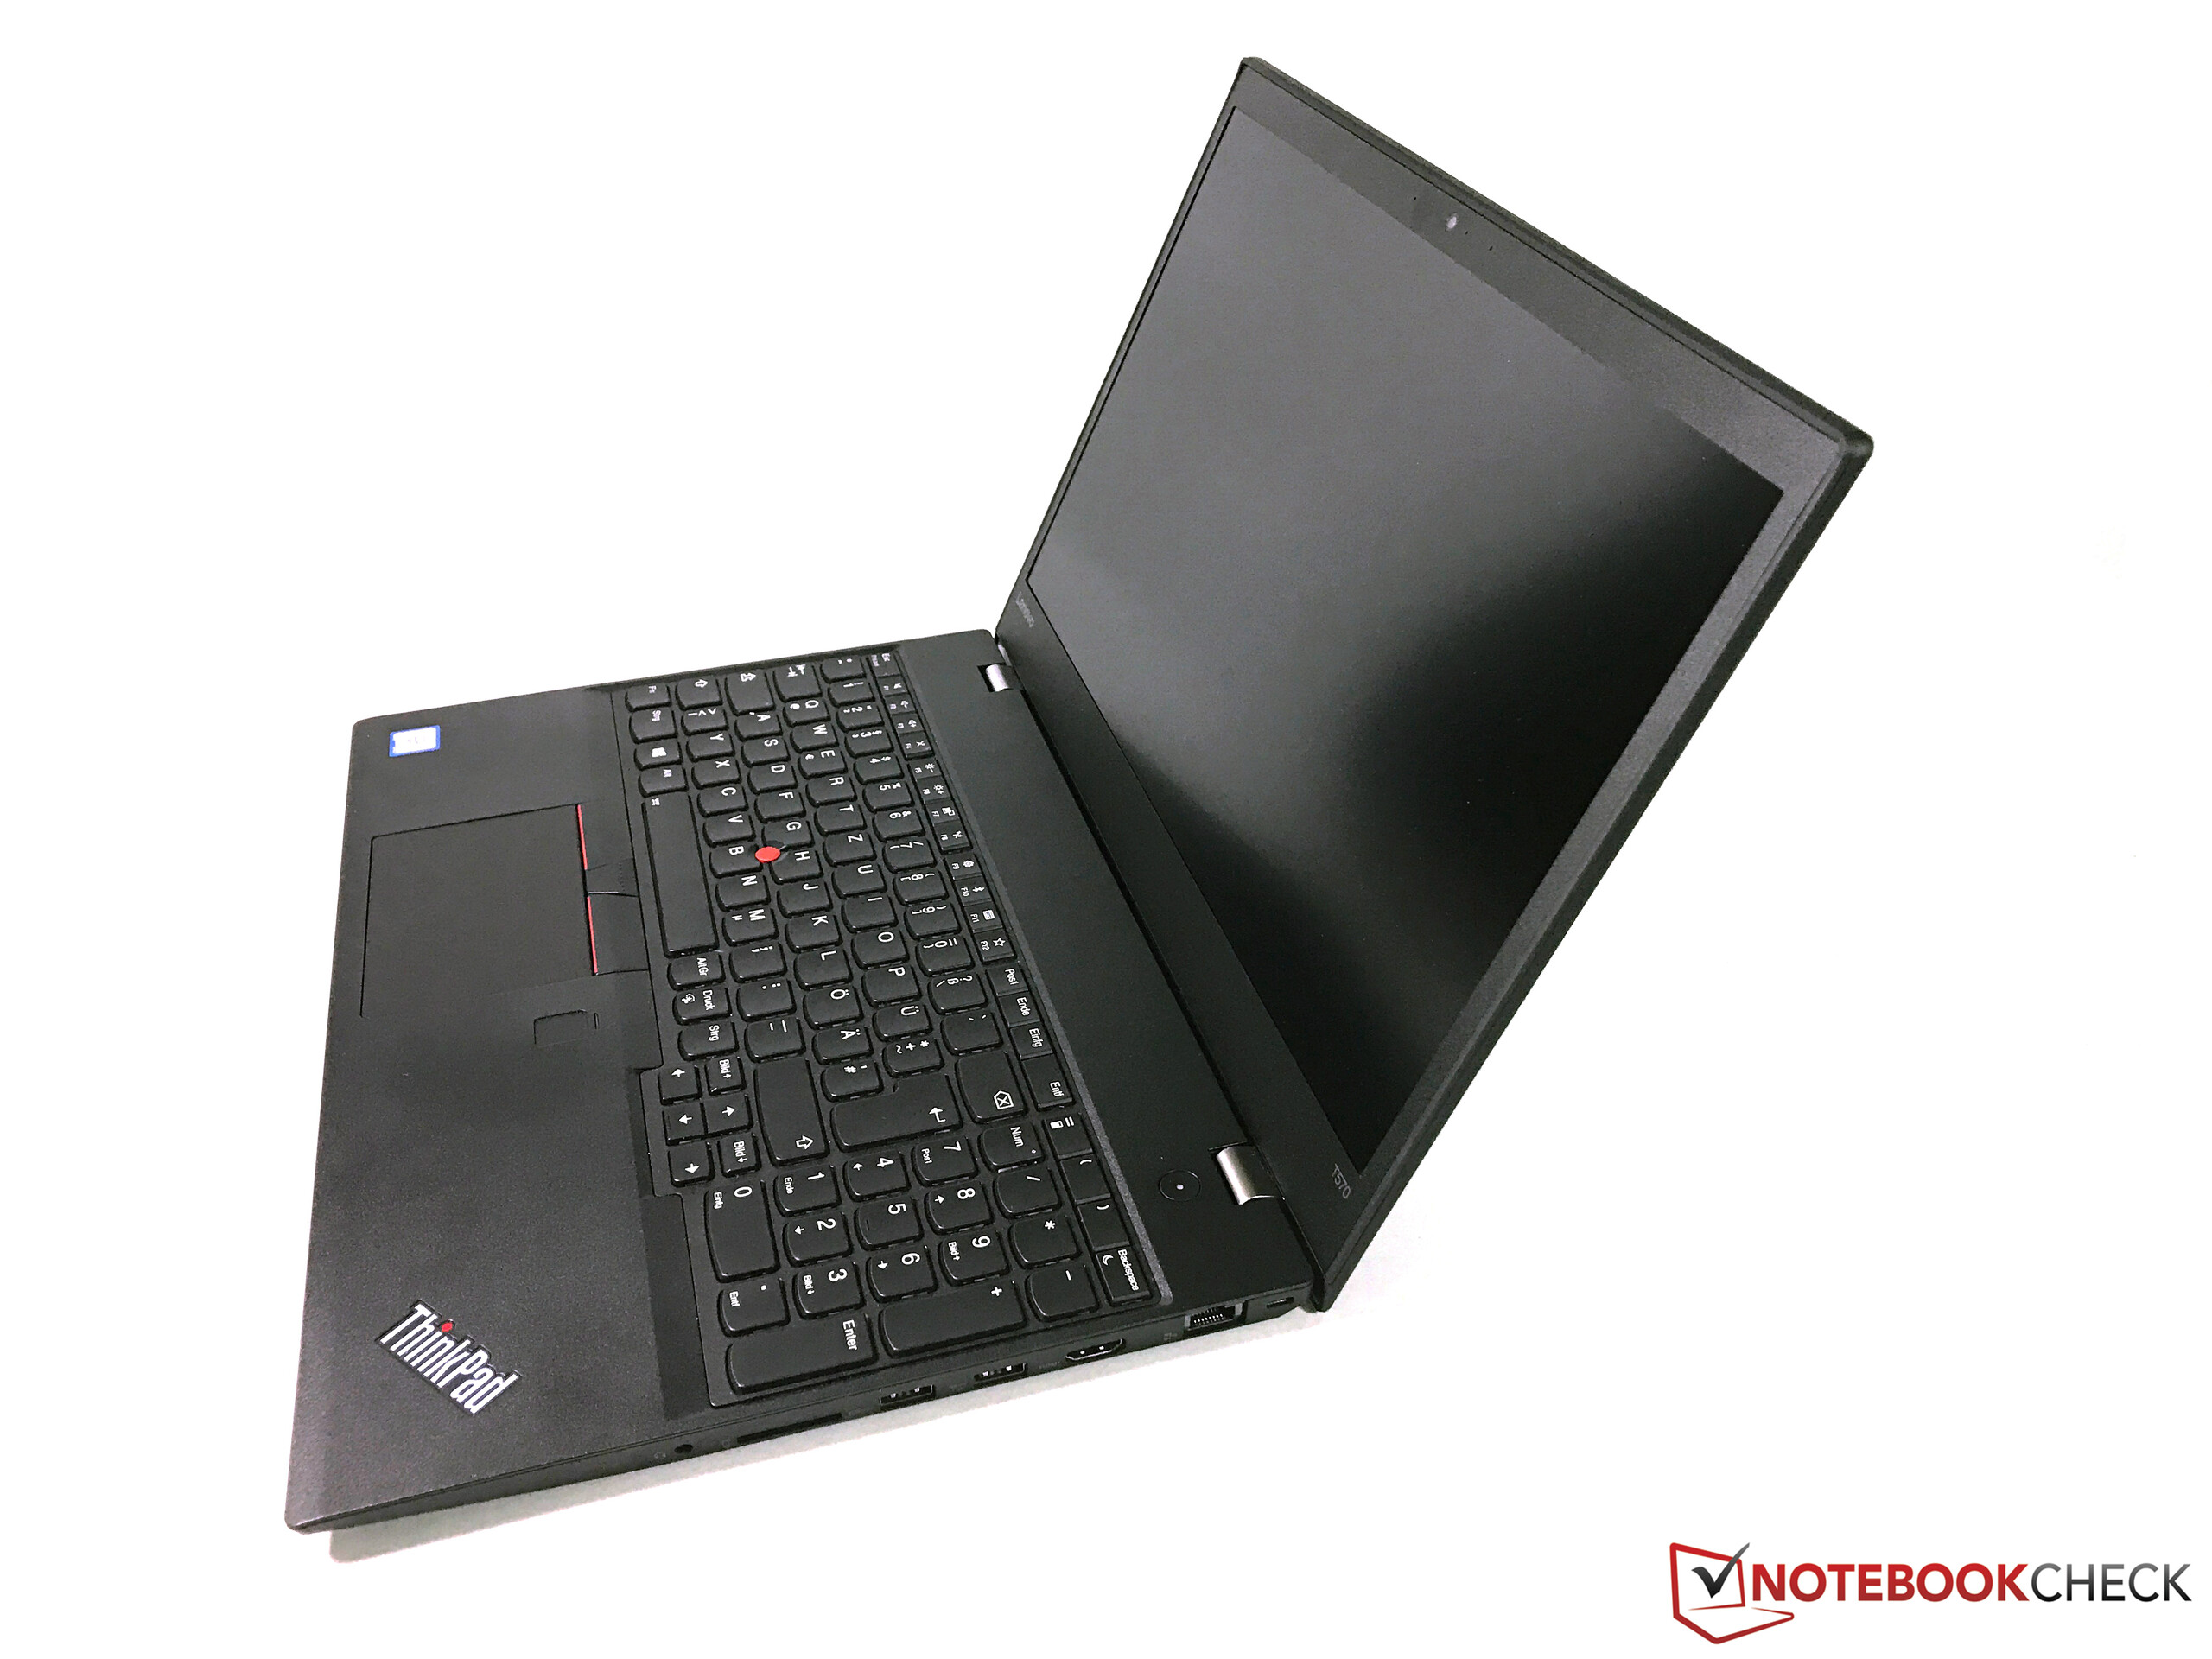
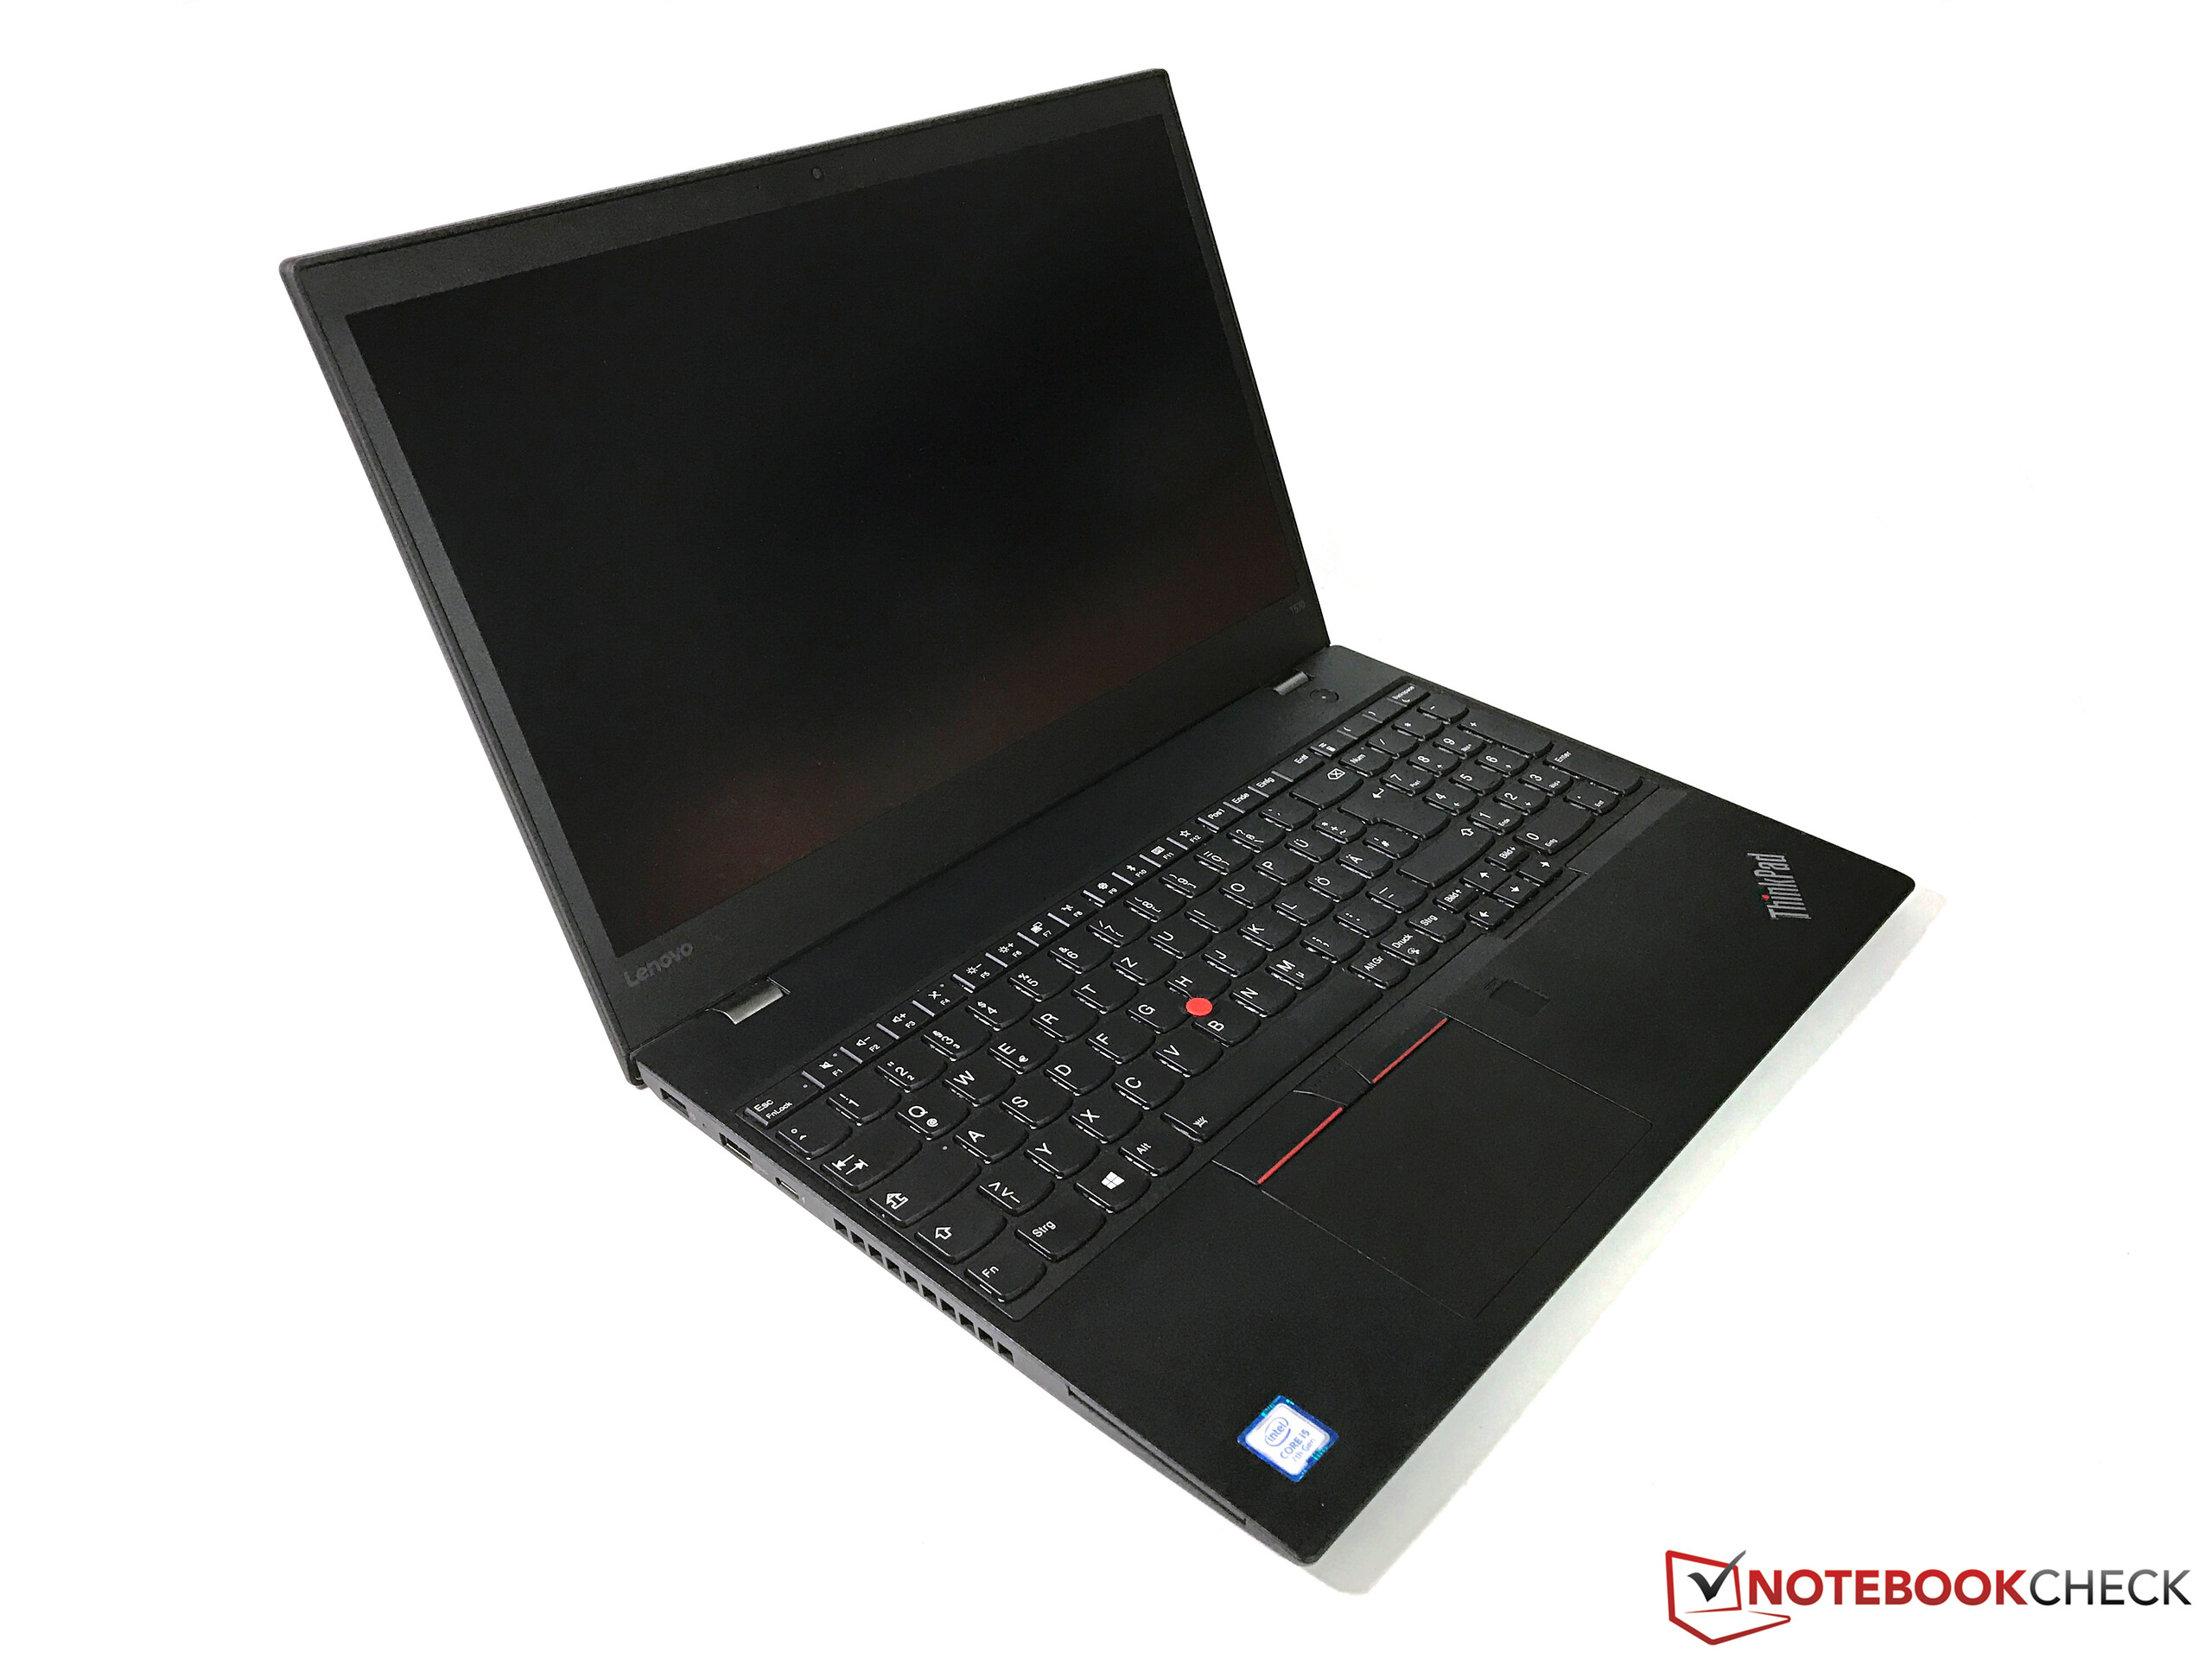
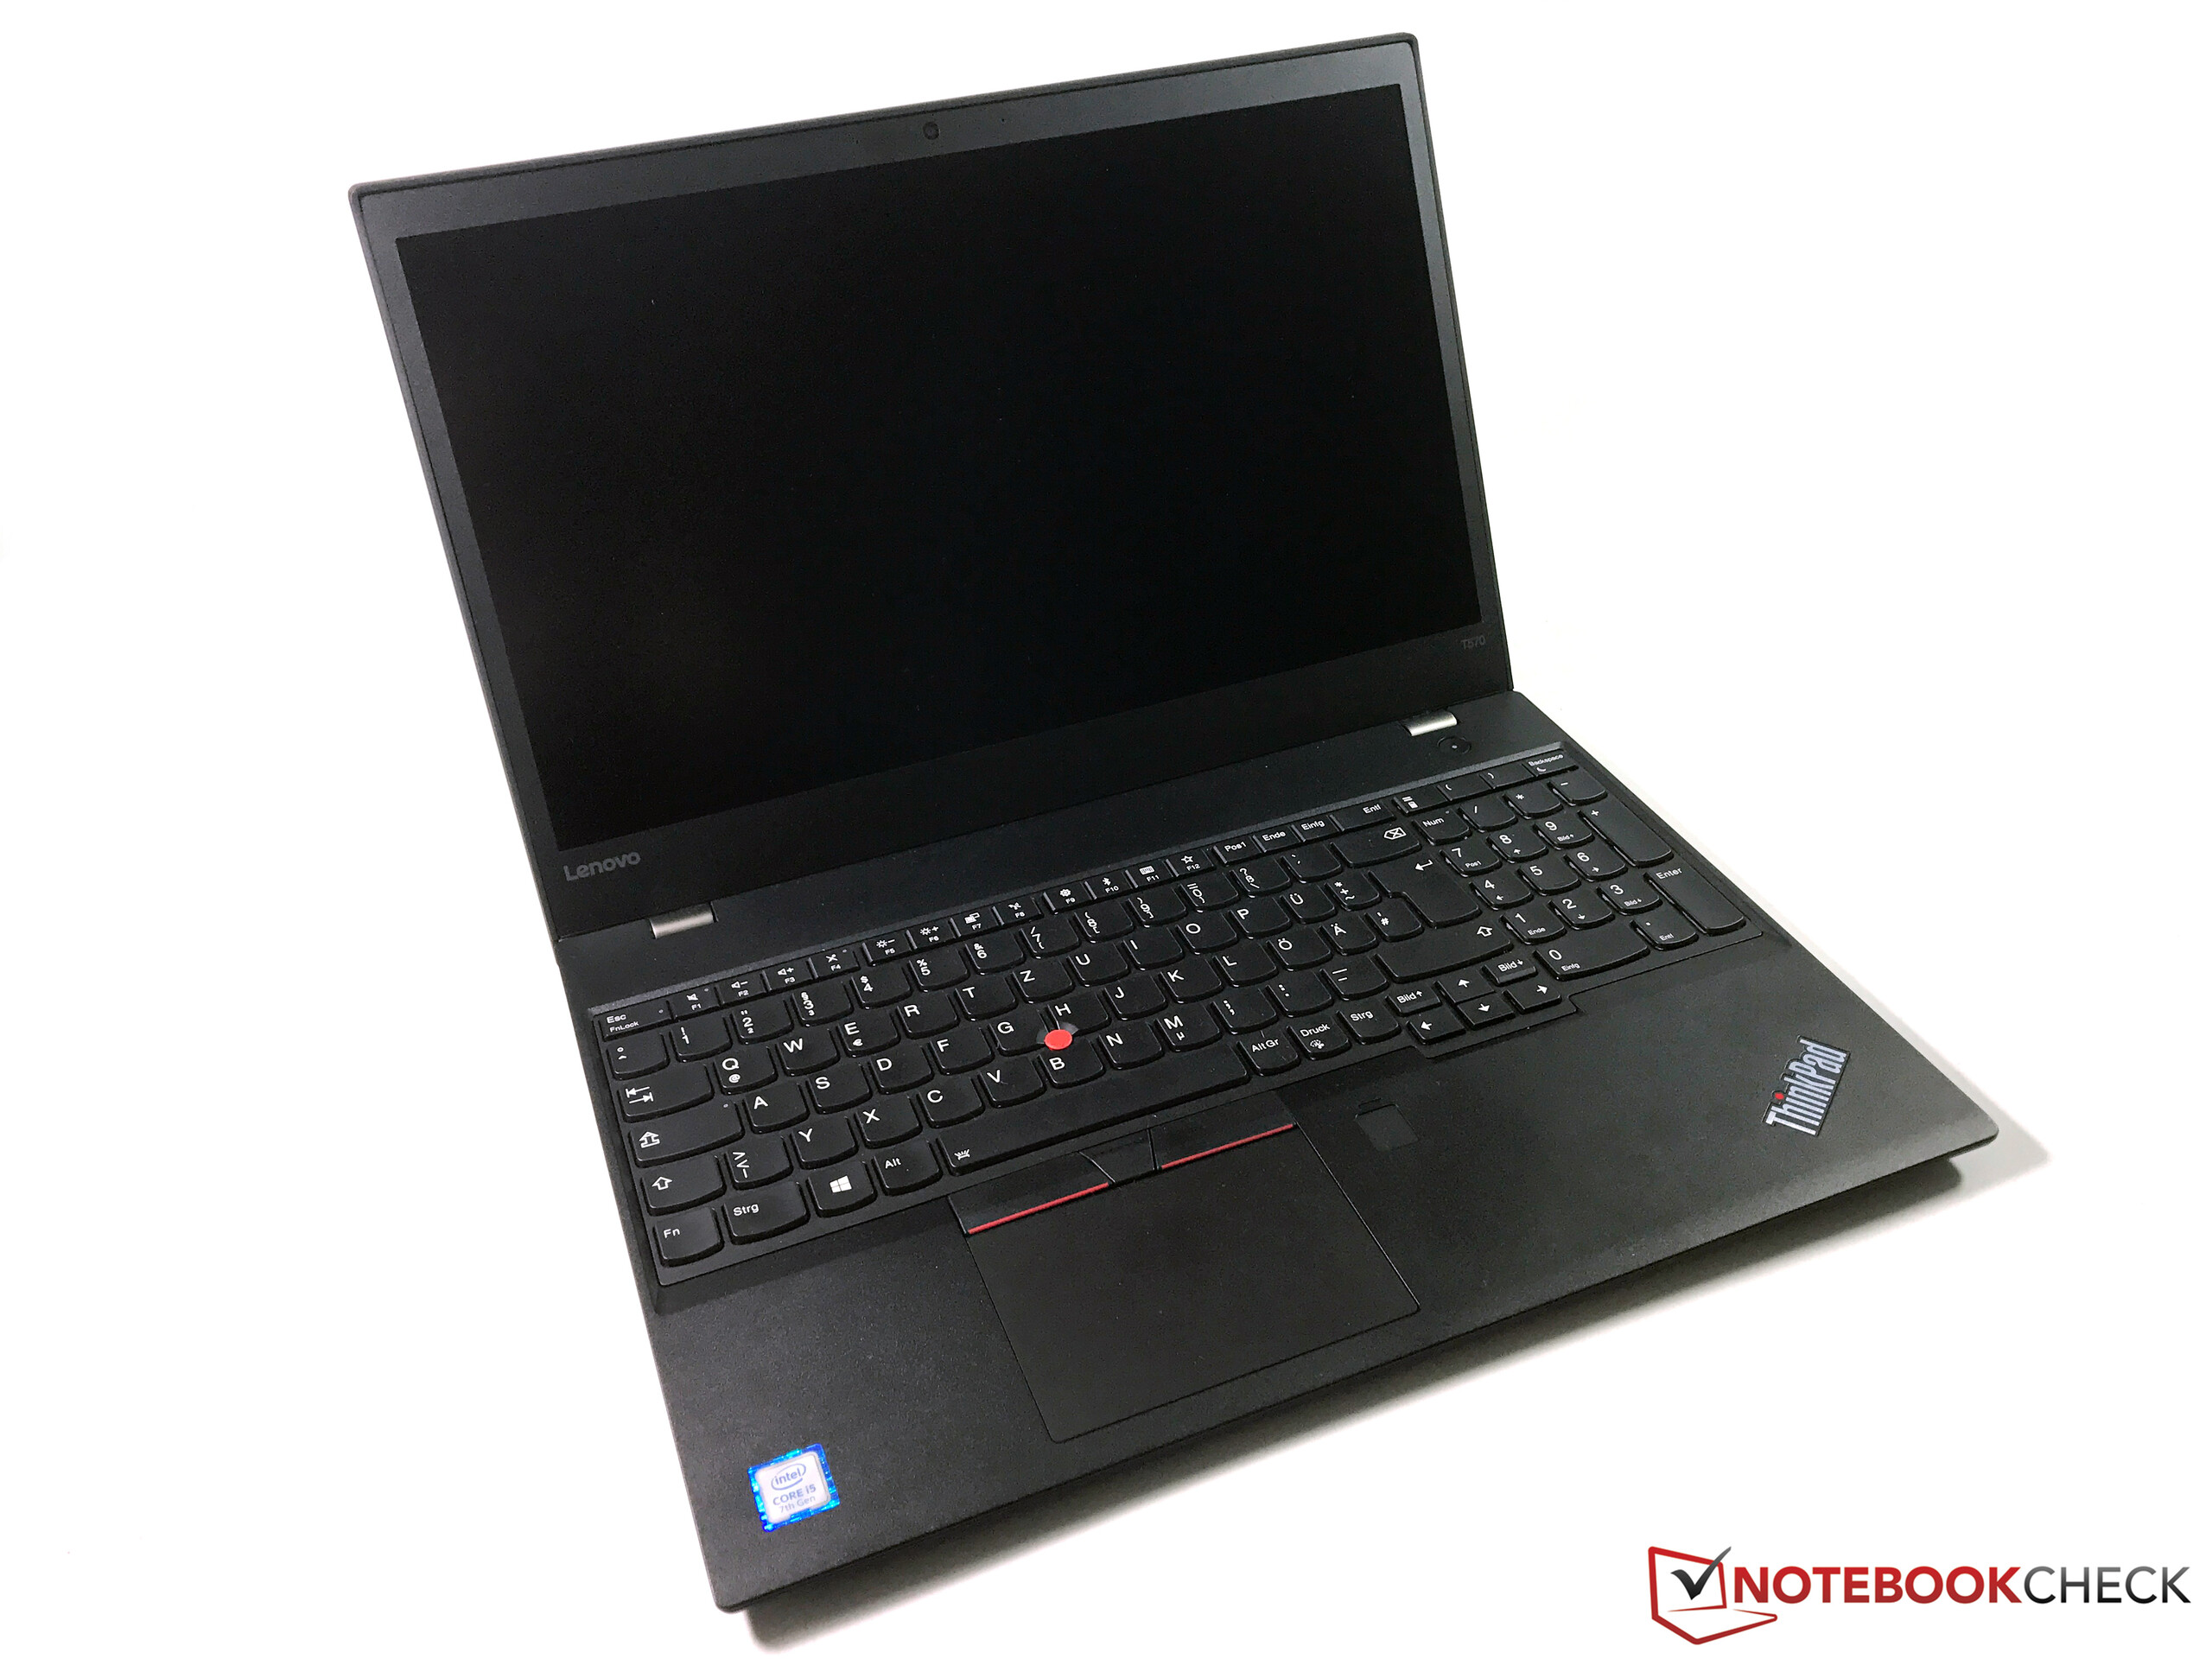
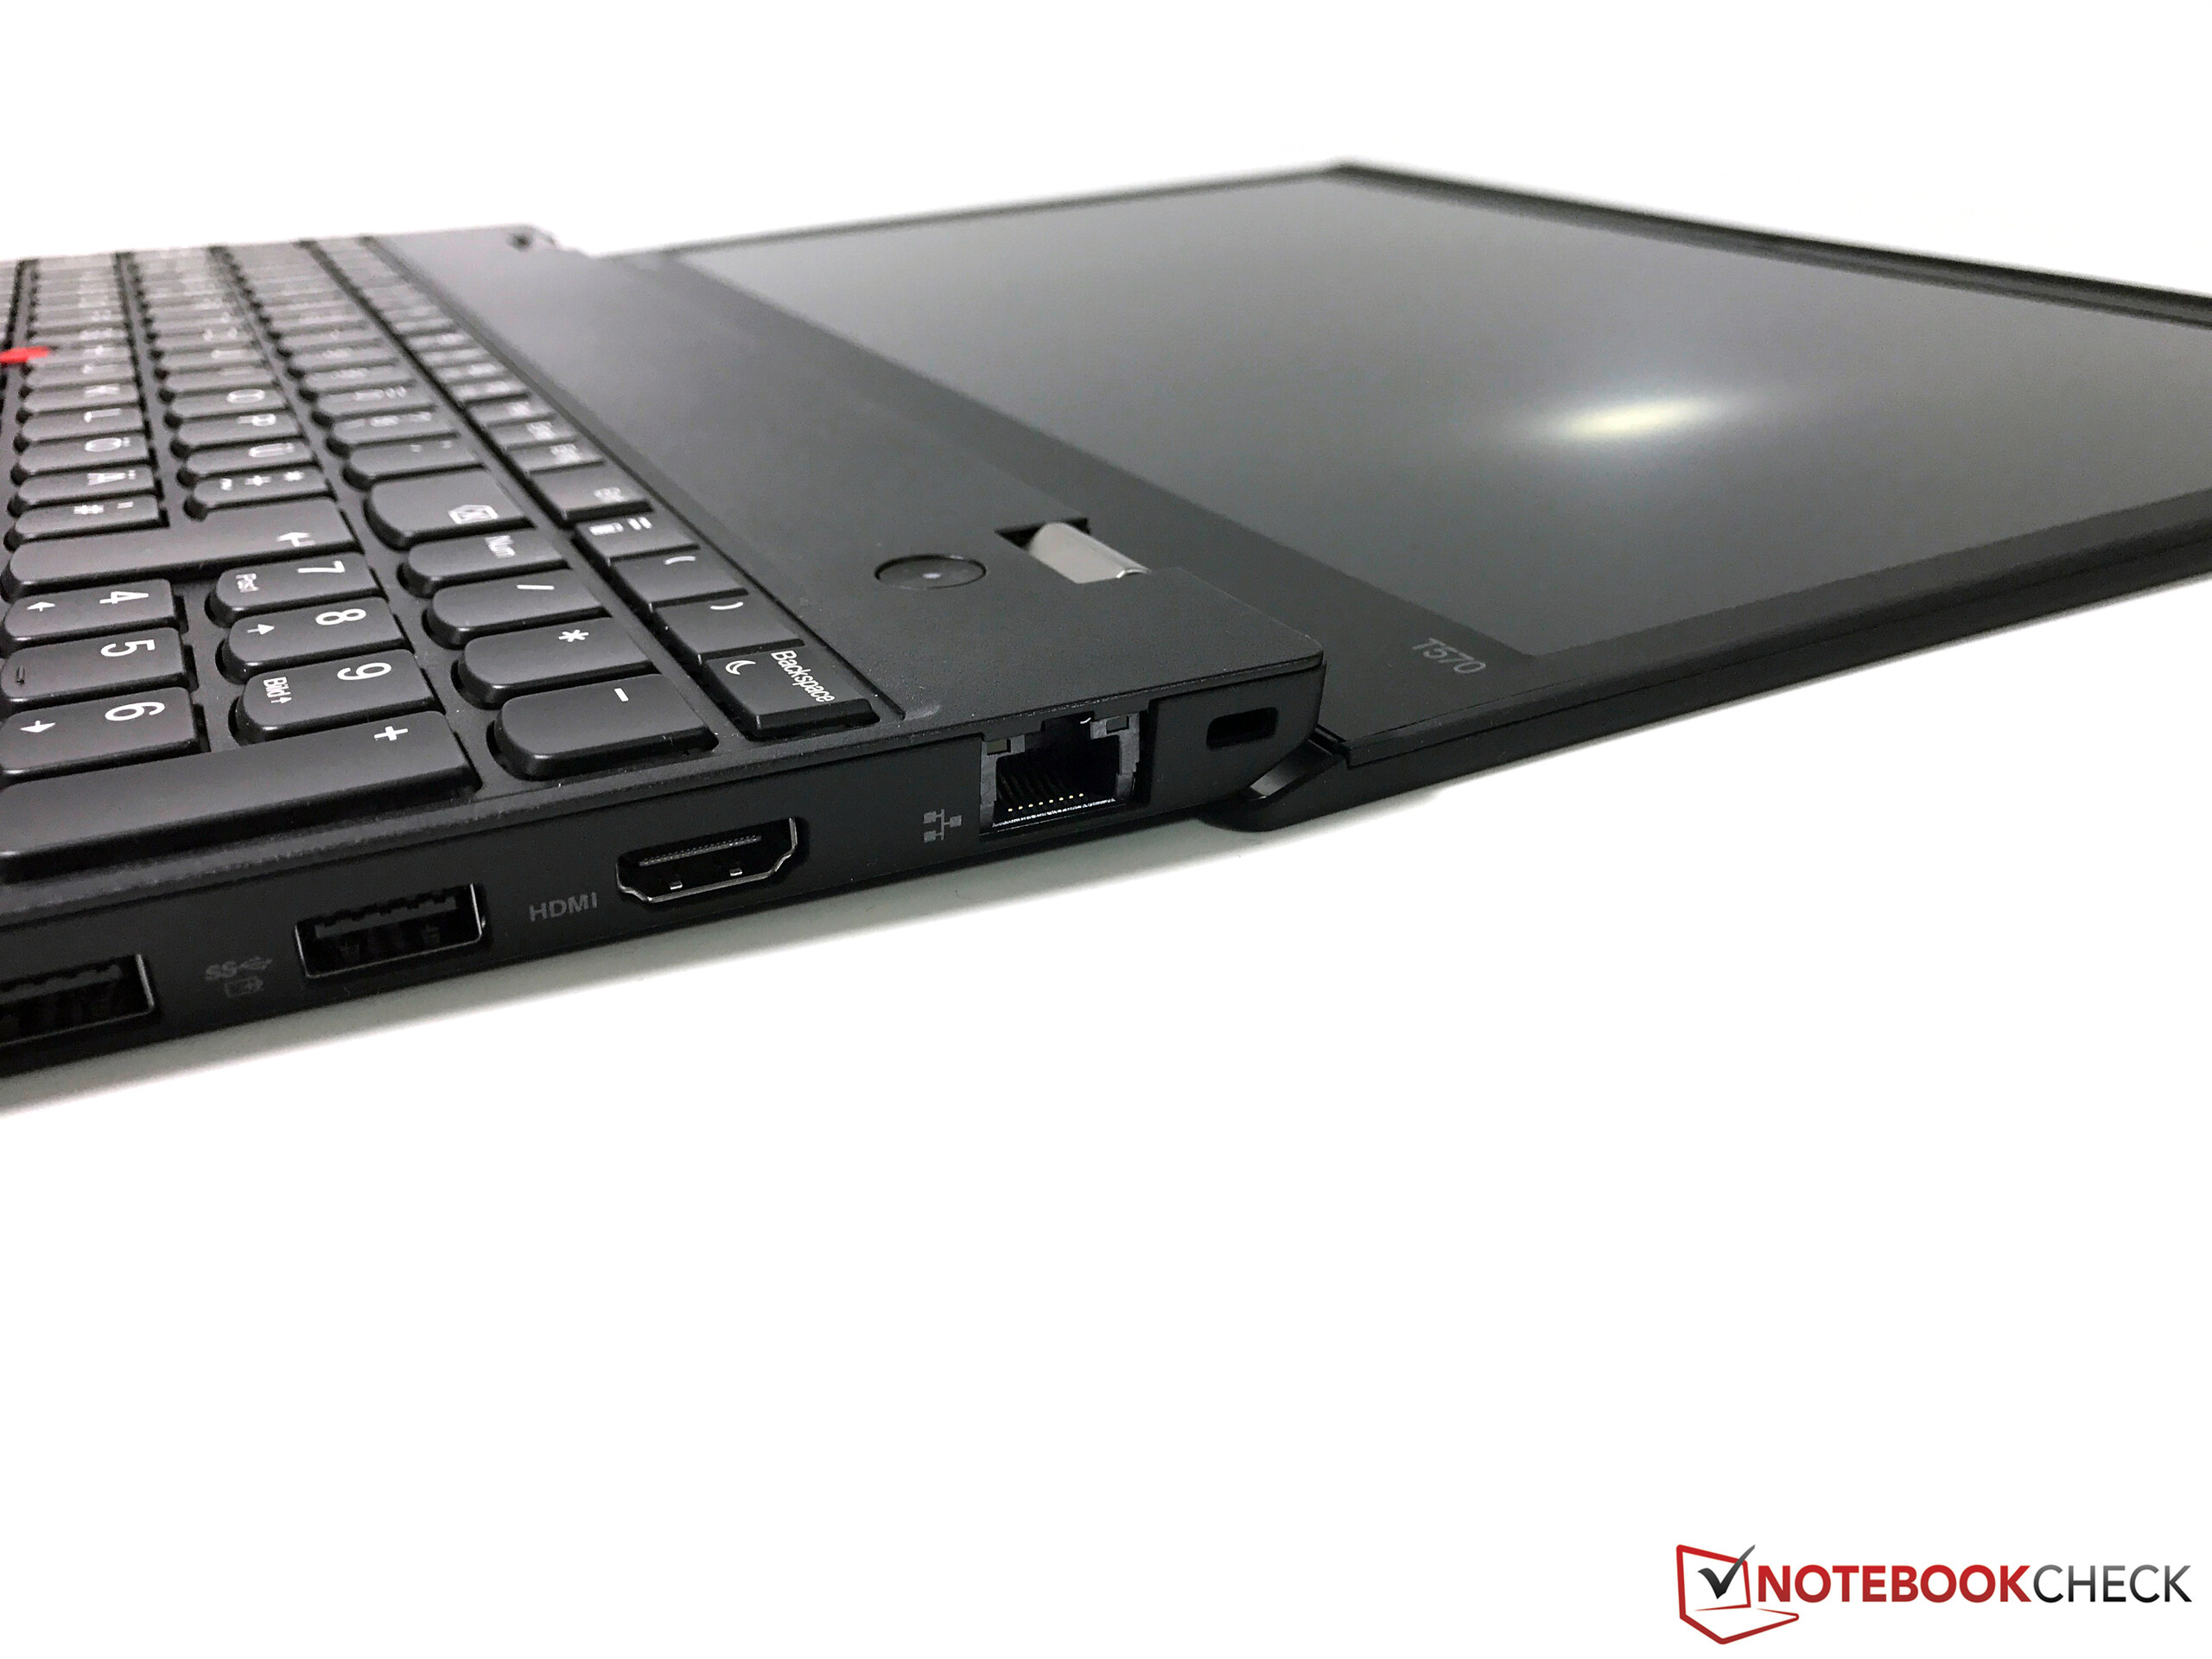
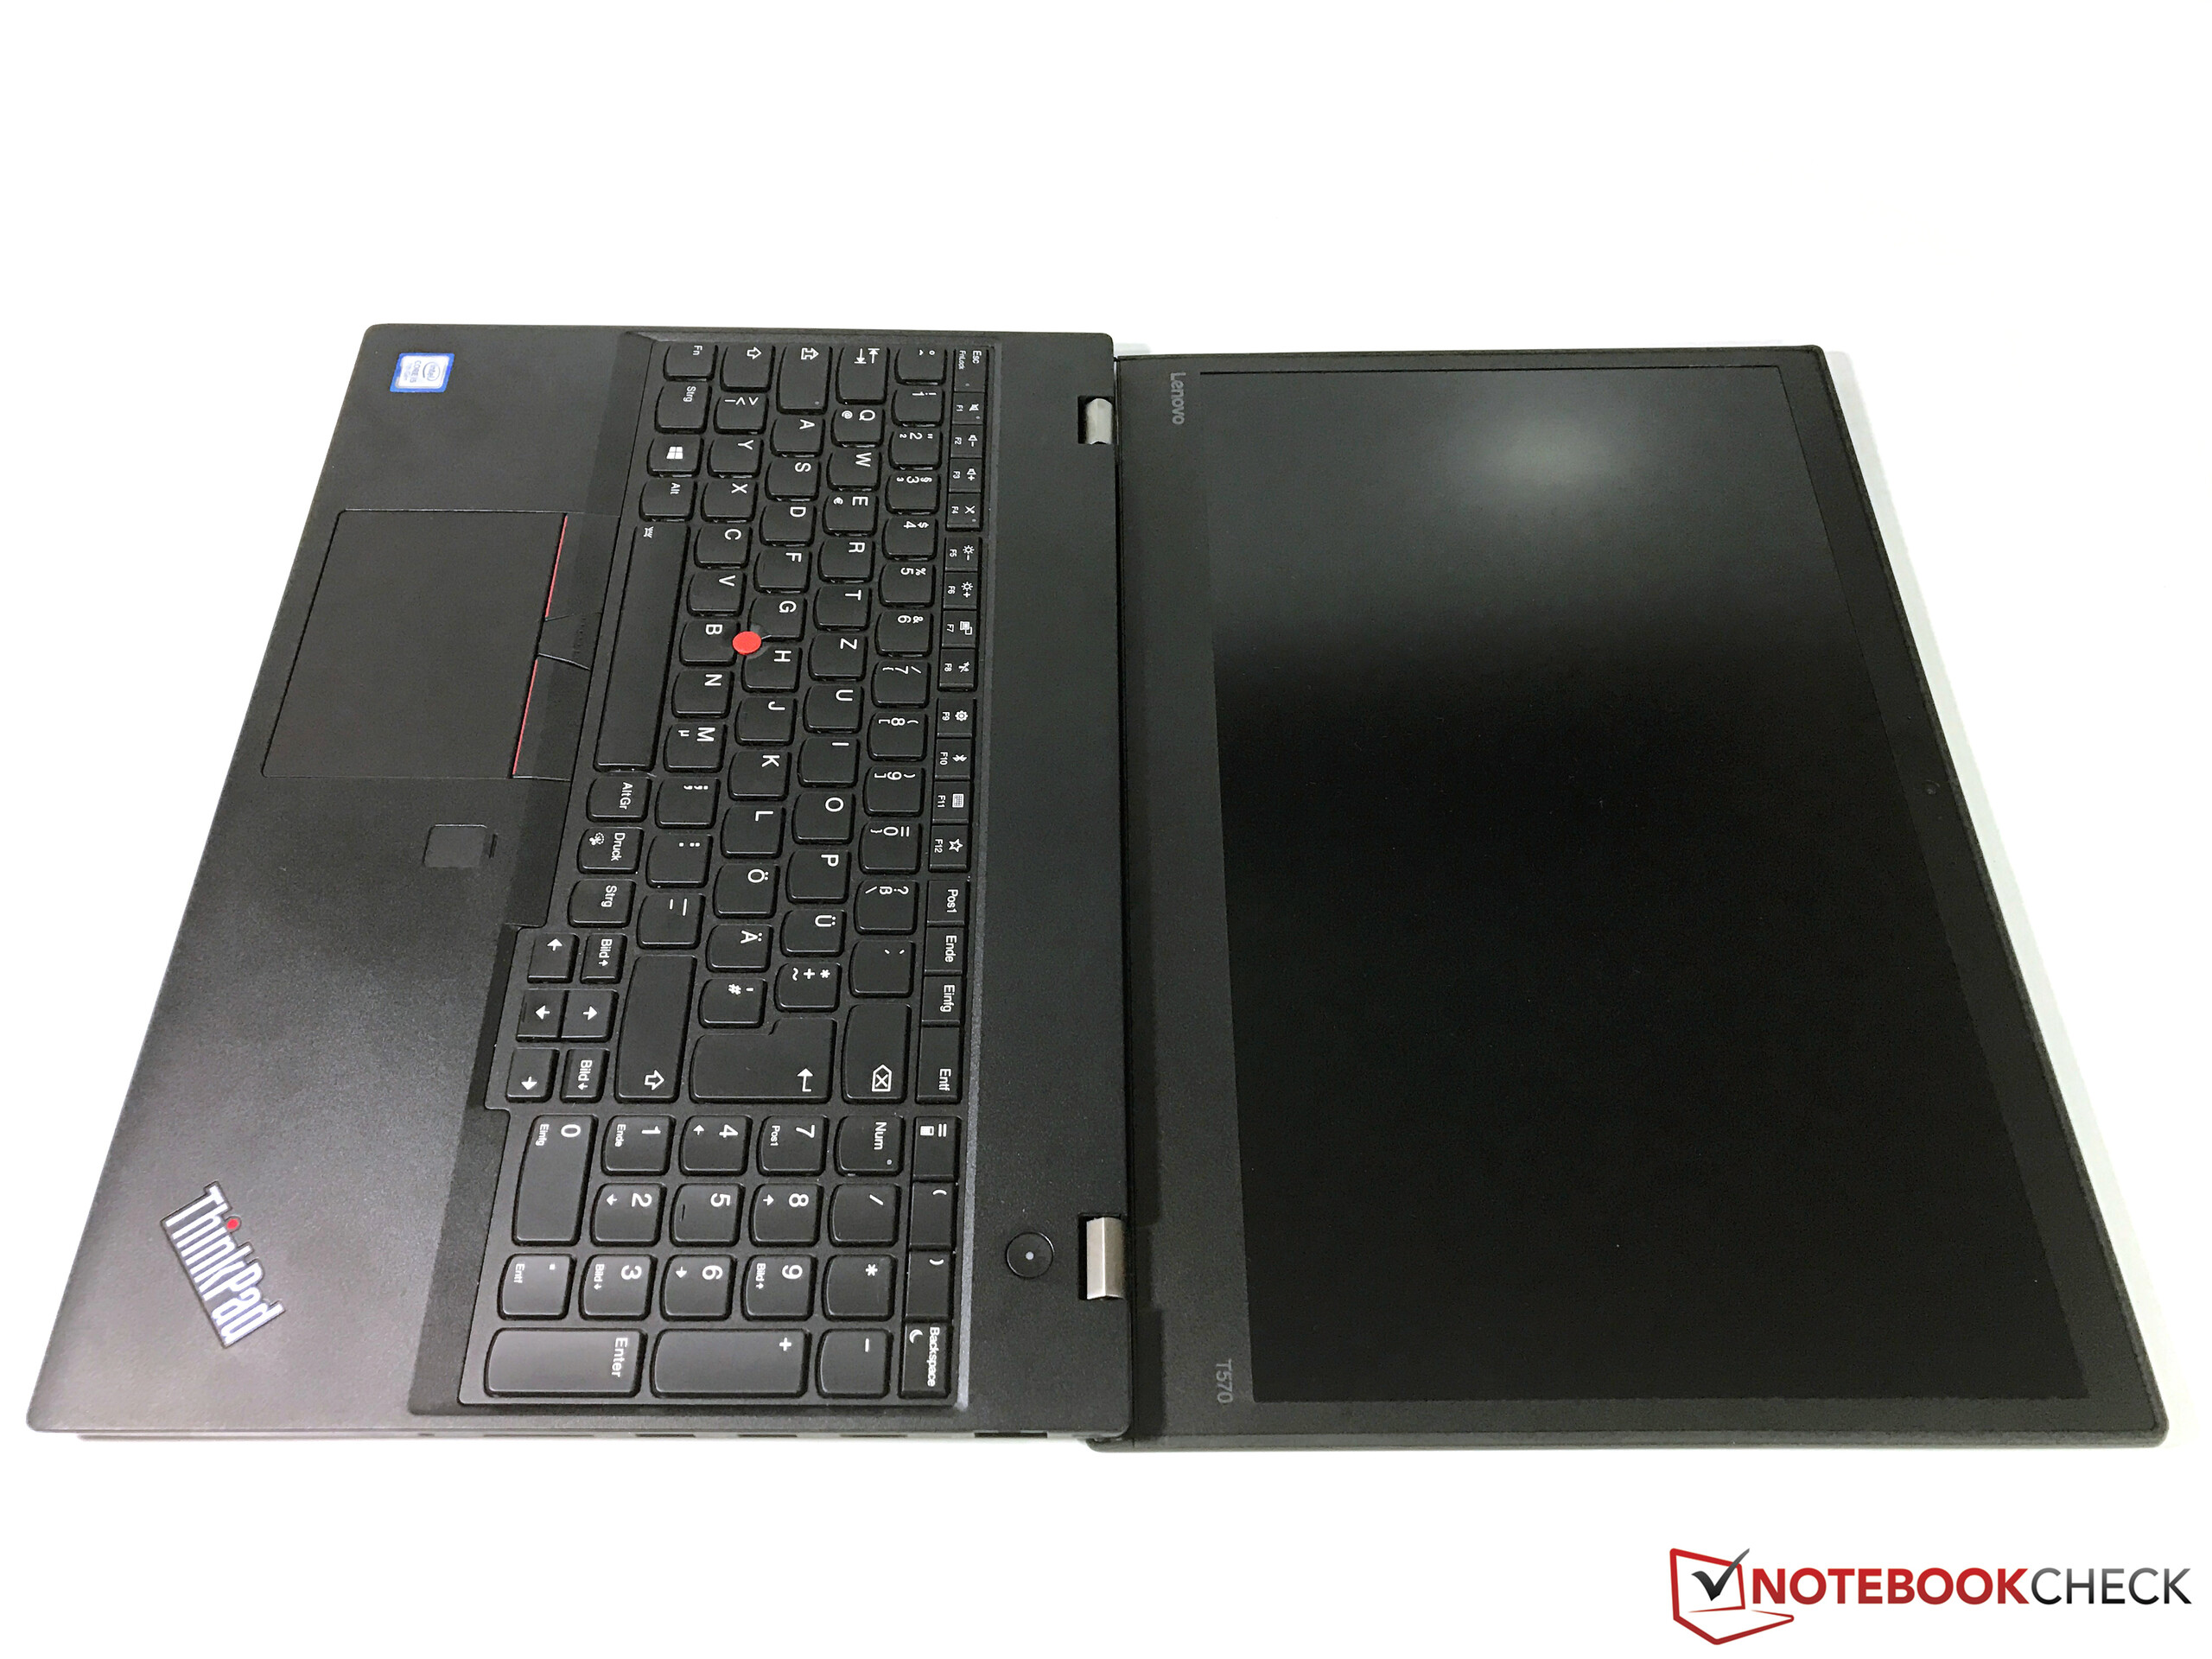
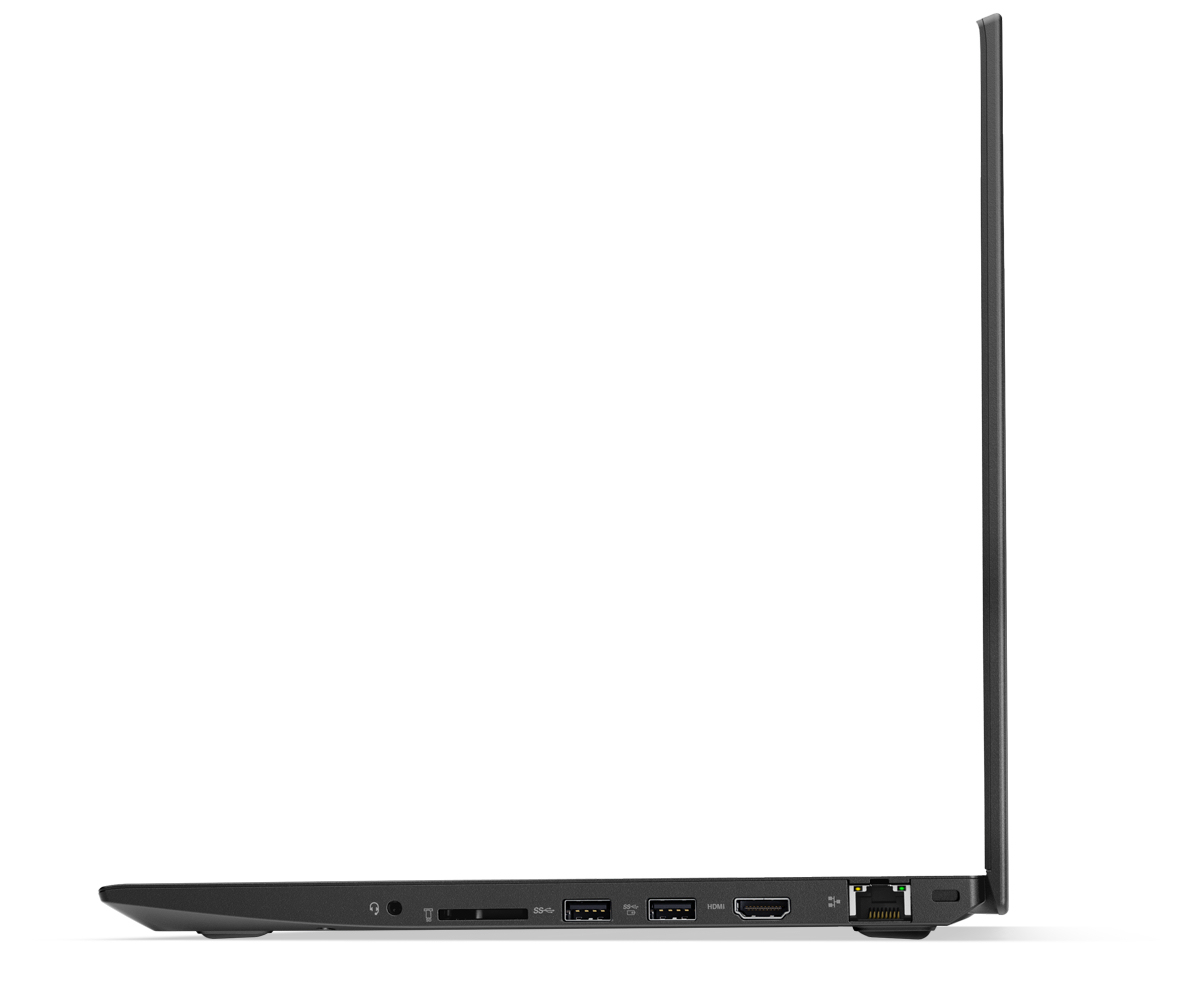
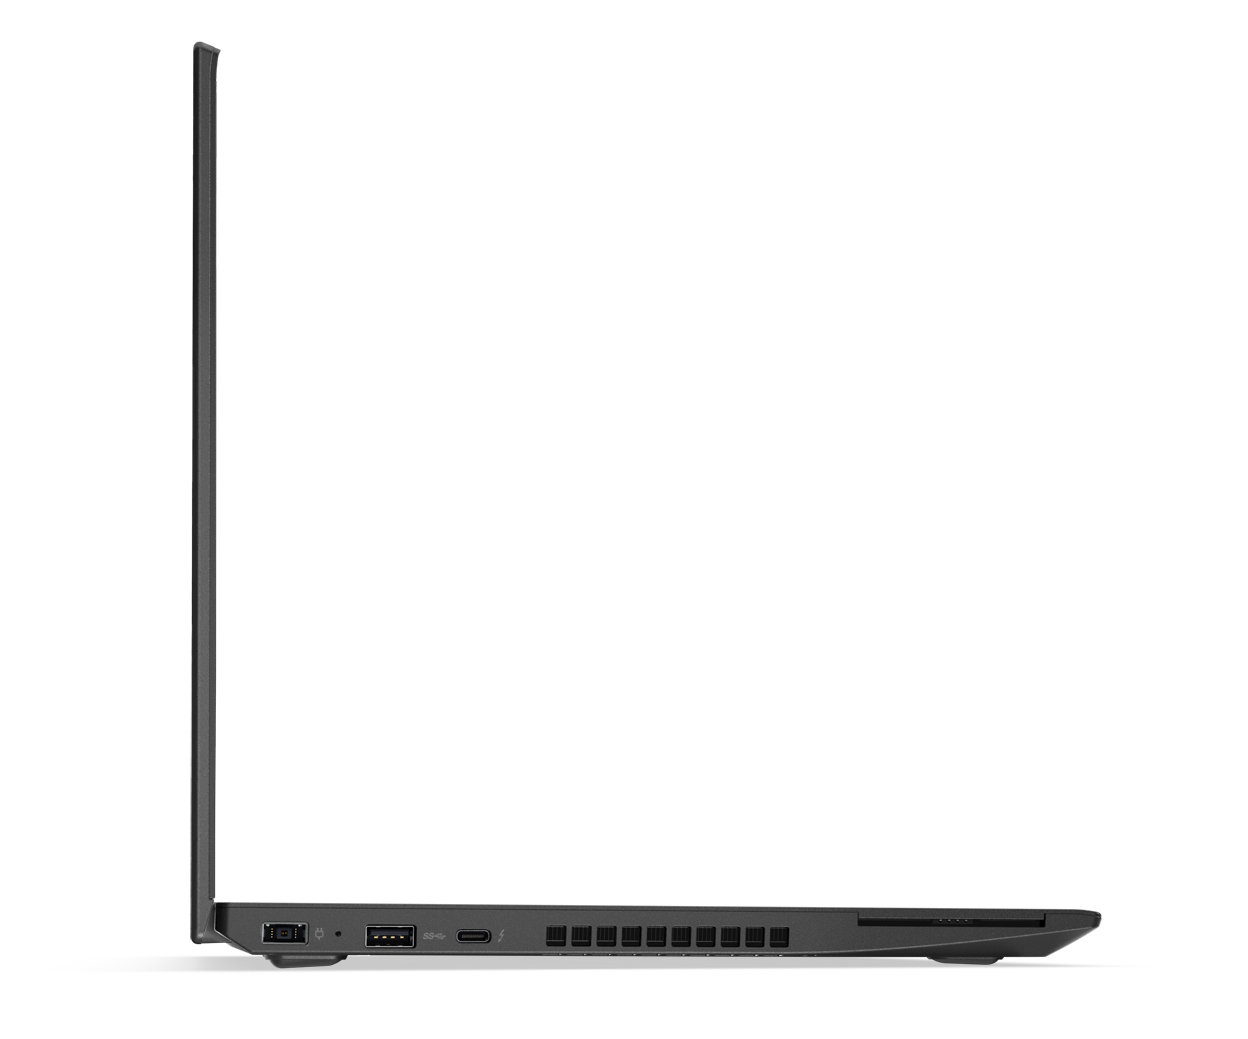
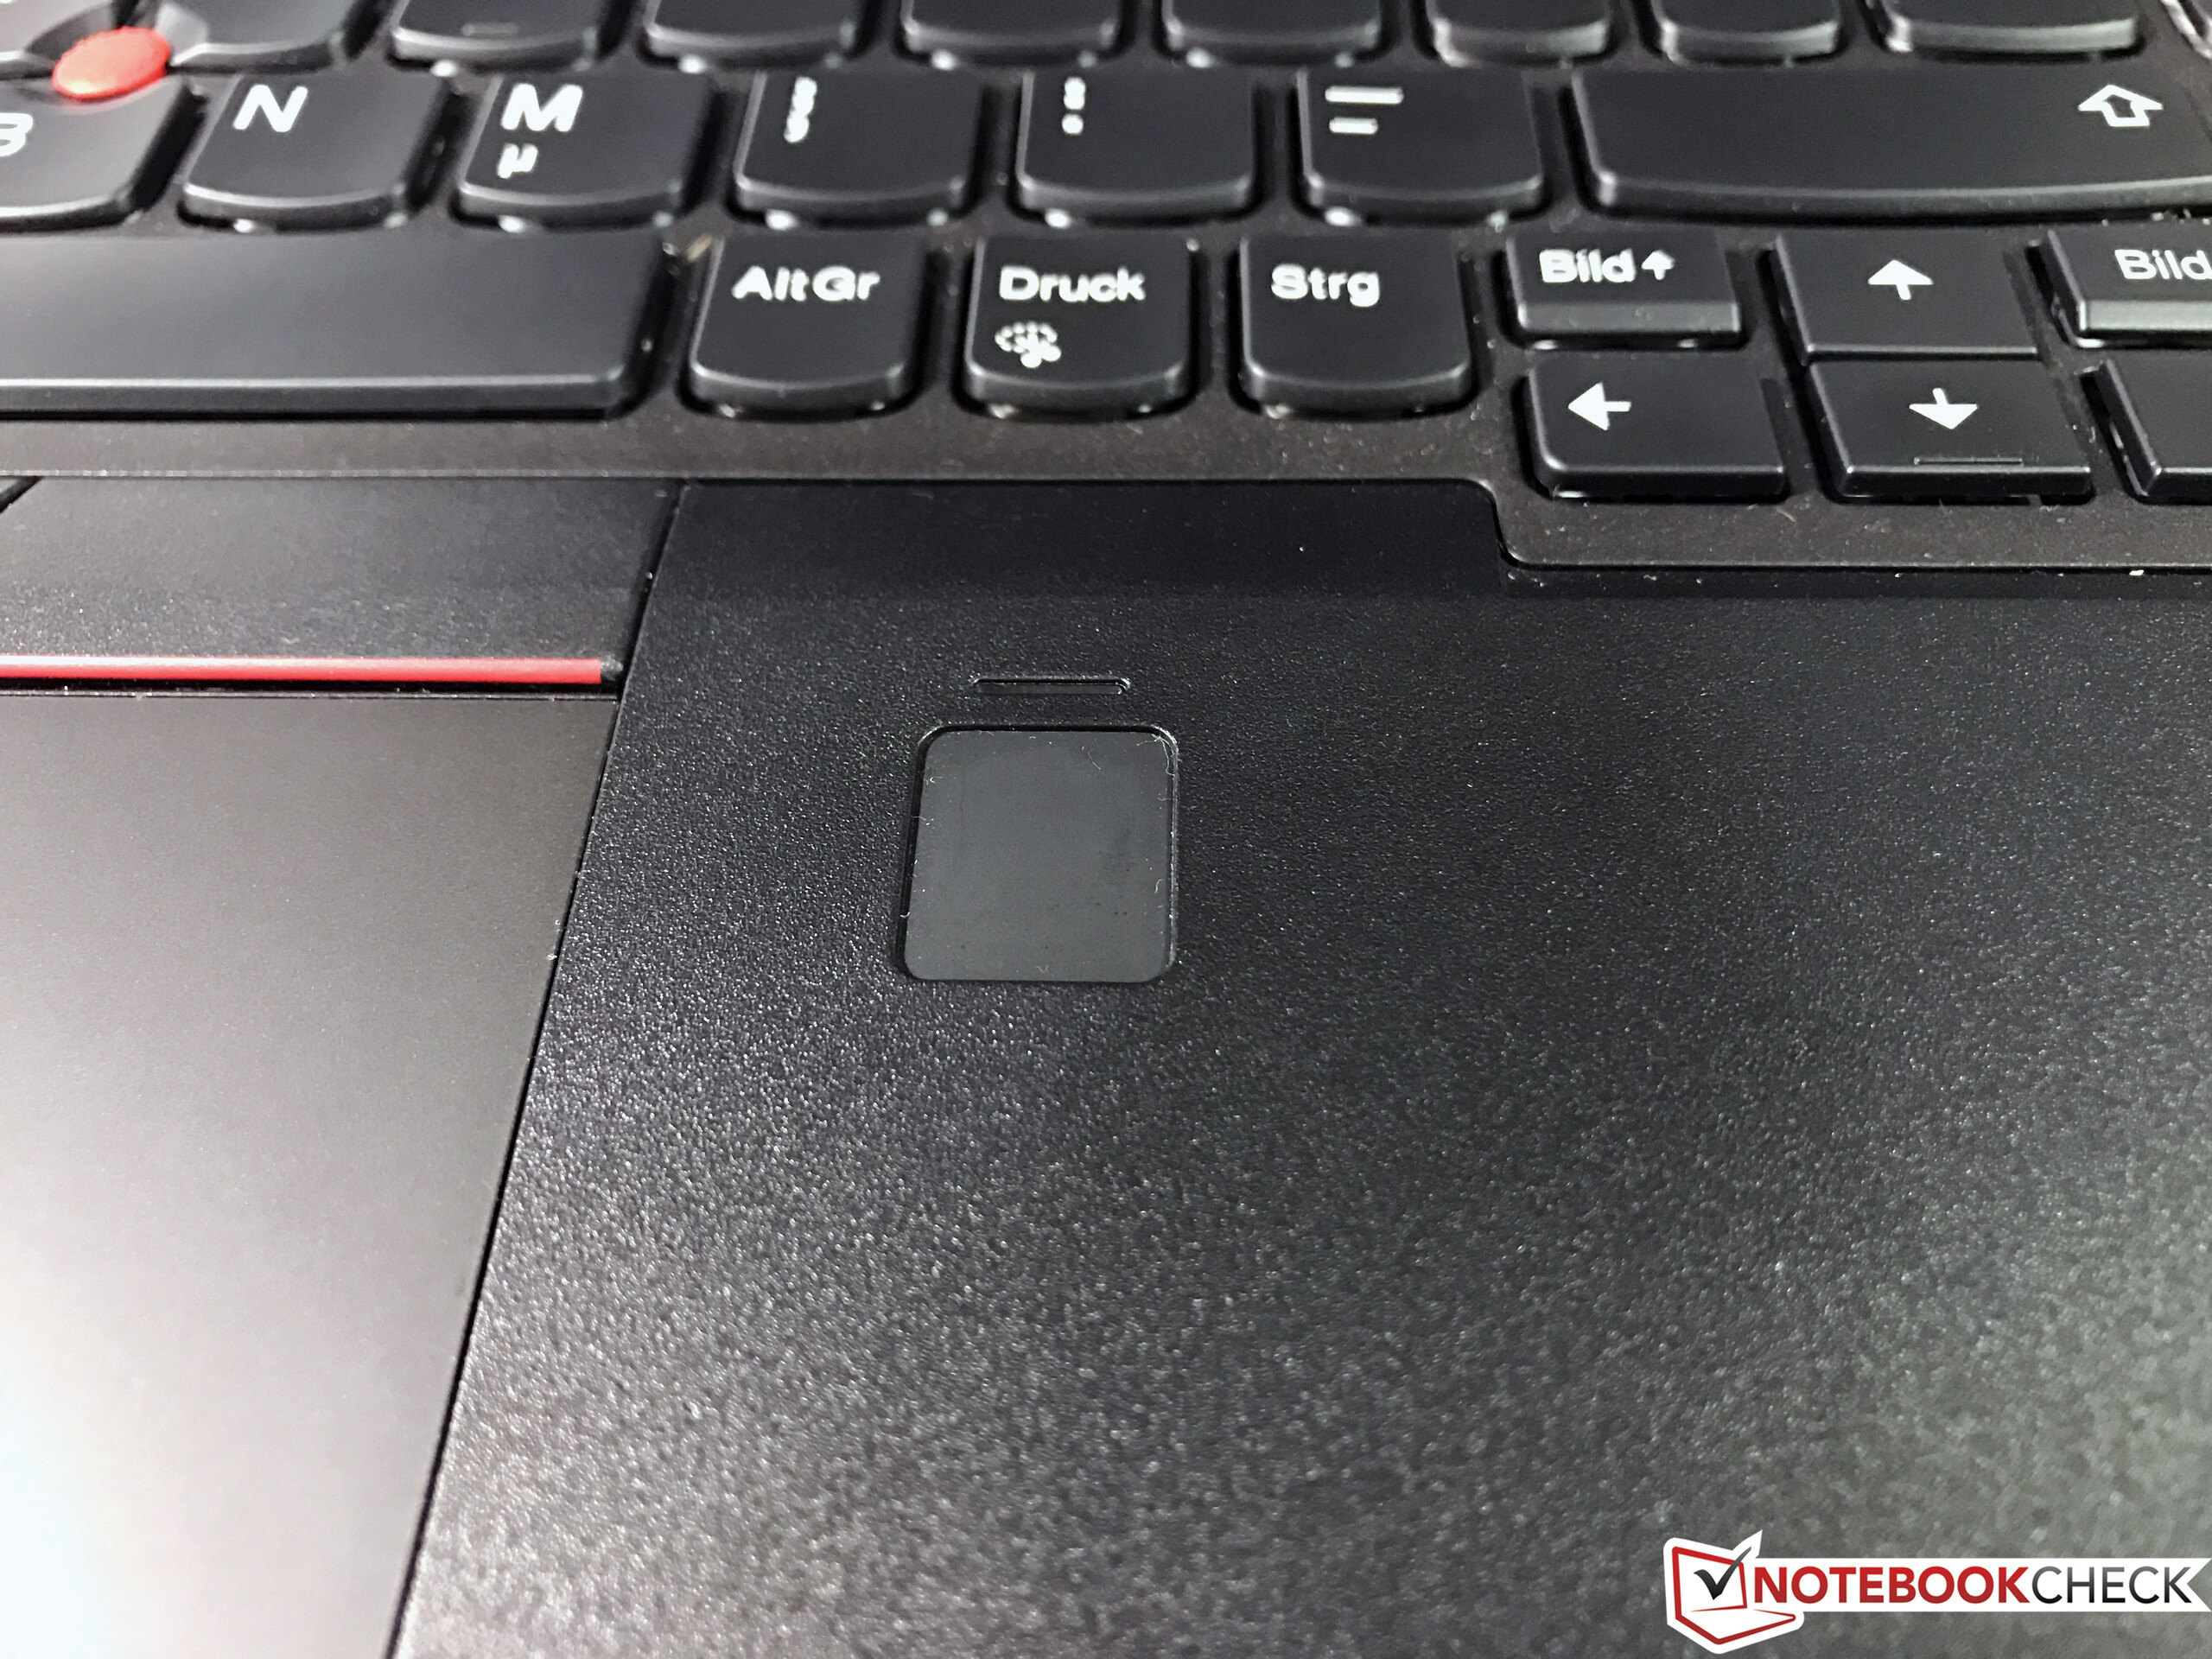
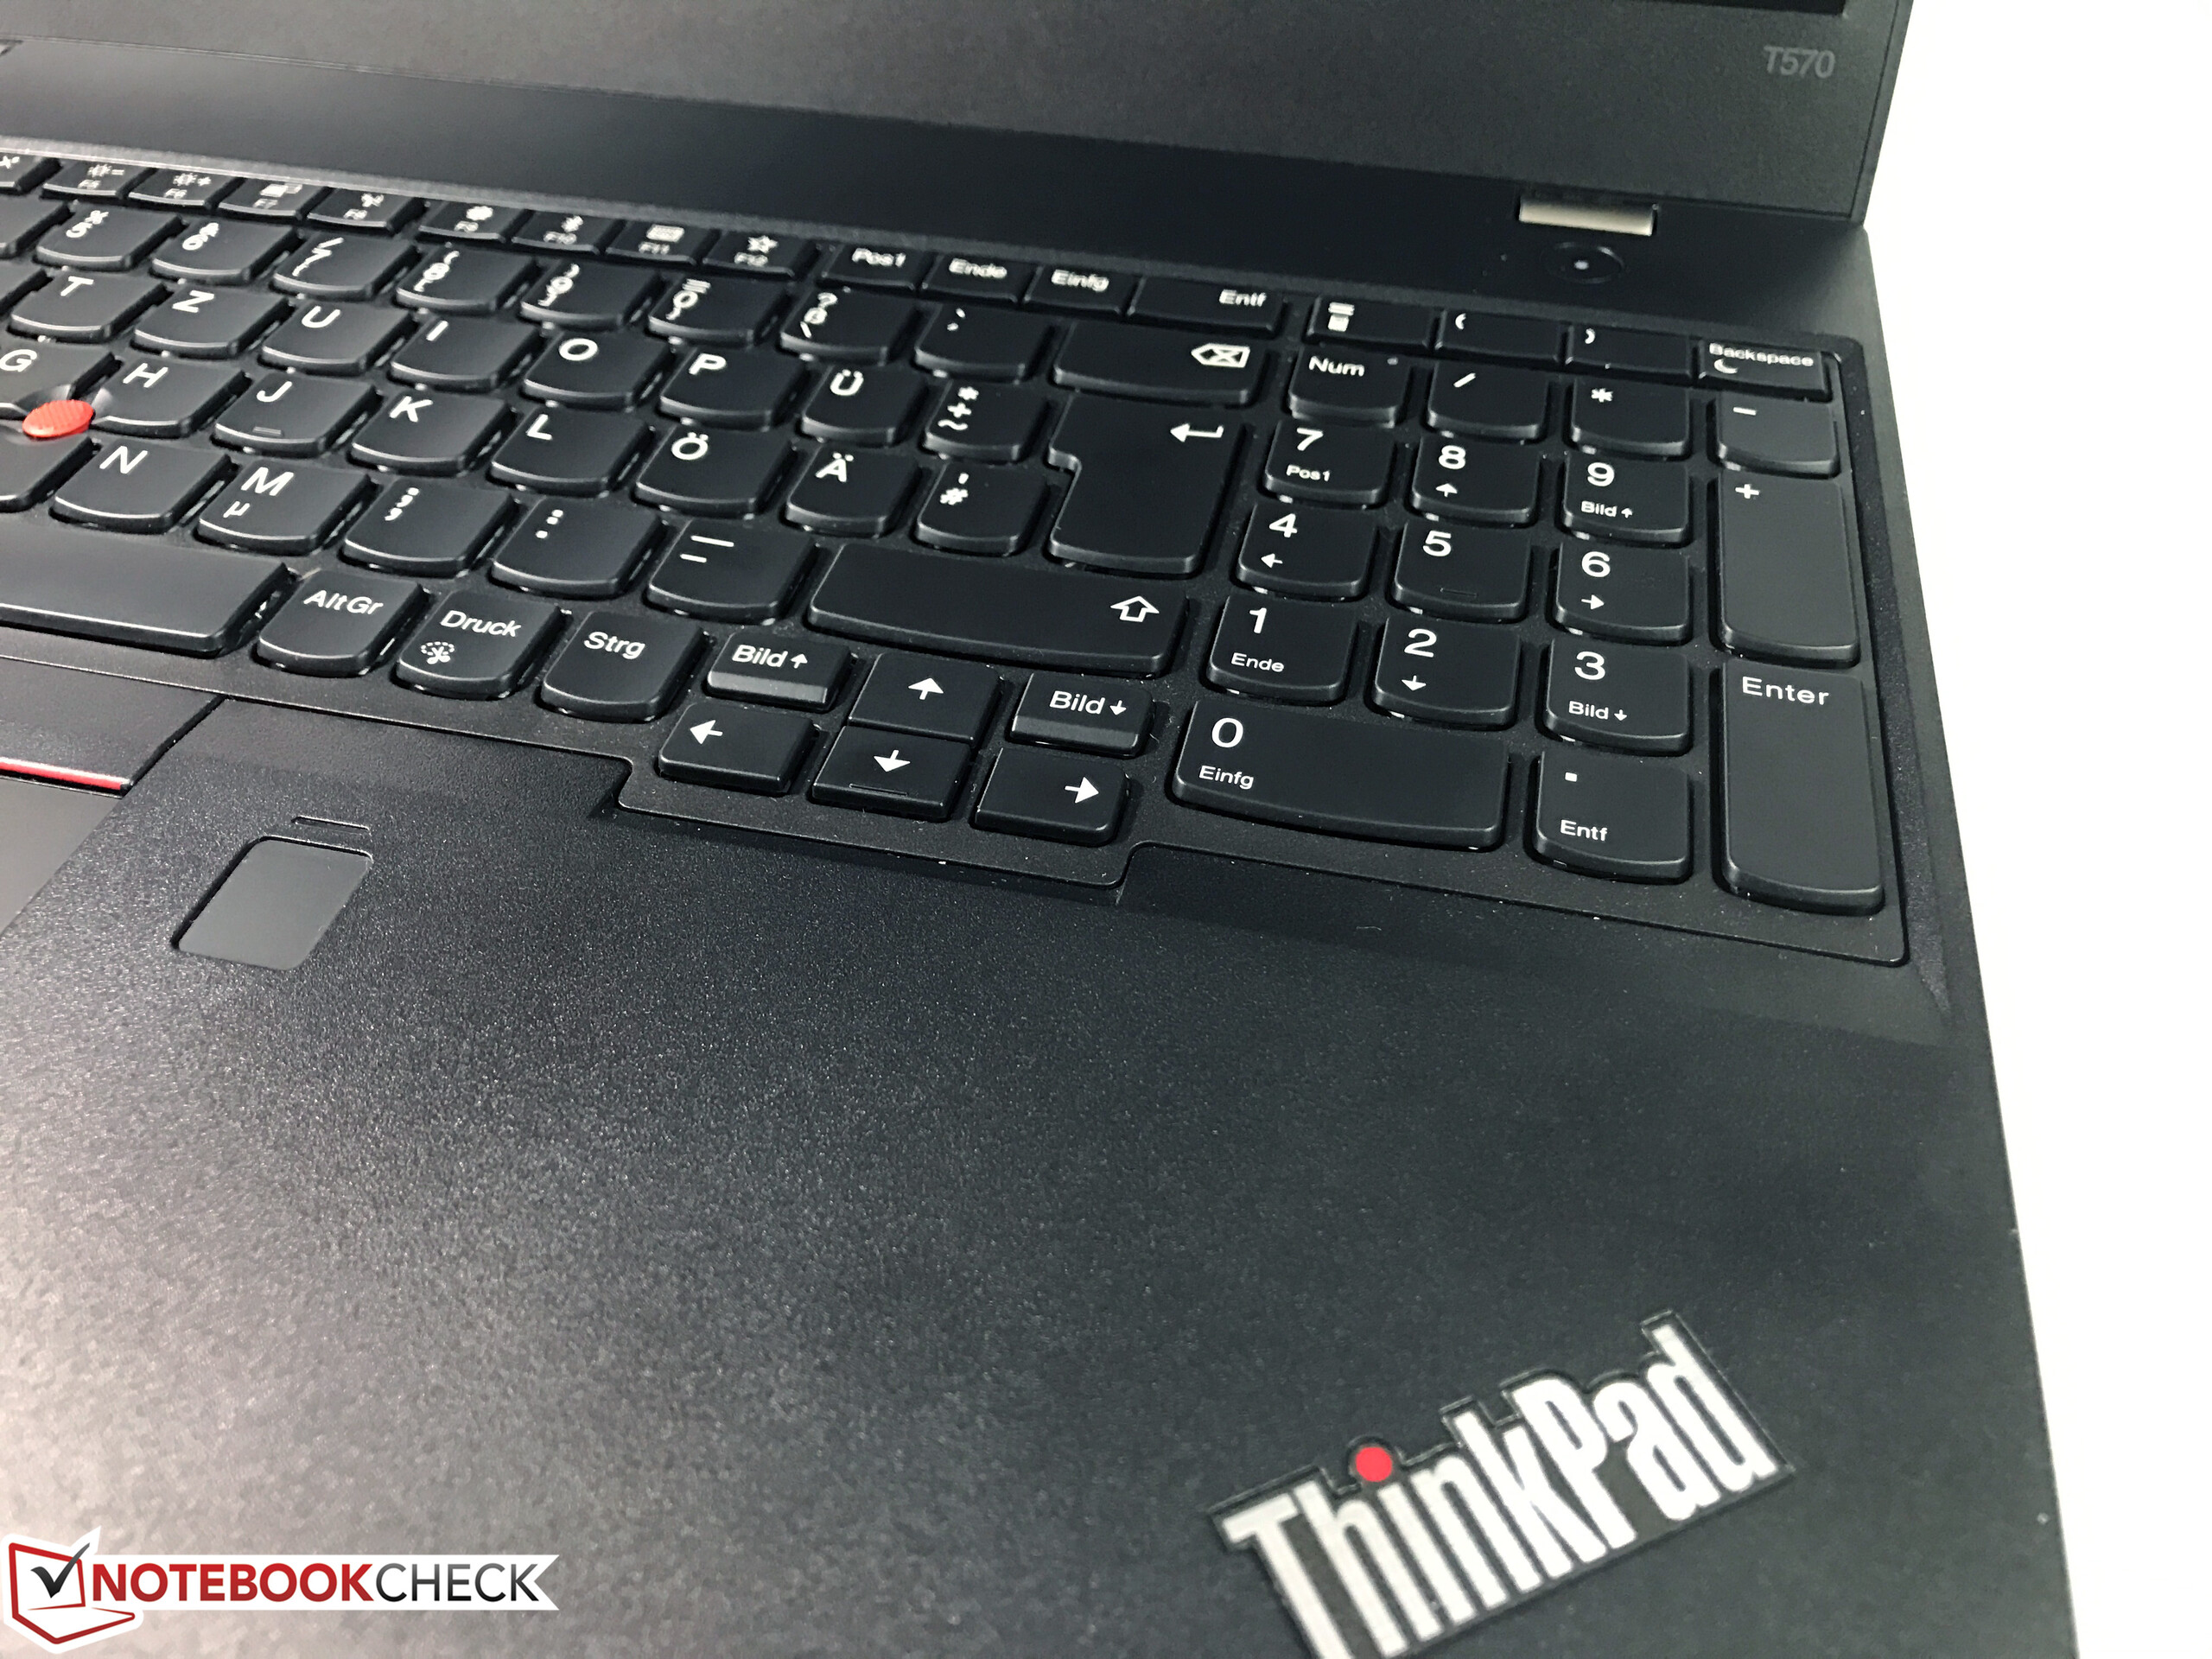
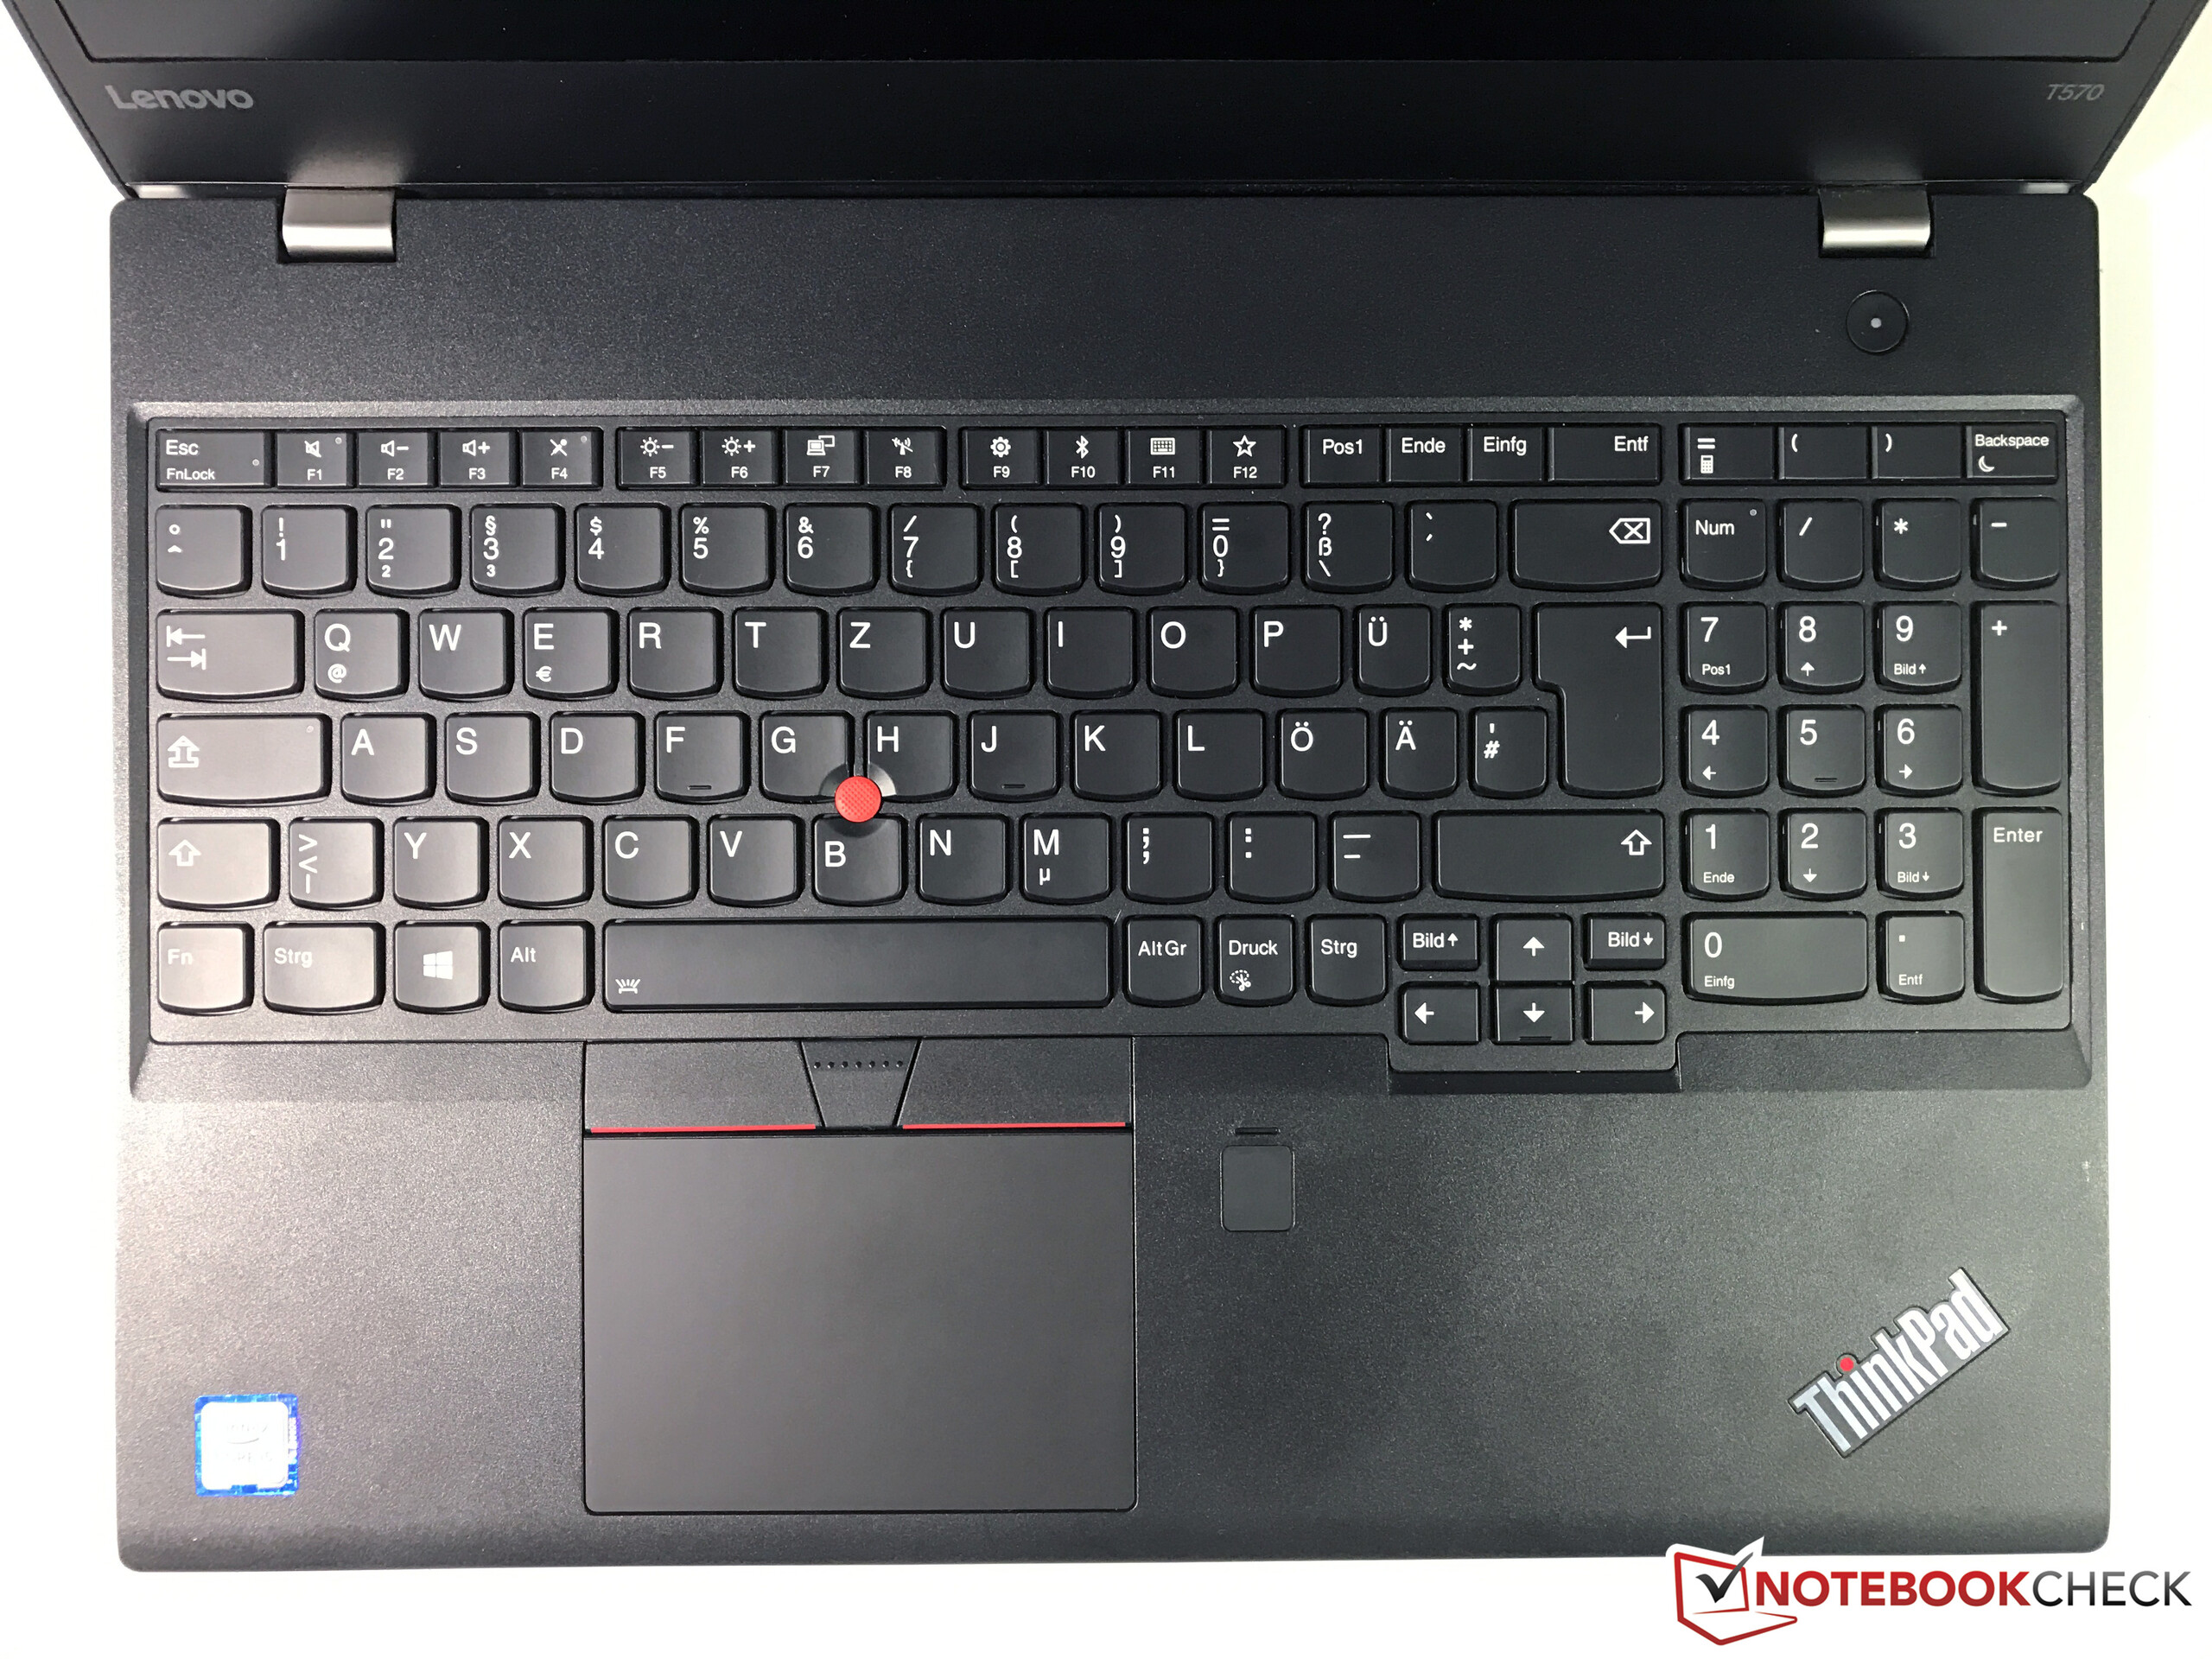
Il ThinkPad è costruito in modo identico al ThinkPad T570. Pertanto, il P51sa lo stesso solido case, i buoni dispositivi di input, la connettività molto varia del T570. E' presente anche una fotocamera ad infrarossi.
Sfortunatamente, il P51s eredita anche le pecche del T570. Ad esempio il throttling della CPU con la batteria. Abbiamo rilevato clock rates di circa 1.8 - 2.4 GHz. Questo dipende dal throttling. Inoltre, il portatile si è surriscaldato molto durante il nostro stress test. Abbiamo registrato una temperatura di 60.8 °C su un punto - troppo per un portatile ULV. La rumorosità appare migliore; il ThinkPad è ad un livello normale.
La sorprendente autonomia è un highlight di questo portatile.
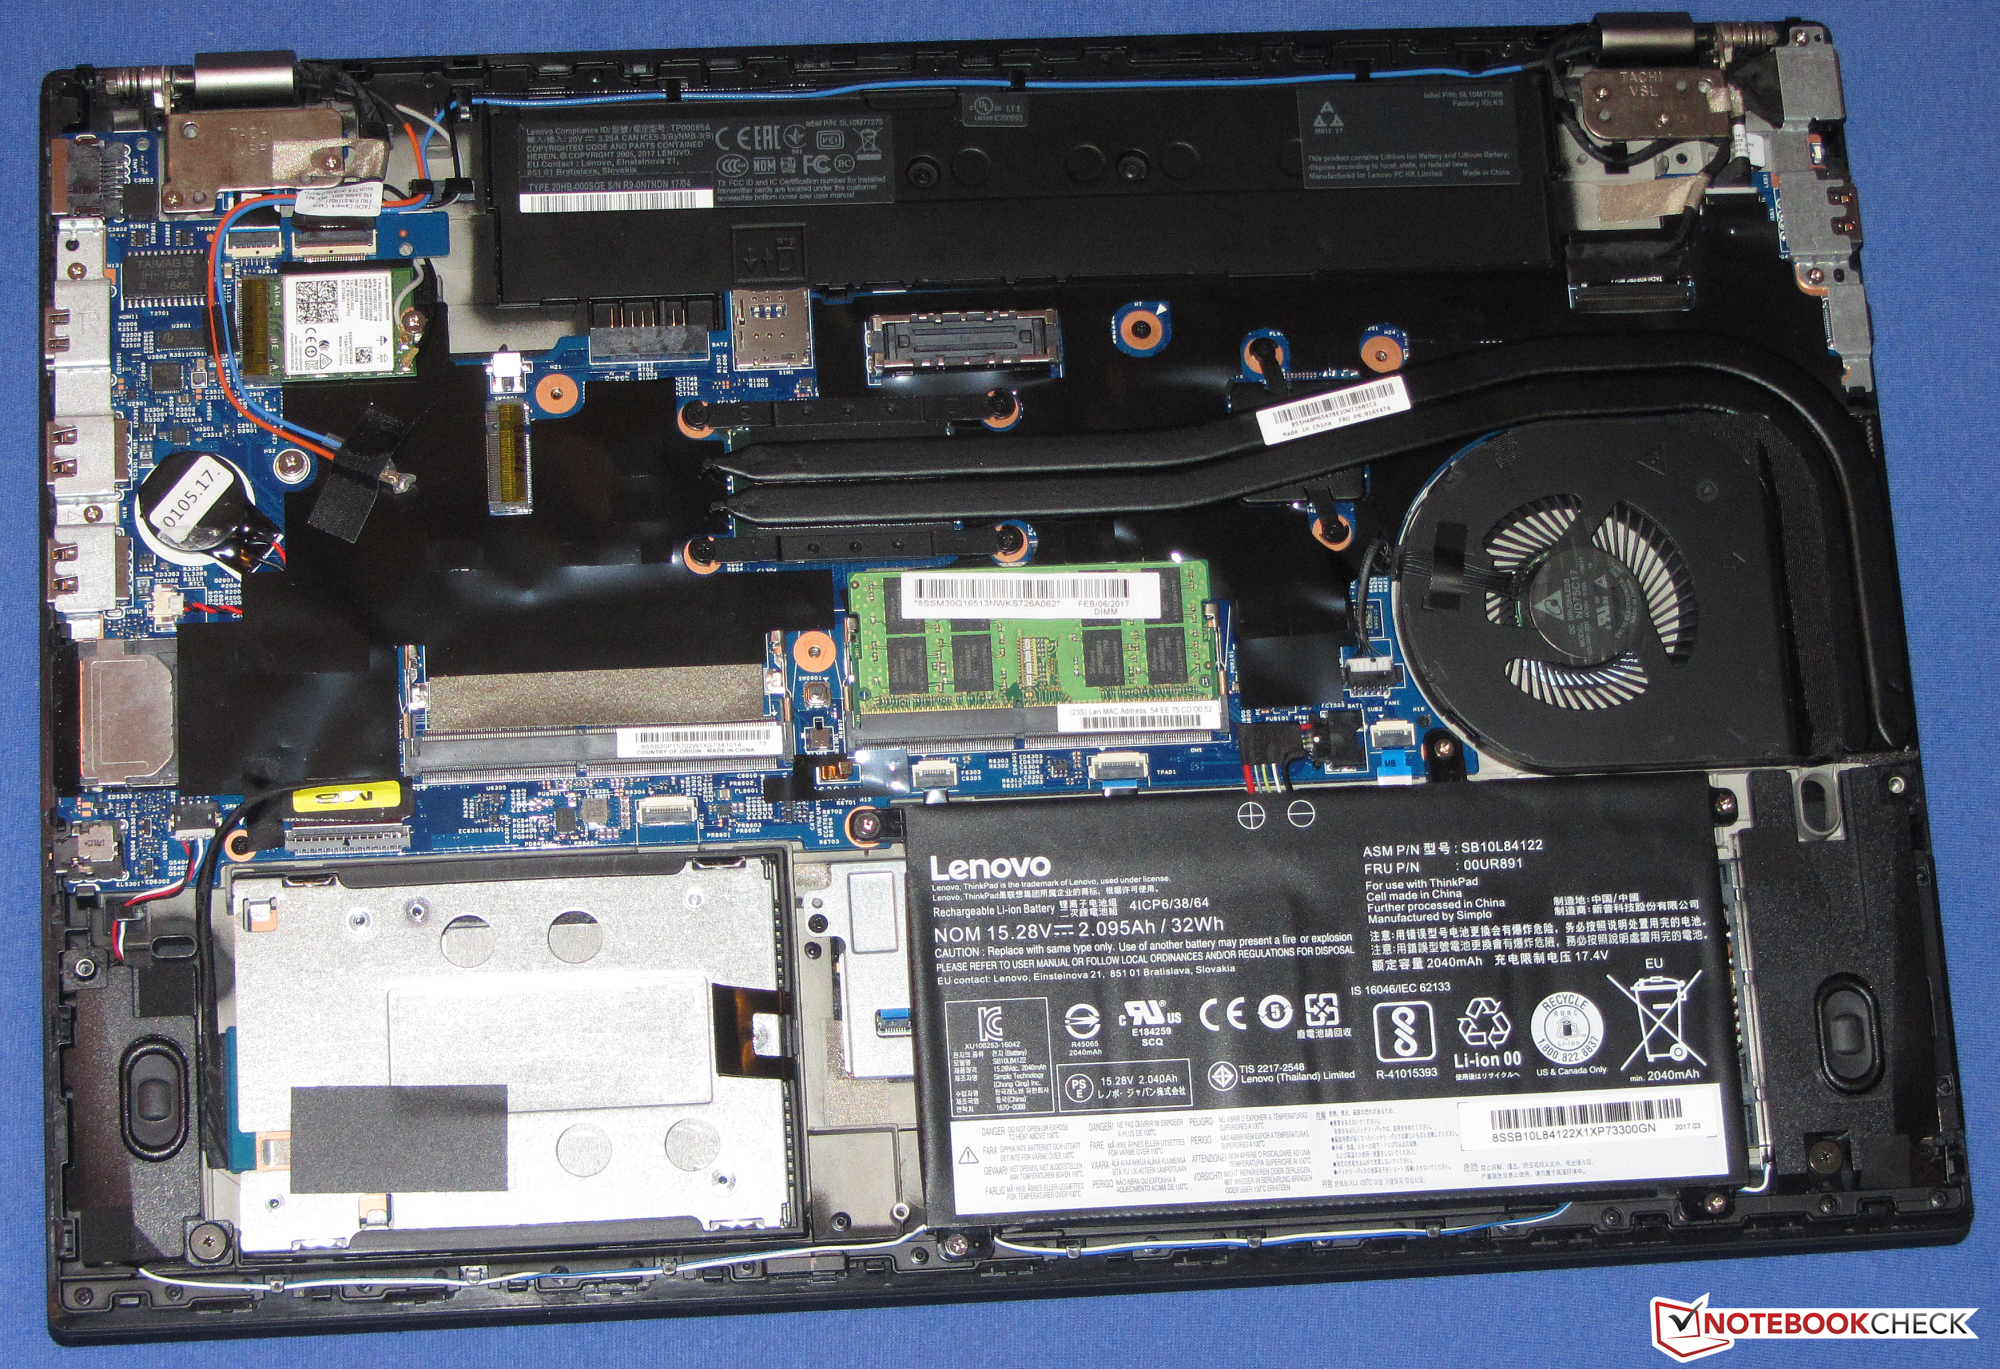
In totale, il P51s ha una batteria da 104 Wh (internala: 32 Wh, esterna: 72 Wh). E' abbastanza per far girare a lungo questo portatile 4K. Un veloce SSD NVMe consente un sistema scattante. Il portatile può anche essere dotato di un hard drive da 2,5" invece dell'SSD M.2 NVMe. Può essere inserito anche un modem LTE; il nostro modello ha uno slot vuoto e le relative antenne.
Lo schermo matto 4K del P51s l'abbiamo visto sul ThinkPad T570. Entrambi i portatili hanno lo stesso pannello. Lo schermo IPS con angoli di visuale stabili e contrasto buono. La luminosità è soddisfacente sebbene potrebbe essere maggiore. Sfortunatamente lo schermo mostra PWM-flickering con livelli di luminosità del 90% ed inferiori.
Nota: si tratta di una recensione breve, con alcune sezioni non tradotte, per la versione integrale in inglese guardate qui.
Lenovo ThinkPad P51s 20HB000SGE
- 06/03/2017 v6 (old)
Sascha Mölck