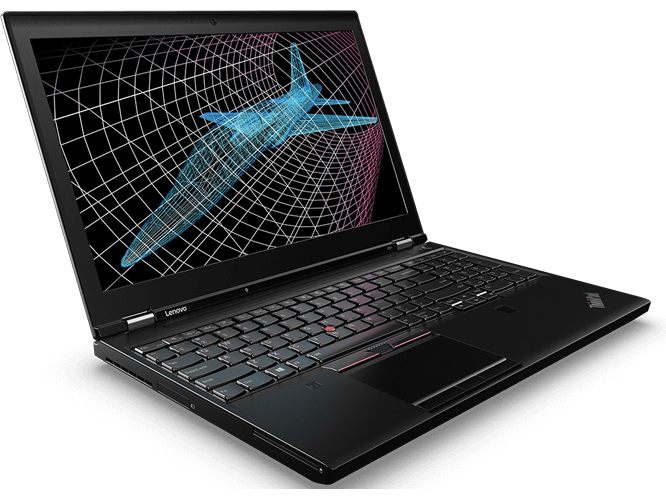
Recensione completa della Workstation Lenovo ThinkPad P51 (Xeon, 4K)
Per la recensione originale in Tedesco, guardate qui.
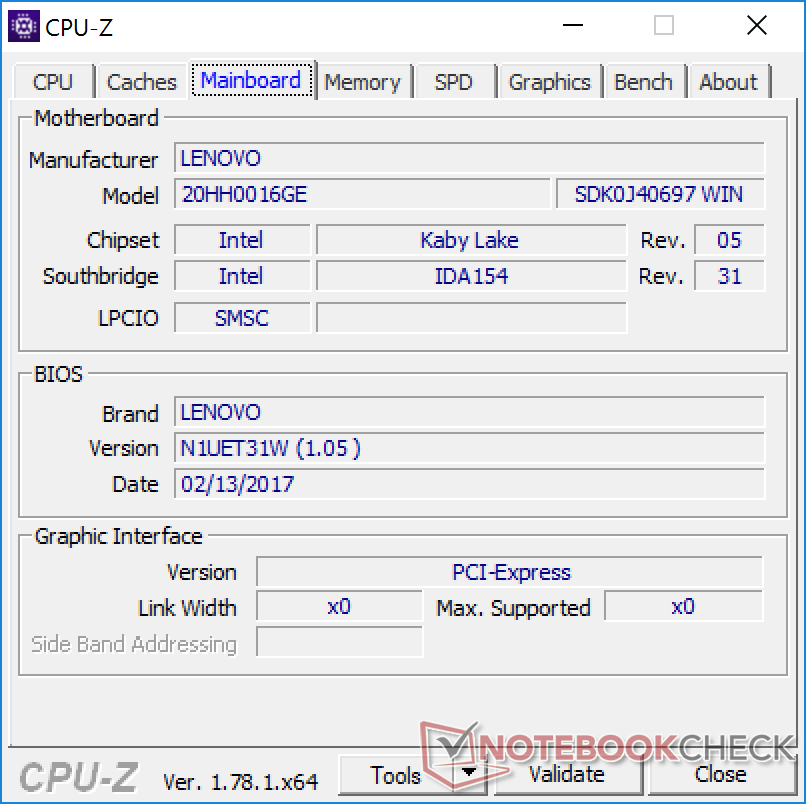
Lenovo ha aggiornato con cautela la sua linea di workstation quest'anno in quanto l'anno scorso c'era stato un intervento più evidente. Diversamente dal ThinkPad P51s (recensione), che puntava di più sulla mobilità, si pensa soprattutto alle prestazioni con il ThinkPad P51. E' supportato da potenti processori quad-core ed una scheda grafica professionale più veloce, ma si basa ancora sulla vecchia architettura Nvidia Maxwell.
Il modello che stiamo testando è attualmente una delle SKUs più potenti del ThinkPad P51 with con un processore mobile Xeon (Kaby Lake), GPU Nvidia Quadro M2200M, veloce SSD PCIe e schermo high-resolution 4K con calibrazione integrata. Tuttavia tutto questo ha un prezzo. I clienti normali pagano circa 3300 Euro (~$3671); studenti ed impiegati del settore scientifico possono averlo per 2700 Euro (~$3005).
I principali concorrenti ovviamente sono le classiche workstations mobile Dell, HP, o Fujitsu, ma non siamo stati in grado di recensire i loro modelli per il momento. Pertanto useremo i predecessori Dell Precision 7510, HP ZBook 15 G3, e Fujitsu Celsius H760. Vogliamo anche verificare quali compromessi sono necessari per scegliere una alternativa più sottile e leggera rispetto al Dell Precision 5520 o o al citato ThinkPad P51s.
La costruzione base del ThinkPad P51 non è cambiata rispetto al precedente ThinkPad P50, quindi non copriremo tutte le sezioni in questo articolo e parleremo solo delle modifiche. Raccomandiamo le nostre recensioni complete del ThinkPad P50 per maggiori informazioni:
Case
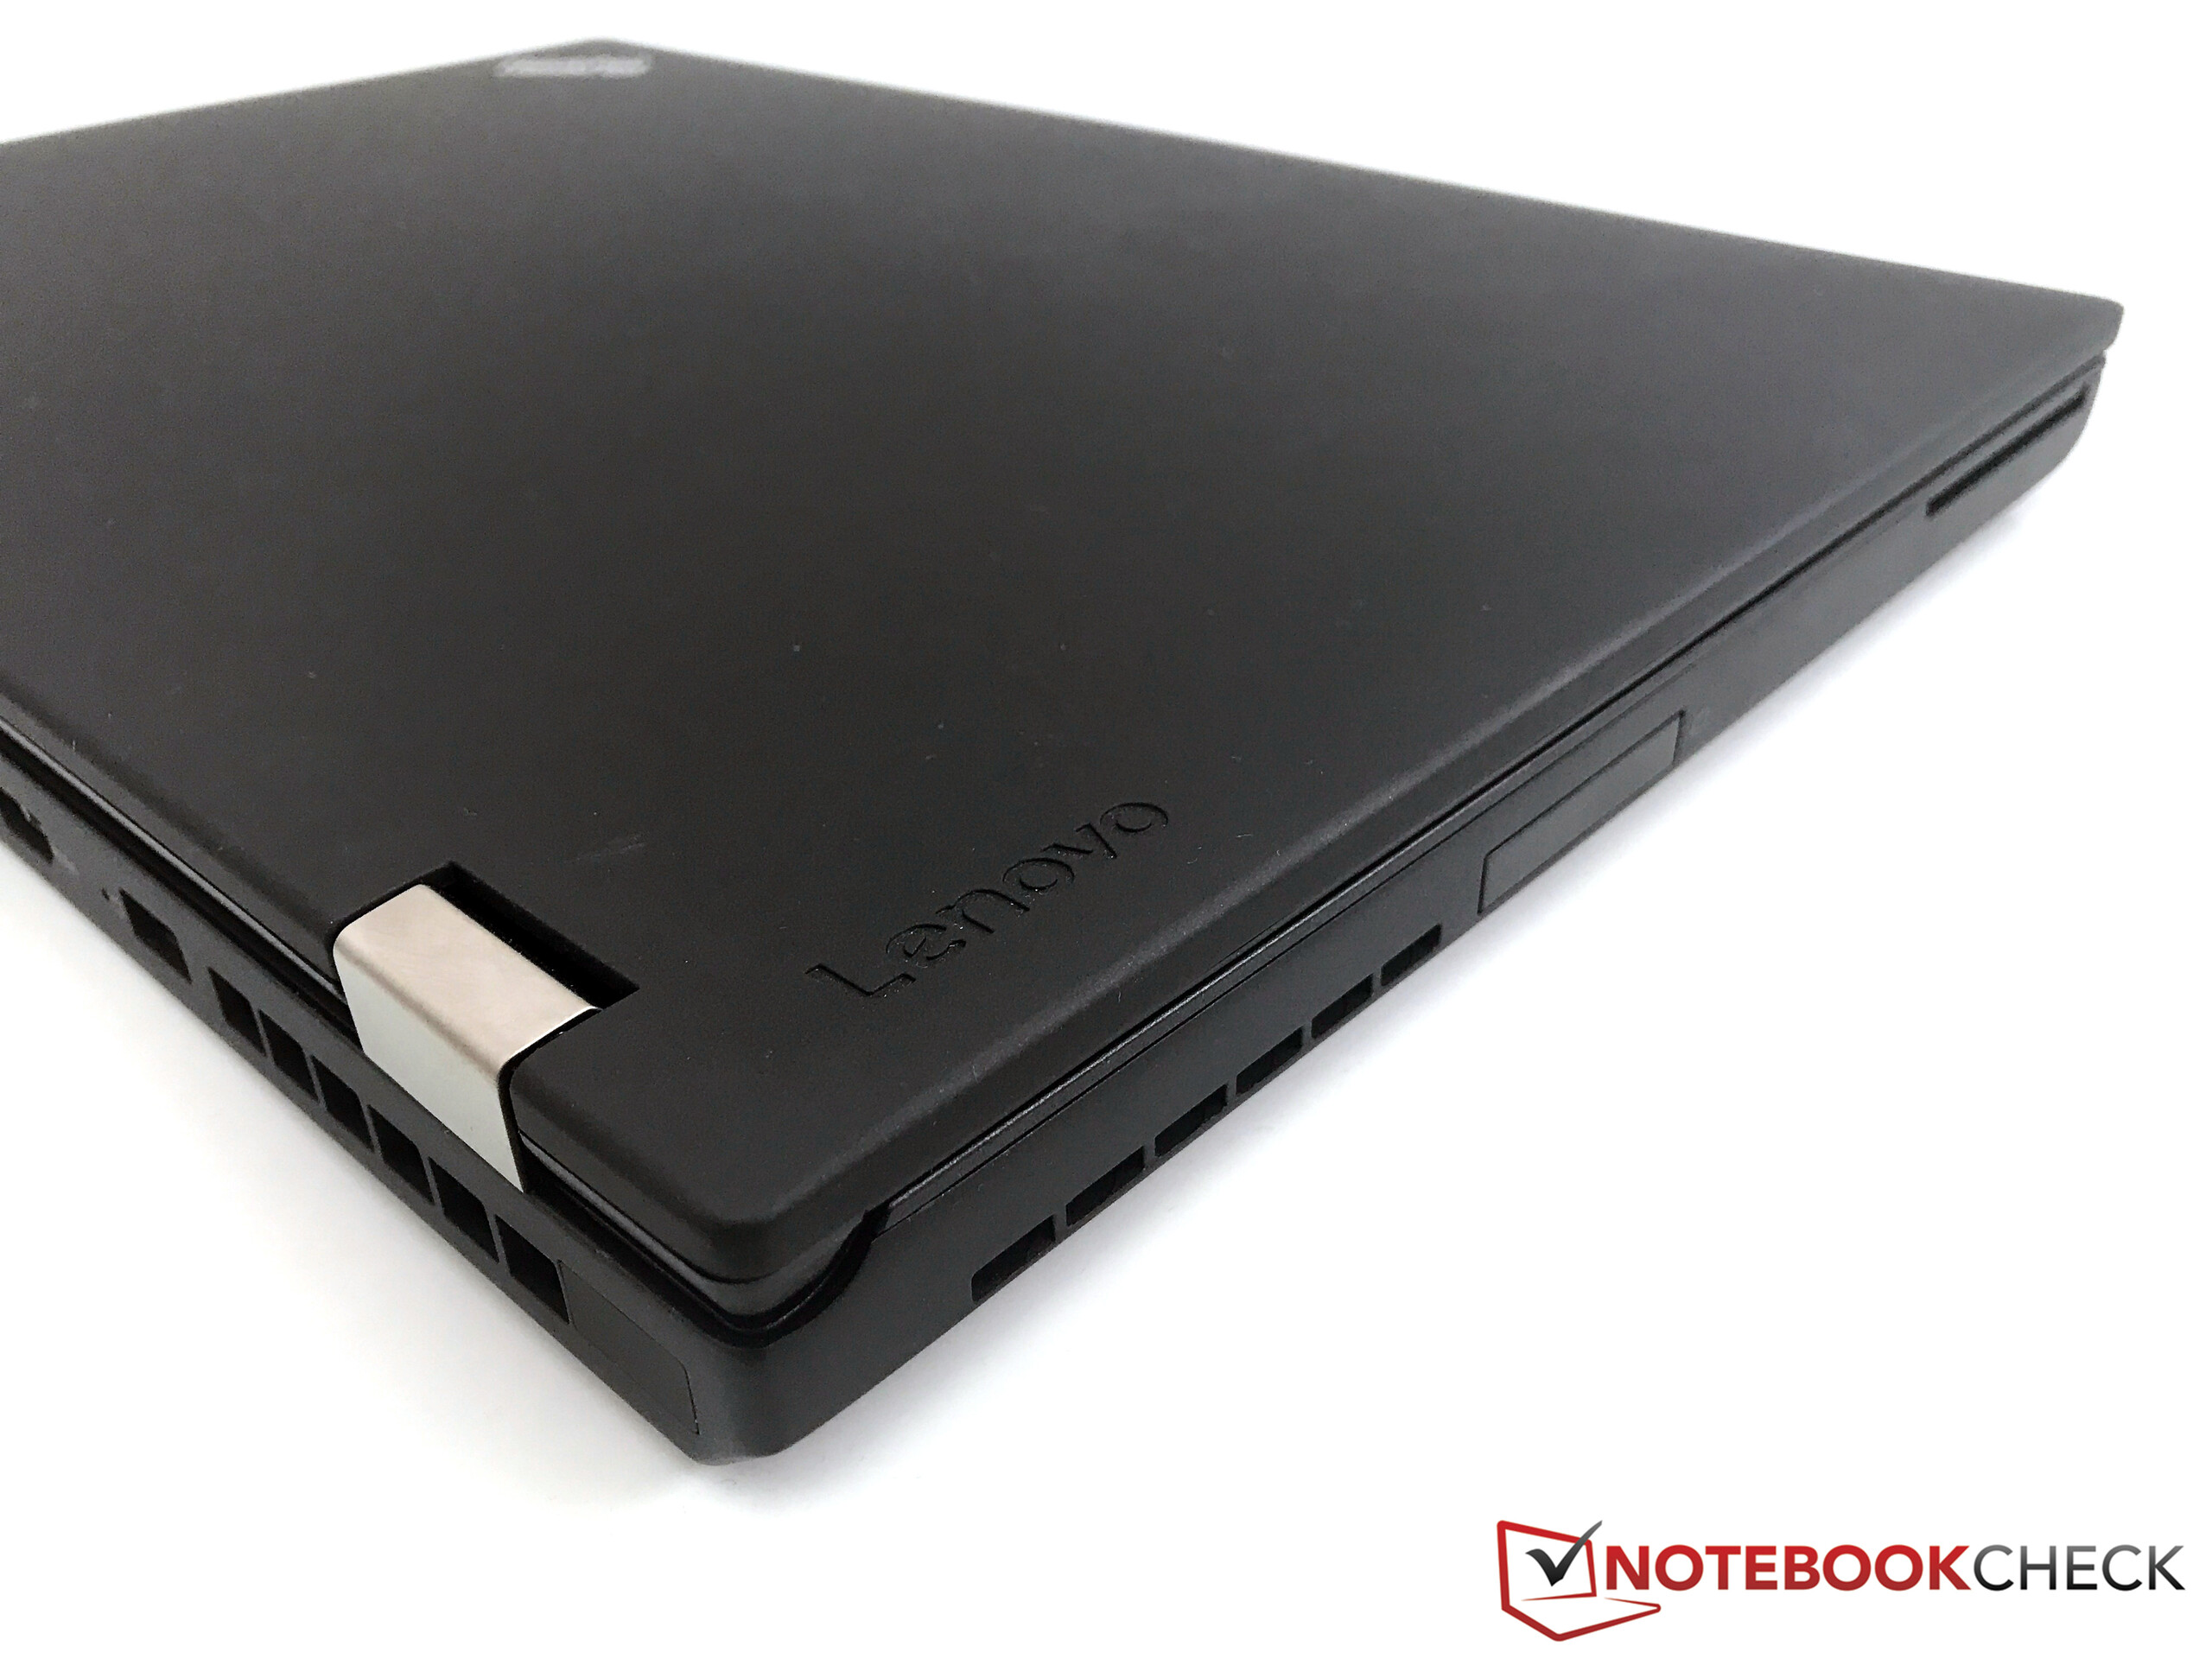
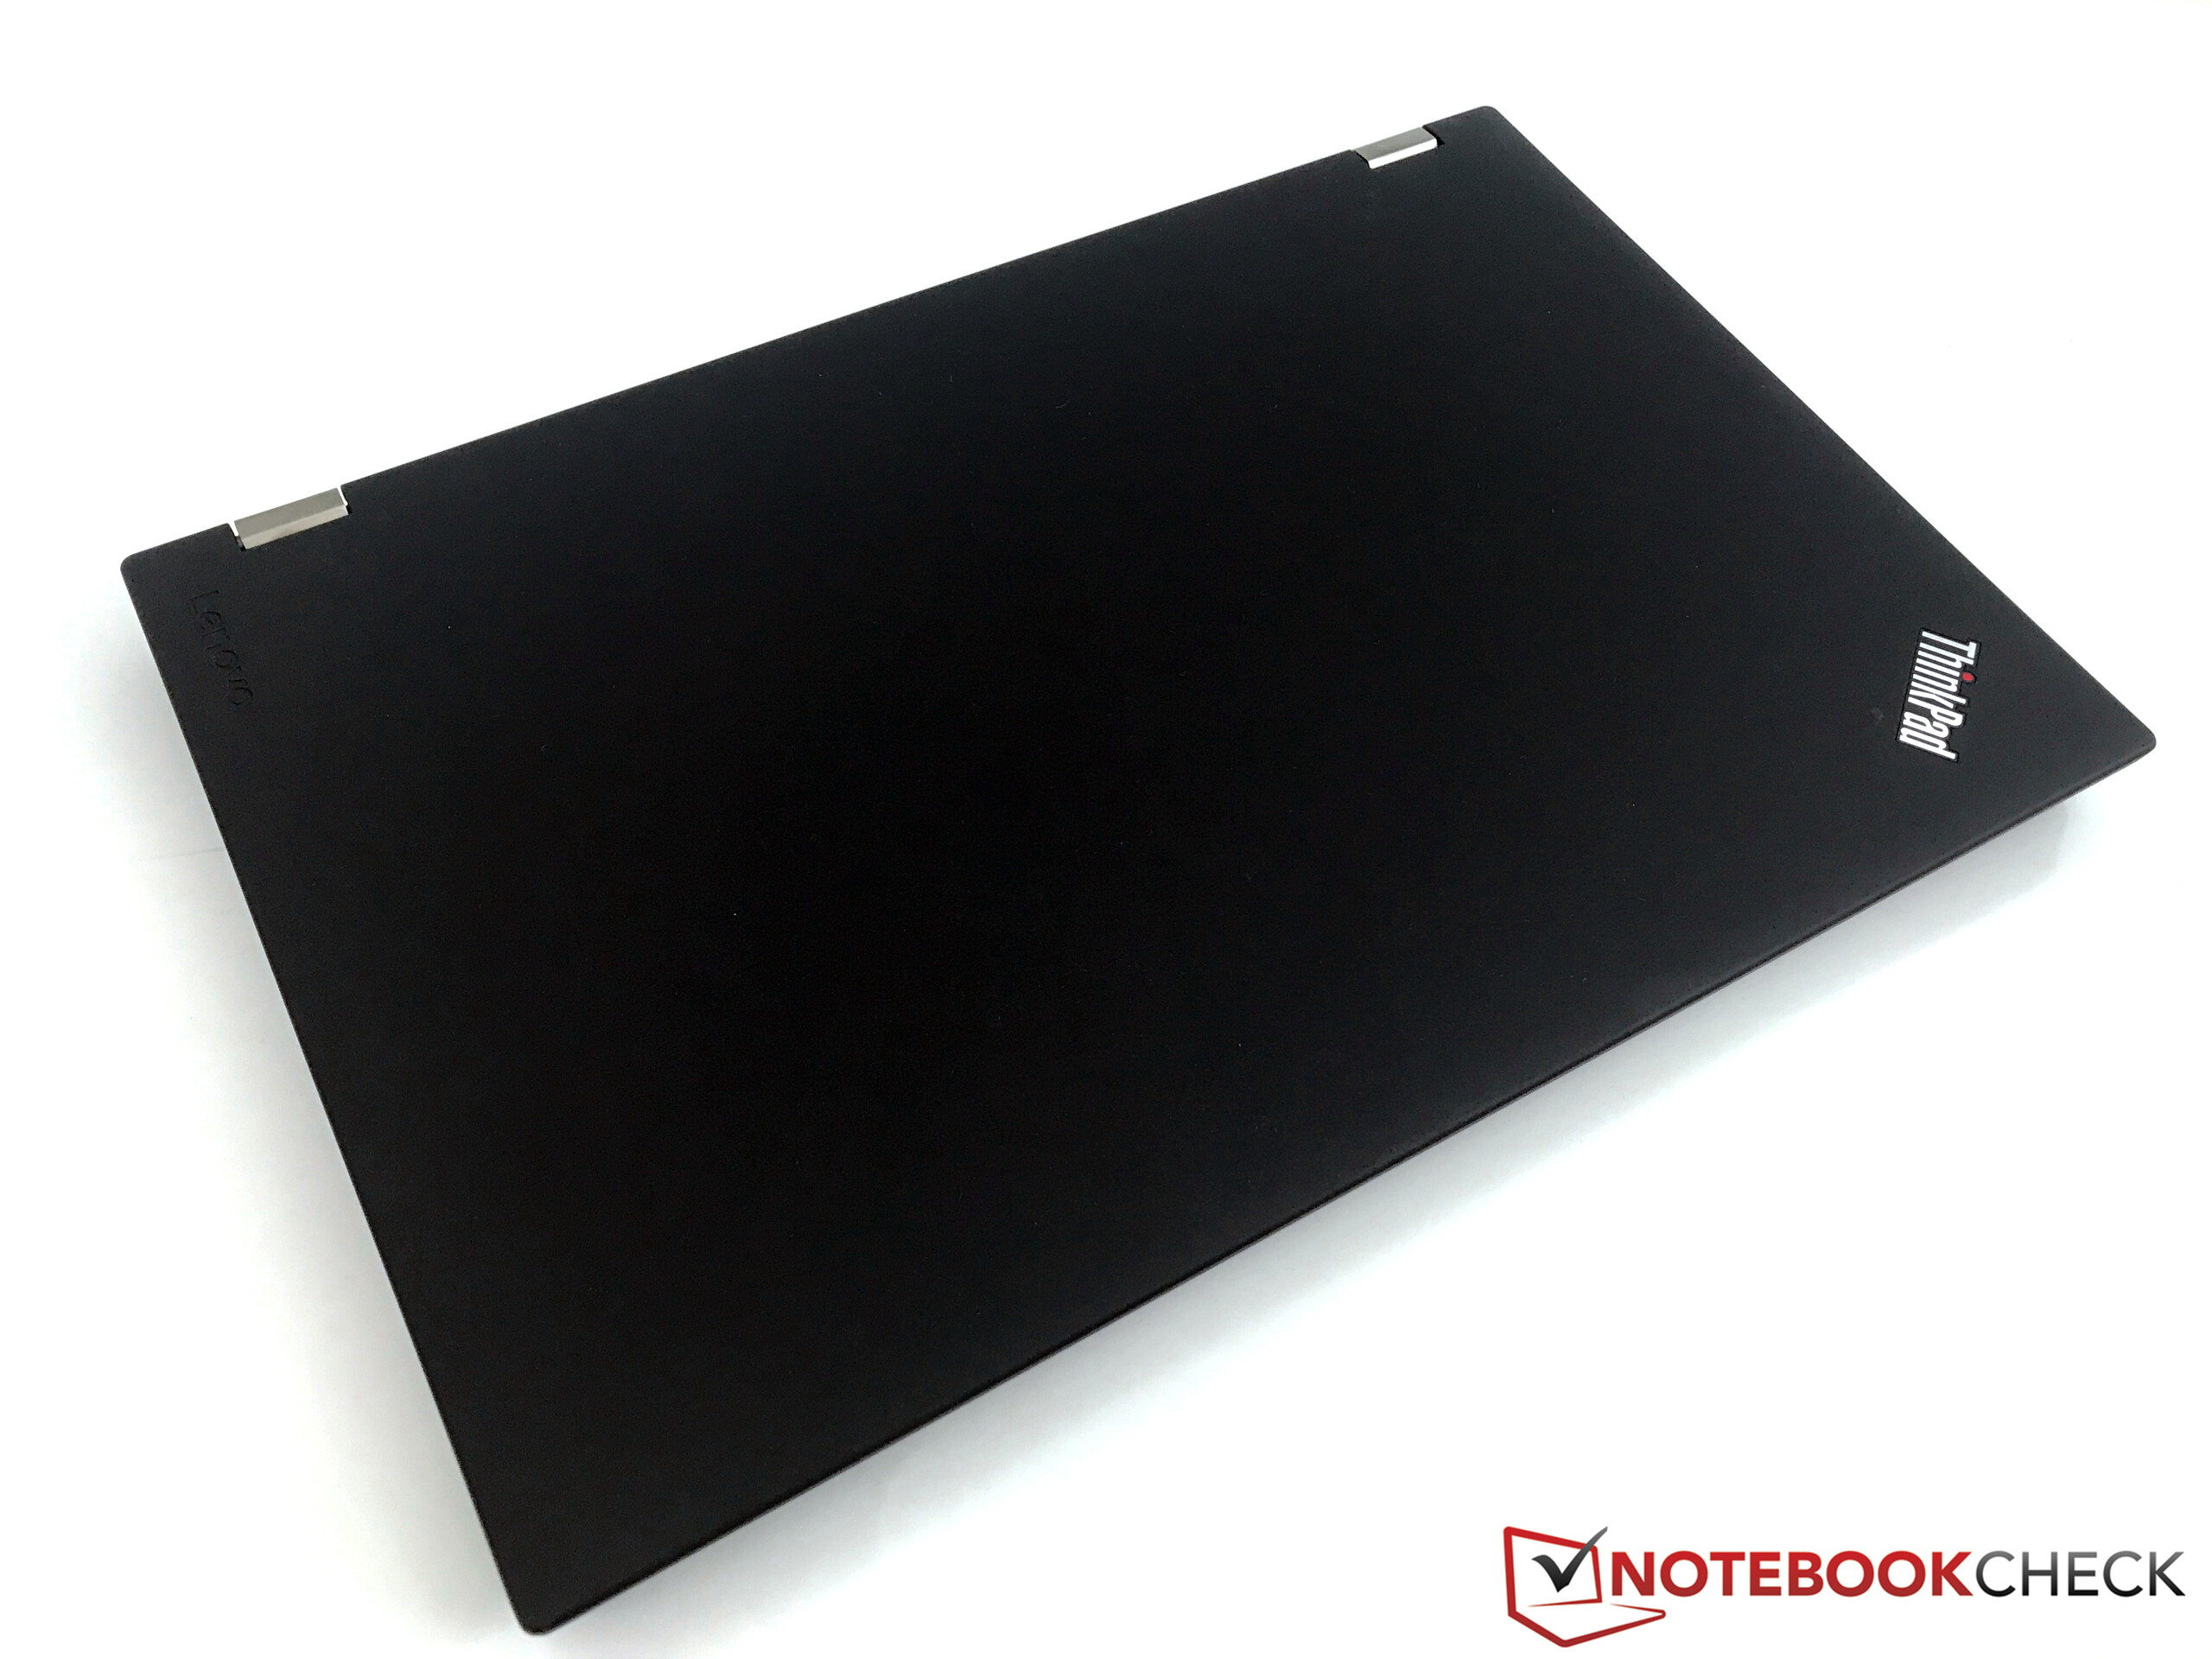
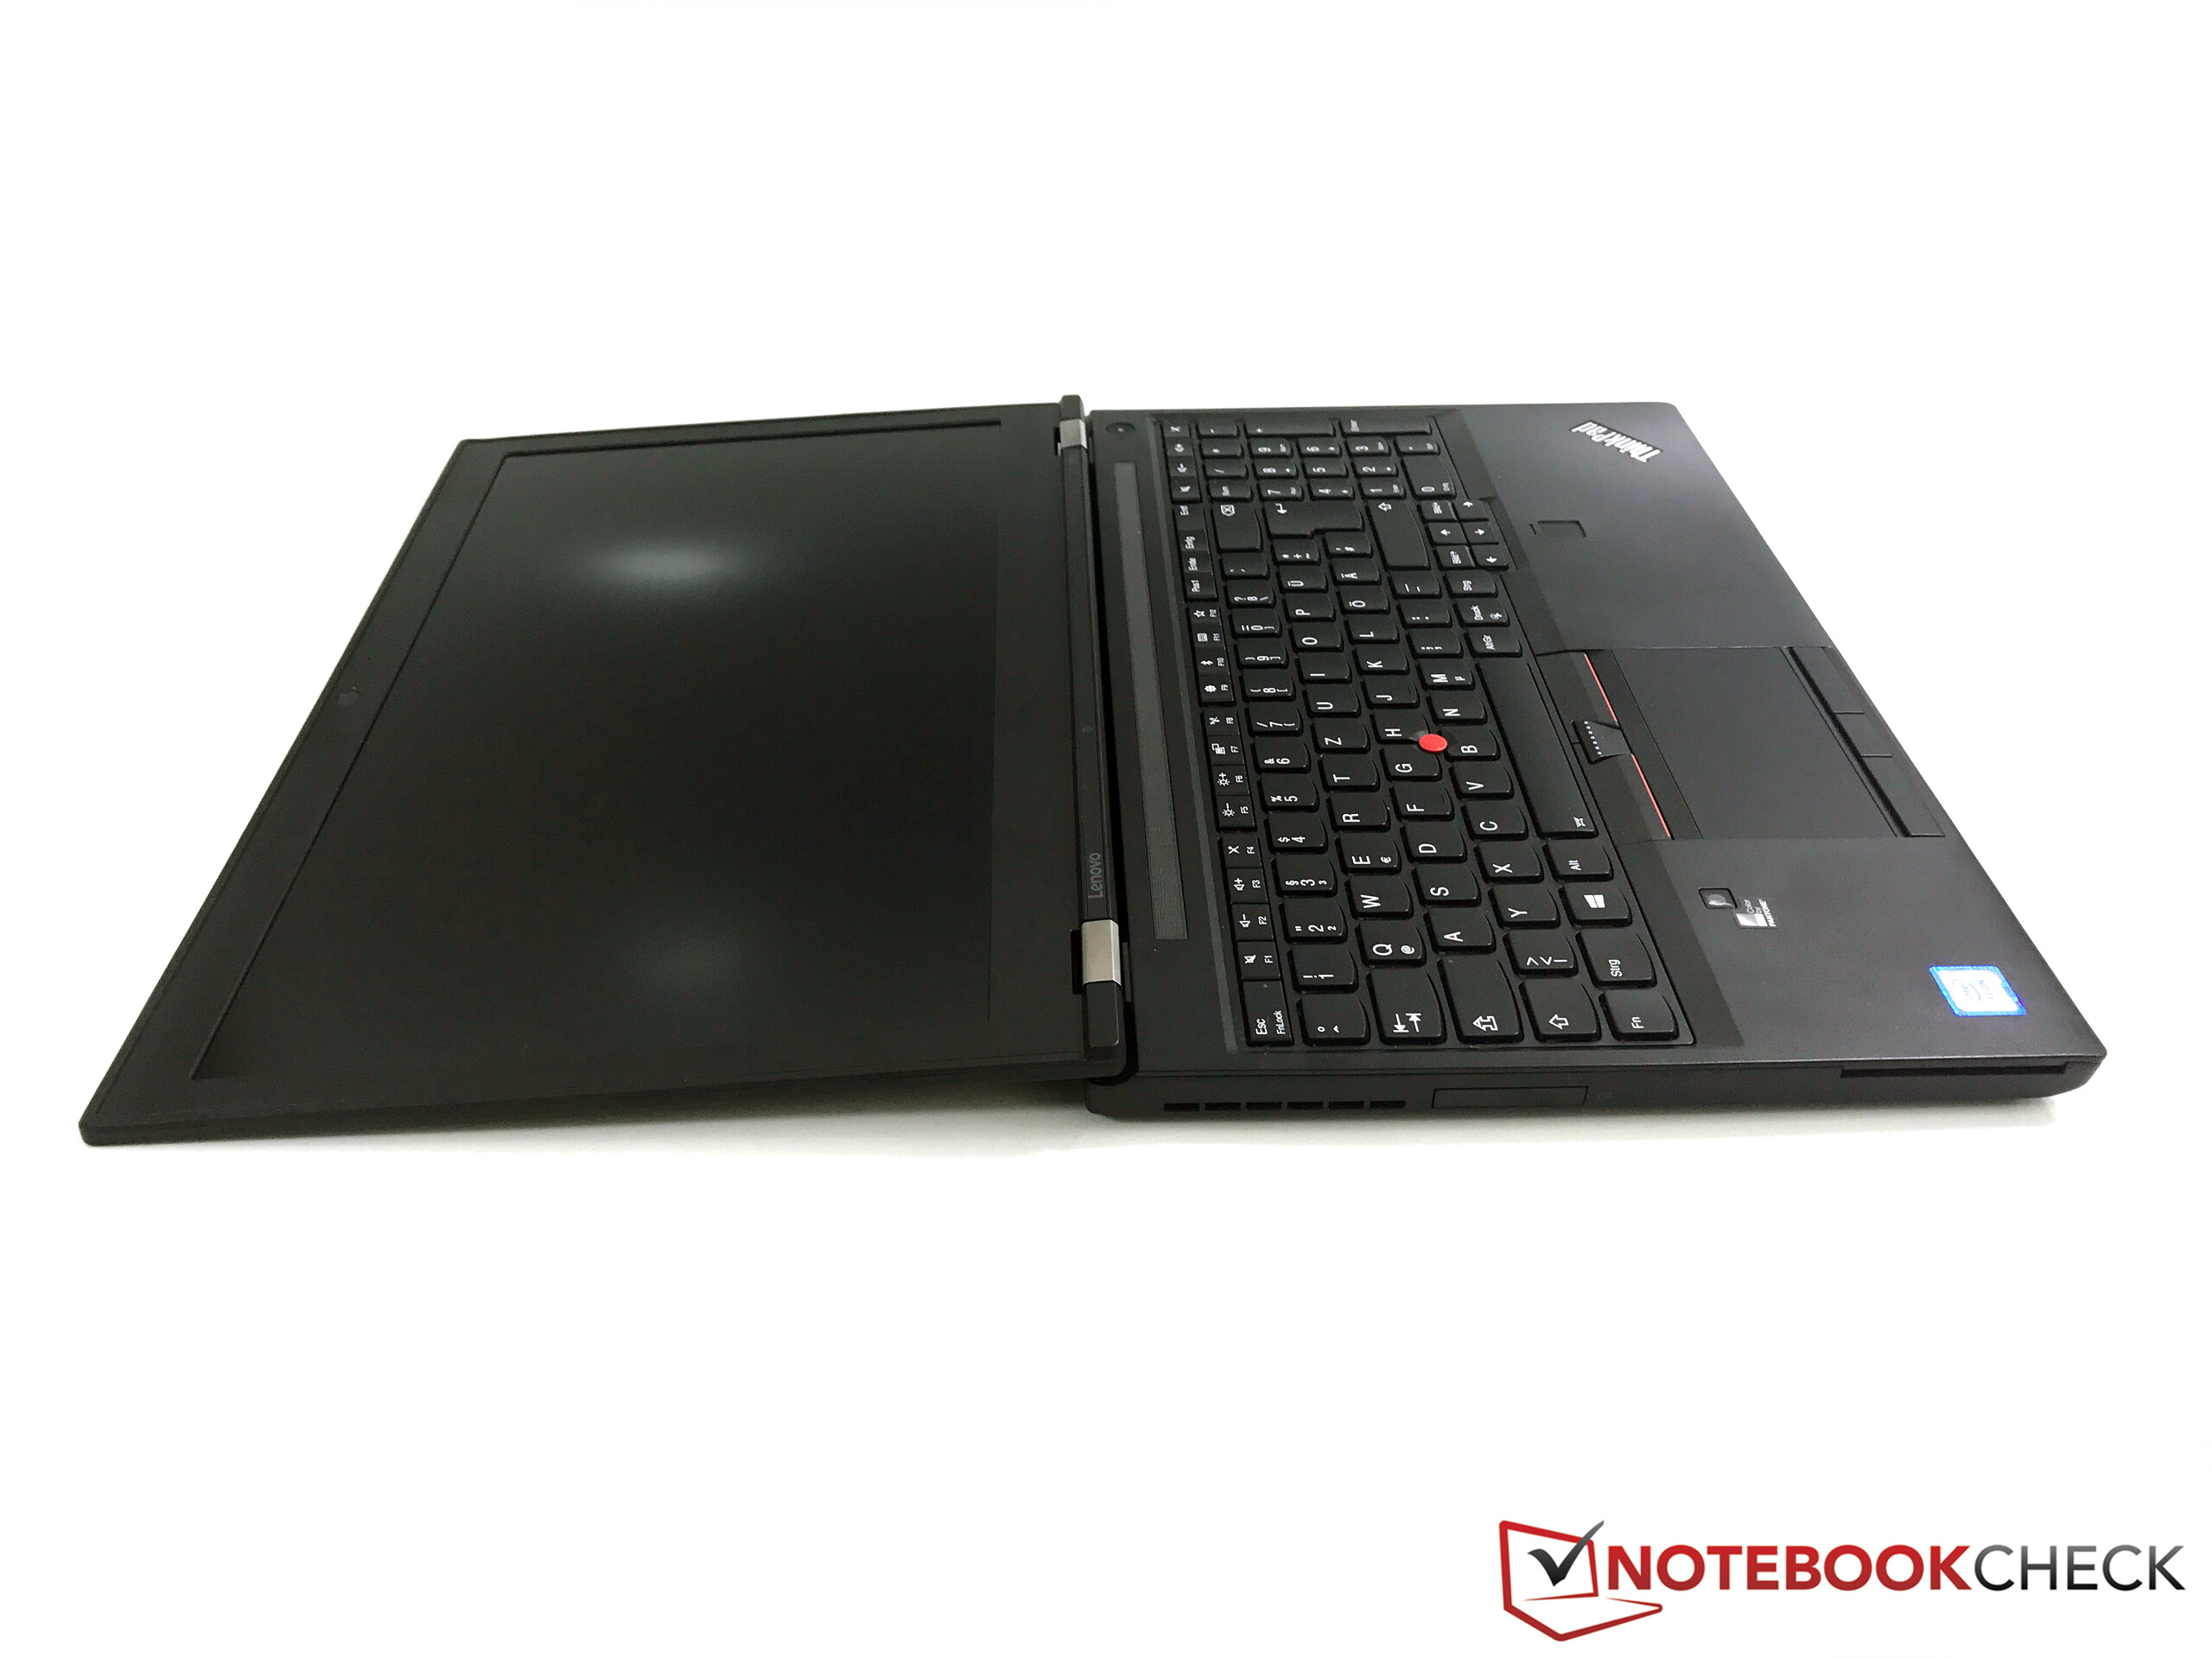
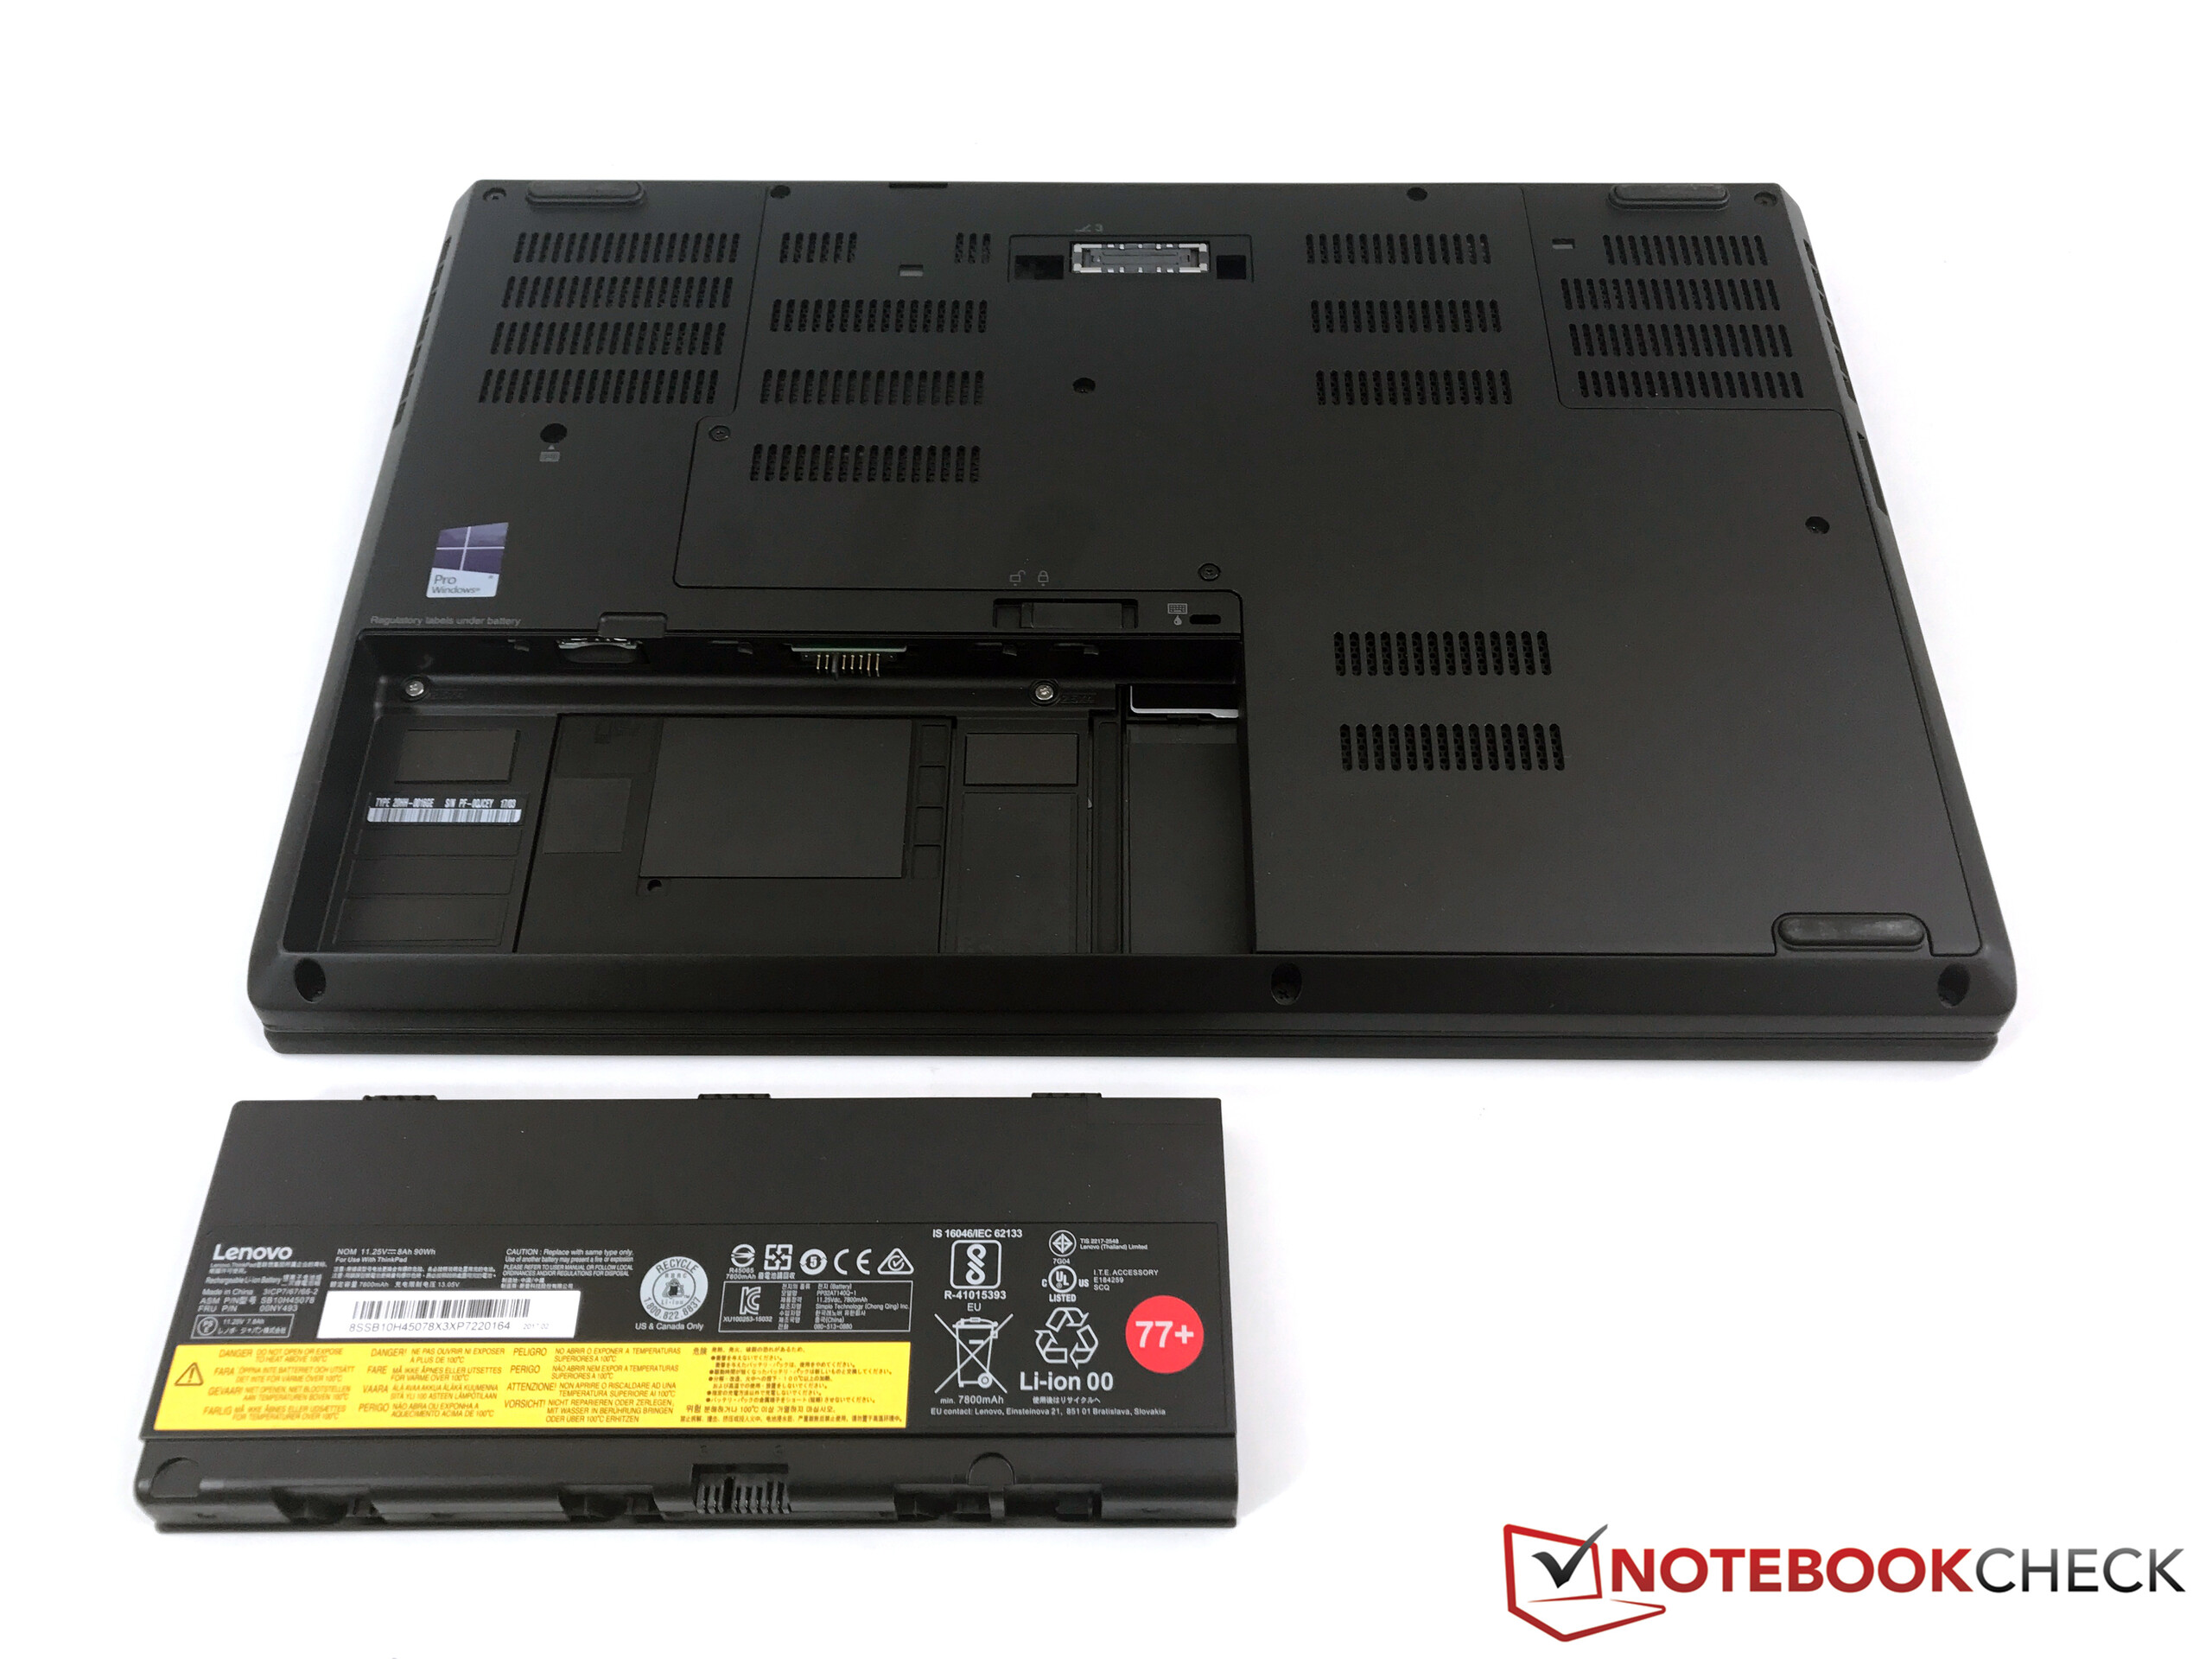
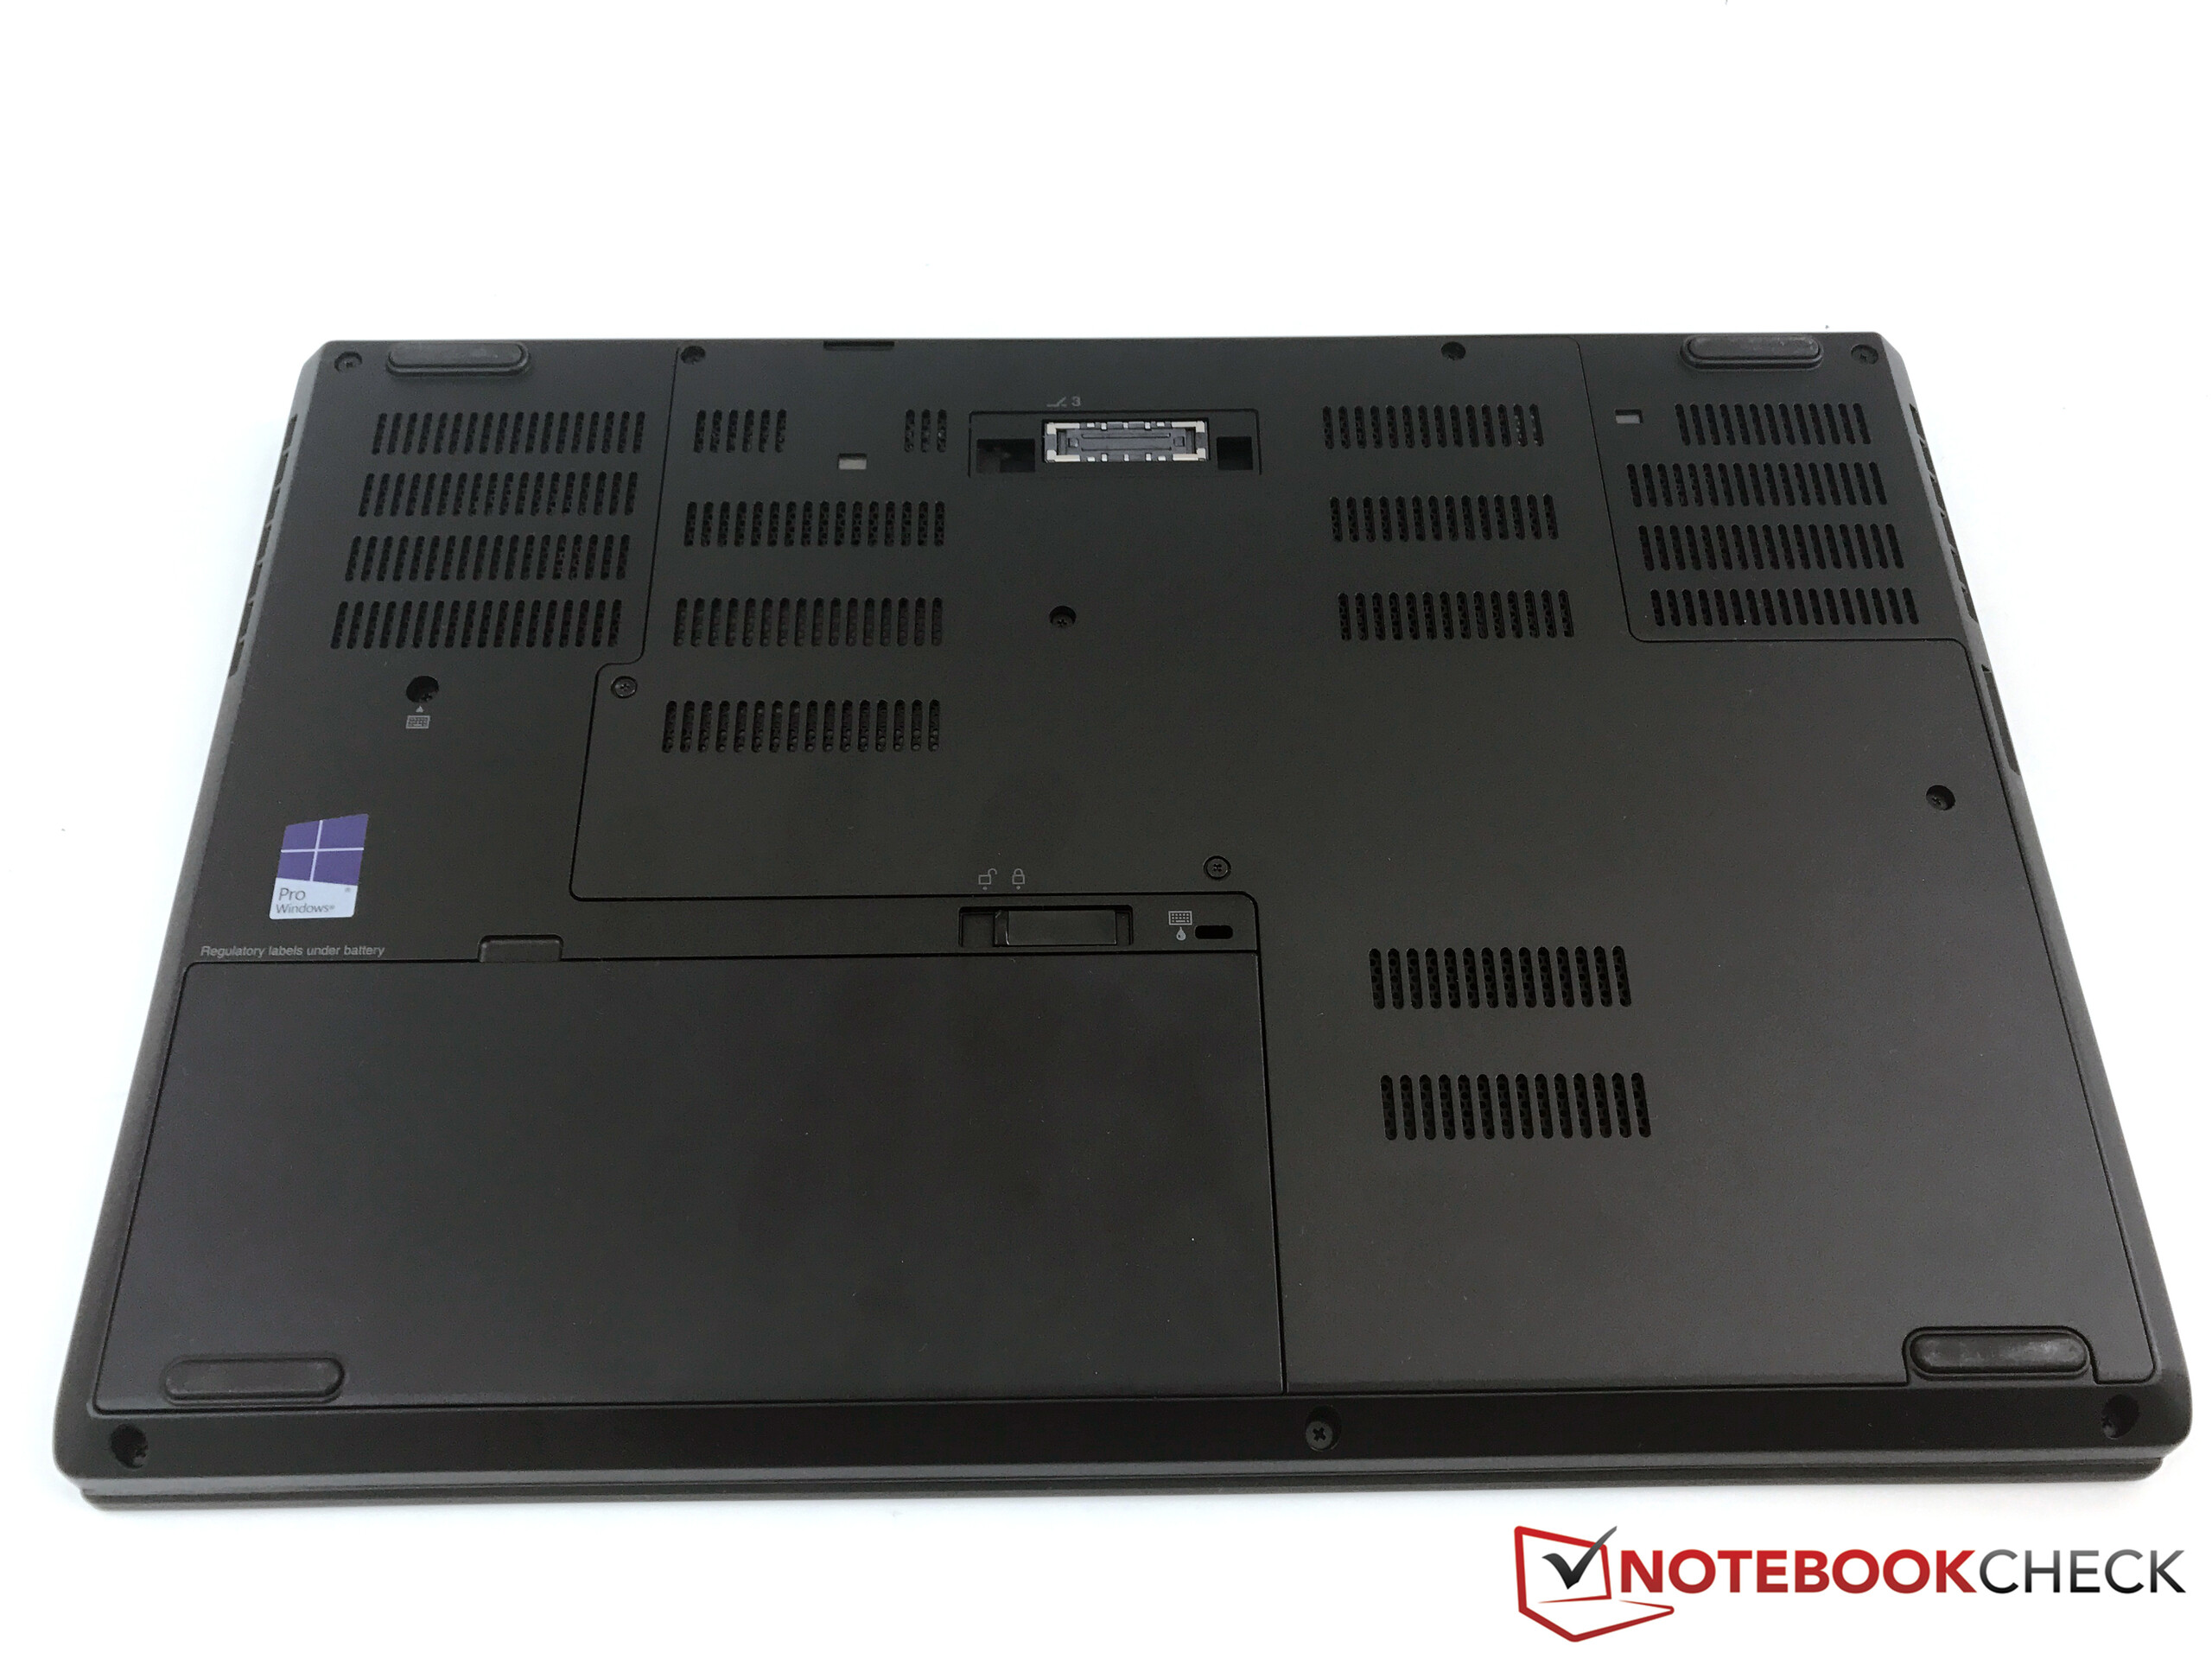
Come ci aspettavamo, la base classica in plastica non è cambiata- C'è ancora una lega di magnesio ed alluminio sotto la superficie, che fornisce un'elevata stabilità. Né i tentativi di pressione né di torsione creano problemi alla base, e la stabilità nel complesso regge il confronto con le costruzioni unibody. Nella parte anteriore del lato inferiore c'è la batteria, che si rimuove facilmente. Come nel ThinkPad P50, tuttavia, uno dei piedini di supporto si trova sulla batteria. Questo è un problema quando usate il dispositivo senza batteria.
La cover è leggermente gommata e la costruzione è in plastica rinforzata con fibra di vetro. La stabilità è decente, ma potrebbe essere migliore. Potete deformare facilmente la cover, ma non ne scaturiscono distorsioni dell'immagine. Le cerniere funzionano molto bene e reggono bene il display in posizione; l'angolo di apertura massimo è di 180 gradi.
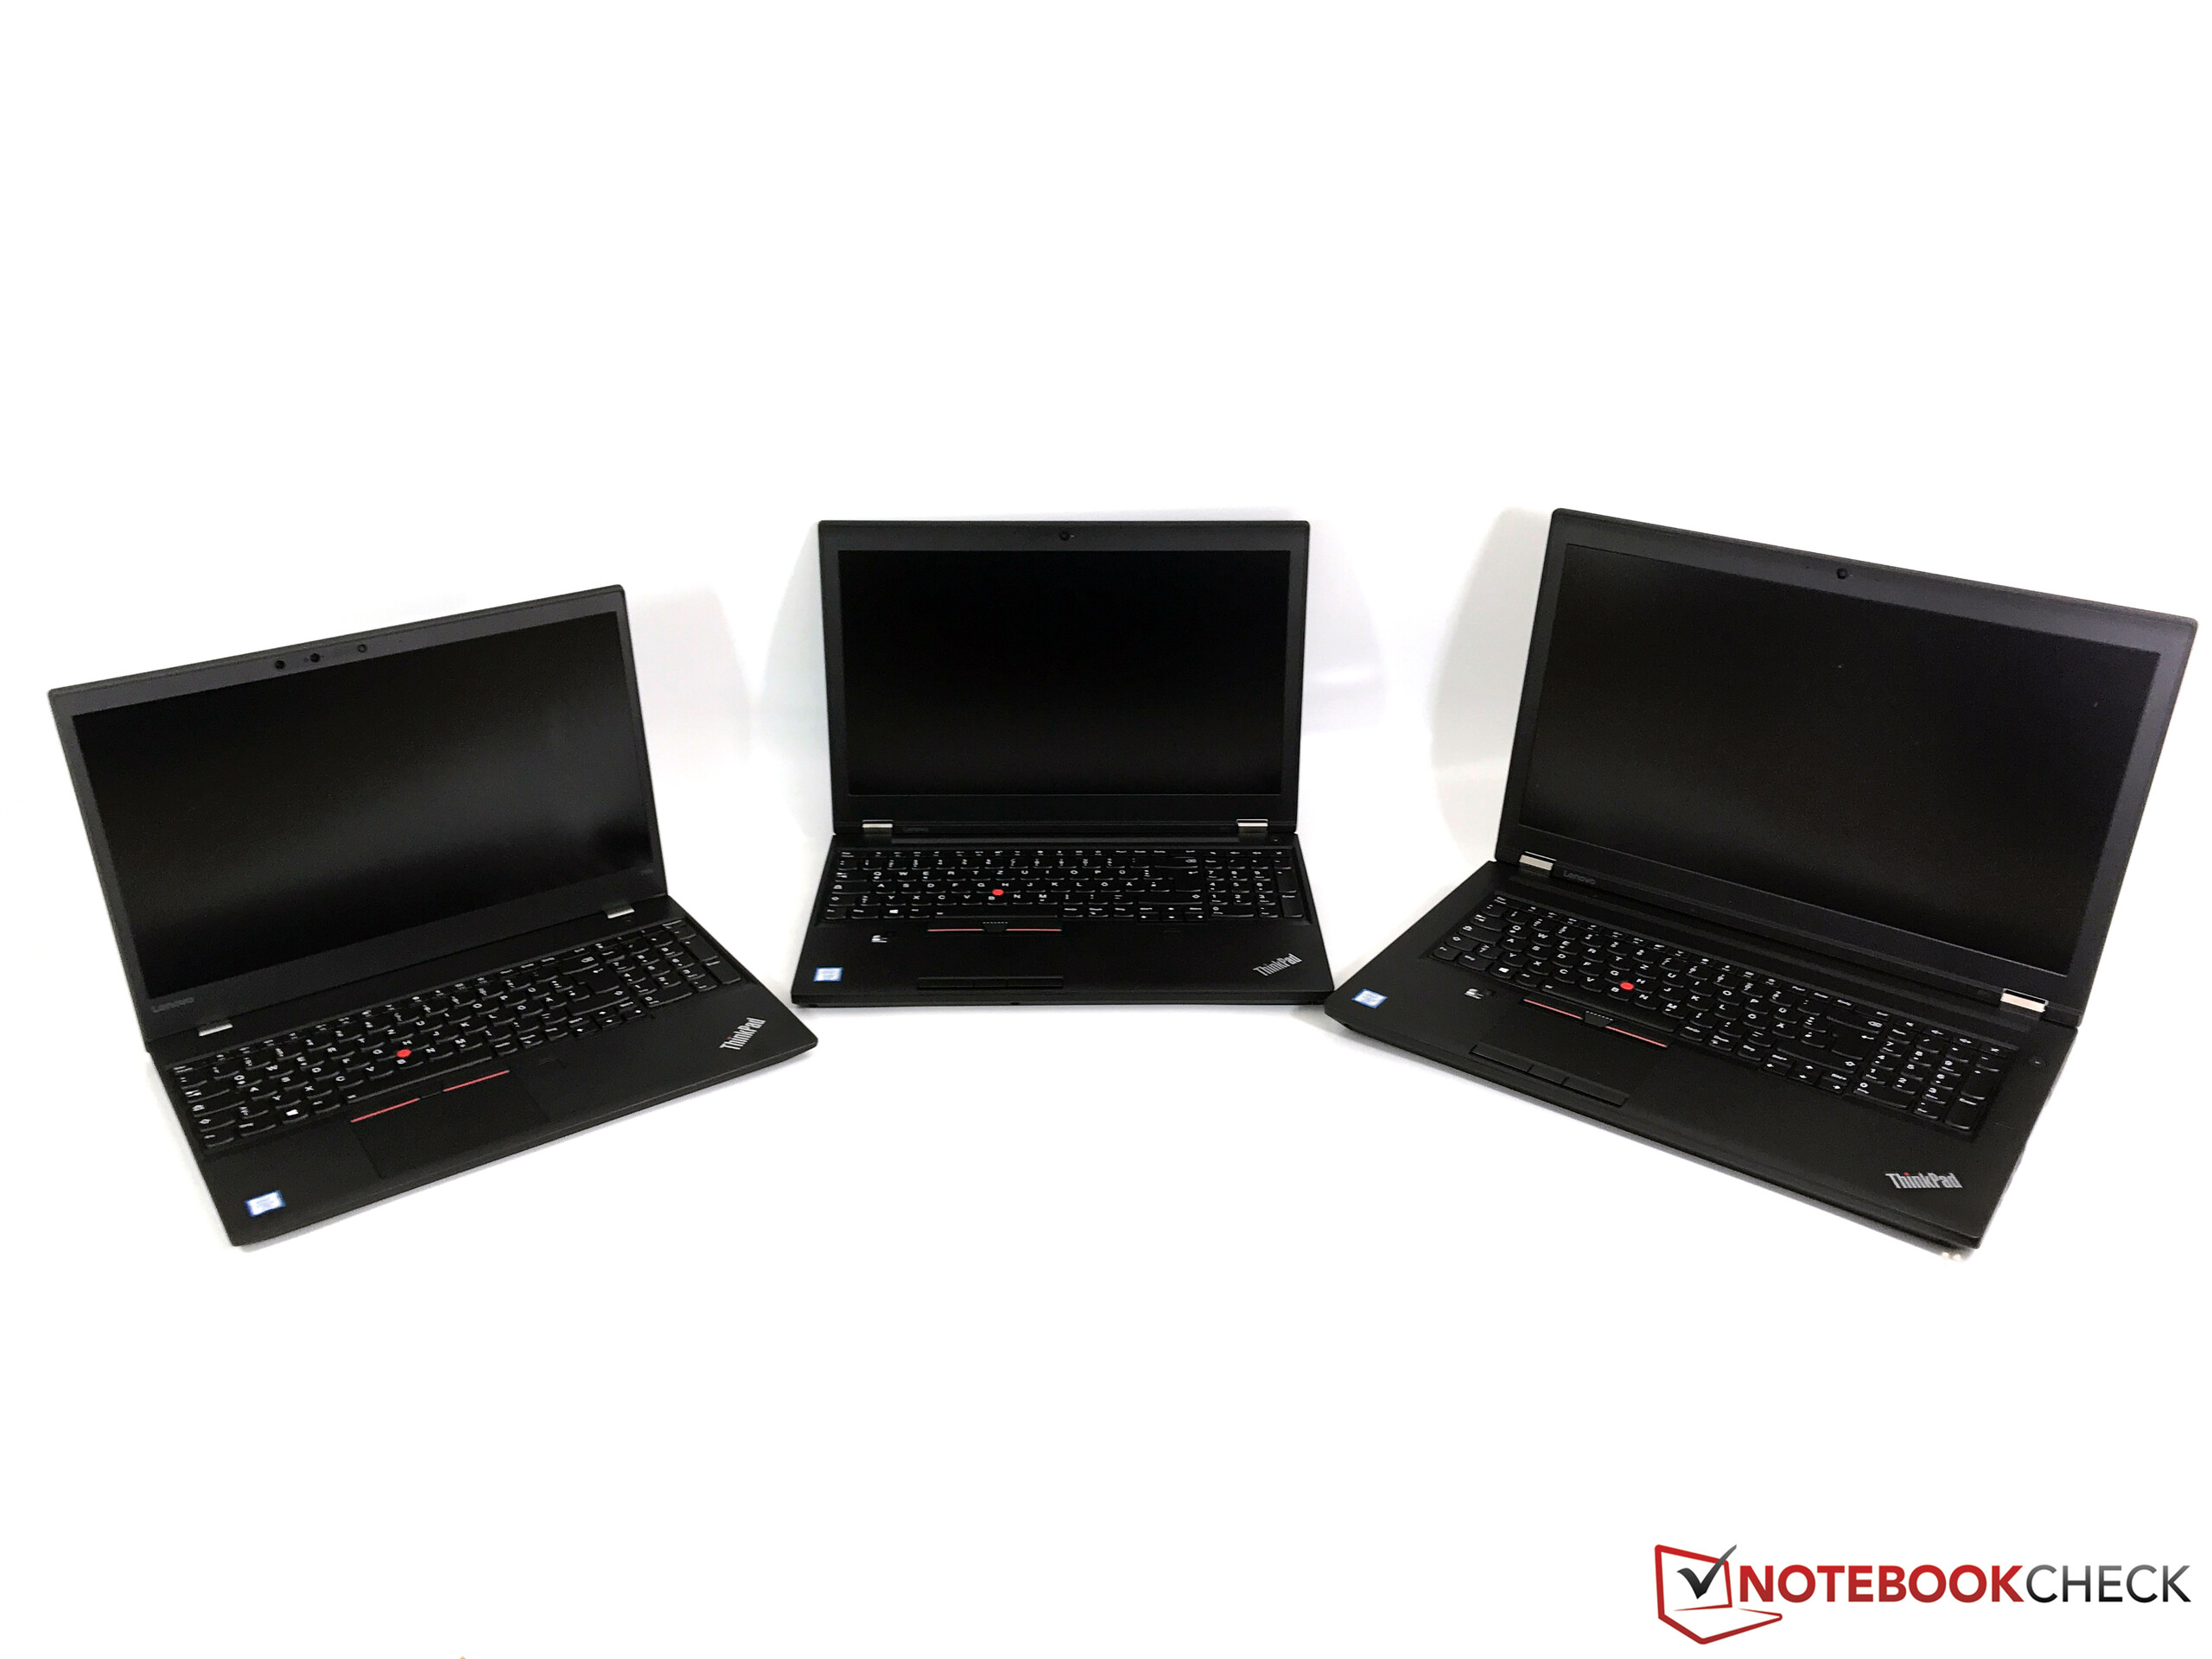
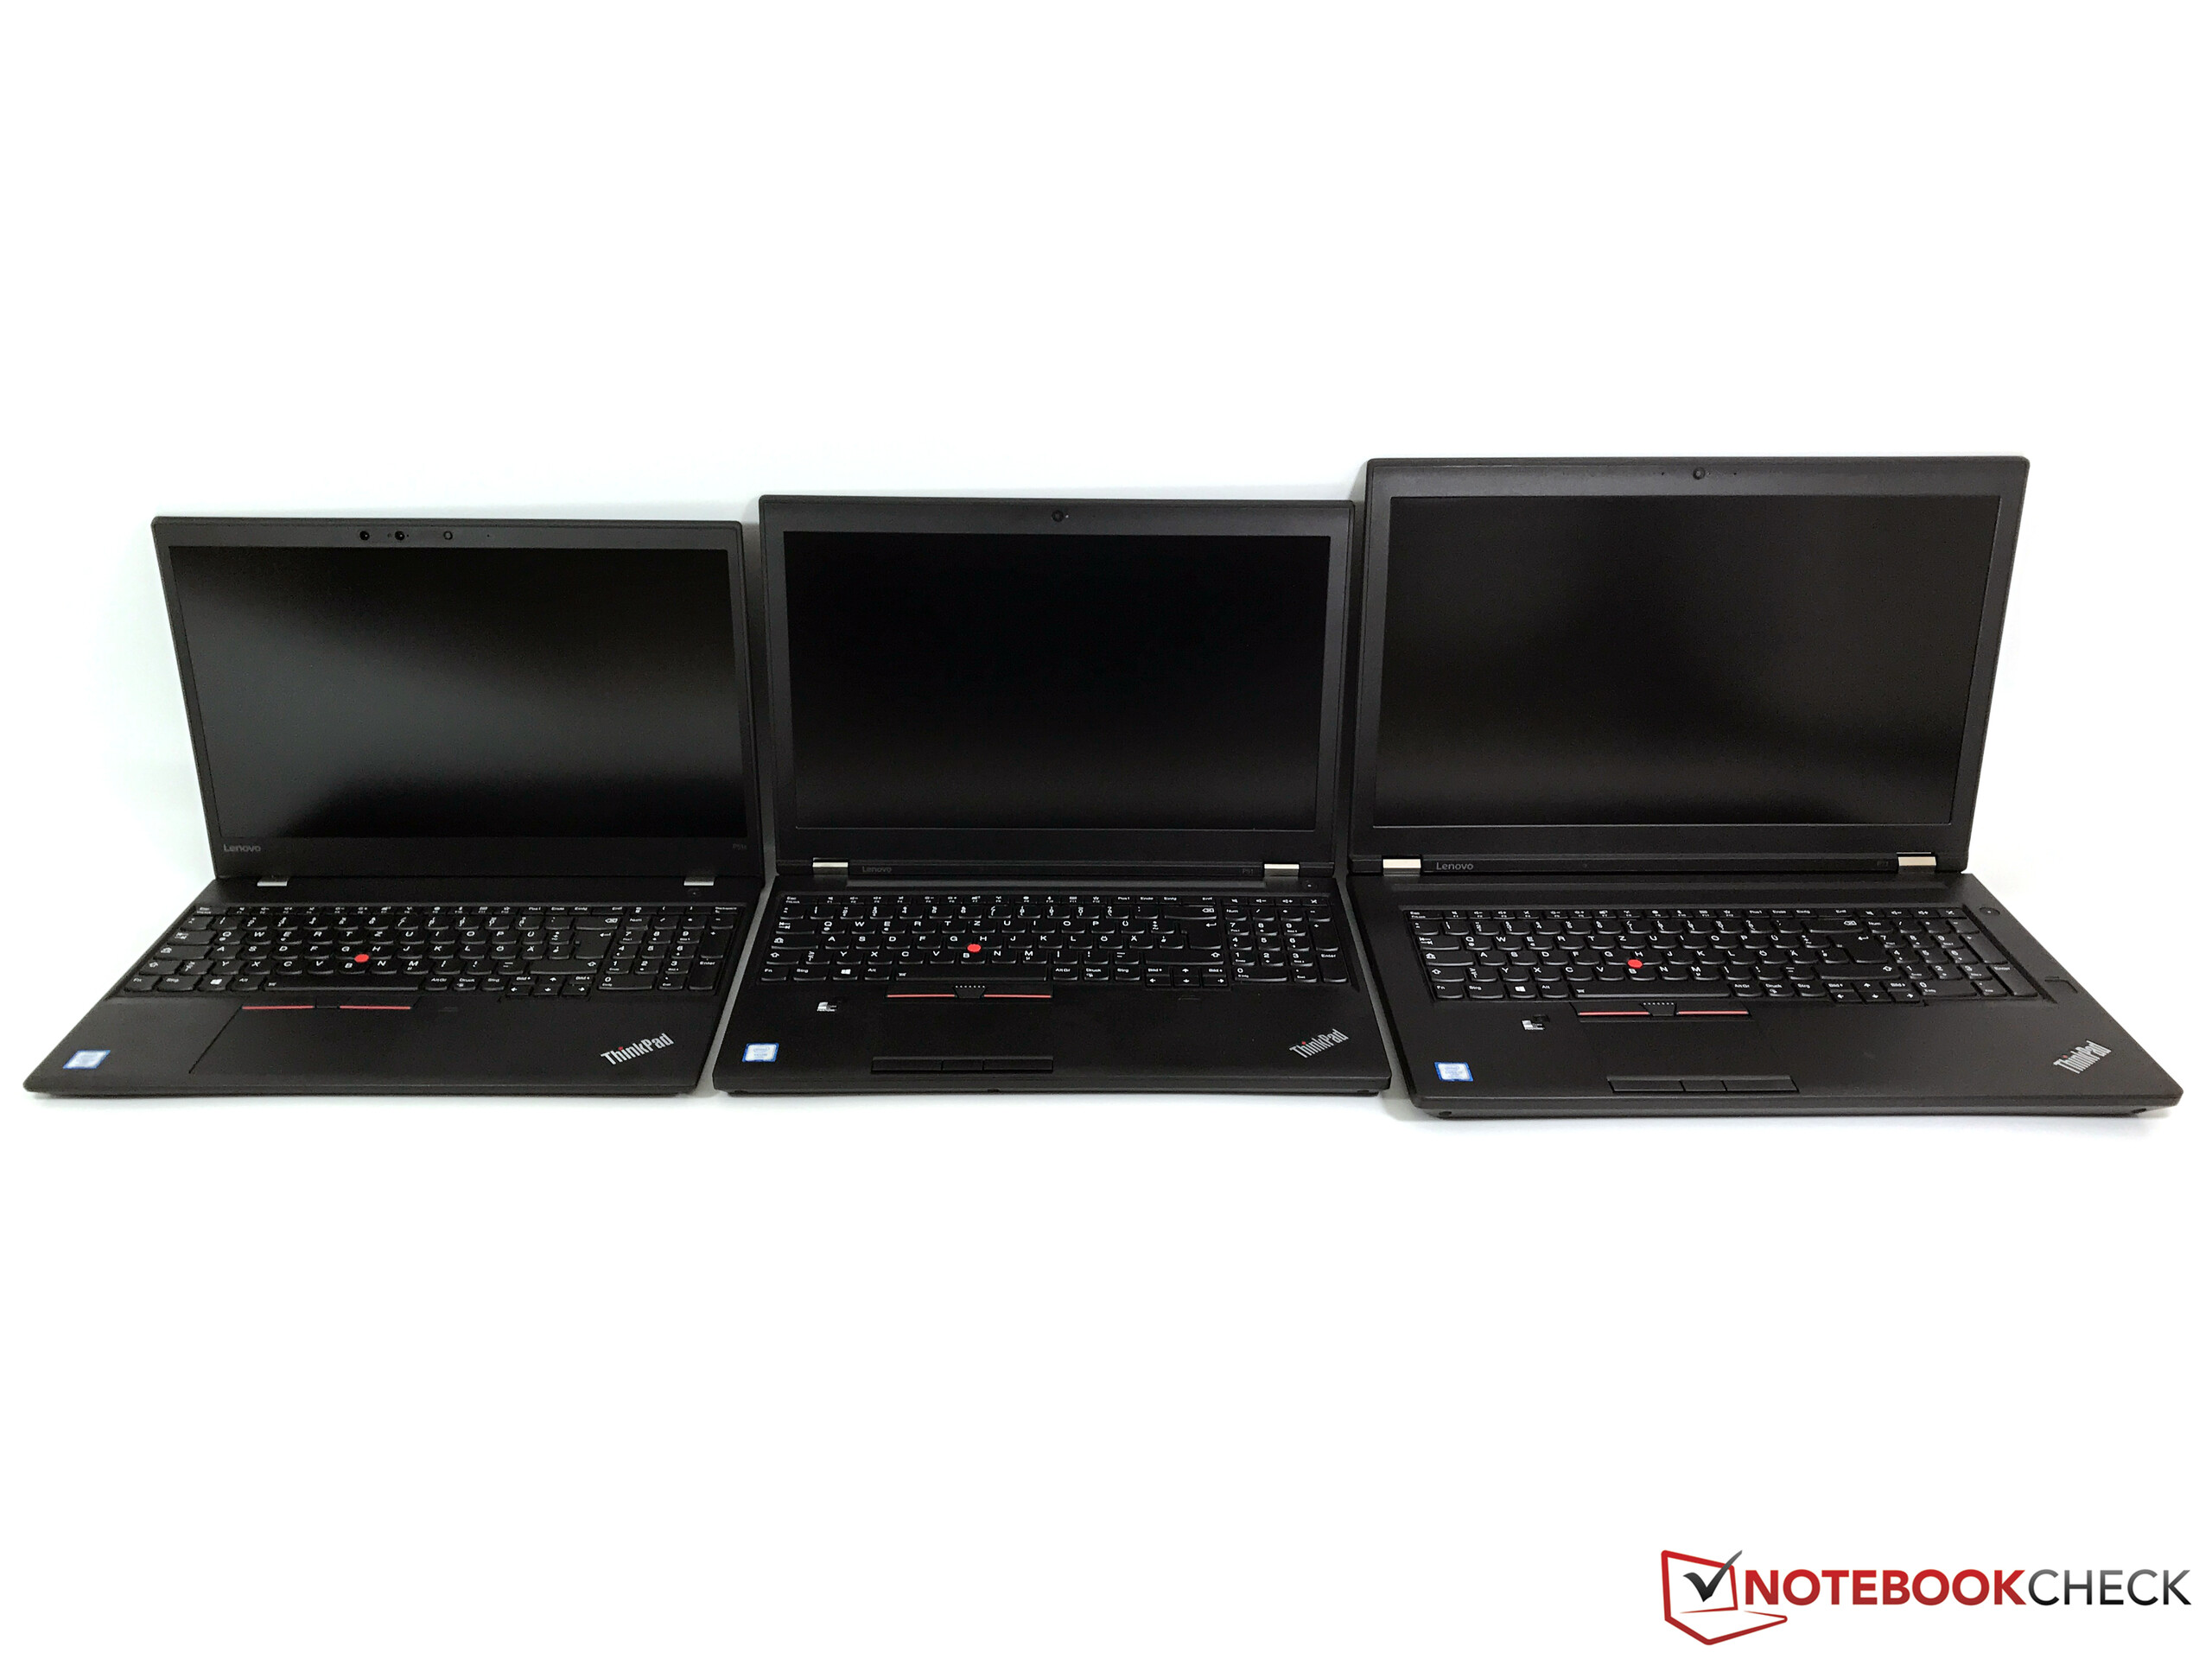
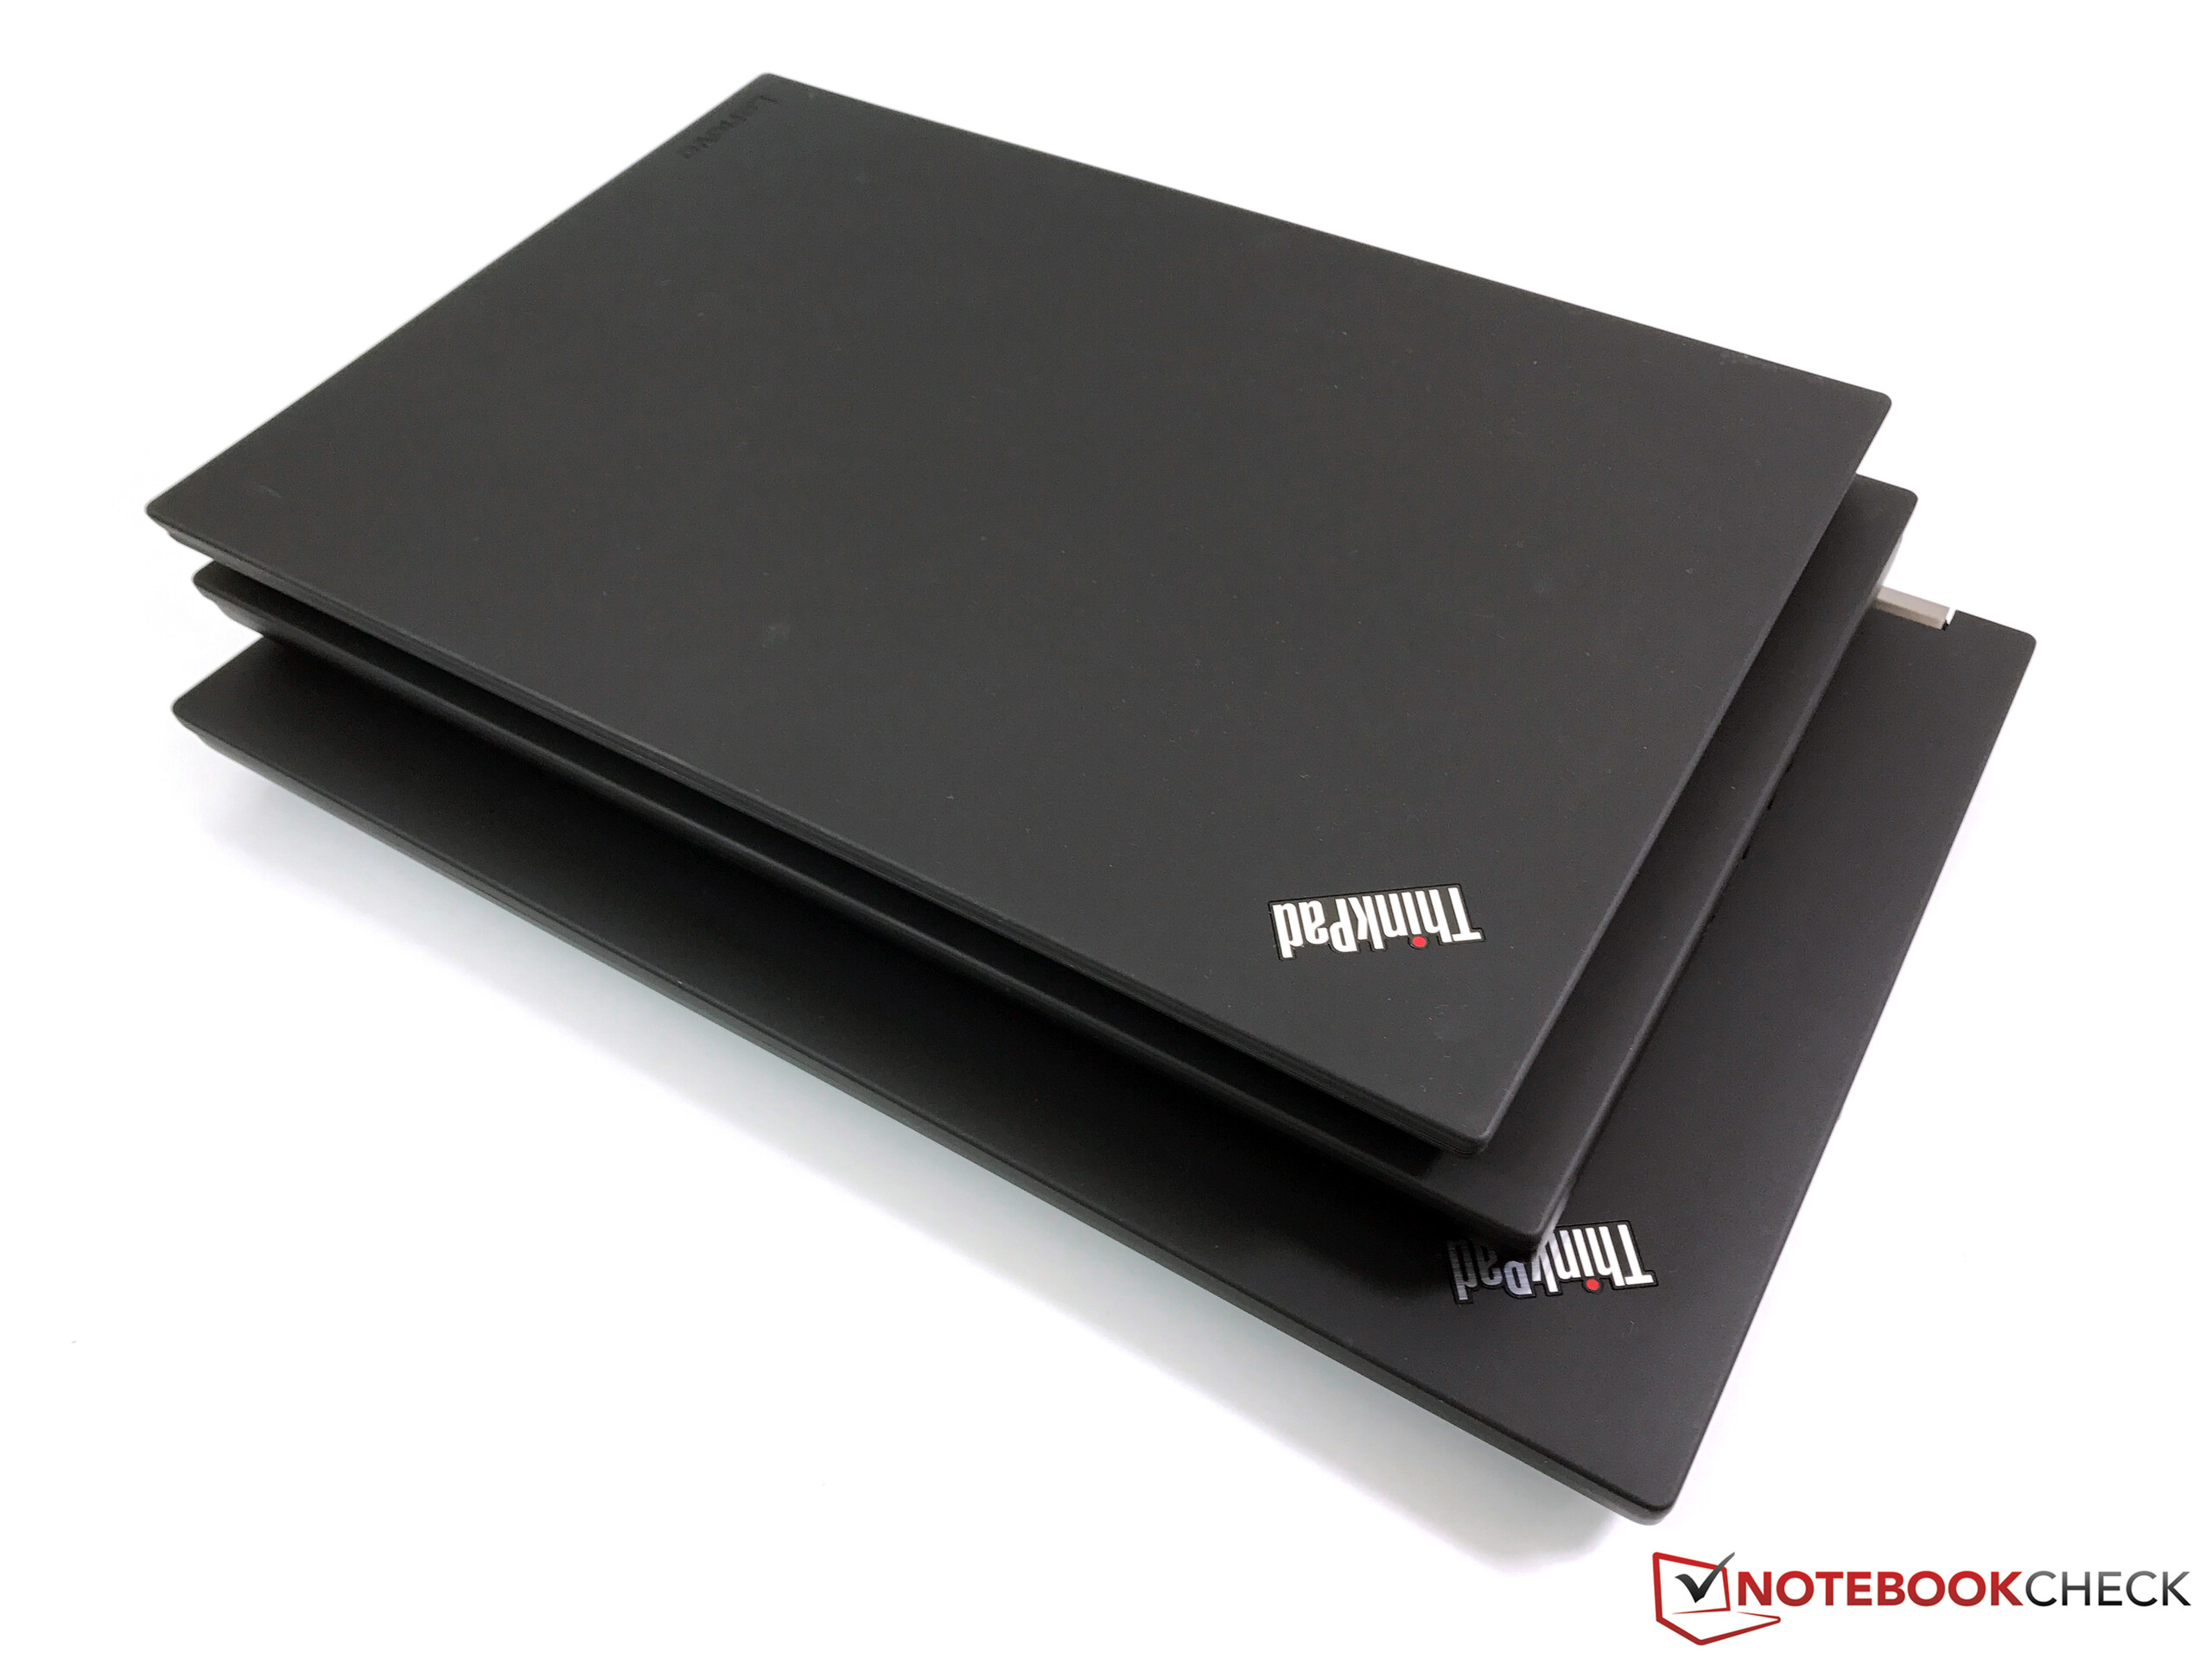
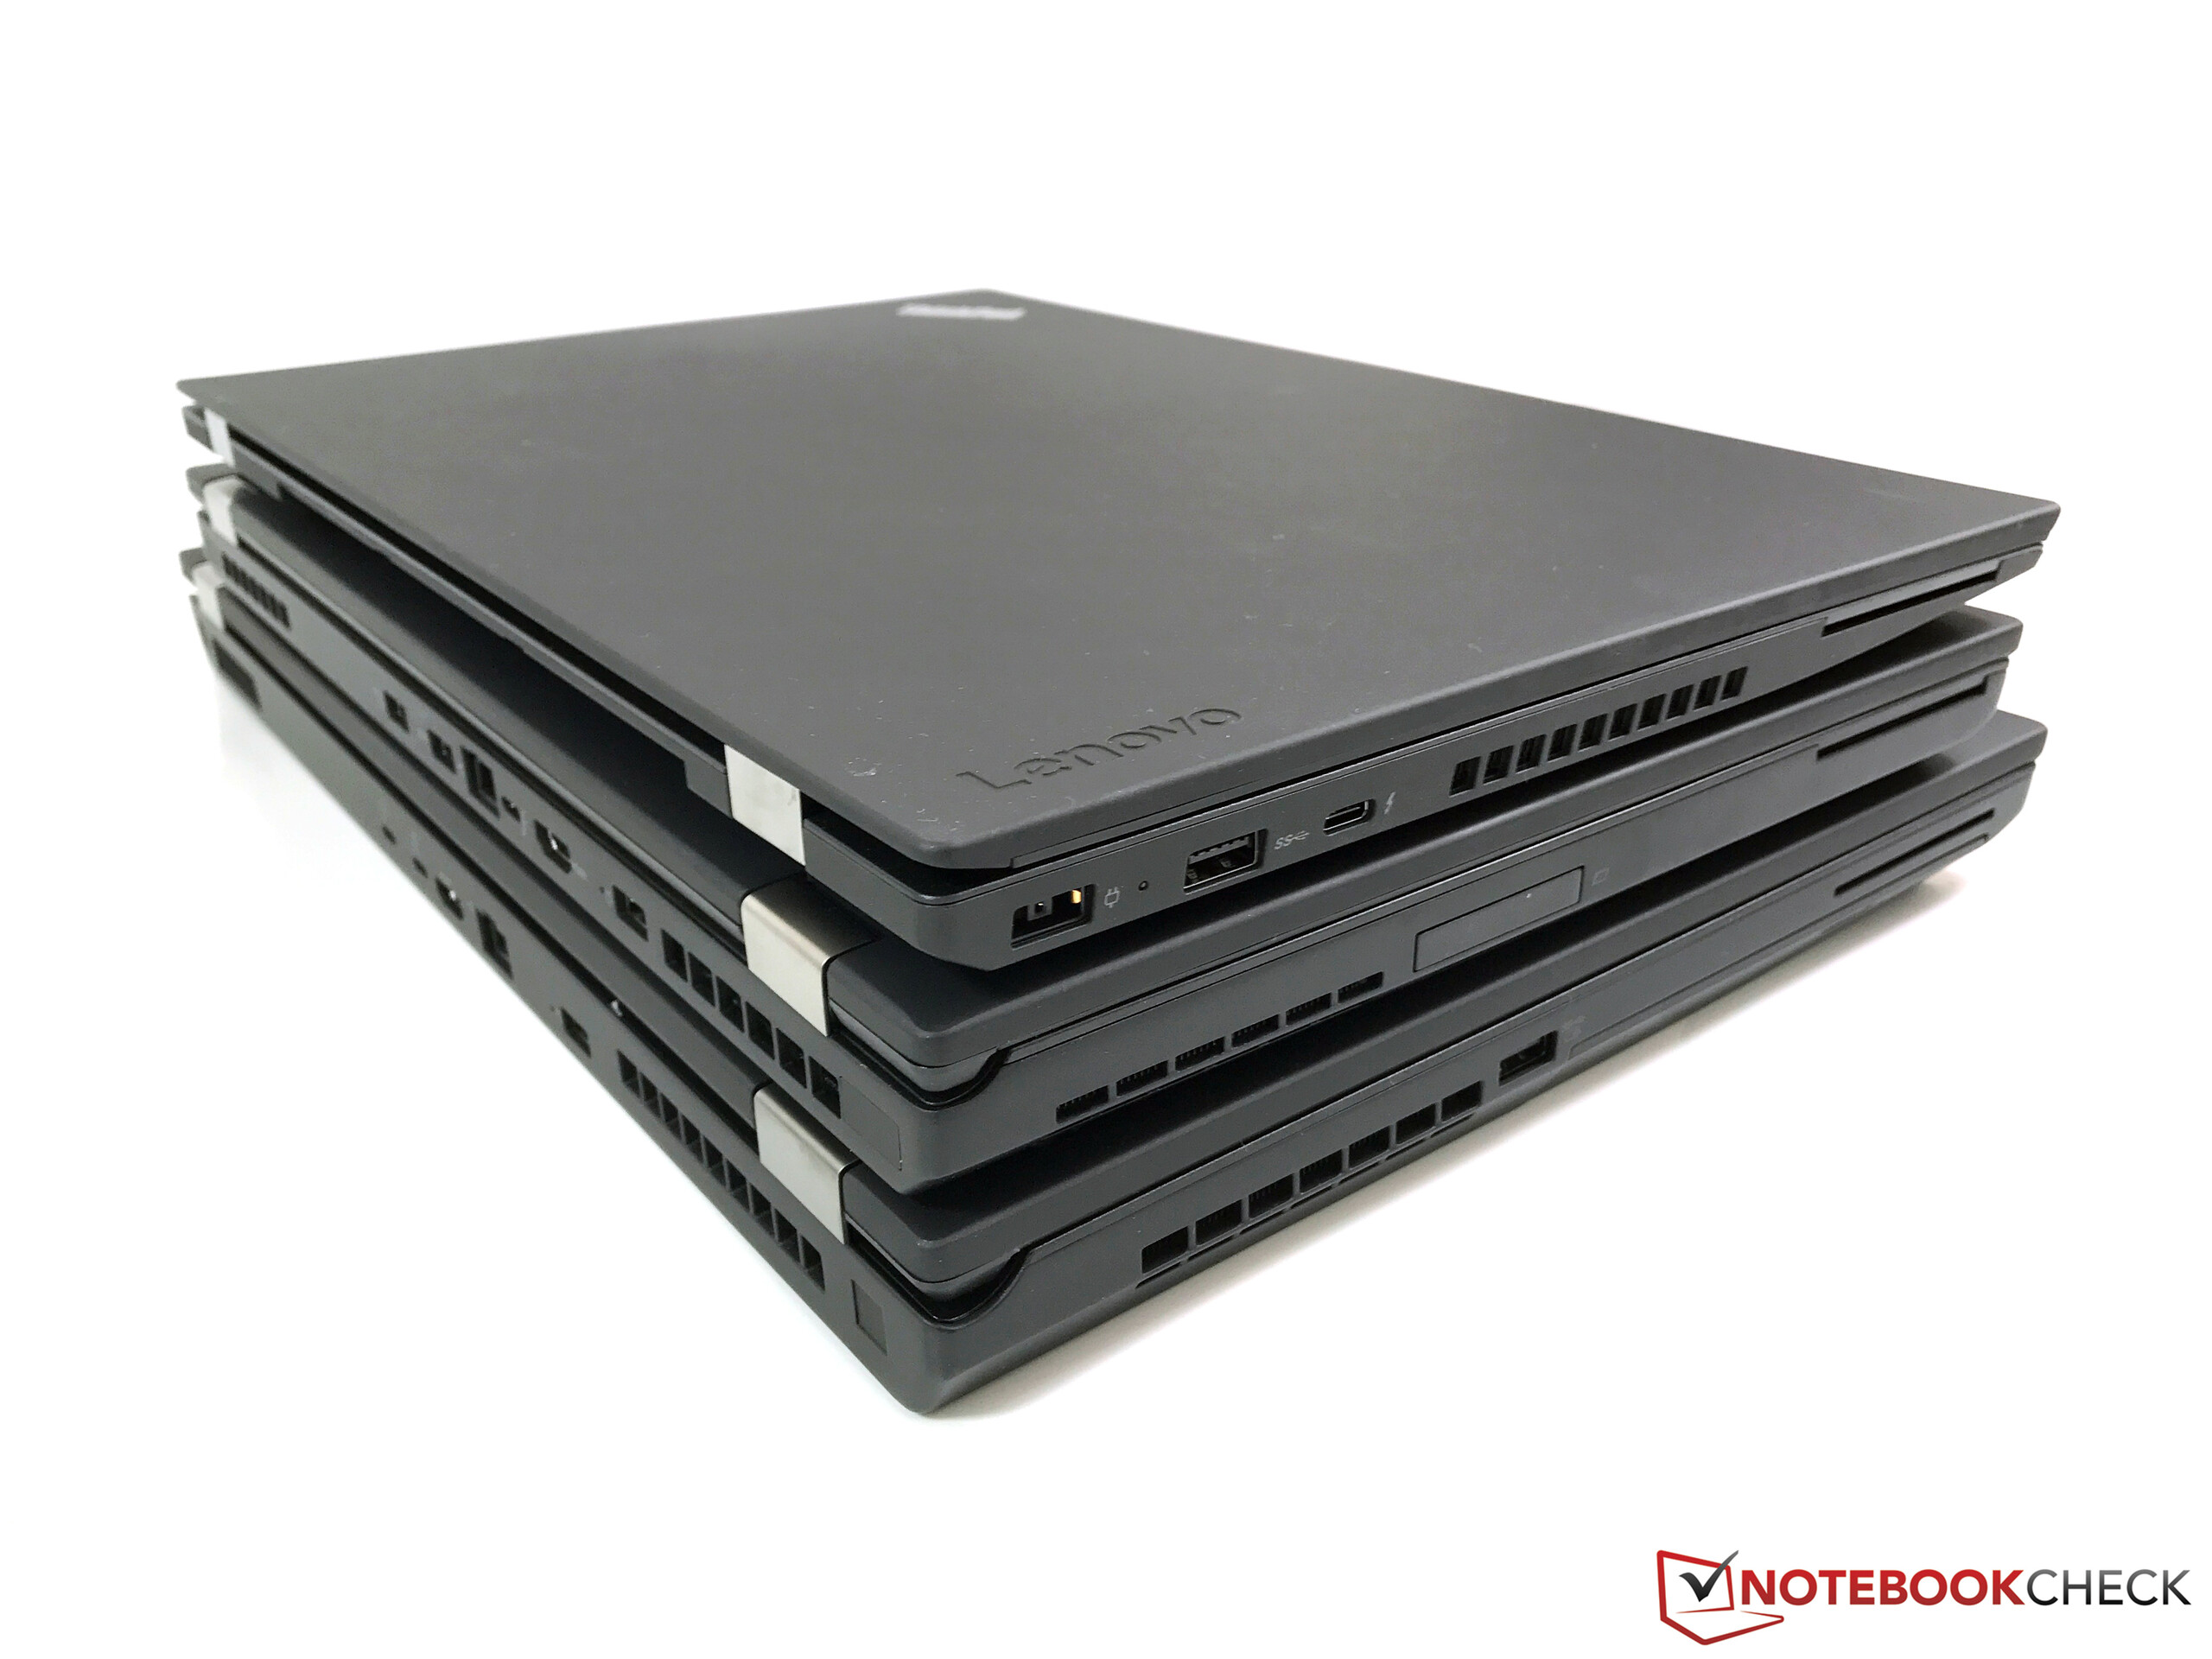
ThinkPad P51 vs. P51s vs. P71
Abbiamo avuto la possibilità di confrontare tutte le tre attuali workstations mobile Lenovo e scattare alcune foto. Il ThinkPad P51s, che ha lo stesso chassis del ThinkPad T570, è nettamente più sottile e anche più compatto rispetto al P51. Il modello di test con processore quad-core e Quadro M2200 è ovviamente più potente. Il ThinkPad P71 d'altro canto è molto più ingombrante ed ha un'impronta più grande.
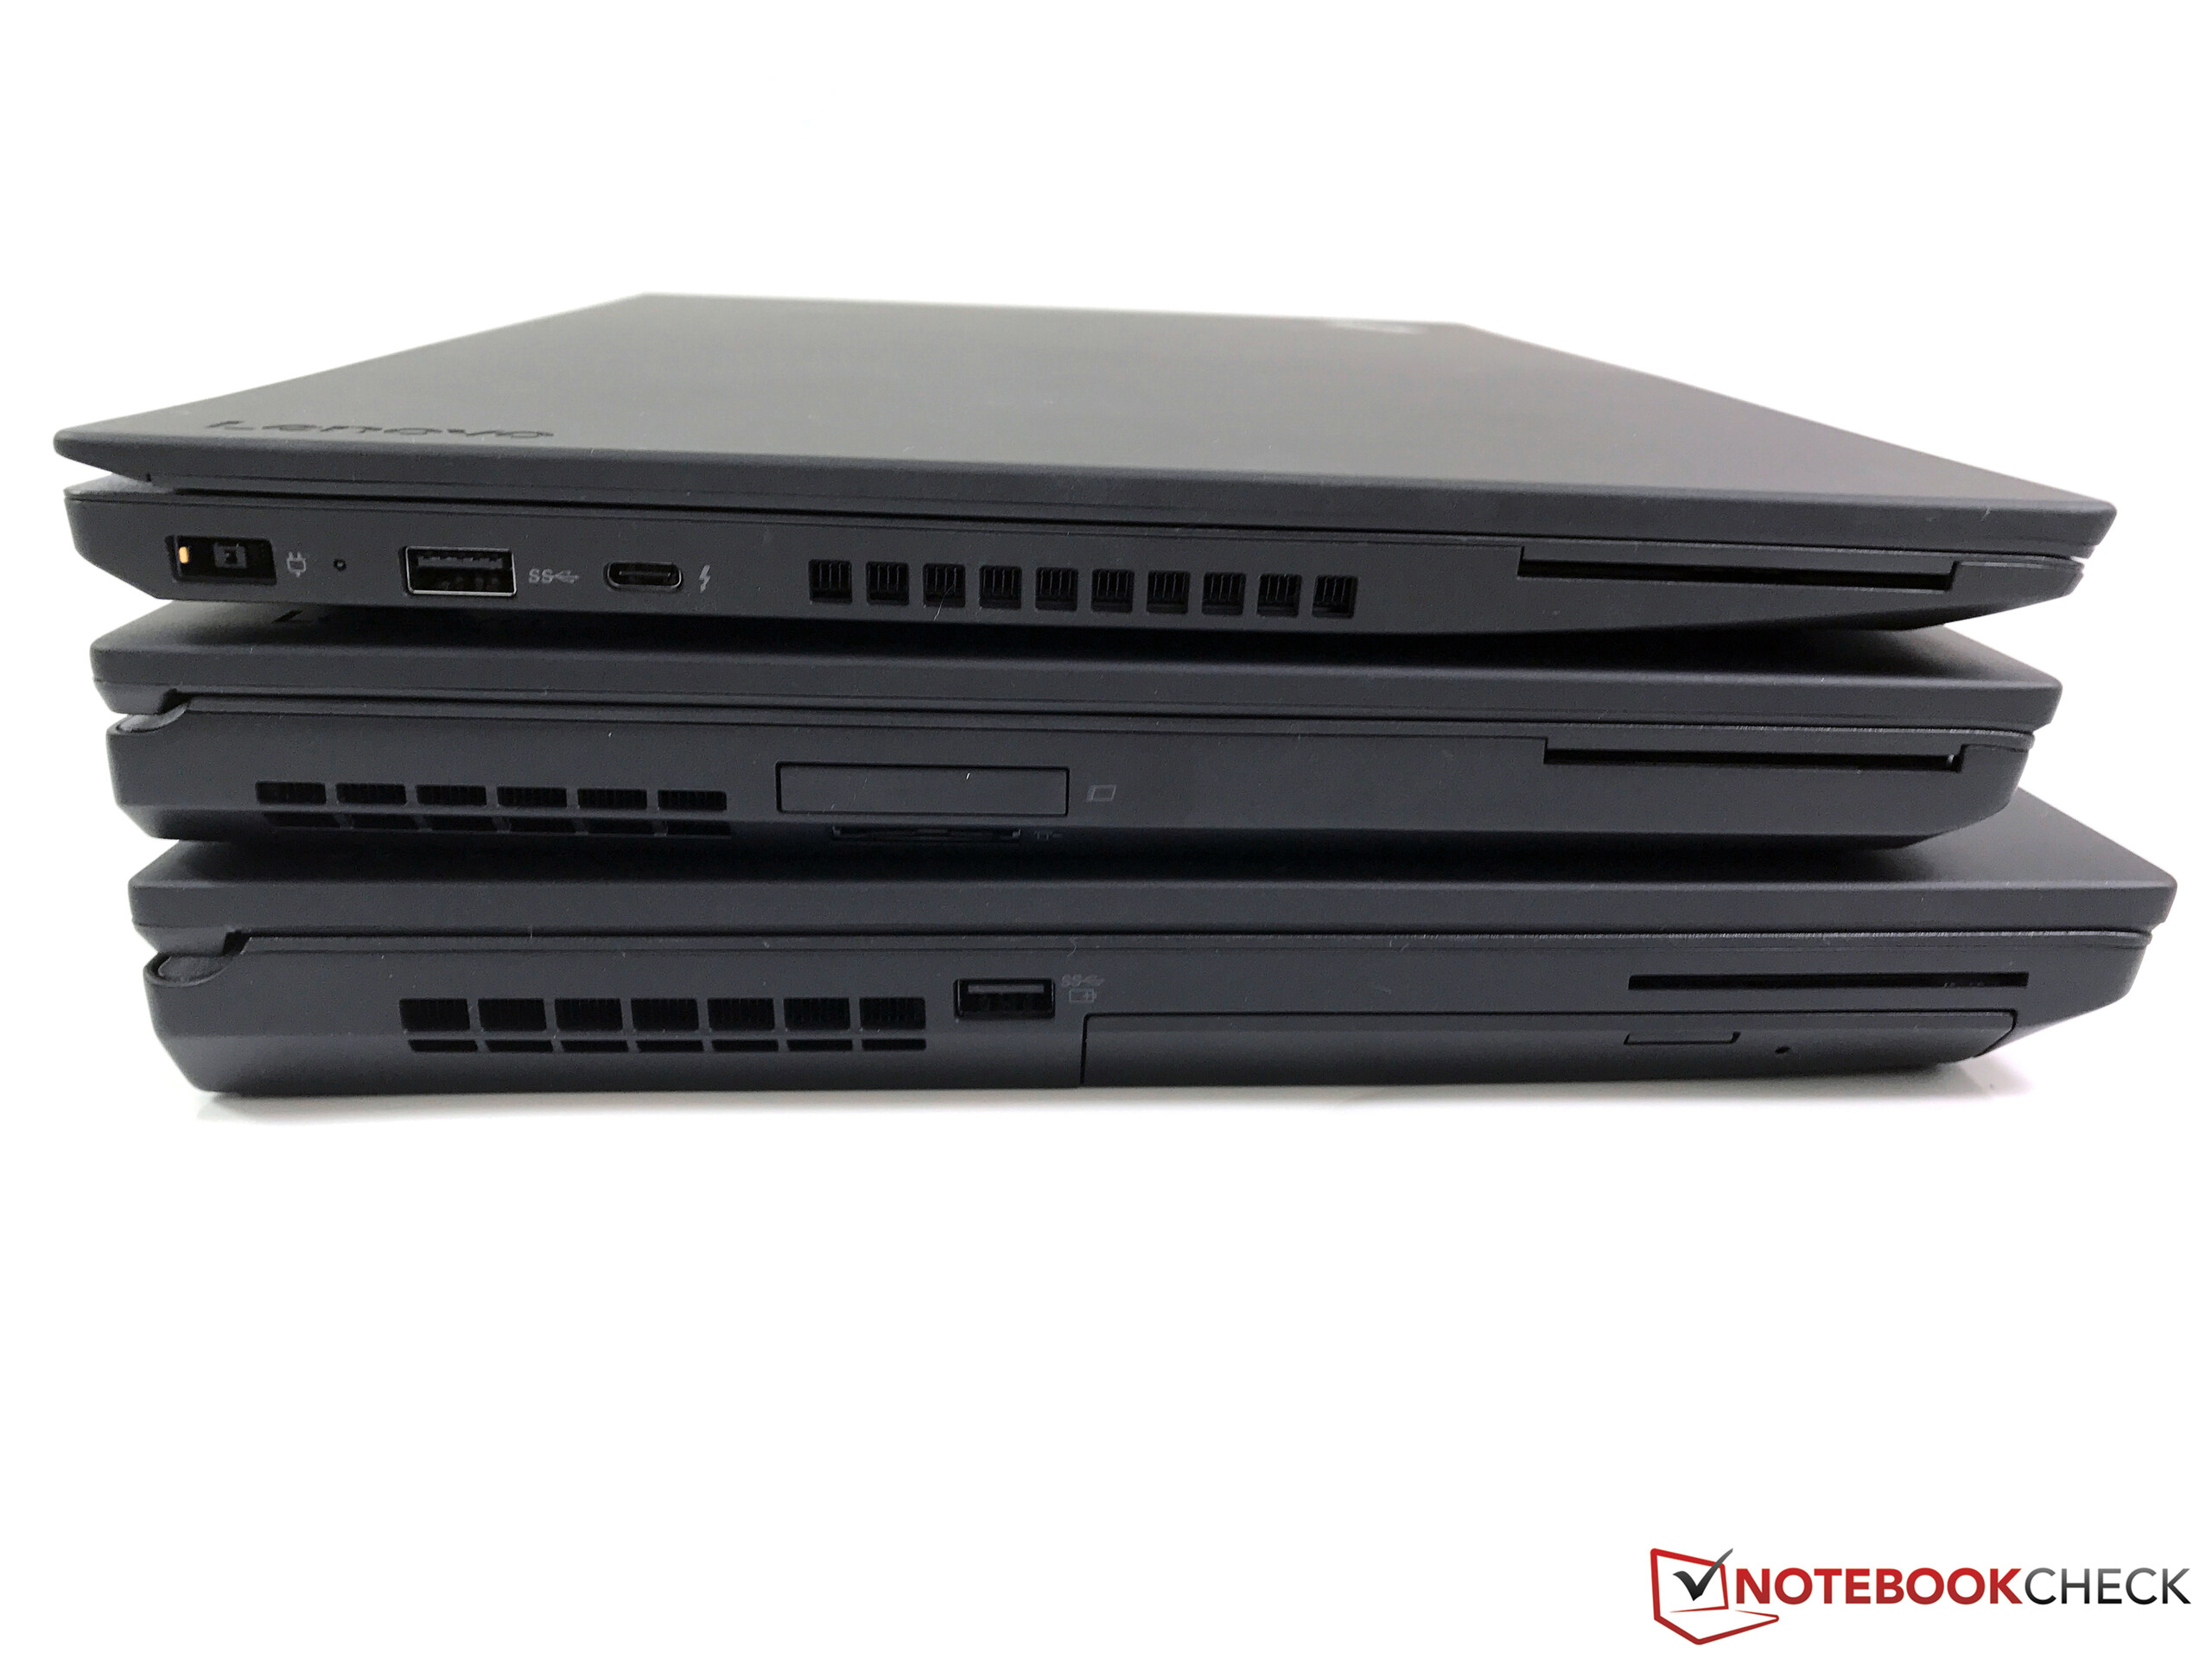
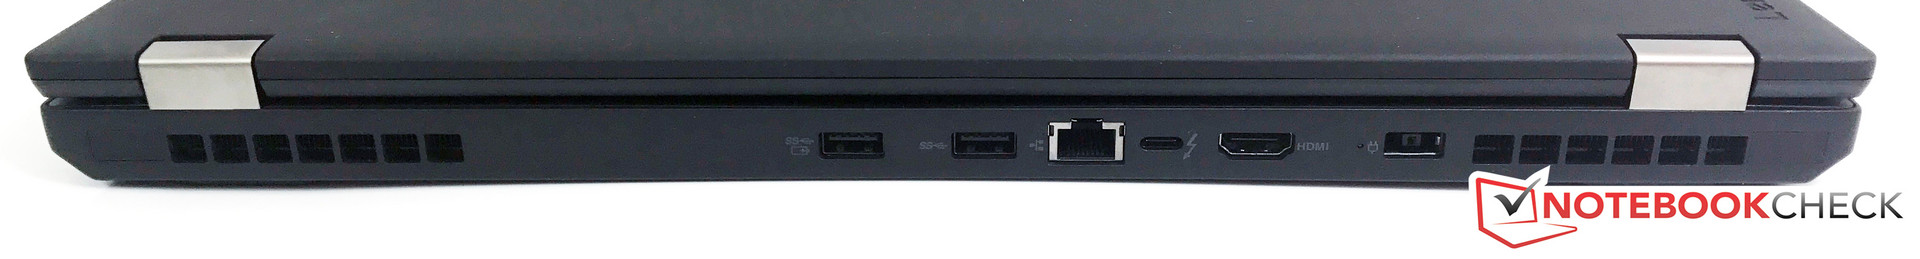
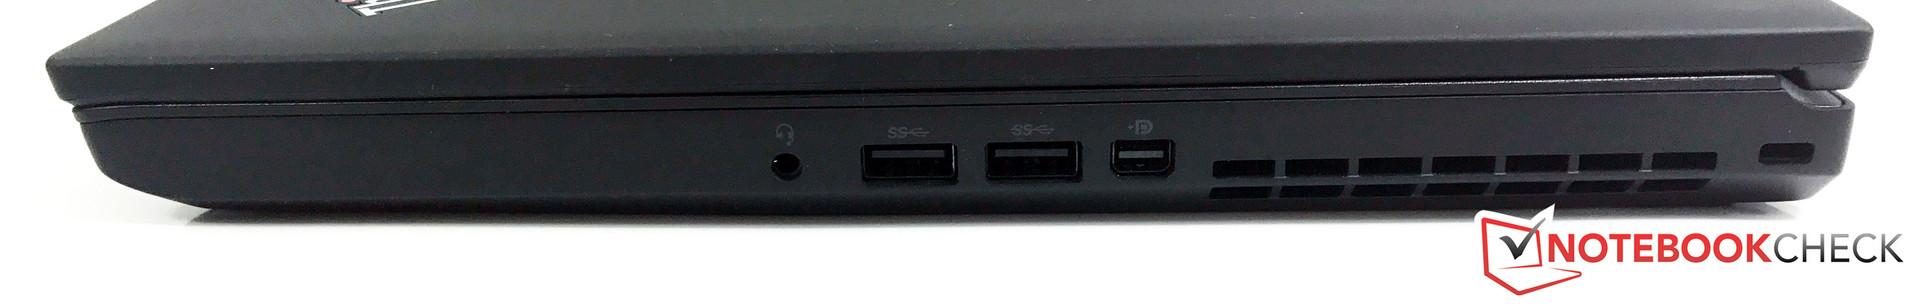
Connettività
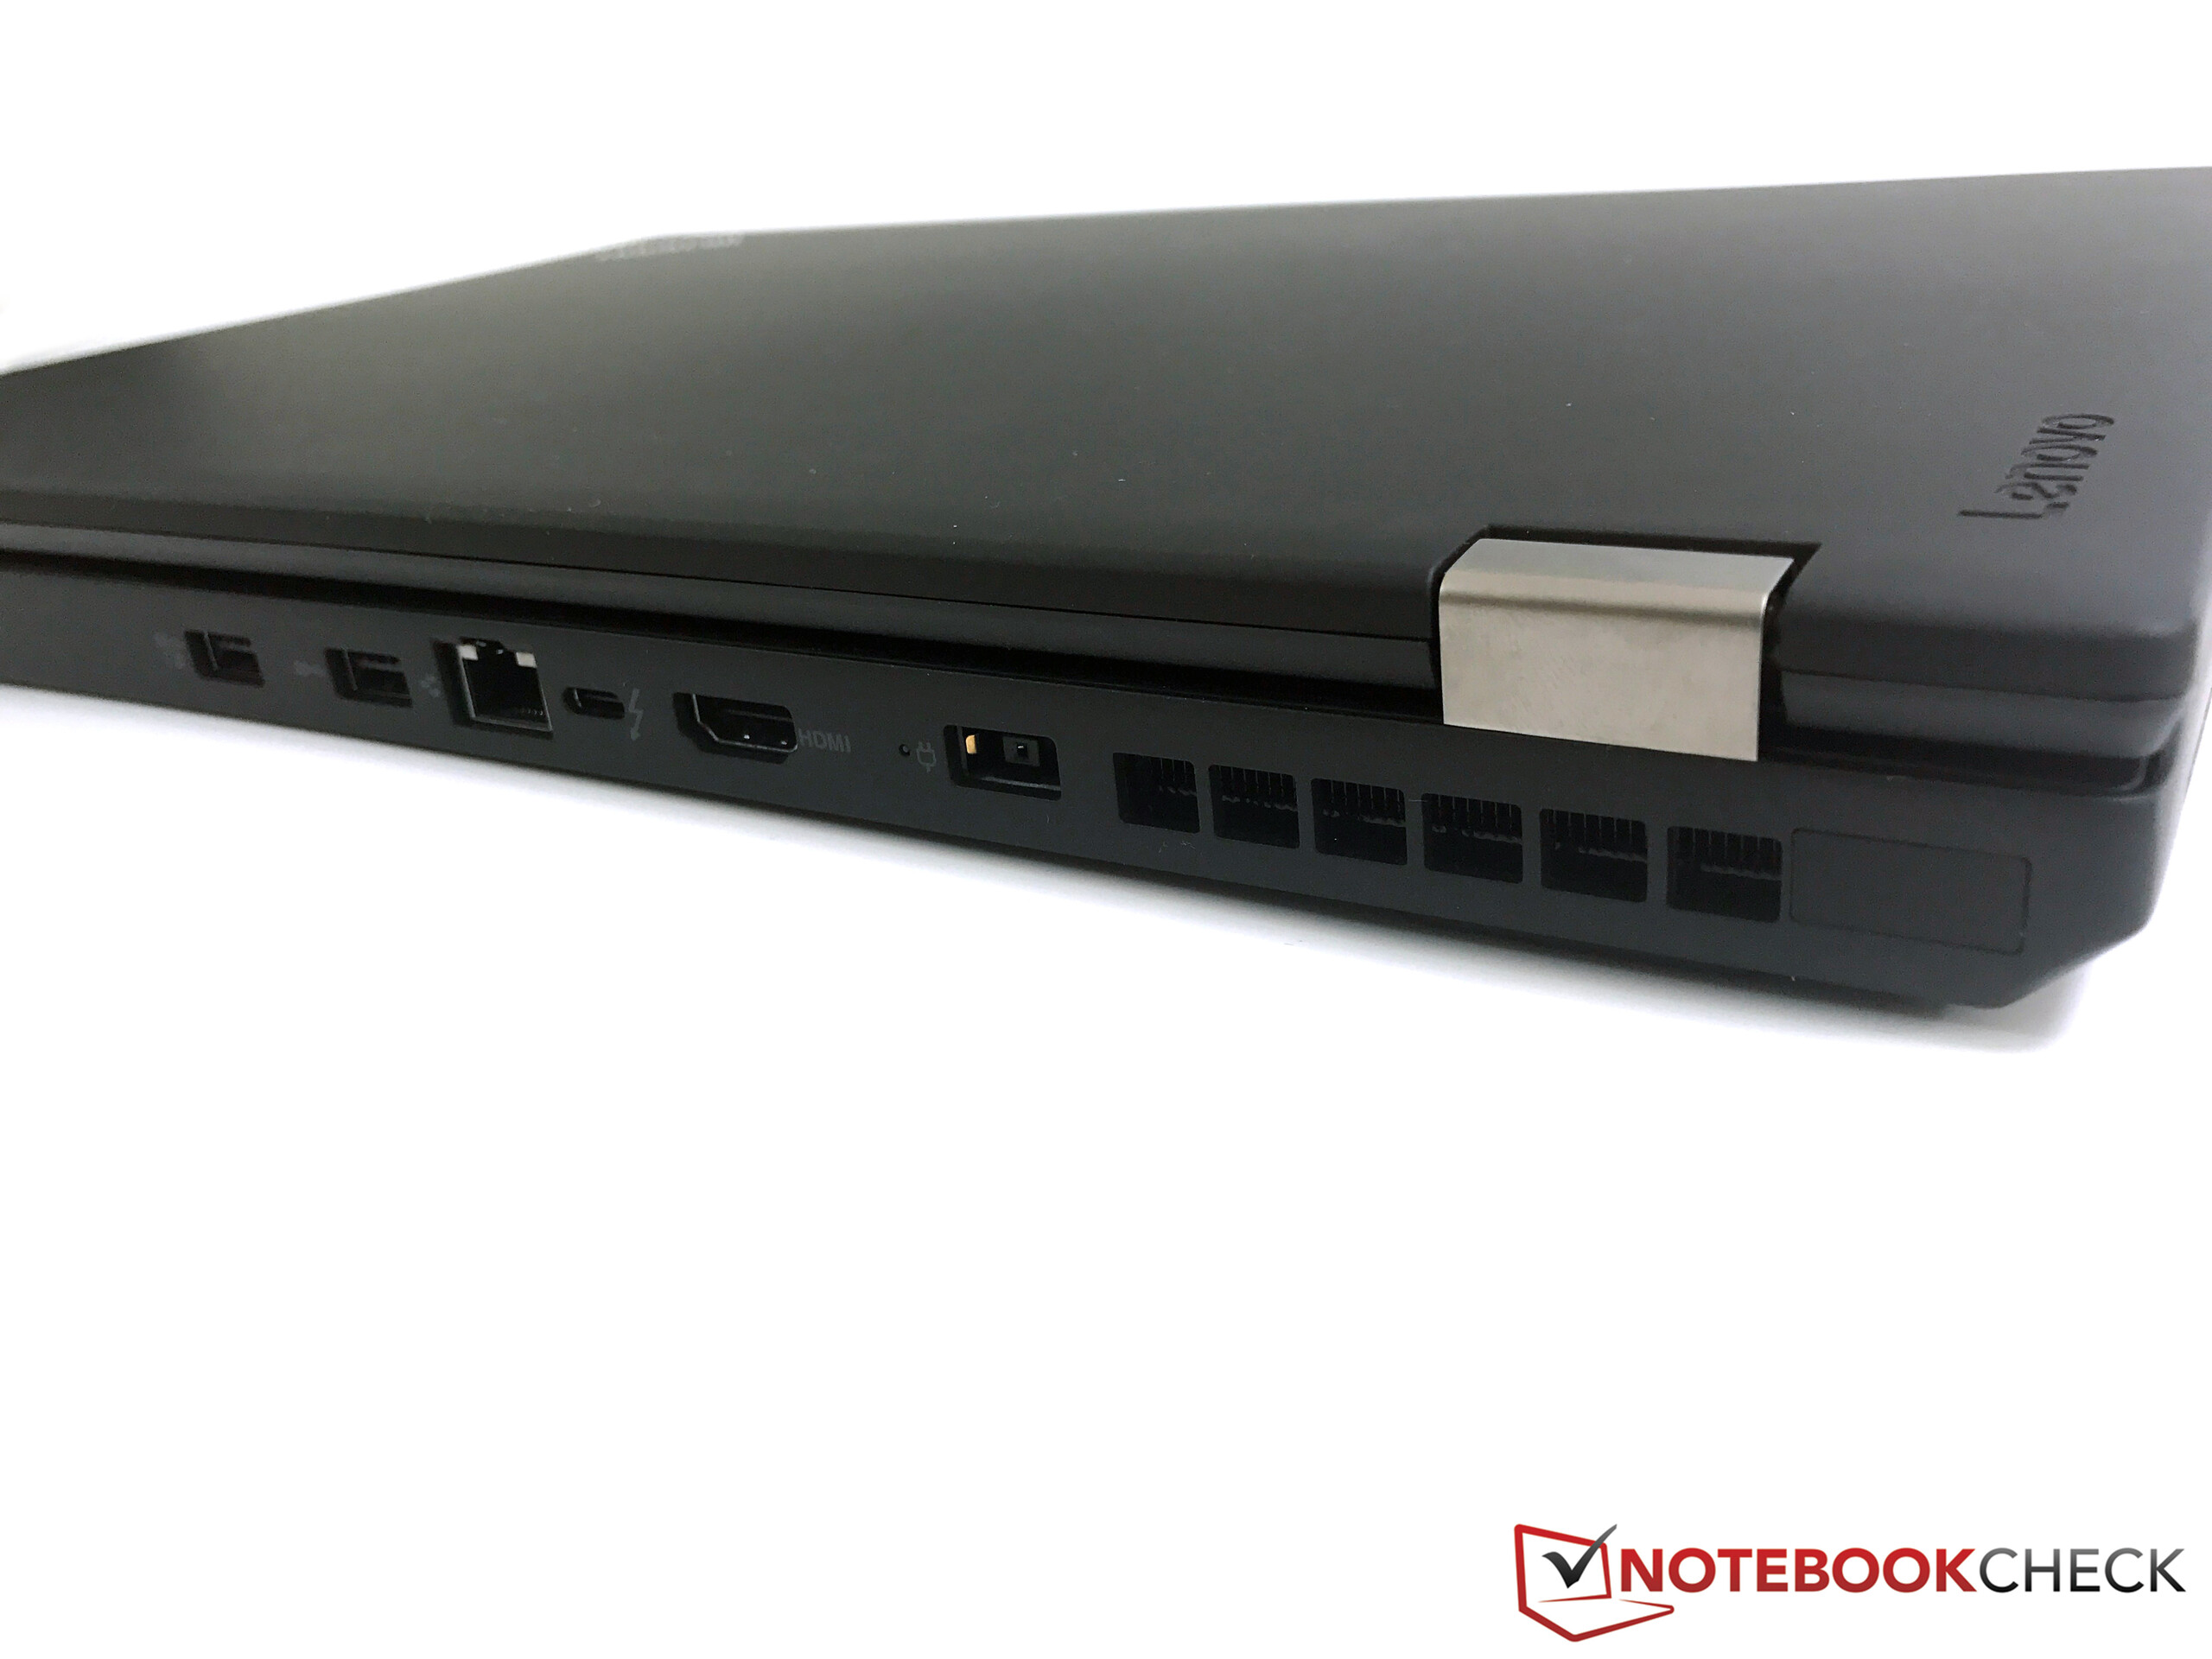
La selezione delle porte non è cambiata in questa generazione. Tuttavia, ci sono tutte le porte necessarie, quindi non ci sono problemi. Potete collegare fino a quattro monitors 4K esterni tramite la Nvidia GPU.
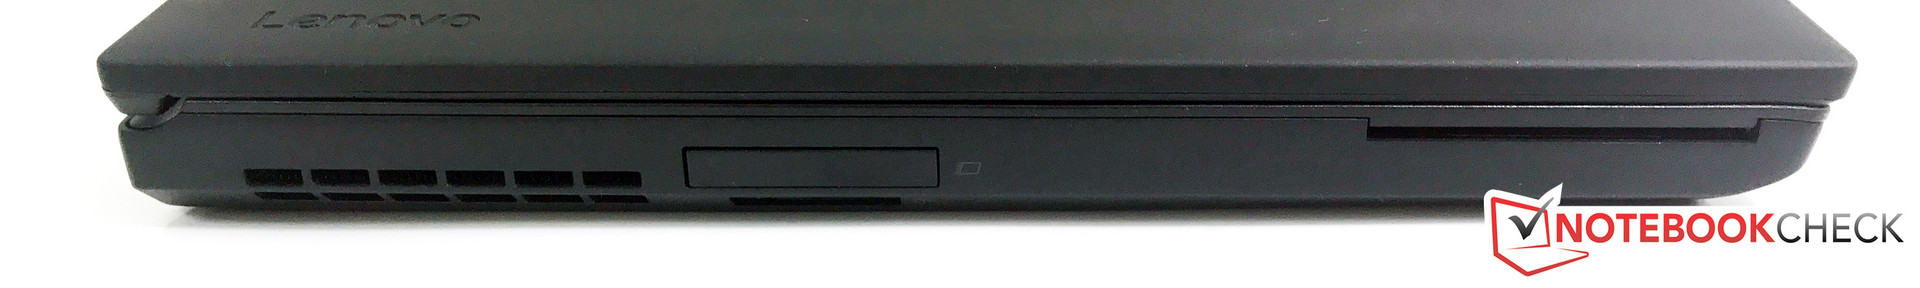
SD-Card Reader
Il lettore SD-card è molto più veloce rispetto al più sottile ThinkPad P51s. Abbiamo rilevato un valore di trasferimento massimo molto buono di oltre 200 MB/s e oltre 150 MB/s durante la copia di immagini JPEG con la nostra scheda di riferimento Toshiba (Exceria Pro SDXC UHS-II 64 GB). Solo il Dell Precision 5520 ha prestazioni superiori. Non avrete bisogno di un lettore di schede esterno (USB 3.0).
| SD Card Reader | |
| average JPG Copy Test (av. of 3 runs) | |
| Dell Precision 5520 UHD | |
| Lenovo ThinkPad P51 20HH0016GE | |
| HP ZBook 15 G3 | |
| Dell Precision 7510 (4K IGZO) | |
| Lenovo ThinkPad P50 | |
| Fujitsu Celsius H760 | |
| Lenovo ThinkPad P51s 20HB000SGE | |
| maximum AS SSD Seq Read Test (1GB) | |
| Dell Precision 5520 UHD | |
| Lenovo ThinkPad P51 20HH0016GE | |
| HP ZBook 15 G3 | |
| Lenovo ThinkPad P50 | |
| Fujitsu Celsius H760 | |
| Lenovo ThinkPad P51s 20HB000SGE | |
Comunicazioni
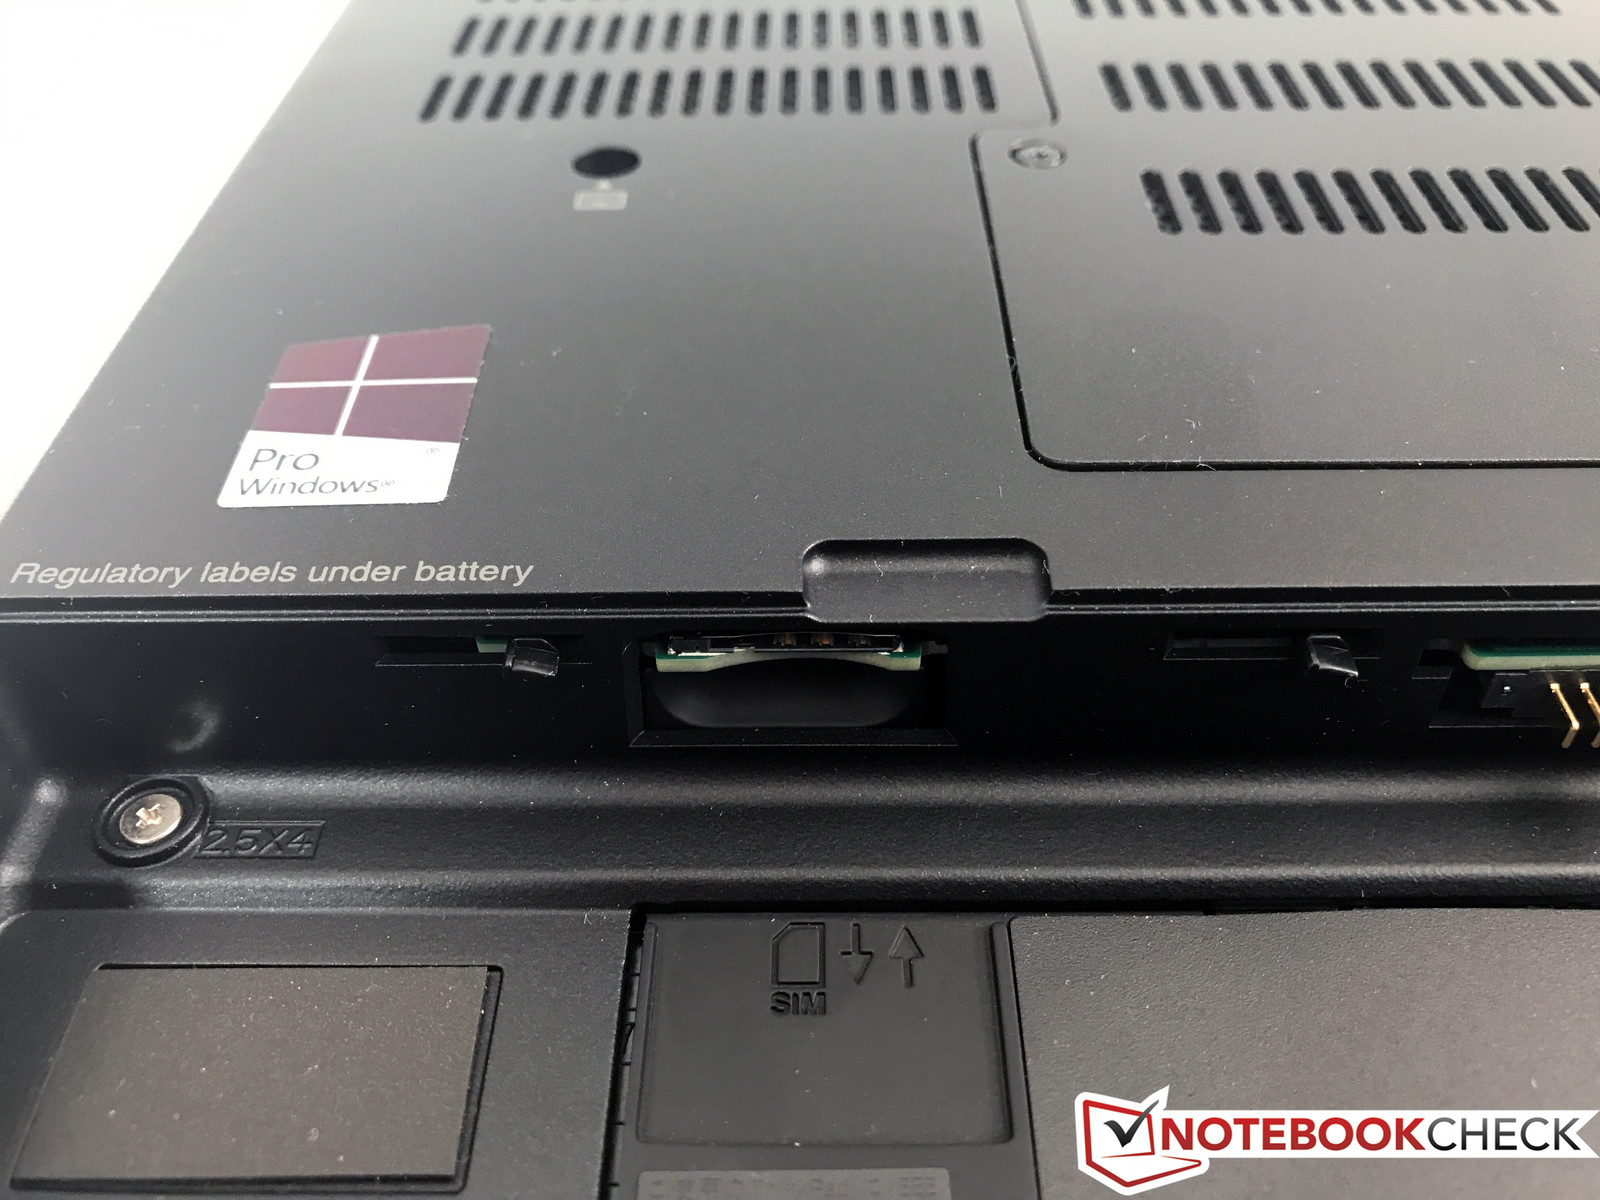
Il primo modello del P50 ha creato problemi tra gli utenti in quanto non era "WWAN-ready". Lenovo ha dichiarato che il problema dipendeva da interferenze con la memoria, in quanto entrambi i componenti usavano la stessa frequenza di 2133 MHz.
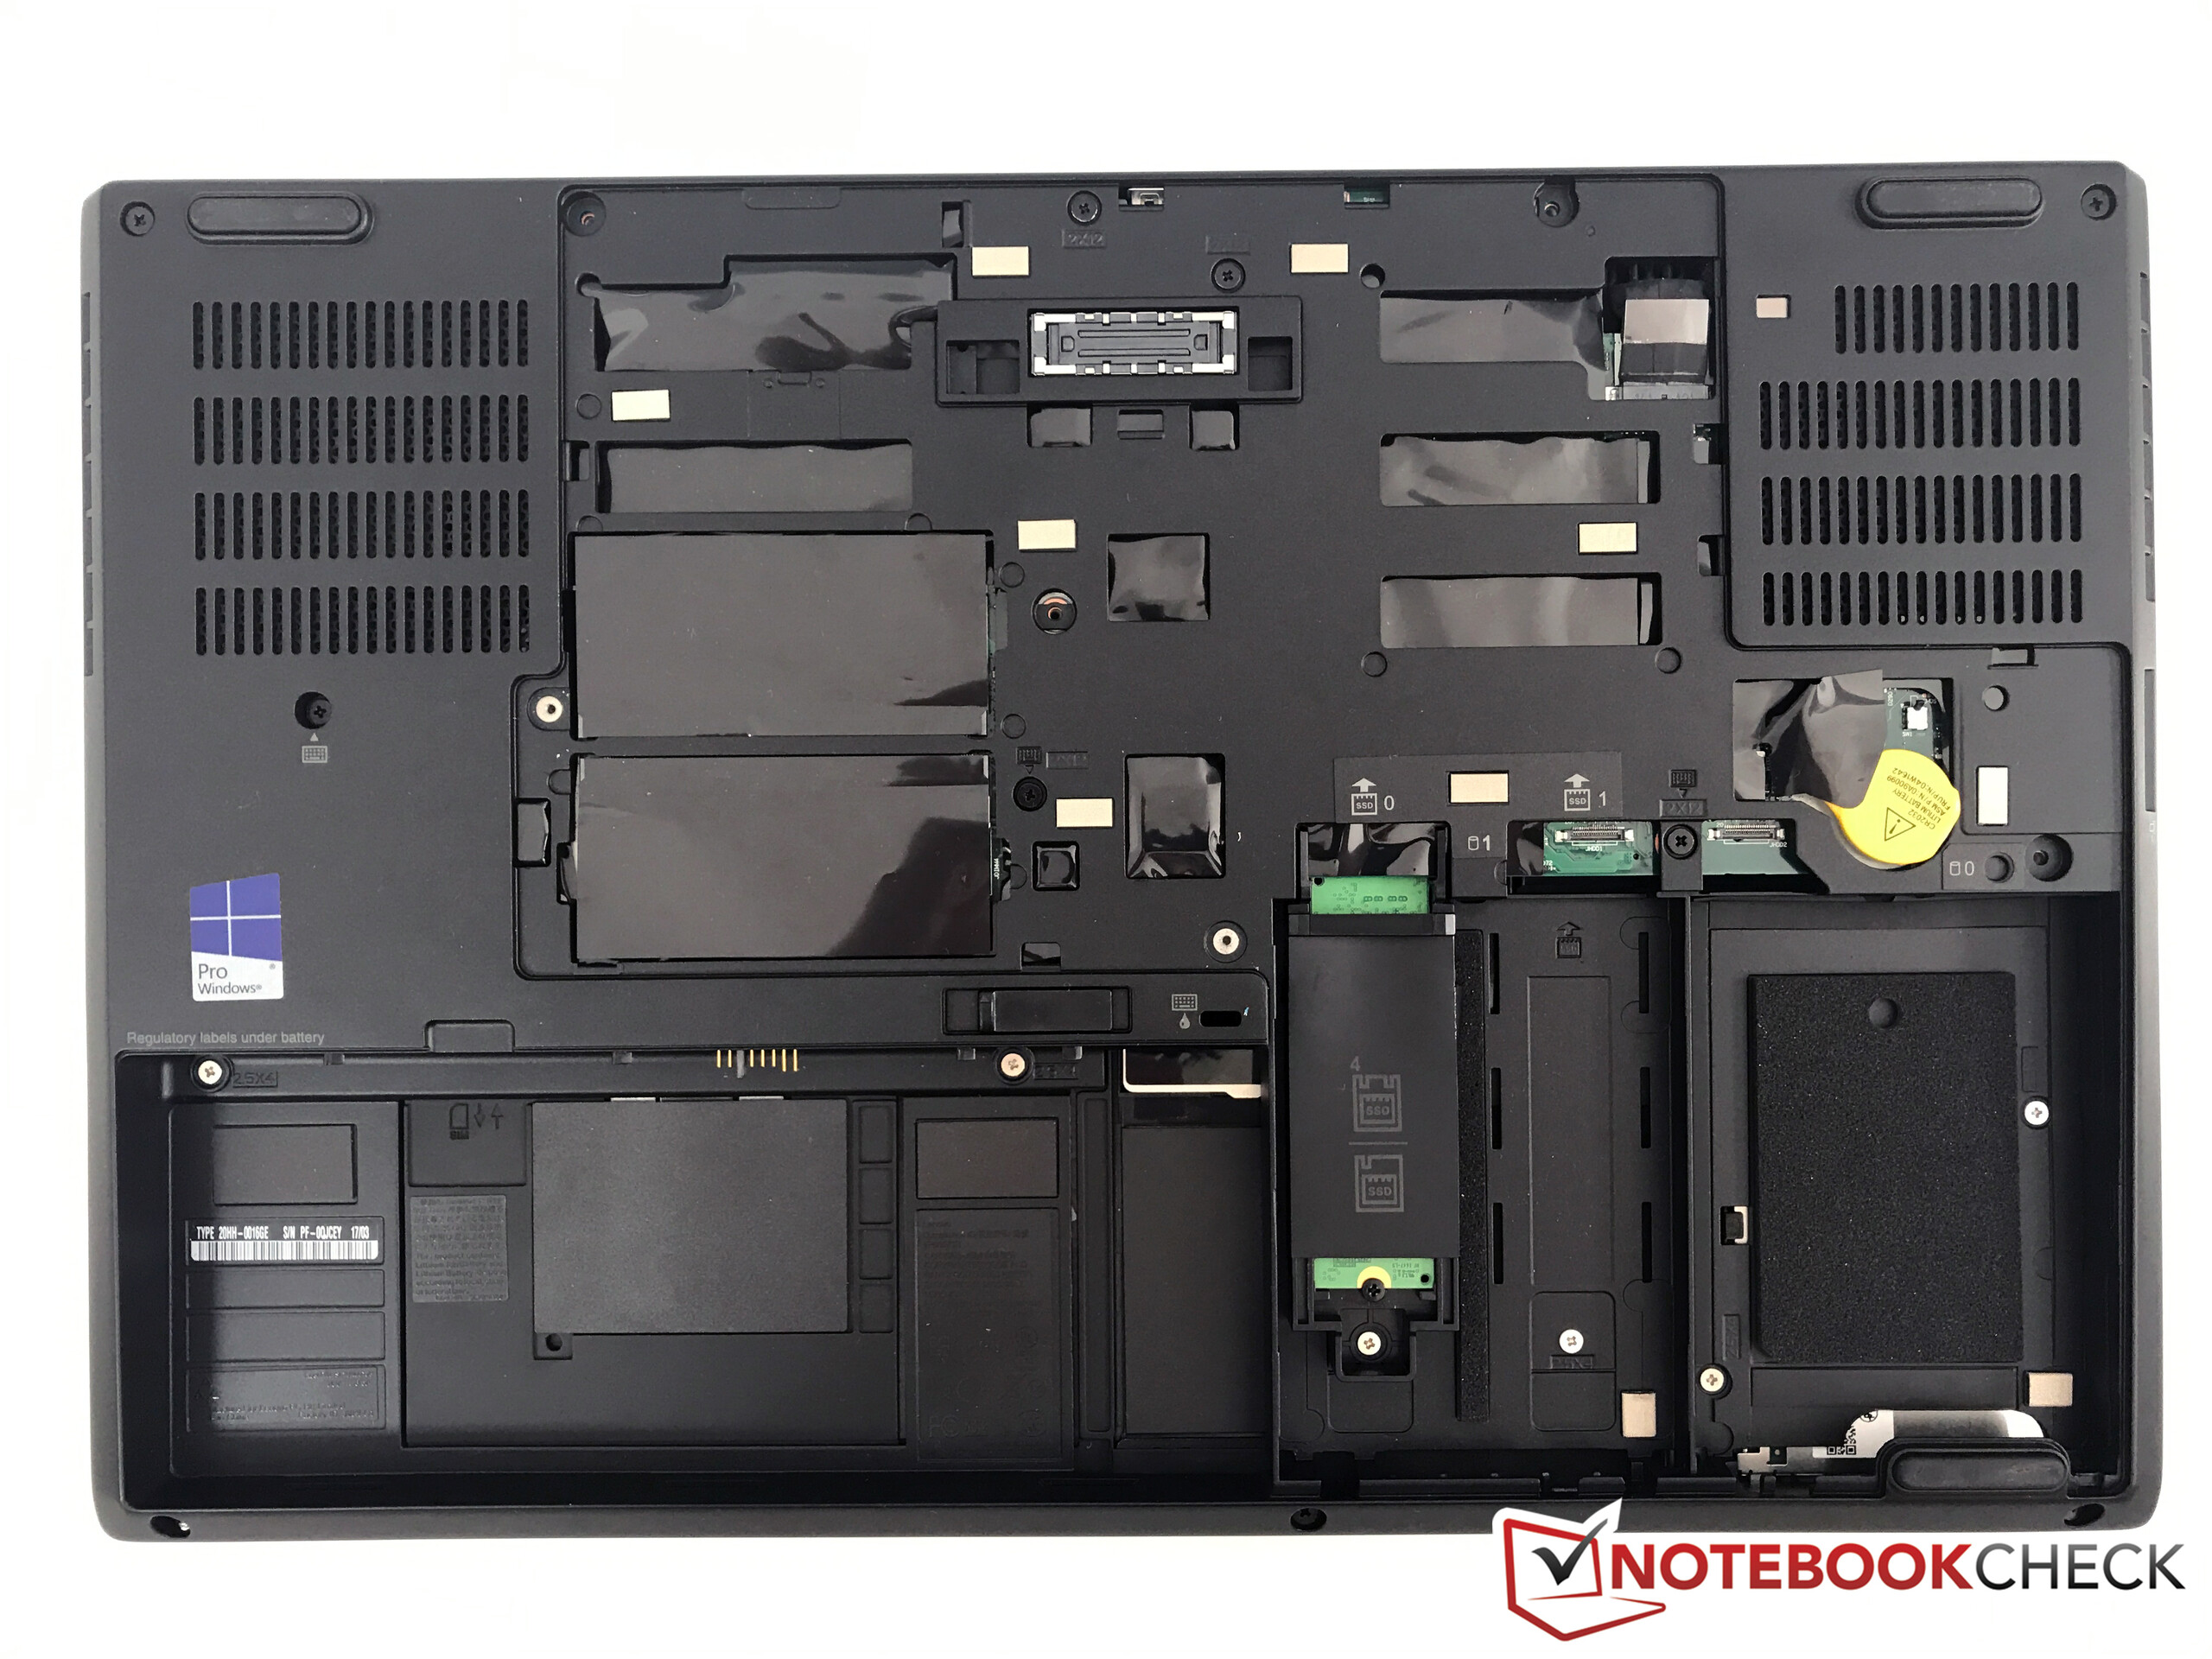
Questo problema ora è stato risolto, e tutte le SKUs del ThinkPad P51 sono predisposte per un modem LTE. Il relativo slot Micro-SIM si trova nel vano batteria, come si vede dall'immagine a destra.
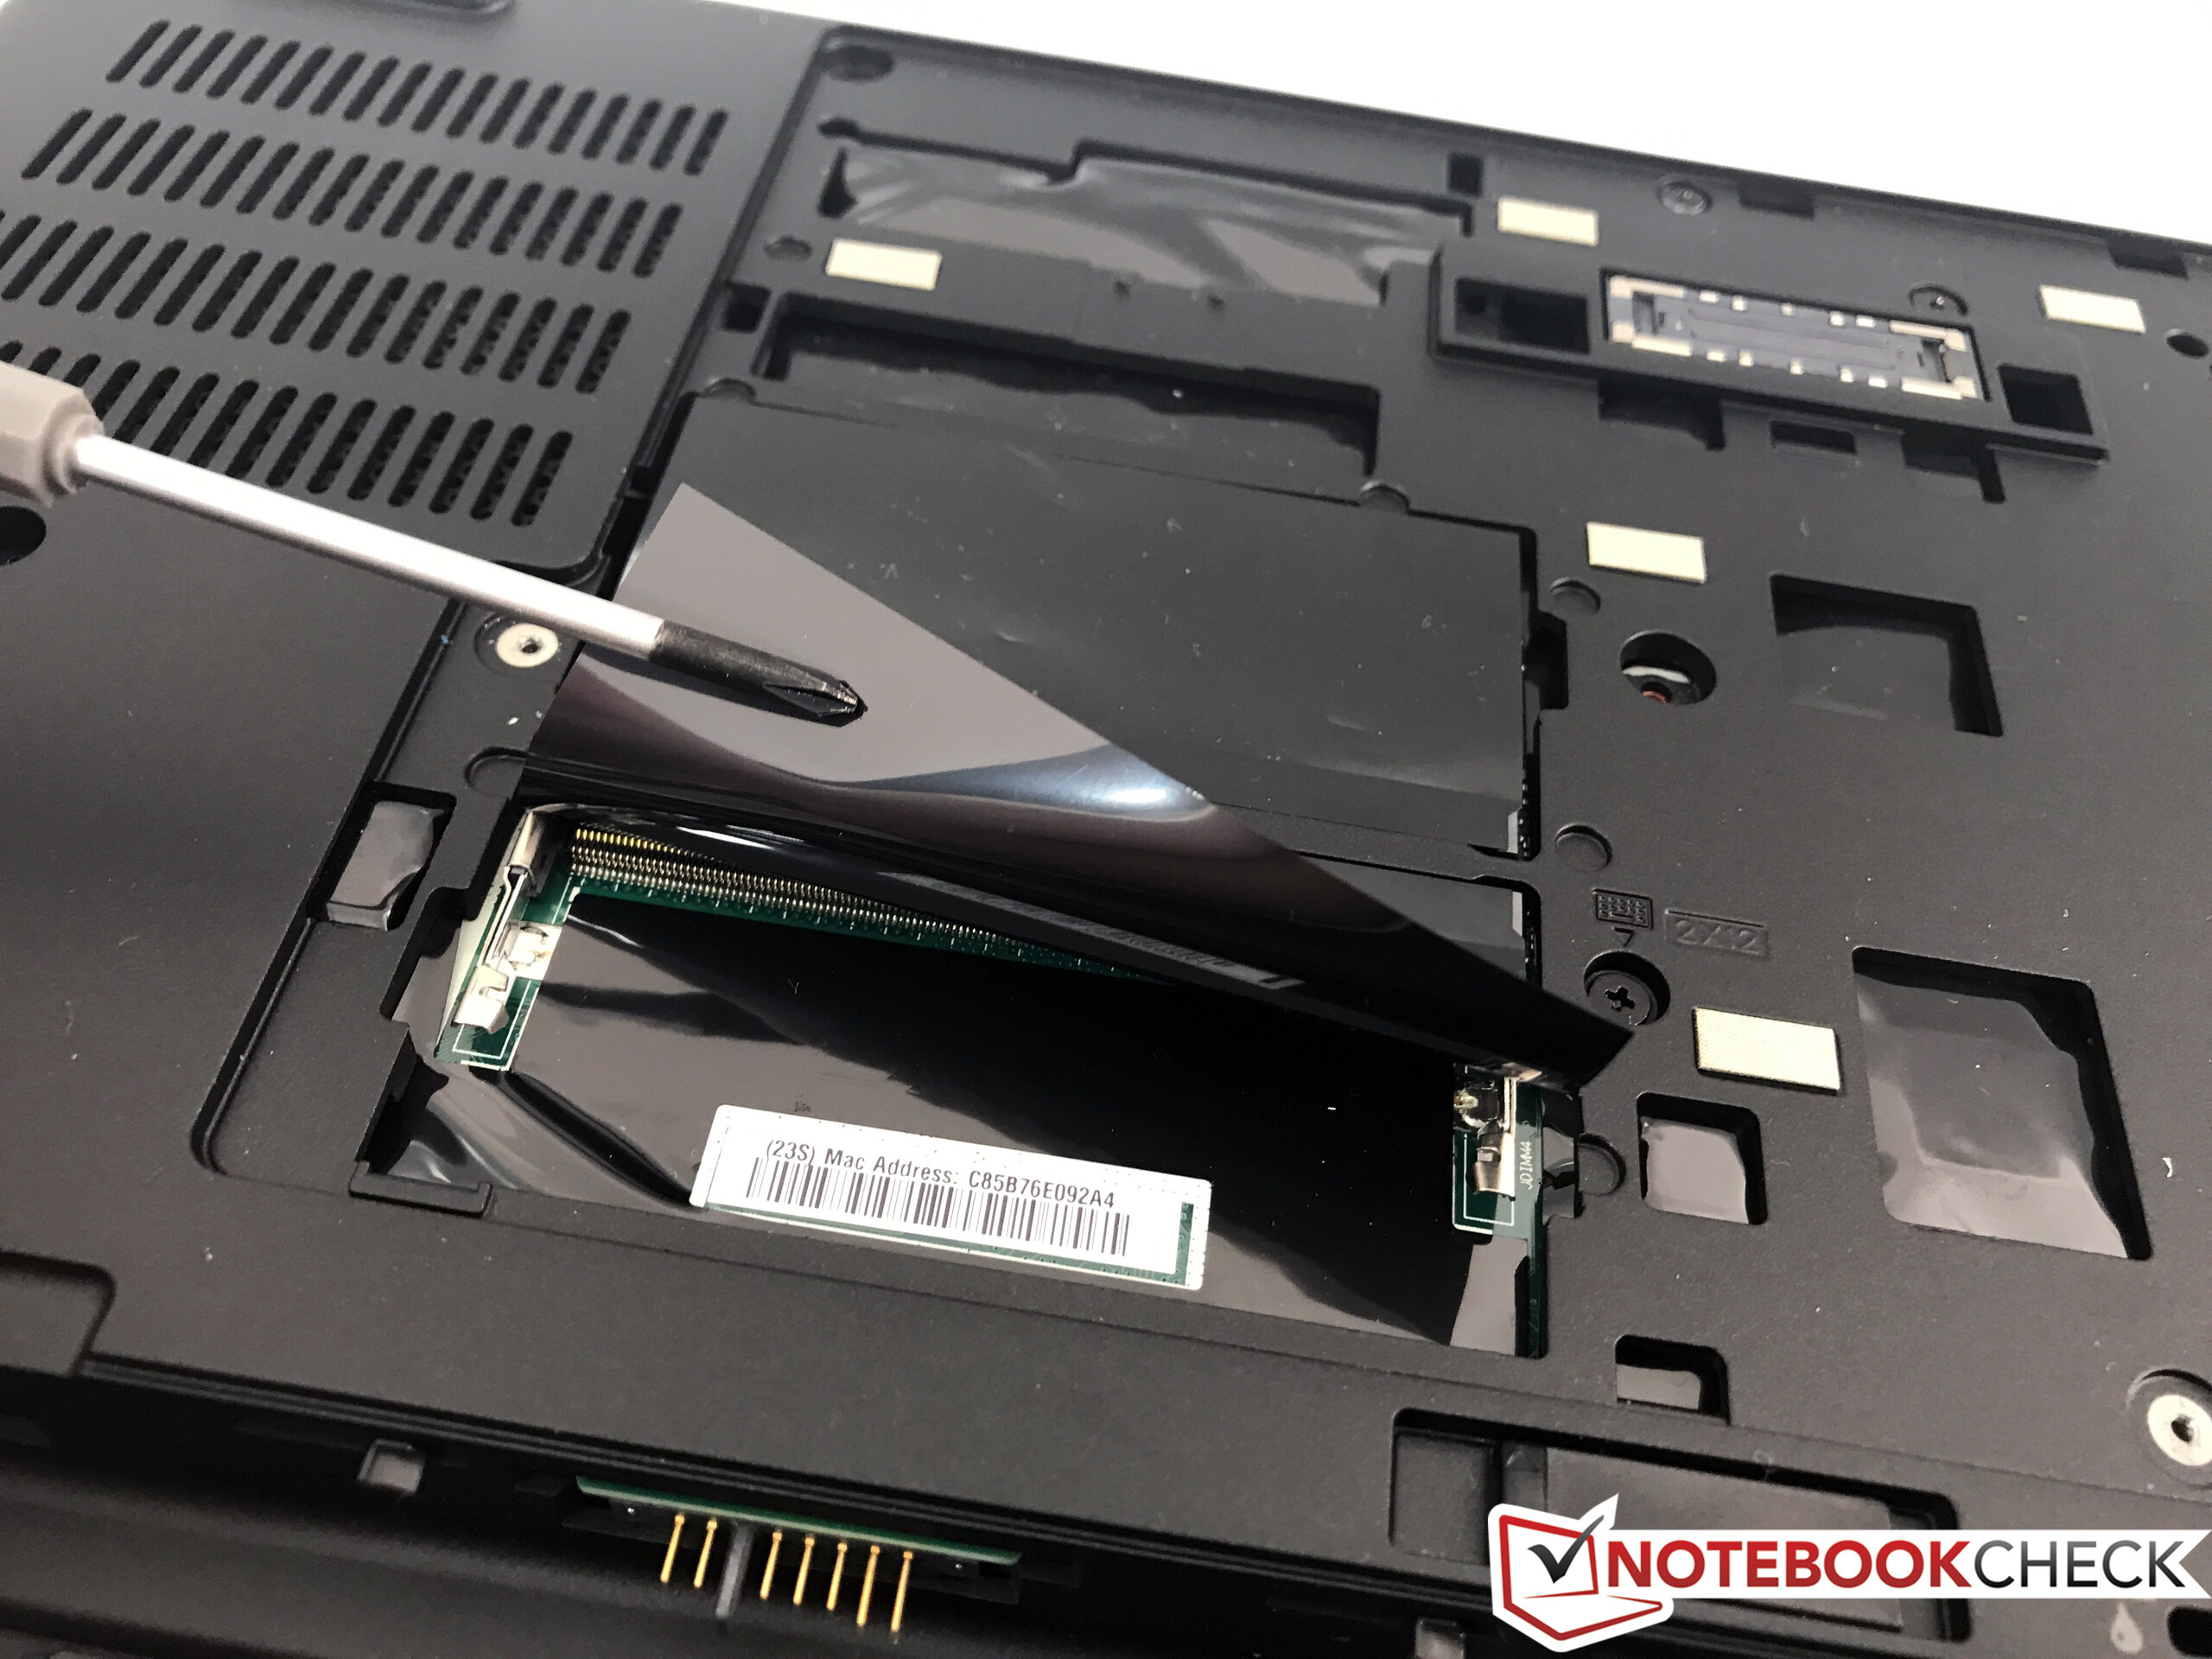
Il modulo wireless è stato aggiornato all'Intel 8265. Questo modulo 2x2 supporta le reti 2.4 & 5 GHz, il veloce standard 802.11ac, ed un trasferimento massimo di 867 Mbps. Abbiamo rilevato buoni risultati nel nostro test standard WLAN con il router Linksys EA8500 (1 metro di distanza/~3 ft), ed non abbiamo avuto problemi con la connessione wireless nel periodo della recensione.
| Networking | |
| iperf3 transmit AX12 | |
| Lenovo ThinkPad P51s 20HB000SGE | |
| Lenovo ThinkPad P51 20HH0016GE | |
| Dell Precision 5520 UHD | |
| iperf3 receive AX12 | |
| Lenovo ThinkPad P51s 20HB000SGE | |
| Lenovo ThinkPad P51 20HH0016GE | |
| Dell Precision 5520 UHD | |
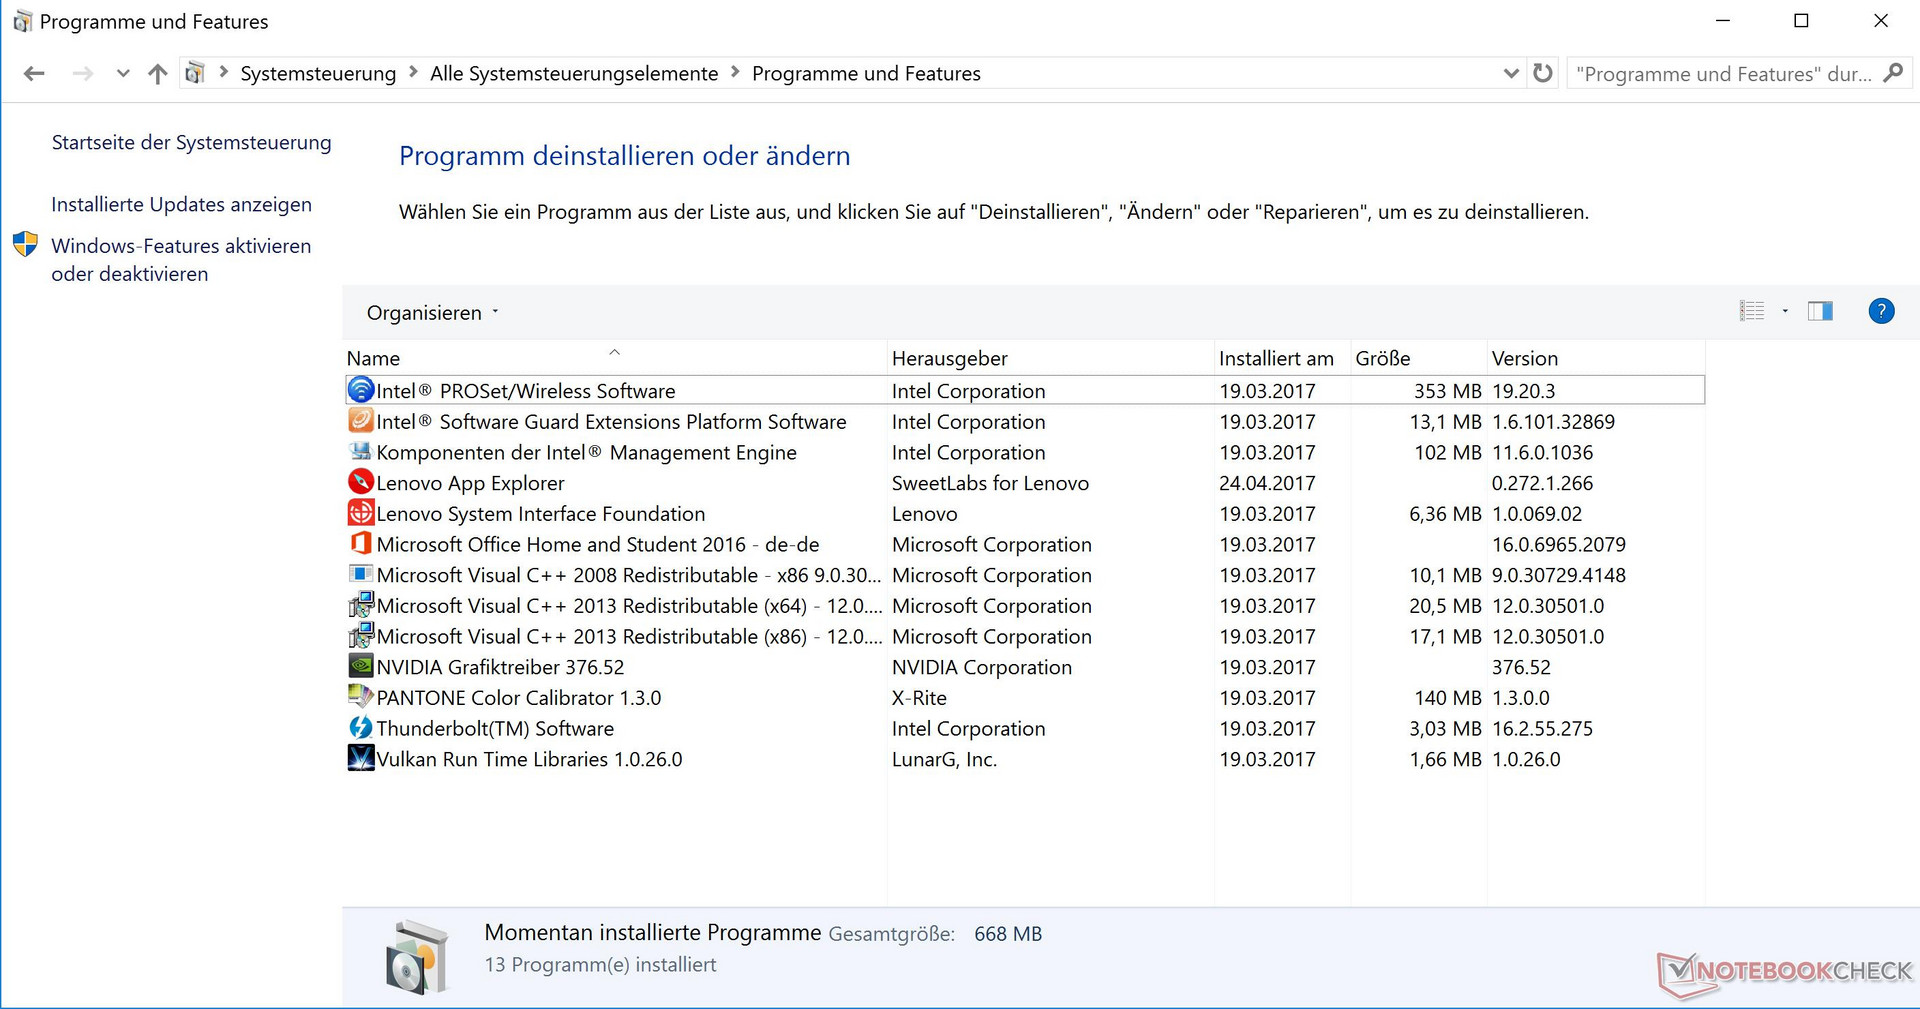
Software
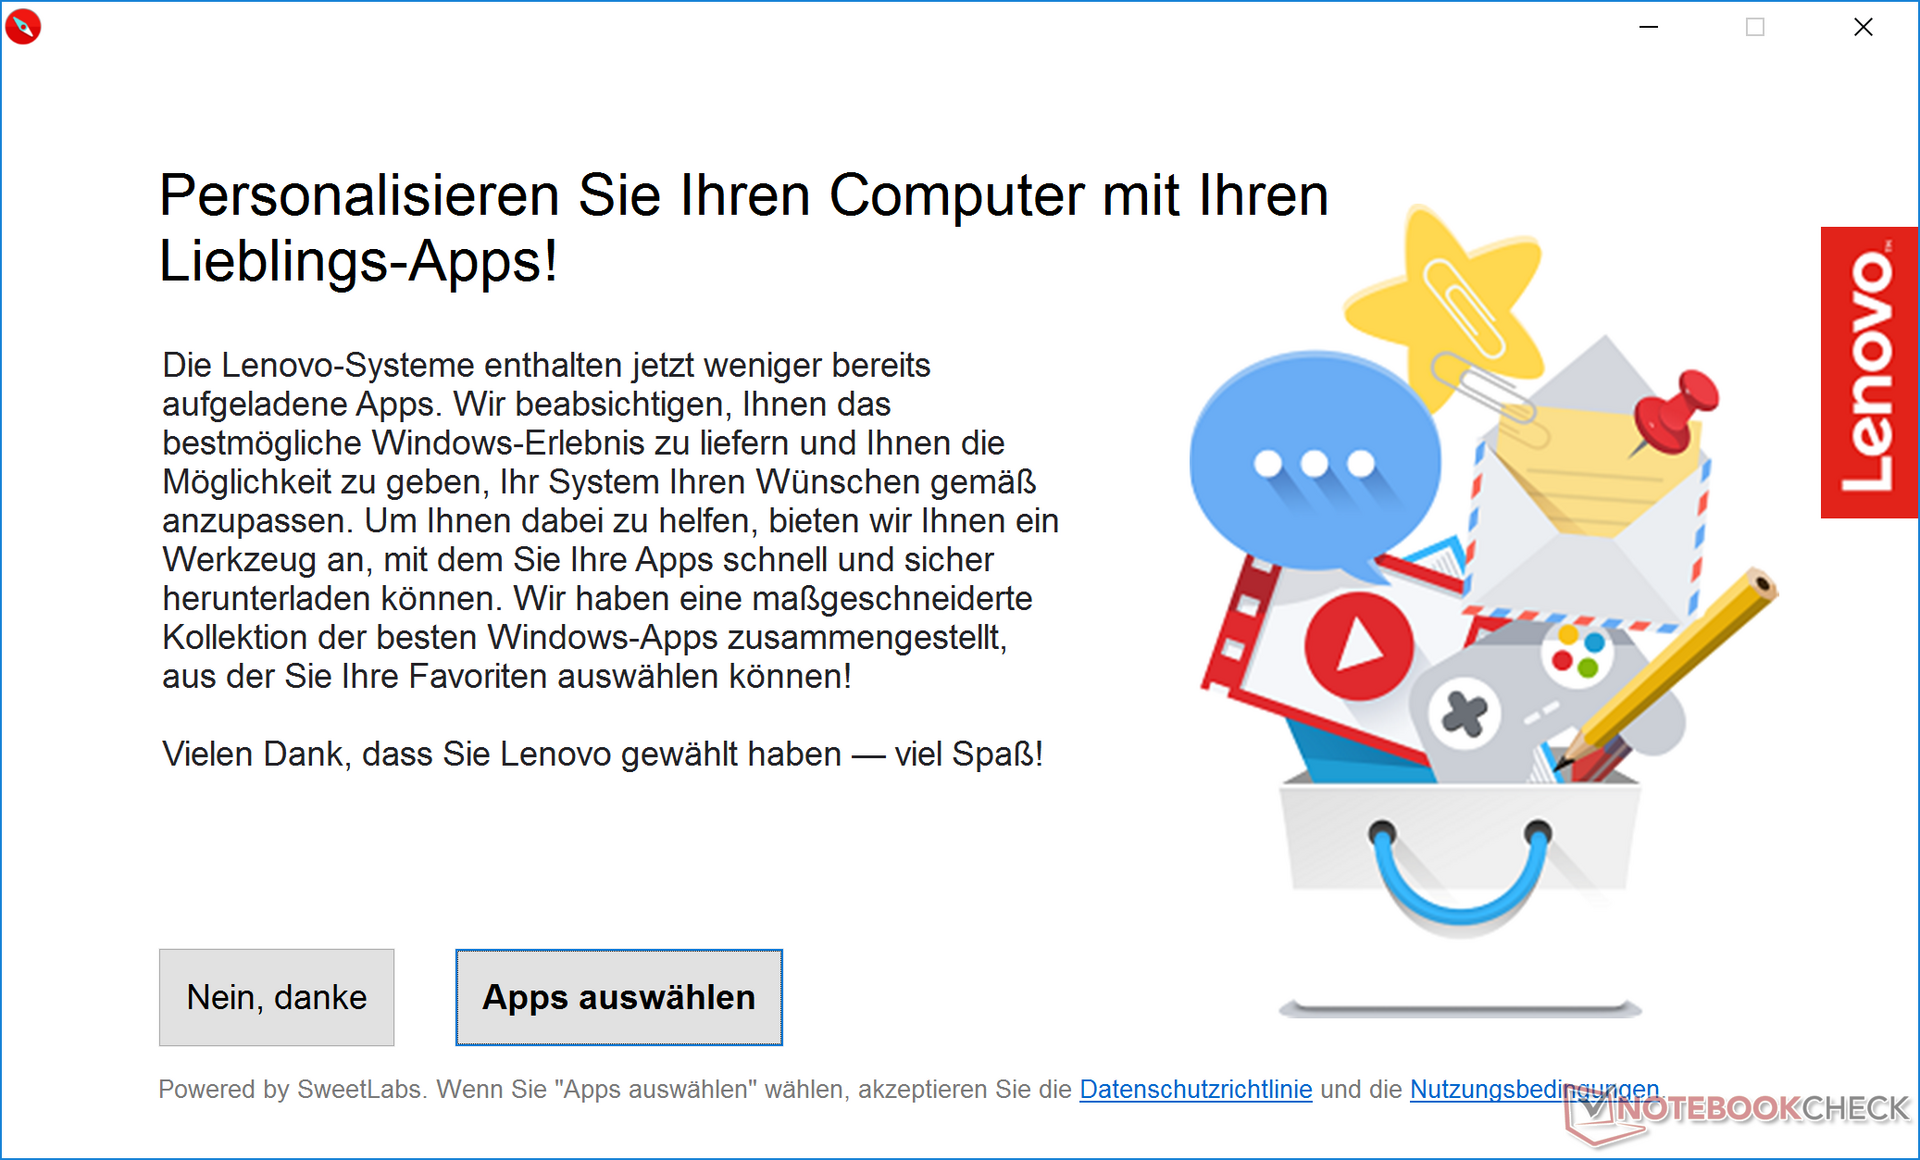
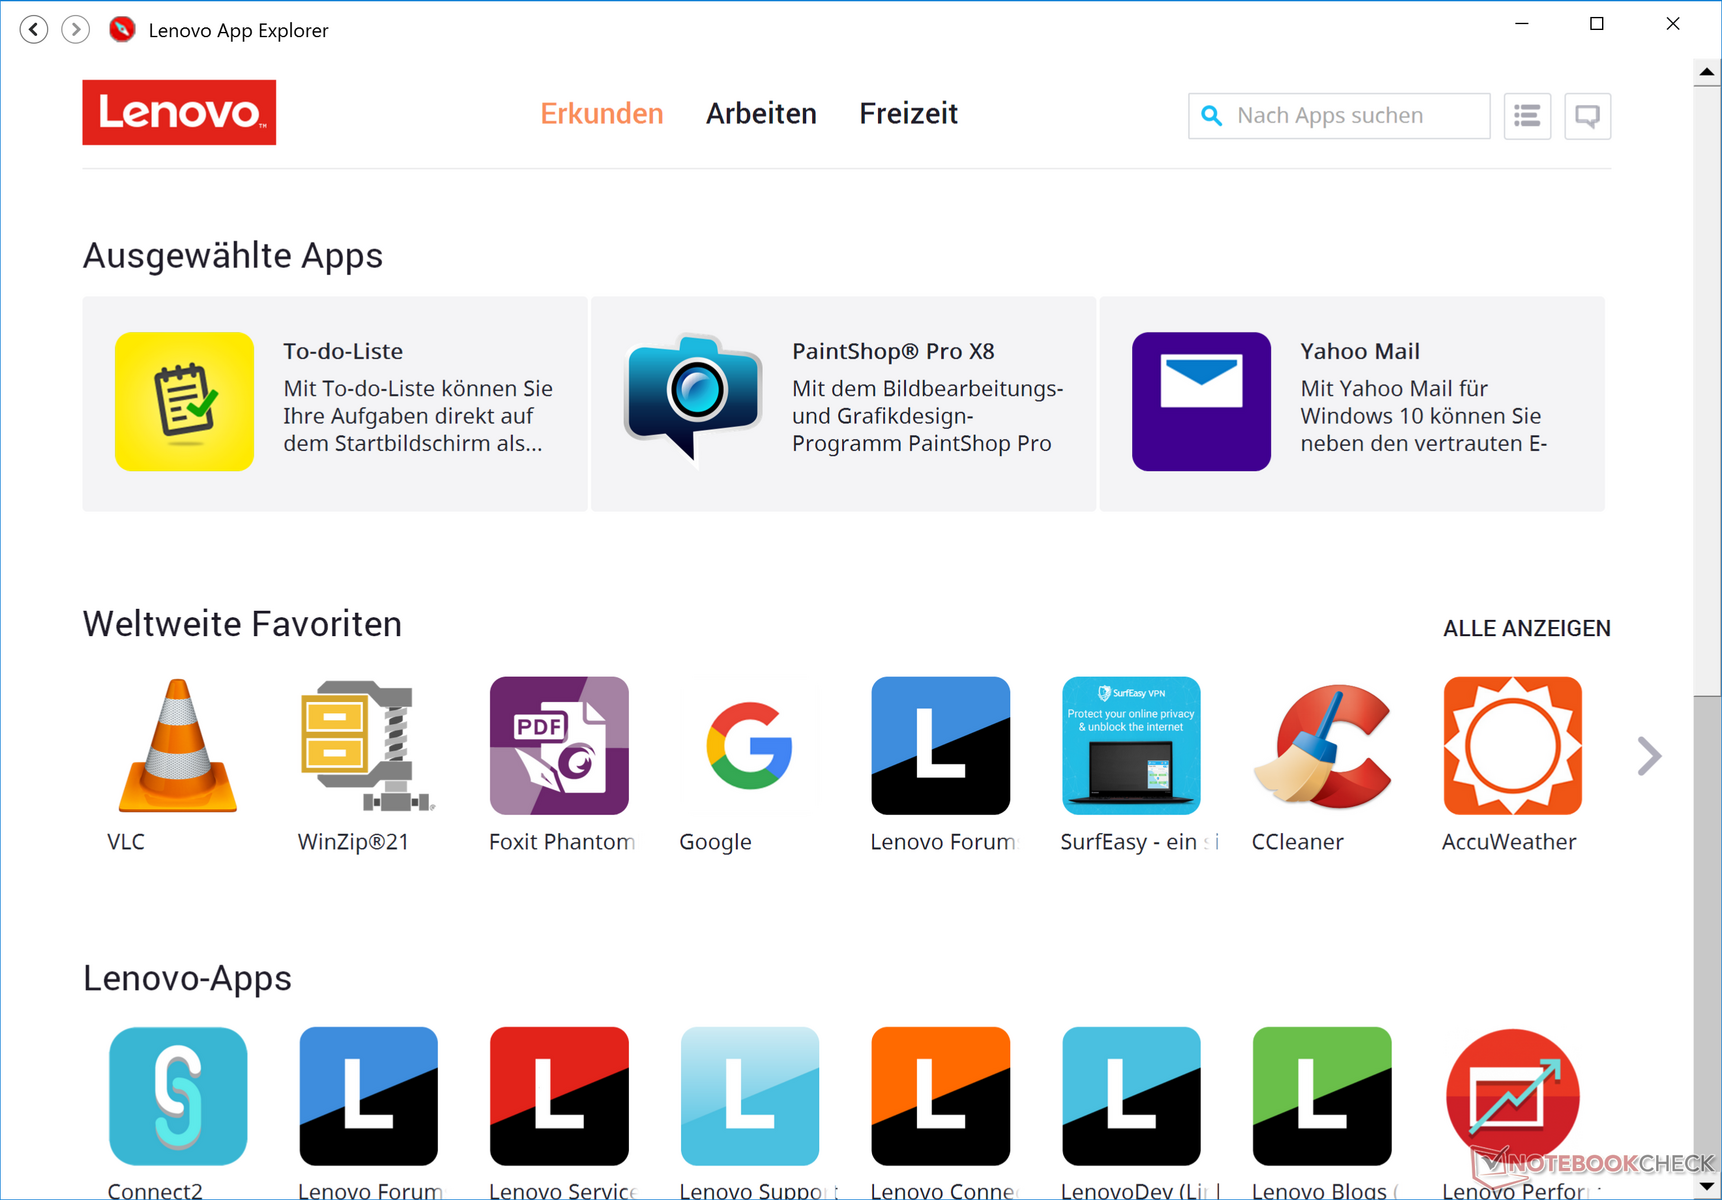
Lenovo installa sul ThinkPad P51 Windows 10 Professional (64-bit). é la cosiddetta Signature Edition senza alcun noioso bloat ware. Mentre Lenovo ha installato l'App Explorer, che offre una scelta di popolari applicazioni da installare.
Garanzia
La garanzia di 36 mesi (servizio on-site) e può essere estesa fino a cinque anni.
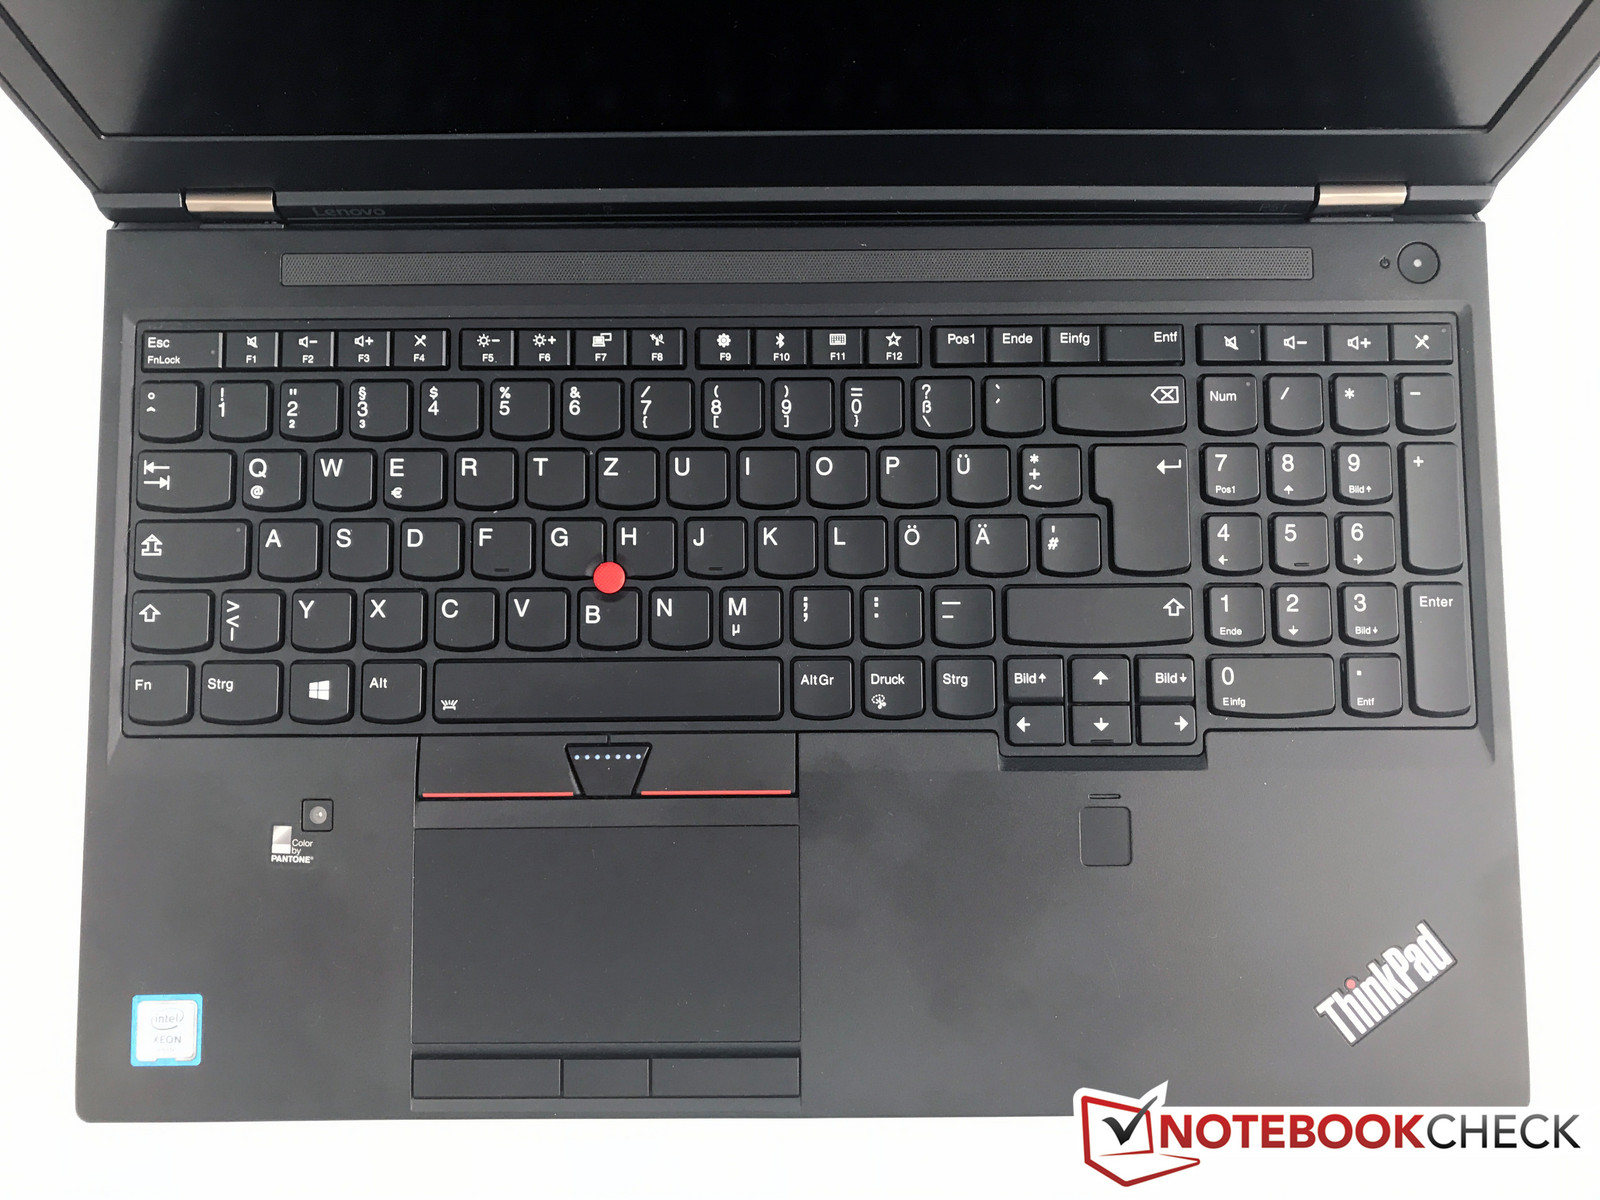
Dispositivi di Input
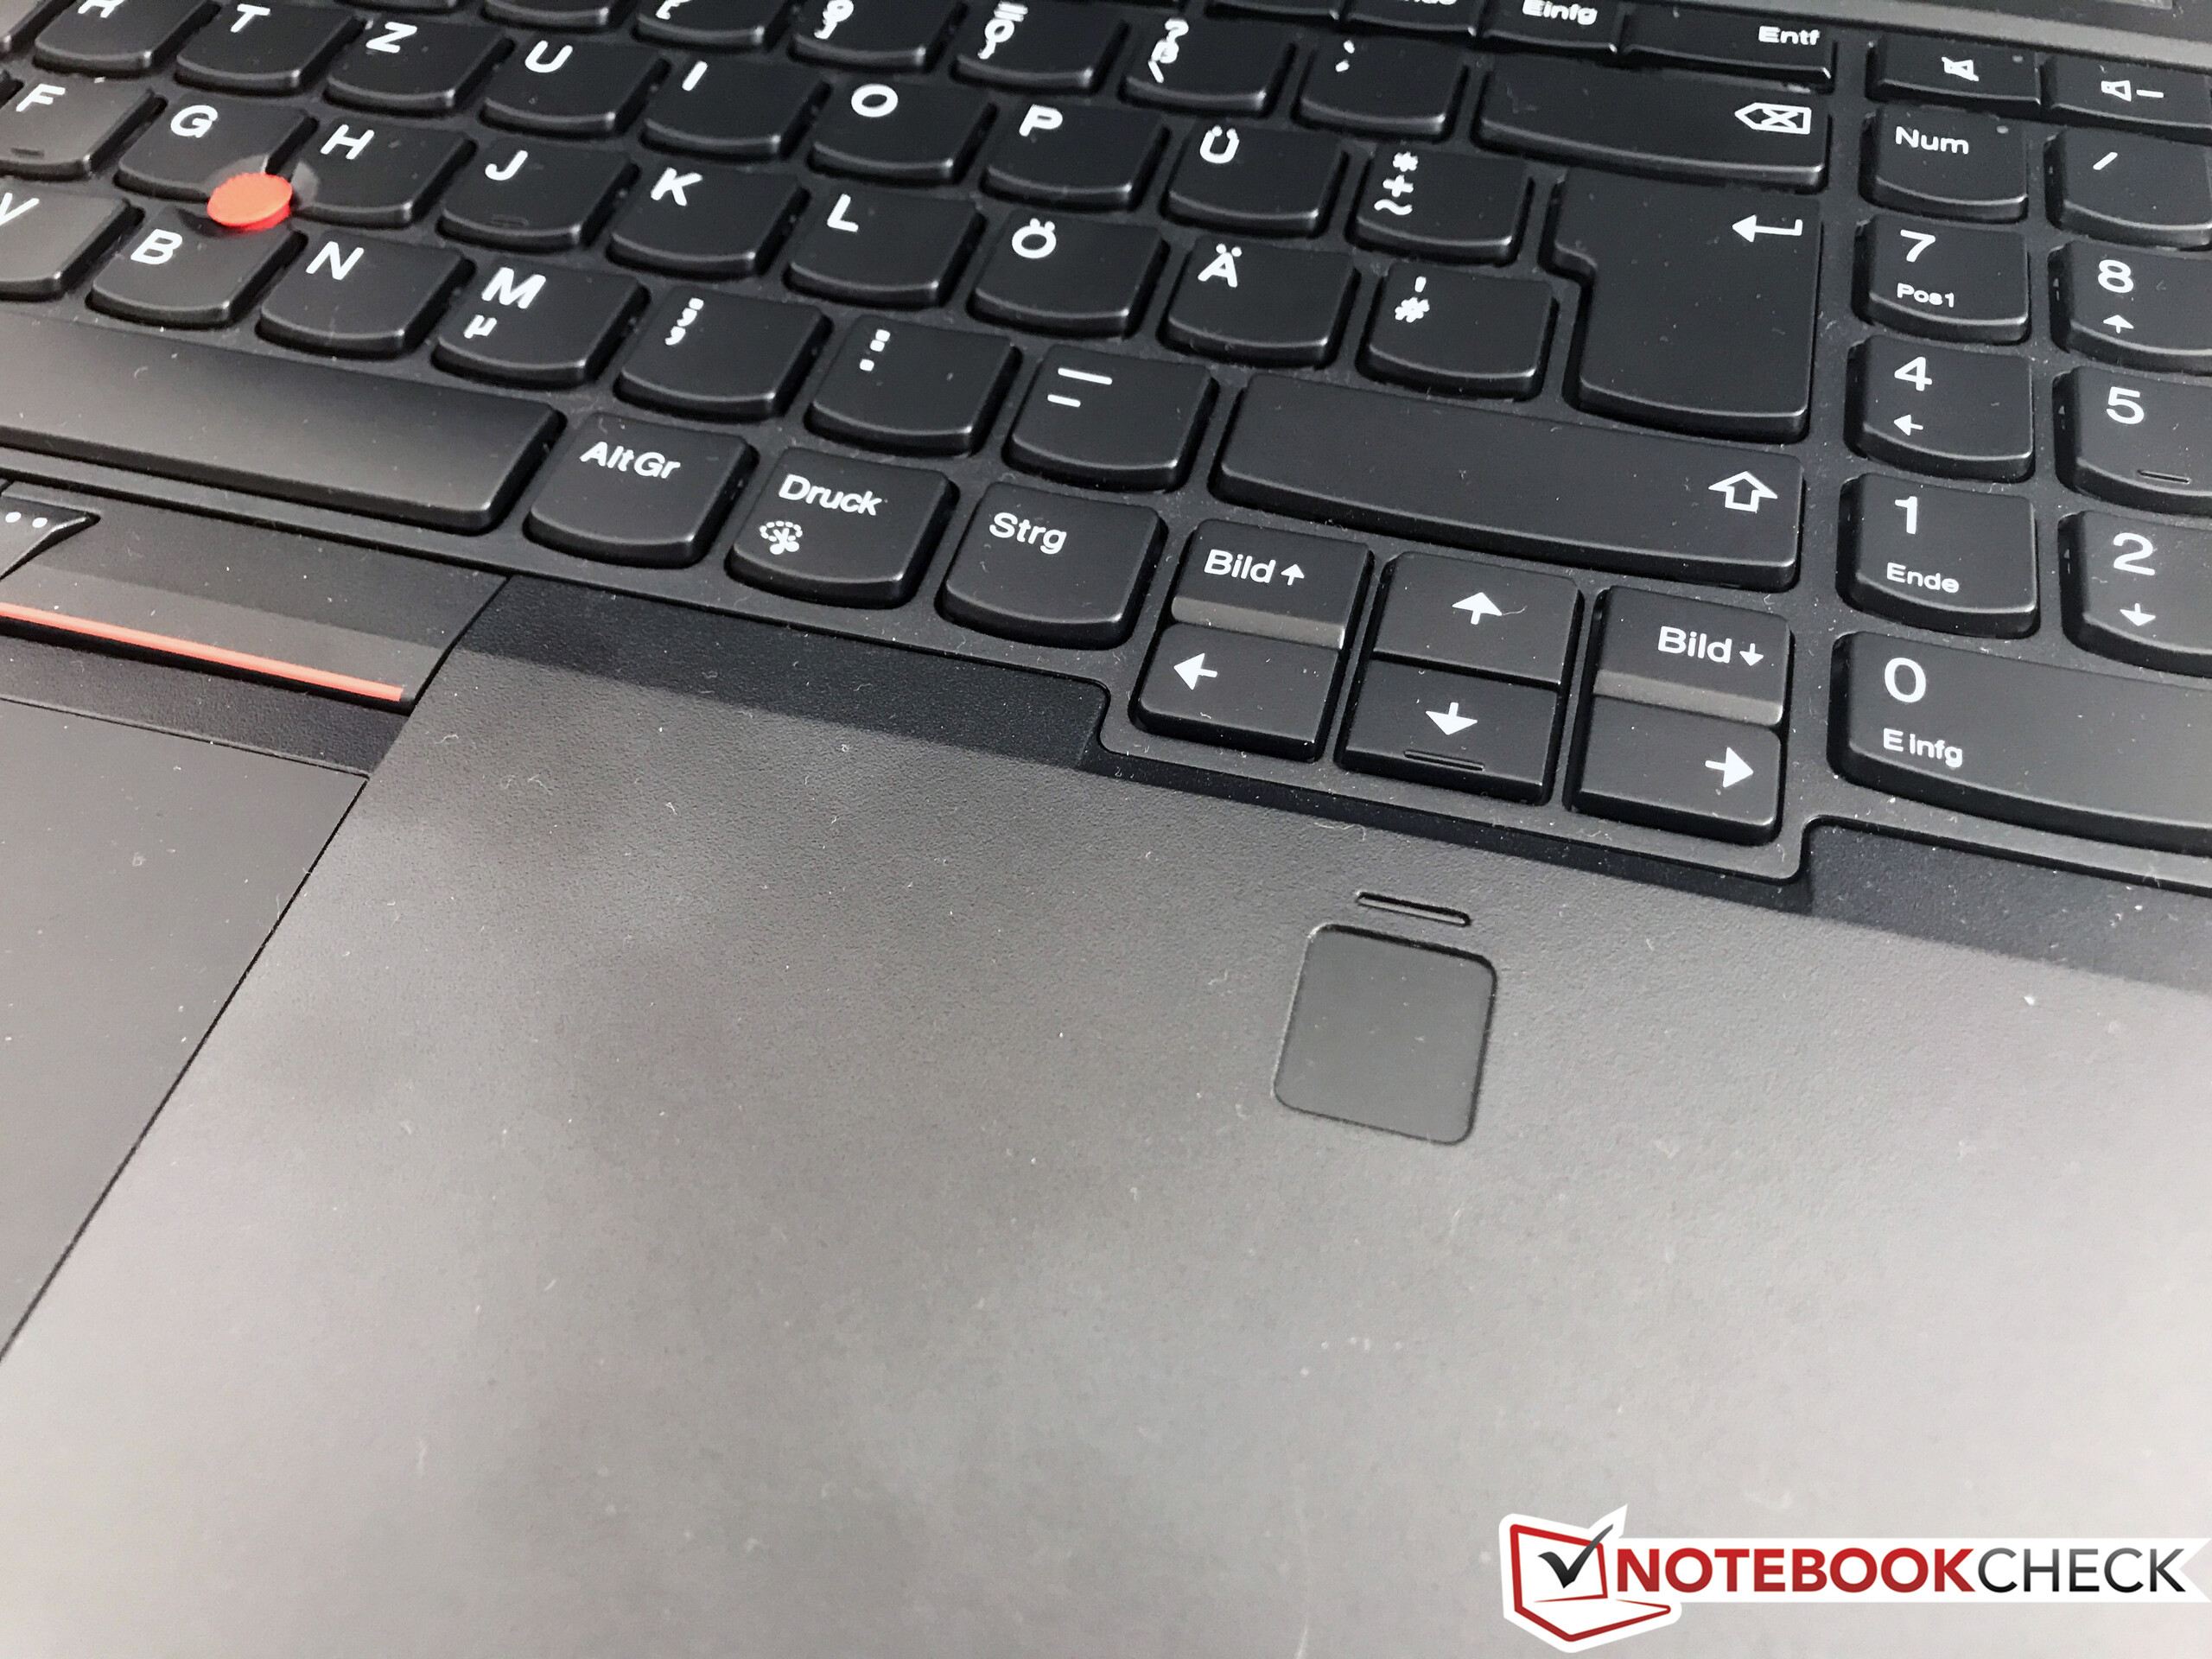
I dispositivi di input non sono cambiati. Non ci sono problemi con la tastiera - buona esperienza di digitazione meccanica, corsa dei tasti sufficiente, non troppo rumorosa, illuminata, e resistente agli schizzi di acqua. Chi scrive molto sarà contento dei dispositivi di input. Il touchpad ora è un Precision Touchpad, il che significa che tutti gli inputs sono gestiti da Windows. Il design è simile a quello del precedente modello, incluse le strisce tra touchpad e pulsanti dedicati per il TrackPoint. I modelli come il ThinkPad P51s già utilizzano un design aggiornato con un touchpad più grande. Tuttavia, questo modello funziona molto bene.
Il nostro modello di test ha un piccolo problema con il pulsante destro dedicato del TrackPoint: il tasto a volte si blocca dopo l'utilizzo. Tuttavia, non abbiamo riscontrato questo problema su un altro modello o sul ThinkPad P71, quindi dovrebbe essere un caso isolato.

Display
Il nuovo ThinkPad P51 è disponibile con uno schermo matto Full HD IPS (250 nits, opzione Touch con 220 nits) o con display high-resolution matto 4K IPS. Questo lo si aveva anche con il predecessore, ma i due modelli P50 non convincevano molto in termini di luminosità. Il pannello 4K del ThinkPad P51 si comporta meglio a riguardo e supera i valori dichiarati. Abbiamo rilevato fino a 330 nits e 307 nits in media.
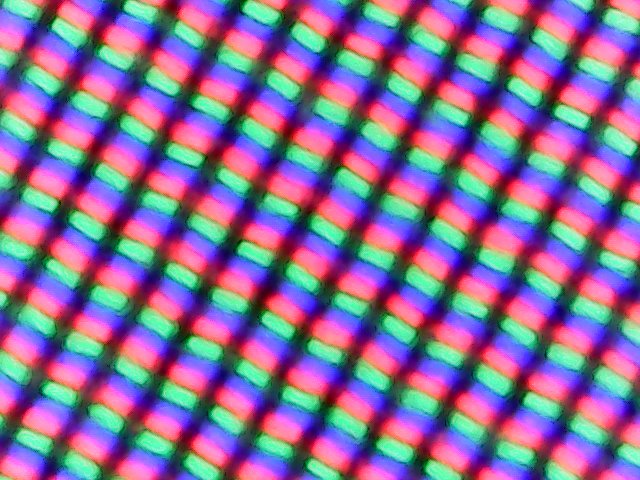
Il valore del nero è medio (0.36), quindi abbiamo "solo" un valore di contrasto di 881:1. Che comunque supera il predecessore, e soggettivamente, l'immagine ci piace molto. Non ci sono sgranatura, il che accade spesso con questi schermi. L'assenza del PWM è un altro aspetto positivo. Possiamo notare solo minime anomalie della retroilluminazione nei due angoli inferiori.
| |||||||||||||||||||||||||
Distribuzione della luminosità: 89 %
Al centro con la batteria: 313 cd/m²
Contrasto: 881:1 (Nero: 0.36 cd/m²)
ΔE ColorChecker Calman: 2.7 | ∀{0.5-29.43 Ø4.73}
ΔE Greyscale Calman: 3 | ∀{0.09-98 Ø4.97}
99.5% sRGB (Argyll 1.6.3 3D)
87.6% AdobeRGB 1998 (Argyll 1.6.3 3D)
99.3% AdobeRGB 1998 (Argyll 3D)
99.5% sRGB (Argyll 3D)
86.3% Display P3 (Argyll 3D)
Gamma: 2.27
CCT: 6077 K
| Lenovo ThinkPad P51 20HH0016GE LEN40BD, B156ZAN02.1, , 3840x2160, 15.6" | Lenovo ThinkPad P50 LQ156D1JW05, , 3840x2160, 15.6" | Lenovo ThinkPad P50 LP156WF6-SPK1, , 1920x1080, 15.6" | Lenovo ThinkPad P51s 20HB000SGE BOE NV156QUM-N44, , 3840x2160, 15.6" | HP ZBook 15 G3 Samsung SDC5344, , 1920x1080, 15.6" | Dell Precision 7510 (4K IGZO) Sharp LQ156D1, , 3840x2160, 15.6" | Dell Precision 5520 UHD SHP1476, , 3840x2160, 15.6" | Fujitsu Celsius H760 LGD046F LP156WF6-SPP1, , 1920x1080, 15.6" | |
|---|---|---|---|---|---|---|---|---|
| Display | -1% | -52% | -20% | -19% | 0% | -18% | -27% | |
| Display P3 Coverage (%) | 86.3 | 85.8 -1% | 39.13 -55% | 69.7 -19% | 66.8 -23% | 86.2 0% | 67.4 -22% | 63.9 -26% |
| sRGB Coverage (%) | 99.5 | 98.6 -1% | 58.5 -41% | 91.2 -8% | 95.5 -4% | 99.7 0% | 98.5 -1% | 82.4 -17% |
| AdobeRGB 1998 Coverage (%) | 99.3 | 98.2 -1% | 40.45 -59% | 66.8 -33% | 69 -31% | 99 0% | 68.9 -31% | 60.3 -39% |
| Response Times | 9% | -8% | 4% | -37% | -5% | -55% | 2% | |
| Response Time Grey 50% / Grey 80% * (ms) | 40.8 ? | 39.2 ? 4% | 46 ? -13% | 38.4 ? 6% | 54 ? -32% | 40.4 ? 1% | 59.2 ? -45% | 38 ? 7% |
| Response Time Black / White * (ms) | 25.2 ? | 22 ? 13% | 26 ? -3% | 24.8 ? 2% | 35.6 ? -41% | 27.6 ? -10% | 41.6 ? -65% | 26 ? -3% |
| PWM Frequency (Hz) | 217 | 980 ? | 198 ? | 198.4 ? | ||||
| Screen | -38% | -17% | -16% | -42% | -11% | -9% | -21% | |
| Brightness middle (cd/m²) | 317 | 250 -21% | 263 -17% | 317 0% | 306 -3% | 279.2 -12% | 372.4 17% | 341 8% |
| Brightness (cd/m²) | 309 | 250 -19% | 236 -24% | 290 -6% | 289 -6% | 271 -12% | 368 19% | 310 0% |
| Brightness Distribution (%) | 89 | 86 -3% | 78 -12% | 85 -4% | 85 -4% | 83 -7% | 90 1% | 82 -8% |
| Black Level * (cd/m²) | 0.36 | 0.31 14% | 0.34 6% | 0.32 11% | 0.34 6% | 0.266 26% | 0.48 -33% | 0.34 6% |
| Contrast (:1) | 881 | 806 -9% | 774 -12% | 991 12% | 900 2% | 1050 19% | 776 -12% | 1003 14% |
| Colorchecker dE 2000 * | 2.7 | 4.5 -67% | 2.35 13% | 3.6 -33% | 5.1 -89% | 4.14 -53% | 2.6 4% | 3.8 -41% |
| Colorchecker dE 2000 max. * | 4.1 | 9.3 -127% | 6.6 -61% | 9.9 -141% | 6.56 -60% | 5.6 -37% | 10.8 -163% | |
| Greyscale dE 2000 * | 3 | 7.2 -140% | 3.33 -11% | 4.2 -40% | 7.4 -147% | 3.26 -9% | 3.7 -23% | 2 33% |
| Gamma | 2.27 97% | 2.31 95% | 2.38 92% | 2.24 98% | 2.37 93% | 2.19 100% | 2.14 103% | 2.17 101% |
| CCT | 6077 107% | 6399 102% | 6917 94% | 6740 96% | 7263 89% | 6375 102% | 7096 92% | 6581 99% |
| Color Space (Percent of AdobeRGB 1998) (%) | 87.6 | 85 -3% | 37 -58% | 59.5 -32% | 63 -28% | 85.68 -2% | 63 -28% | 54 -38% |
| Color Space (Percent of sRGB) (%) | 99.5 | 98.6 -1% | 58 -42% | 91.1 -8% | 95 -5% | 99.72 0% | 99 -1% | 82.2 -17% |
| Media totale (Programma / Settaggio) | -10% /
-24% | -26% /
-23% | -11% /
-14% | -33% /
-36% | -5% /
-8% | -27% /
-17% | -15% /
-19% |
* ... Meglio usare valori piccoli
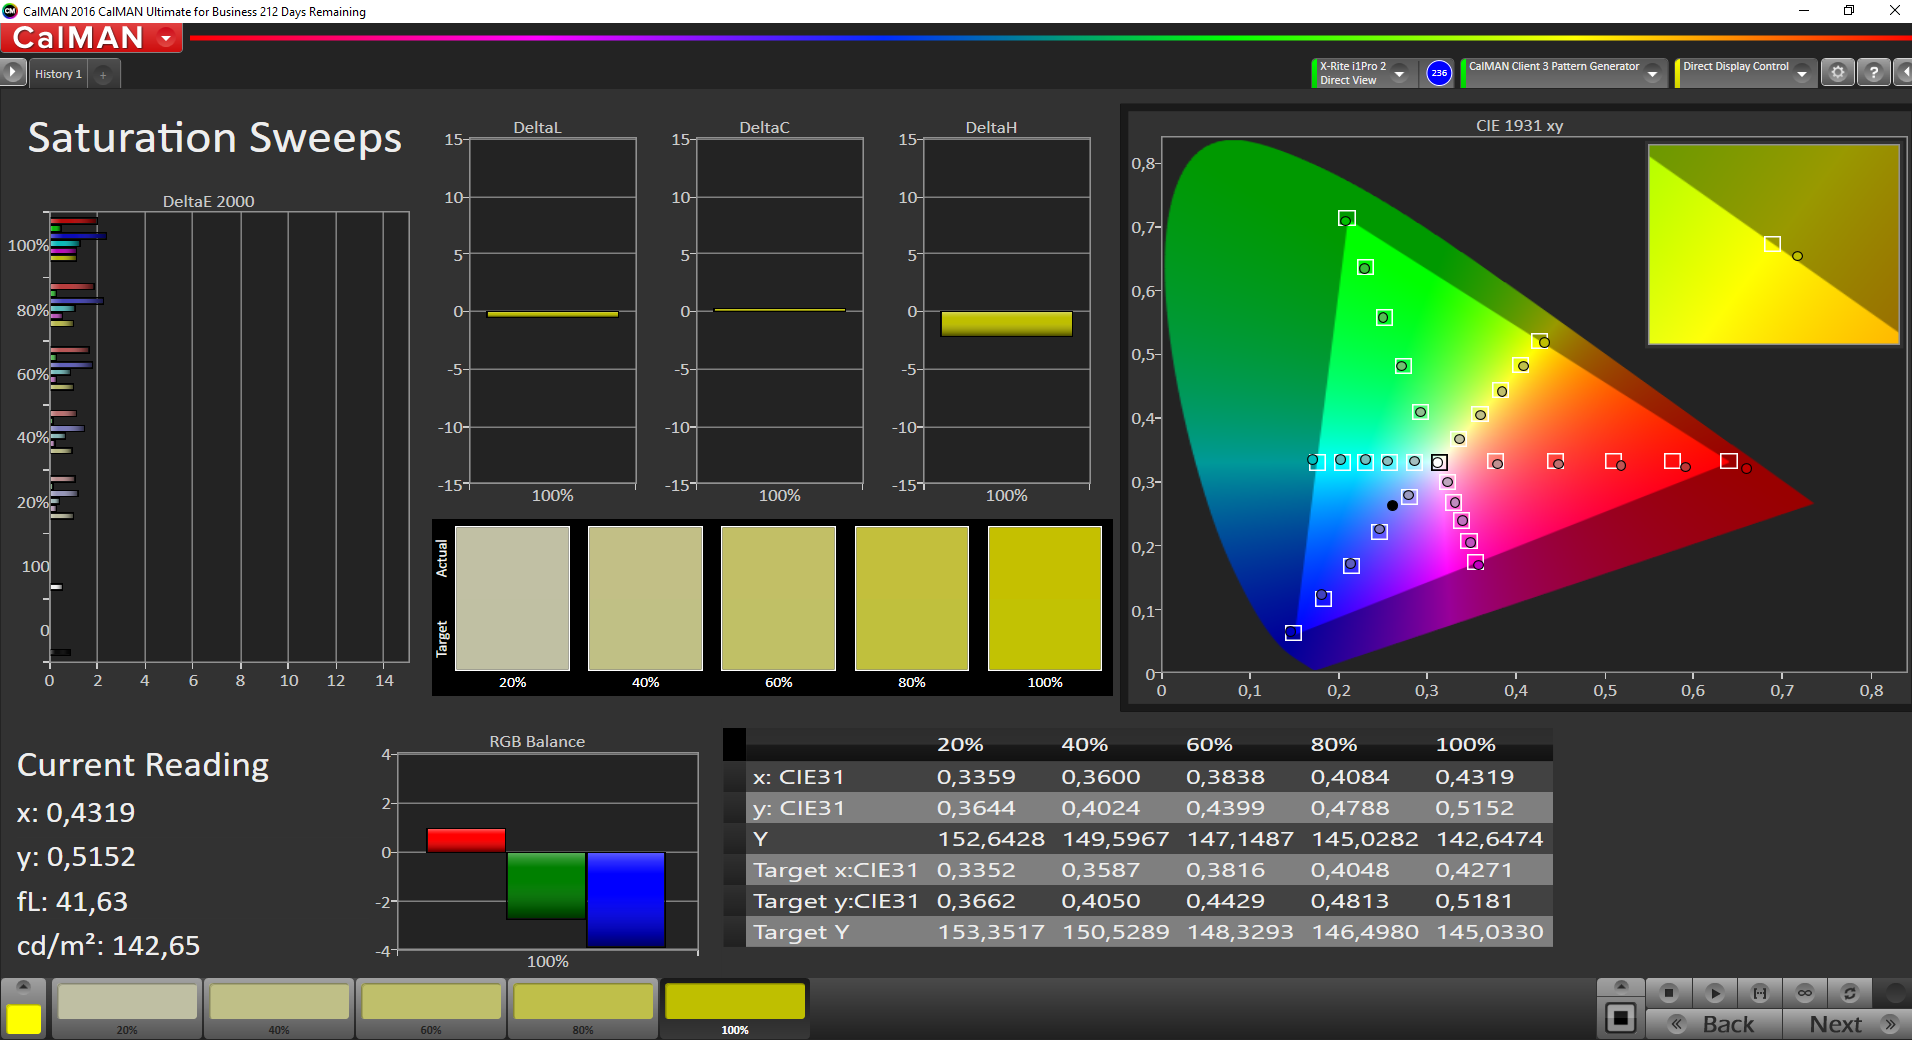
Alcune SKUs P51 hanno anche come feature la calibrazione integrata del colore (X-Rite Pantone). In quanto si tratta di una feature integrata, prendiamo questi risultati calibrati per il nostro database. Tuttavia, la calibrazione non ha funzionato nel nostro modello di test. La luminosità è passata ad appena ~200 nits, con un evidente tinta rossa, e le deviazioni CalMAN sono state molto più alte rispetto ai risultati standard. I seguenti screenshots sono stati scattati con i settaggi standard di fabbrica.
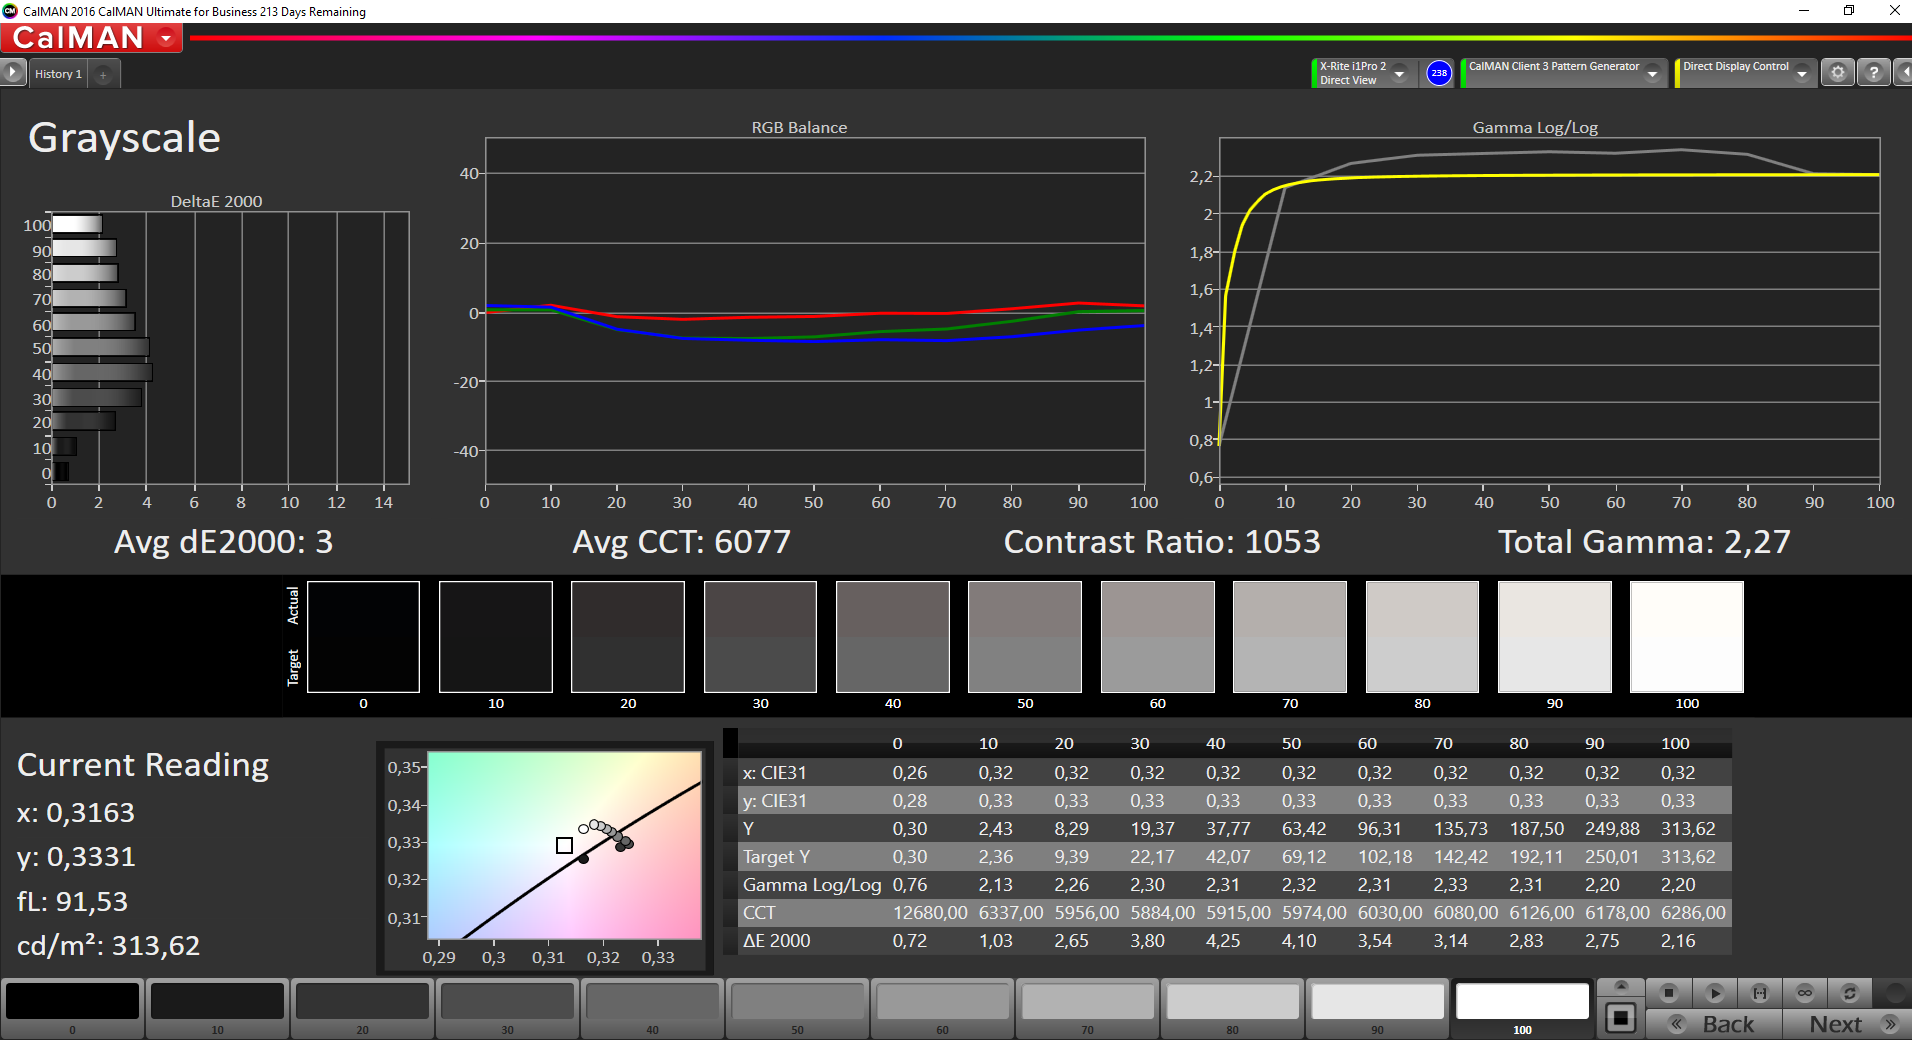
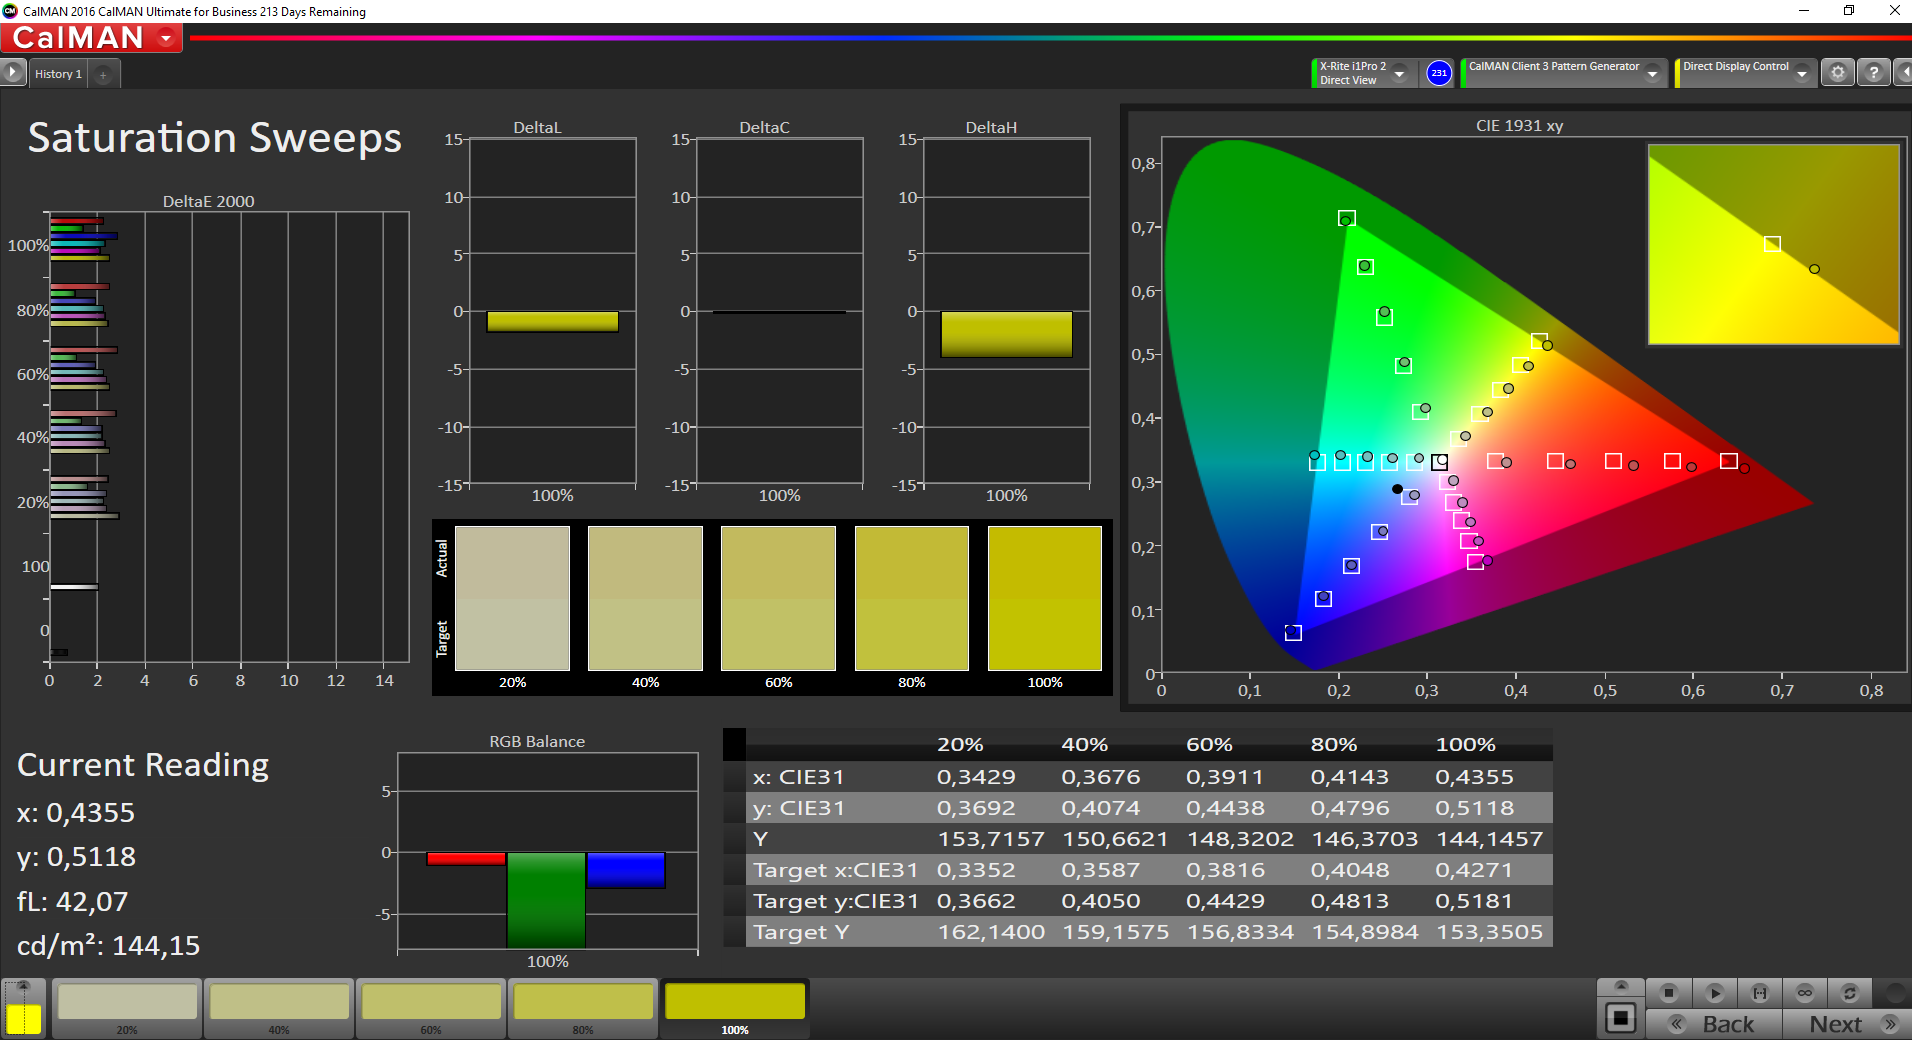
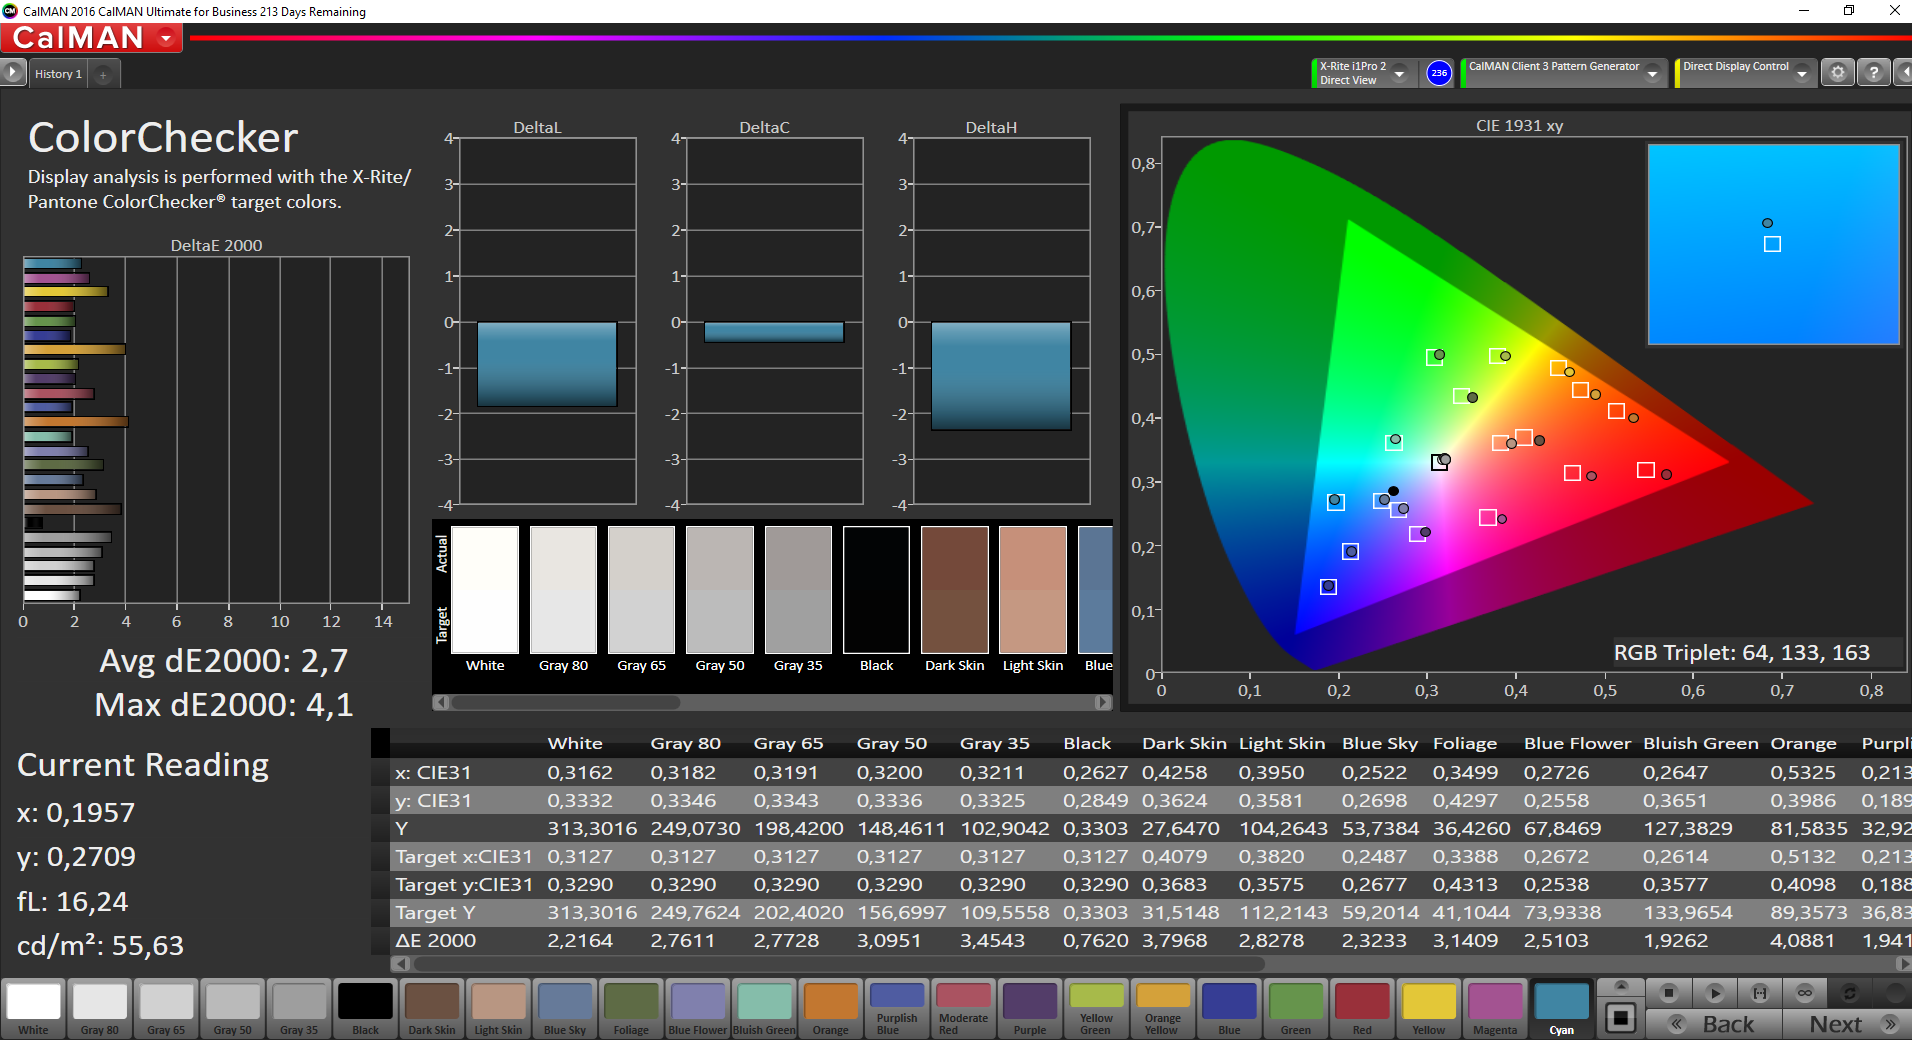
Grazie all'ampia gamma di colore (vedremo tra poco meglio), abbiamo misurato il display rispetto alle gamme di colore di riferimento sRGB ed AdobeRGB . I risultati AdobeRGB sono migliore come si vede dagli screenshots, ma le deviazioni rispetto al riferimento sRGB non sono molto peggiori.
Le deviazioni medie per la scala di grigi e dei colori sono nel range target di 3 o inferiore. Abbiamo notato una leggera tinta rossa nella scala di grigi, e la temperatura del colore non è perfetta.
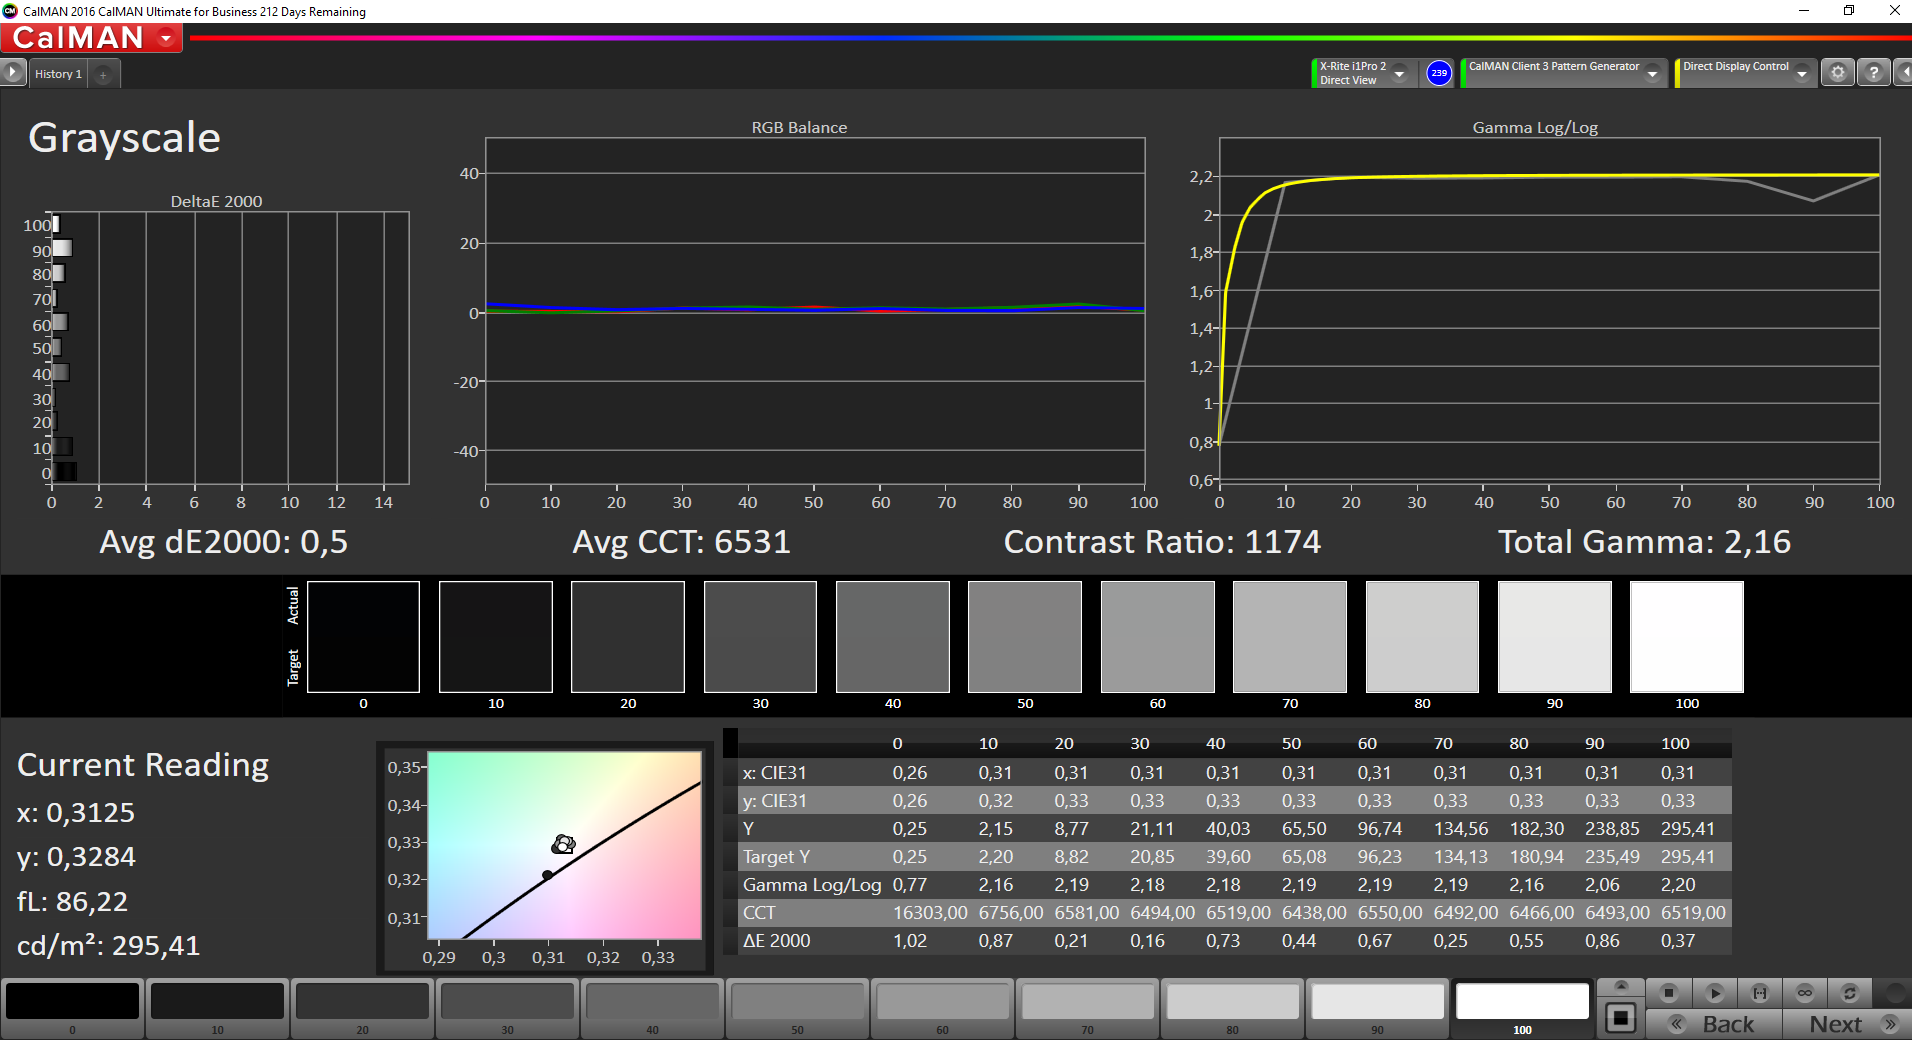
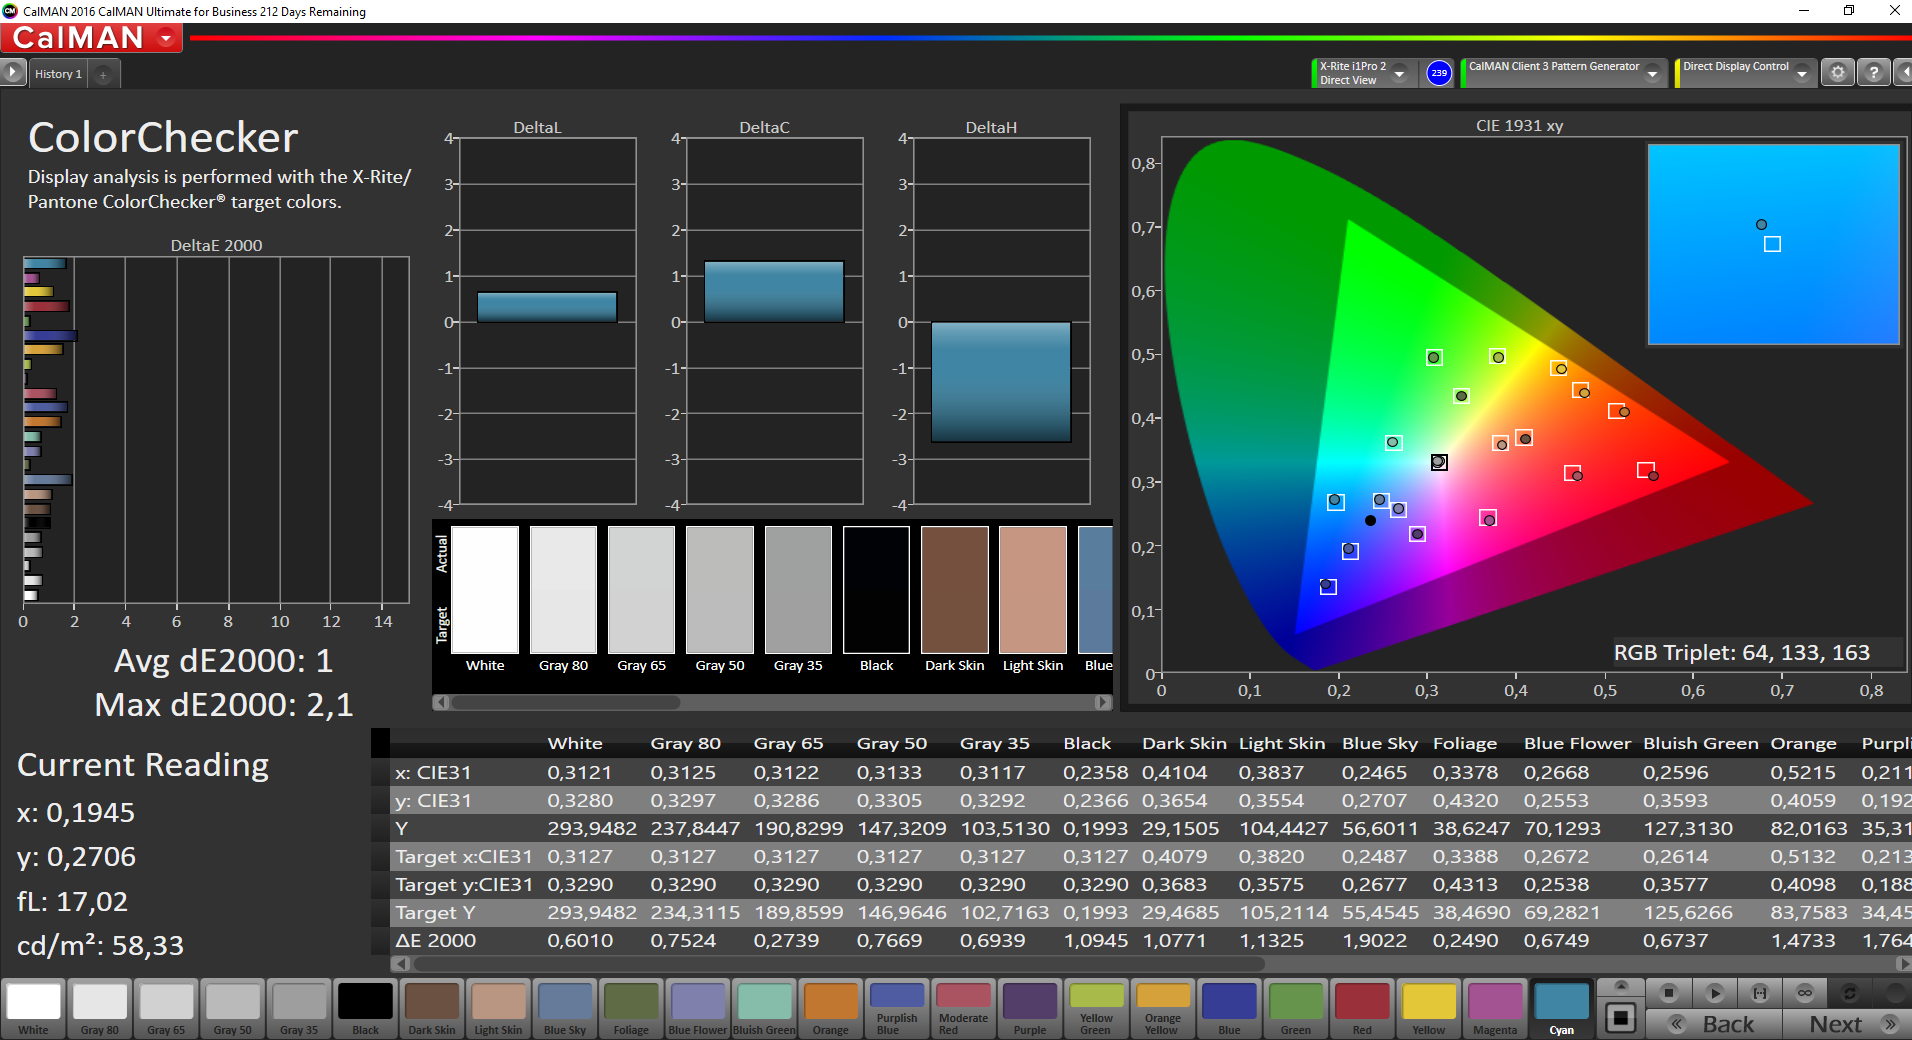
La nostra calibrazione (spettofotometro X-Rite i1Pro2) mostra il pieno potenziale dello schermo. La deviazione della scala di grigi scende a 0.5 e sia il bilanciamento RGB che la temperatura del colore sono quasi perfetti. La deviazione del colore pure scende ad 1 in media (fino a 2.1), quindi siamo le limite target. Potete scaricare il nostro profilo calibrato nel box in alto.
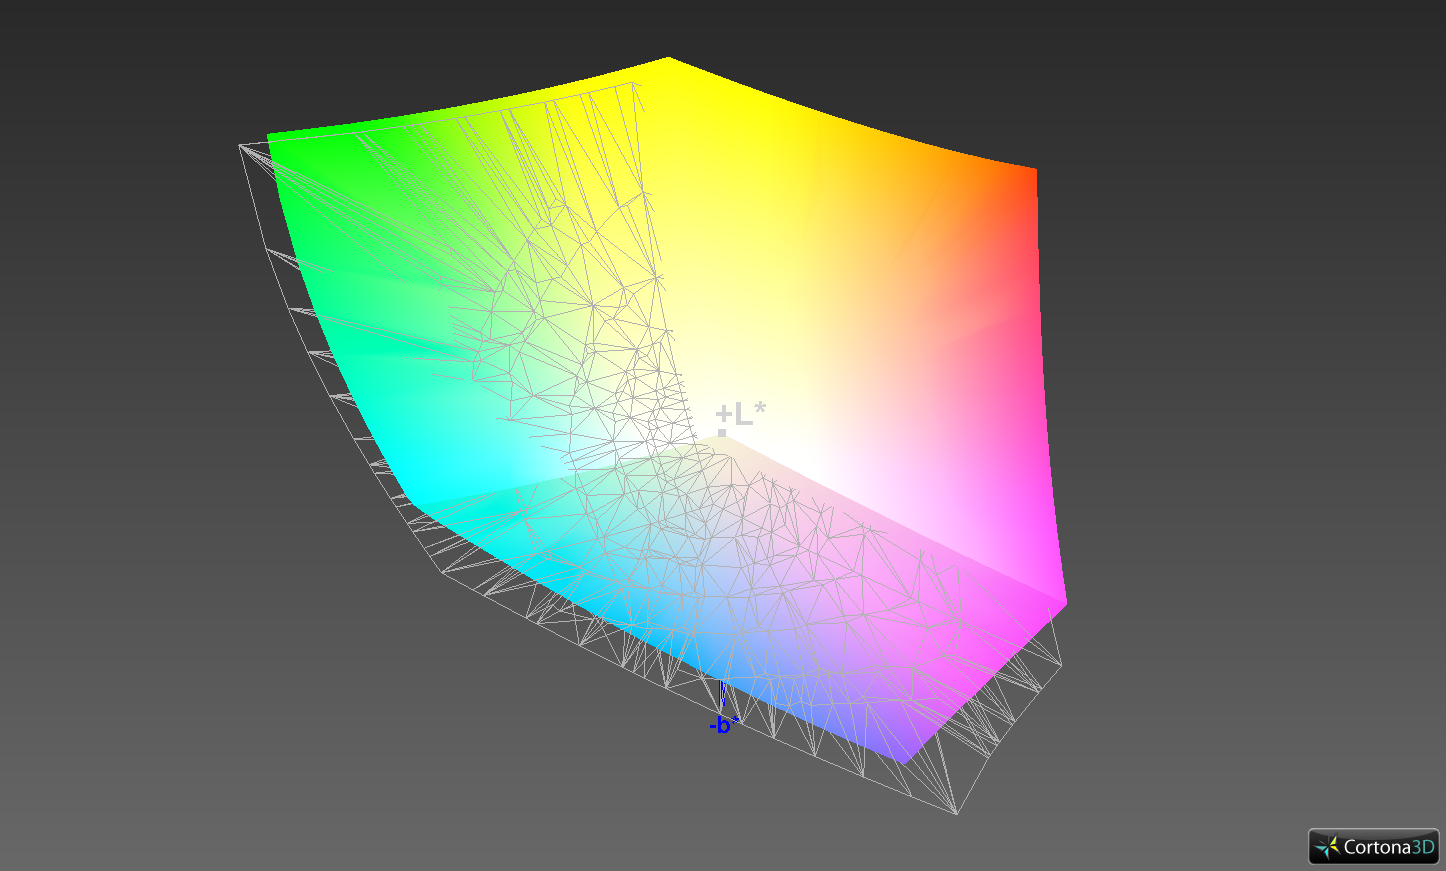
La gamma di colore è alla pari con il panel 4K del modello precedente e del Dell 7510. La gamma più piccola sRGB è completamente coperta, e l'AdobeRGB lo è del 87.5%. Grazie alle basse deviazioni di colore, potete usare il P51 per editing immagine seri.

Tempi di risposta del Display
| ↔ Tempi di risposta dal Nero al Bianco | ||
|---|---|---|
| 25.2 ms ... aumenta ↗ e diminuisce ↘ combinato | ↗ 14 ms Incremento | 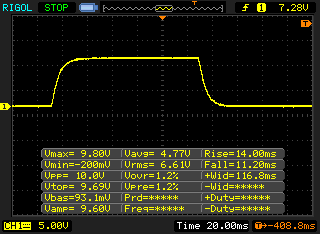 |
| ↘ 11.2 ms Calo | ||
| Lo schermo mostra tempi di risposta relativamente lenti nei nostri tests e potrebbe essere troppo lento per i gamers. In confronto, tutti i dispositivi di test variano da 0.1 (minimo) a 240 (massimo) ms. » 60 % di tutti i dispositivi è migliore. Questo significa che i tempi di risposta rilevati sono peggiori rispetto alla media di tutti i dispositivi testati (19.9 ms). | ||
| ↔ Tempo di risposta dal 50% Grigio all'80% Grigio | ||
| 40.8 ms ... aumenta ↗ e diminuisce ↘ combinato | ↗ 20.8 ms Incremento | 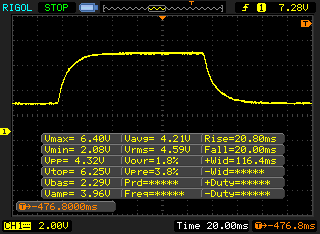 |
| ↘ 20 ms Calo | ||
| Lo schermo mostra tempi di risposta lenti nei nostri tests e sarà insoddisfacente per i gamers. In confronto, tutti i dispositivi di test variano da 0.165 (minimo) a 636 (massimo) ms. » 64 % di tutti i dispositivi è migliore. Questo significa che i tempi di risposta rilevati sono peggiori rispetto alla media di tutti i dispositivi testati (31.1 ms). | ||
Sfarfallio dello schermo / PWM (Pulse-Width Modulation)
| flickering dello schermo / PWM non rilevato |  | ||
In confronto: 52 % di tutti i dispositivi testati non utilizza PWM per ridurre la luminosita' del display. Se è rilevato PWM, una media di 7798 (minimo: 5 - massimo: 343500) Hz è stata rilevata. | |||
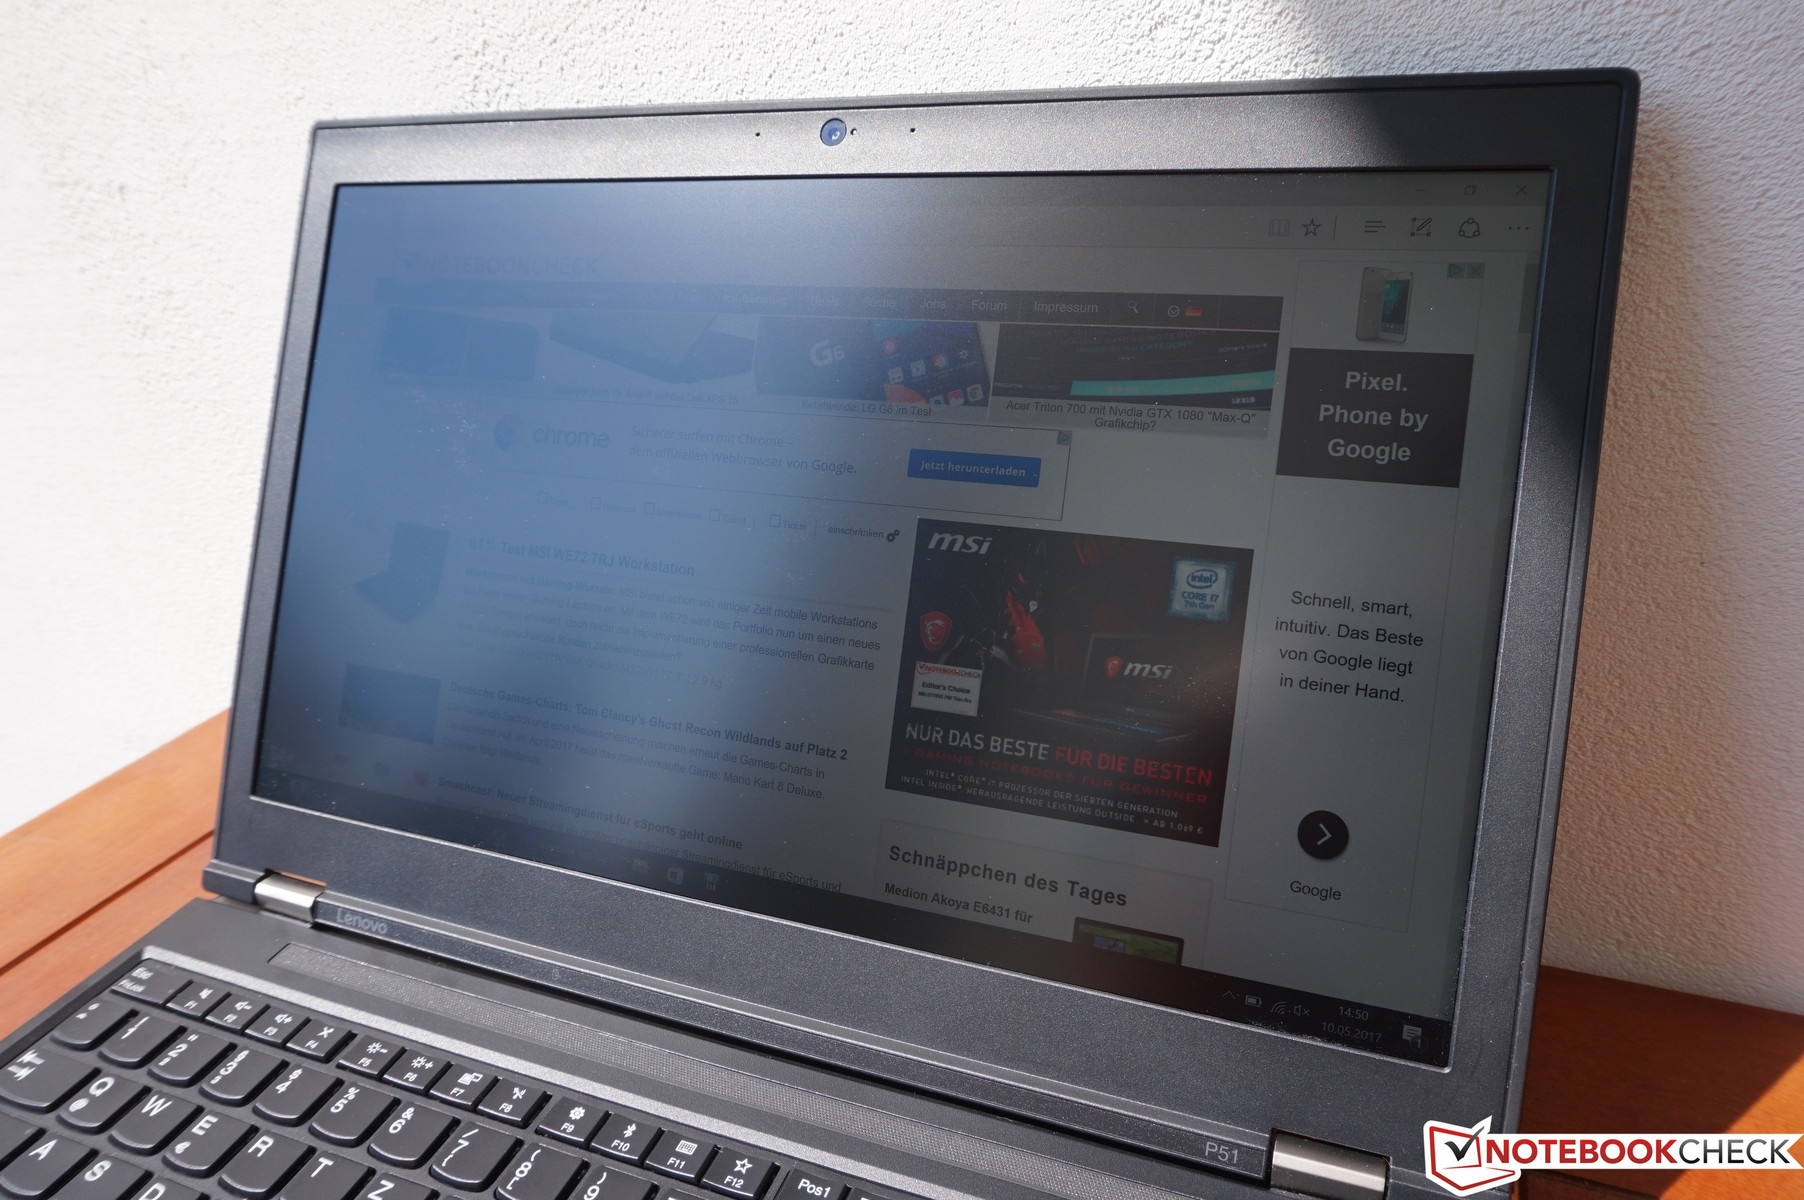
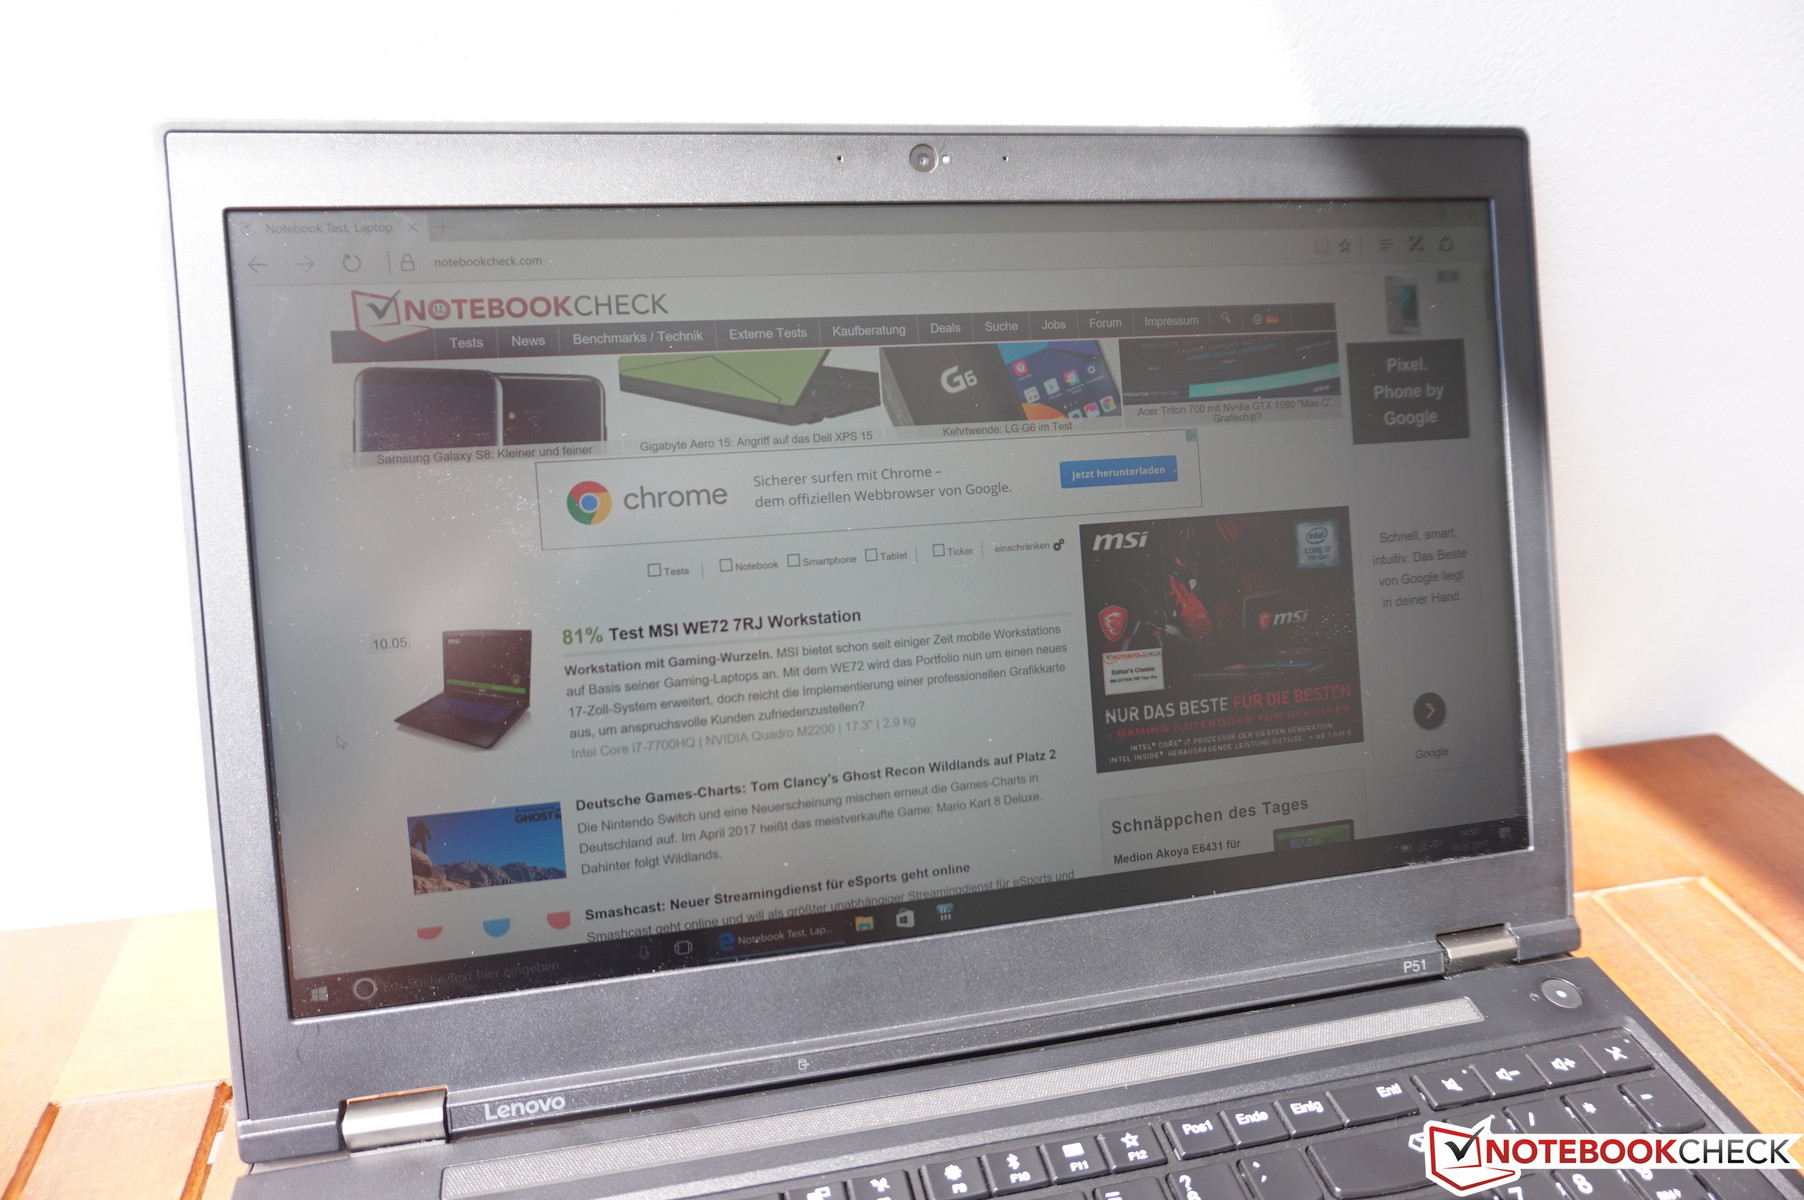
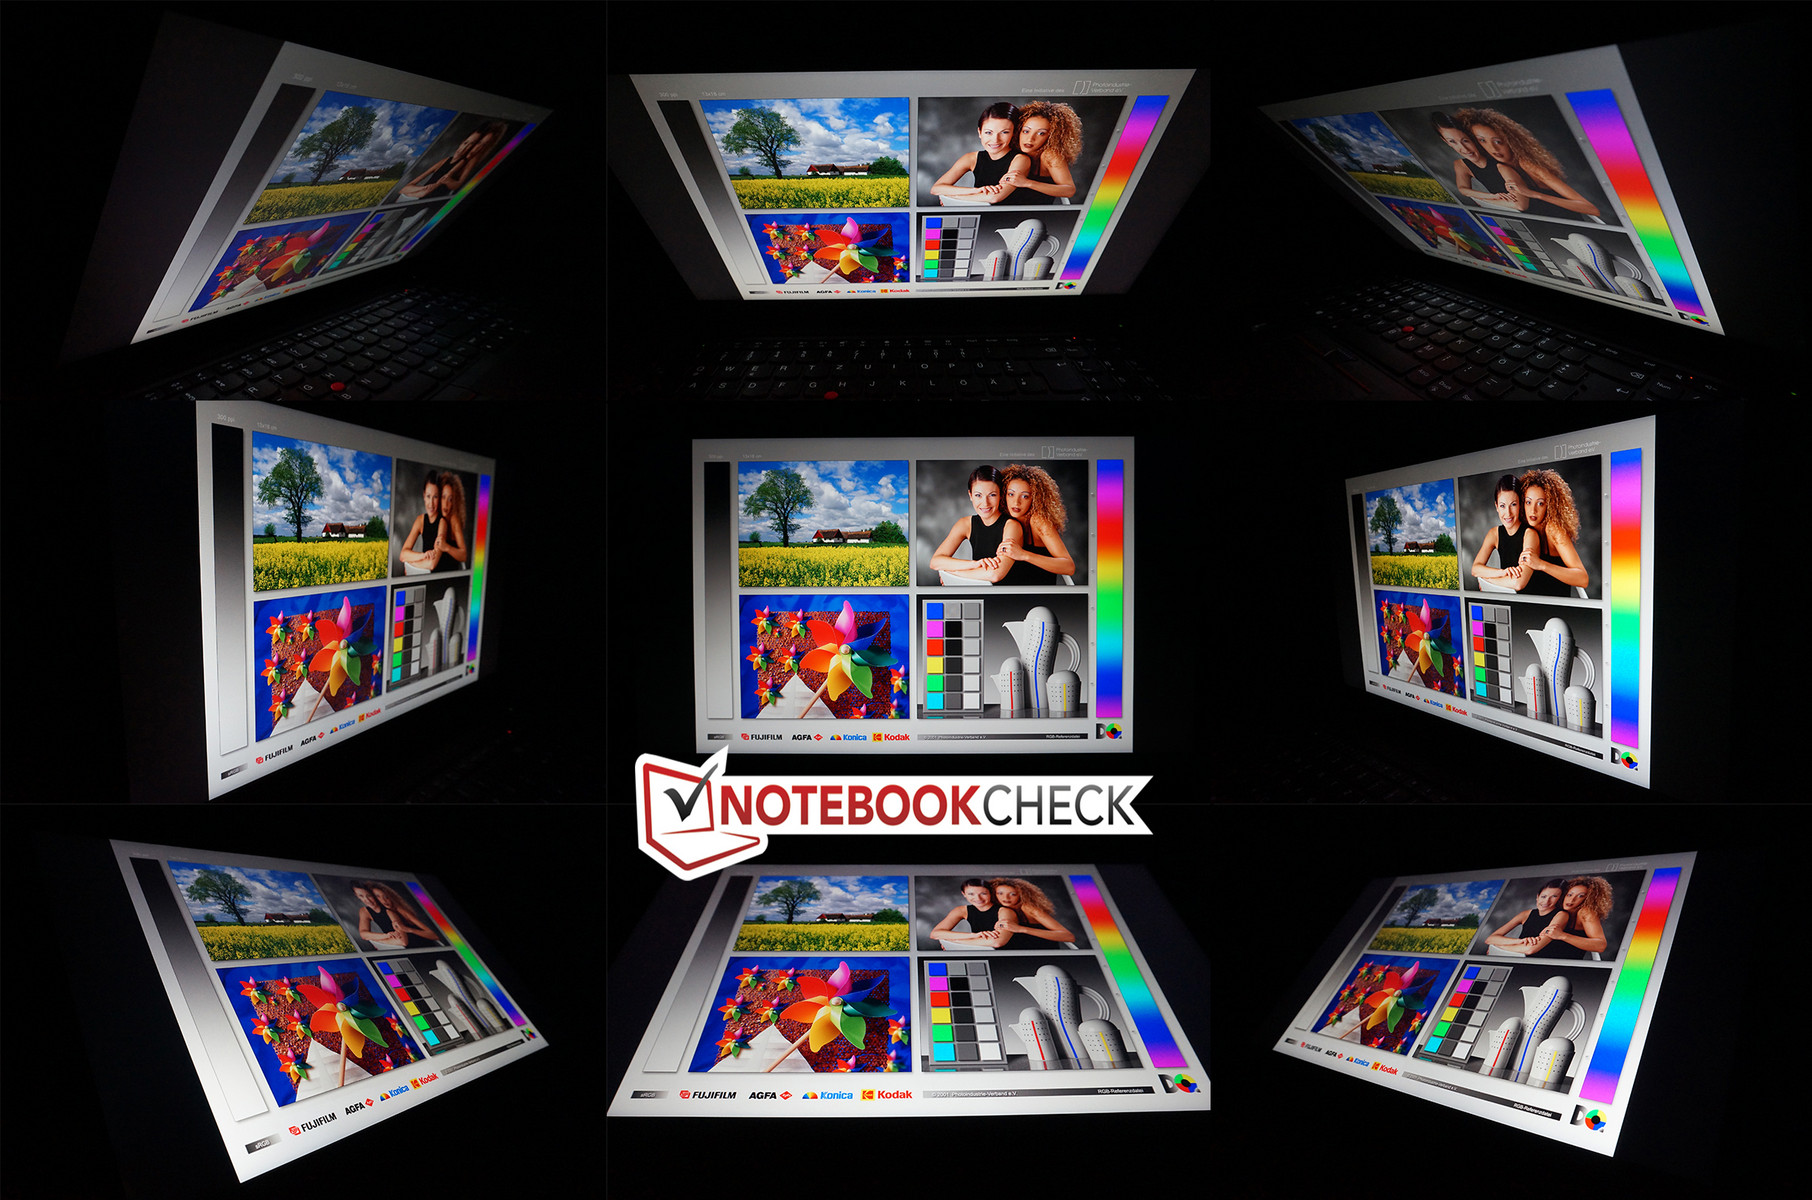
La luminosità non viene ridotta con l'uso della sola batteria, e potete usare il ThinkPad P51 all'esterno grazie al pannello con superficie matta. La stabilità degli angoli di visuale del pannello IPS è molto buona; la luminosità soffre solo ad angolazioni estreme, ma non è un problema nel concreto.
Performance
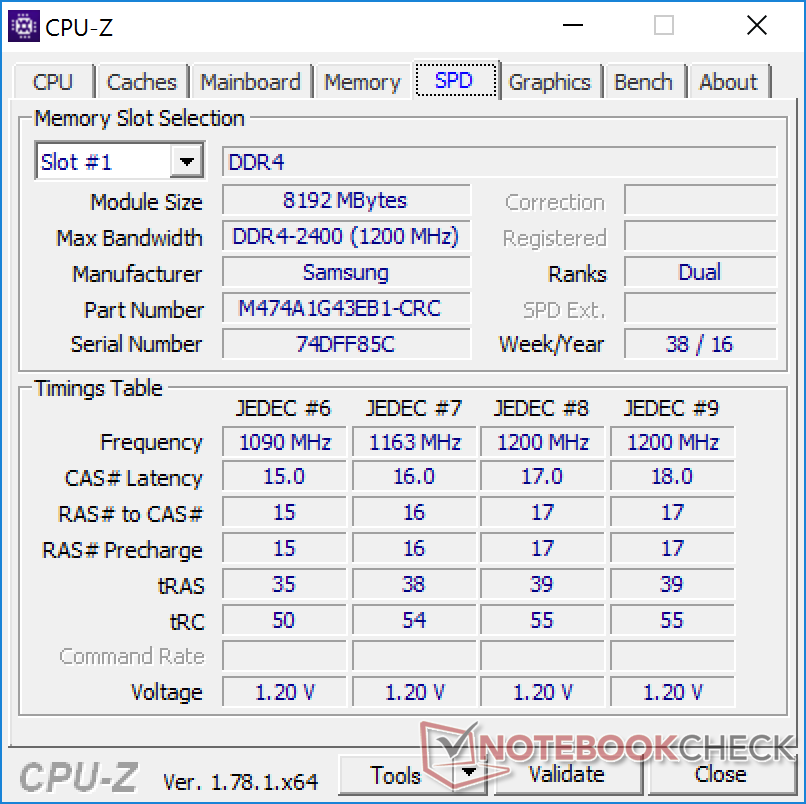
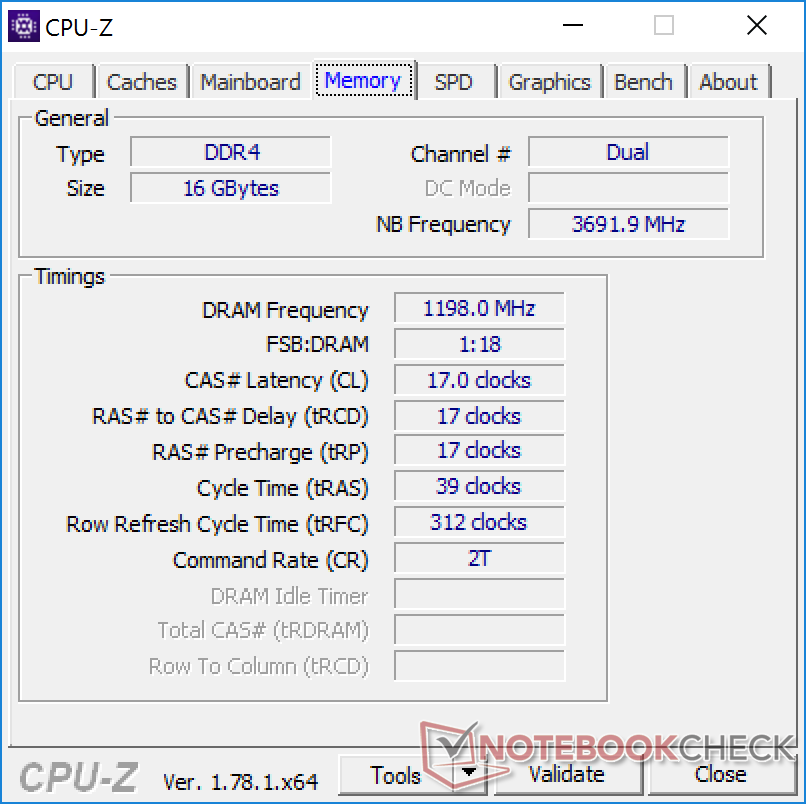
Il ThinkPad P51 è una potente workstation mobile. Il sistema è disponibile solo con processori quad-core e con GPUs dedicate Quadro Nvidia. Le due soluzioni grafiche (M1200 & M2200) si basano ancora sulla vecchia architettura Maxwell sebbene i più recenti chips Pascal siano riservati al ThinkPad P71. Lenovo offre anche molte opzioni per la memoria (inclusa RAM ECC con CPUs Xeon per una migliore correzione degli errori) e per lo spazio di archiviazione. In aggiunta ai modelli preconfigurati TopSeller, è anche possibile configurare il sistema nel negozio online Lenovo. Il modello più piccolo attualmente parte da circa 2000 Euro (~$2225), ma potete arrivare fino a 5500 Euro (~$5562) se selezionate tutte le opzioni a disposizione.
Processore
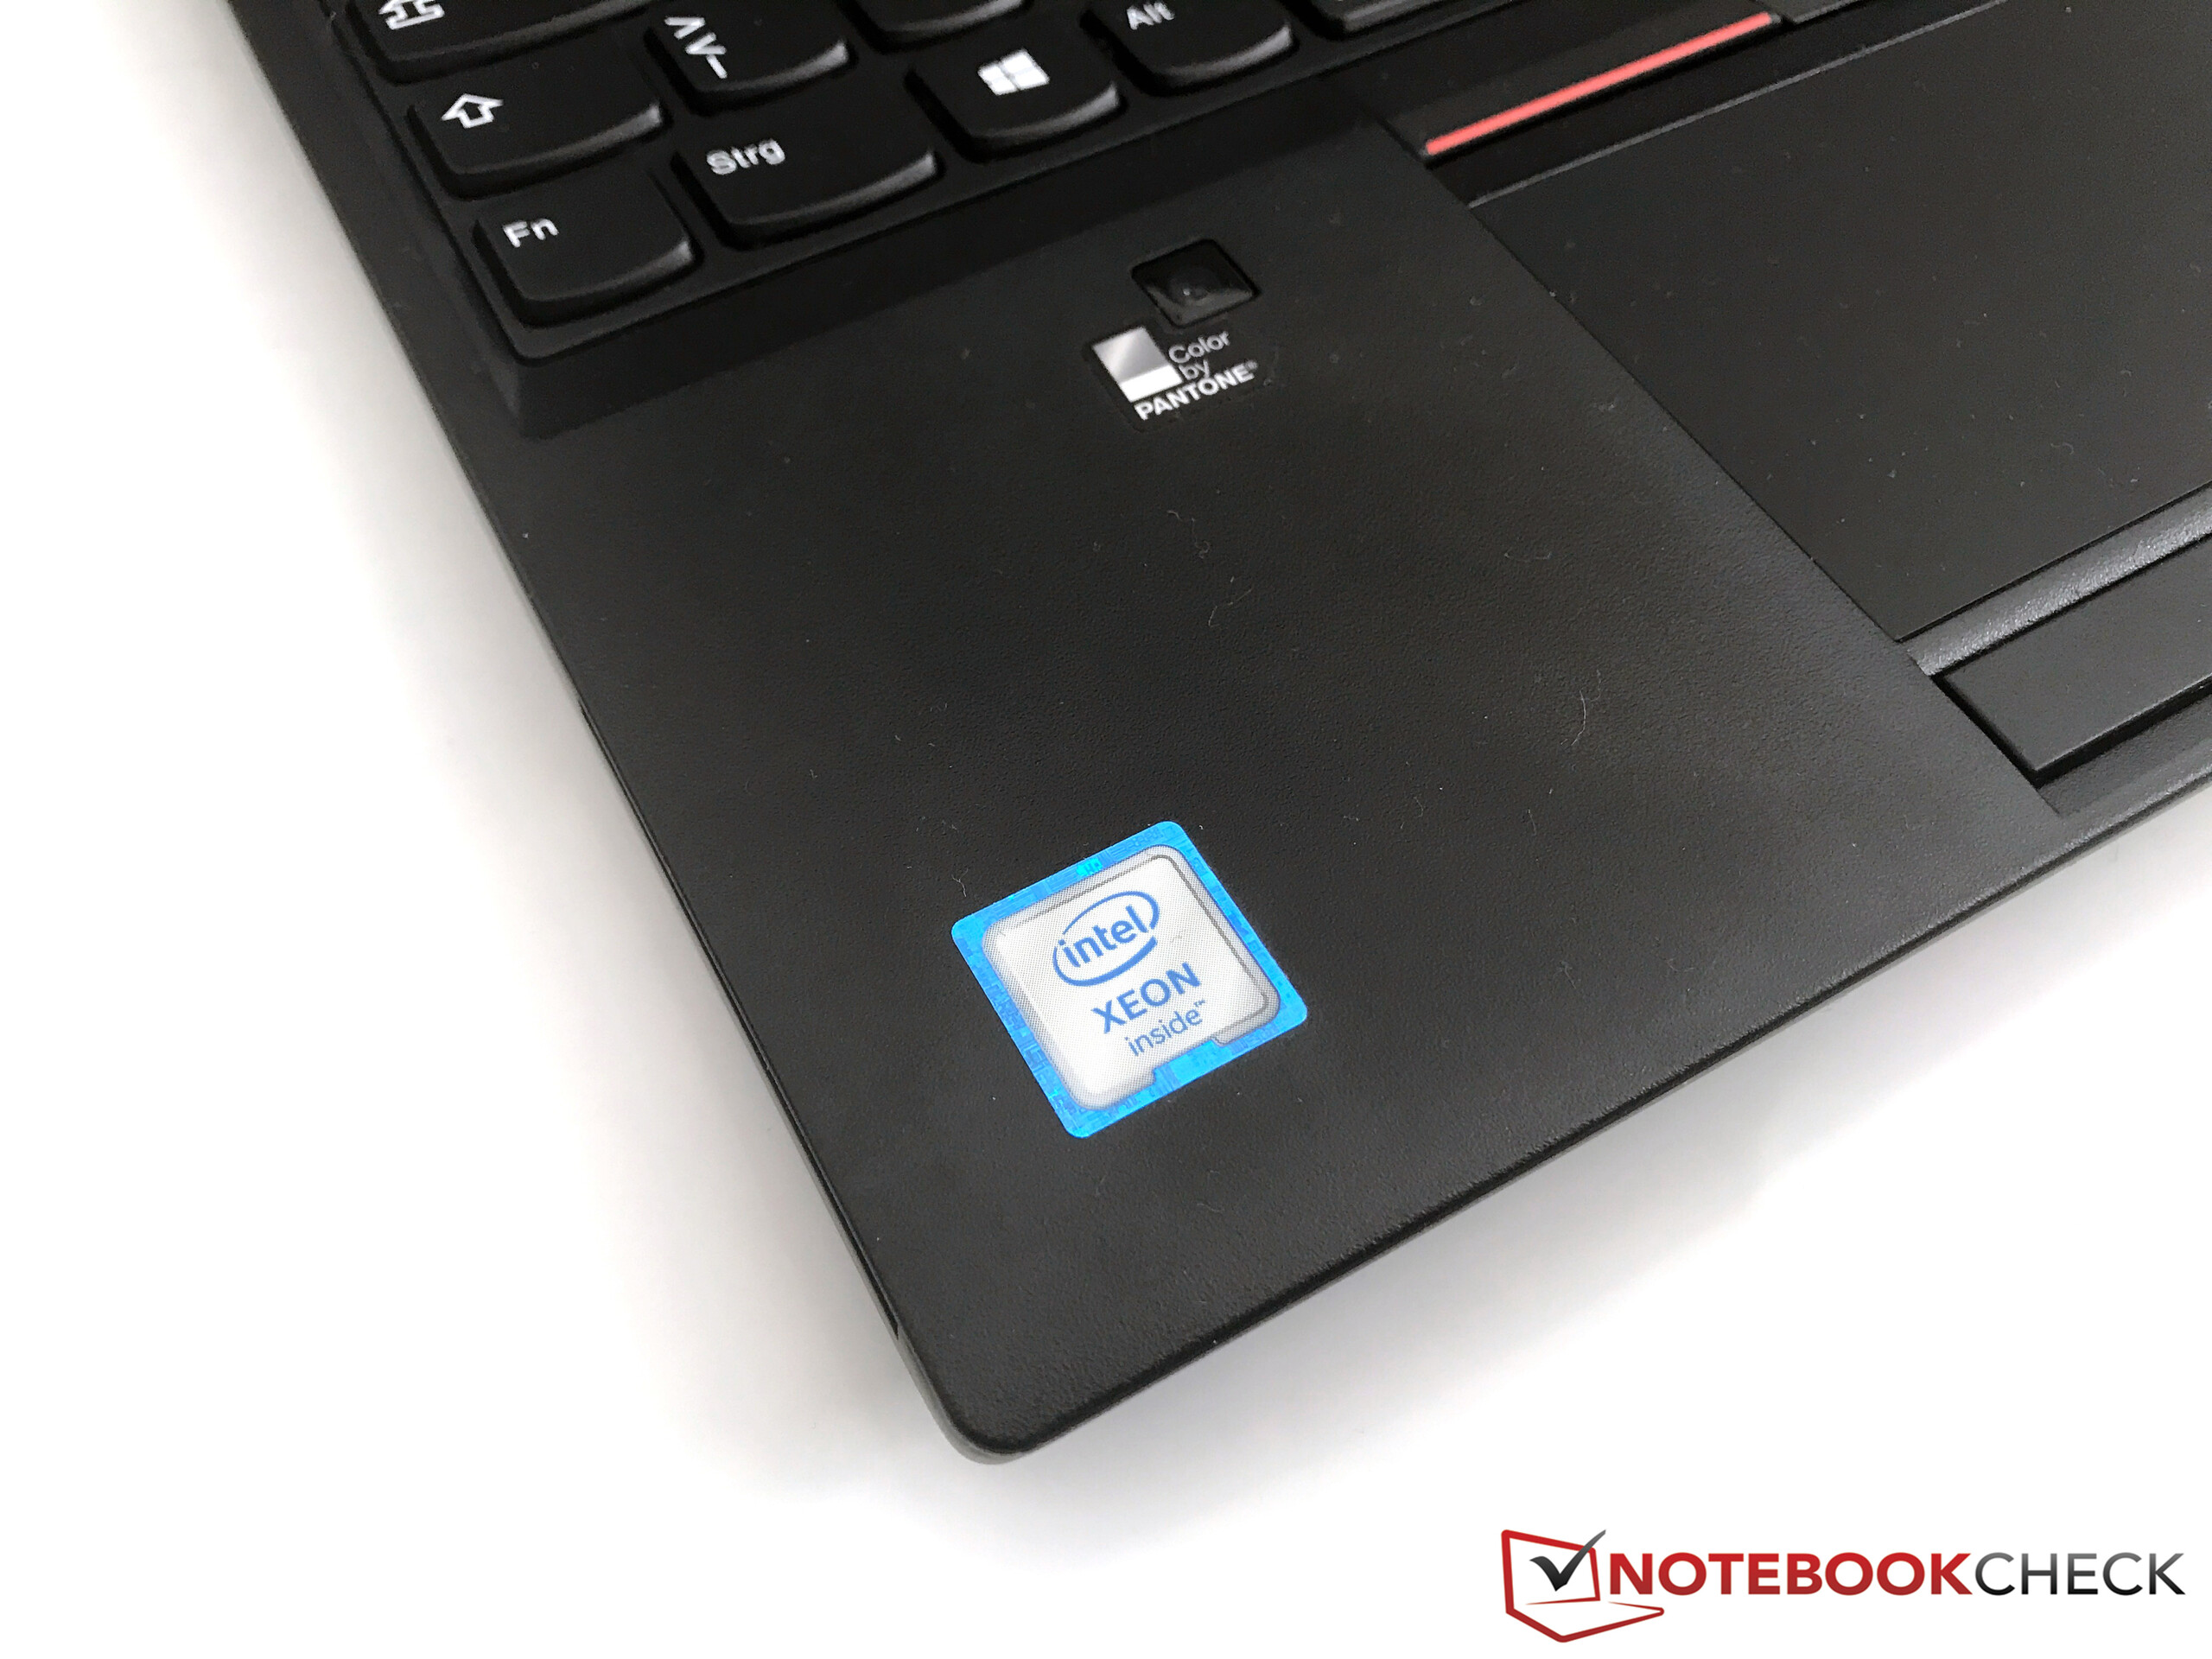
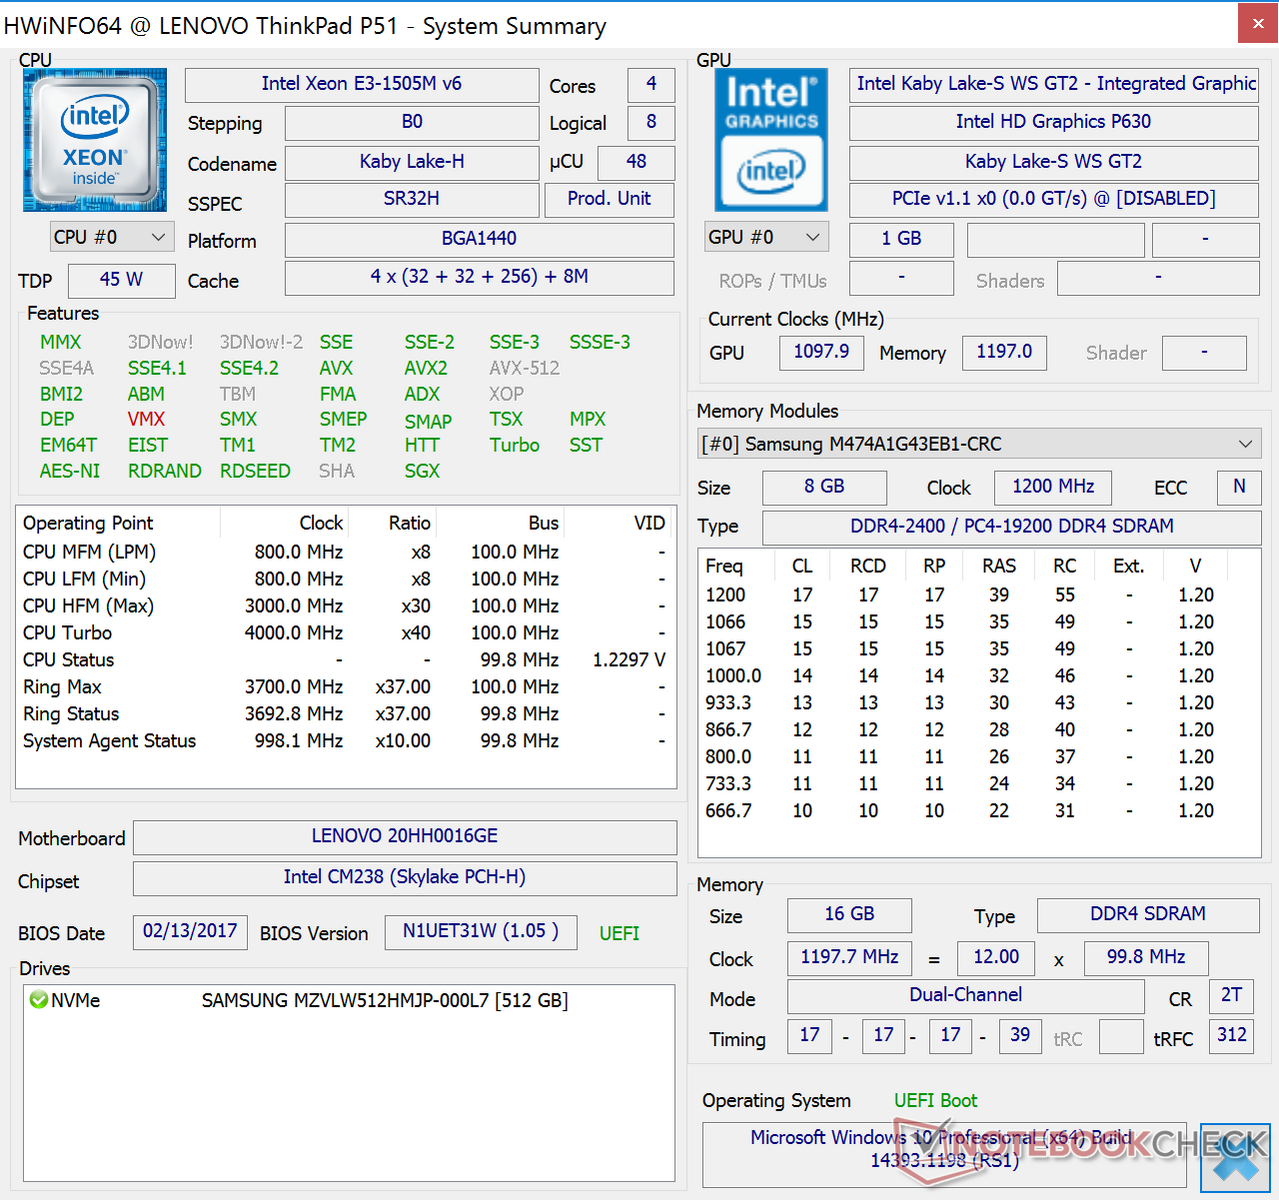
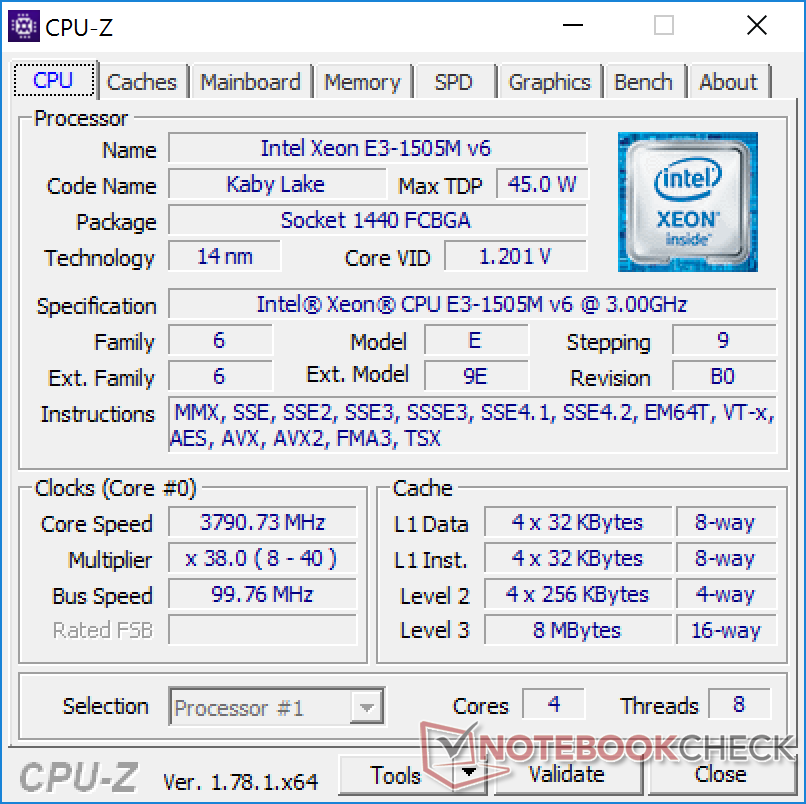
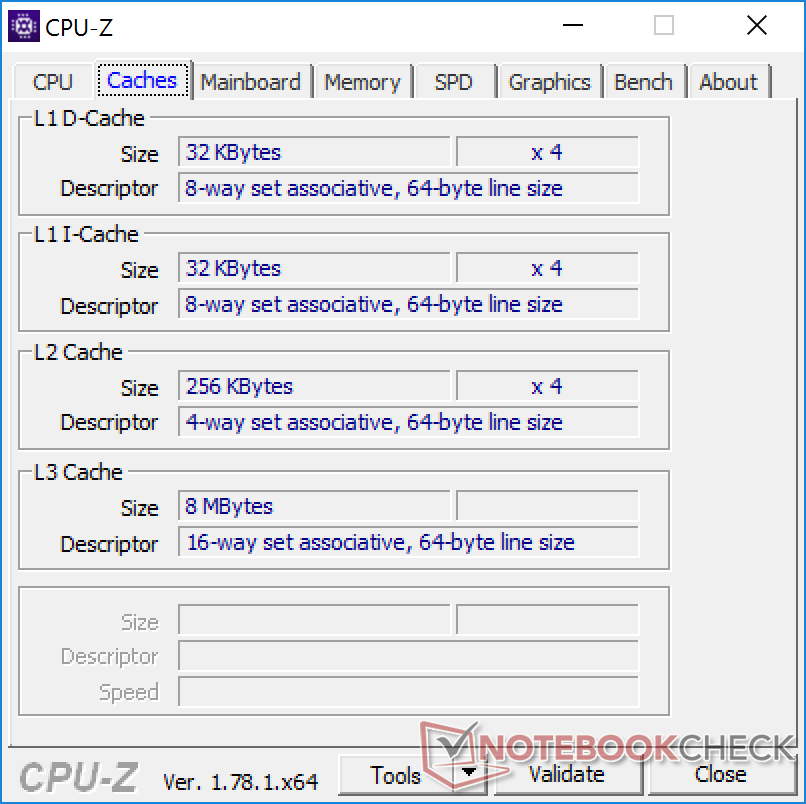
Potete avere il ThinkPad P51 con quattro diversi processori Intel basati sull'architettura Kaby Lake. Oltre al Core i7-7700HQ e al Core i7-7820HQ, Lenovo offre anche due due chips mobile Xeon: l'Xeon E3-1505M v6 del nostro modello di test ed anche il più veloce E3-1535M v6. I due Xeons attualmente sono tra i processori mobile più veloci sul mercato. La frequenza base dell'Xeon E3-1505M v6 è di 3 GHz, ma riesce ad arrivare fino 4 GHz per un core via Turbo Boost (2 cores: 3.8 GHz, 4 cores: 3.6 GHz). Questo significa che l'Xeon è leggermente avanti all'i7-7820HQ, che è di 100 MHz più lento.
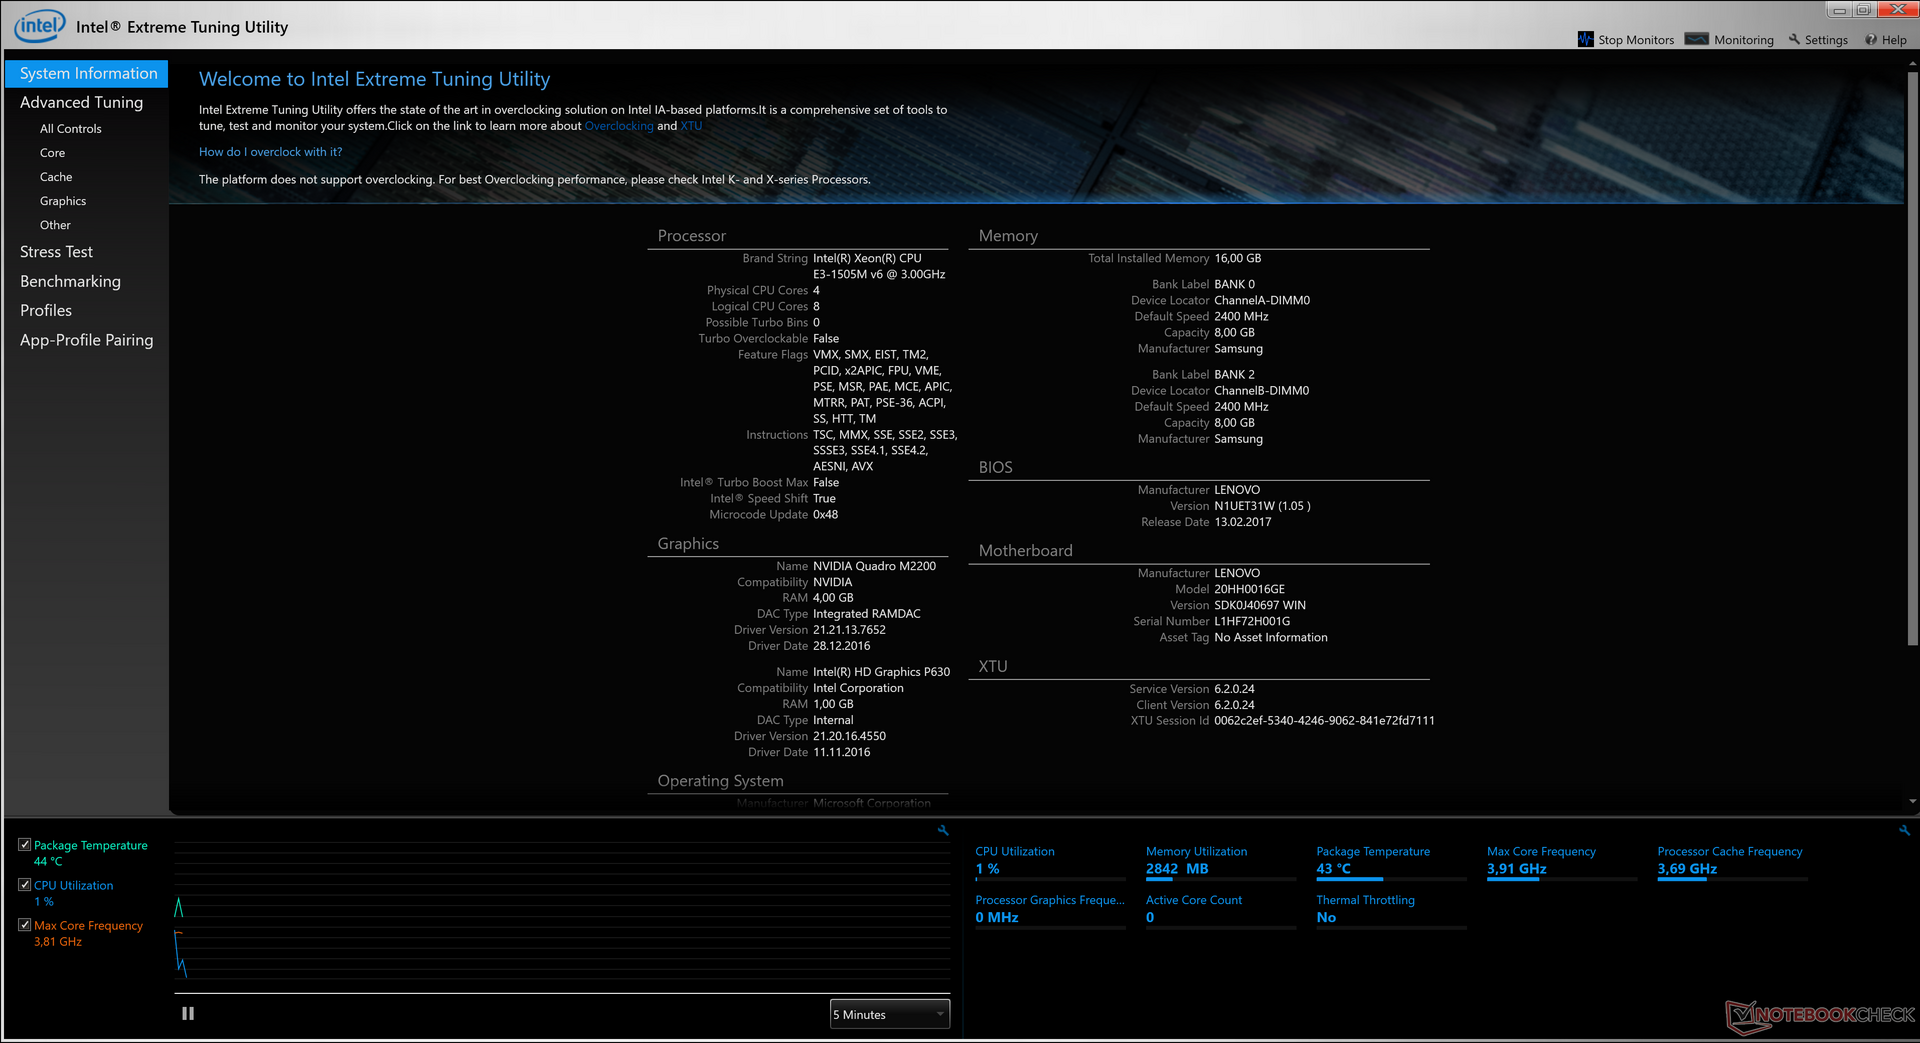
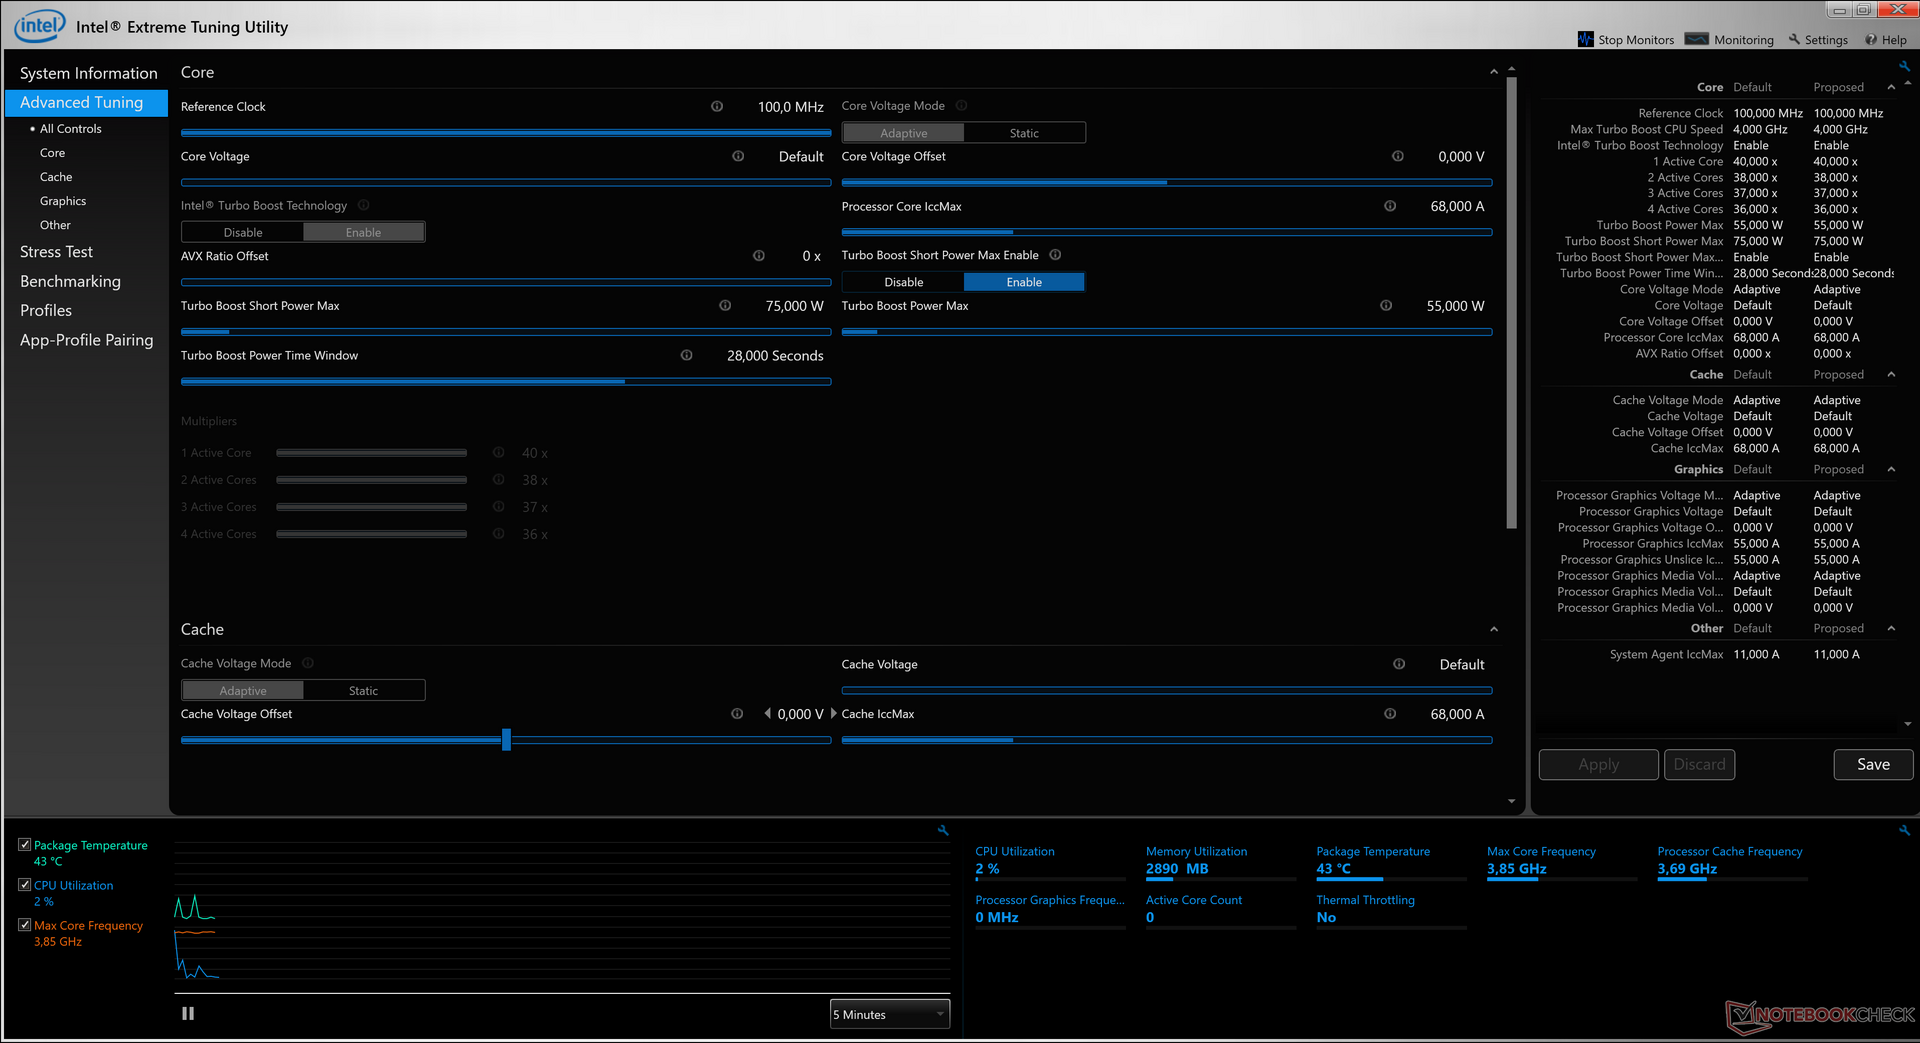
Lenovo ha incrementato il limite TDP da 45 a 55 watts (anche 75 watts per brevi periodi), quindi potete usare clocks elevati. Potete anche notare un vantaggio della costruzione più spessa nei benchmarks. Mentre lo stesso processore Xeon nel più sottile Dell Precision 5520 è alla pari nel test Cinebench R15 Single, soffre di problemi di temperatura nel Multi test e resta dietro del 17%. La differenza rispetto al più sottile ThinkPad P51s è altrettanto significativa, in quanto il processore ULV non arriva nemmeno a metà dei punti del P51 (CB R15 Multi). Nel complesso, il nuovo Xeon è avanti di pochi punti percentuali rispetto ai modelli Skylake. I due chips opzionali Core i7 non sono molto più lenti. Se non avete bisogno di tutte le prestazioni della CPU o della RAM ECC, potete anche scegliere uno dei due modelli meno costosi.
E' sempre interessante vedere se i processori veloci riescono a mantenere le prestazioni per lunghi periodi. Lo abbiamo verificato con un loop del Cinebench R15 Multi test. Il ThinkPad P51 non ha alcun problema, e le prestazioni sono fluide anche dopo 50 lanci.
Il processore va leggermente peggio con la batteria, e il Multi test è eseguito "solo" con un clock di 4x 3.2 GHz. Il punteggio è di 682 punti, ossia il 14% in meno rispetto a quando si è collegati alla rete elettrica. Maggiori informazioni tecniche e benchmarks per l'Xeon E3-1505M v6 sono elencati nella Sezione Tecnica.
Performance di sistema
Il nostro ThinkPad P51 monta componenti potenti - CPU Xeon, GPU Nvidia Quadro, un veloce SSD NVMe – quindi le impressioni soggettive sulle prestazioni sono molto buone. Tuttavia, in ancuni synthetic benchmarks si attesta solo a metà del nostro gruppo di confronto; si mette in evidenza solo nel Creative test e nel vecchio PCMark 7.
| PCMark 7 - Score | |
| Lenovo ThinkPad P51 20HH0016GE | |
| Lenovo ThinkPad P51s 20HB000SGE | |
| HP ZBook 15 G3 | |
| Lenovo ThinkPad P50 | |
| PCMark 7 Score | 6440 punti | |
| PCMark 8 Home Score Accelerated v2 | 3641 punti | |
| PCMark 8 Creative Score Accelerated v2 | 6301 punti | |
| PCMark 8 Work Score Accelerated v2 | 4256 punti | |
Aiuto | ||
Dispositivi Archiviazione
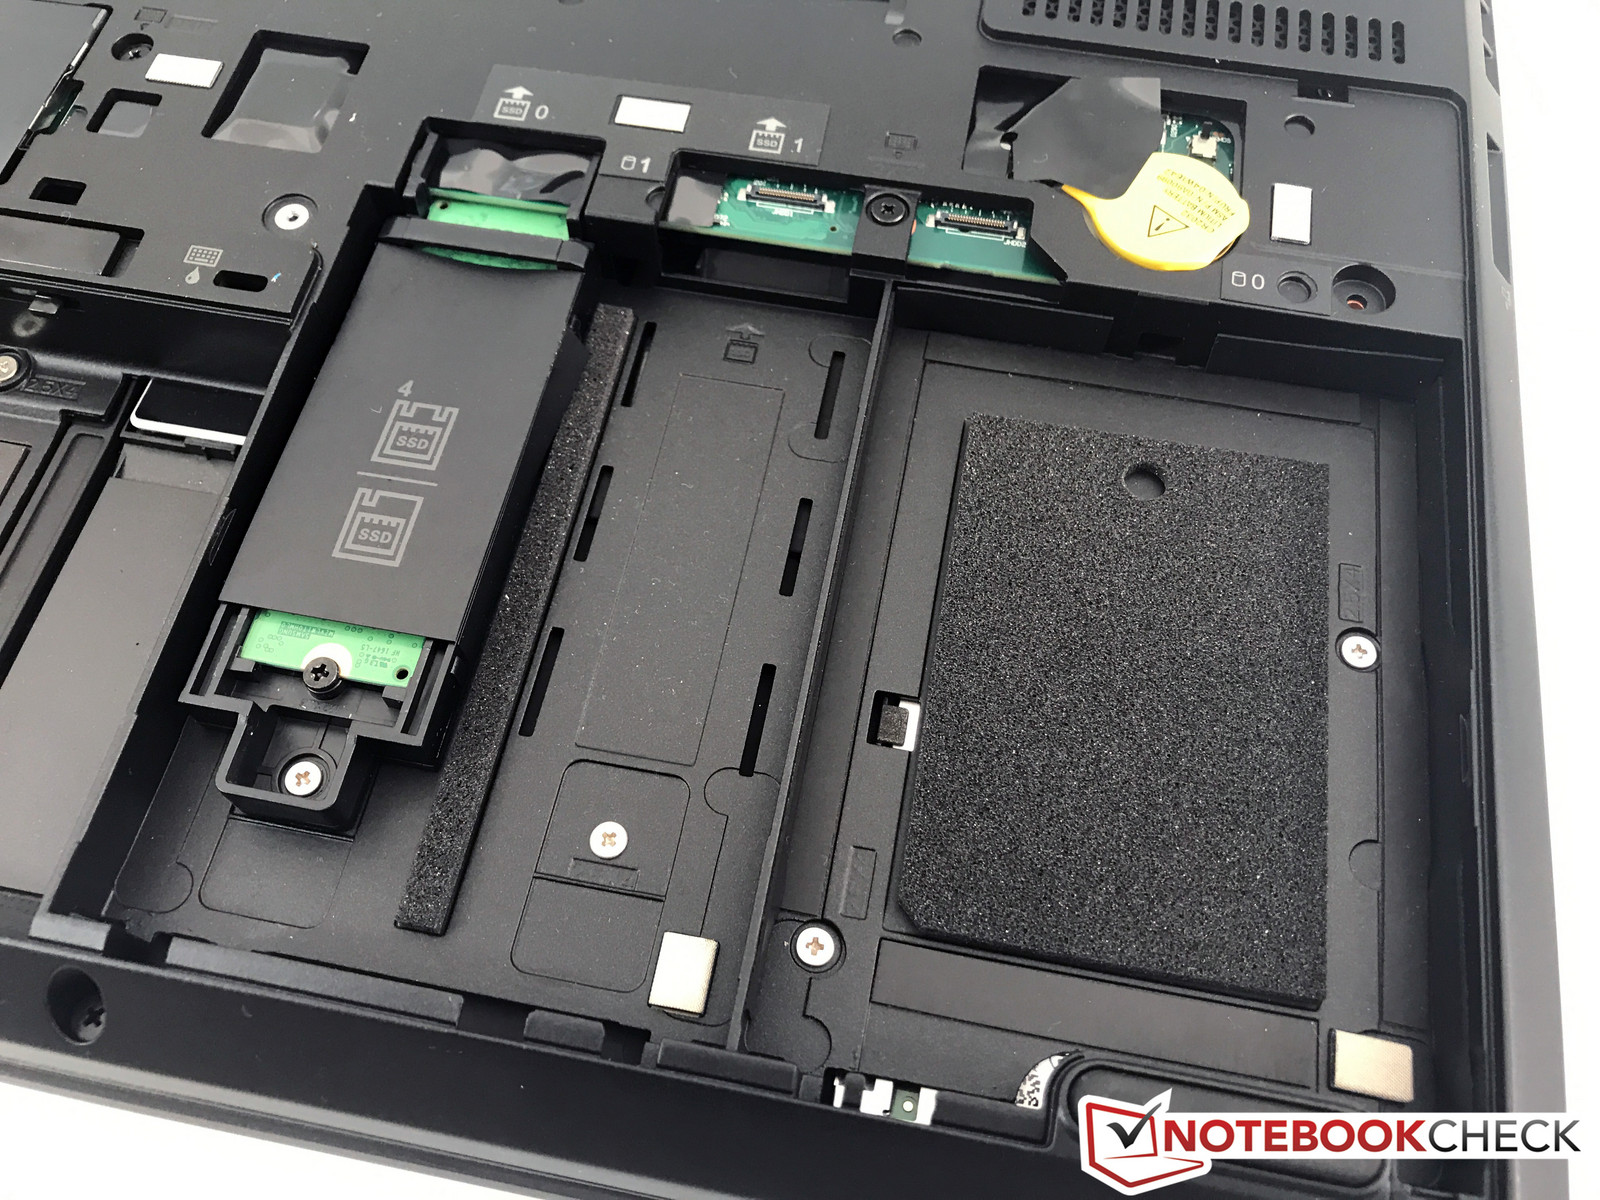
All'interno del ThinkPad P51 ci sono tre slot per archiviazione in totale: 2x M.2-2280 con PCIe 3.0 x4 interfacce e 1x slot 2.5" per drives con spessore fino a 7 mm (~0.27 in). Almeno in teoria. Potete accedere a tutti i tre slots dopo la rimozione della cover di manutenzione, ma mancano gli adattatori necessari. Lenovo dovrebbe prendere esempio da HP, in quanto lo ZBook 15 G3, ad esempio, ha i cavi necessari in dotazione.
Il nostro modello di test monta un SSD da 512 GB PCIe NVMe Samsung, più precisamente il PM961. I risultati dei benchmark sono molto buoni nel complesso, ma i dispositivi di confronto si comportano molto bene in questo settore. Ulteriori benchmarks sono disponibili nella nostra lista completa HDD/SSD.
| Lenovo ThinkPad P51 20HH0016GE Samsung PM961 NVMe MZVLW512HMJP | Lenovo ThinkPad P51s 20HB000SGE Samsung SSD PM961 1TB M.2 PCIe 3.0 x4 NVMe (MZVLW1T0) | Lenovo ThinkPad P50 Samsung SM951 MZVPV256HDGL m.2 PCI-e | HP ZBook 15 G3 Samsung SM951 MZVPV512HDGL m.2 PCI-e | Dell Precision 7510 (4K IGZO) Samsung SSD SM951a 512GB M.2 PCIe 3.0 x4 NVMe (MZVKV512) | Dell Precision 5520 UHD Samsung SM961 MZVKW512HMJP m.2 PCI-e | |
|---|---|---|---|---|---|---|
| CrystalDiskMark 3.0 | -15% | 11% | 4% | -1% | -1% | |
| Read Seq (MB/s) | 1705 | 1189 -30% | 1771 4% | 1502 -12% | 1648 -3% | 2253 32% |
| Write Seq (MB/s) | 1541 | 1138 -26% | 1304 -15% | 1538 0% | 1575 2% | 1662 8% |
| Read 512 (MB/s) | 1038 | 782 -25% | 1364 31% | 1164 12% | 1155 11% | 459.1 -56% |
| Write 512 (MB/s) | 1157 | 959 -17% | 1291 12% | 1432 24% | 1561 35% | 1611 39% |
| Read 4k (MB/s) | 61.3 | 54.8 -11% | 60.2 -2% | 59.1 -4% | 53 -14% | 56.1 -8% |
| Write 4k (MB/s) | 176 | 161.4 -8% | 256.7 46% | 207.3 18% | 158.9 -10% | 169.4 -4% |
| Read 4k QD32 (MB/s) | 664 | 642 -3% | 953 44% | 798 20% | 623 -6% | 633 -5% |
| Write 4k QD32 (MB/s) | 560 | 549 -2% | 389.6 -30% | 393.8 -30% | 423 -24% | 506 -10% |

Performance GPU
Abbiamo già detto che il ThinkPad P51 è disponibile con due diverse GPUs Quadro Nvidia, la M1200 e la M2200. Questi chips sono diretti successori delle vecchie GPUs M1000M ed M2000M. La lettera "M" indica già che si basano sulla vecchia architettura Maxwell, mentre la nuova generazione Pascal è riservata a classi di prestazioni superiori (a partire dalla Quadro P3000) del più grande ThinkPad P71.
La Quadro M2200 è, similmente alla consumer GeForce GTX 965M (Refresh), basata sul chip GM206 ed ha 4 GB di VRAM GDDR5. Il clock massimo è di 1038 MHz e pertanto leggermente inferiore rispetto alla GTX 965M. Il modello di test supporta anche la tecnologia Nvidia Optimus unitamente alla Intel HD Graphics P630 integrata per risparmiare energia durante le operazioni semplici.
Non ci sono sorprese nei benchmarks: l'M2200 di base è alla pari con l'M2200 del più grande MSI WE72 di solito tra il 15 e il 30% (in base al benchmark) avanti alla vecchia Quadro M2000M ed all'attuale Quadro M1200. La Quadro P3000 del più grande ThinkPad P71 d'altro canto è tra il 20 ed il 30% più veloce; la vecchia Quadro M3000M è anche leggermente avanti in molti tests.
Grazie all'architettura simile, la Quadro M2200 è ovviamente alla pari con la GeForce GTX 965M consumer, ma quest'ultima ha un vantaggio grazie al clock leggermente maggiore. La Pascal based GTX 1050 pure è leggermente più veloce.
Le prestazioni della GPU non sono ridotte quando si usa la batteria. Ulteriori benchmarks con la Quadro M2200 sono disponibili qui.
| 3DMark 11 - 1280x720 Performance GPU | |
| MSI GE72VR-6RF16H21 | |
| Lenovo ThinkPad P71-20HK0004GE | |
| Nexoc G739 | |
| MSI GE72 965M Ti | |
| HP ZBook 17 G3 TZV66eA | |
| MSI GL62M 7RD-077 | |
| HP Omen 15-ax007ng | |
| Lenovo ThinkPad P51 20HH0016GE | |
| MSI WE72 7RJ | |
| Lenovo ThinkPad P50 | |
| Lenovo ThinkPad P50 | |
| Dell Precision 5520 UHD | |
| Dell Precision 7510 (4K IGZO) | |
| HP ZBook 15 G3 | |
| Lenovo ThinkPad P51s 20HB000SGE | |
| 3DMark | |
| 1280x720 Cloud Gate Standard Graphics | |
| MSI GE72VR-6RF16H21 | |
| Lenovo ThinkPad P71-20HK0004GE | |
| Nexoc G739 | |
| HP ZBook 17 G3 TZV66eA | |
| MSI GL62M 7RD-077 | |
| MSI GE72 965M Ti | |
| MSI WE72 7RJ | |
| Lenovo ThinkPad P51 20HH0016GE | |
| HP Omen 15-ax007ng | |
| Lenovo ThinkPad P50 | |
| HP ZBook 15 G3 | |
| Dell Precision 5520 UHD | |
| Dell Precision 7510 (4K IGZO) | |
| Lenovo ThinkPad P50 | |
| Lenovo ThinkPad P51s 20HB000SGE | |
| 1920x1080 Fire Strike Graphics | |
| MSI GE72VR-6RF16H21 | |
| Lenovo ThinkPad P71-20HK0004GE | |
| Nexoc G739 | |
| HP ZBook 17 G3 TZV66eA | |
| MSI GL62M 7RD-077 | |
| MSI GE72 965M Ti | |
| HP Omen 15-ax007ng | |
| MSI WE72 7RJ | |
| Lenovo ThinkPad P51 20HH0016GE | |
| Dell Precision 7510 (4K IGZO) | |
| Dell Precision 5520 UHD | |
| Lenovo ThinkPad P50 | |
| HP ZBook 15 G3 | |
| Lenovo ThinkPad P50 | |
| Lenovo ThinkPad P51s 20HB000SGE | |
| Unigine Heaven 4.0 | |
| Extreme Preset OpenGL | |
| Lenovo ThinkPad P71-20HK0004GE | |
| Nexoc G739 | |
| Lenovo ThinkPad P51 20HH0016GE | |
| MSI WE72 7RJ | |
| Lenovo ThinkPad P51s 20HB000SGE | |
| Extreme Preset DX11 | |
| MSI GE72VR-6RF16H21 | |
| Lenovo ThinkPad P71-20HK0004GE | |
| Nexoc G739 | |
| MSI GL62M 7RD-077 | |
| MSI WE72 7RJ | |
| Lenovo ThinkPad P51 20HH0016GE | |
| MSI GE72 965M Ti | |
| HP Omen 15-ax007ng | |
| Lenovo ThinkPad P51s 20HB000SGE | |
| Unigine Valley 1.0 | |
| 1920x1080 Extreme HD DirectX AA:x8 | |
| MSI GE72VR-6RF16H21 | |
| Lenovo ThinkPad P71-20HK0004GE | |
| HP ZBook 17 G3 TZV66eA | |
| MSI WE72 7RJ | |
| MSI GE72 965M Ti | |
| Lenovo ThinkPad P51 20HH0016GE | |
| Lenovo ThinkPad P50 | |
| Lenovo ThinkPad P50 | |
| HP ZBook 15 G3 | |
| Lenovo ThinkPad P51s 20HB000SGE | |
| 1920x1080 Extreme HD Preset OpenGL AA:x8 | |
| Lenovo ThinkPad P71-20HK0004GE | |
| HP ZBook 17 G3 TZV66eA | |
| Lenovo ThinkPad P51 20HH0016GE | |
| MSI WE72 7RJ | |
| HP ZBook 15 G3 | |
| Lenovo ThinkPad P50 | |
| Lenovo ThinkPad P50 | |
| Lenovo ThinkPad P51s 20HB000SGE | |
| SiSoft Sandra 2016 | |
| Image Processing | |
| Lenovo ThinkPad P71-20HK0004GE | |
| HP ZBook 17 G3 TZV66eA | |
| Lenovo ThinkPad P51 20HH0016GE | |
| HP ZBook 15 G3 | |
| Lenovo ThinkPad P50 | |
| Lenovo ThinkPad P50 | |
| Lenovo ThinkPad P51s 20HB000SGE | |
| GP Cryptography (Higher Security AES256+SHA2-512) | |
| Lenovo ThinkPad P71-20HK0004GE | |
| HP ZBook 17 G3 TZV66eA | |
| Lenovo ThinkPad P50 | |
| Lenovo ThinkPad P51 20HH0016GE | |
| HP ZBook 15 G3 | |
| Lenovo ThinkPad P50 | |
| Lenovo ThinkPad P51s 20HB000SGE | |
| GP Financial Analysis (FP High/Double Precision) | |
| Lenovo ThinkPad P71-20HK0004GE | |
| HP ZBook 17 G3 TZV66eA | |
| Lenovo ThinkPad P51 20HH0016GE | |
| HP ZBook 15 G3 | |
| Lenovo ThinkPad P50 | |
| Lenovo ThinkPad P50 | |
| Lenovo ThinkPad P51s 20HB000SGE | |
| 3DMark 06 Standard Score | 29465 punti | |
| 3DMark 11 Performance | 7709 punti | |
| 3DMark Cloud Gate Standard Score | 20644 punti | |
| 3DMark Fire Strike Score | 5275 punti | |
| 3DMark Fire Strike Extreme Score | 2665 punti | |
| 3DMark Time Spy Score | 1920 punti | |
Aiuto | ||
Performance Gaming
Poiché le performance della Nvidia Quadro M2200 sono quasi alla pari con la GeForce GTX 965M o la GeForce GTX 1050, potete usare anche il ThinkPad P51 per il gaming. Anche i giochi moderni come “For Honor” risultano fluidi con settaggi elevati, ma solo in Full HD. In 4K diventa poco gestibile. Ulteriori gaming benchmarks con la Quadro M2200 si trovano qui.
| basso | medio | alto | ultra | 4K | |
|---|---|---|---|---|---|
| The Witcher 3 (2015) | 66.6 | 37.2 | 20 | 12.7 | |
| Rise of the Tomb Raider (2016) | 71.6 | 41.6 | 35.2 | 13.7 | |
| For Honor (2017) | 54.8 | 51.9 | 37.5 | 14.6 |
Emissioni
Rumorosità
Le due ventole del ThinkPad P51 fanno una impressione molto buona. Spesso sono disattive, e registriamo 32.2 dB(A) con carico di lavoro medio, io che infastidisce poco. Il livello massimo di rumore è di 36.6 dB(A), che è un risultato molto buono considerando i potenti componenti. La ventola non crea nemmeno frequenze fastidiose. Tuttavia il coil whine resta un problema, in quanto si sente poiché le ventole spesso sono ferme.
Rumorosità
| Idle |
| 29.6 / 29.6 / 29.6 dB(A) |
| Sotto carico |
| 32.2 / 36.6 dB(A) |
 | ||
30 dB silenzioso 40 dB(A) udibile 50 dB(A) rumoroso |
||
min: | ||
| Lenovo ThinkPad P51 20HH0016GE Quadro M2200, E3-1505M v6, Samsung PM961 NVMe MZVLW512HMJP | Lenovo ThinkPad P51s 20HB000SGE Quadro M520, i7-7600U, Samsung SSD PM961 1TB M.2 PCIe 3.0 x4 NVMe (MZVLW1T0) | Lenovo ThinkPad P50 Quadro M2000M, E3-1505M v5, Samsung SM951 MZVPV256HDGL m.2 PCI-e | HP ZBook 15 G3 Quadro M2000M, E3-1505M v5, Samsung SM951 MZVPV512HDGL m.2 PCI-e | Dell Precision 7510 (4K IGZO) Quadro M2000M, E3-1535M v5, Samsung SSD SM951a 512GB M.2 PCIe 3.0 x4 NVMe (MZVKV512) | Dell Precision 5520 UHD Quadro M1200, E3-1505M v6, Samsung SM961 MZVKW512HMJP m.2 PCI-e | Fujitsu Celsius H760 Quadro M2000M, E3-1505M v5, Samsung SM951 MZVPV512 m.2 PCI-e | |
|---|---|---|---|---|---|---|---|
| Noise | -4% | -8% | -14% | -9% | -10% | -10% | |
| off /ambiente * (dB) | 29.6 | 29.2 1% | 30 -1% | 30 -1% | 28.2 5% | 28.7 3% | 29 2% |
| Idle Minimum * (dB) | 29.6 | 29.2 1% | 30 -1% | 30 -1% | 29.8 -1% | 28.7 3% | 29 2% |
| Idle Average * (dB) | 29.6 | 29.2 1% | 30 -1% | 30 -1% | 29.8 -1% | 32.1 -8% | 29 2% |
| Idle Maximum * (dB) | 29.6 | 31.1 -5% | 30 -1% | 30 -1% | 31.2 -5% | 32.1 -8% | 29 2% |
| Load Average * (dB) | 32.2 | 36.7 -14% | 42.1 -31% | 45.3 -41% | 37.2 -16% | 41.3 -28% | 43.1 -34% |
| Load Maximum * (dB) | 36.6 | 39.4 -8% | 42.1 -15% | 49.7 -36% | 49.4 -35% | 45.5 -24% | 49.2 -34% |
| Witcher 3 ultra * (dB) | 45.5 |
* ... Meglio usare valori piccoli
Temperature
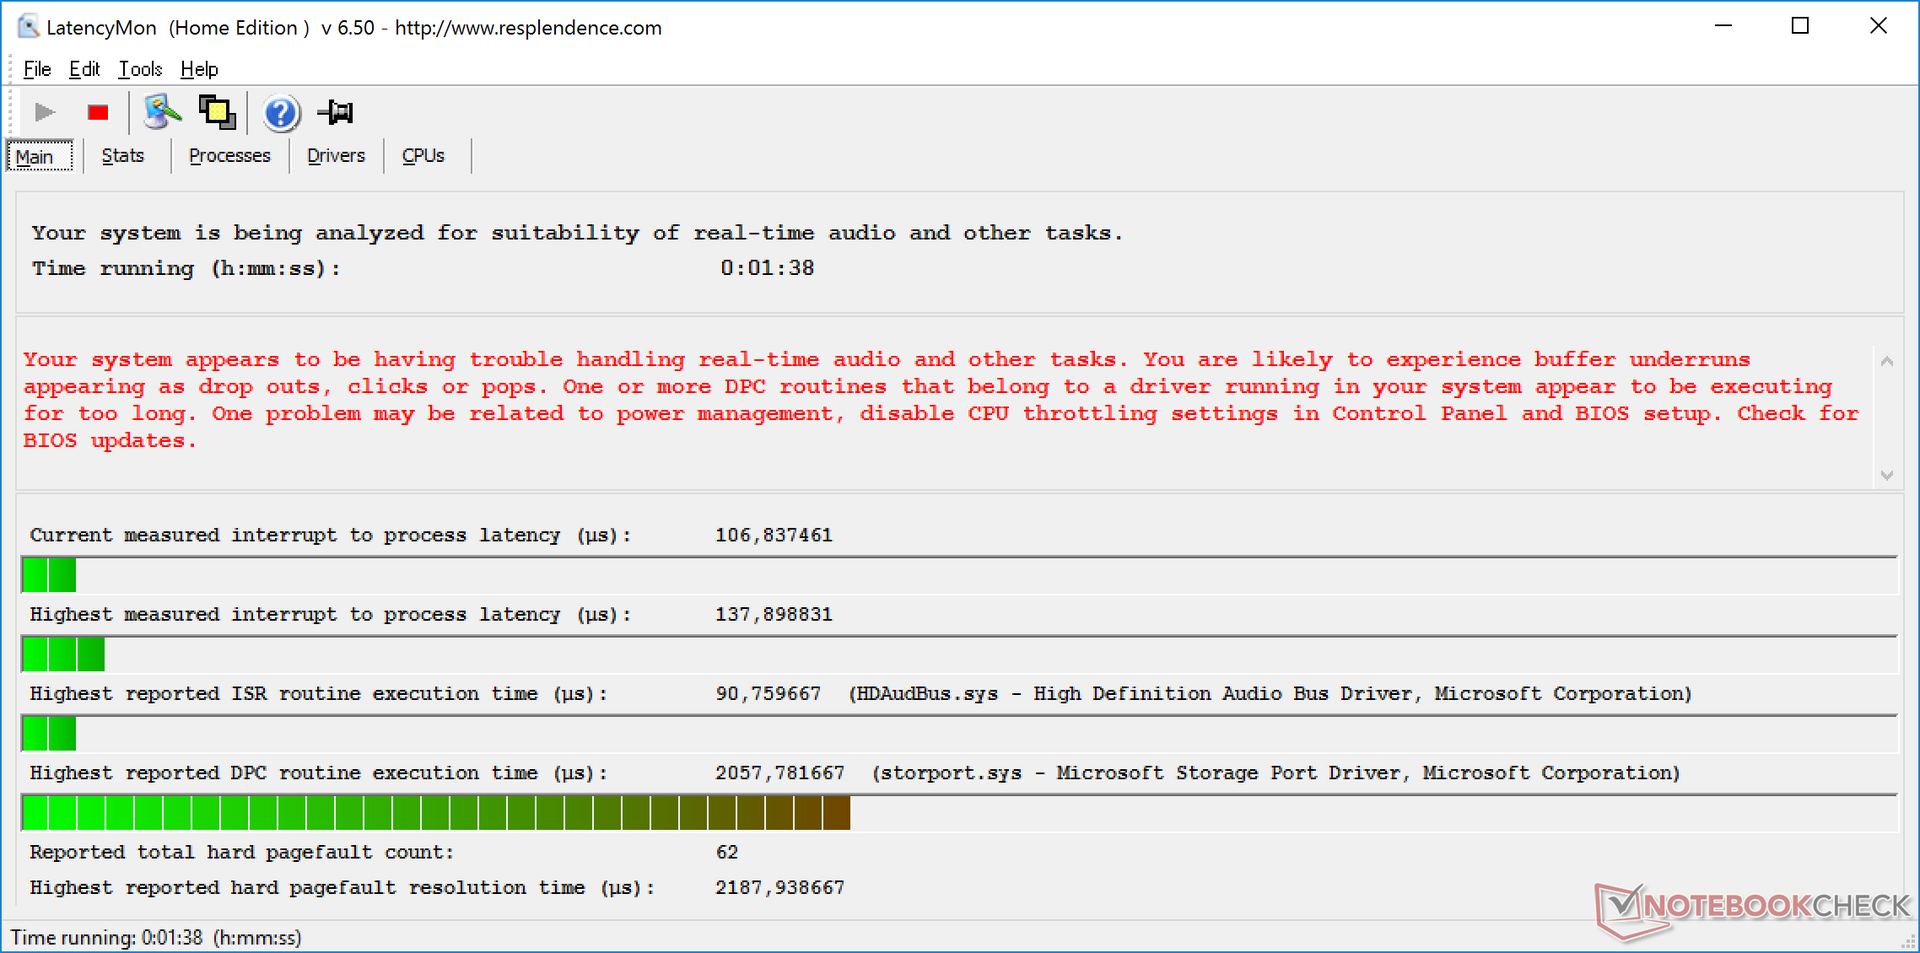
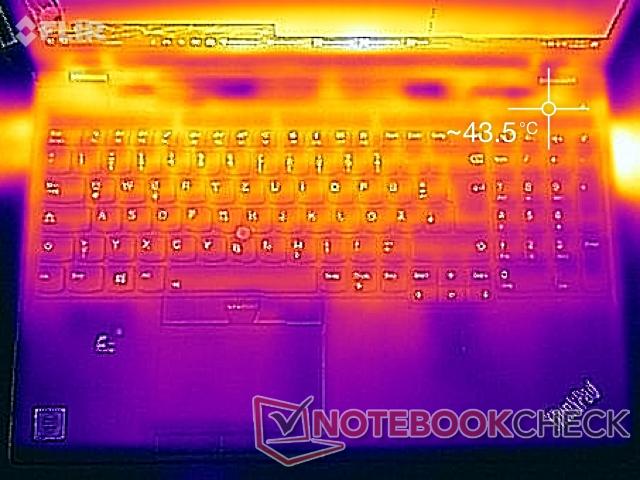
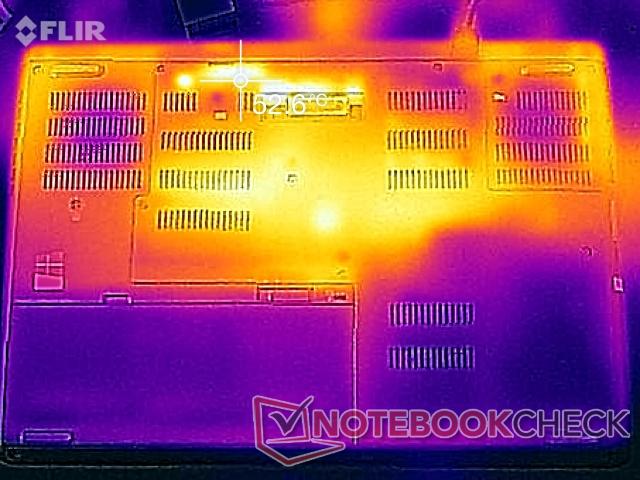
Le temperature indicano che il sistema di raffreddamento lavora al limite quando stressate entrambi i componenti insieme. Le superfici difficilmente si scaldano in idle, ma rileviamo fino a 52 °C (~126 °F) al centro del lato inferiore. Tuttavia, difficilmente userete sulle ginocchia un dispositivo così grande, si tratta di valori accettabili. I poggiapolsi e la tastiera restano freschi, quindi non è scomodo usare questo dispositivo.
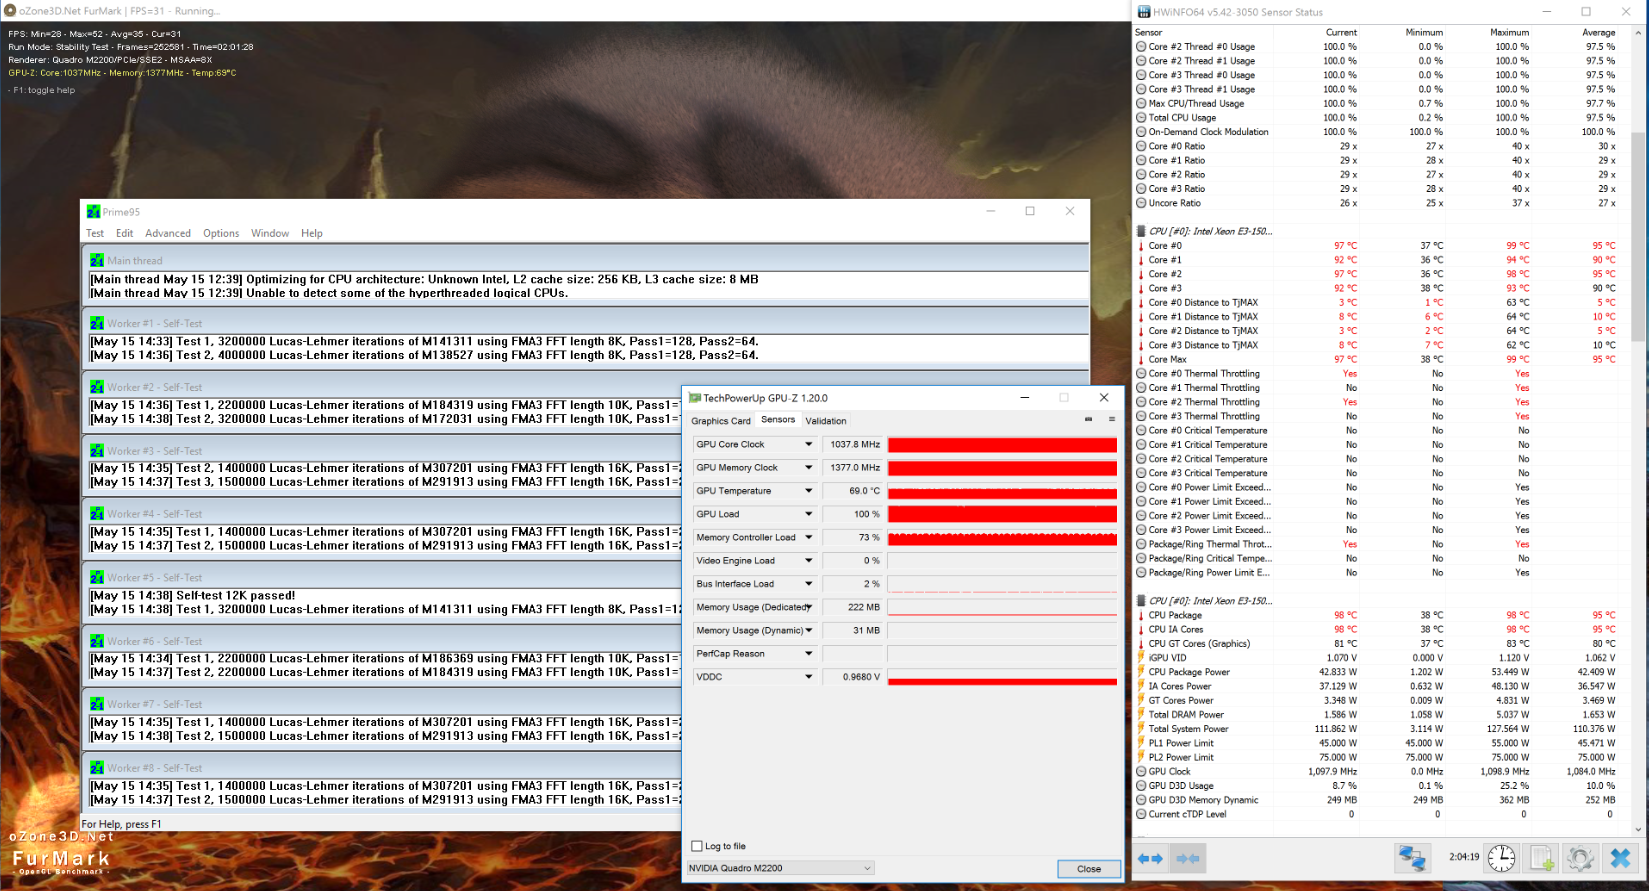
Il processore gira a 3.4 GHz nello stress test con i tools Prime95 e FurMark, ma presto raggiunge oltre i 90 °C (~194 °F). Il clock scenderà a 3.2 GHz dopo pochi minuti e poi a 3.0 GHz. Si attesterà tra 2.8 e 3.0 GHz nel corso del test ed a 2.9 GHz per la maggior parte del tempo. Troviamo presto la ragione, in quanto la temperatura CPU è di 98 °C (~208 °F) pertanto pericolosamente al limite di 100 °C (~212 °F). La situazione dovrebbe essere leggermente migliore con due chips Core i7.
La scheda grafica d'altro canto mantiene sempre i 1038 MHz e le temperature sono di 69 °C (~156 °F). Un lancio di 3DMark 11 subito dopo lo stress test non determina risultati inferiori.
(±) La temperatura massima sul lato superiore è di 43 °C / 109 F, rispetto alla media di 38.2 °C / 101 F, che varia da 22.2 a 69.8 °C per questa classe Workstation.
(-) Il lato inferiore si riscalda fino ad un massimo di 52.2 °C / 126 F, rispetto alla media di 41.1 °C / 106 F
(+) In idle, la temperatura media del lato superiore è di 26.2 °C / 79 F, rispetto alla media deld ispositivo di 32 °C / 90 F.
(±) I poggiapolsi e il touchpad possono diventare molto caldi al tatto con un massimo di 36.1 °C / 97 F.
(-) La temperatura media della zona del palmo della mano di dispositivi simili e'stata di 27.8 °C / 82 F (-8.3 °C / -15 F).
Casse
Le due casse si trovano sempre in cima alla tastiera e sono leggermente più potenti con 2x 2 watts rispetto al modello dello scorso anno (2x 1.5 watts), ma il volume massimo è è leggermente inferiore con 65 dB(A) e piuttosto basso in generale. Dovreste usare soluzioni esterne, anche per presentazioni in stanze di dimensioni medie. L'analisi audio mostra toni medi e alti bilanciati, il che è positivo per la riproduzione della voce.
Lenovo ThinkPad P51 20HH0016GE analisi audio
(-) | altoparlanti non molto potenti (64.5 dB)
Bassi 100 - 315 Hz
(±) | bassi ridotti - in media 12.3% inferiori alla media
(±) | la linearità dei bassi è media (10.4% delta rispetto alla precedente frequenza)
Medi 400 - 2000 Hz
(+) | medi bilanciati - solo only 3.9% rispetto alla media
(+) | medi lineari (6.4% delta rispetto alla precedente frequenza)
Alti 2 - 16 kHz
(+) | Alti bilanciati - appena 2.7% dalla media
(±) | la linearità degli alti è media (13.3% delta rispetto alla precedente frequenza)
Nel complesso 100 - 16.000 Hz
(±) | la linearità complessiva del suono è media (24.7% di differenza rispetto alla media
Rispetto alla stessa classe
» 86% di tutti i dispositivi testati in questa classe è stato migliore, 2% simile, 12% peggiore
» Il migliore ha avuto un delta di 7%, medio di 17%, peggiore di 35%
Rispetto a tutti i dispositivi testati
» 75% di tutti i dispositivi testati in questa classe è stato migliore, 5% similare, 20% peggiore
» Il migliore ha avuto un delta di 4%, medio di 24%, peggiore di 134%
Lenovo ThinkPad P51s 20HB000SGE analisi audio
(±) | potenza degli altiparlanti media ma buona (75.2 dB)
Bassi 100 - 315 Hz
(±) | bassi ridotti - in media 10.7% inferiori alla media
(±) | la linearità dei bassi è media (11% delta rispetto alla precedente frequenza)
Medi 400 - 2000 Hz
(+) | medi bilanciati - solo only 3.9% rispetto alla media
(±) | linearità dei medi adeguata (10.5% delta rispetto alla precedente frequenza)
Alti 2 - 16 kHz
(+) | Alti bilanciati - appena 3.1% dalla media
(±) | la linearità degli alti è media (7.1% delta rispetto alla precedente frequenza)
Nel complesso 100 - 16.000 Hz
(±) | la linearità complessiva del suono è media (15.6% di differenza rispetto alla media
Rispetto alla stessa classe
» 35% di tutti i dispositivi testati in questa classe è stato migliore, 11% simile, 54% peggiore
» Il migliore ha avuto un delta di 7%, medio di 17%, peggiore di 35%
Rispetto a tutti i dispositivi testati
» 23% di tutti i dispositivi testati in questa classe è stato migliore, 5% similare, 72% peggiore
» Il migliore ha avuto un delta di 4%, medio di 24%, peggiore di 134%
Frequency Comparison (Checkboxes select/deselectable!)
Gestione energetica
Consumi energetici
Lenovo ha provato a ridurre il consumo minimo rispetto al vecchio ThinkPad P50, ma notiamo che la luminosità massima dello schermo 4K porta fino a 22 watts in idle. I due dispositivi sono molto vicini sotto carico, il che è un buon risultato considerando il pannello molto luminoso e le prestazioni superiori. Possiamo solo notare il consumo massimo di 130.6 watts all'inizio dello stress test prima che si attesti a circa 120 watts.
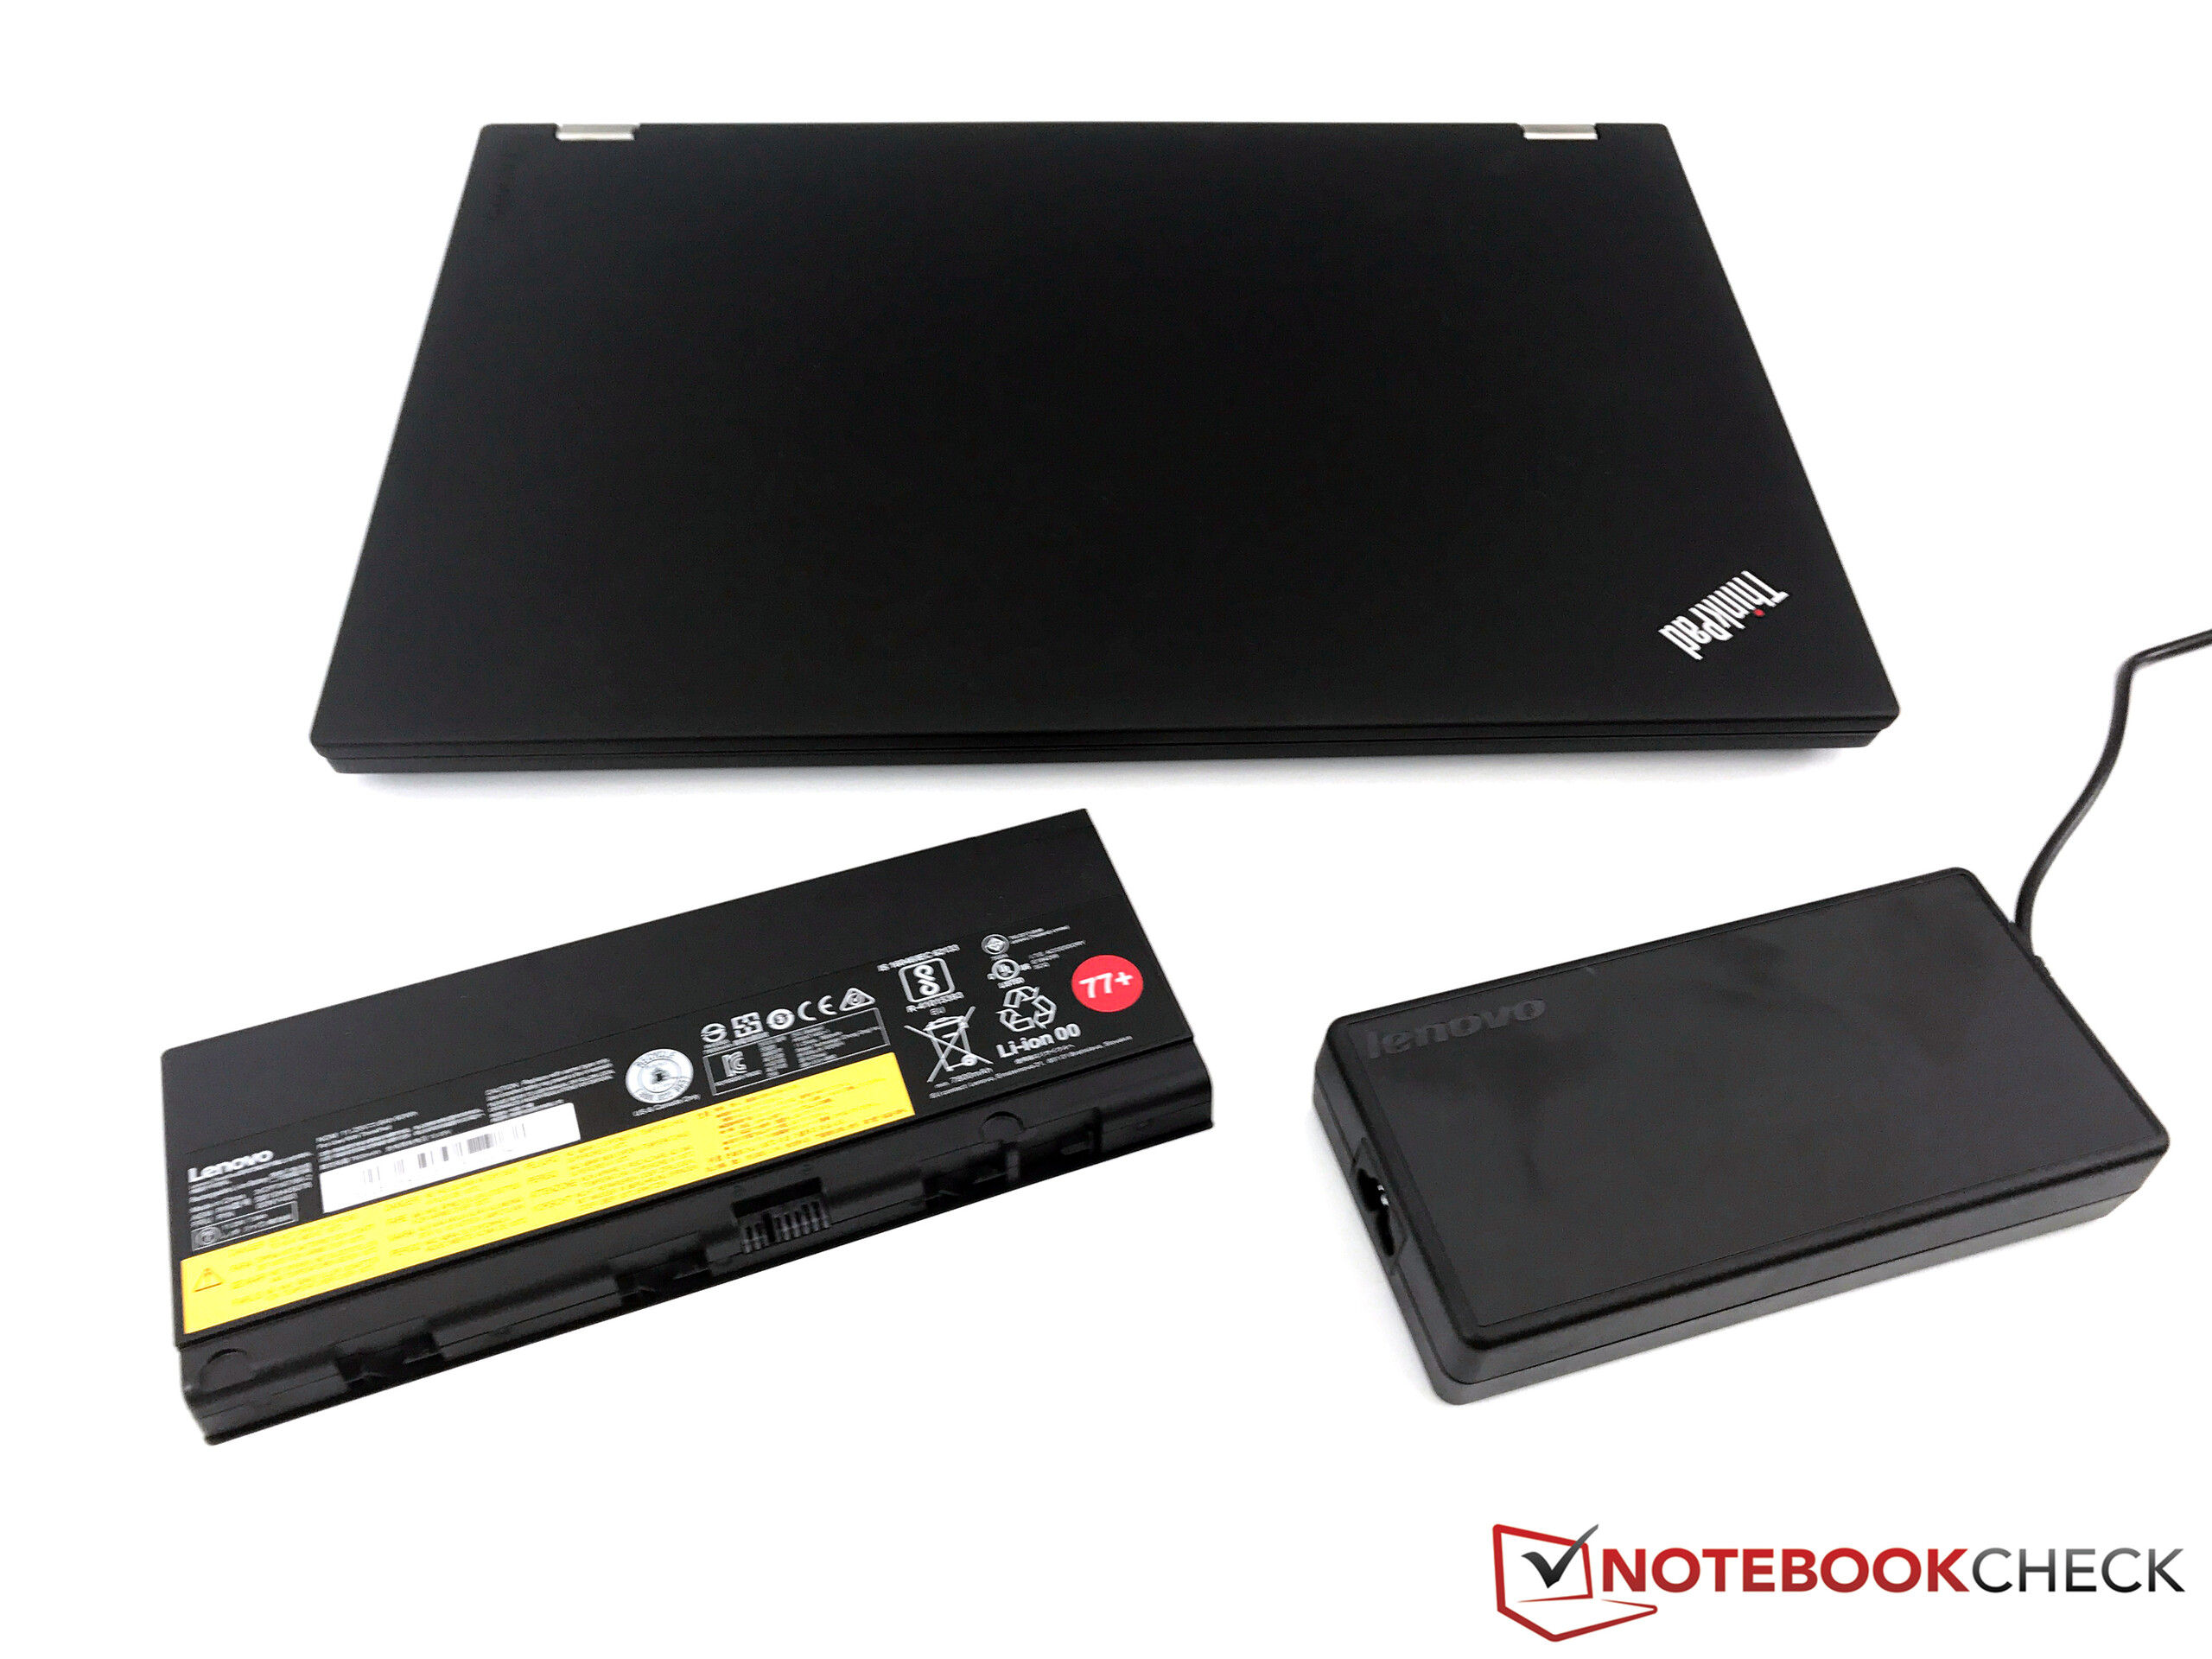
L'alimentatore da 170-watt (15.5 x 7.3 x 3 cm; 689 grammi/6.1 x 2.9 x 1.2 in; 1.5 lb) è sufficiente e ha abbastanza capacità per ricaricare la batteria sotto sforzo.
| Off / Standby | |
| Idle | |
| Sotto carico |
|
Leggenda:
min: | |
| Lenovo ThinkPad P51 20HH0016GE E3-1505M v6, Quadro M2200, Samsung PM961 NVMe MZVLW512HMJP, IPS, 3840x2160, 15.6" | Lenovo ThinkPad P51s 20HB000SGE i7-7600U, Quadro M520, Samsung SSD PM961 1TB M.2 PCIe 3.0 x4 NVMe (MZVLW1T0), IPS, 3840x2160, 15.6" | Lenovo ThinkPad P50 E3-1505M v5, Quadro M2000M, Samsung SM951 MZVPV256HDGL m.2 PCI-e, IPS, 3840x2160, 15.6" | HP ZBook 15 G3 E3-1505M v5, Quadro M2000M, Samsung SM951 MZVPV512HDGL m.2 PCI-e, UWVA-IPS, 1920x1080, 15.6" | Dell Precision 7510 (4K IGZO) E3-1535M v5, Quadro M2000M, Samsung SSD SM951a 512GB M.2 PCIe 3.0 x4 NVMe (MZVKV512), IGZO IPS, 3840x2160, 15.6" | Dell Precision 5520 UHD E3-1505M v6, Quadro M1200, Samsung SM961 MZVKW512HMJP m.2 PCI-e, IPS, 3840x2160, 15.6" | |
|---|---|---|---|---|---|---|
| Power Consumption | 35% | 0% | 19% | -66% | 6% | |
| Idle Minimum * (Watt) | 8.6 | 5.8 33% | 10.2 -19% | 5.7 34% | 23.9 -178% | 8.9 -3% |
| Idle Average * (Watt) | 15.9 | 10.4 35% | 17.8 -12% | 12.2 23% | 28.9 -82% | 13.6 14% |
| Idle Maximum * (Watt) | 22.1 | 13.5 39% | 18.3 17% | 12.6 43% | 30 -36% | 14.1 36% |
| Load Average * (Watt) | 84.4 | 62.4 26% | 76.9 9% | 83.1 2% | 95.2 -13% | 100.3 -19% |
| Load Maximum * (Watt) | 130.6 | 73.1 44% | 123.5 5% | 138.2 -6% | 157.1 -20% | 126.3 3% |
| Witcher 3 ultra * (Watt) | 100.2 |
* ... Meglio usare valori piccoli
Autonomia della batteria
Lenovo offre due batterie per il ThinkPad P51: una da 4-celle e 66 Wh e una da 6-celle e 90 Wh (entrambe a polimeri di litio). Quest'ultima è usata per il nostro modello e consente una buona autonomia.
In aggiunta al normale Battery Eater Classic Test, abbiamo rilevato l'autonomia minima con un loop del SPECviewperf 12 benchmark per workstations mobile. Il Classic test resiste 95 minuti; il SPECviewperf 12 test 12 minuti in più.
L'autonomia Wi-Fi e video sono stata rilevate con luminosità a 150 nits. Il ThinkPad P51 beneficia della grafica switchable in entrambi i casi. Rispettivamente 7 e 7,5 ore, risultati molto buoni che superano le workstation concorrenti. L'eccezione è il sottile ThinkPad P51s con processore ULV, che supera tutti i tests.
Una ricarica completa della batteria impiega 155 minuti.
| Lenovo ThinkPad P51 20HH0016GE E3-1505M v6, Quadro M2200, 90 Wh | Lenovo ThinkPad P51s 20HB000SGE i7-7600U, Quadro M520, 104 Wh | Lenovo ThinkPad P50 E3-1505M v5, Quadro M2000M, 90 Wh | HP ZBook 15 G3 E3-1505M v5, Quadro M2000M, 90 Wh | Dell Precision 7510 (4K IGZO) E3-1535M v5, Quadro M2000M, 91 Wh | Dell Precision 5520 UHD E3-1505M v6, Quadro M1200, 97 Wh | Fujitsu Celsius H760 E3-1505M v5, Quadro M2000M, 72 Wh | |
|---|---|---|---|---|---|---|---|
| Autonomia della batteria | 106% | -26% | -3% | -47% | -34% | -22% | |
| Reader / Idle (h) | 16.4 | 26.4 61% | 9 -45% | 13.7 -16% | 4.5 -73% | 12.1 -26% | 9.3 -43% |
| H.264 (h) | 7.6 | 11.7 54% | 5.5 -28% | 7.5 -1% | 4.6 -39% | ||
| WiFi v1.3 (h) | 6.9 | 11.9 72% | 4.8 -30% | 6.4 -7% | 4 -42% | 4.2 -39% | 5.6 -19% |
| Load (h) | 1.6 | 5.4 238% | 1.6 0% | 1.8 13% | 1.2 -25% | 1 -37% | 1.8 13% |
Giudizio complessivo
Pro
Contro
Il Lenovo ThinkPad P50 è stata una workstation mobile molto buona lo scorso anno, ma c'erano dei problemi. Tra questi i due tipi di display, in quanto non rispecchiavano le attese in termini di luminosità e soffrivano di PWM (4K). Il ThinkPad P51 è un aggiornamento Kaby Lake ed utilizza una costruzione identica.
Ancora una volta, abbiamo un sistema molto robusto con eccellenti dispositivi di input e sistema di raffreddamento silenzioso. Le prestazioni sono superiori grazie ai componenti più nuovi, e Lenovo finalmente usa un ottimo schermo 4K con ampia gamma di colore. I problemi iniziali del P50 (problemi WWAN, prestazioni CPU ridotte con la batteria) sono stati risolti.
Prestazioni elevate, case buono, e schermo eccellente - il ThinkPad P51 è una workstation mobile molto buona. Ma alcuni dettagli sono da migliorare.
Tuttavia, il ThinkPad P51 non è perfetto. Oltre a piccole cose (problemi con il pulsante destro del TrackPoint sul nostro modello di test, casse scarse, manutenzione difficile), la calibrazione integrata ancora una vota non funziona. Il sistema di raffreddamento arriva al limite quando stressate entrambi i componenti, e non potete sfruttare tutte le prestazioni del processore Xeon. Anche l'occasionale coil whining è fastidioso. Lo noterete di più in quanto spesso le ventole sono ferme.
Nel complesso, Lenovo offre ancora un pacchetto di successo, e i prossimi modelli Dell & HP avranno un duro concorrente.
Lenovo ThinkPad P51 20HH0016GE
- 06/18/2017 v6 (old)
Andreas Osthoff
