Recensione breve del Portatile Asus VivoBook S15 S510UA (i5-7200U, FHD)


| SD Card Reader | |
| average JPG Copy Test (av. of 3 runs) | |
| HP Pavilion 15t-au100 CTO (W0P31AV) | |
| Asus VivoBook S15 S510UA | |
| Dell Inspiron 15 7000 7567 | |
| maximum AS SSD Seq Read Test (1GB) | |
| HP Pavilion 15t-au100 CTO (W0P31AV) | |
| Asus VivoBook S15 S510UA | |
| Dell Inspiron 15 7000 7567 | |
| Networking | |
| iperf3 transmit AX12 | |
| Asus VivoBook S15 S510UA | |
| Lenovo V510-15IKB 80WQ0002GE | |
| Dell Inspiron 15 7000 7567 (jseb) | |
| iperf3 receive AX12 | |
| Asus VivoBook S15 S510UA | |
| Lenovo V510-15IKB 80WQ0002GE | |
| Dell Inspiron 15 7000 7567 (jseb) | |
| |||||||||||||||||||||||||
Distribuzione della luminosità: 89 %
Al centro con la batteria: 277.5 cd/m²
Contrasto: 793:1 (Nero: 0.35 cd/m²)
ΔE ColorChecker Calman: 4.8 | ∀{0.5-29.43 Ø4.71}
ΔE Greyscale Calman: 3 | ∀{0.09-98 Ø4.96}
69.3% sRGB (Argyll 1.6.3 3D)
37.7% AdobeRGB 1998 (Argyll 1.6.3 3D)
41.11% AdobeRGB 1998 (Argyll 3D)
59.5% sRGB (Argyll 3D)
39.9% Display P3 (Argyll 3D)
Gamma: 2.39
CCT: 6854 K
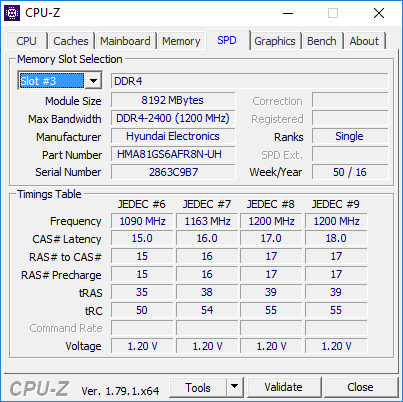
| Asus VivoBook S15 S510UA ID: LGD0573, Name: LG Display LP156WF9-SPK2, IPS, 15.6", 1920x1080 | Lenovo V510-15IKB 80WQ0002GE LG Philips LP156WF6-SPK3, IPS, 15.6", 1920x1080 | HP Pavilion 15t-au100 CTO (W0P31AV) BOE0693, IPS, 15.6", 1920x1080 | Apple MacBook Pro 15 2016 (2.9 GHz, 460) Apple APPA030, IPS, 15.4", 2880x1800 | HP Envy 15-as133cl Chi Mei CMN15D8, IPS, 15.6", 1920x1080 | Dell Inspiron 15 7000 7567 AU Optronics AUO38ED B156HTN 28H80, TN, 15.6", 1920x1080 | |
|---|---|---|---|---|---|---|
| Display | -2% | 9% | 109% | 8% | -8% | |
| Display P3 Coverage (%) | 39.9 | 38.8 -3% | 43.27 8% | 99 148% | 42.95 8% | 36.42 -9% |
| sRGB Coverage (%) | 59.5 | 58.1 -2% | 64.9 9% | 100 68% | 64.3 8% | 54.9 -8% |
| AdobeRGB 1998 Coverage (%) | 41.11 | 40.12 -2% | 44.71 9% | 87.3 112% | 44.41 8% | 37.62 -8% |
| Response Times | -8% | -18% | -66% | -15% | -15% | |
| Response Time Grey 50% / Grey 80% * (ms) | 38.4 ? | 39 ? -2% | 42 ? -9% | 46 ? -20% | 44.4 ? -16% | 36 ? 6% |
| Response Time Black / White * (ms) | 26.4 ? | 30 ? -14% | 33.6 ? -27% | 56 ? -112% | 30 ? -14% | 36 ? -36% |
| PWM Frequency (Hz) | 20000 ? | 198.4 | 119000 ? | 1000 ? | ||
| Screen | -6% | -9% | 46% | 2% | -75% | |
| Brightness middle (cd/m²) | 277.5 | 256 -8% | 186.5 -33% | 420 51% | 262.3 -5% | 246 -11% |
| Brightness (cd/m²) | 265 | 252 -5% | 174 -34% | 401 51% | 240 -9% | 235 -11% |
| Brightness Distribution (%) | 89 | 87 -2% | 69 -22% | 90 1% | 83 -7% | 75 -16% |
| Black Level * (cd/m²) | 0.35 | 0.3 14% | 0.18 49% | 0.3 14% | 0.24 31% | 0.55 -57% |
| Contrast (:1) | 793 | 853 8% | 1036 31% | 1400 77% | 1093 38% | 447 -44% |
| Colorchecker dE 2000 * | 4.8 | 5.4 -13% | 5.7 -19% | 3.33 31% | 5 -4% | 10.97 -129% |
| Colorchecker dE 2000 max. * | 17.8 | 9.36 47% | 22.5 -26% | 5.11 71% | 20.6 -16% | |
| Greyscale dE 2000 * | 3 | 5.37 -79% | 4.4 -47% | 2.73 9% | 3.2 -7% | 14.25 -375% |
| Gamma | 2.39 92% | 2.58 85% | 2.35 94% | 2.48 89% | 2.45 90% | 1.83 120% |
| CCT | 6854 95% | 6795 96% | 6963 93% | 6457 101% | 6817 95% | 11200 58% |
| Color Space (Percent of AdobeRGB 1998) (%) | 37.7 | 37 -2% | 44.71 19% | 78.09 107% | 40.5 7% | 35 -7% |
| Color Space (Percent of sRGB) (%) | 69.3 | 58 -16% | 64.95 -6% | 99.97 44% | 63.5 -8% | 55 -21% |
| Media totale (Programma / Settaggio) | -5% /
-5% | -6% /
-7% | 30% /
43% | -2% /
1% | -33% /
-52% |
* ... Meglio usare valori piccoli
Tempi di risposta del Display
| ↔ Tempi di risposta dal Nero al Bianco | ||
|---|---|---|
| 26.4 ms ... aumenta ↗ e diminuisce ↘ combinato | ↗ 15.6 ms Incremento | 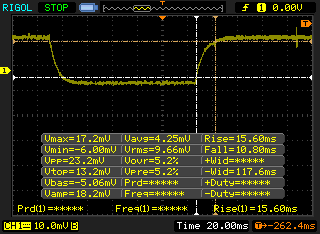 |
| ↘ 10.8 ms Calo | ||
| Lo schermo mostra tempi di risposta relativamente lenti nei nostri tests e potrebbe essere troppo lento per i gamers. In confronto, tutti i dispositivi di test variano da 0.1 (minimo) a 240 (massimo) ms. » 66 % di tutti i dispositivi è migliore. Questo significa che i tempi di risposta rilevati sono peggiori rispetto alla media di tutti i dispositivi testati (19.8 ms). | ||
| ↔ Tempo di risposta dal 50% Grigio all'80% Grigio | ||
| 38.4 ms ... aumenta ↗ e diminuisce ↘ combinato | ↗ 19.2 ms Incremento | 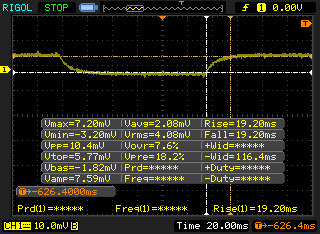 |
| ↘ 19.2 ms Calo | ||
| Lo schermo mostra tempi di risposta lenti nei nostri tests e sarà insoddisfacente per i gamers. In confronto, tutti i dispositivi di test variano da 0.165 (minimo) a 636 (massimo) ms. » 58 % di tutti i dispositivi è migliore. Questo significa che i tempi di risposta rilevati sono peggiori rispetto alla media di tutti i dispositivi testati (31 ms). | ||
Sfarfallio dello schermo / PWM (Pulse-Width Modulation)
| flickering dello schermo / PWM non rilevato | 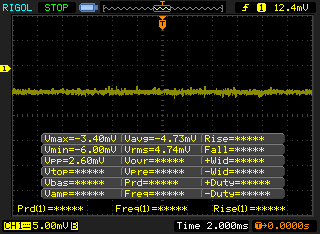 | ||
In confronto: 52 % di tutti i dispositivi testati non utilizza PWM per ridurre la luminosita' del display. Se è rilevato PWM, una media di 7754 (minimo: 5 - massimo: 343500) Hz è stata rilevata. | |||
| Cinebench R11.5 | |
| CPU Single 64Bit | |
| Lenovo ThinkPad 13-20J2S00G00 | |
| Lenovo ThinkPad T470s-20HF0012US | |
| Asus VivoBook S15 S510UA | |
| Dell Latitude 5280 | |
| HP ProBook 640 G2-T9X60ET | |
| HP 250 G4 T6P08ES | |
| Lenovo IdeaPad Z40-59422614 | |
| Lenovo Thinkpad 13-20J1001BUS | |
| HP EliteBook 725 G4 | |
| CPU Multi 64Bit | |
| Lenovo ThinkPad T470s-20HF0012US | |
| Lenovo ThinkPad 13-20J2S00G00 | |
| Asus VivoBook S15 S510UA | |
| Dell Latitude 5280 | |
| HP ProBook 640 G2-T9X60ET | |
| Lenovo Thinkpad 13-20J1001BUS | |
| HP 250 G4 T6P08ES | |
| Lenovo IdeaPad Z40-59422614 | |
| HP EliteBook 725 G4 | |
| Cinebench R10 | |
| Rendering Multiple CPUs 32Bit | |
| Asus VivoBook S15 S510UA | |
| Dell Latitude 5280 | |
| Lenovo ThinkPad 13-20J2S00G00 | |
| HP ProBook 640 G2-T9X60ET | |
| Lenovo Thinkpad 13-20J1001BUS | |
| HP 250 G4 T6P08ES | |
| Lenovo IdeaPad Z40-59422614 | |
| HP EliteBook 725 G4 | |
| Rendering Single 32Bit | |
| Asus VivoBook S15 S510UA | |
| Dell Latitude 5280 | |
| Lenovo ThinkPad 13-20J2S00G00 | |
| HP ProBook 640 G2-T9X60ET | |
| HP 250 G4 T6P08ES | |
| Lenovo Thinkpad 13-20J1001BUS | |
| Lenovo IdeaPad Z40-59422614 | |
| HP EliteBook 725 G4 | |
| wPrime 2.10 - 1024m | |
| Lenovo IdeaPad Z40-59422614 | |
| Lenovo Thinkpad 13-20J1001BUS | |
| HP EliteBook 725 G4 | |
| Dell Latitude 5280 | |
| Asus VivoBook S15 S510UA | |
| Lenovo ThinkPad T470s-20HF0012US | |
* ... Meglio usare valori piccoli
| PCMark 8 | |
| Home Score Accelerated v2 | |
| Apple MacBook Pro 15 2016 (2.9 GHz, 460) | |
| Asus VivoBook S15 S510UA | |
| HP Pavilion 15t-au100 CTO (W0P31AV) | |
| Work Score Accelerated v2 | |
| Apple MacBook Pro 15 2016 (2.9 GHz, 460) | |
| Asus VivoBook S15 S510UA | |
| HP Pavilion 15t-au100 CTO (W0P31AV) | |
| Creative Score Accelerated v2 | |
| Apple MacBook Pro 15 2016 (2.9 GHz, 460) | |
| Asus VivoBook S15 S510UA | |
| HP Pavilion 15t-au100 CTO (W0P31AV) | |
| PCMark 8 Home Score Accelerated v2 | 3831 punti | |
| PCMark 8 Creative Score Accelerated v2 | 4627 punti | |
| PCMark 8 Work Score Accelerated v2 | 4746 punti | |
Aiuto | ||
| Asus VivoBook S15 S510UA Toshiba HG6 THNSNJ128G8NY | Lenovo V510-15IKB 80WQ0002GE Samsung CM871a MZNTY256HDHP | HP Pavilion 15t-au100 CTO (W0P31AV) Toshiba MQ01ABD100 | Apple MacBook Pro 15 2016 (2.9 GHz, 460) Apple SSD SM1024L | Dell Inspiron 15 7000 7567 Intel SSDSCKKF256H6 | |
|---|---|---|---|---|---|
| CrystalDiskMark 3.0 | 51% | -91% | 165% | 29% | |
| Read Seq (MB/s) | 503 | 532 6% | 109.5 -78% | 1458 190% | 485.8 -3% |
| Write Seq (MB/s) | 396 | 511 29% | 105.2 -73% | 1440 264% | 422.8 7% |
| Read 512 (MB/s) | 417.7 | 414.8 -1% | 34.08 -92% | 914 119% | 338.9 -19% |
| Write 512 (MB/s) | 342 | 307.7 -10% | 40.02 -88% | 1058 209% | 304 -11% |
| Read 4k (MB/s) | 19.48 | 39.51 103% | 0.429 -98% | 9.786 -50% | 27.11 39% |
| Write 4k (MB/s) | 64.6 | 108.1 67% | 1.008 -98% | 10.9 -83% | 85.4 32% |
| Read 4k QD32 (MB/s) | 250.3 | 361.6 44% | 0.81 -100% | 679 171% | 279.6 12% |
| Write 4k QD32 (MB/s) | 94.3 | 253 168% | 0.893 -99% | 562 496% | 255.1 171% |

| 3DMark 11 Performance | 1768 punti | |
| 3DMark Ice Storm Standard Score | 69286 punti | |
| 3DMark Cloud Gate Standard Score | 6704 punti | |
| 3DMark Fire Strike Score | 965 punti | |
| 3DMark Fire Strike Extreme Score | 449 punti | |
Aiuto | ||
| basso | medio | alto | ultra | |
|---|---|---|---|---|
| BioShock Infinite (2013) | 62.7 | 33.9 | 28.6 | 8.8 |
| Dota 2 Reborn (2015) | 82 | 56 | 20 |
Rumorosità
| Idle |
| 30.2 / 30.2 / 30.2 dB(A) |
| HDD |
| 30.2 dB(A) |
| Sotto carico |
| 36.9 / 37 dB(A) |
 | ||
30 dB silenzioso 40 dB(A) udibile 50 dB(A) rumoroso |
||
min: | ||
| Asus VivoBook S15 S510UA HD Graphics 620, i5-7200U, Toshiba HG6 THNSNJ128G8NY | Lenovo V510-15IKB 80WQ0002GE HD Graphics 620, i5-7200U, Samsung CM871a MZNTY256HDHP | HP Pavilion 15t-au100 CTO (W0P31AV) GeForce 940MX, i7-7500U, Toshiba MQ01ABD100 | Apple MacBook Pro 15 2016 (2.9 GHz, 460) Radeon Pro 460, 6920HQ, Apple SSD SM1024L | Dell Inspiron 15 7000 7567 GeForce GTX 1050 Ti Mobile, i7-7700HQ, Intel SSDSCKKF256H6 | |
|---|---|---|---|---|---|
| Noise | 0% | -9% | -4% | -11% | |
| off /ambiente * (dB) | 28.2 | 30.2 -7% | 29 -3% | 30.3 -7% | |
| Idle Minimum * (dB) | 30.2 | 30.2 -0% | 32.2 -7% | 30.3 -0% | 30.9 -2% |
| Idle Average * (dB) | 30.2 | 30.2 -0% | 32.2 -7% | 30.3 -0% | 30.9 -2% |
| Idle Maximum * (dB) | 30.2 | 32 -6% | 33.7 -12% | 30.3 -0% | 31 -3% |
| Load Average * (dB) | 36.9 | 34.7 6% | 39.4 -7% | 35.1 5% | 46.5 -26% |
| Load Maximum * (dB) | 37 | 33.9 8% | 42.2 -14% | 46 -24% | 46.8 -26% |
* ... Meglio usare valori piccoli
(-) La temperatura massima sul lato superiore è di 46 °C / 115 F, rispetto alla media di 36.8 °C / 98 F, che varia da 21 a 71 °C per questa classe Multimedia.
(±) Il lato inferiore si riscalda fino ad un massimo di 45 °C / 113 F, rispetto alla media di 39.1 °C / 102 F
(+) In idle, la temperatura media del lato superiore è di 23.5 °C / 74 F, rispetto alla media deld ispositivo di 31.3 °C / 88 F.
(+) I poggiapolsi e il touchpad raggiungono la temperatura massima della pelle (32.4 °C / 90.3 F) e quindi non sono caldi.
(-) La temperatura media della zona del palmo della mano di dispositivi simili e'stata di 28.7 °C / 83.7 F (-3.7 °C / -6.6 F).
Asus VivoBook S15 S510UA analisi audio
(-) | altoparlanti non molto potenti (66.4 dB)
Bassi 100 - 315 Hz
(-) | quasi nessun basso - in media 15.3% inferiori alla media
(±) | la linearità dei bassi è media (12.2% delta rispetto alla precedente frequenza)
Medi 400 - 2000 Hz
(+) | medi bilanciati - solo only 1.6% rispetto alla media
(+) | medi lineari (6.8% delta rispetto alla precedente frequenza)
Alti 2 - 16 kHz
(+) | Alti bilanciati - appena 3.8% dalla media
(±) | la linearità degli alti è media (10.6% delta rispetto alla precedente frequenza)
Nel complesso 100 - 16.000 Hz
(±) | la linearità complessiva del suono è media (19.8% di differenza rispetto alla media
Rispetto alla stessa classe
» 65% di tutti i dispositivi testati in questa classe è stato migliore, 6% simile, 28% peggiore
» Il migliore ha avuto un delta di 5%, medio di 17%, peggiore di 45%
Rispetto a tutti i dispositivi testati
» 51% di tutti i dispositivi testati in questa classe è stato migliore, 7% similare, 42% peggiore
» Il migliore ha avuto un delta di 4%, medio di 23%, peggiore di 134%
Apple MacBook 12 (Early 2016) 1.1 GHz analisi audio
(+) | gli altoparlanti sono relativamente potenti (83.6 dB)
Bassi 100 - 315 Hz
(±) | bassi ridotti - in media 11.3% inferiori alla media
(±) | la linearità dei bassi è media (14.2% delta rispetto alla precedente frequenza)
Medi 400 - 2000 Hz
(+) | medi bilanciati - solo only 2.4% rispetto alla media
(+) | medi lineari (5.5% delta rispetto alla precedente frequenza)
Alti 2 - 16 kHz
(+) | Alti bilanciati - appena 2% dalla media
(+) | alti lineari (4.5% delta rispetto alla precedente frequenza)
Nel complesso 100 - 16.000 Hz
(+) | suono nel complesso lineare (10.2% differenza dalla media)
Rispetto alla stessa classe
» 7% di tutti i dispositivi testati in questa classe è stato migliore, 2% simile, 90% peggiore
» Il migliore ha avuto un delta di 5%, medio di 18%, peggiore di 53%
Rispetto a tutti i dispositivi testati
» 5% di tutti i dispositivi testati in questa classe è stato migliore, 1% similare, 94% peggiore
» Il migliore ha avuto un delta di 4%, medio di 23%, peggiore di 134%
| Off / Standby | |
| Idle | |
| Sotto carico |
|
Leggenda:
min: | |
| Asus VivoBook S15 S510UA i5-7200U, HD Graphics 620, Toshiba HG6 THNSNJ128G8NY, IPS, 1920x1080, 15.6" | Lenovo V510-15IKB 80WQ0002GE i5-7200U, HD Graphics 620, Samsung CM871a MZNTY256HDHP, IPS, 1920x1080, 15.6" | HP Pavilion 15t-au100 CTO (W0P31AV) i7-7500U, GeForce 940MX, Toshiba MQ01ABD100, IPS, 1920x1080, 15.6" | Apple MacBook Pro 15 2016 (2.9 GHz, 460) 6920HQ, Radeon Pro 460, Apple SSD SM1024L, IPS, 2880x1800, 15.4" | HP Envy 15-as133cl i7-7500U, HD Graphics 620, HGST Travelstar 5K1000 HTS541010A7E630, IPS, 1920x1080, 15.6" | |
|---|---|---|---|---|---|
| Power Consumption | -5% | -33% | -62% | 10% | |
| Idle Minimum * (Watt) | 4.6 | 4 13% | 6.16 -34% | 3 35% | 4.6 -0% |
| Idle Average * (Watt) | 7.6 | 9.6 -26% | 8.48 -12% | 9.9 -30% | 7.7 -1% |
| Idle Maximum * (Watt) | 7.7 | 9.7 -26% | 9.62 -25% | 12.5 -62% | 7.8 -1% |
| Load Average * (Watt) | 35.1 | 27.7 21% | 41.63 -19% | 70.6 -101% | 30.5 13% |
| Load Maximum * (Watt) | 36.2 | 38.4 -6% | 63.22 -75% | 90.8 -151% | 22.7 37% |
* ... Meglio usare valori piccoli
| Asus VivoBook S15 S510UA i5-7200U, HD Graphics 620, 42 Wh | Lenovo V510-15IKB 80WQ0002GE i5-7200U, HD Graphics 620, 32 Wh | HP Pavilion 15t-au100 CTO (W0P31AV) i7-7500U, GeForce 940MX, 41 Wh | Apple MacBook Pro 15 2016 (2.9 GHz, 460) 6920HQ, Radeon Pro 460, 76 Wh | HP Envy 15-as133cl i7-7500U, HD Graphics 620, 52 Wh | |
|---|---|---|---|---|---|
| Autonomia della batteria | -12% | 3% | 58% | 17% | |
| Reader / Idle (h) | 10.2 | 7.3 -28% | 9.6 -6% | ||
| WiFi v1.3 (h) | 4.3 | 3.8 -12% | 3.7 -14% | 10.3 140% | 6.8 58% |
| Load (h) | 1.2 | 1.8 50% | 0.9 -25% | 1.2 0% |
Pro
Contro
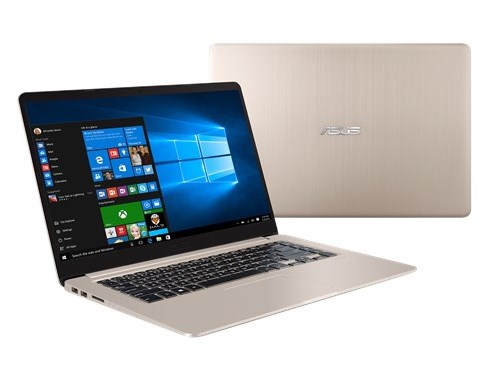

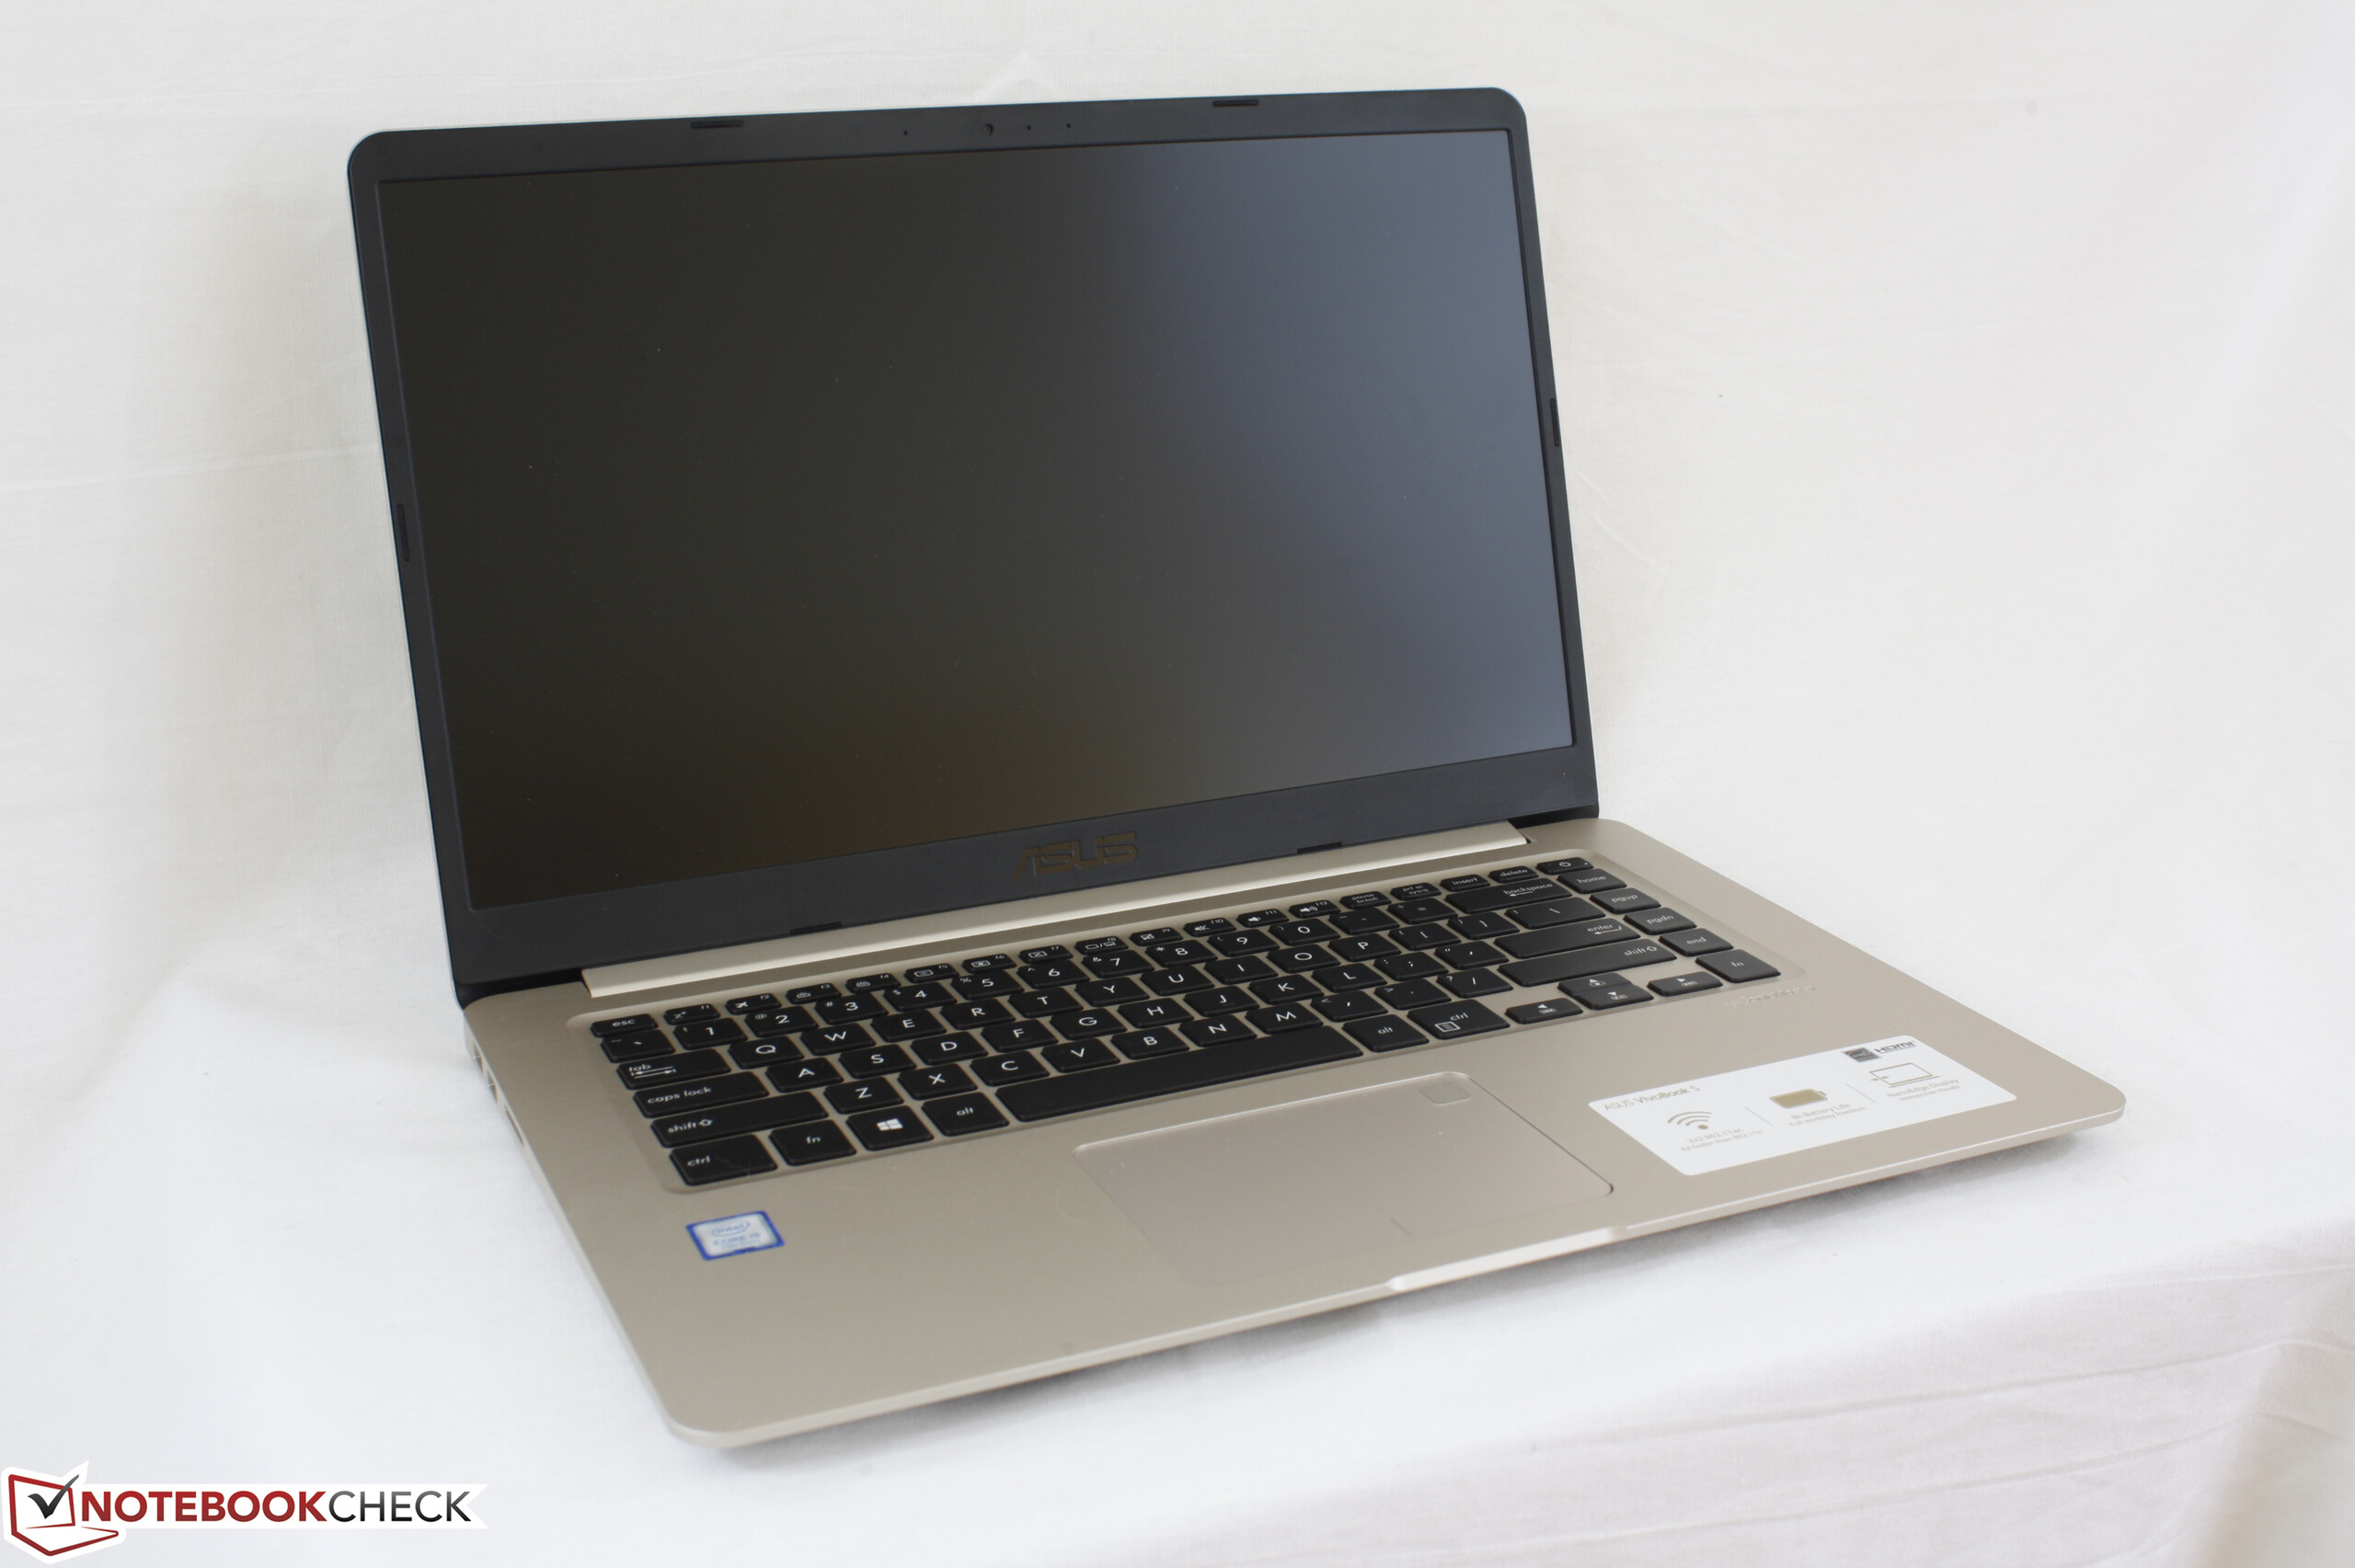
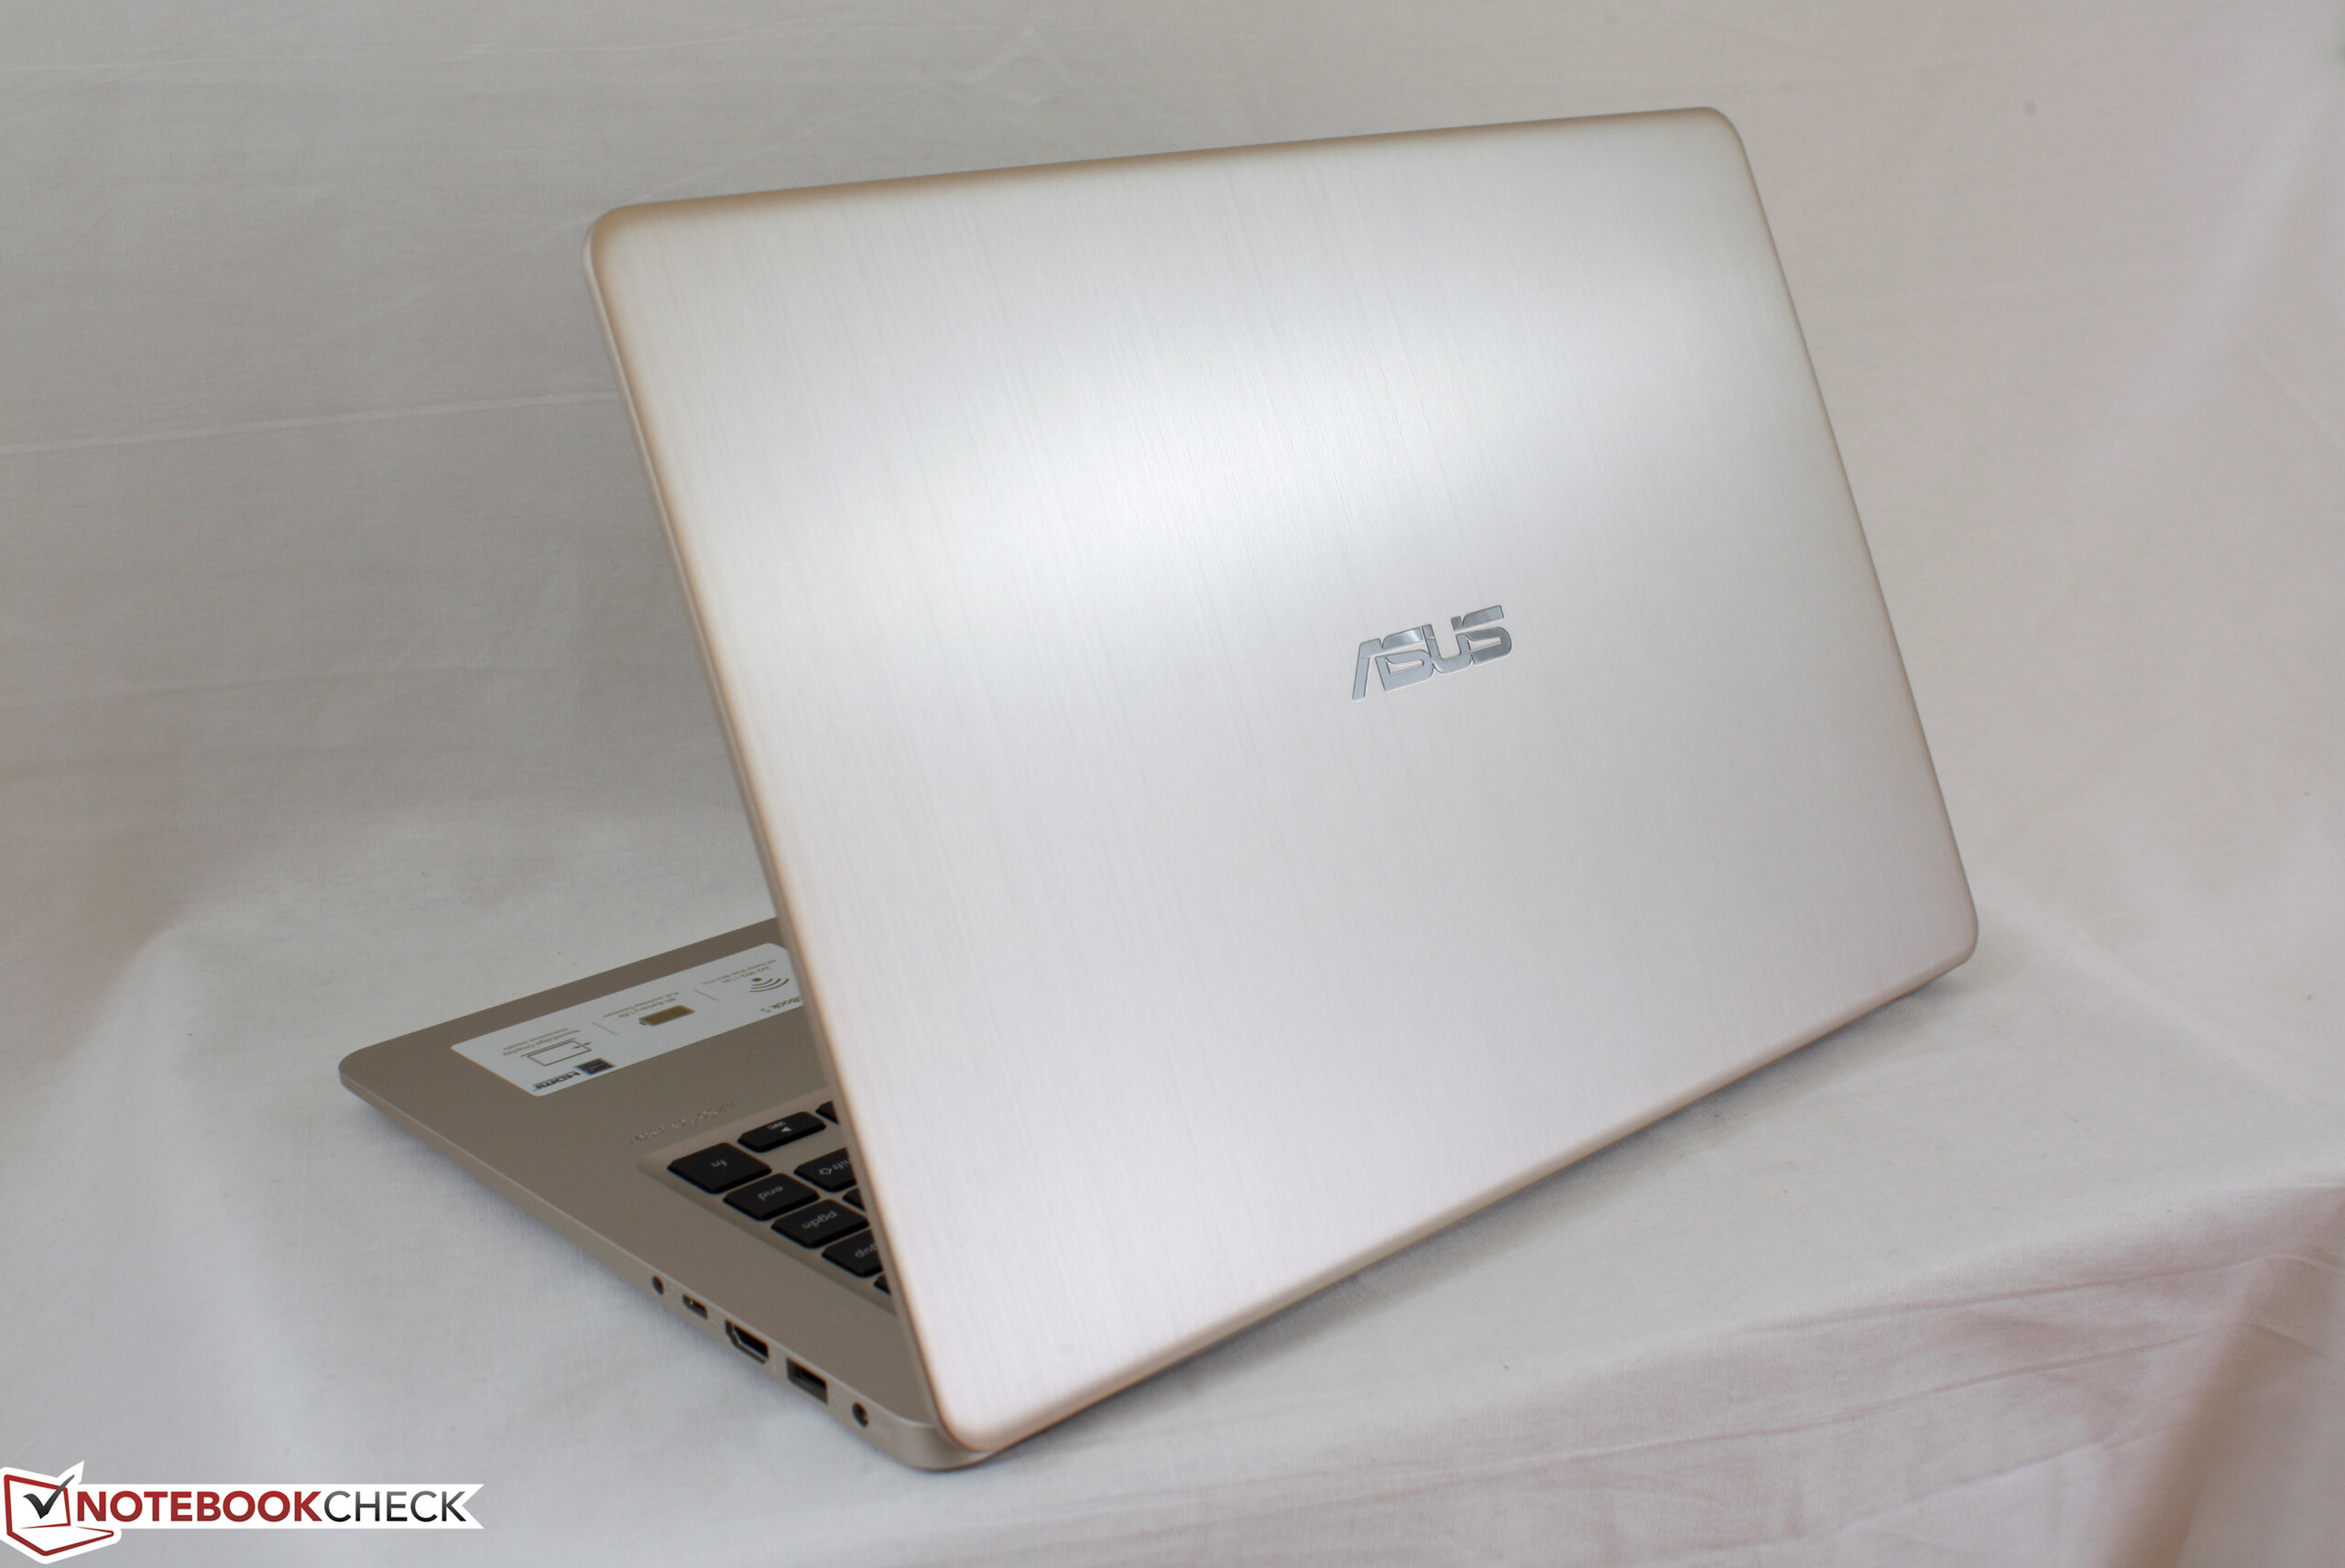
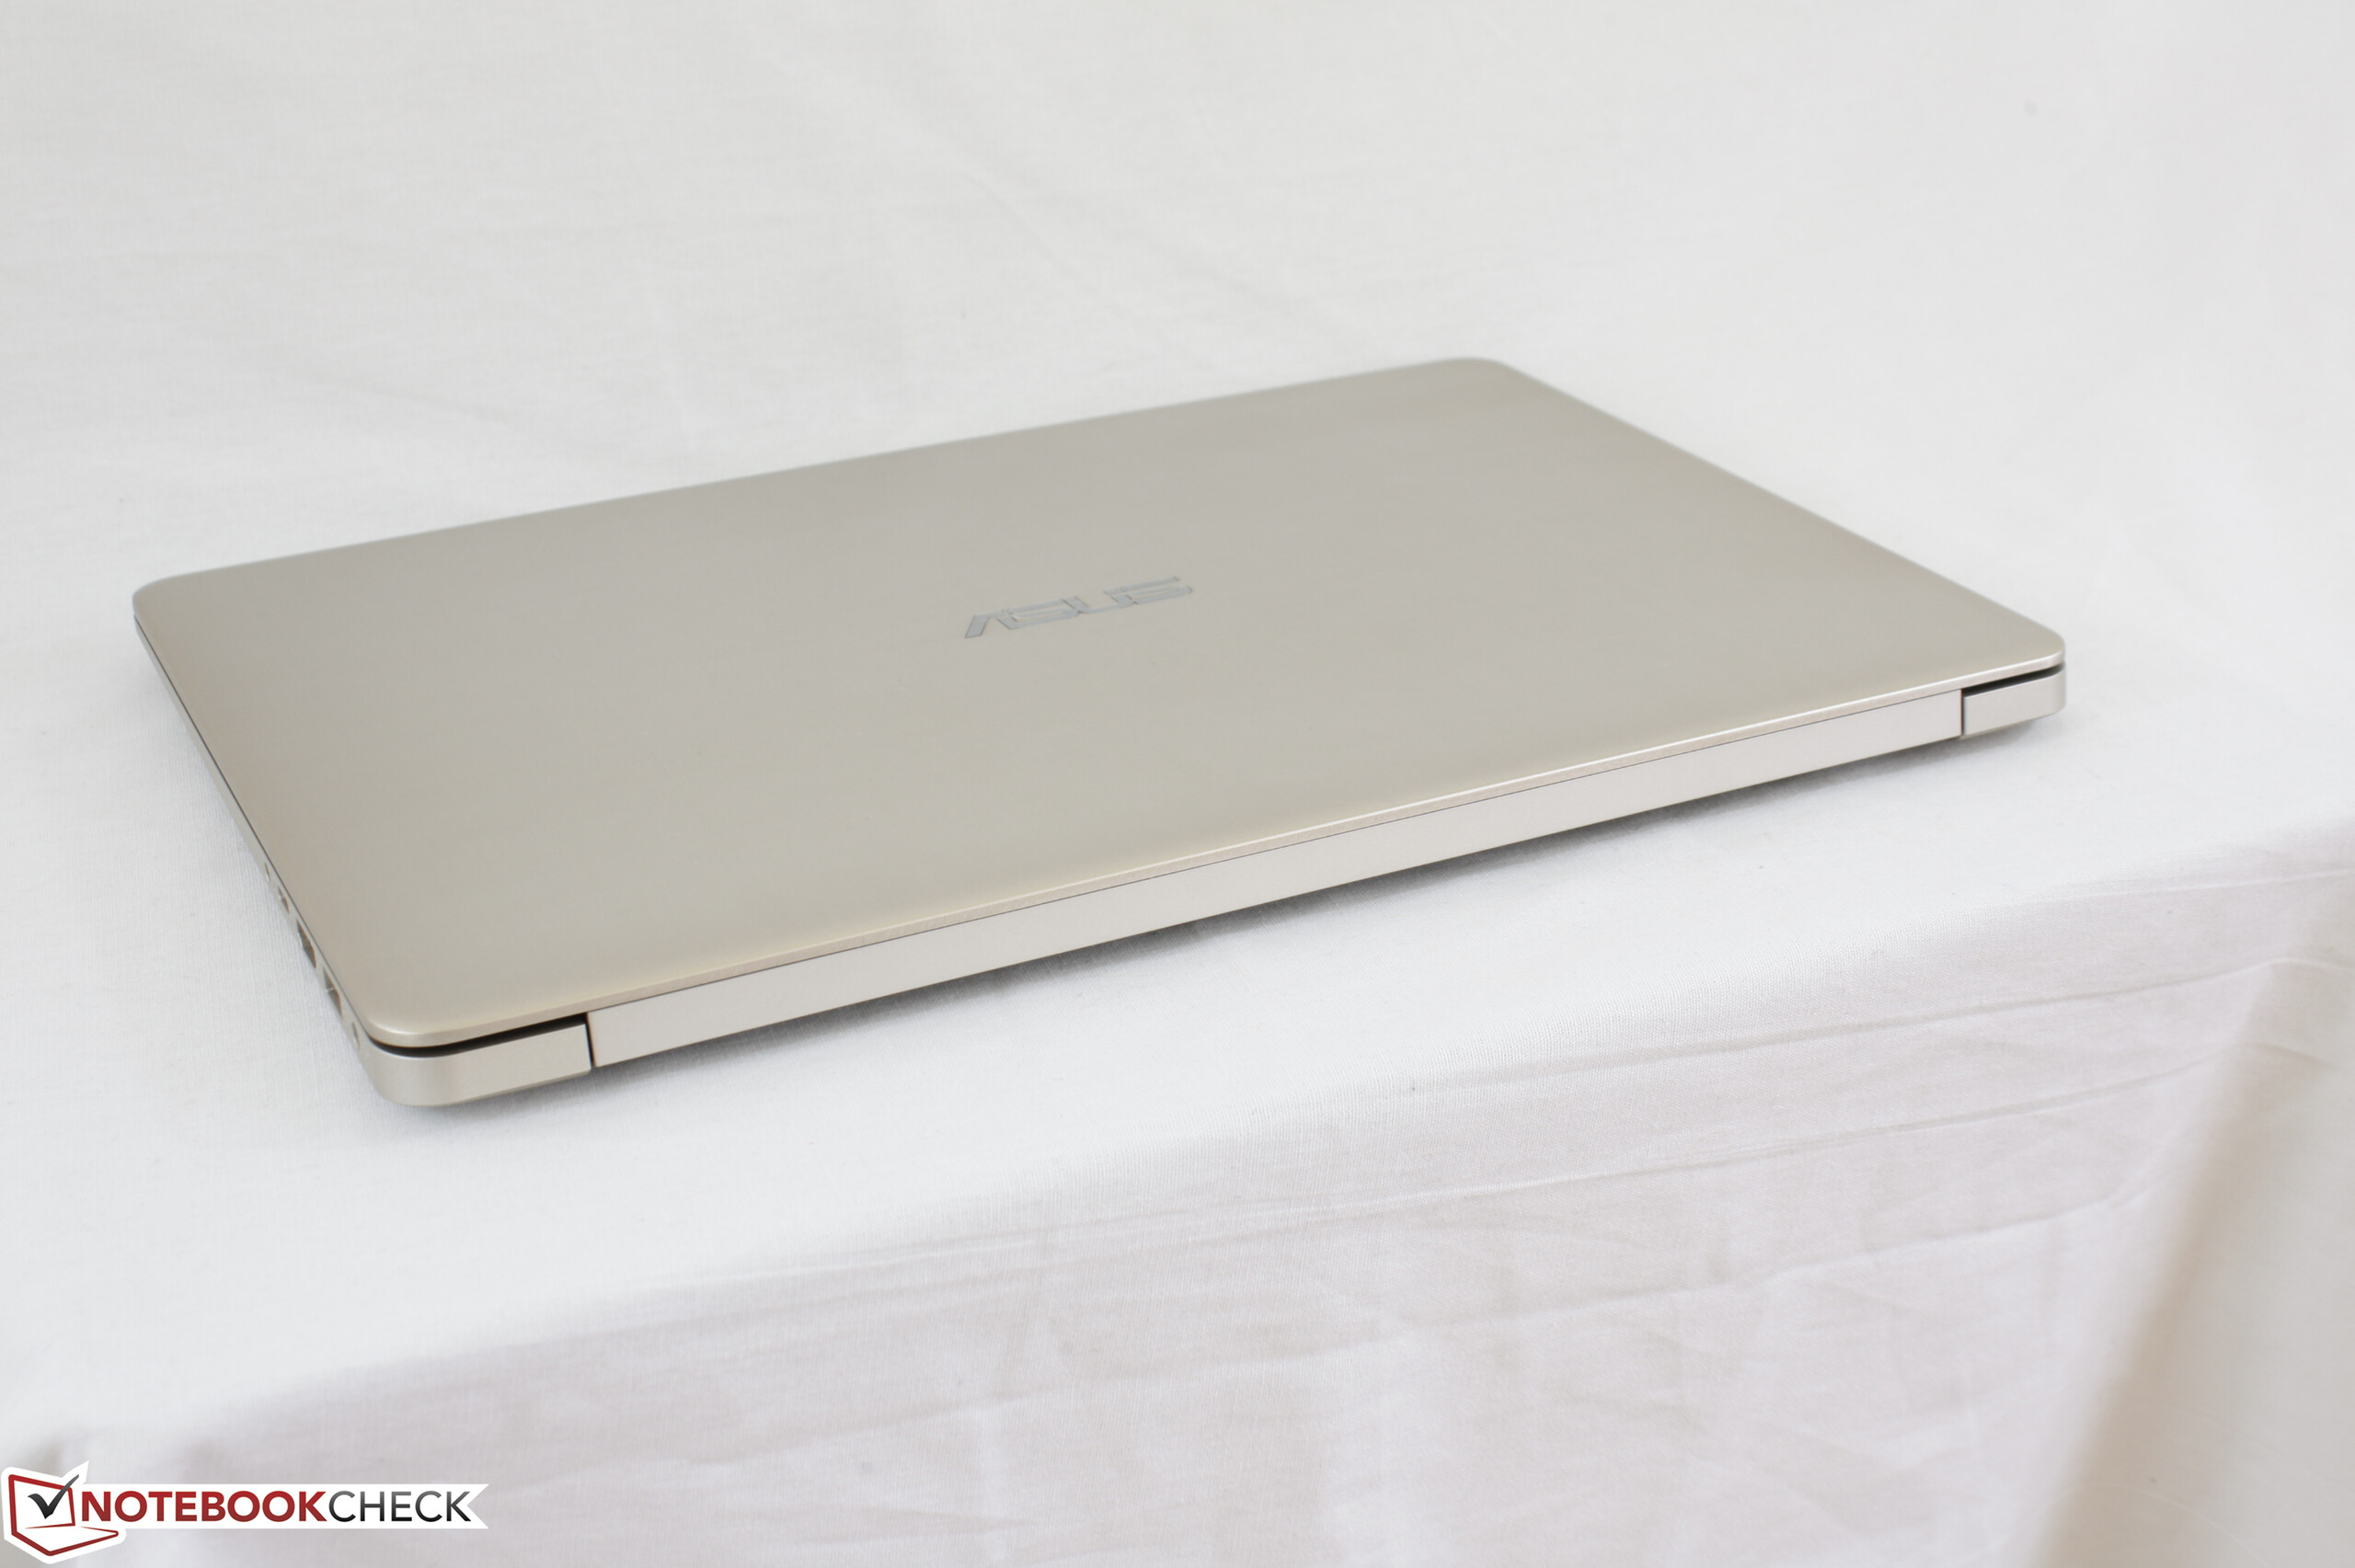
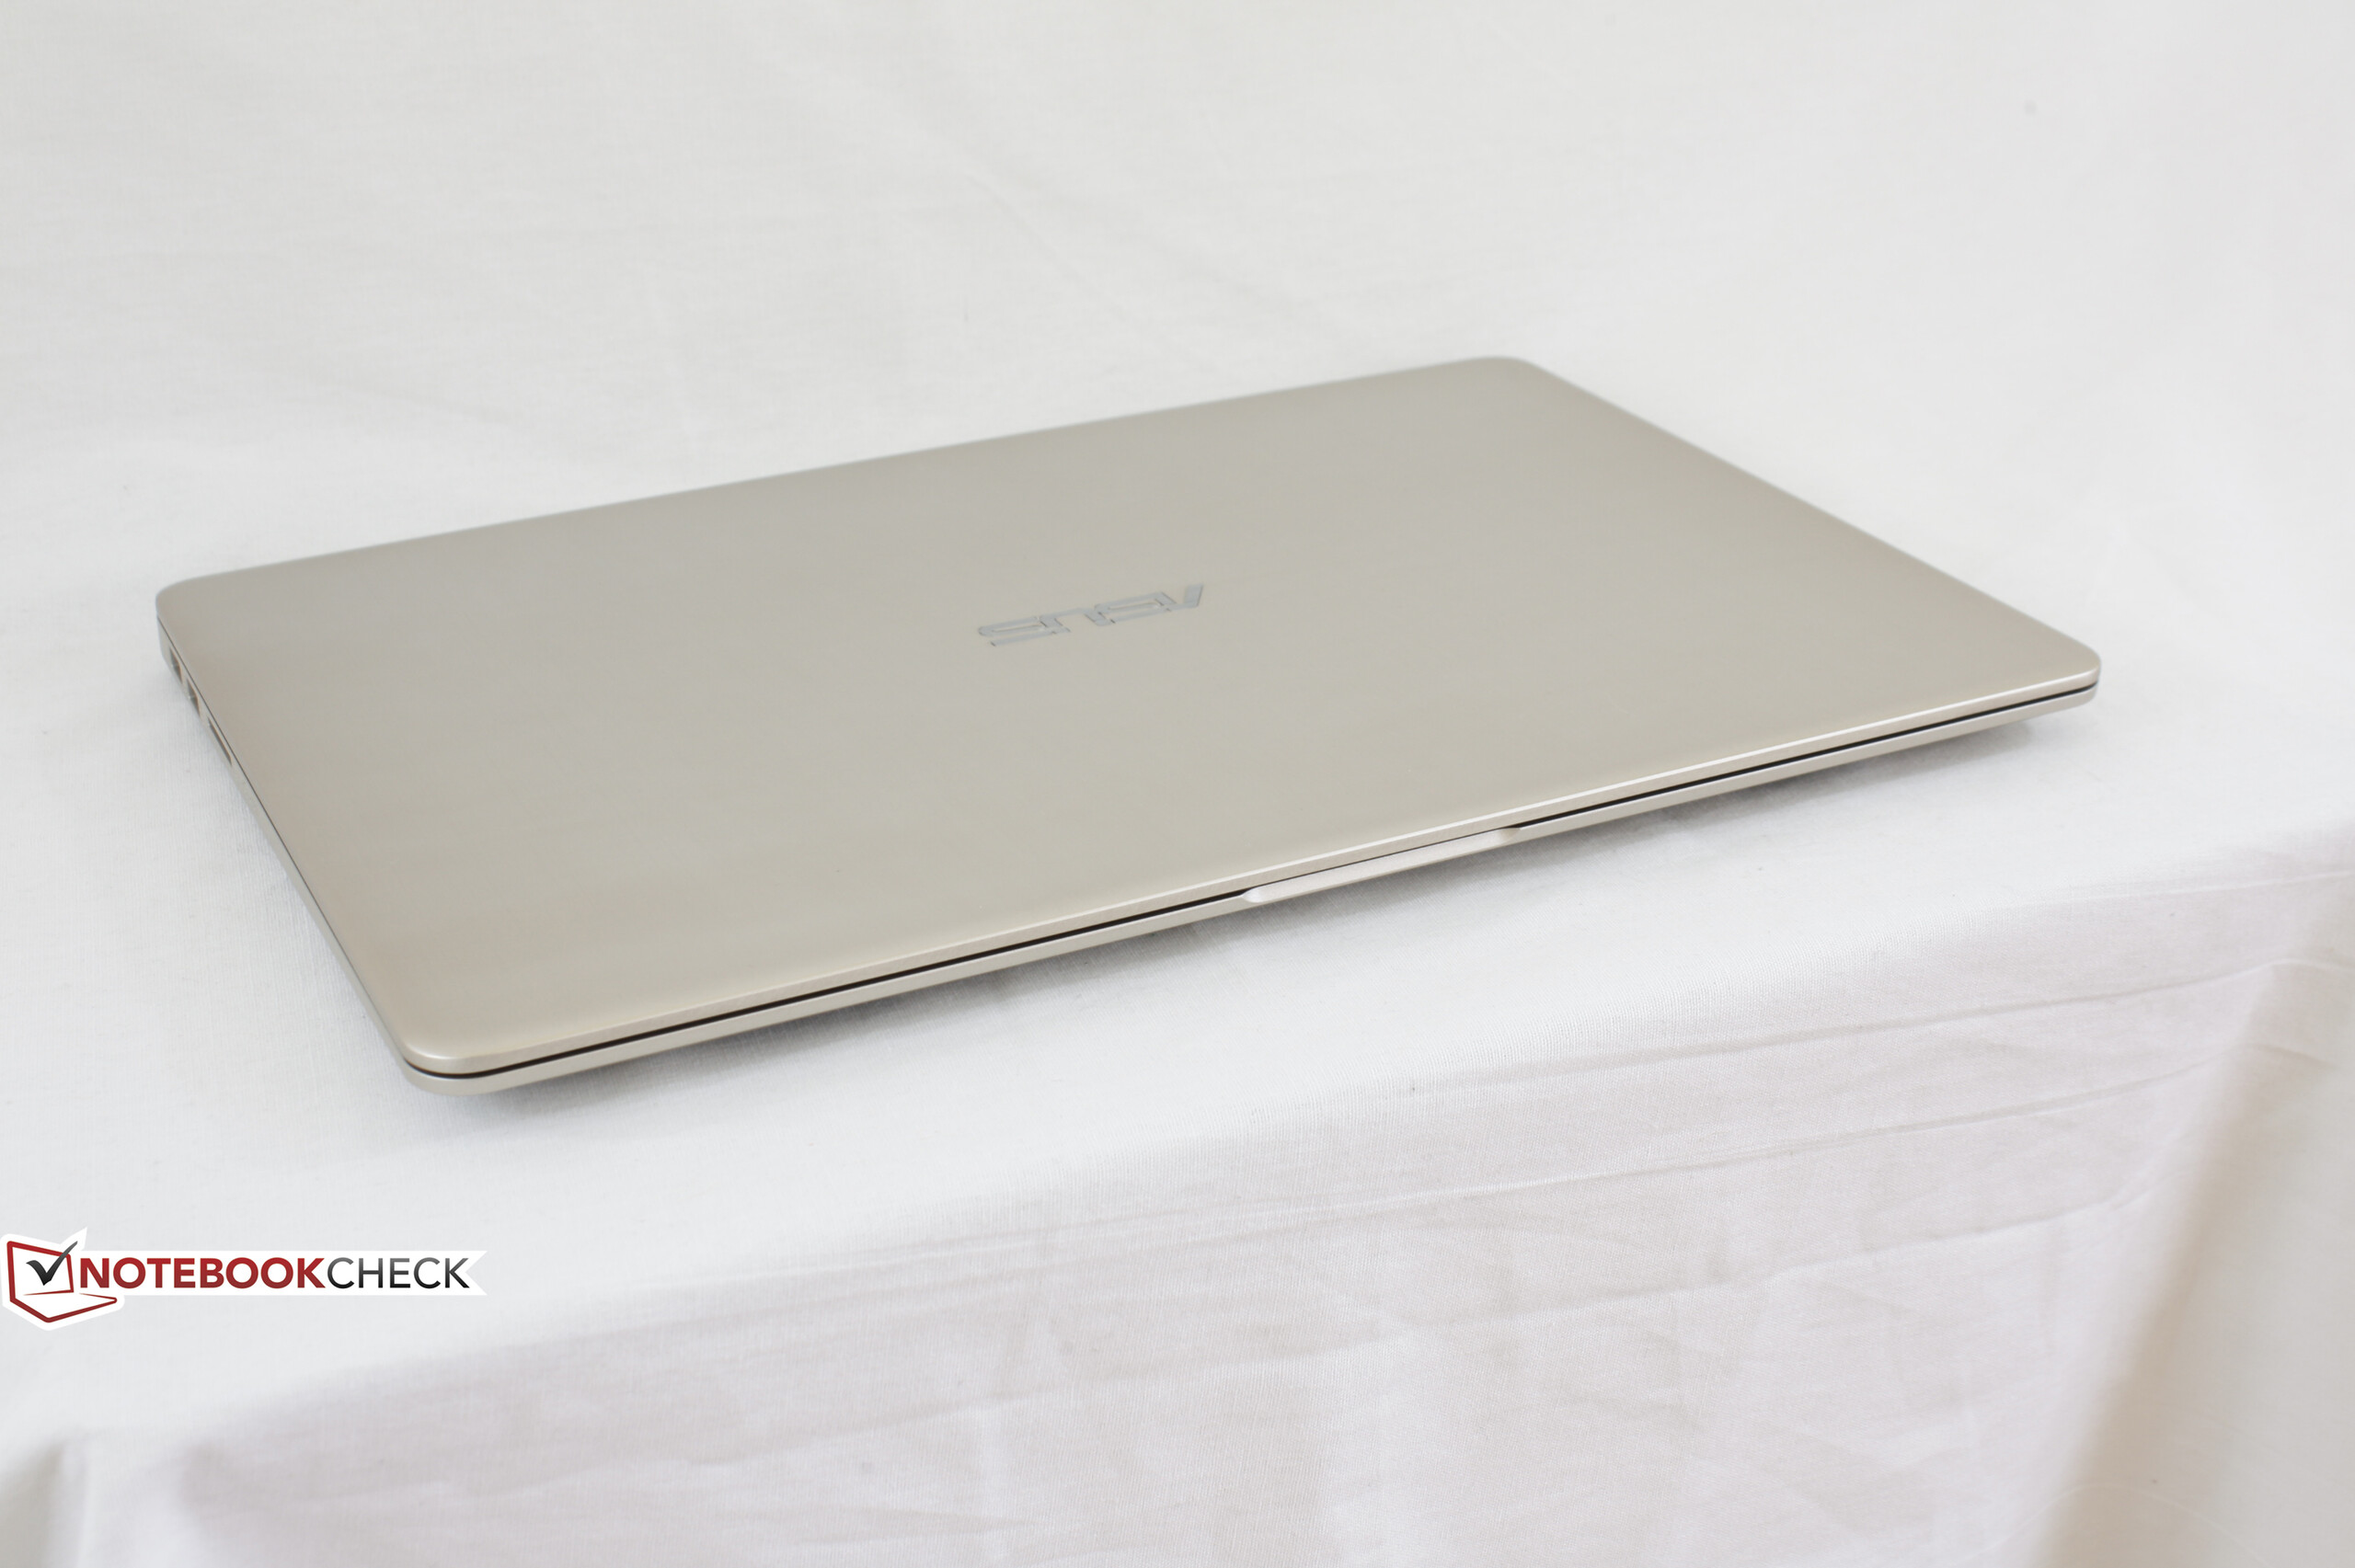
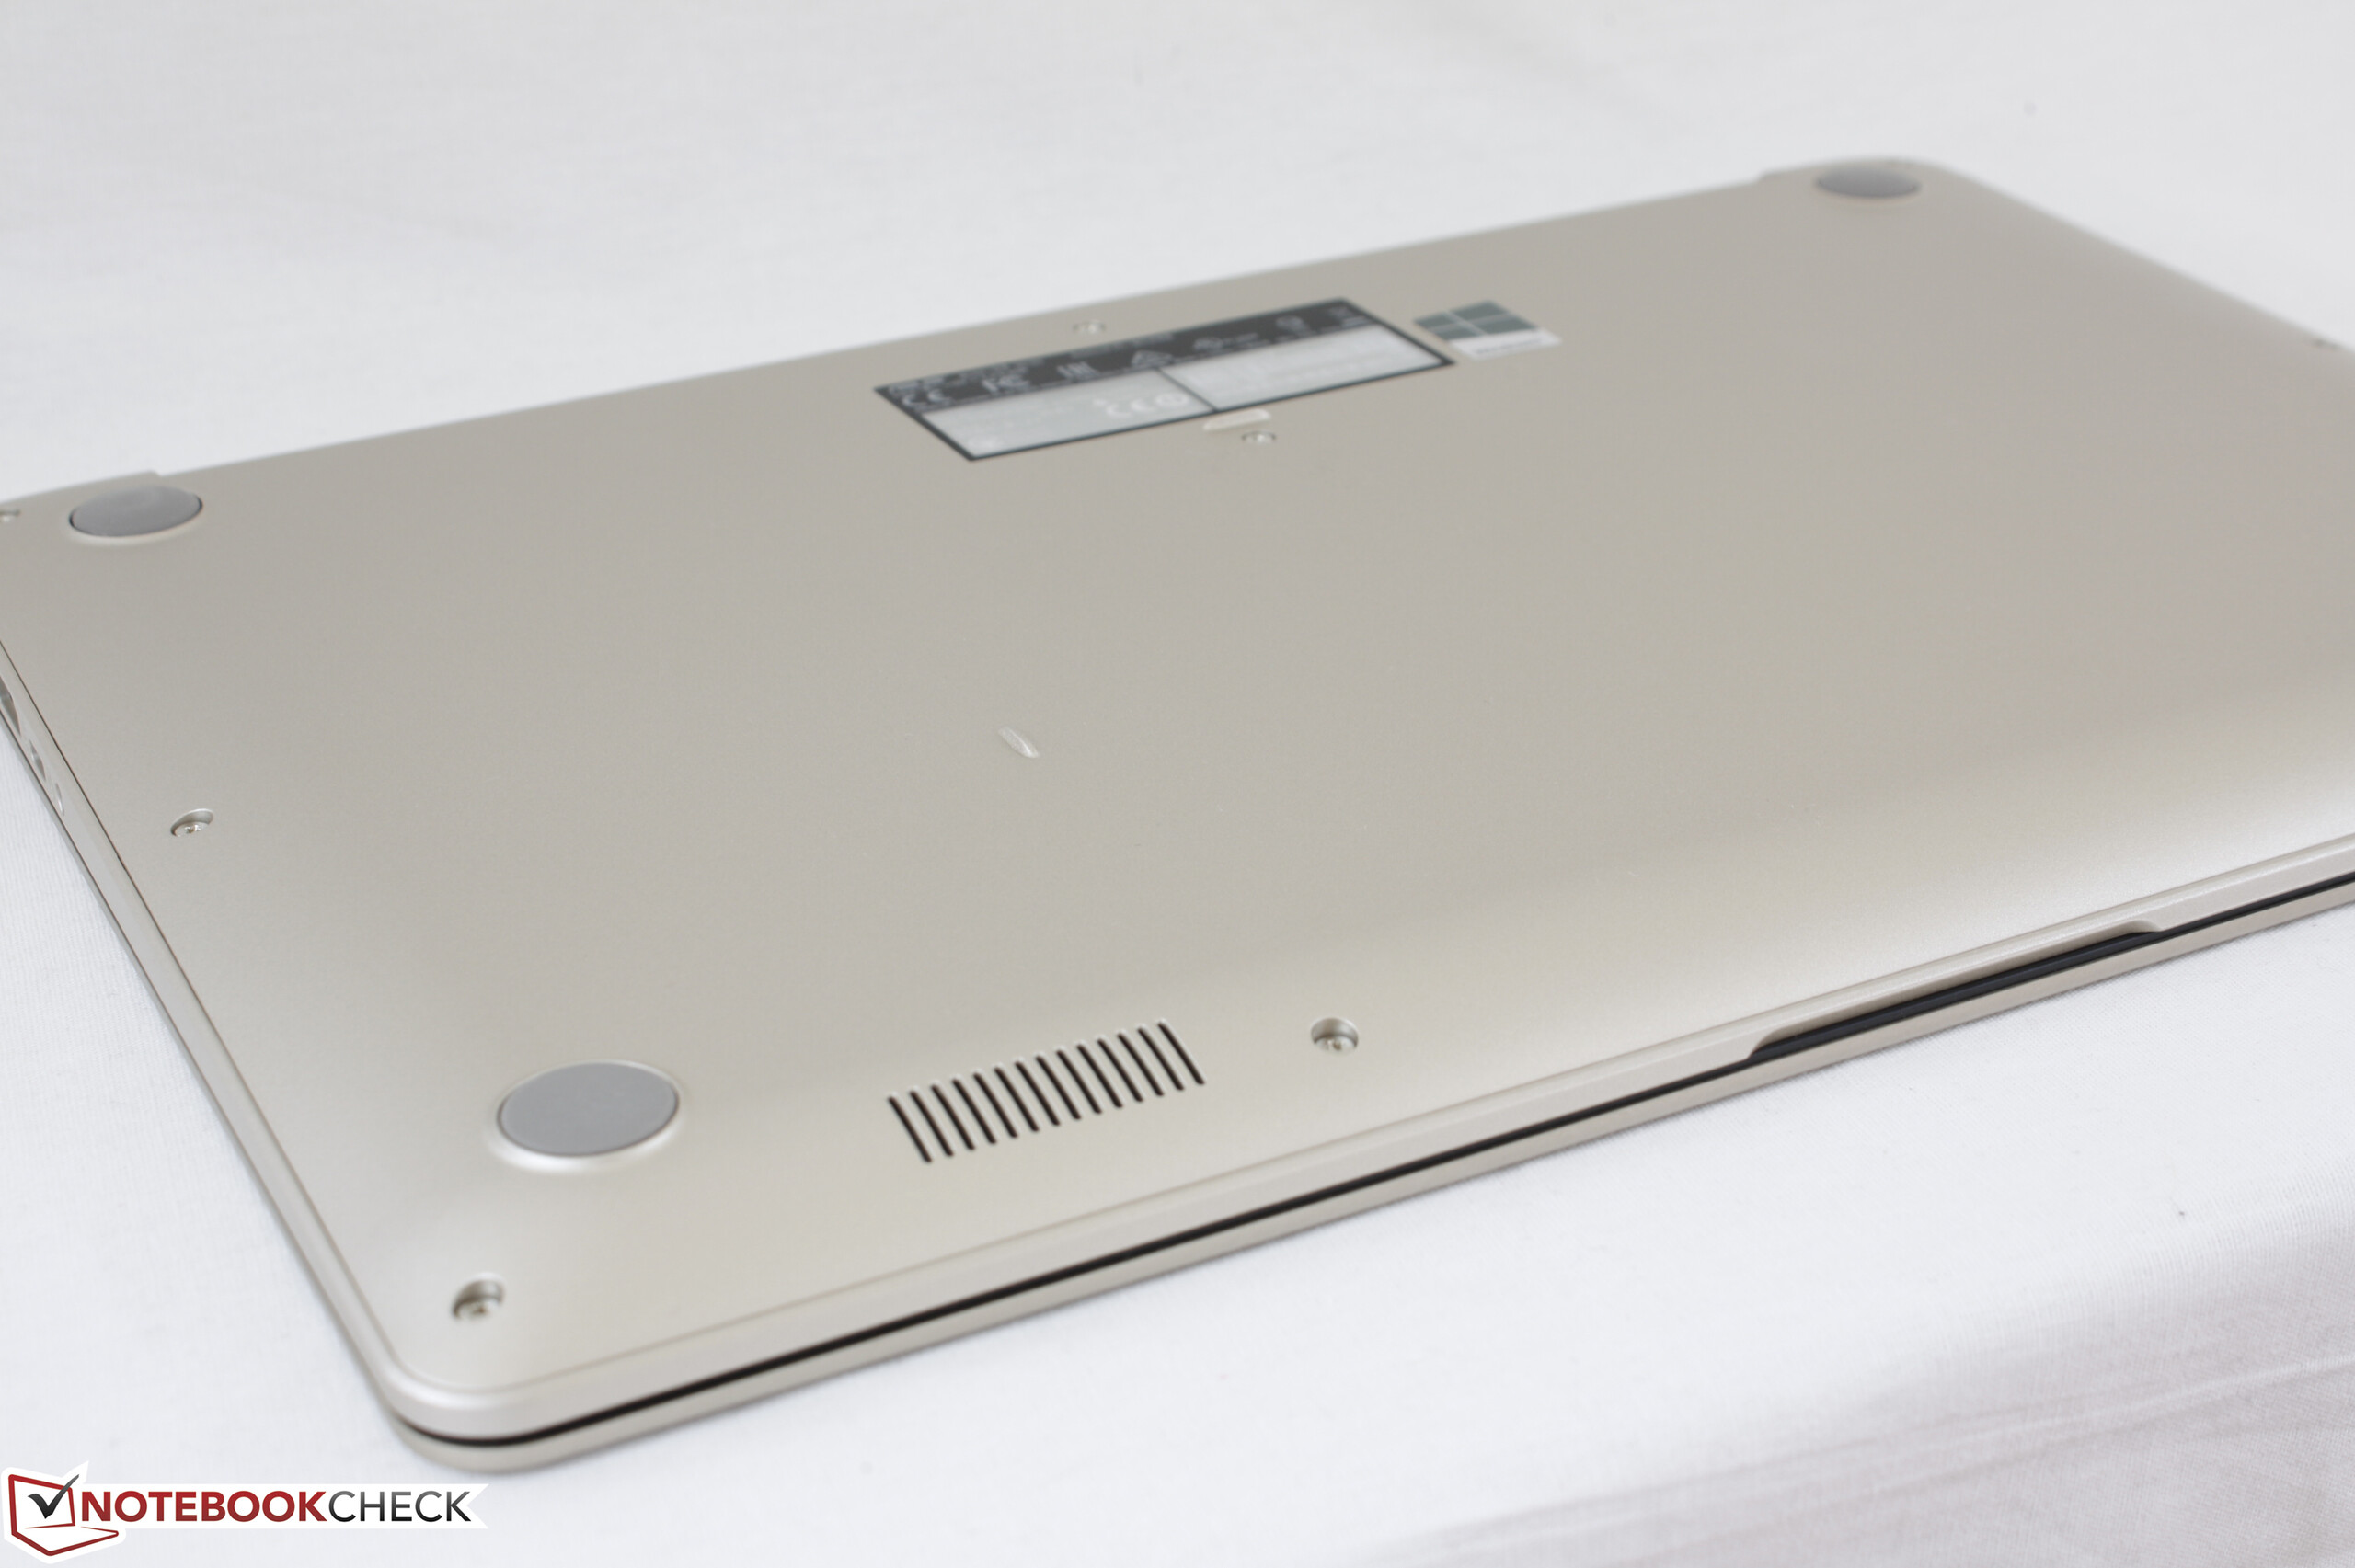
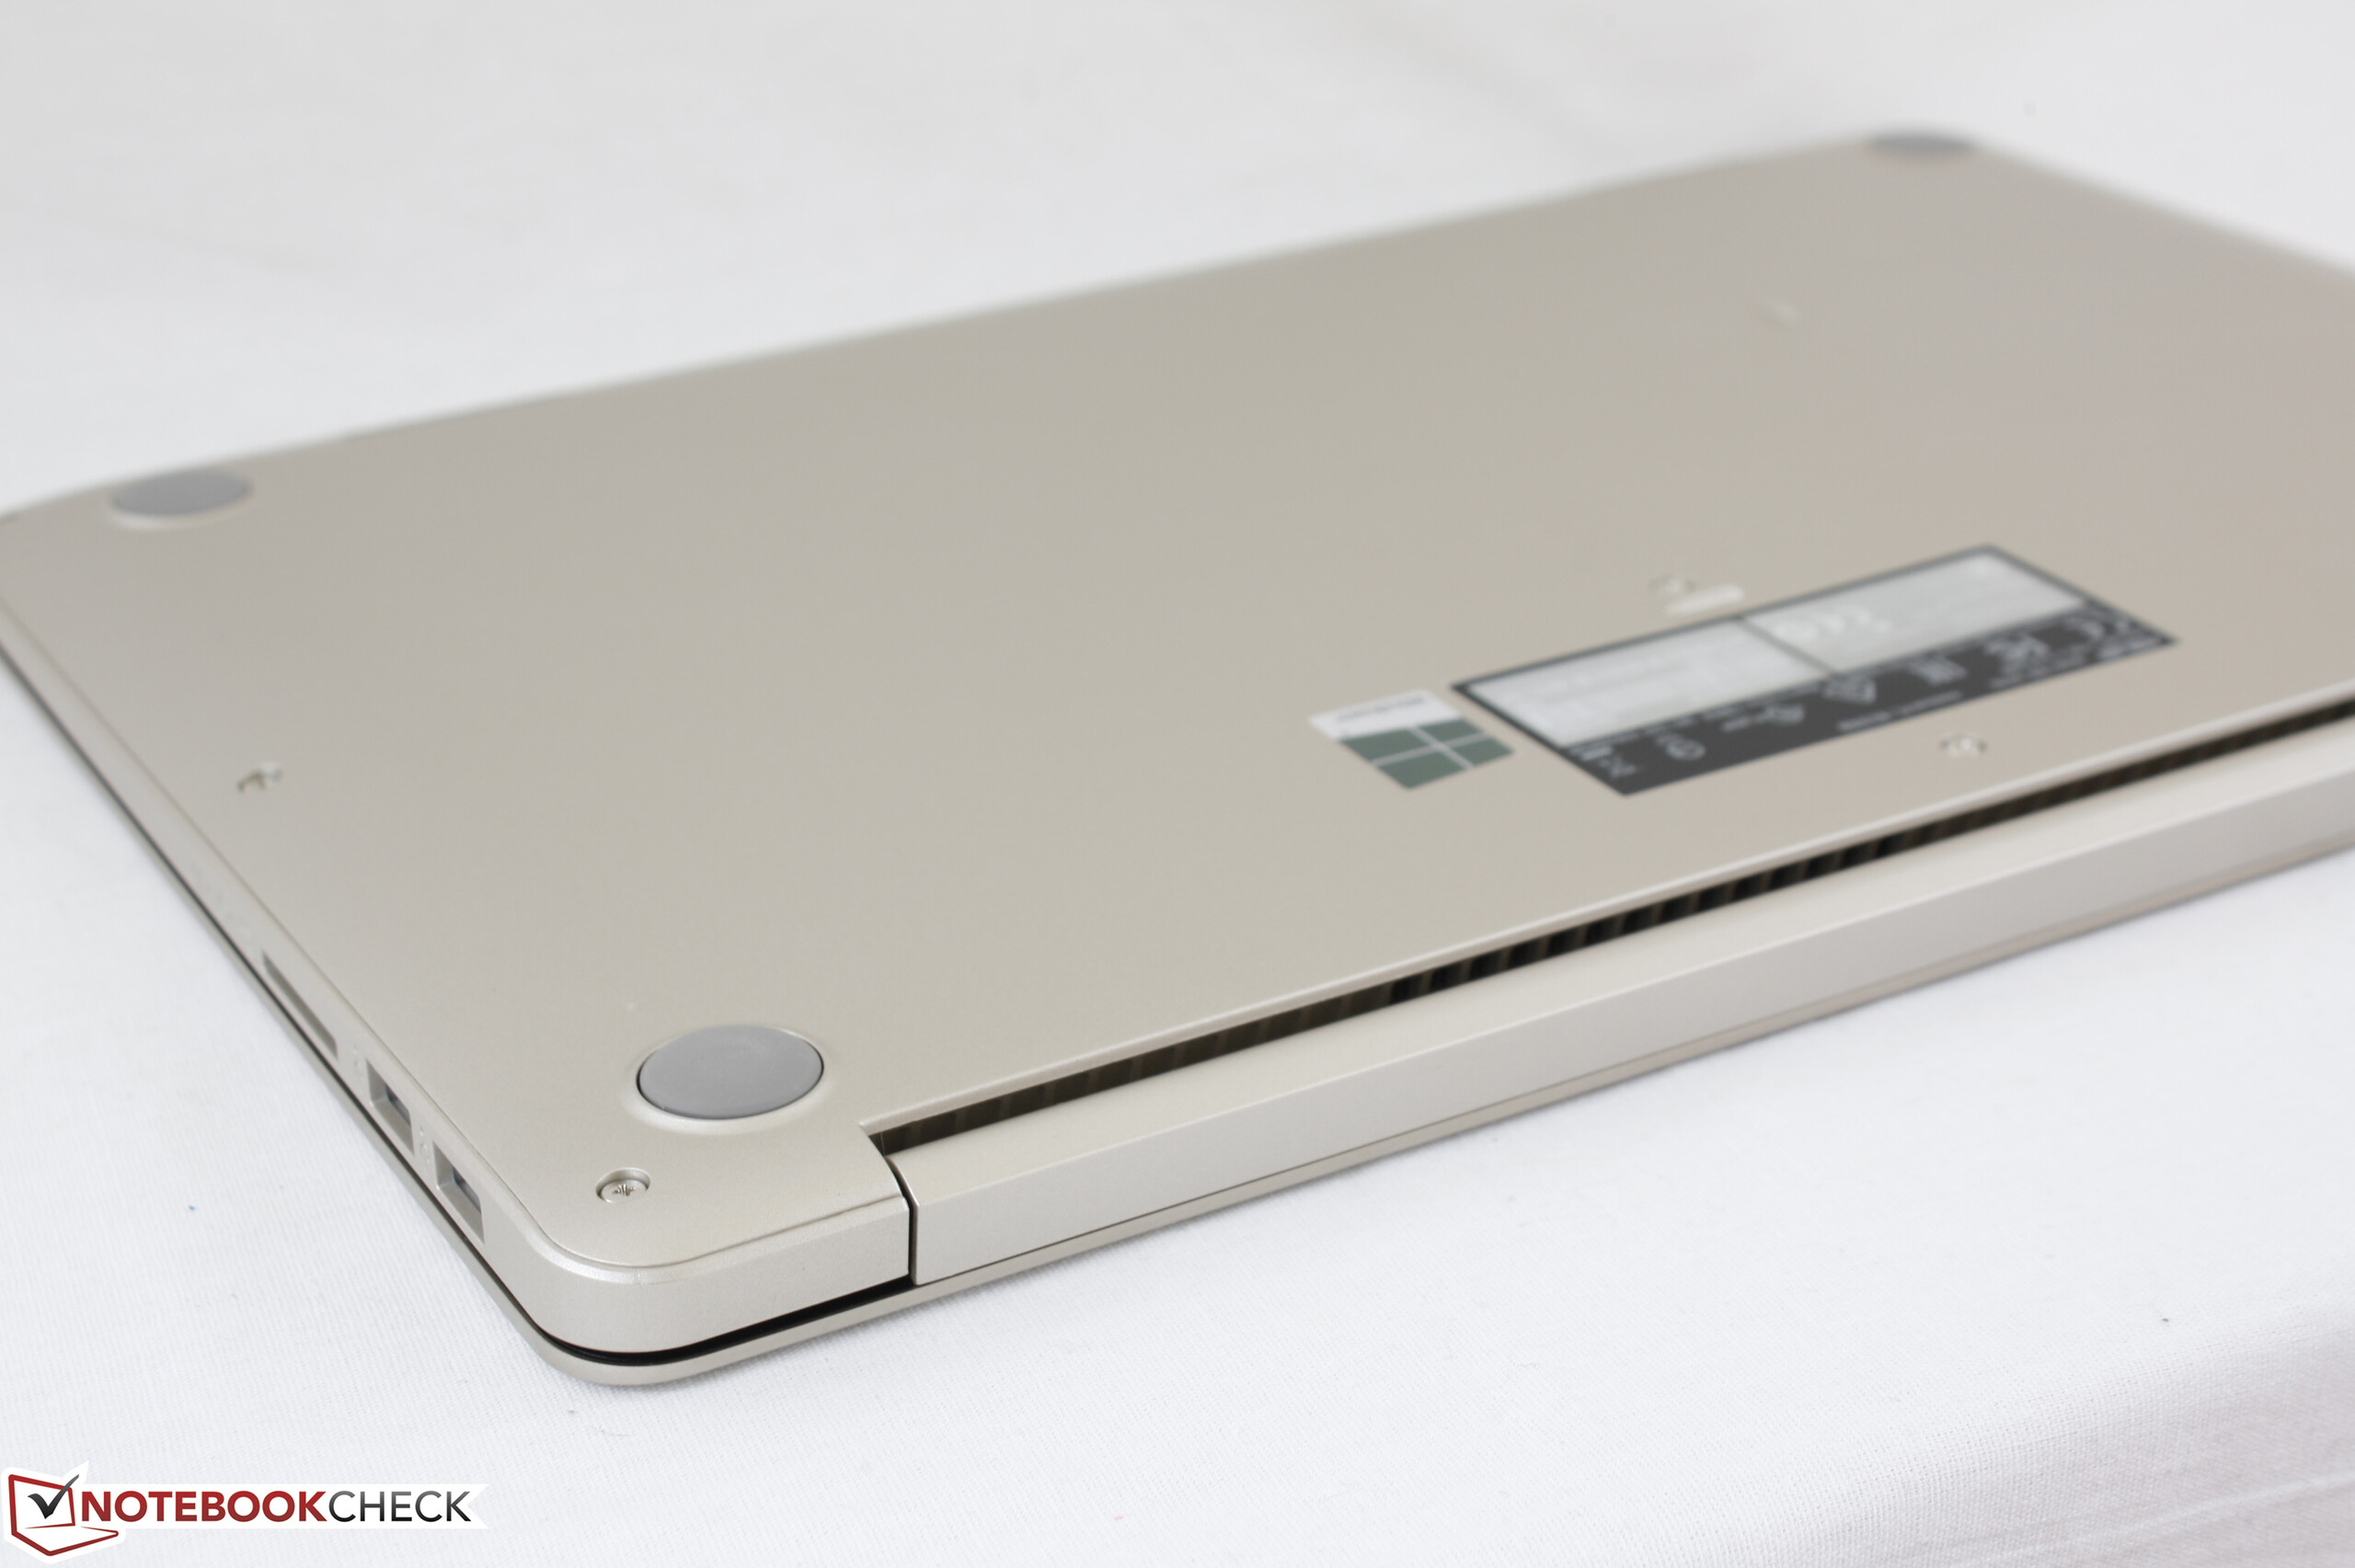
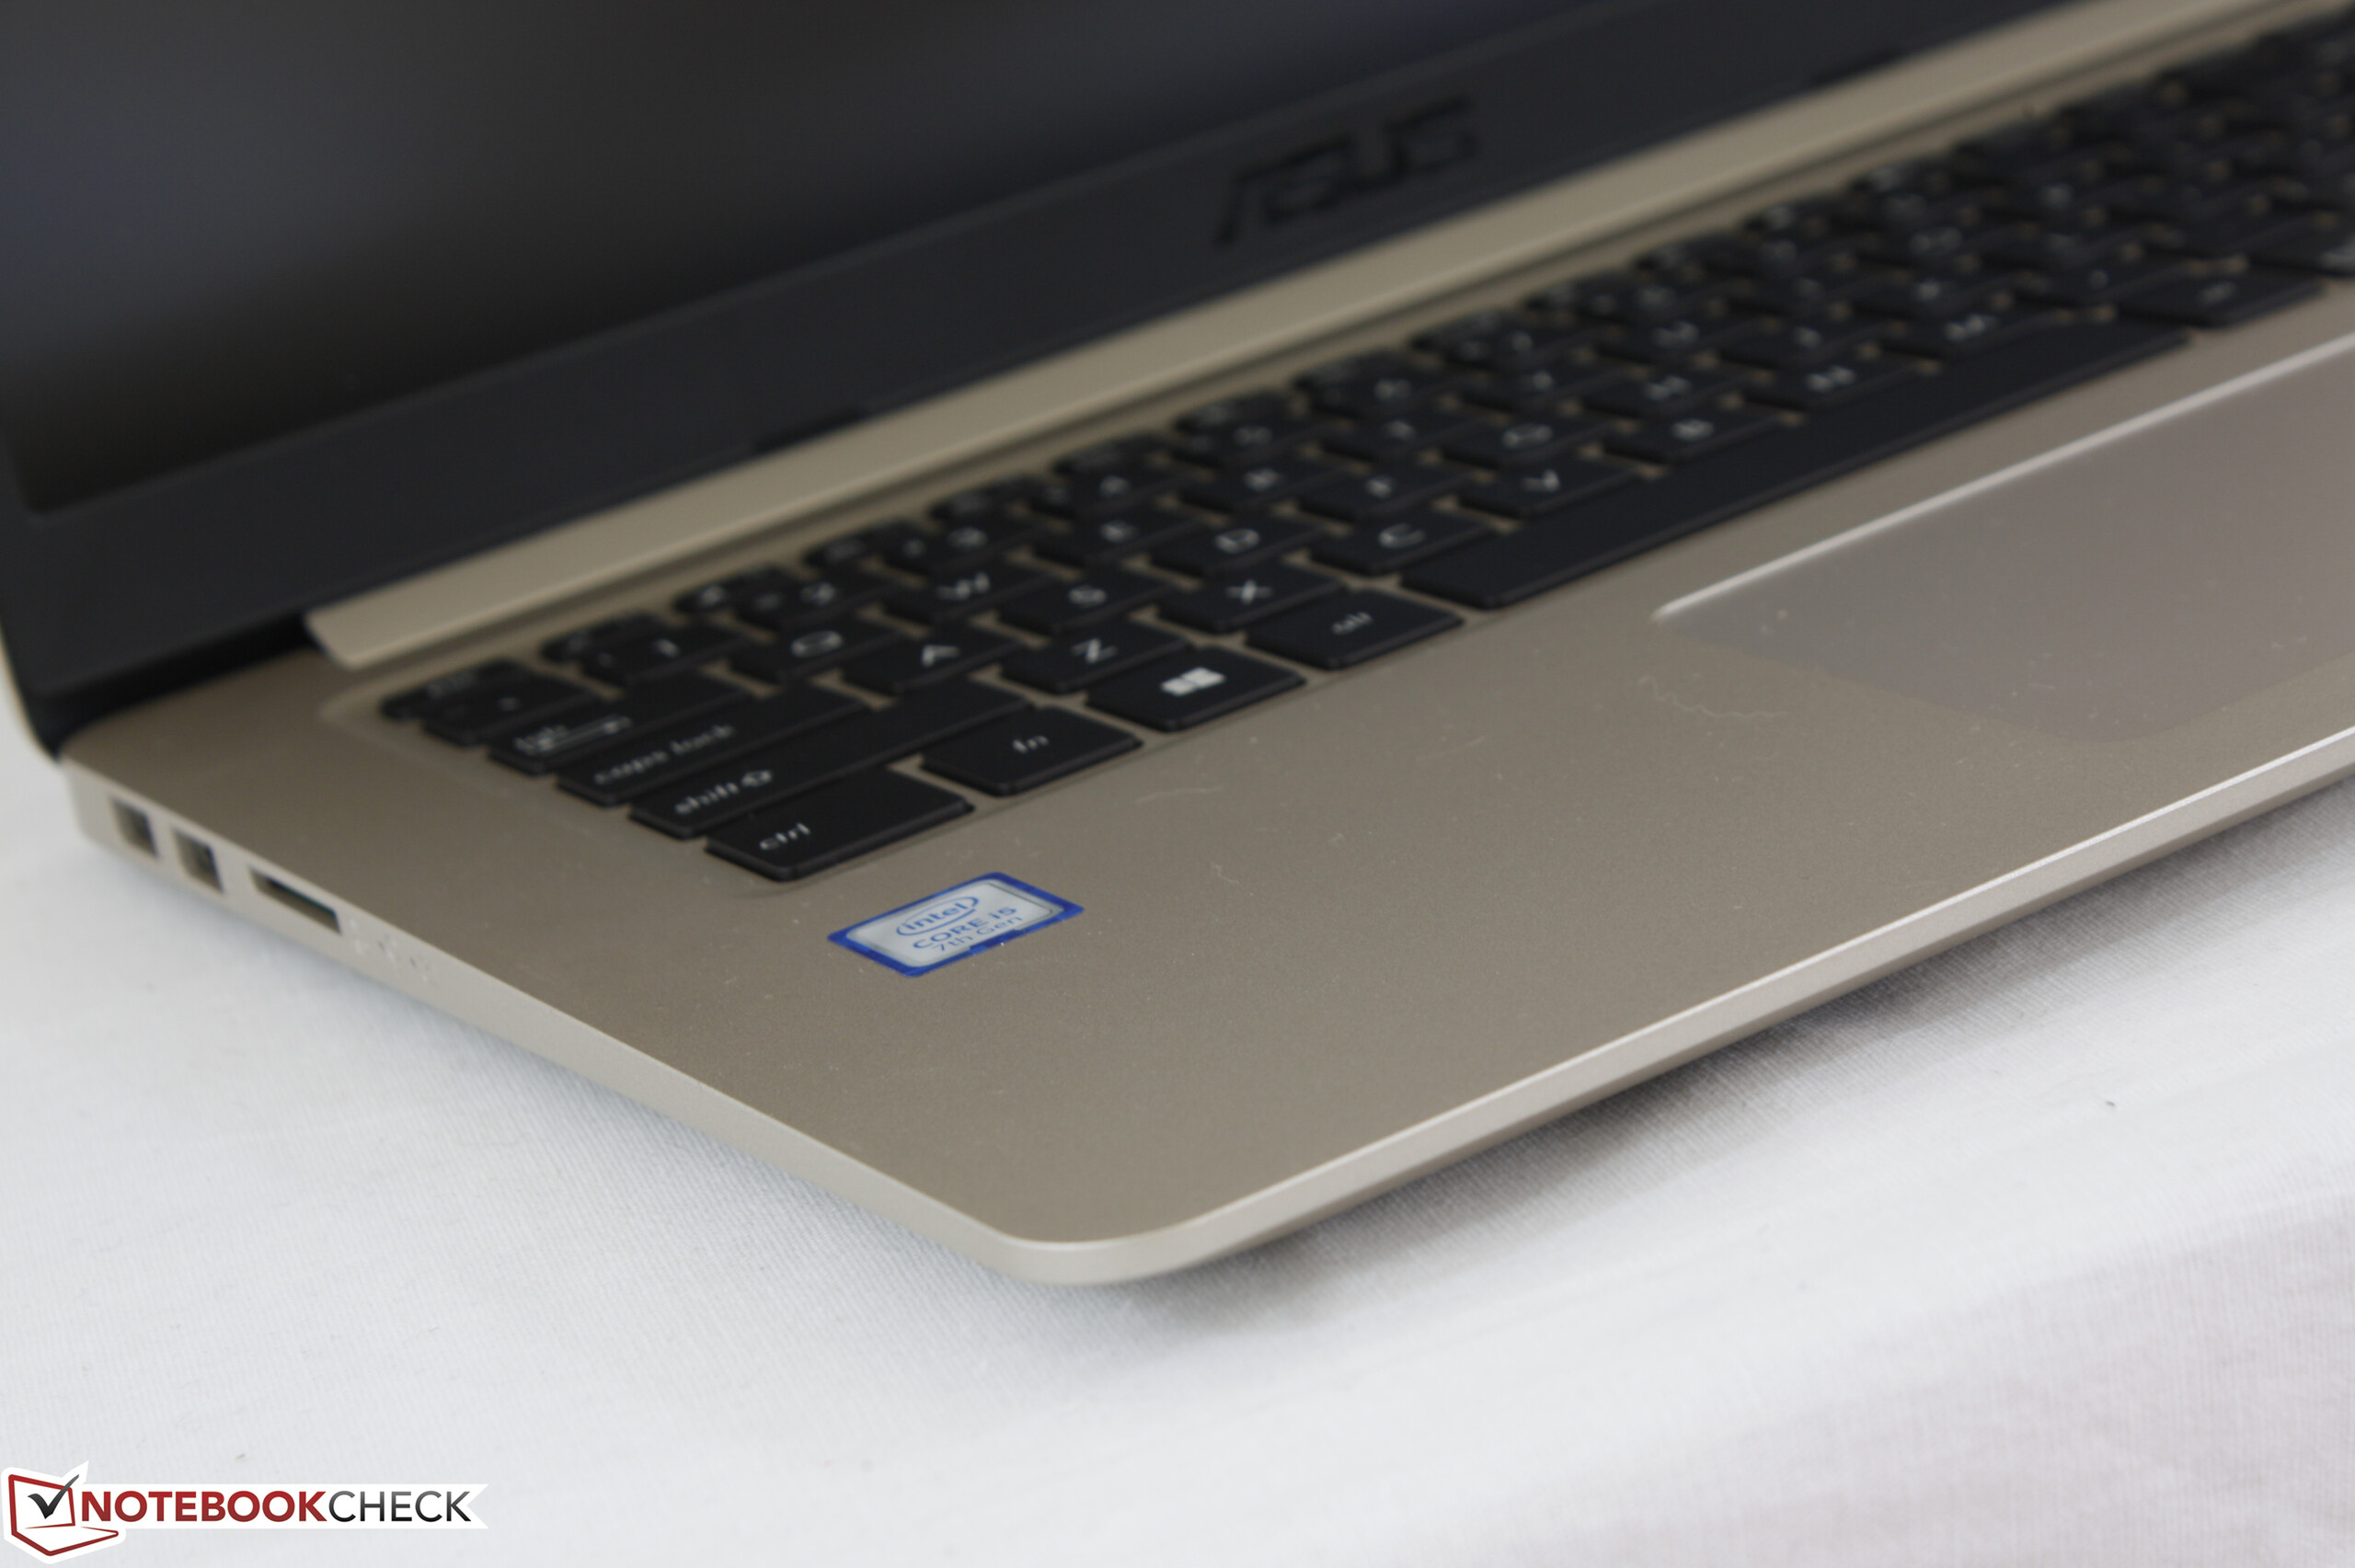
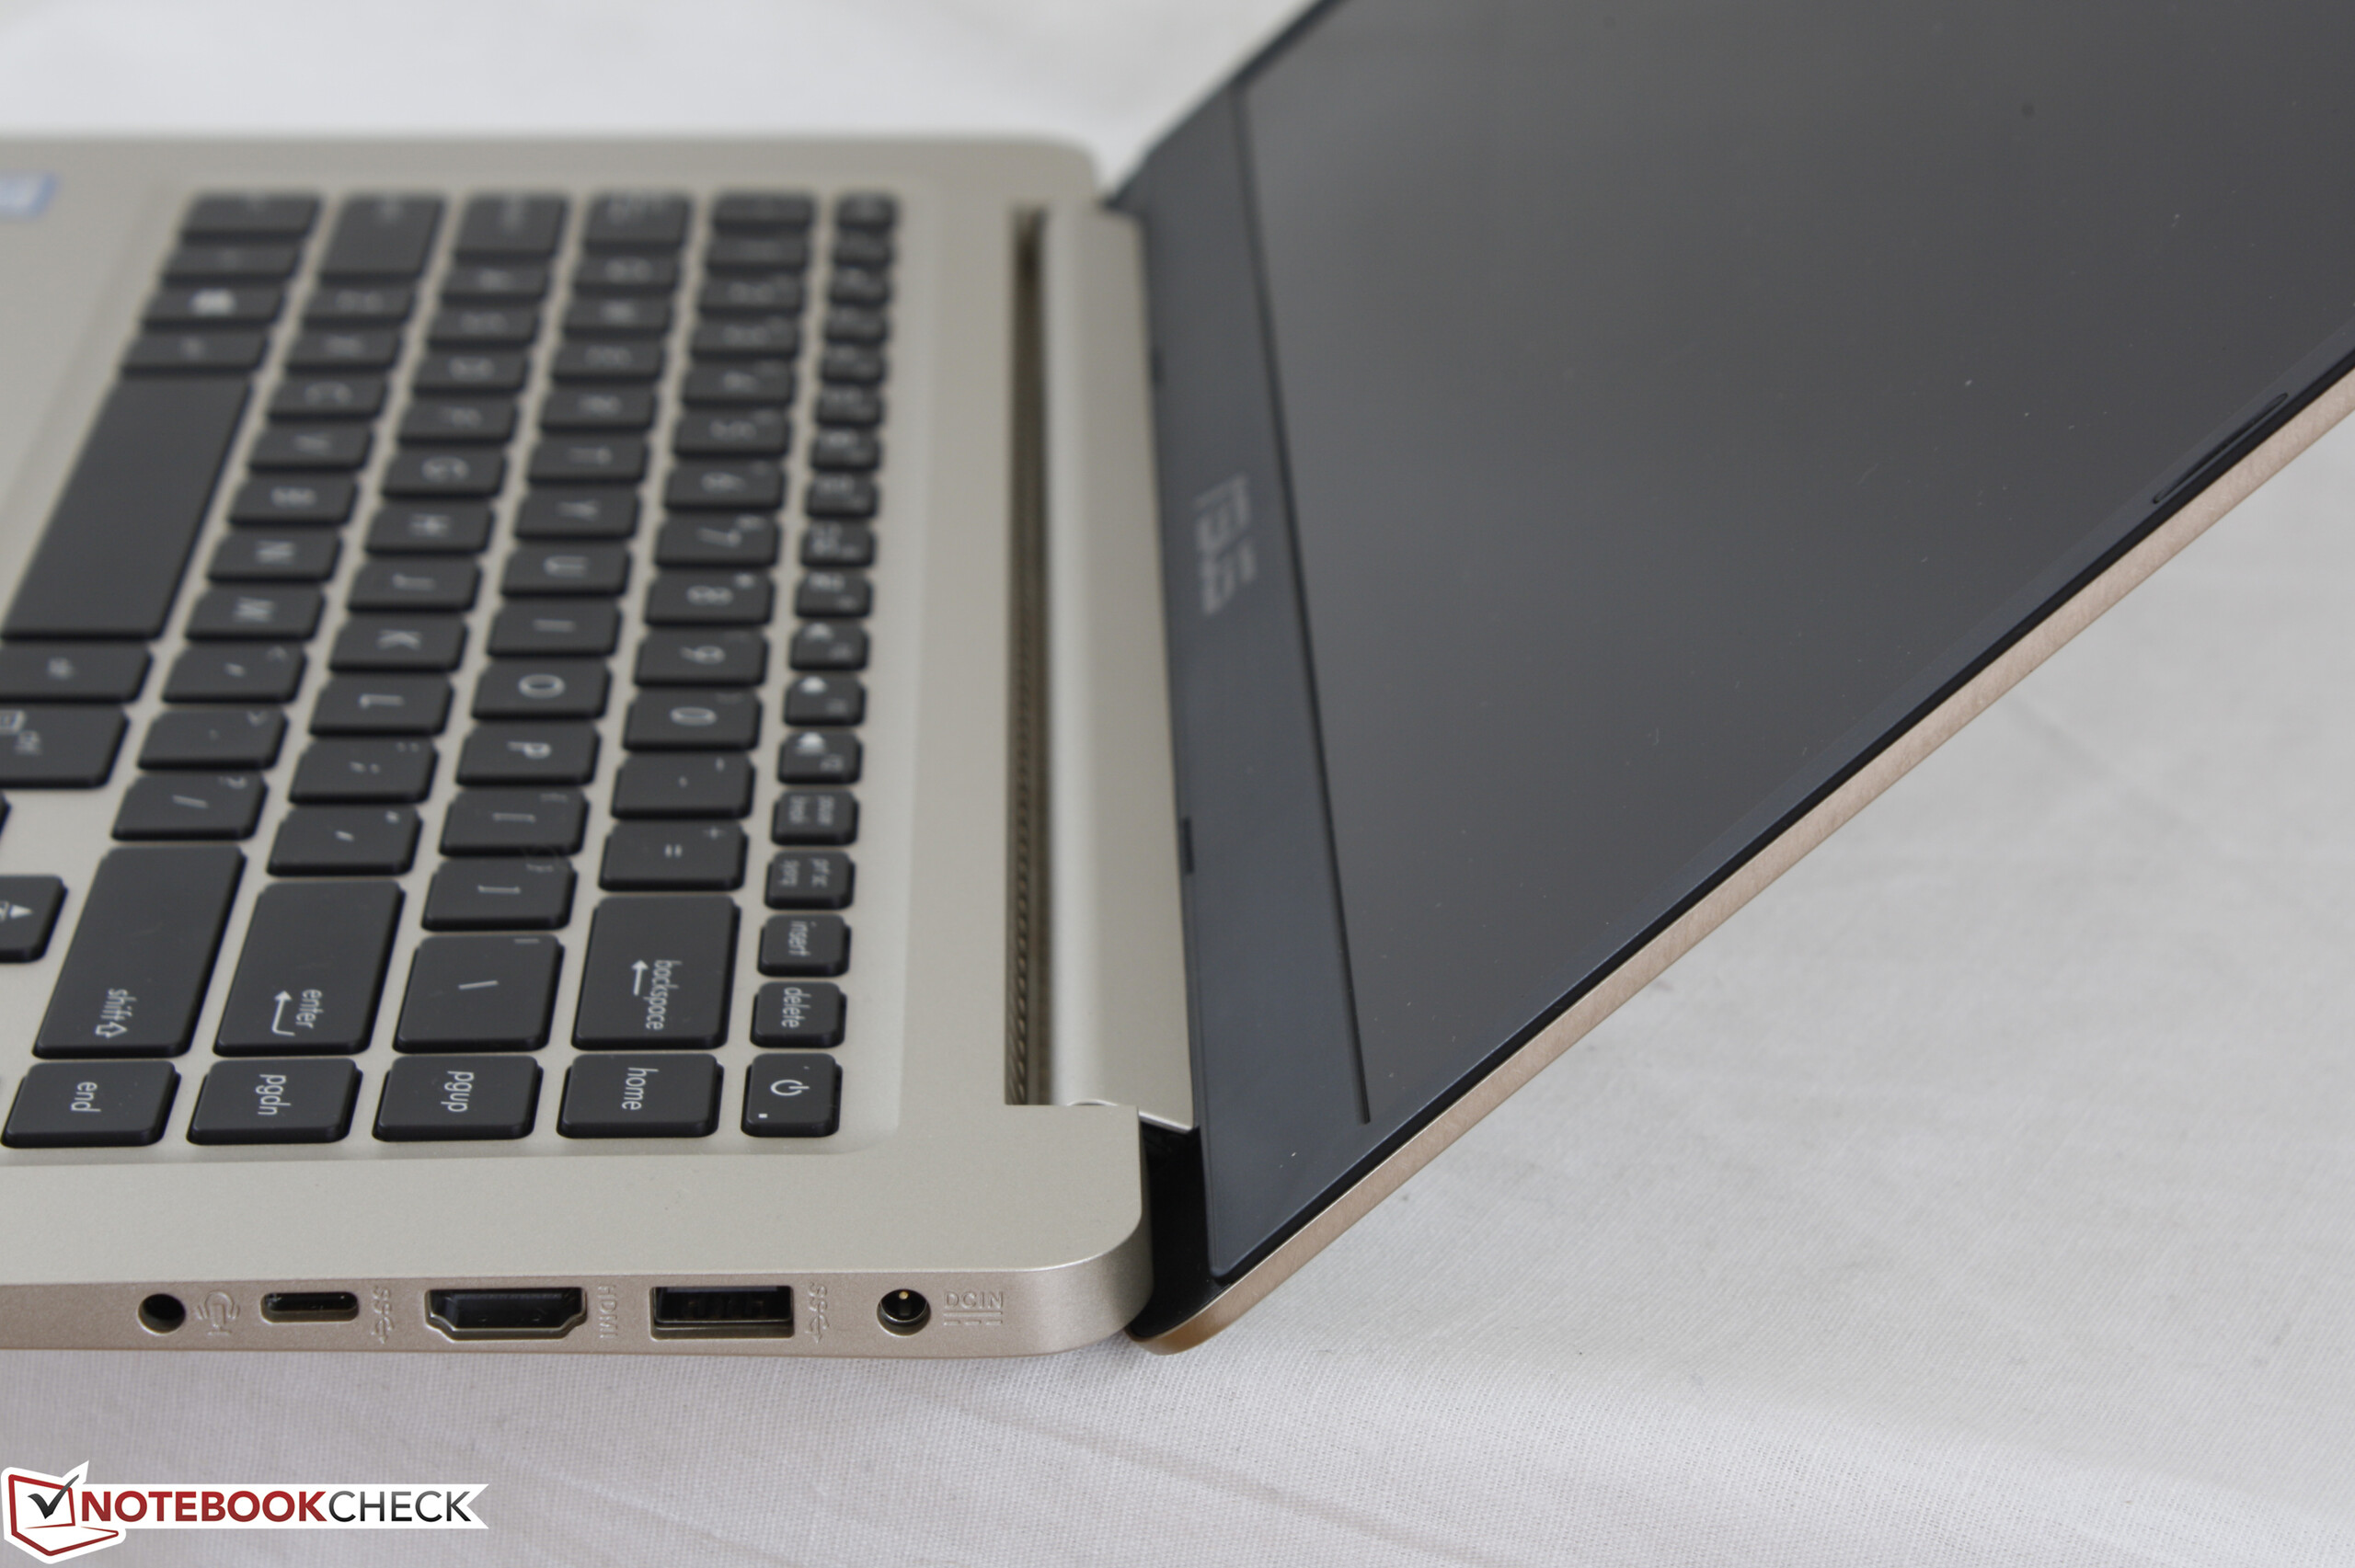
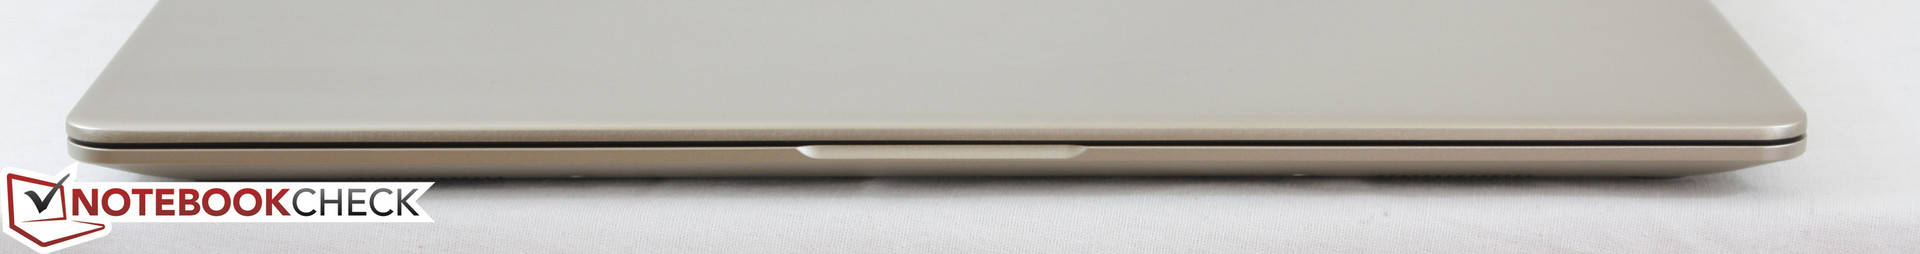
La serie VivoBook S510 era stata progettata per essere più economica rispetto alle serie ZenBook, XPS, o Spectre senza essere più pesante o meno attraente. Di fatto si tratta di un portatile economico mainstream inserito in un design super sottile. Asus è riuscita a farlo con l'S510UA a partire da meno di $1000 USD la sua base sottile conferisce una impronta più piccola rispetto ai classici portatili economici mainstream delle famiglie Pavilion, Inspiron, o IdeaPad. Siamo particolarmente contenti del fatto che non si sia risparmiato sulla qualità del display ho sulle prestazioni in quanto il processore riesce a gestire la velocità Turbo Boost senza alcun problema. La ventola relativamente silenziosa è un altro punto di forza specialmente se paragonata alle ventole più rumorose dell'XPS 15.
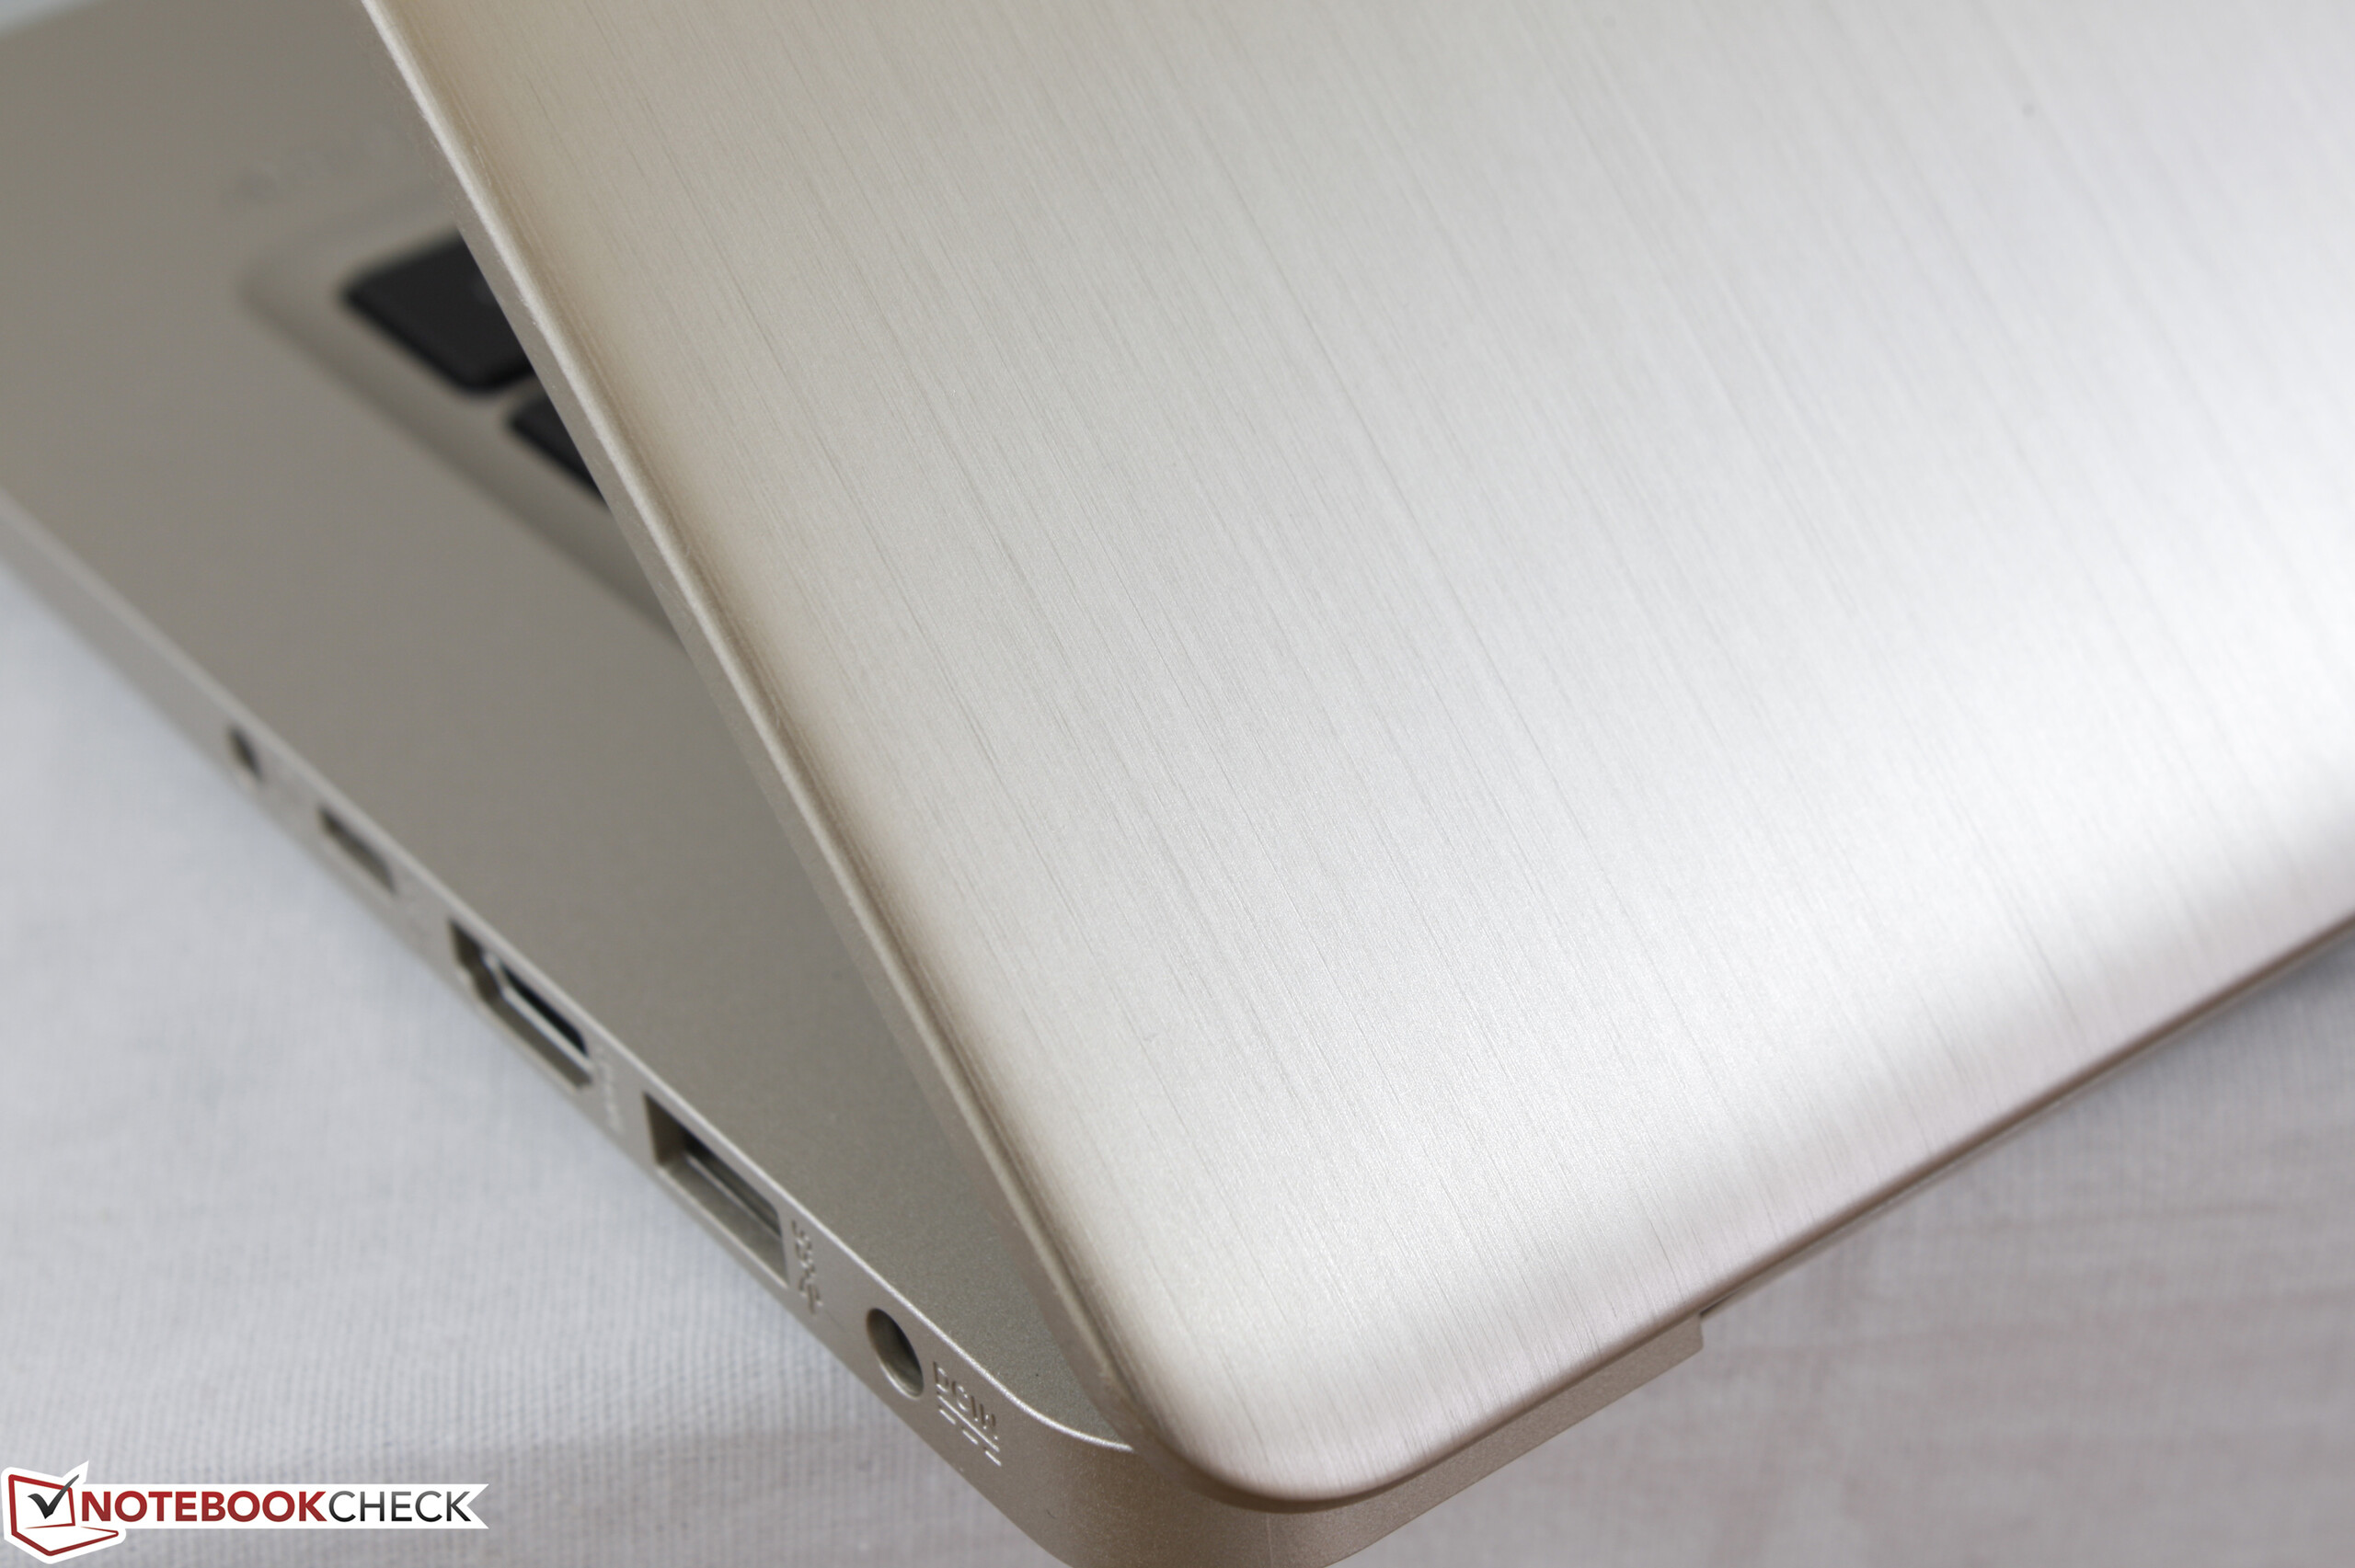
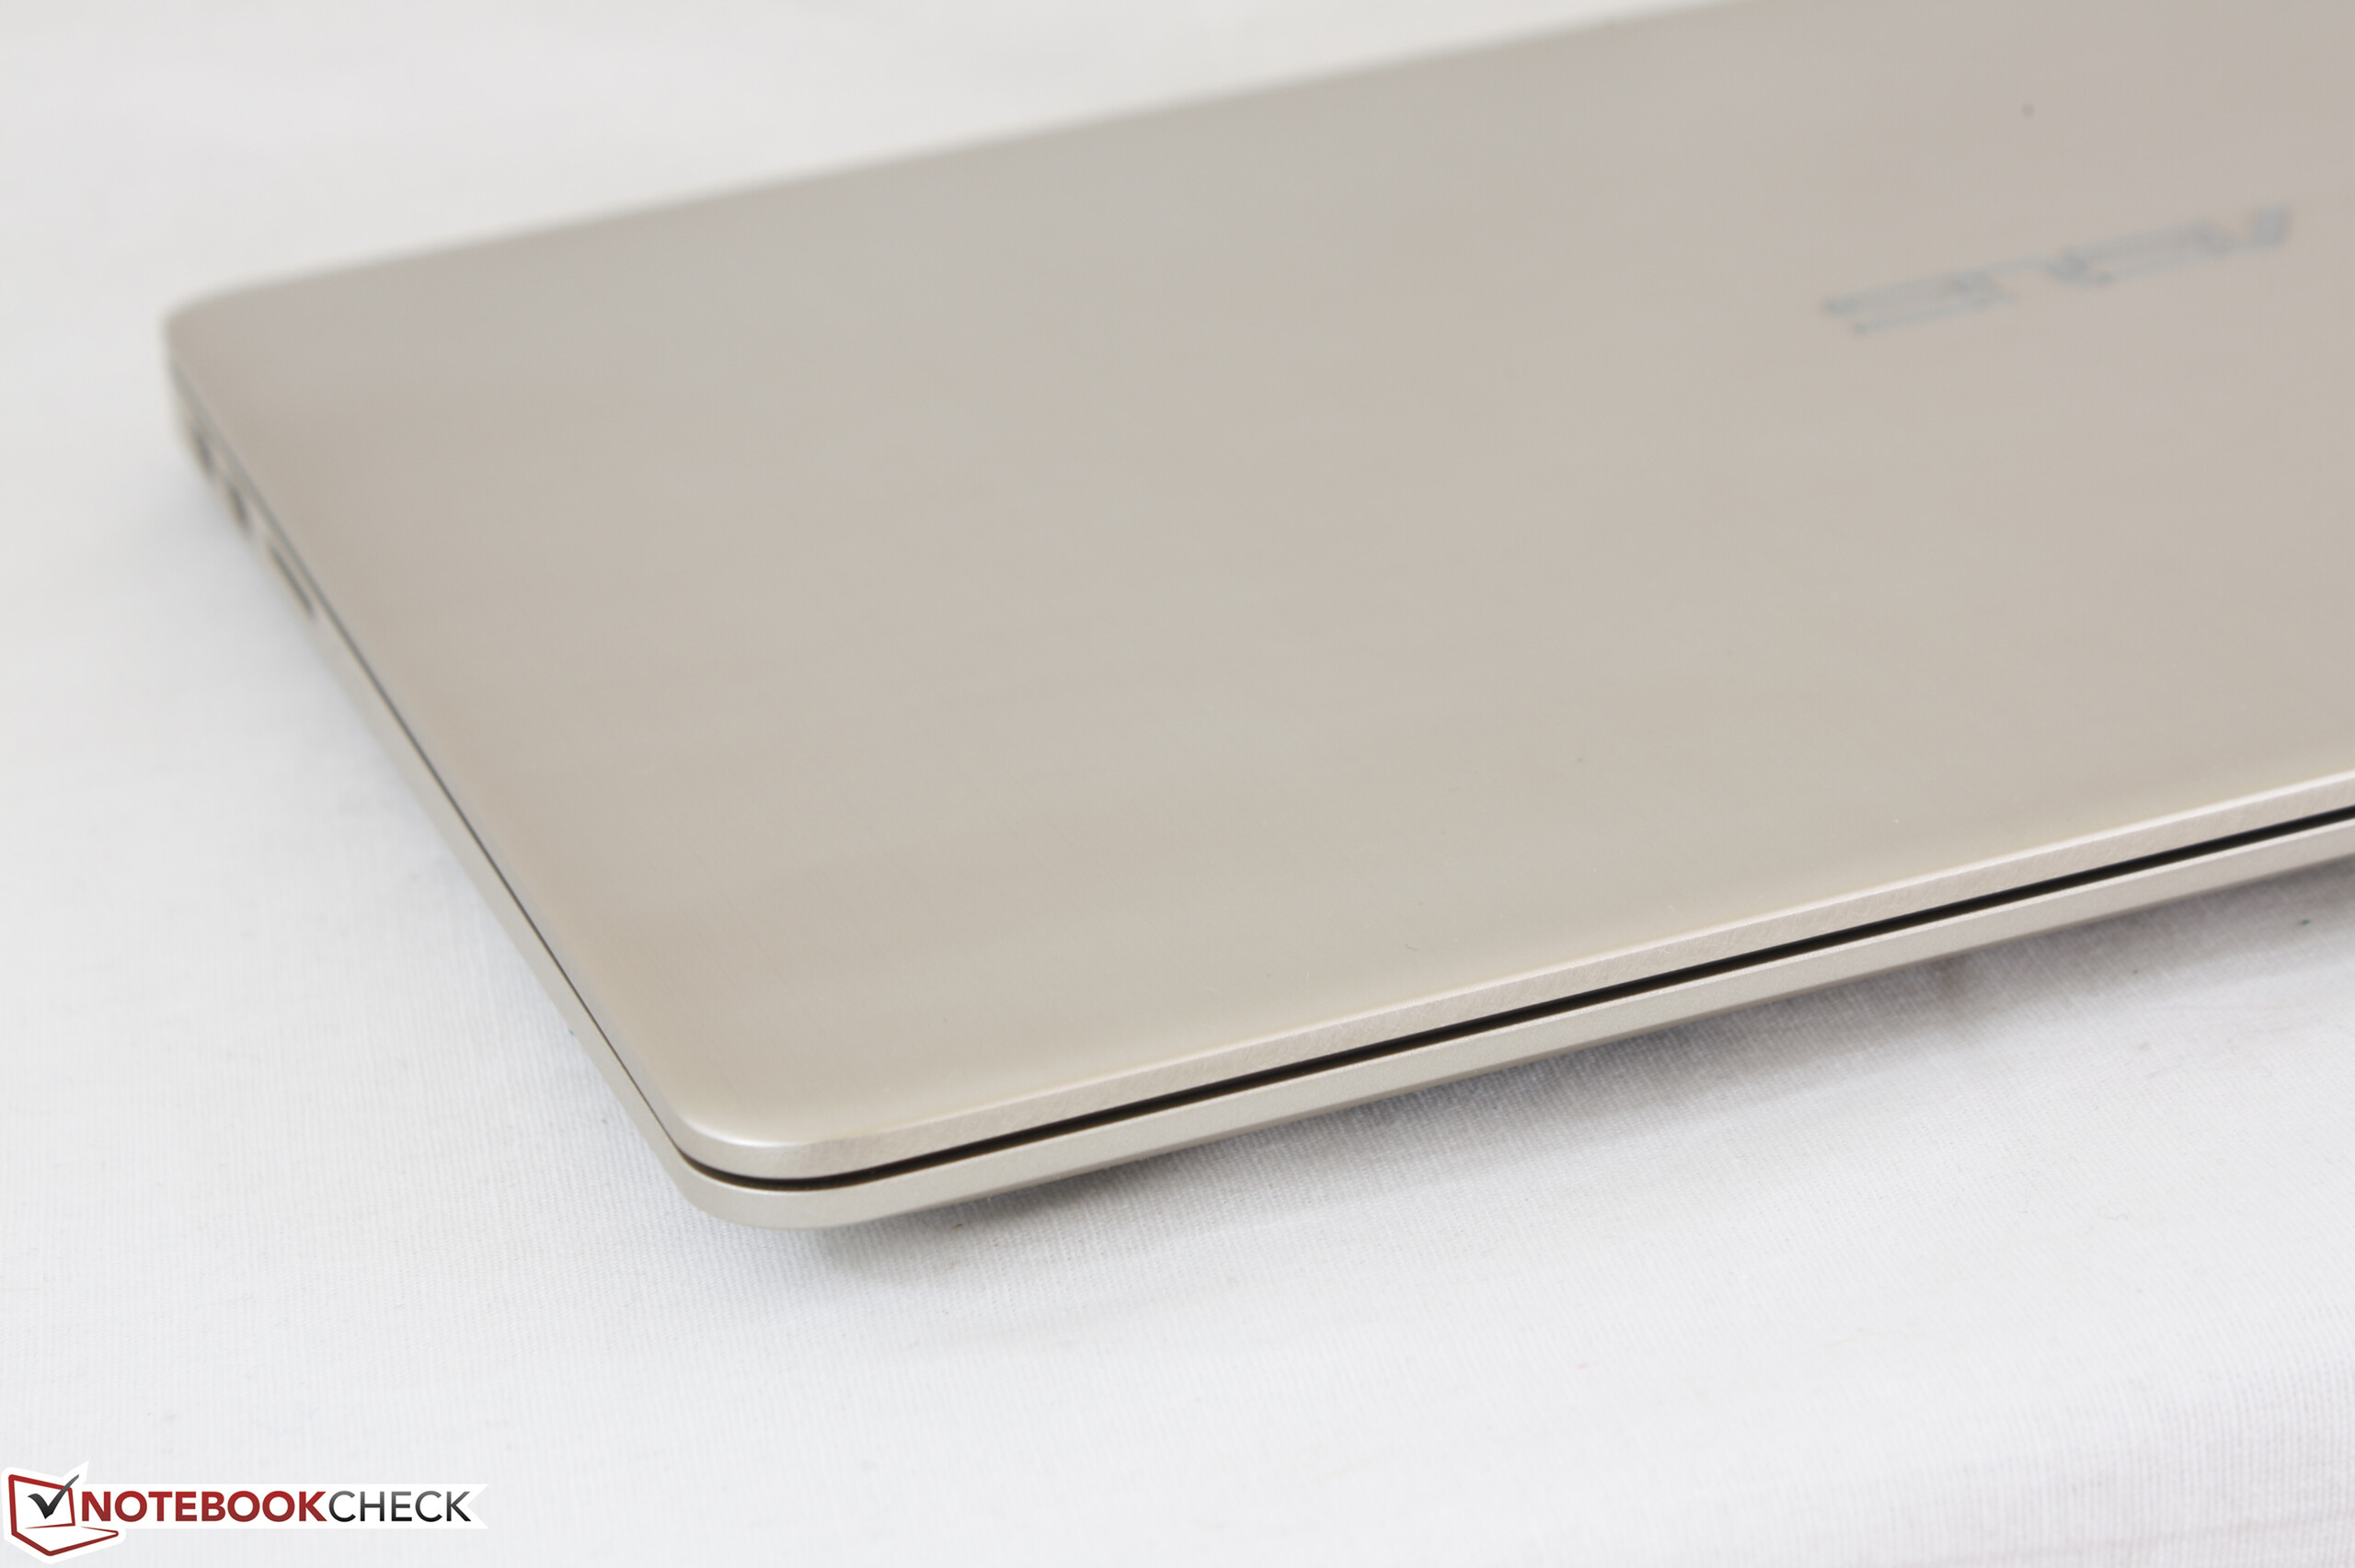
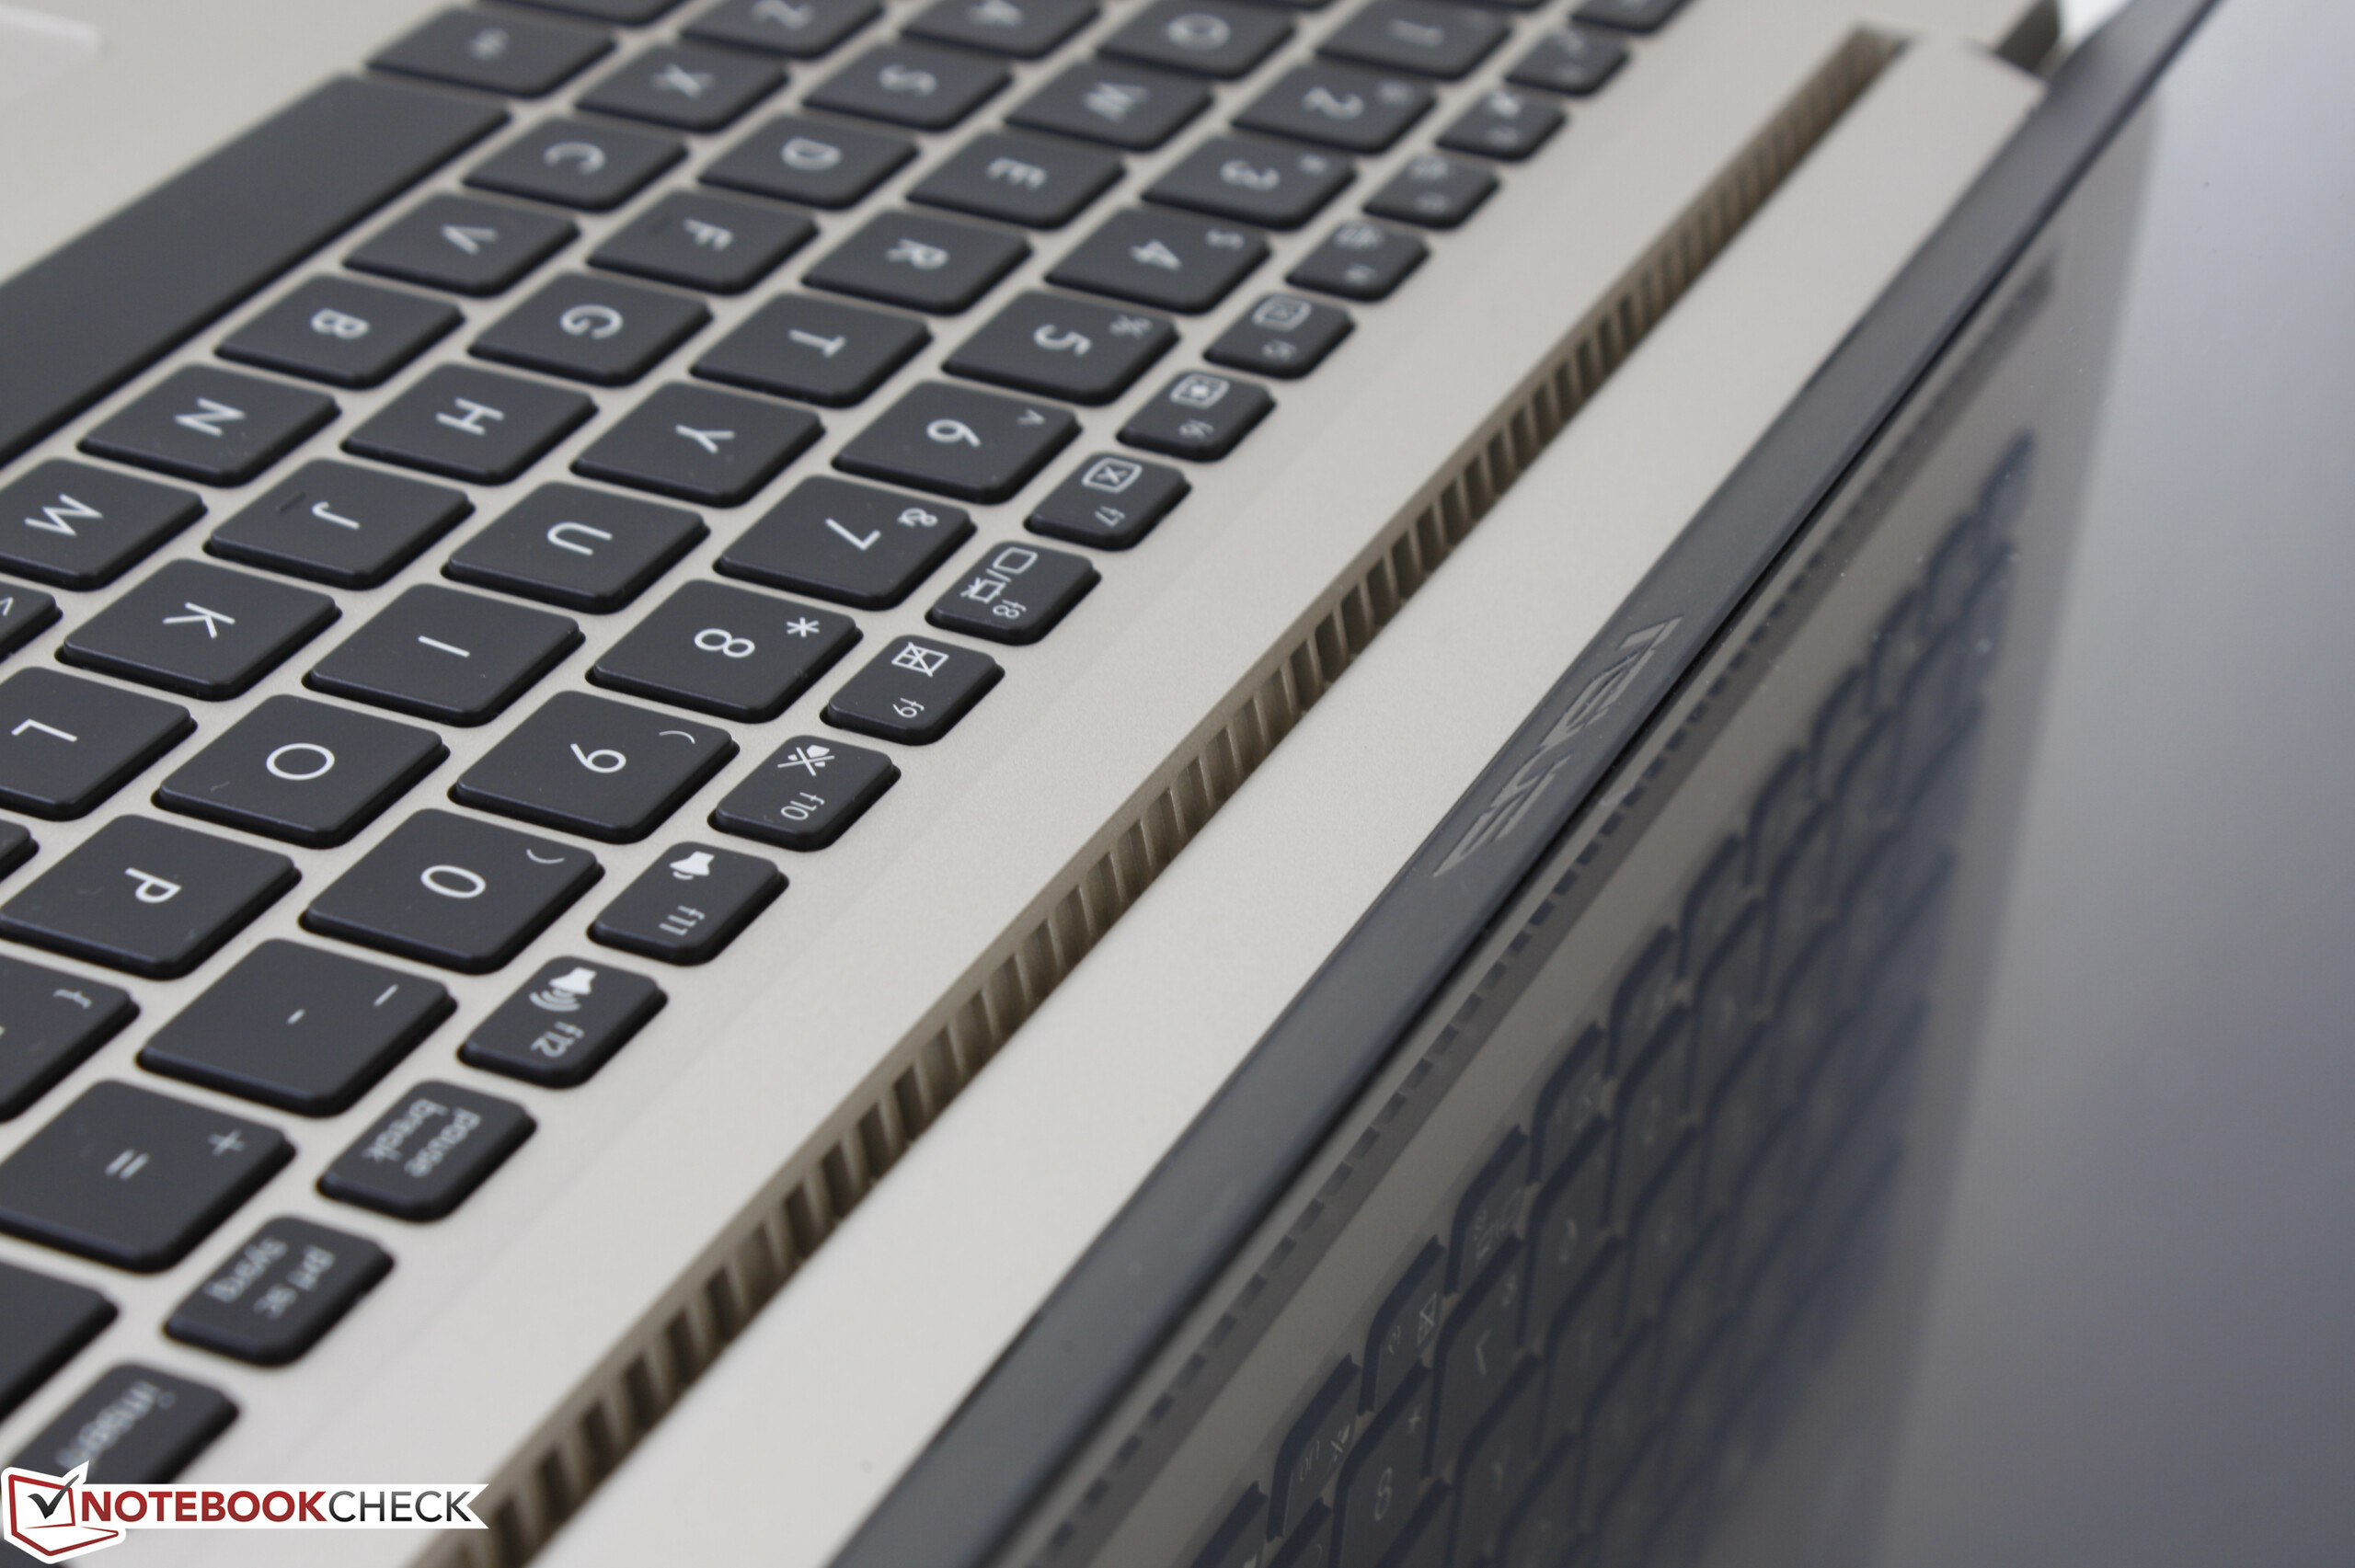
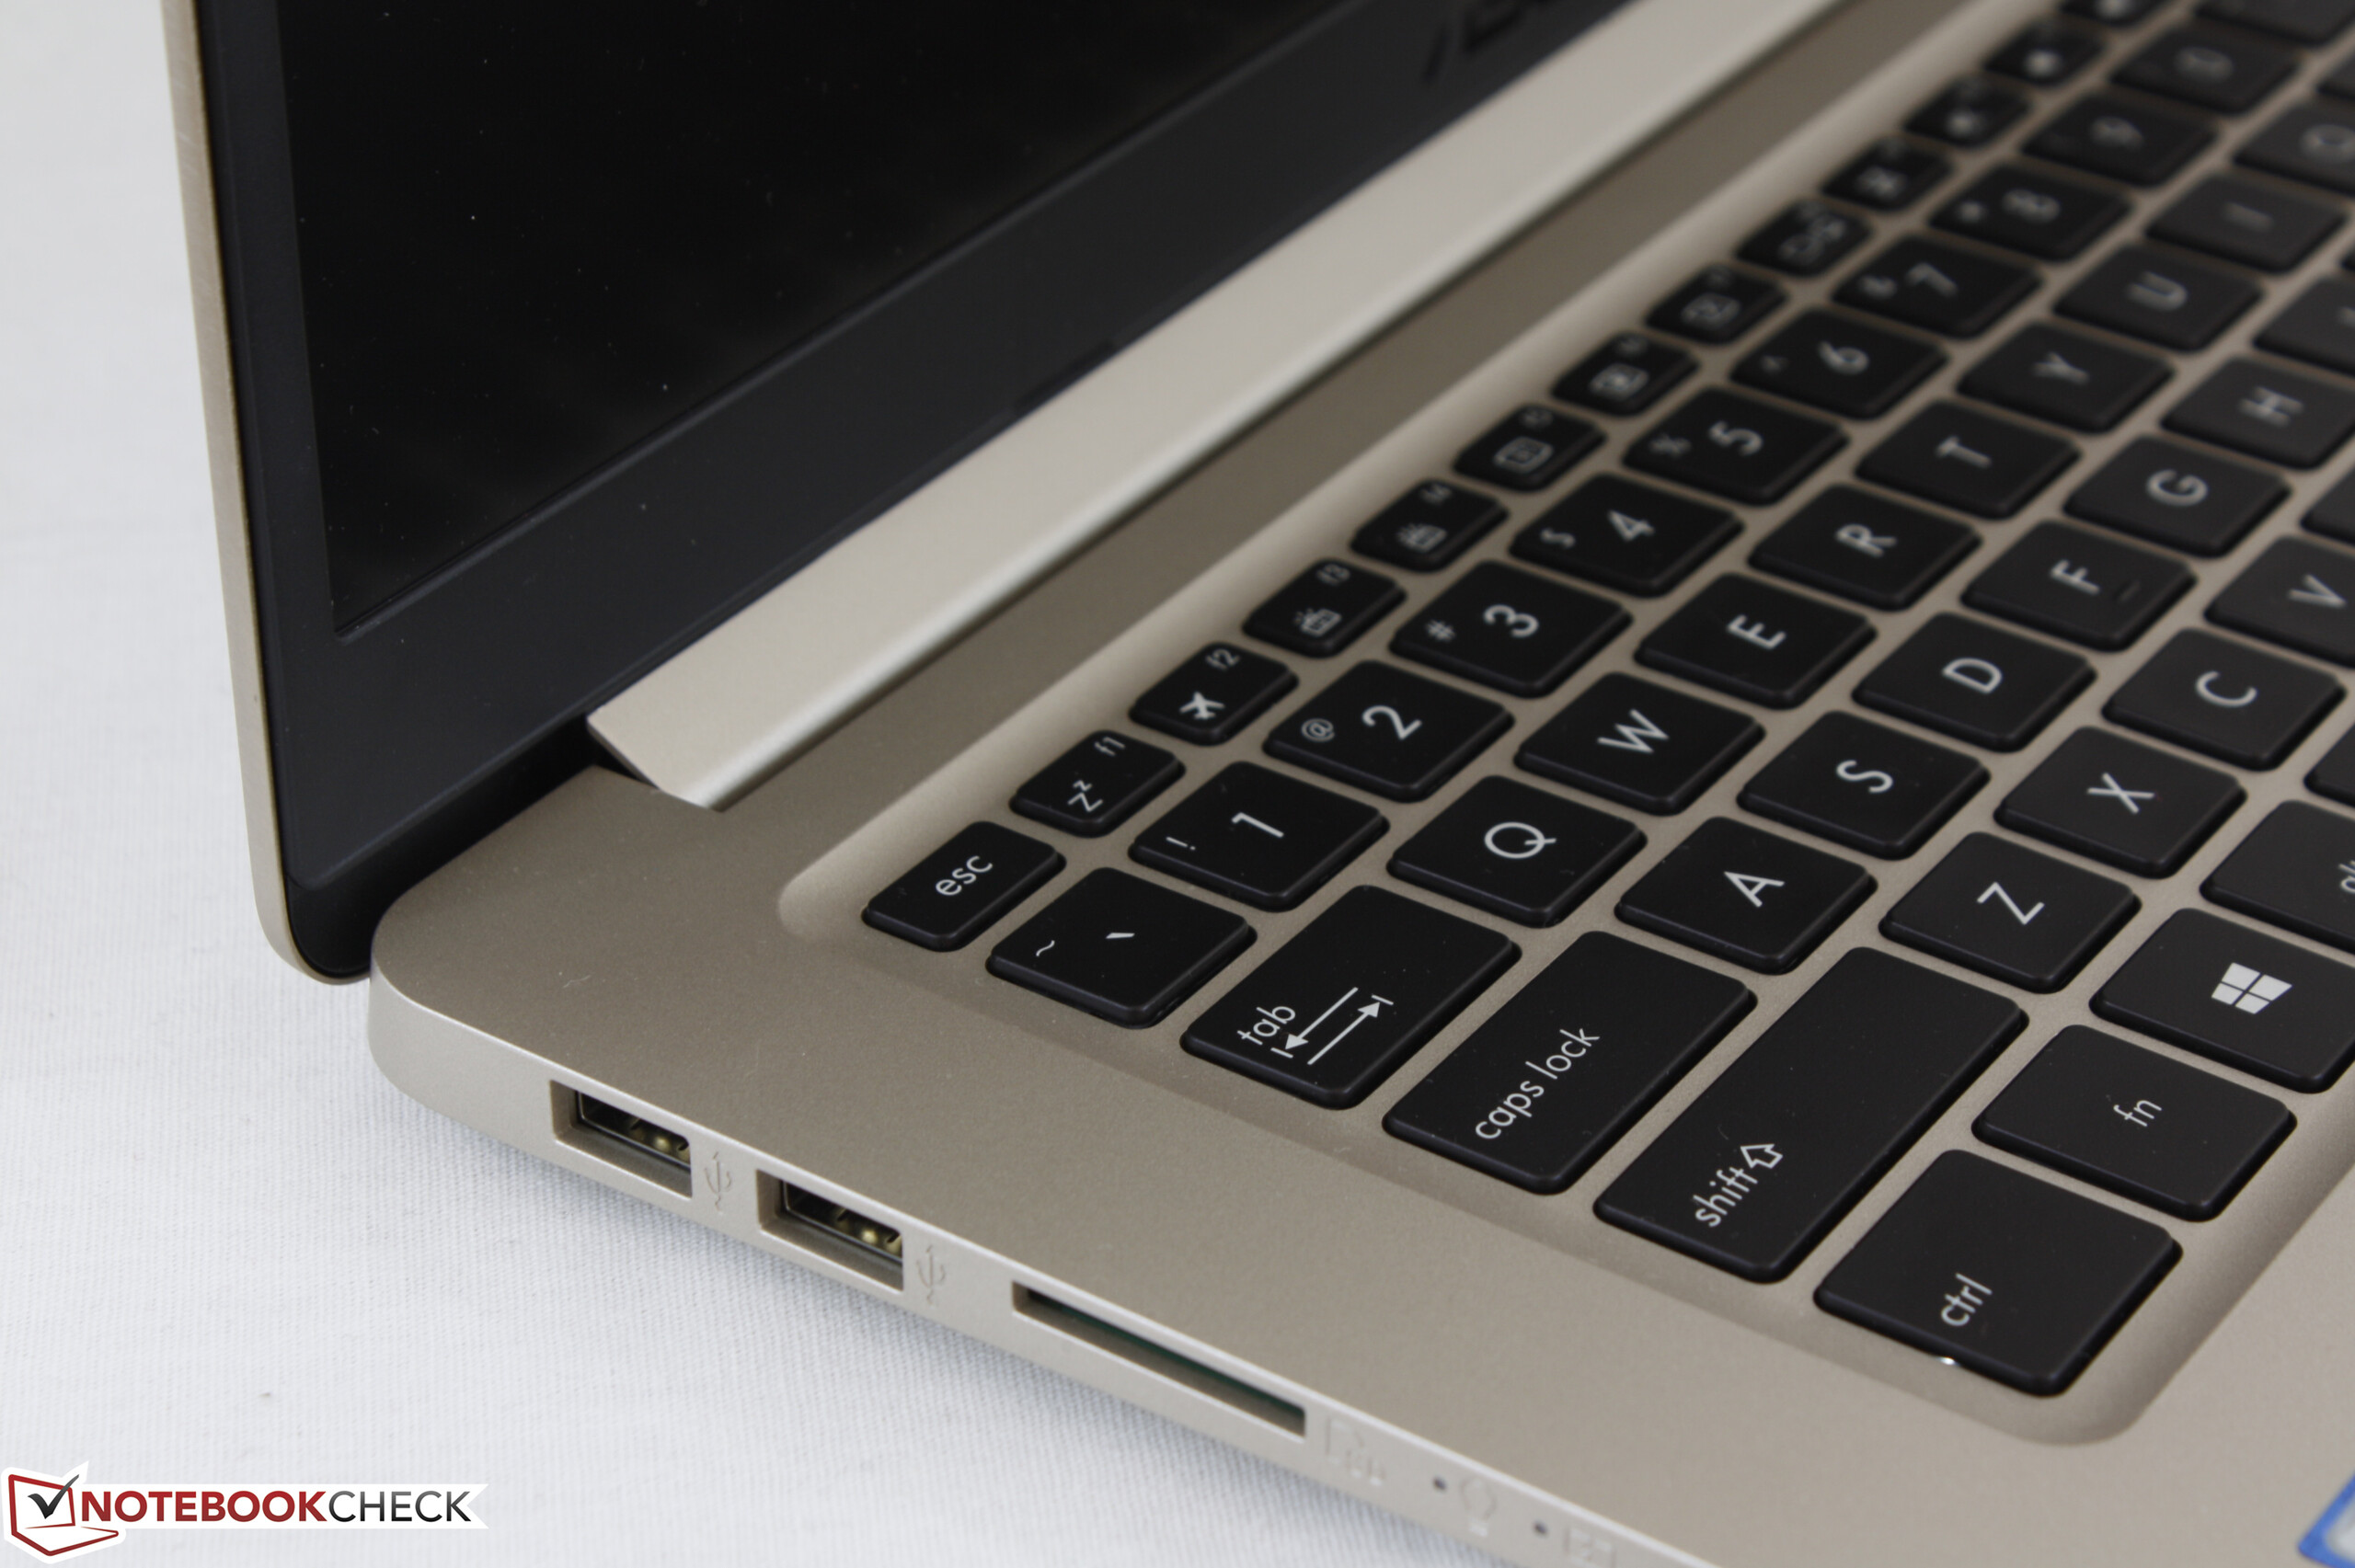
I punti deboli dell'S510UA, tuttavia sono difficili da ignorare. Il case non è molto rigido e sia la tastiera che il trackpad non risultano saldi come dovrebbero essere. Il suo case potrebbe apparire come una ammiraglia, ma non ha la solidità necessaria. L'autonomia è breve e la flessione della superficie inferiore del portatile intorno al processore evidenzia che si tratta di un design economico. Per fortuna queste piccole pecche del nostro dispositivo non possono essere considerate come problemi in genere per tutta la serie VivoBook S15, quindi testeremo altre SKUs in futuro per avere un quadro complessivo.
Possiamo assolutamente raccomandare il VivoBook S15 S510 rispetto ad un vecchio HP Pavilion 15 o alla serie Asus F se economicità e portabilità sono gli aspetti più interessanti. Per il resto, coloro che vogliono investire $200 o $300 USD in più per una SKU ZenBook, XPS, o Spectre SKU avranno un'esperienza migliore.
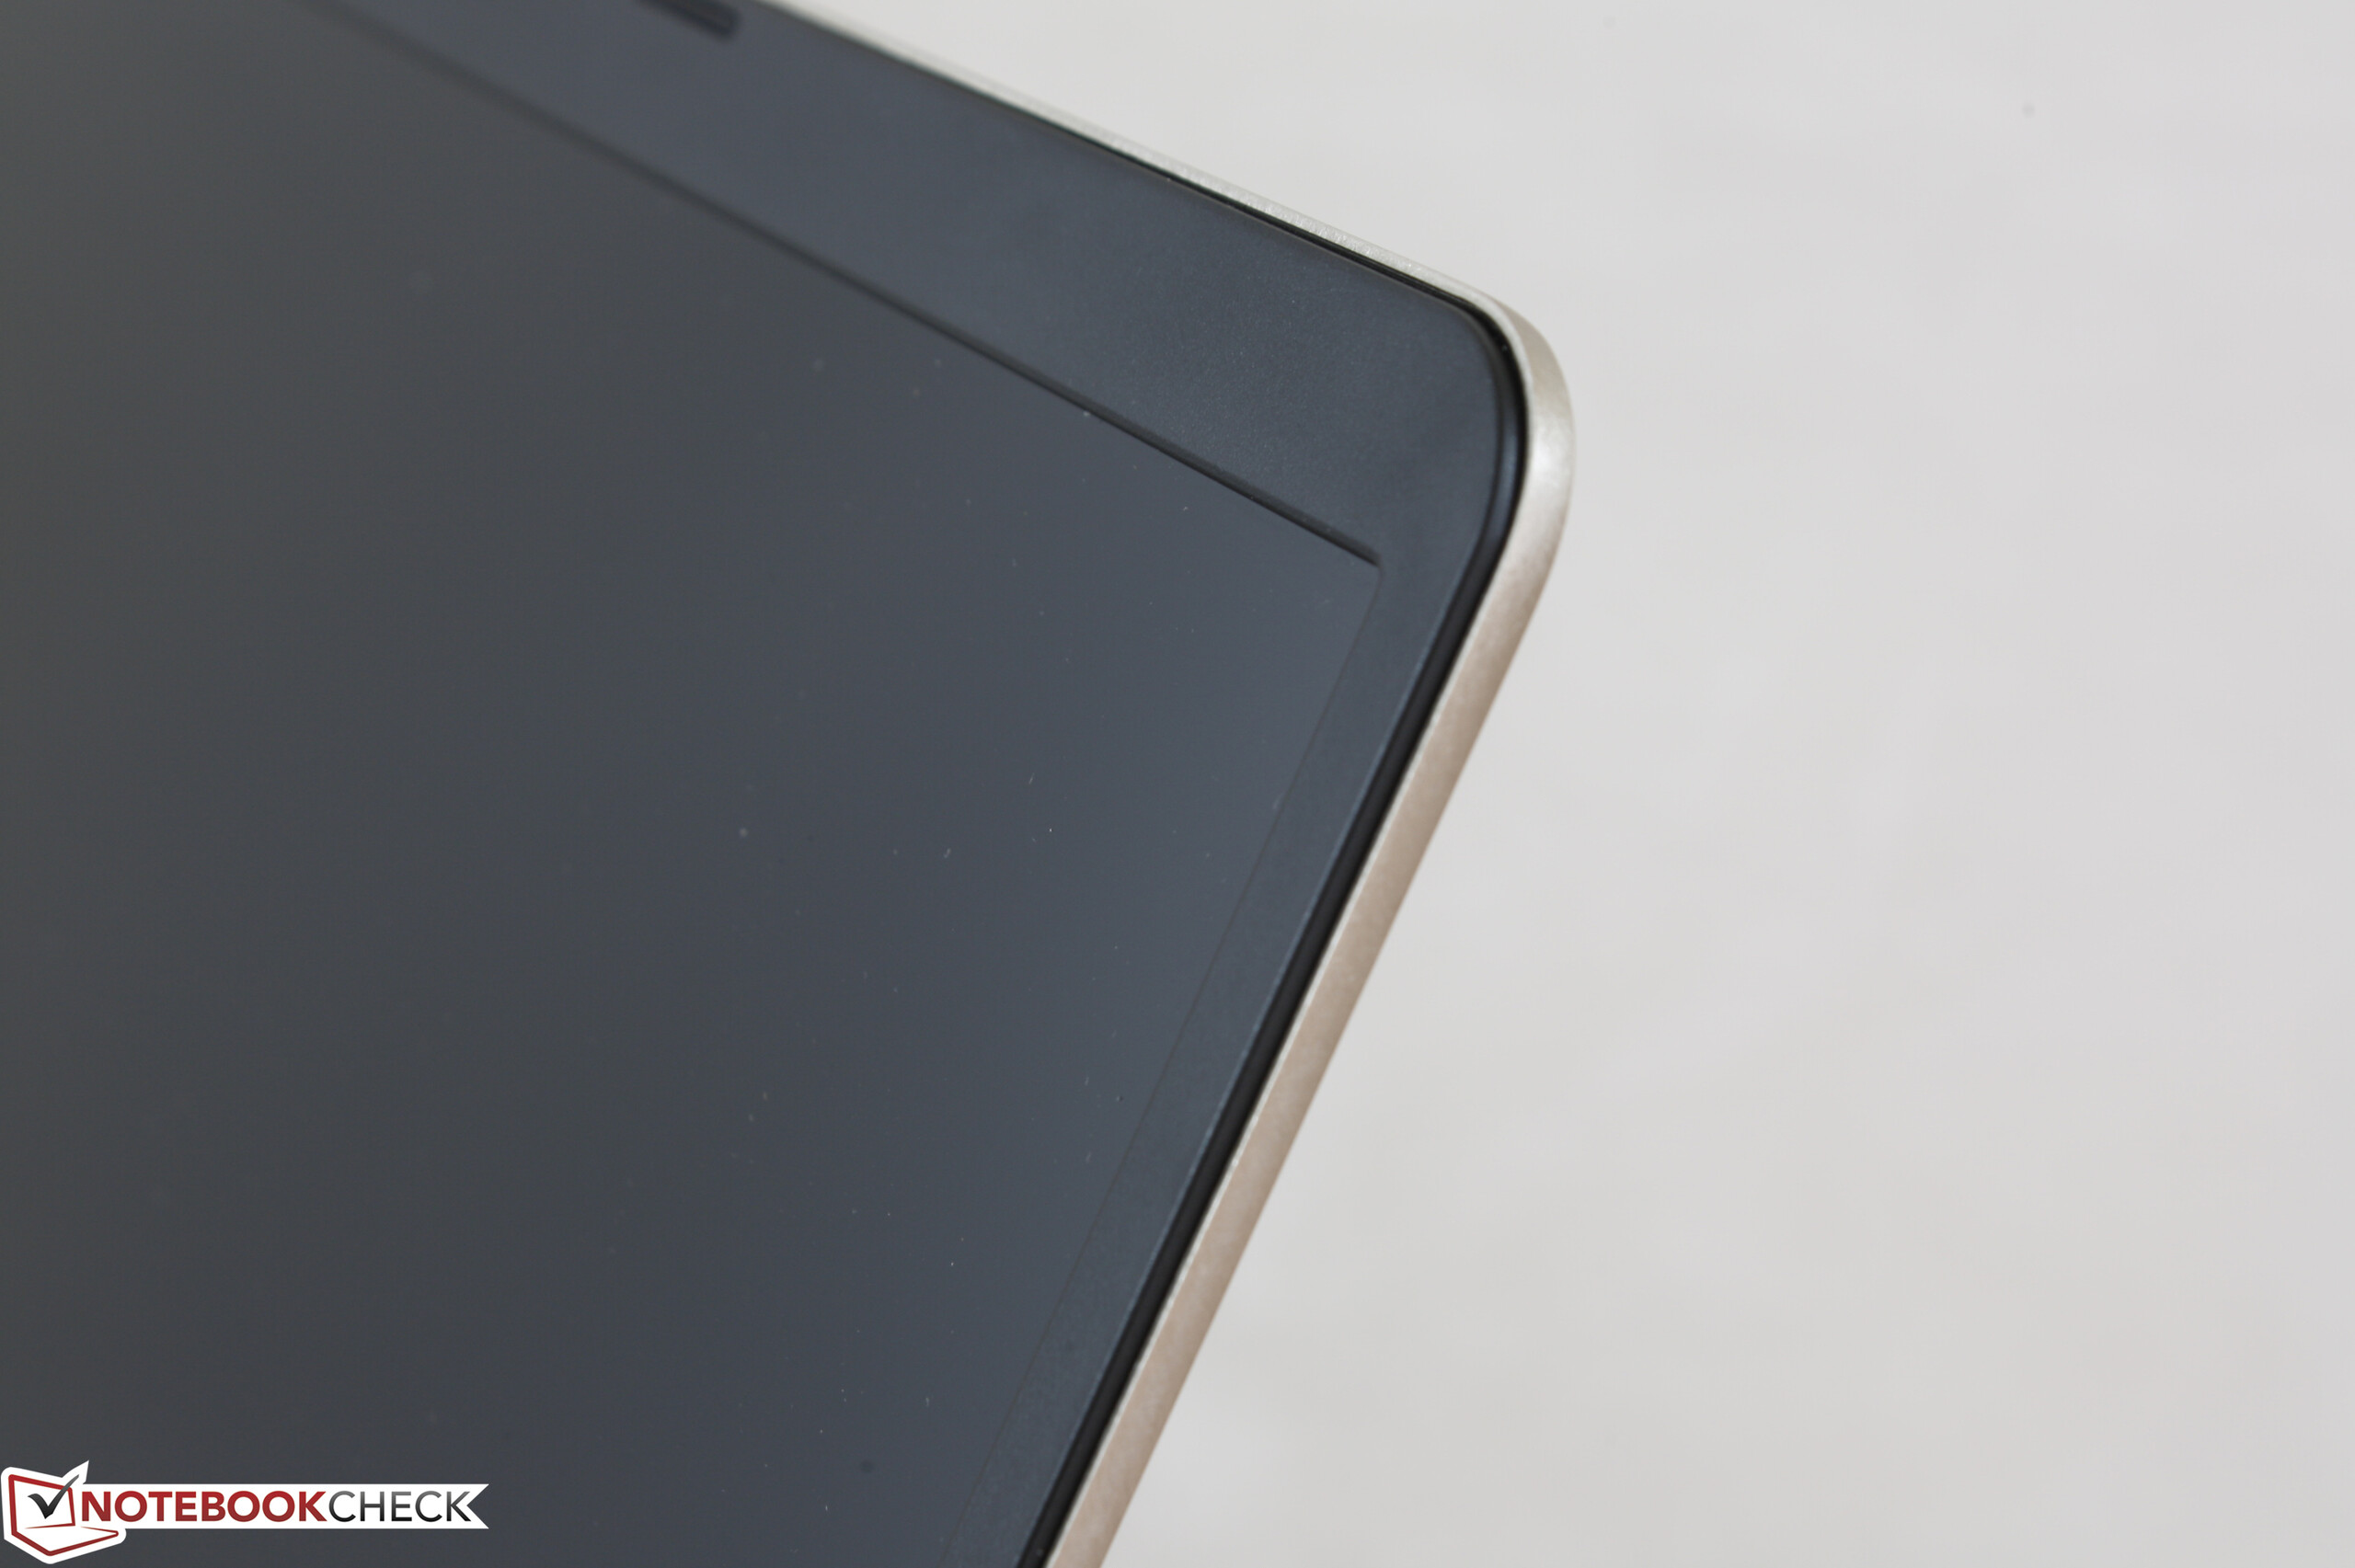
Il pesopiuma S510UA appare sobrio, con prestazioni ottime, e con un rispettabile display matto IPS 1080p. La tastiera spugnosa, l'autonomia sotto la media, e qualche anomalia dell'hardware sul nostro dispositivo di test impongono attenzione da parte dell'acquirente prima di investire sulla nuova serie VivoBook S15.
Nota: si tratta di una recensione breve, con alcune sezioni non tradotte, per la versione integrale in inglese guardate qui.
Asus VivoBook S15 S510UA
- 06/11/2017 v6 (old)
Allen Ngo
Price comparison
