Recensione breve del Portatile HP Pavilion 15t-au100 (W0P31AV)

| SD Card Reader | |
| average JPG Copy Test (av. of 3 runs) | |
| Dell XPS 15-9550 i7 | |
| HP Pavilion 15t-au100 CTO (W0P31AV) | |
| Lenovo IdeaPad 510-15IKB 80SV0087GE | |
| Acer Aspire E5-575G-549D | |
| Asus Zenbook UX510UW-CN044T | |
| maximum AS SSD Seq Read Test (1GB) | |
| Dell XPS 15-9550 i7 | |
| HP Pavilion 15t-au100 CTO (W0P31AV) | |
| Acer Aspire E5-575G-549D | |
| Asus Zenbook UX510UW-CN044T | |
| Lenovo IdeaPad 510-15IKB 80SV0087GE | |
| Networking | |
| Wi-Fi Client 1m 512KB | |
| Wi-Fi Server 1m 512KB |
| |||||||||||||||||||||||||
Distribuzione della luminosità: 69 %
Al centro con la batteria: 186.5 cd/m²
Contrasto: 1036:1 (Nero: 0.18 cd/m²)
ΔE ColorChecker Calman: 5.7 | ∀{0.5-29.43 Ø4.73}
ΔE Greyscale Calman: 4.4 | ∀{0.09-98 Ø4.97}
64.95% sRGB (Argyll 1.6.3 3D)
44.71% AdobeRGB 1998 (Argyll 1.6.3 3D)
44.71% AdobeRGB 1998 (Argyll 3D)
64.9% sRGB (Argyll 3D)
43.27% Display P3 (Argyll 3D)
Gamma: 2.35
CCT: 6963 K
| HP Pavilion 15t-au100 CTO (W0P31AV) BOE0693, IPS, 15.6", 1920x1080 | Asus Zenbook UX510UW-CN044T LG Philips LP156WF6-SPB6, IPS, 15.6", 1920x1080 | Lenovo IdeaPad 510-15IKB 80SV0087GE BOE HF NV156FHM-N42, IPS, 15.6", 1920x1080 | Acer Aspire E5-575G-549D Chi Mei CMN15C4, TN, 15.6", 1920x1080 | HP Pavilion 15 UHD T9Y85AV SDC5958, IPS, 15.6", 3840x2160 | |
|---|---|---|---|---|---|
| Display | 33% | -1% | -11% | 36% | |
| Display P3 Coverage (%) | 43.27 | 61.5 42% | 42.66 -1% | 38.57 -11% | 60 39% |
| sRGB Coverage (%) | 64.9 | 80.4 24% | 64.1 -1% | 57.4 -12% | 85.8 32% |
| AdobeRGB 1998 Coverage (%) | 44.71 | 58.8 32% | 44.08 -1% | 39.89 -11% | 61.8 38% |
| Response Times | 14% | -17% | 18% | 13% | |
| Response Time Grey 50% / Grey 80% * (ms) | 42 ? | 40 ? 5% | 51 ? -21% | 39 ? 7% | 39.6 ? 6% |
| Response Time Black / White * (ms) | 33.6 ? | 26 ? 23% | 38 ? -13% | 24 ? 29% | 27.2 ? 19% |
| PWM Frequency (Hz) | 198.4 | 50 ? | 1282 ? | ||
| Screen | 16% | 21% | -35% | 10% | |
| Brightness middle (cd/m²) | 186.5 | 326 75% | 291 56% | 176 -6% | 336.2 80% |
| Brightness (cd/m²) | 174 | 316 82% | 265 52% | 169 -3% | 323 86% |
| Brightness Distribution (%) | 69 | 80 16% | 86 25% | 91 32% | 87 26% |
| Black Level * (cd/m²) | 0.18 | 0.35 -94% | 0.23 -28% | 0.47 -161% | 0.629 -249% |
| Contrast (:1) | 1036 | 931 -10% | 1265 22% | 374 -64% | 534 -48% |
| Colorchecker dE 2000 * | 5.7 | 5.49 4% | 4.78 16% | 8.83 -55% | 3.32 42% |
| Colorchecker dE 2000 max. * | 22.5 | 11.36 50% | 9.51 58% | 14.01 38% | 7.4 67% |
| Greyscale dE 2000 * | 4.4 | 4.84 -10% | 3.49 21% | 8.97 -104% | 2.88 35% |
| Gamma | 2.35 94% | 2.23 99% | 2.58 85% | 2.43 91% | 2.34 94% |
| CCT | 6963 93% | 5971 109% | 6013 108% | 10234 64% | 6279 104% |
| Color Space (Percent of AdobeRGB 1998) (%) | 44.71 | 53 19% | 40 -11% | 36.8 -18% | 55.3 24% |
| Color Space (Percent of sRGB) (%) | 64.95 | 80 23% | 64 -1% | 57.3 -12% | 85.5 32% |
| Media totale (Programma / Settaggio) | 21% /
19% | 1% /
12% | -9% /
-23% | 20% /
15% |
* ... Meglio usare valori piccoli
Tempi di risposta del Display
| ↔ Tempi di risposta dal Nero al Bianco | ||
|---|---|---|
| 33.6 ms ... aumenta ↗ e diminuisce ↘ combinato | ↗ 7.6 ms Incremento | 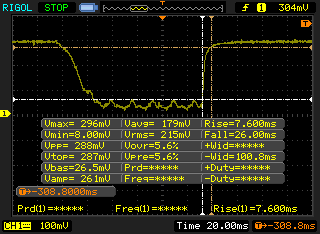 |
| ↘ 26 ms Calo | ||
| Lo schermo mostra tempi di risposta lenti nei nostri tests e sarà insoddisfacente per i gamers. In confronto, tutti i dispositivi di test variano da 0.1 (minimo) a 240 (massimo) ms. » 90 % di tutti i dispositivi è migliore. Questo significa che i tempi di risposta rilevati sono peggiori rispetto alla media di tutti i dispositivi testati (19.9 ms). | ||
| ↔ Tempo di risposta dal 50% Grigio all'80% Grigio | ||
| 42 ms ... aumenta ↗ e diminuisce ↘ combinato | ↗ 13.2 ms Incremento | 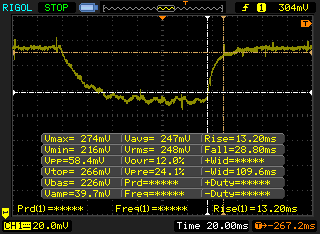 |
| ↘ 28.8 ms Calo | ||
| Lo schermo mostra tempi di risposta lenti nei nostri tests e sarà insoddisfacente per i gamers. In confronto, tutti i dispositivi di test variano da 0.165 (minimo) a 636 (massimo) ms. » 67 % di tutti i dispositivi è migliore. Questo significa che i tempi di risposta rilevati sono peggiori rispetto alla media di tutti i dispositivi testati (31.1 ms). | ||
Sfarfallio dello schermo / PWM (Pulse-Width Modulation)
| flickering dello schermo / PWM rilevato | 198.4 Hz | 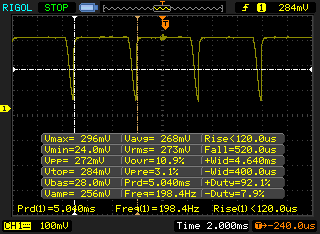 | |
Il display sfarfalla a 198.4 Hz (Probabilmente a causa dell'uso di PWM) . La frequenza di 198.4 Hz è relativamente bassa, quindi gli utenti sensibili potrebbero notare il flickering ed accusare stanchezza agli occhi a questo livello di luminosità e a livelli inferiori. In confronto: 52 % di tutti i dispositivi testati non utilizza PWM per ridurre la luminosita' del display. Se è rilevato PWM, una media di 7801 (minimo: 5 - massimo: 343500) Hz è stata rilevata. | |||
| wPrime 2.10 - 1024m | |
| HP Pavilion 15t-au100 CTO (W0P31AV) | |
| Acer Aspire E5-575G-549D | |
| Dell XPS 15 9550 i7 FHD | |
| HP Pavilion 15 UHD T9Y85AV | |
| Super Pi Mod 1.5 XS 32M - 32M | |
| Acer Aspire E5-575G-549D | |
| HP Pavilion 15t-au100 CTO (W0P31AV) | |
| Dell XPS 15 9550 i7 FHD | |
| HP Pavilion 15 UHD T9Y85AV | |
* ... Meglio usare valori piccoli
| PCMark 8 Home Score Accelerated v2 | 3424 punti | |
| PCMark 8 Creative Score Accelerated v2 | 4089 punti | |
| PCMark 8 Work Score Accelerated v2 | 4340 punti | |
Aiuto | ||
| HP Pavilion 15t-au100 CTO (W0P31AV) Toshiba MQ01ABD100 | Acer Aspire E5-575G-549D Toshiba MQ01ABD100 | Lenovo IdeaPad 510-15IKB 80SV0087GE Liteonit CV3-DE256 | Asus Zenbook UX510UW-CN044T SanDisk SD8SNAT256G1002 | Dell XPS 15 9550 i7 FHD Samsung PM951 NVMe 512 GB | HP Pavilion 15 UHD T9Y85AV SanDisk Z400s SD8SNAT-128G | |
|---|---|---|---|---|---|---|
| CrystalDiskMark 3.0 | -20% | 10956% | 7338% | 16558% | 6457% | |
| Read Seq (MB/s) | 109.5 | 95.3 -13% | 469.2 328% | 459.3 319% | 1291 1079% | 484.6 343% |
| Write Seq (MB/s) | 105.2 | 85.6 -19% | 431.5 310% | 325.5 209% | 590 461% | 185.2 76% |
| Read 512 (MB/s) | 34.08 | 29.32 -14% | 338.3 893% | 279.2 719% | 632 1754% | 307.6 803% |
| Write 512 (MB/s) | 40.02 | 25.93 -35% | 297.9 644% | 280.1 600% | 588 1369% | 180 350% |
| Read 4k (MB/s) | 0.429 | 0.366 -15% | 28.68 6585% | 22.43 5128% | 41.4 9550% | 22.08 5047% |
| Write 4k (MB/s) | 1.008 | 0.726 -28% | 66.8 6527% | 74.9 7331% | 132.4 13035% | 77.7 7608% |
| Read 4k QD32 (MB/s) | 0.81 | 0.647 -20% | 364.7 44925% | 149 18295% | 542 66814% | 143.7 17641% |
| Write 4k QD32 (MB/s) | 0.893 | 0.722 -19% | 245.9 27436% | 234 26104% | 343.8 38399% | 177.6 19788% |

| 3DMark | |
| 1280x720 Cloud Gate Standard Graphics | |
| Dell XPS 15 9550 i7 FHD | |
| HP Pavilion 15 UHD T9Y85AV | |
| Asus Zenbook UX510UW-CN044T | |
| Acer Aspire E5-575G-549D | |
| HP Pavilion 15t-au100 CTO (W0P31AV) | |
| 1920x1080 Fire Strike Graphics | |
| HP Pavilion 15 UHD T9Y85AV | |
| Dell XPS 15 9550 i7 FHD | |
| Asus Zenbook UX510UW-CN044T | |
| Acer Aspire E5-575G-549D | |
| HP Pavilion 15t-au100 CTO (W0P31AV) | |
| 1920x1080 Ice Storm Extreme Graphics | |
| Dell XPS 15 9550 i7 FHD | |
| Asus Zenbook UX510UW-CN044T | |
| HP Pavilion 15 UHD T9Y85AV | |
| 3DMark 11 Performance | 2622 punti | |
| 3DMark Cloud Gate Standard Score | 7017 punti | |
| 3DMark Fire Strike Score | 1538 punti | |
| 3DMark Fire Strike Extreme Score | 777 punti | |
Aiuto | ||
| Rise of the Tomb Raider | |
| 1024x768 Lowest Preset (ordina per valore) | |
| HP Pavilion 15t-au100 CTO (W0P31AV) | |
| Acer Aspire E5-575G-549D | |
| 1366x768 Medium Preset AF:2x (ordina per valore) | |
| HP Pavilion 15t-au100 CTO (W0P31AV) | |
| Acer Aspire E5-575G-549D | |
| 1920x1080 High Preset AA:FX AF:4x (ordina per valore) | |
| HP Pavilion 15t-au100 CTO (W0P31AV) | |
| Acer Aspire E5-575G-549D | |
| Dell XPS 15 9550 i7 FHD | |
| HP Pavilion 15 UHD T9Y85AV | |
| 1920x1080 Very High Preset AA:FX AF:16x (ordina per valore) | |
| HP Pavilion 15t-au100 CTO (W0P31AV) | |
| Acer Aspire E5-575G-549D | |
| Dell XPS 15 9550 i7 FHD | |
| HP Pavilion 15 UHD T9Y85AV | |
| GRID 2 | |
| 1024x768 Ultra Low Preset (ordina per valore) | |
| HP Pavilion 15t-au100 CTO (W0P31AV) | |
| 1366x768 Medium Preset (ordina per valore) | |
| HP Pavilion 15t-au100 CTO (W0P31AV) | |
| 1366x768 High Preset AA:2xMS (ordina per valore) | |
| HP Pavilion 15t-au100 CTO (W0P31AV) | |
| 1920x1080 Ultra Preset AA:4xMS (ordina per valore) | |
| HP Pavilion 15t-au100 CTO (W0P31AV) | |
| Metro: Last Light | |
| 1024x768 Low (DX10) AF:4x (ordina per valore) | |
| HP Pavilion 15t-au100 CTO (W0P31AV) | |
| 1366x768 Medium (DX10) AF:4x (ordina per valore) | |
| HP Pavilion 15t-au100 CTO (W0P31AV) | |
| 1366x768 High (DX11) AF:16x (ordina per valore) | |
| HP Pavilion 15t-au100 CTO (W0P31AV) | |
| Dell XPS 15 9550 i7 FHD | |
| HP Pavilion 15 UHD T9Y85AV | |
| 1920x1080 Very High (DX11) AF:16x (ordina per valore) | |
| HP Pavilion 15t-au100 CTO (W0P31AV) | |
| Dell XPS 15 9550 i7 FHD | |
| HP Pavilion 15 UHD T9Y85AV | |
| Tomb Raider | |
| 1024x768 Low Preset (ordina per valore) | |
| HP Pavilion 15t-au100 CTO (W0P31AV) | |
| Asus Zenbook UX510UW-CN044T | |
| 1366x768 Normal Preset AA:FX AF:4x (ordina per valore) | |
| HP Pavilion 15t-au100 CTO (W0P31AV) | |
| Asus Zenbook UX510UW-CN044T | |
| 1366x768 High Preset AA:FX AF:8x (ordina per valore) | |
| HP Pavilion 15t-au100 CTO (W0P31AV) | |
| Asus Zenbook UX510UW-CN044T | |
| Dell XPS 15 9550 i7 FHD | |
| 1920x1080 Ultra Preset AA:FX AF:16x (ordina per valore) | |
| HP Pavilion 15t-au100 CTO (W0P31AV) | |
| Asus Zenbook UX510UW-CN044T | |
| Dell XPS 15 9550 i7 FHD | |
| Company of Heroes 2 | |
| 1024x768 Minimum / Low / Off AA:Off (ordina per valore) | |
| HP Pavilion 15t-au100 CTO (W0P31AV) | |
| 1366x768 Medium AA:Off (ordina per valore) | |
| HP Pavilion 15t-au100 CTO (W0P31AV) | |
| 1366x768 High AA:Medium (ordina per valore) | |
| HP Pavilion 15t-au100 CTO (W0P31AV) | |
| 1920x1080 Maximum / Higher / High AA:High (ordina per valore) | |
| HP Pavilion 15t-au100 CTO (W0P31AV) | |
| Sleeping Dogs | |
| 1024x768 Low Preset AA:Normal (ordina per valore) | |
| HP Pavilion 15t-au100 CTO (W0P31AV) | |
| 1366x768 Medium Preset AA:Normal (ordina per valore) | |
| HP Pavilion 15t-au100 CTO (W0P31AV) | |
| 1366x768 High Preset AA:High (ordina per valore) | |
| HP Pavilion 15t-au100 CTO (W0P31AV) | |
| Dell XPS 15 9550 i7 FHD | |
| HP Pavilion 15 UHD T9Y85AV | |
| 1920x1080 Extreme Preset AA:Extreme (ordina per valore) | |
| HP Pavilion 15t-au100 CTO (W0P31AV) | |
| Dell XPS 15 9550 i7 FHD | |
| HP Pavilion 15 UHD T9Y85AV | |
| basso | medio | alto | ultra | |
|---|---|---|---|---|
| Dirt 3 (2011) | 67.8 | 48.7 | 41.6 | 28.9 |
| Anno 2070 (2011) | 130.4 | 66.8 | 42.5 | 21 |
| Sleeping Dogs (2012) | 92.9 | 69.9 | 34 | 9 |
| Hitman: Absolution (2012) | 61.3 | 38.3 | 17.8 | 6.6 |
| Tomb Raider (2013) | 137 | 66.4 | 37.4 | 18.3 |
| BioShock Infinite (2013) | 90.3 | 62.4 | 42.7 | 14.6 |
| Metro: Last Light (2013) | 49.3 | 38.4 | 23.5 | 11.6 |
| GRID 2 (2013) | 125.4 | 89.8 | 60.3 | 21.2 |
| Company of Heroes 2 (2013) | 36.1 | 29.5 | 21 | 7.2 |
| F1 2013 (2013) | 120 | 81 | 41 | 31 |
| Rise of the Tomb Raider (2016) | 34.7 | 22.1 | 13.2 | 10.1 |
Rumorosità
| Idle |
| 32.2 / 32.2 / 33.7 dB(A) |
| Sotto carico |
| 39.4 / 42.2 dB(A) |
 | ||
30 dB silenzioso 40 dB(A) udibile 50 dB(A) rumoroso |
||
min: | ||
| HP Pavilion 15t-au100 CTO (W0P31AV) GeForce 940MX, i7-7500U, Toshiba MQ01ABD100 | Asus Zenbook UX510UW-CN044T GeForce GTX 960M, 6500U, SanDisk SD8SNAT256G1002 | Lenovo IdeaPad 510-15IKB 80SV0087GE GeForce 940MX, i7-7500U, Liteonit CV3-DE256 | Acer Aspire E5-575G-549D GeForce GTX 950M, i5-7200U, Toshiba MQ01ABD100 | Dell XPS 15 9550 i7 FHD GeForce GTX 960M, 6700HQ, Samsung PM951 NVMe 512 GB | HP Pavilion 15 UHD T9Y85AV GeForce GTX 960M, 6700HQ, SanDisk Z400s SD8SNAT-128G | |
|---|---|---|---|---|---|---|
| Noise | -1% | 5% | 7% | 5% | -4% | |
| Idle Minimum * (dB) | 32.2 | 31.6 2% | 32.6 -1% | 30.8 4% | 29.2 9% | 32.3 -0% |
| Idle Average * (dB) | 32.2 | 31.6 2% | 32.6 -1% | 30.8 4% | 29.3 9% | 32.4 -1% |
| Idle Maximum * (dB) | 33.7 | 33.4 1% | 32.6 3% | 30.8 9% | 29.5 12% | 32.4 4% |
| Load Average * (dB) | 39.4 | 41.7 -6% | 35.3 10% | 33.4 15% | 36.5 7% | 40.5 -3% |
| Load Maximum * (dB) | 42.2 | 44.8 -6% | 37.1 12% | 40.1 5% | 47.7 -13% | 50.3 -19% |
| off /ambiente * (dB) | 31.6 | 31.6 | 28.9 | 29.5 |
* ... Meglio usare valori piccoli
(±) La temperatura massima sul lato superiore è di 40 °C / 104 F, rispetto alla media di 36.8 °C / 98 F, che varia da 21 a 71 °C per questa classe Multimedia.
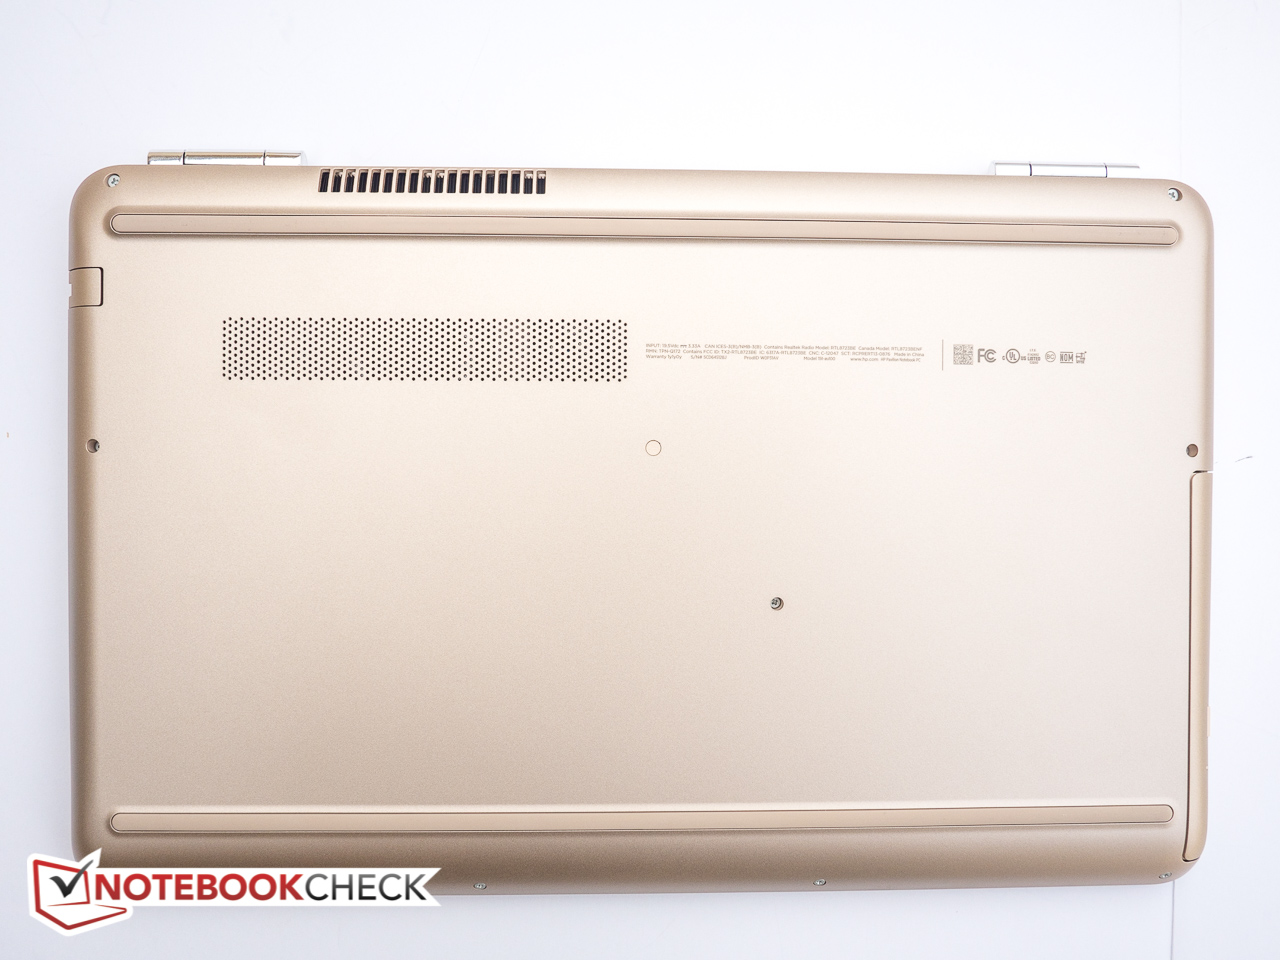
(+) Il lato inferiore si riscalda fino ad un massimo di 34.8 °C / 95 F, rispetto alla media di 39.1 °C / 102 F
(+) In idle, la temperatura media del lato superiore è di 24.4 °C / 76 F, rispetto alla media deld ispositivo di 31.3 °C / 88 F.
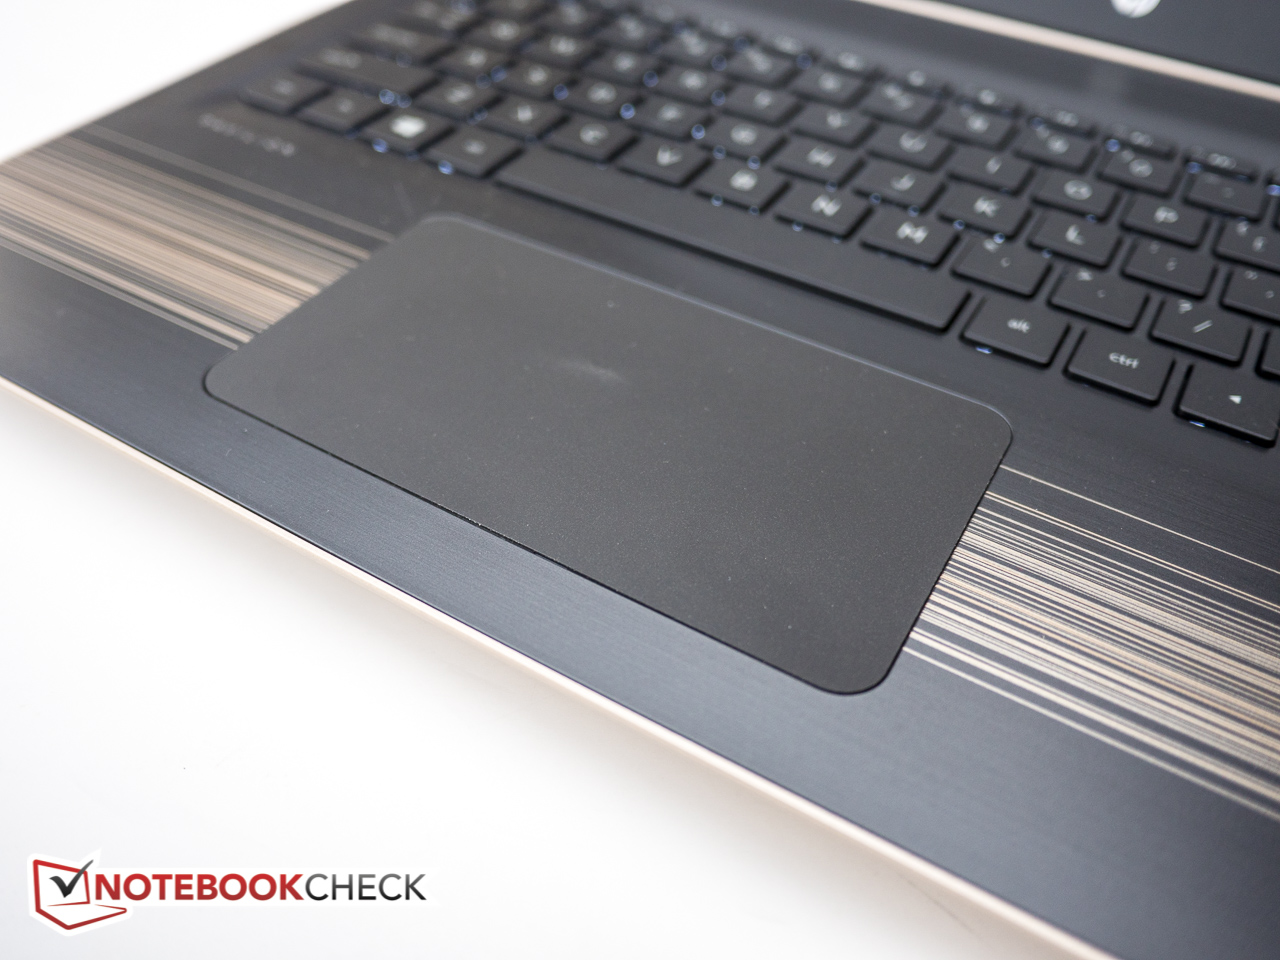
(+) I poggiapolsi e il touchpad sono piu' freddi della temperatura della pelle con un massimo di 27.2 °C / 81 F e sono quindi freddi al tatto.
(±) La temperatura media della zona del palmo della mano di dispositivi simili e'stata di 28.7 °C / 83.7 F (+1.5 °C / 2.7 F).
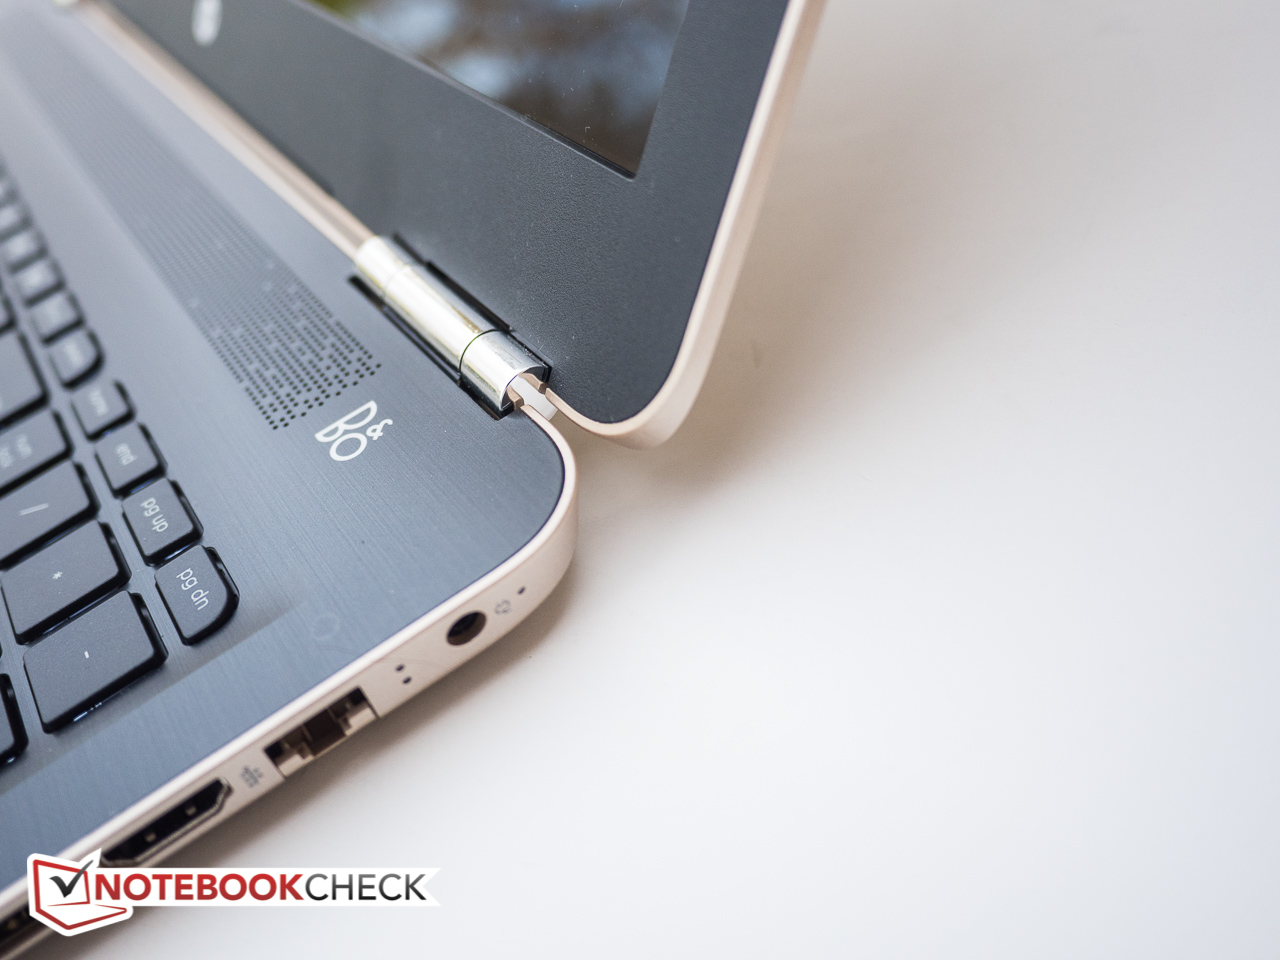
HP Pavilion 15t-au100 CTO (W0P31AV) analisi audio
(-) | altoparlanti non molto potenti (58 dB)
Bassi 100 - 315 Hz
(±) | bassi ridotti - in media 14.1% inferiori alla media
(±) | la linearità dei bassi è media (12.4% delta rispetto alla precedente frequenza)
Medi 400 - 2000 Hz
(±) | medi elevati - circa 5.6% superiore alla media
(±) | linearità dei medi adeguata (7.2% delta rispetto alla precedente frequenza)
Alti 2 - 16 kHz
(+) | Alti bilanciati - appena 3.1% dalla media
(+) | alti lineari (6.6% delta rispetto alla precedente frequenza)
Nel complesso 100 - 16.000 Hz
(-) | suono nel complesso non lineare (32.9% di differenza rispetto alla media
Rispetto alla stessa classe
» 97% di tutti i dispositivi testati in questa classe è stato migliore, 1% simile, 2% peggiore
» Il migliore ha avuto un delta di 5%, medio di 17%, peggiore di 45%
Rispetto a tutti i dispositivi testati
» 92% di tutti i dispositivi testati in questa classe è stato migliore, 1% similare, 7% peggiore
» Il migliore ha avuto un delta di 4%, medio di 24%, peggiore di 134%
Apple MacBook 12 (Early 2016) 1.1 GHz analisi audio
(+) | gli altoparlanti sono relativamente potenti (83.6 dB)
Bassi 100 - 315 Hz
(±) | bassi ridotti - in media 11.3% inferiori alla media
(±) | la linearità dei bassi è media (14.2% delta rispetto alla precedente frequenza)
Medi 400 - 2000 Hz
(+) | medi bilanciati - solo only 2.4% rispetto alla media
(+) | medi lineari (5.5% delta rispetto alla precedente frequenza)
Alti 2 - 16 kHz
(+) | Alti bilanciati - appena 2% dalla media
(+) | alti lineari (4.5% delta rispetto alla precedente frequenza)
Nel complesso 100 - 16.000 Hz
(+) | suono nel complesso lineare (10.2% differenza dalla media)
Rispetto alla stessa classe
» 7% di tutti i dispositivi testati in questa classe è stato migliore, 2% simile, 91% peggiore
» Il migliore ha avuto un delta di 5%, medio di 18%, peggiore di 53%
Rispetto a tutti i dispositivi testati
» 5% di tutti i dispositivi testati in questa classe è stato migliore, 1% similare, 94% peggiore
» Il migliore ha avuto un delta di 4%, medio di 24%, peggiore di 134%
| Off / Standby | |
| Idle | |
| Sotto carico |
|
Leggenda:
min: | |
| HP Pavilion 15t-au100 CTO (W0P31AV) i7-7500U, GeForce 940MX, Toshiba MQ01ABD100, IPS, 1920x1080, 15.6" | Asus Zenbook UX510UW-CN044T 6500U, GeForce GTX 960M, SanDisk SD8SNAT256G1002, IPS, 1920x1080, 15.6" | Lenovo IdeaPad 510-15IKB 80SV0087GE i7-7500U, GeForce 940MX, Liteonit CV3-DE256, IPS, 1920x1080, 15.6" | Acer Aspire E5-575G-549D i5-7200U, GeForce GTX 950M, Toshiba MQ01ABD100, TN, 1920x1080, 15.6" | HP Pavilion 15 UHD T9Y85AV 6700HQ, GeForce GTX 960M, SanDisk Z400s SD8SNAT-128G, IPS, 3840x2160, 15.6" | |
|---|---|---|---|---|---|
| Power Consumption | -18% | 15% | -10% | -69% | |
| Idle Minimum * (Watt) | 6.16 | 5 19% | 3.9 37% | 6 3% | 8.3 -35% |
| Idle Average * (Watt) | 8.48 | 8.9 -5% | 7.4 13% | 8.1 4% | 14.8 -75% |
| Idle Maximum * (Watt) | 9.62 | 11.8 -23% | 9.5 1% | 9.8 -2% | 16.8 -75% |
| Load Average * (Watt) | 41.63 | 55 -32% | 41 2% | 52.5 -26% | 71 -71% |
| Load Maximum * (Watt) | 63.22 | 93 -47% | 48 24% | 81.6 -29% | 119.2 -89% |
* ... Meglio usare valori piccoli
| HP Pavilion 15t-au100 CTO (W0P31AV) i7-7500U, GeForce 940MX, 41 Wh | Asus Zenbook UX510UW-CN044T 6500U, GeForce GTX 960M, 48 Wh | Lenovo IdeaPad 510-15IKB 80SV0087GE i7-7500U, GeForce 940MX, 30 Wh | Acer Aspire E5-575G-549D i5-7200U, GeForce GTX 950M, 62 Wh | Dell XPS 15 9550 i7 FHD 6700HQ, GeForce GTX 960M, 84 Wh | HP Pavilion 15 UHD T9Y85AV 6700HQ, GeForce GTX 960M, 61.5 Wh | |
|---|---|---|---|---|---|---|
| Autonomia della batteria | 57% | 24% | 50% | 90% | 8% | |
| Reader / Idle (h) | 7.3 | 13.6 86% | 12.8 75% | 16.3 123% | 8.5 16% | |
| WiFi v1.3 (h) | 3.7 | 7.2 95% | 4.6 24% | 7.5 103% | 9.1 146% | 4.4 19% |
| Load (h) | 1.8 | 1.6 -11% | 1.3 -28% | 1.8 0% | 1.6 -11% |
Pro
Contro


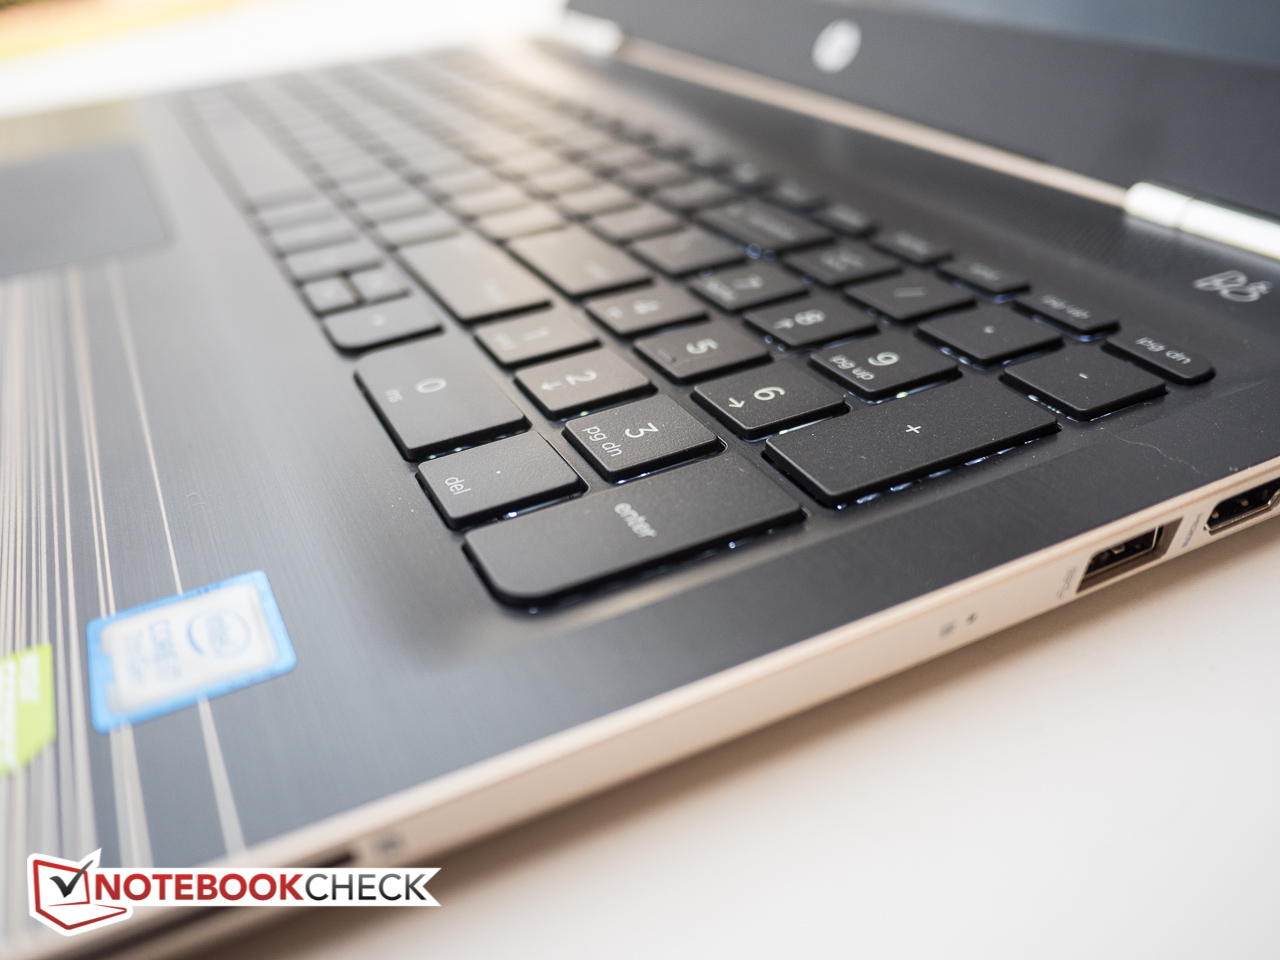
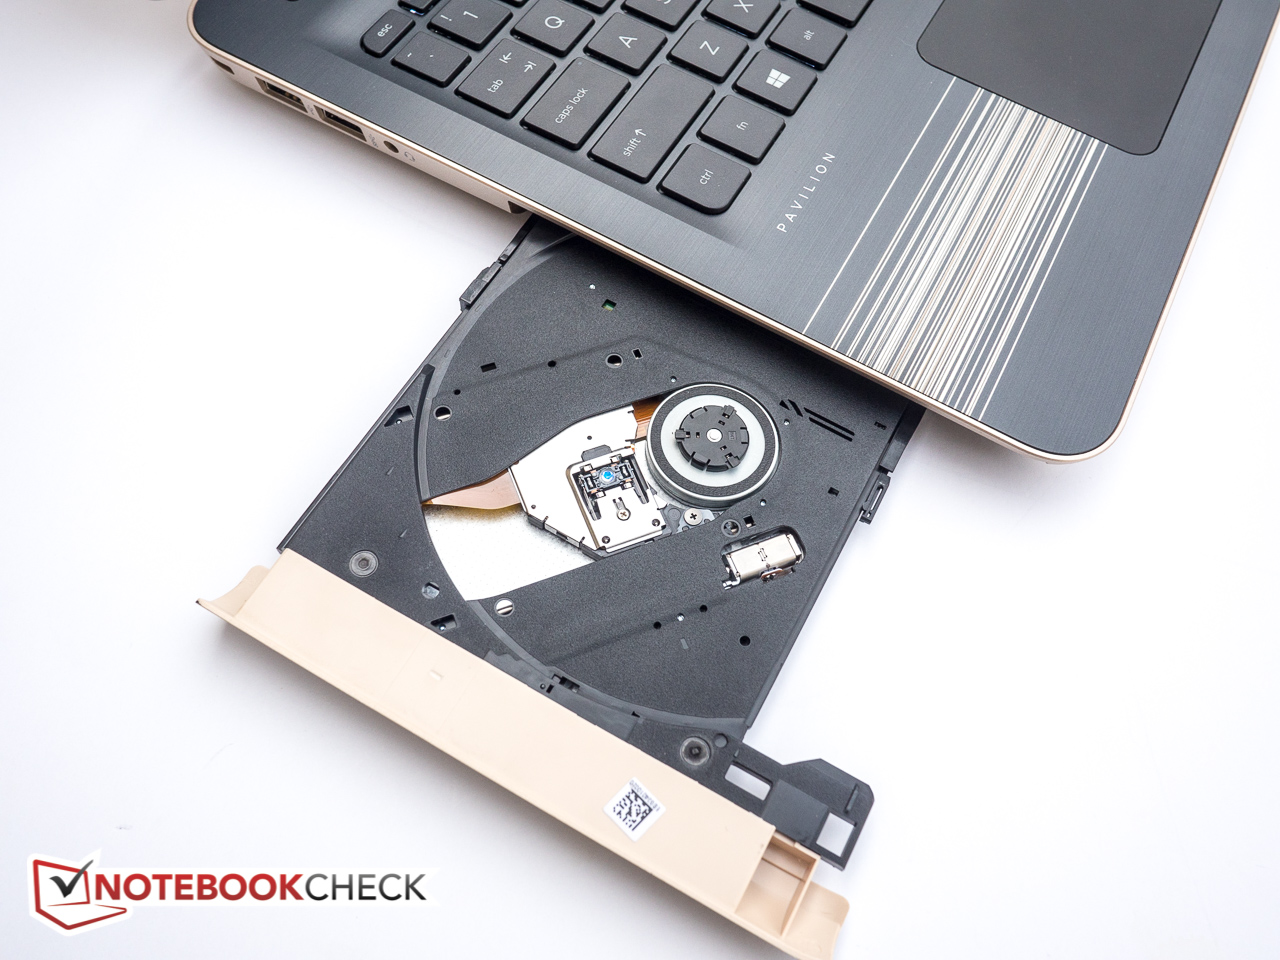
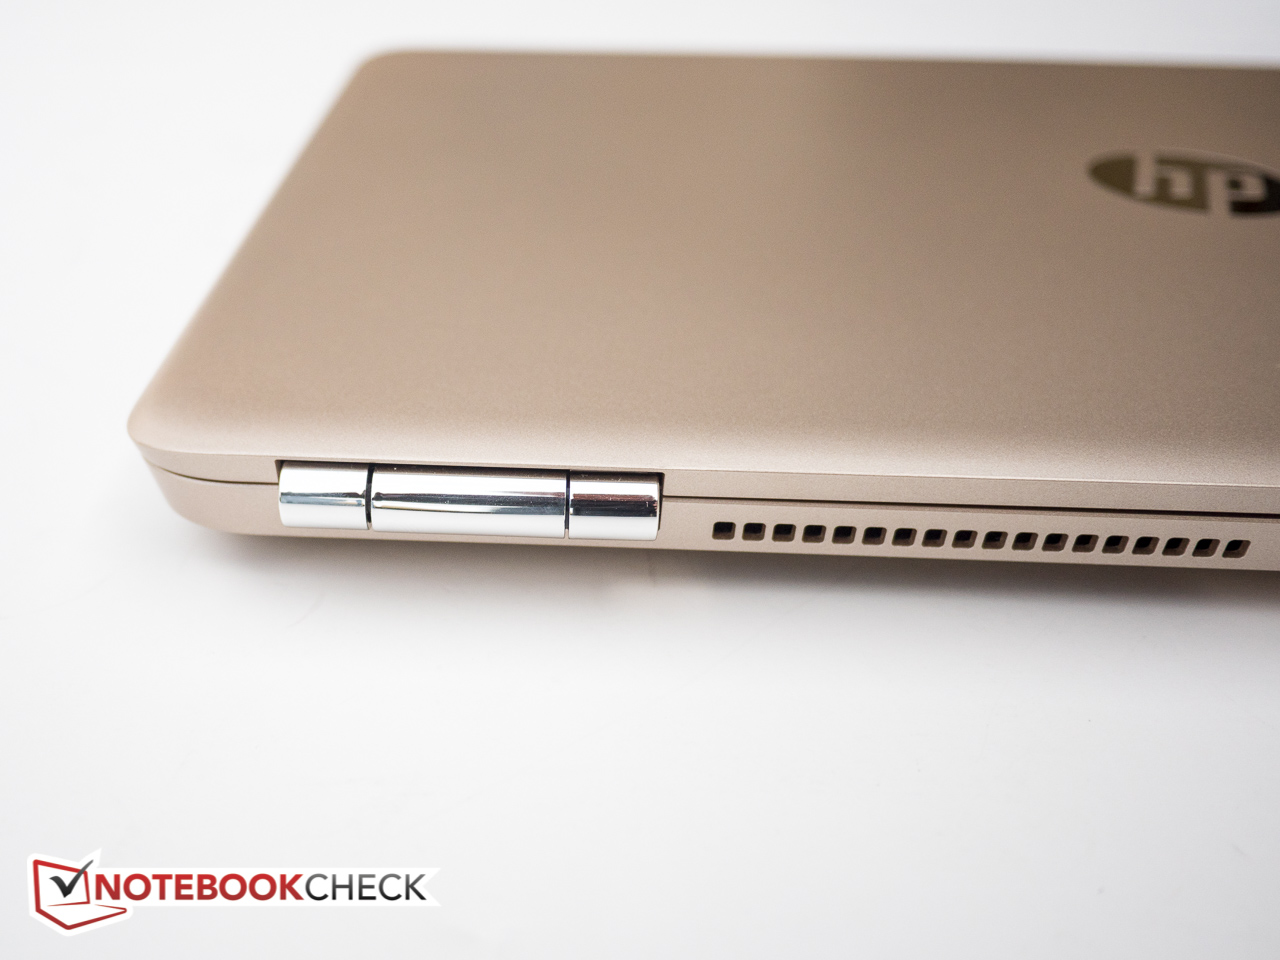
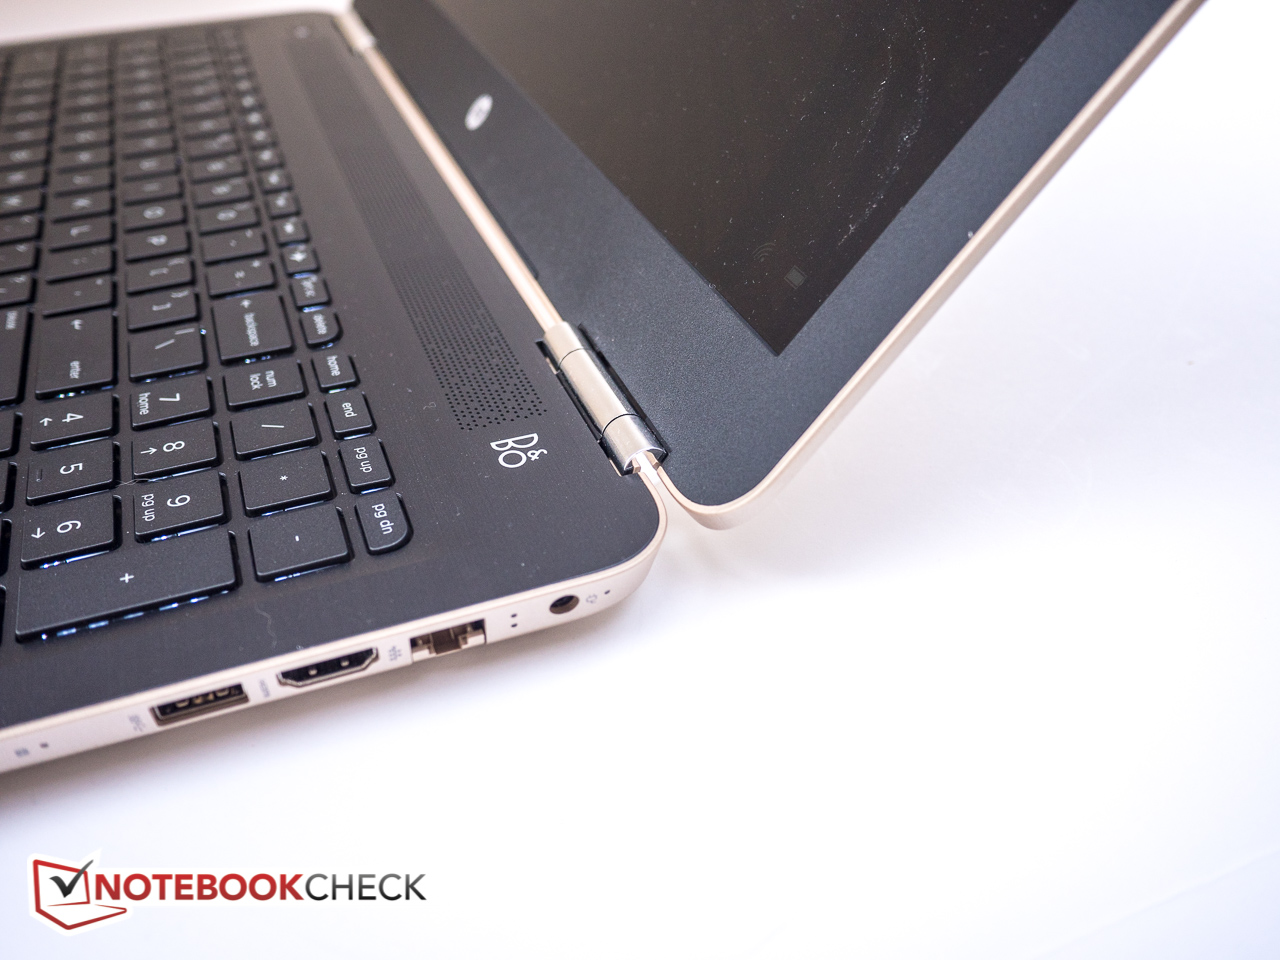
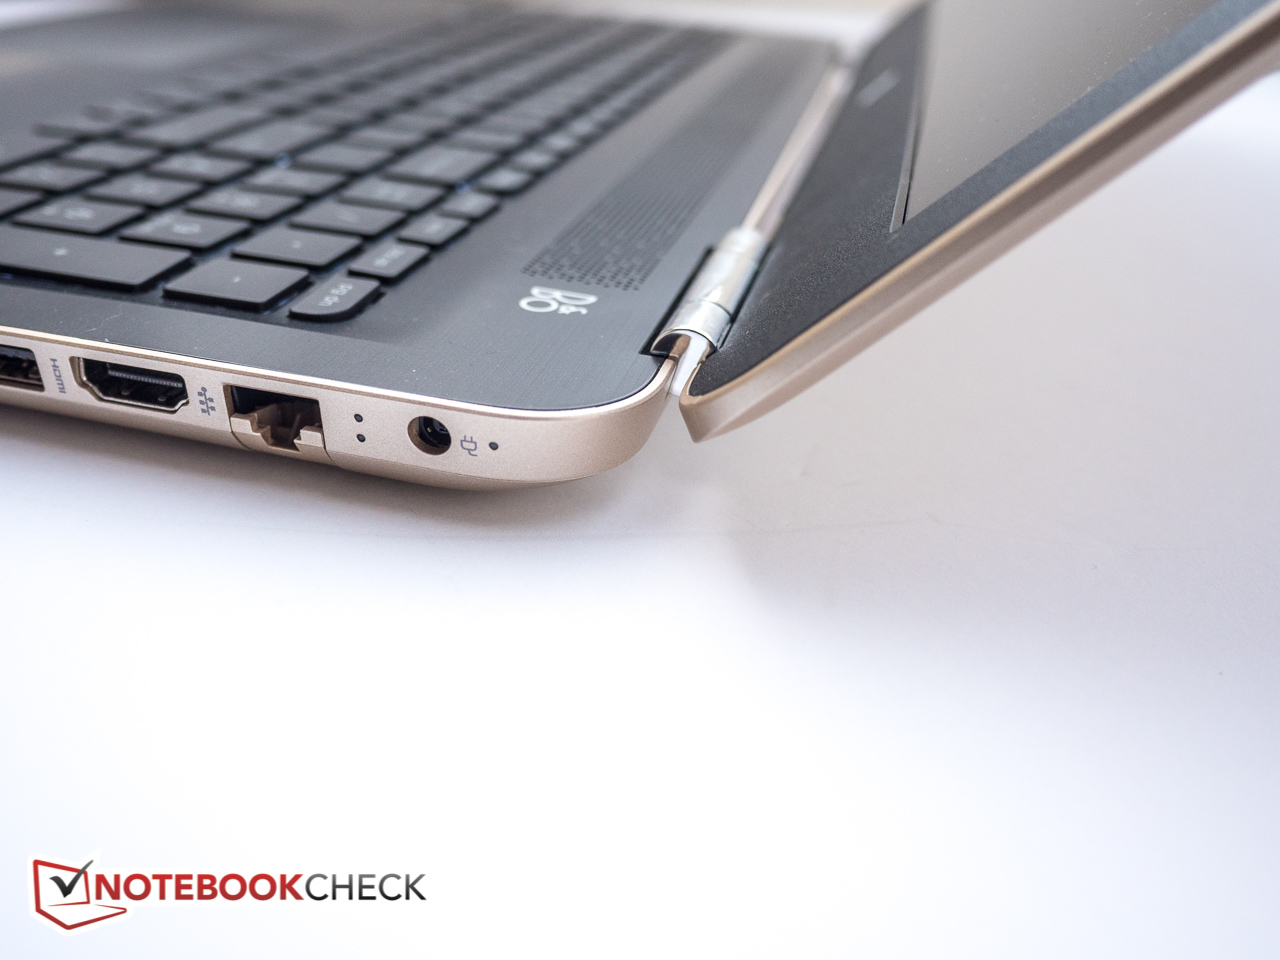
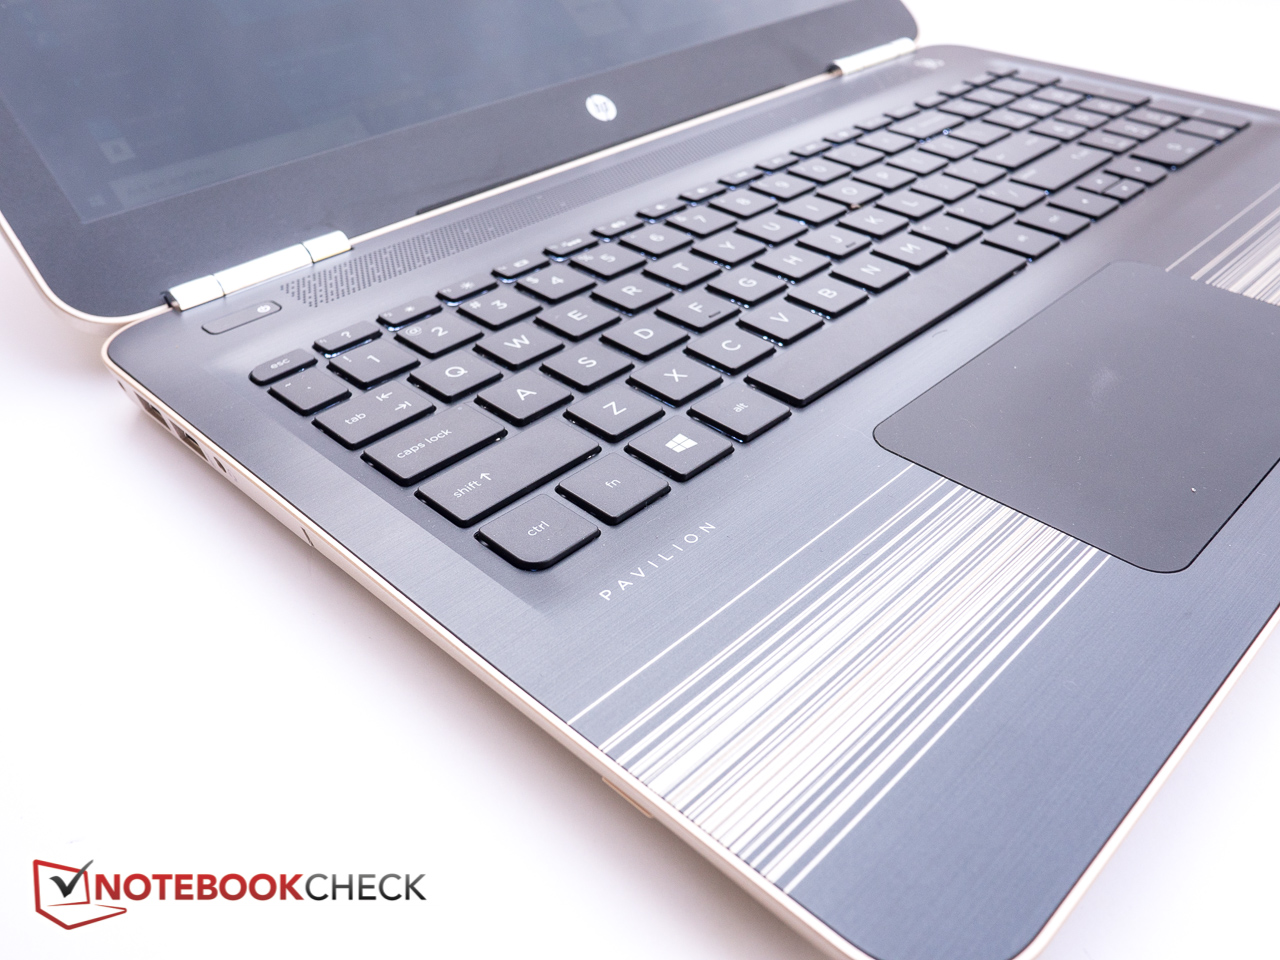
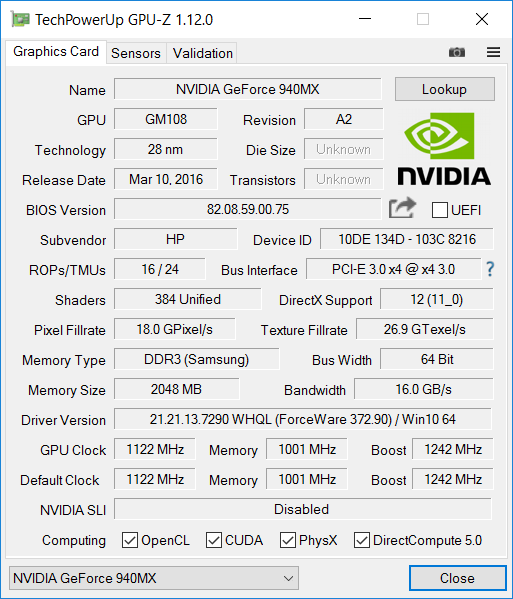
L'HP Pavilion 15t-au100 è un portatile da 15.6" abbastanza attraente con abbastanza performance per le applicazioni quotidiane. Monta l'attuale generazione di CPU dual-core i7, 8 GB di RAM ed una scheda grafica di fascia media dedicata GeForce 940MX, ed anche i giochi non troppo pesanti non sono un problema. Mentre le prestazioni complessive sono molto buone, il sistema ha un collo di bottiglia senza dubbio a causa dell'hard drive meccanico, che gira a 5400 RPM. Il portatile non è veloce quanto i competitivi sistemi con SSDs. Per fortuna alcuni modelli della serie hanno SSDs PCIe NVMe M.2 e possono montare un SSD o drives convenzionali SATA per aumentare le prestazioni senza spendere molto.
Un altro punto di critica è il display, che sfortunatamente è scuro e riflettente. Questa combinazione rende difficile utilizzarlo all'aperto o in ambienti luminosi. Infine, l'autonomia della batteria è limitata, alcuni concorrenti durano il doppio.
L'HP Pavilion 15t offre prestazioni decenti, ma è frenato dal suo hard drive meccanico, dal display e dall'autonomia. A meno che HP aumenti la luminosità del modello Full-HD, preferiremo optare per un modello UHD con drive SSD e scheda grafica più potente.
Nota: si tratta di una recensione breve, con alcune sezioni non tradotte, per la versione integrale in inglese guardate qui.
HP Pavilion 15t-au100 CTO (W0P31AV)
- 01/07/2017 v6 (old)
Bernhard Pechlaner
Price comparison
