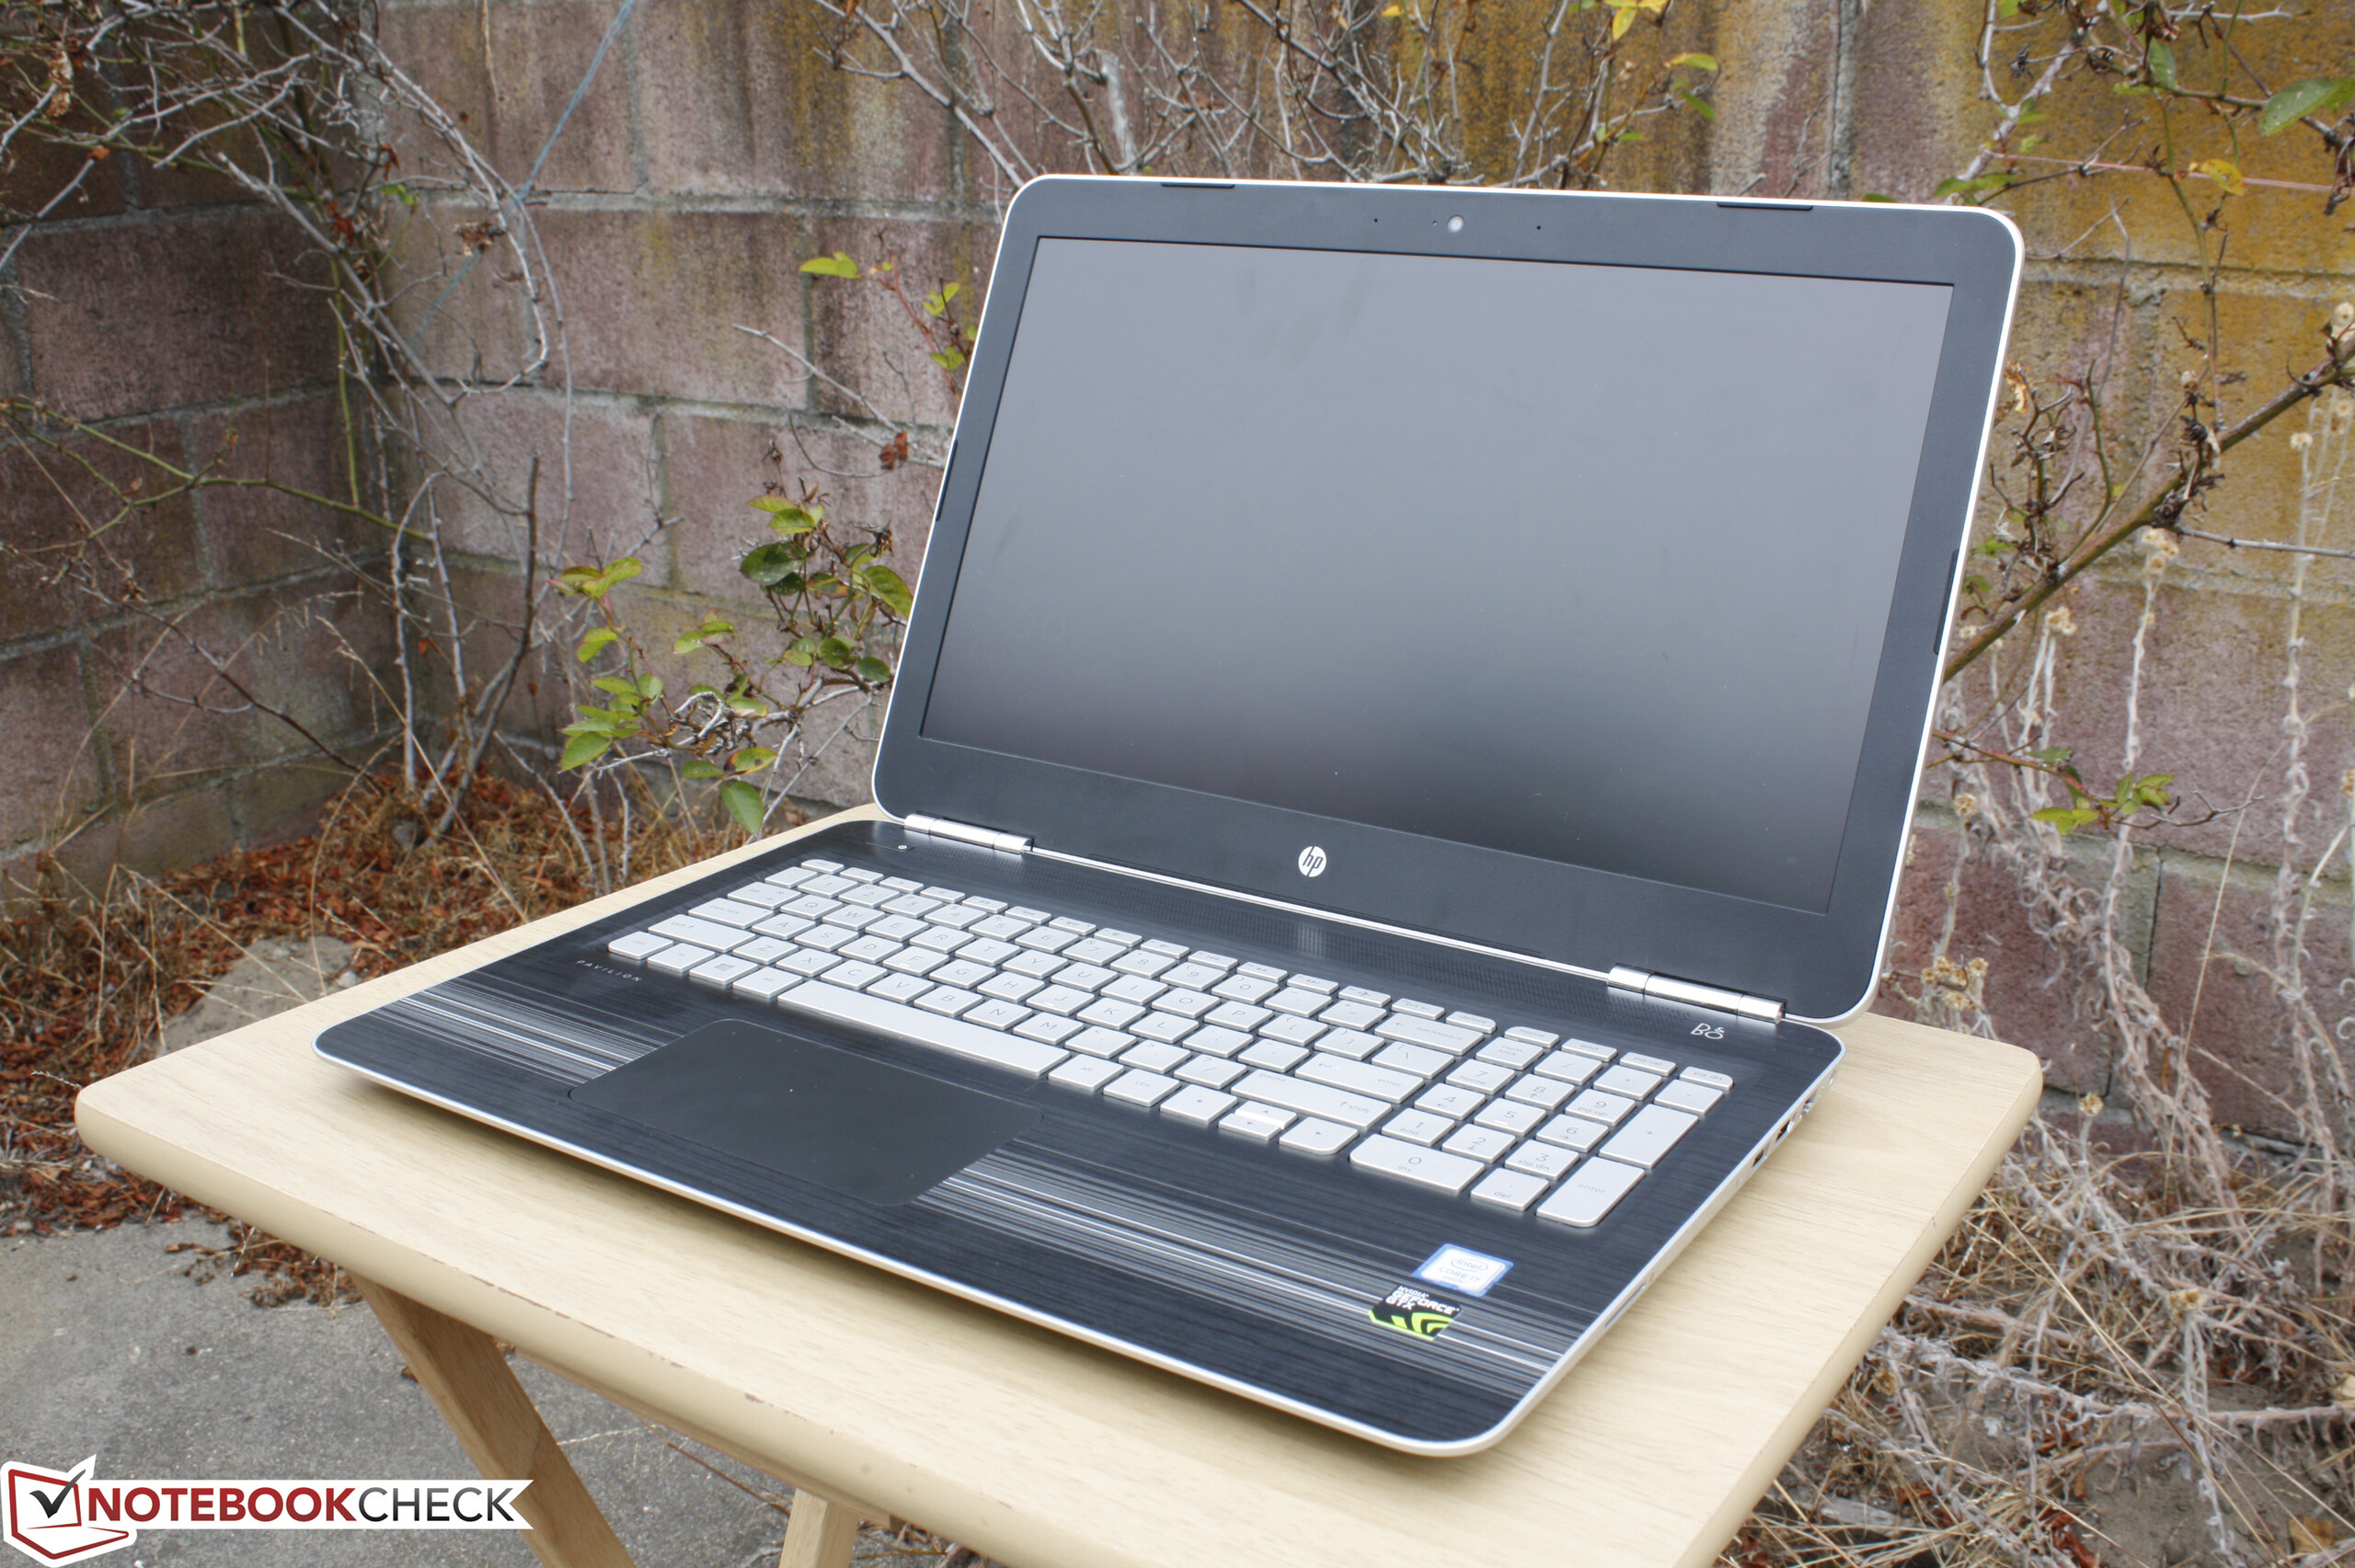
Recensione breve del portatile HP Pavilion 15 UHD T9Y85AV


| SD Card Reader | |
| average JPG Copy Test (av. of 3 runs) | |
| Dell XPS 13 2016 9350 (FHD, i7-6560U) | |
| HP Pavilion 15-bk001ng x360 | |
| Apple MacBook Pro Retina 13 inch 2013-10 | |
| HP Pavilion 15 UHD T9Y85AV | |
| maximum AS SSD Seq Read Test (1GB) | |
| Dell XPS 13 2016 9350 (FHD, i7-6560U) | |
| HP Pavilion 15 UHD T9Y85AV | |
| HP Pavilion 15-bk001ng x360 | |
| Networking | |
| iperf Server (receive) TCP 1 m | |
| Apple MacBook 12 (Early 2016) 1.1 GHz | |
| Asus ZenPad 8.0 Z380M-6B026A | |
| iperf Client (transmit) TCP 1 m | |
| Apple MacBook 12 (Early 2016) 1.1 GHz | |
| Asus ZenPad 8.0 Z380M-6B026A | |
| |||||||||||||||||||||||||
Distribuzione della luminosità: 87 %
Al centro con la batteria: 336.2 cd/m²
Contrasto: 534:1 (Nero: 0.629 cd/m²)
ΔE ColorChecker Calman: 3.32 | ∀{0.5-29.43 Ø4.73}
ΔE Greyscale Calman: 2.88 | ∀{0.09-98 Ø4.97}
85.5% sRGB (Argyll 1.6.3 3D)
55.3% AdobeRGB 1998 (Argyll 1.6.3 3D)
61.8% AdobeRGB 1998 (Argyll 3D)
85.8% sRGB (Argyll 3D)
60% Display P3 (Argyll 3D)
Gamma: 2.34
CCT: 6279 K
| HP Pavilion 15 UHD T9Y85AV SDC5958, IPS, 15.6", 3840x2160 | HP Pavilion 15-ak003ng Samsung SDC5544, IPS, 15.6", 1920x1080 | MSI GL62-6QFi781H11 CMN N156HGE-EAL (CMN15D2), TN LED, 15.6", 1920x1080 | Asus ZenBook Pro UX501VW-DS71T IPS, 15.6", 3840x2160 | HP Omen 15-ax007ng LGD0519, IPS, 15.6", 1920x1080 | |
|---|---|---|---|---|---|
| Display | -27% | 32% | 6% | -16% | |
| Display P3 Coverage (%) | 60 | 43.03 -28% | 85.8 43% | 64.3 7% | 59.9 0% 40.34 -33% |
| sRGB Coverage (%) | 85.8 | 64.7 -25% | 99.8 16% | 89.9 5% | 85.9 0% 60.3 -30% |
| AdobeRGB 1998 Coverage (%) | 61.8 | 44.47 -28% | 84.1 36% | 65.4 6% | 61.6 0% 41.73 -32% |
| Response Times | -12% | 3% | -5% | -27% | |
| Response Time Grey 50% / Grey 80% * (ms) | 39.6 ? | 48 ? -21% | 43 ? -9% | 43.2 ? -9% | 55 ? -39% |
| Response Time Black / White * (ms) | 27.2 ? | 28 ? -3% | 23 ? 15% | 27.2 ? -0% | 31 ? -14% |
| PWM Frequency (Hz) | 1282 ? | 1000 ? | |||
| Screen | 4% | -63% | -22% | -29% | |
| Brightness middle (cd/m²) | 336.2 | 254 -24% | 216 -36% | 252.9 -25% | 214 -36% |
| Brightness (cd/m²) | 323 | 241 -25% | 202 -37% | 250 -23% | 203 -37% |
| Brightness Distribution (%) | 87 | 78 -10% | 83 -5% | 89 2% | 79 -9% |
| Black Level * (cd/m²) | 0.629 | 0.27 57% | 0.48 24% | 0.5 21% | 0.28 55% |
| Contrast (:1) | 534 | 941 76% | 450 -16% | 506 -5% | 764 43% |
| Colorchecker dE 2000 * | 3.32 | 3.54 -7% | 9.98 -201% | 5.22 -57% | 6.04 -82% |
| Colorchecker dE 2000 max. * | 7.4 | 17.12 -131% | 8.33 -13% | 12 -62% | |
| Greyscale dE 2000 * | 2.88 | 2.29 20% | 10.91 -279% | 6.74 -134% | 5.91 -105% |
| Gamma | 2.34 94% | 2.5 88% | 2.31 95% | 2.45 90% | 2.44 90% |
| CCT | 6279 104% | 6698 97% | 13185 49% | 6026 108% | 7362 88% |
| Color Space (Percent of AdobeRGB 1998) (%) | 55.3 | 41 -26% | 75 36% | 58.4 6% | 38 -31% |
| Color Space (Percent of sRGB) (%) | 85.5 | 64 -25% | 100 17% | 89.7 5% | 60 -30% |
| Media totale (Programma / Settaggio) | -12% /
-5% | -9% /
-35% | -7% /
-14% | -24% /
-25% |
* ... Meglio usare valori piccoli
Tempi di risposta del Display
| ↔ Tempi di risposta dal Nero al Bianco | ||
|---|---|---|
| 27.2 ms ... aumenta ↗ e diminuisce ↘ combinato | ↗ 7.6 ms Incremento | 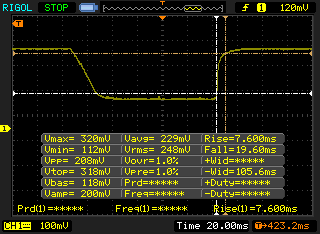 |
| ↘ 19.6 ms Calo | ||
| Lo schermo mostra tempi di risposta relativamente lenti nei nostri tests e potrebbe essere troppo lento per i gamers. In confronto, tutti i dispositivi di test variano da 0.1 (minimo) a 240 (massimo) ms. » 69 % di tutti i dispositivi è migliore. Questo significa che i tempi di risposta rilevati sono peggiori rispetto alla media di tutti i dispositivi testati (19.9 ms). | ||
| ↔ Tempo di risposta dal 50% Grigio all'80% Grigio | ||
| 39.6 ms ... aumenta ↗ e diminuisce ↘ combinato | ↗ 18.4 ms Incremento | 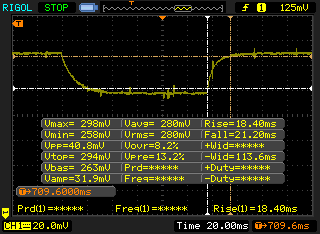 |
| ↘ 21.2 ms Calo | ||
| Lo schermo mostra tempi di risposta lenti nei nostri tests e sarà insoddisfacente per i gamers. In confronto, tutti i dispositivi di test variano da 0.165 (minimo) a 636 (massimo) ms. » 60 % di tutti i dispositivi è migliore. Questo significa che i tempi di risposta rilevati sono peggiori rispetto alla media di tutti i dispositivi testati (31.1 ms). | ||
Sfarfallio dello schermo / PWM (Pulse-Width Modulation)
| flickering dello schermo / PWM rilevato | 1282 Hz | ≤ 59 % settaggio luminosita' | 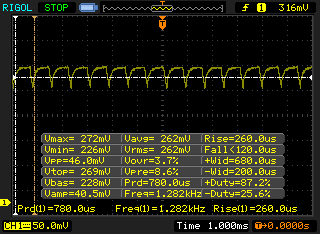 |
Il display sfarfalla a 1282 Hz (Probabilmente a causa dell'uso di PWM) Flickering rilevato ad una luminosita' di 59 % o inferiore. Non dovrebbe verificarsi flickering o PWM sopra questo valore di luminosita'. La frequenza di 1282 Hz è abbastanza alta, quindi la maggioranza degli utenti sensibili al PWM non dovrebbero notare alcun flickering. In confronto: 52 % di tutti i dispositivi testati non utilizza PWM per ridurre la luminosita' del display. Se è rilevato PWM, una media di 7791 (minimo: 5 - massimo: 343500) Hz è stata rilevata. | |||

| Cinebench R10 | |
| Rendering Multiple CPUs 32Bit (ordina per valore) | |
| HP Pavilion 15 UHD T9Y85AV | |
| DogHouse Systems Mobius SS | |
| Asus G701VO-CS74K | |
| MSI PX60 QD-034US | |
| Lenovo IdeaPad Y50 | |
| HP Spectre 13 | |
| Rendering Single 32Bit (ordina per valore) | |
| HP Pavilion 15 UHD T9Y85AV | |
| DogHouse Systems Mobius SS | |
| Asus G701VO-CS74K | |
| MSI PX60 QD-034US | |
| Lenovo IdeaPad Y50 | |
| HP Spectre 13 | |
| wPrime 2.10 - 1024m (ordina per valore) | |
| HP Pavilion 15 UHD T9Y85AV | |
| DogHouse Systems Mobius SS | |
| Asus G701VO-CS74K | |
| MSI PX60 QD-034US | |
| Lenovo IdeaPad Y50 | |
| HP Spectre 13 | |
| Super Pi Mod 1.5 XS 32M - 32M (ordina per valore) | |
| HP Pavilion 15 UHD T9Y85AV | |
| DogHouse Systems Mobius SS | |
| Asus G701VO-CS74K | |
| MSI PX60 QD-034US | |
| Lenovo IdeaPad Y50 | |
| HP Spectre 13 | |
* ... Meglio usare valori piccoli
| PCMark 8 | |
| Home Score Accelerated v2 (ordina per valore) | |
| HP Pavilion 15 UHD T9Y85AV | |
| HP Omen 15-ax007ng | |
| MSI GL62-6QFi781H11 | |
| HP Pavilion 15-ak003ng | |
| Asus ZenBook Pro UX501VW-DS71T | |
| Work Score Accelerated v2 (ordina per valore) | |
| HP Pavilion 15 UHD T9Y85AV | |
| HP Omen 15-ax007ng | |
| MSI GL62-6QFi781H11 | |
| HP Pavilion 15-ak003ng | |
| Asus ZenBook Pro UX501VW-DS71T | |
| Creative Score Accelerated v2 (ordina per valore) | |
| HP Pavilion 15 UHD T9Y85AV | |
| HP Omen 15-ax007ng | |
| MSI GL62-6QFi781H11 | |
| HP Pavilion 15-ak003ng | |
| Asus ZenBook Pro UX501VW-DS71T | |
| PCMark 8 Home Score Accelerated v2 | 3101 punti | |
| PCMark 8 Creative Score Accelerated v2 | 4648 punti | |
| PCMark 8 Work Score Accelerated v2 | 3717 punti | |
Aiuto | ||
| HP Pavilion 15 UHD T9Y85AV SanDisk Z400s SD8SNAT-128G | HP Pavilion 15-ak003ng Samsung CM871 MZNLF128HCHP | MSI GL62-6QFi781H11 Toshiba HG6 THNSNJ128G8NY | Asus ZenBook Pro UX501VW-DS71T Samsung SM951 MZVPV512HDGL m.2 PCI-e | HP Omen 15-ax007ng Adata IM2S3138E-128GM-B | |
|---|---|---|---|---|---|
| CrystalDiskMark 3.0 | -38% | 51% | 321% | 17% | |
| Read Seq (MB/s) | 484.6 | 465.8 -4% | 530 9% | 1633 237% | 475.7 -2% |
| Write Seq (MB/s) | 185.2 | 120.2 -35% | 442.7 139% | 1579 753% | 169.2 -9% |
| Read 512 (MB/s) | 307.6 | 314.1 2% | 409.1 33% | 1068 247% | 327.6 7% |
| Write 512 (MB/s) | 180 | 75.9 -58% | 417.3 132% | 1570 772% | 169.6 -6% |
| Read 4k (MB/s) | 22.08 | 18.49 -16% | 21.81 -1% | 50.4 128% | 33.14 50% |
| Write 4k (MB/s) | 77.7 | 21.18 -73% | 93 20% | 128.6 66% | 81.4 5% |
| Read 4k QD32 (MB/s) | 143.7 | 94.8 -34% | 257 79% | 534 272% | 276.8 93% |
| Write 4k QD32 (MB/s) | 177.6 | 21.66 -88% | 168.3 -5% | 344 94% | 168 -5% |

| 3DMark 11 | |
| 1280x720 Performance GPU (ordina per valore) | |
| HP Pavilion 15 UHD T9Y85AV | |
| Asus Strix GL502VY-DS71 | |
| Asus Strix GL502VT-DS74 | |
| HP Omen 15-ax007ng | |
| MSI GL62-6QFi781H11 | |
| HP Envy 17-n107ng | |
| Dell Inspiron 17 7778 | |
| 1280x720 Performance Combined (ordina per valore) | |
| HP Pavilion 15 UHD T9Y85AV | |
| Asus Strix GL502VY-DS71 | |
| Asus Strix GL502VT-DS74 | |
| HP Omen 15-ax007ng | |
| MSI GL62-6QFi781H11 | |
| HP Envy 17-n107ng | |
| Dell Inspiron 17 7778 | |
| 3DMark | |
| 1280x720 Cloud Gate Standard Graphics (ordina per valore) | |
| HP Pavilion 15 UHD T9Y85AV | |
| Asus Strix GL502VY-DS71 | |
| Asus Strix GL502VT-DS74 | |
| HP Omen 15-ax007ng | |
| MSI GL62-6QFi781H11 | |
| HP Envy 17-n107ng | |
| Dell Inspiron 17 7778 | |
| 1920x1080 Fire Strike Graphics (ordina per valore) | |
| HP Pavilion 15 UHD T9Y85AV | |
| Asus Strix GL502VY-DS71 | |
| Asus Strix GL502VT-DS74 | |
| HP Omen 15-ax007ng | |
| MSI GL62-6QFi781H11 | |
| HP Envy 17-n107ng | |
| Dell Inspiron 17 7778 | |
| Fire Strike Extreme Graphics (ordina per valore) | |
| HP Pavilion 15 UHD T9Y85AV | |
| Asus Strix GL502VY-DS71 | |
| Asus Strix GL502VT-DS74 | |
| 3840x2160 Fire Strike Ultra Graphics (ordina per valore) | |
| HP Pavilion 15 UHD T9Y85AV | |
| Asus Strix GL502VY-DS71 | |
| 3DMark 11 Performance | 5775 punti | |
| 3DMark Ice Storm Standard Score | 37758 punti | |
| 3DMark Cloud Gate Standard Score | 16612 punti | |
| 3DMark Fire Strike Score | 3954 punti | |
| 3DMark Fire Strike Extreme Score | 1990 punti | |
Aiuto | ||
| basso | medio | alto | ultra | 4K | |
|---|---|---|---|---|---|
| Sleeping Dogs (2012) | 91.2 | 24.1 | |||
| BioShock Infinite (2013) | 110 | 45.8 | |||
| Metro: Last Light (2013) | 58.4 | 31.4 | |||
| Thief (2014) | 55 | 28.2 | |||
| Batman: Arkham Knight (2015) | 34 | 22 | |||
| Metal Gear Solid V (2015) | 45.9 | 32.1 | 14.5 | ||
| Fallout 4 (2015) | 29.9 | 24.1 | |||
| Rise of the Tomb Raider (2016) | 29.6 | 23.5 | |||
| Overwatch (2016) | 66.8 | 40.2 | 19.8 |
| Rise of the Tomb Raider - 1920x1080 Very High Preset AA:FX AF:16x | |
| Asus Strix GL502VY-DS71 | |
| Asus Strix GL502VT-DS74 | |
| HP Omen 15-ax007ng | |
| HP Pavilion 15 UHD T9Y85AV | |
| Dell XPS 15 9550 i7 FHD | |
| Medion Erazer P6661 MD 99873 | |
| BioShock Infinite - 1920x1080 Ultra Preset, DX11 (DDOF) | |
| Asus Strix GL502VY-DS71 | |
| Asus Strix GL502VT-DS74 | |
| HP Pavilion 15 UHD T9Y85AV | |
| Dell XPS 15 9550 i7 FHD | |
| Medion Erazer P6661 MD 99873 | |
| Sleeping Dogs - 1920x1080 Extreme Preset AA:Extreme | |
| Asus Strix GL502VY-DS71 | |
| Asus Strix GL502VT-DS74 | |
| HP Pavilion 15 UHD T9Y85AV | |
| Dell XPS 15 9550 i7 FHD | |
| Metro: Last Light - 1920x1080 Very High (DX11) AF:16x | |
| Asus Strix GL502VT-DS74 | |
| HP Pavilion 15 UHD T9Y85AV | |
| Dell XPS 15 9550 i7 FHD | |
| Medion Erazer P6661 MD 99873 | |
| Thief - 1920x1080 Very High Preset AA:FXAA & High SS AF:8x | |
| Asus Strix GL502VY-DS71 | |
| Asus Strix GL502VT-DS74 | |
| HP Pavilion 15 UHD T9Y85AV | |
| Dell XPS 15 9550 i7 FHD | |
| Medion Erazer P6661 MD 99873 | |
| Batman: Arkham Knight - 1920x1080 High / On AA:SM AF:16x | |
| Asus Strix GL502VT-DS74 | |
| Medion Erazer P6661 MD 99873 | |
| HP Pavilion 15 UHD T9Y85AV | |
| Dell XPS 15 9550 i7 FHD | |
| Metal Gear Solid V - 1920x1080 Extra High / On | |
| Asus Strix GL502VT-DS74 | |
| Asus Strix GL502VY-DS71 | |
| Dell XPS 15 9550 i7 FHD | |
| HP Pavilion 15 UHD T9Y85AV | |
| Fallout 4 - 1920x1080 Ultra Preset AA:T AF:16x | |
| Asus Strix GL502VY-DS71 | |
| Asus Strix GL502VT-DS74 | |
| Dell XPS 15 9550 i7 FHD | |
| HP Pavilion 15 UHD T9Y85AV | |
| Overwatch - 1920x1080 Epic (Render Scale 100 %) AA:SM AF:16x | |
| Asus Strix GL502VY-DS71 | |
| HP Omen 15-ax007ng | |
| HP Pavilion 15 UHD T9Y85AV | |
Rumorosità
| Idle |
| 32.3 / 32.4 / 32.4 dB(A) |
| Sotto carico |
| 40.5 / 50.3 dB(A) |
 | ||
30 dB silenzioso 40 dB(A) udibile 50 dB(A) rumoroso |
||
min: | ||
| HP Pavilion 15 UHD T9Y85AV GeForce GTX 960M, 6700HQ, SanDisk Z400s SD8SNAT-128G | HP Pavilion 15-ak003ng GeForce GTX 950M, 6700HQ, Samsung CM871 MZNLF128HCHP | MSI GL62-6QFi781H11 GeForce GTX 960M, 6700HQ, Toshiba HG6 THNSNJ128G8NY | Asus ZenBook Pro UX501VW-DS71T GeForce GTX 960M, 6700HQ, Samsung SM951 MZVPV512HDGL m.2 PCI-e | HP Omen 15-ax007ng GeForce GTX 965M, 6700HQ, Adata IM2S3138E-128GM-B | |
|---|---|---|---|---|---|
| Noise | -7% | -5% | 8% | -3% | |
| off /ambiente * (dB) | 29.5 | 30 -2% | 30 -2% | ||
| Idle Minimum * (dB) | 32.3 | 34 -5% | 35 -8% | 28.9 11% | 32 1% |
| Idle Average * (dB) | 32.4 | 35 -8% | 36 -11% | 28.9 11% | 33 -2% |
| Idle Maximum * (dB) | 32.4 | 36 -11% | 37 -14% | 30.2 7% | 36 -11% |
| Load Average * (dB) | 40.5 | 44 -9% | 41 -1% | 41.8 -3% | 43 -6% |
| Load Maximum * (dB) | 50.3 | 51 -1% | 46 9% | 43.9 13% | 49 3% |
* ... Meglio usare valori piccoli
(±) La temperatura massima sul lato superiore è di 41 °C / 106 F, rispetto alla media di 40.4 °C / 105 F, che varia da 21.2 a 68.8 °C per questa classe Gaming.
(±) Il lato inferiore si riscalda fino ad un massimo di 42.6 °C / 109 F, rispetto alla media di 43.2 °C / 110 F
(+) In idle, la temperatura media del lato superiore è di 23.7 °C / 75 F, rispetto alla media deld ispositivo di 33.9 °C / 93 F.
(±) I poggiapolsi e il touchpad possono diventare molto caldi al tatto con un massimo di 37.2 °C / 99 F.
(-) La temperatura media della zona del palmo della mano di dispositivi simili e'stata di 28.8 °C / 83.8 F (-8.4 °C / -15.2 F).
HP Pavilion 15 UHD T9Y85AV analisi audio
(-) | altoparlanti non molto potenti (64 dB)
Analysis not possible as minimum curve is missing or too high
Apple MacBook 12 (Early 2016) 1.1 GHz analisi audio
(+) | gli altoparlanti sono relativamente potenti (83.6 dB)
Bassi 100 - 315 Hz
(±) | bassi ridotti - in media 11.3% inferiori alla media
(±) | la linearità dei bassi è media (14.2% delta rispetto alla precedente frequenza)
Medi 400 - 2000 Hz
(+) | medi bilanciati - solo only 2.4% rispetto alla media
(+) | medi lineari (5.5% delta rispetto alla precedente frequenza)
Alti 2 - 16 kHz
(+) | Alti bilanciati - appena 2% dalla media
(+) | alti lineari (4.5% delta rispetto alla precedente frequenza)
Nel complesso 100 - 16.000 Hz
(+) | suono nel complesso lineare (10.2% differenza dalla media)
Rispetto alla stessa classe
» 7% di tutti i dispositivi testati in questa classe è stato migliore, 2% simile, 91% peggiore
» Il migliore ha avuto un delta di 5%, medio di 18%, peggiore di 53%
Rispetto a tutti i dispositivi testati
» 5% di tutti i dispositivi testati in questa classe è stato migliore, 1% similare, 94% peggiore
» Il migliore ha avuto un delta di 4%, medio di 24%, peggiore di 134%
Schenker F516 Flex analisi audio
(-) | altoparlanti non molto potenti (69 dB)
Analysis not possible as minimum curve is missing or too high
| Off / Standby | |
| Idle | |
| Sotto carico |
|
Leggenda:
min: | |
| HP Pavilion 15 UHD T9Y85AV 6700HQ, GeForce GTX 960M, SanDisk Z400s SD8SNAT-128G, IPS, 3840x2160, 15.6" | HP Pavilion 15-ak003ng 6700HQ, GeForce GTX 950M, Samsung CM871 MZNLF128HCHP, IPS, 1920x1080, 15.6" | MSI GL62-6QFi781H11 6700HQ, GeForce GTX 960M, Toshiba HG6 THNSNJ128G8NY, TN LED, 1920x1080, 15.6" | Asus Zenbook Pro UX501JW-FI218H 4720HQ, GeForce GTX 960M, SanDisk SD7SN3Q128G1002, IPS, 3840x2160, 15.6" | HP Omen 15-ax007ng 6700HQ, GeForce GTX 965M, Adata IM2S3138E-128GM-B, IPS, 1920x1080, 15.6" | |
|---|---|---|---|---|---|
| Power Consumption | 14% | -8% | -24% | 4% | |
| Idle Minimum * (Watt) | 8.3 | 7 16% | 10 -20% | 15.6 -88% | 7 16% |
| Idle Average * (Watt) | 14.8 | 11 26% | 14 5% | 20.5 -39% | 11 26% |
| Idle Maximum * (Watt) | 16.8 | 17 -1% | 19 -13% | 21.2 -26% | 19 -13% |
| Load Average * (Watt) | 71 | 69 3% | 82 -15% | 75.8 -7% | 79 -11% |
| Load Maximum * (Watt) | 119.2 | 89 25% | 118 1% | 72.9 39% | 119 -0% |
* ... Meglio usare valori piccoli
| HP Pavilion 15 UHD T9Y85AV 6700HQ, GeForce GTX 960M, 61.5 Wh | HP Pavilion 15-ak003ng 6700HQ, GeForce GTX 950M, 48 Wh | MSI GL62-6QFi781H11 6700HQ, GeForce GTX 960M, 41.4 Wh | Asus ZenBook Pro UX501VW-DS71T 6700HQ, GeForce GTX 960M, 96 Wh | HP Omen 15-ax007ng 6700HQ, GeForce GTX 965M, 61.5 Wh | |
|---|---|---|---|---|---|
| Autonomia della batteria | -3% | -33% | 34% | -2% | |
| Reader / Idle (h) | 8.5 | 9.5 12% | 5.7 -33% | 11.5 35% | 7.8 -8% |
| WiFi v1.3 (h) | 4.4 | 5.1 16% | 2.6 -41% | 6.3 43% | 4.5 2% |
| Load (h) | 1.6 | 1 -37% | 1.2 -25% | 2 25% | 1.6 0% |
Pro
Contro

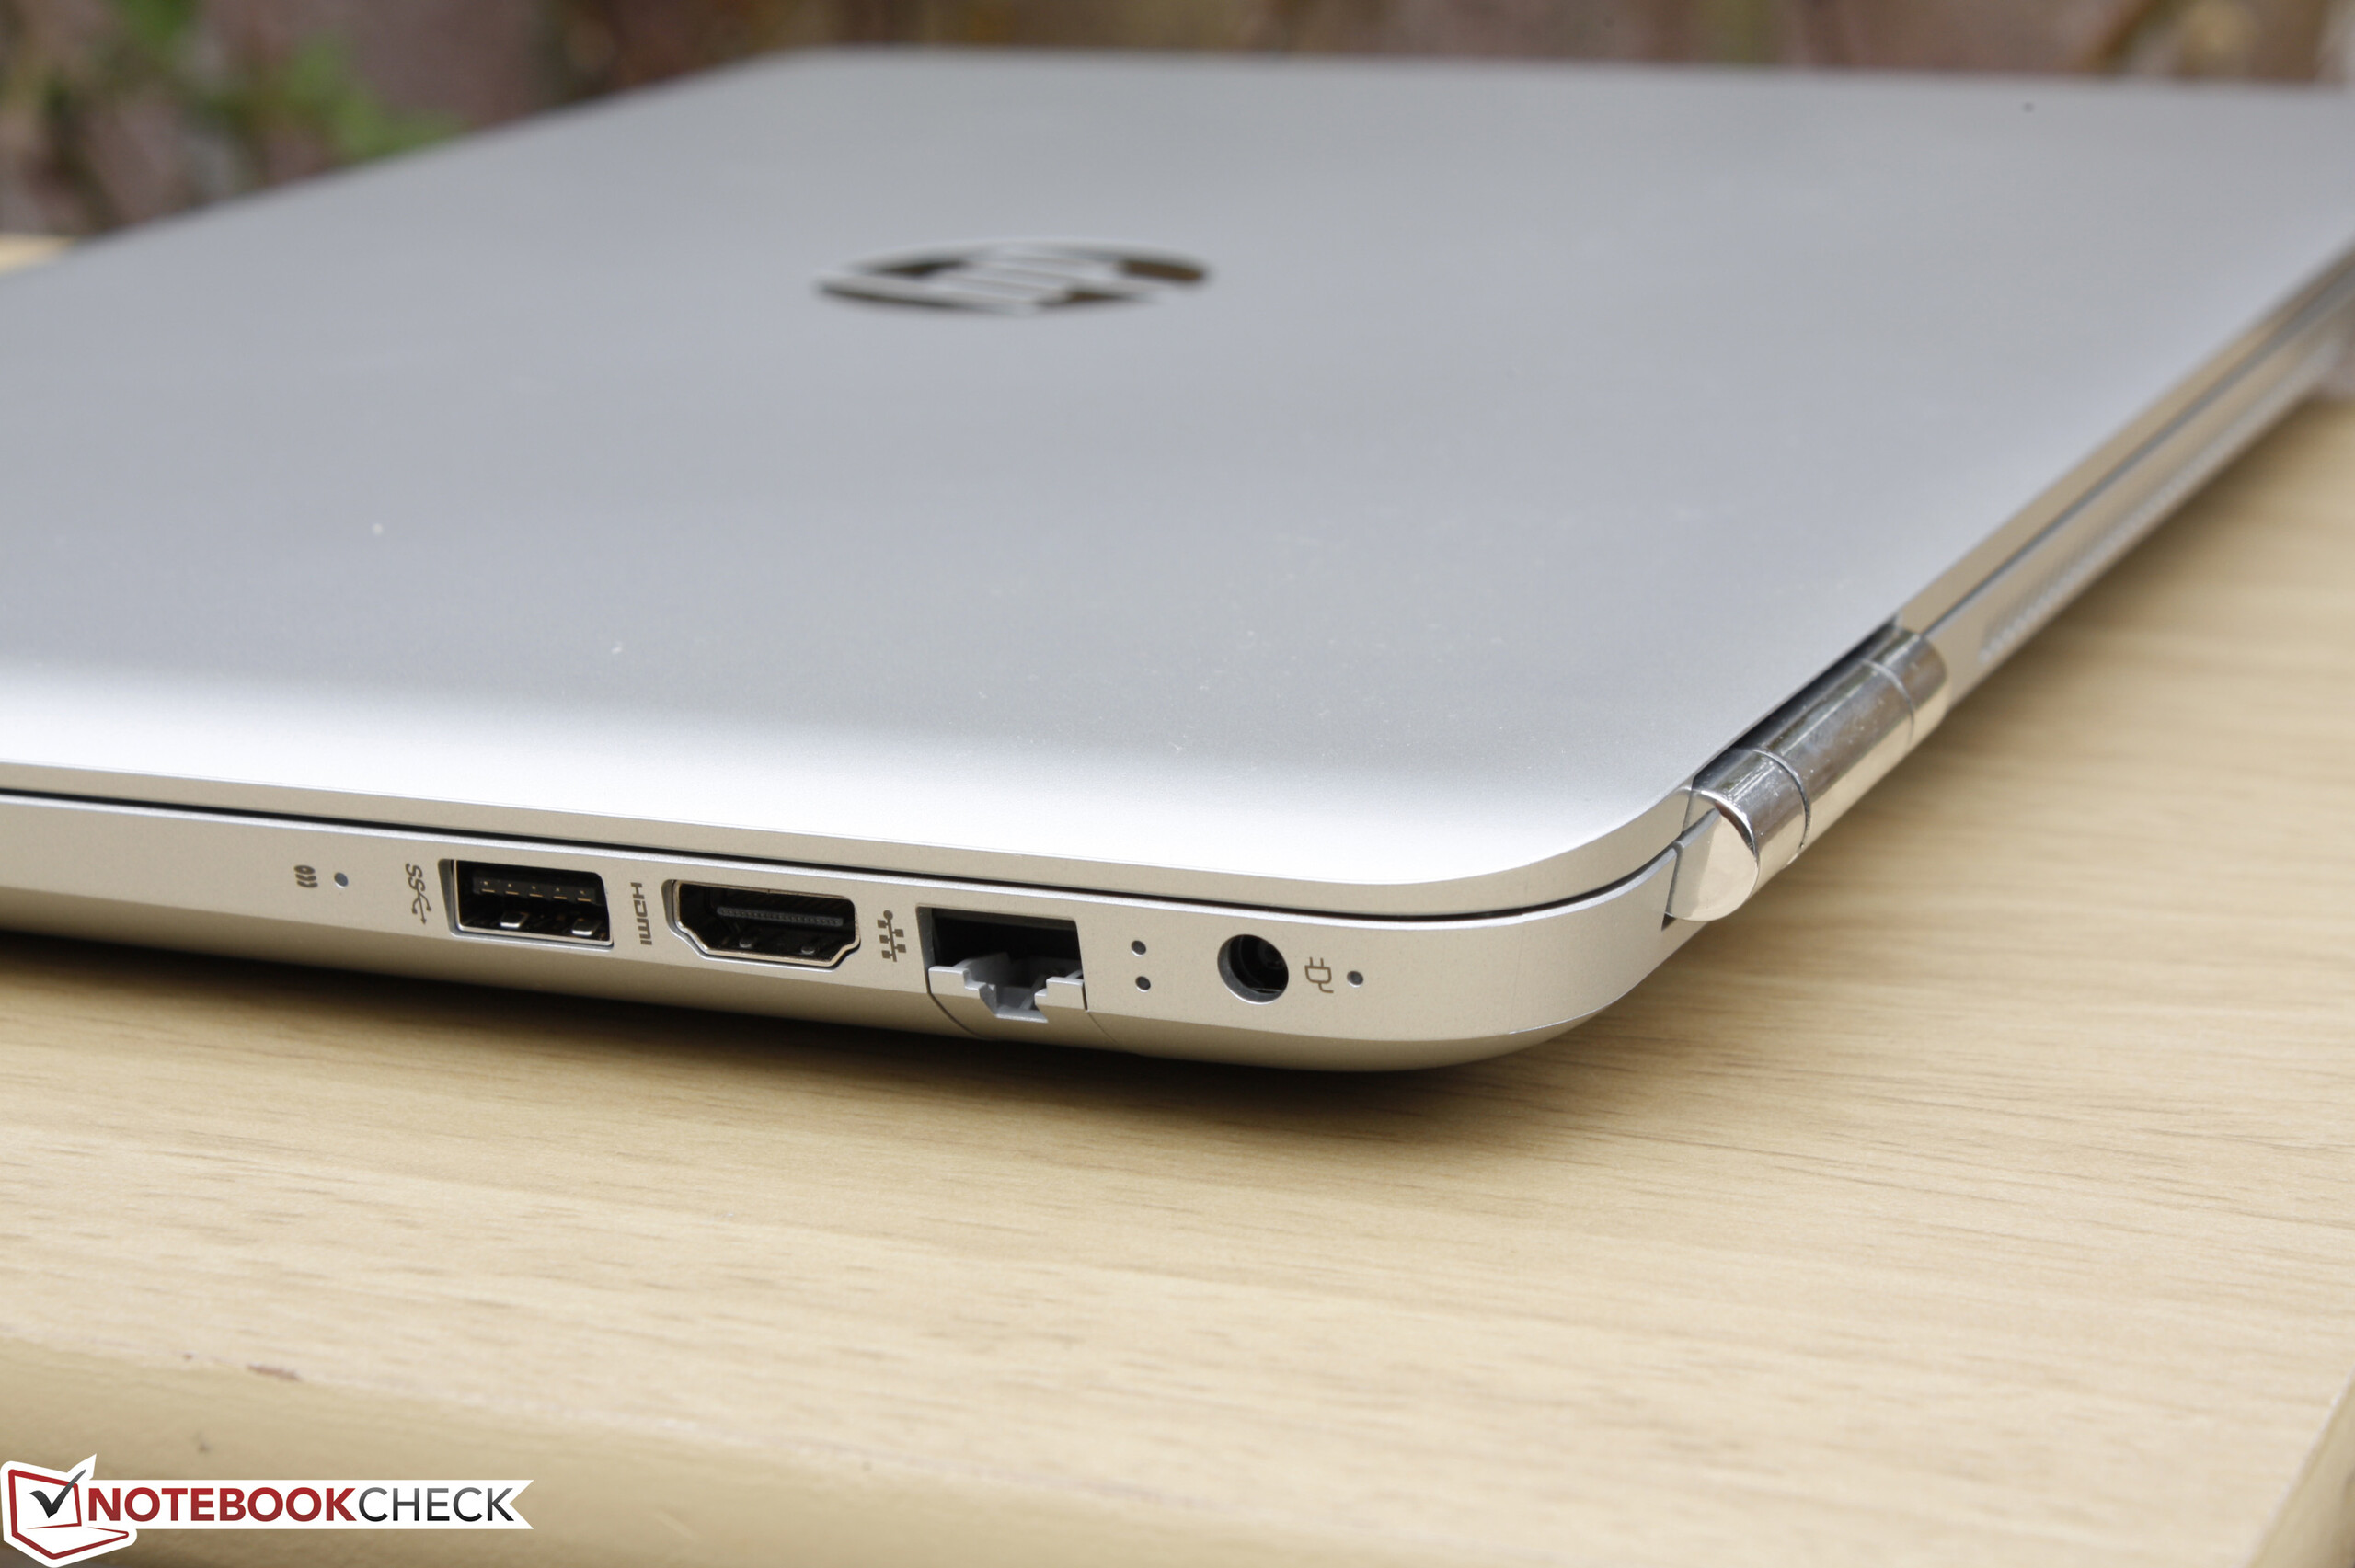
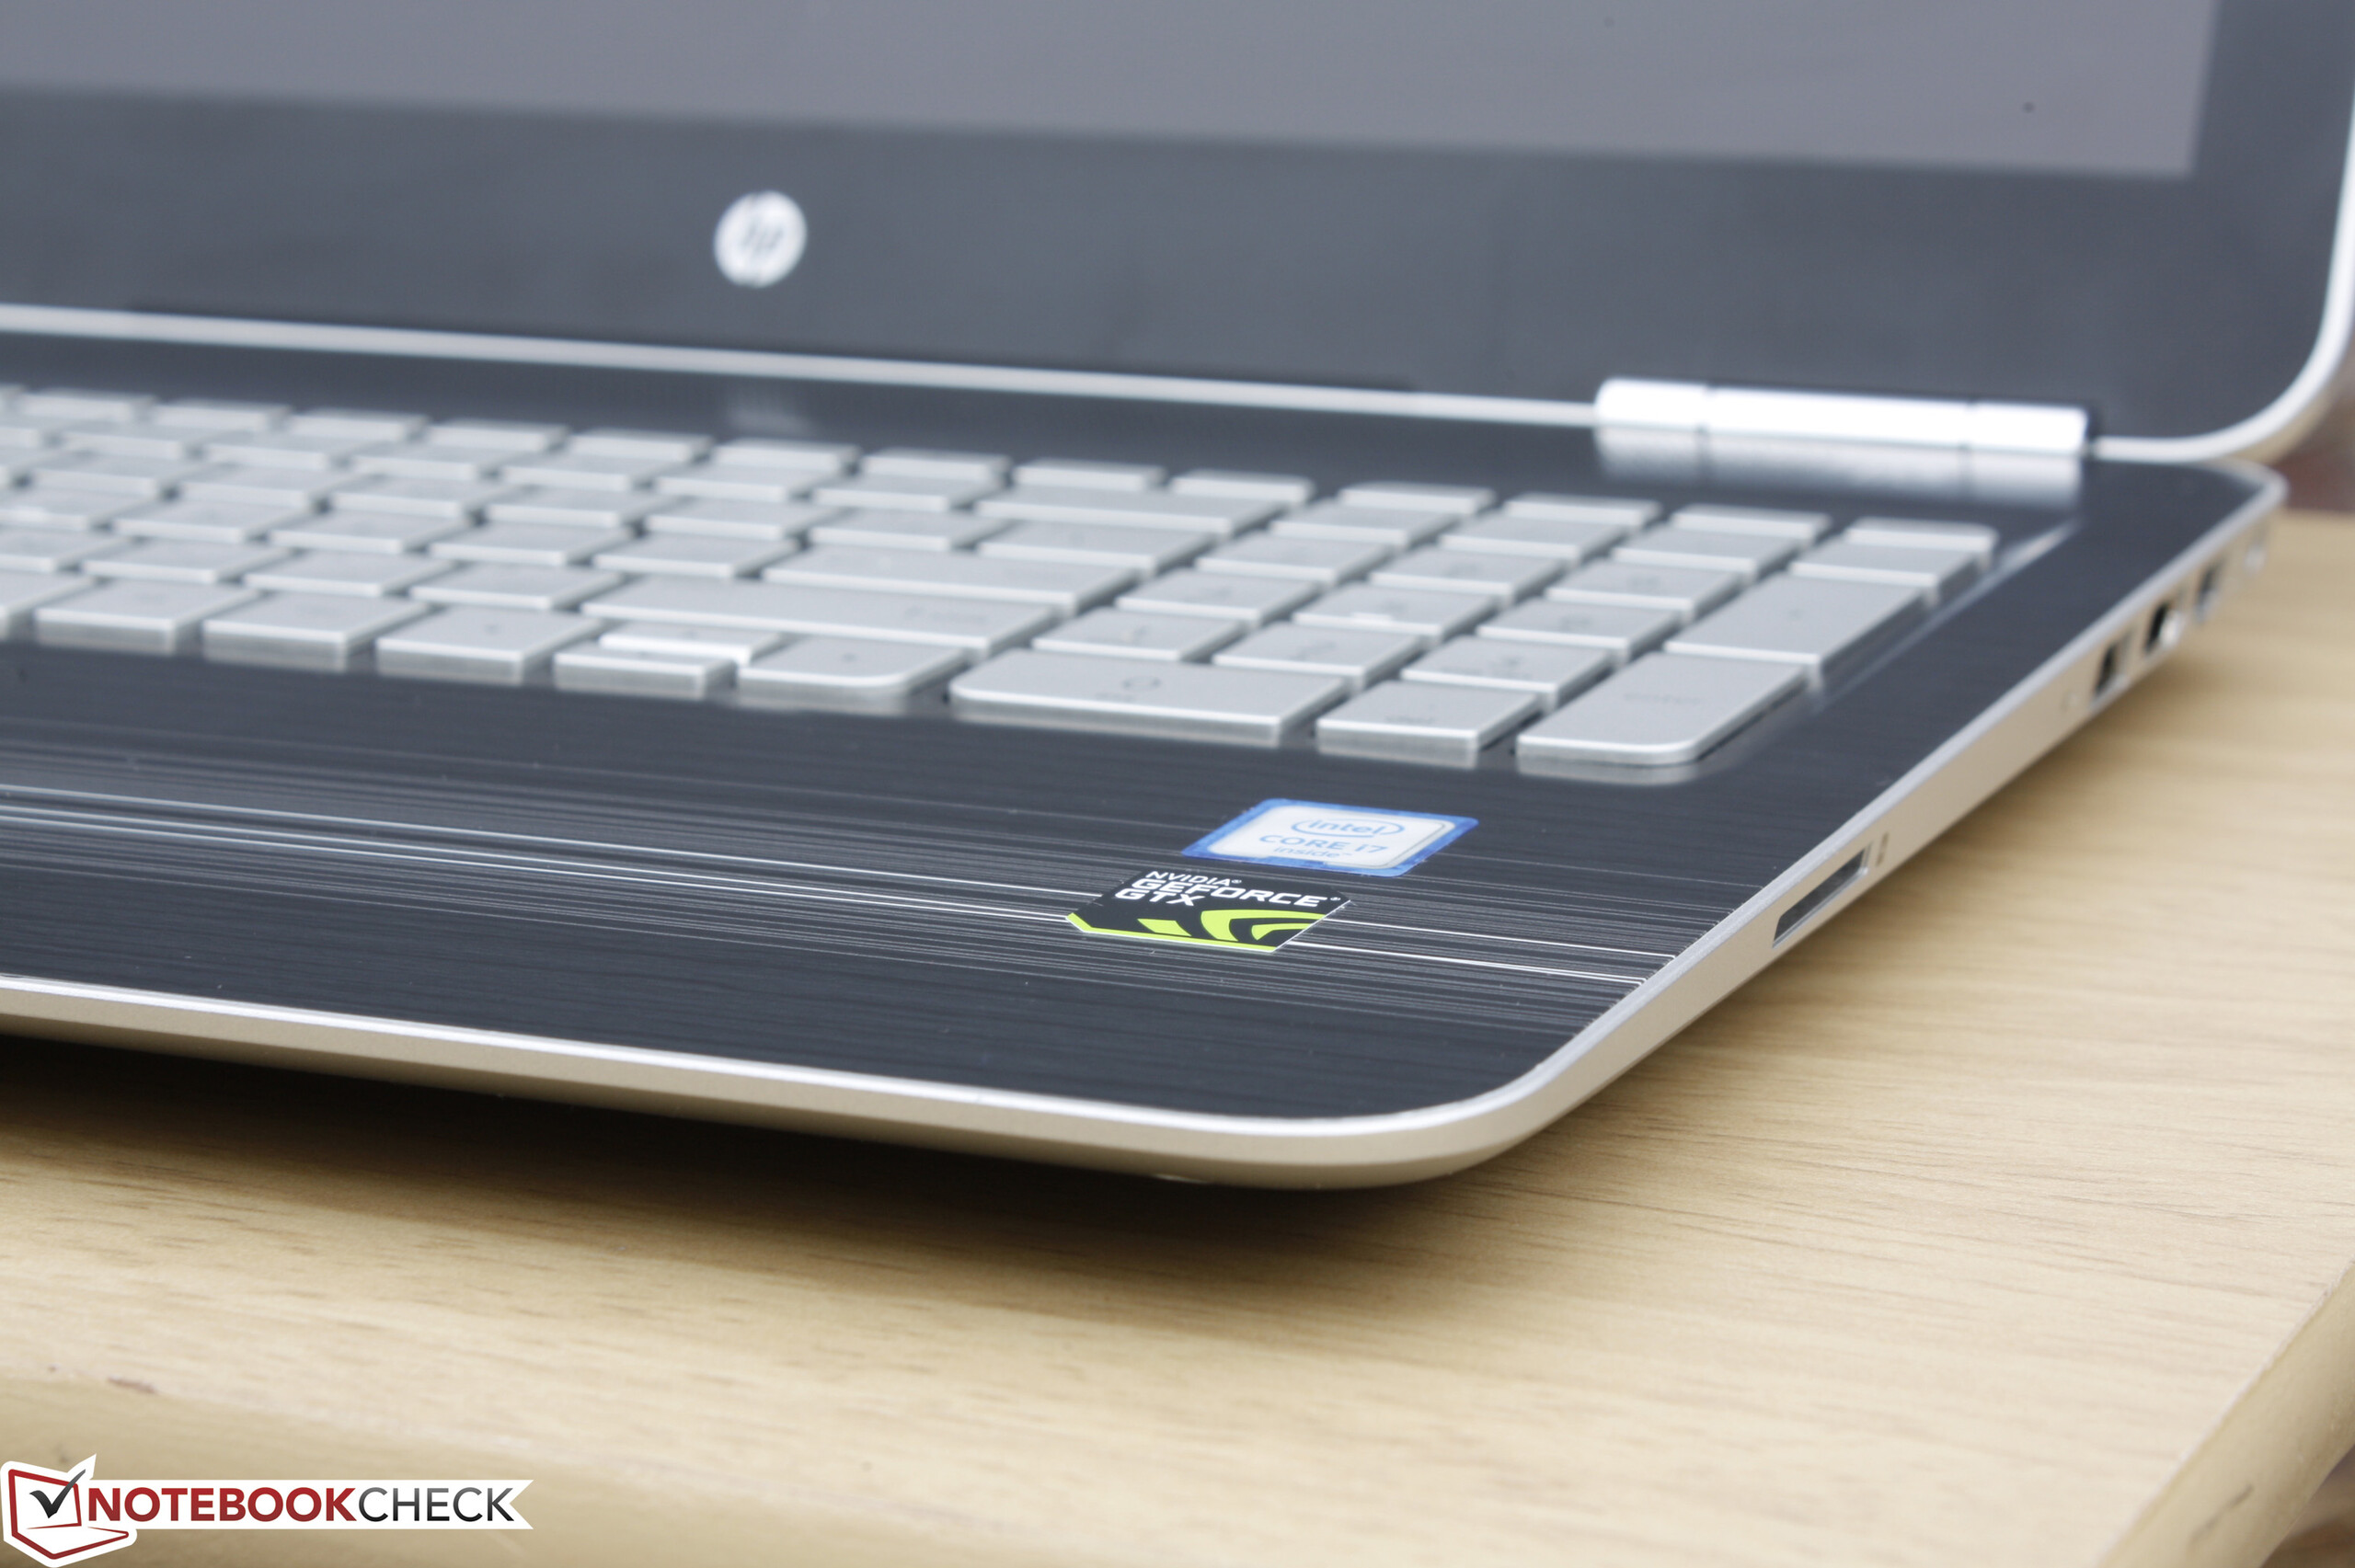
Il nuovo Pavilion 15 è a metà tra il Pavilion 15 del 2015 con GTX 950M e l'ultimo Omen 15 con GTX 965M lanciato appena qualche settimana fa. Pertanto, anche il prezzo cosa qualcosa in meno rispetto al modello entry-level ma con migliori prestazioni grafiche Omen 15. Poiché entrambi questi modelli sono per il resto identici, il Pavilion 15 è più attraente per coloro che vogliono prestazioni gaming 1080p per $1000 USD o meno. Di base è un portatile factotum per lavorare e giocare.
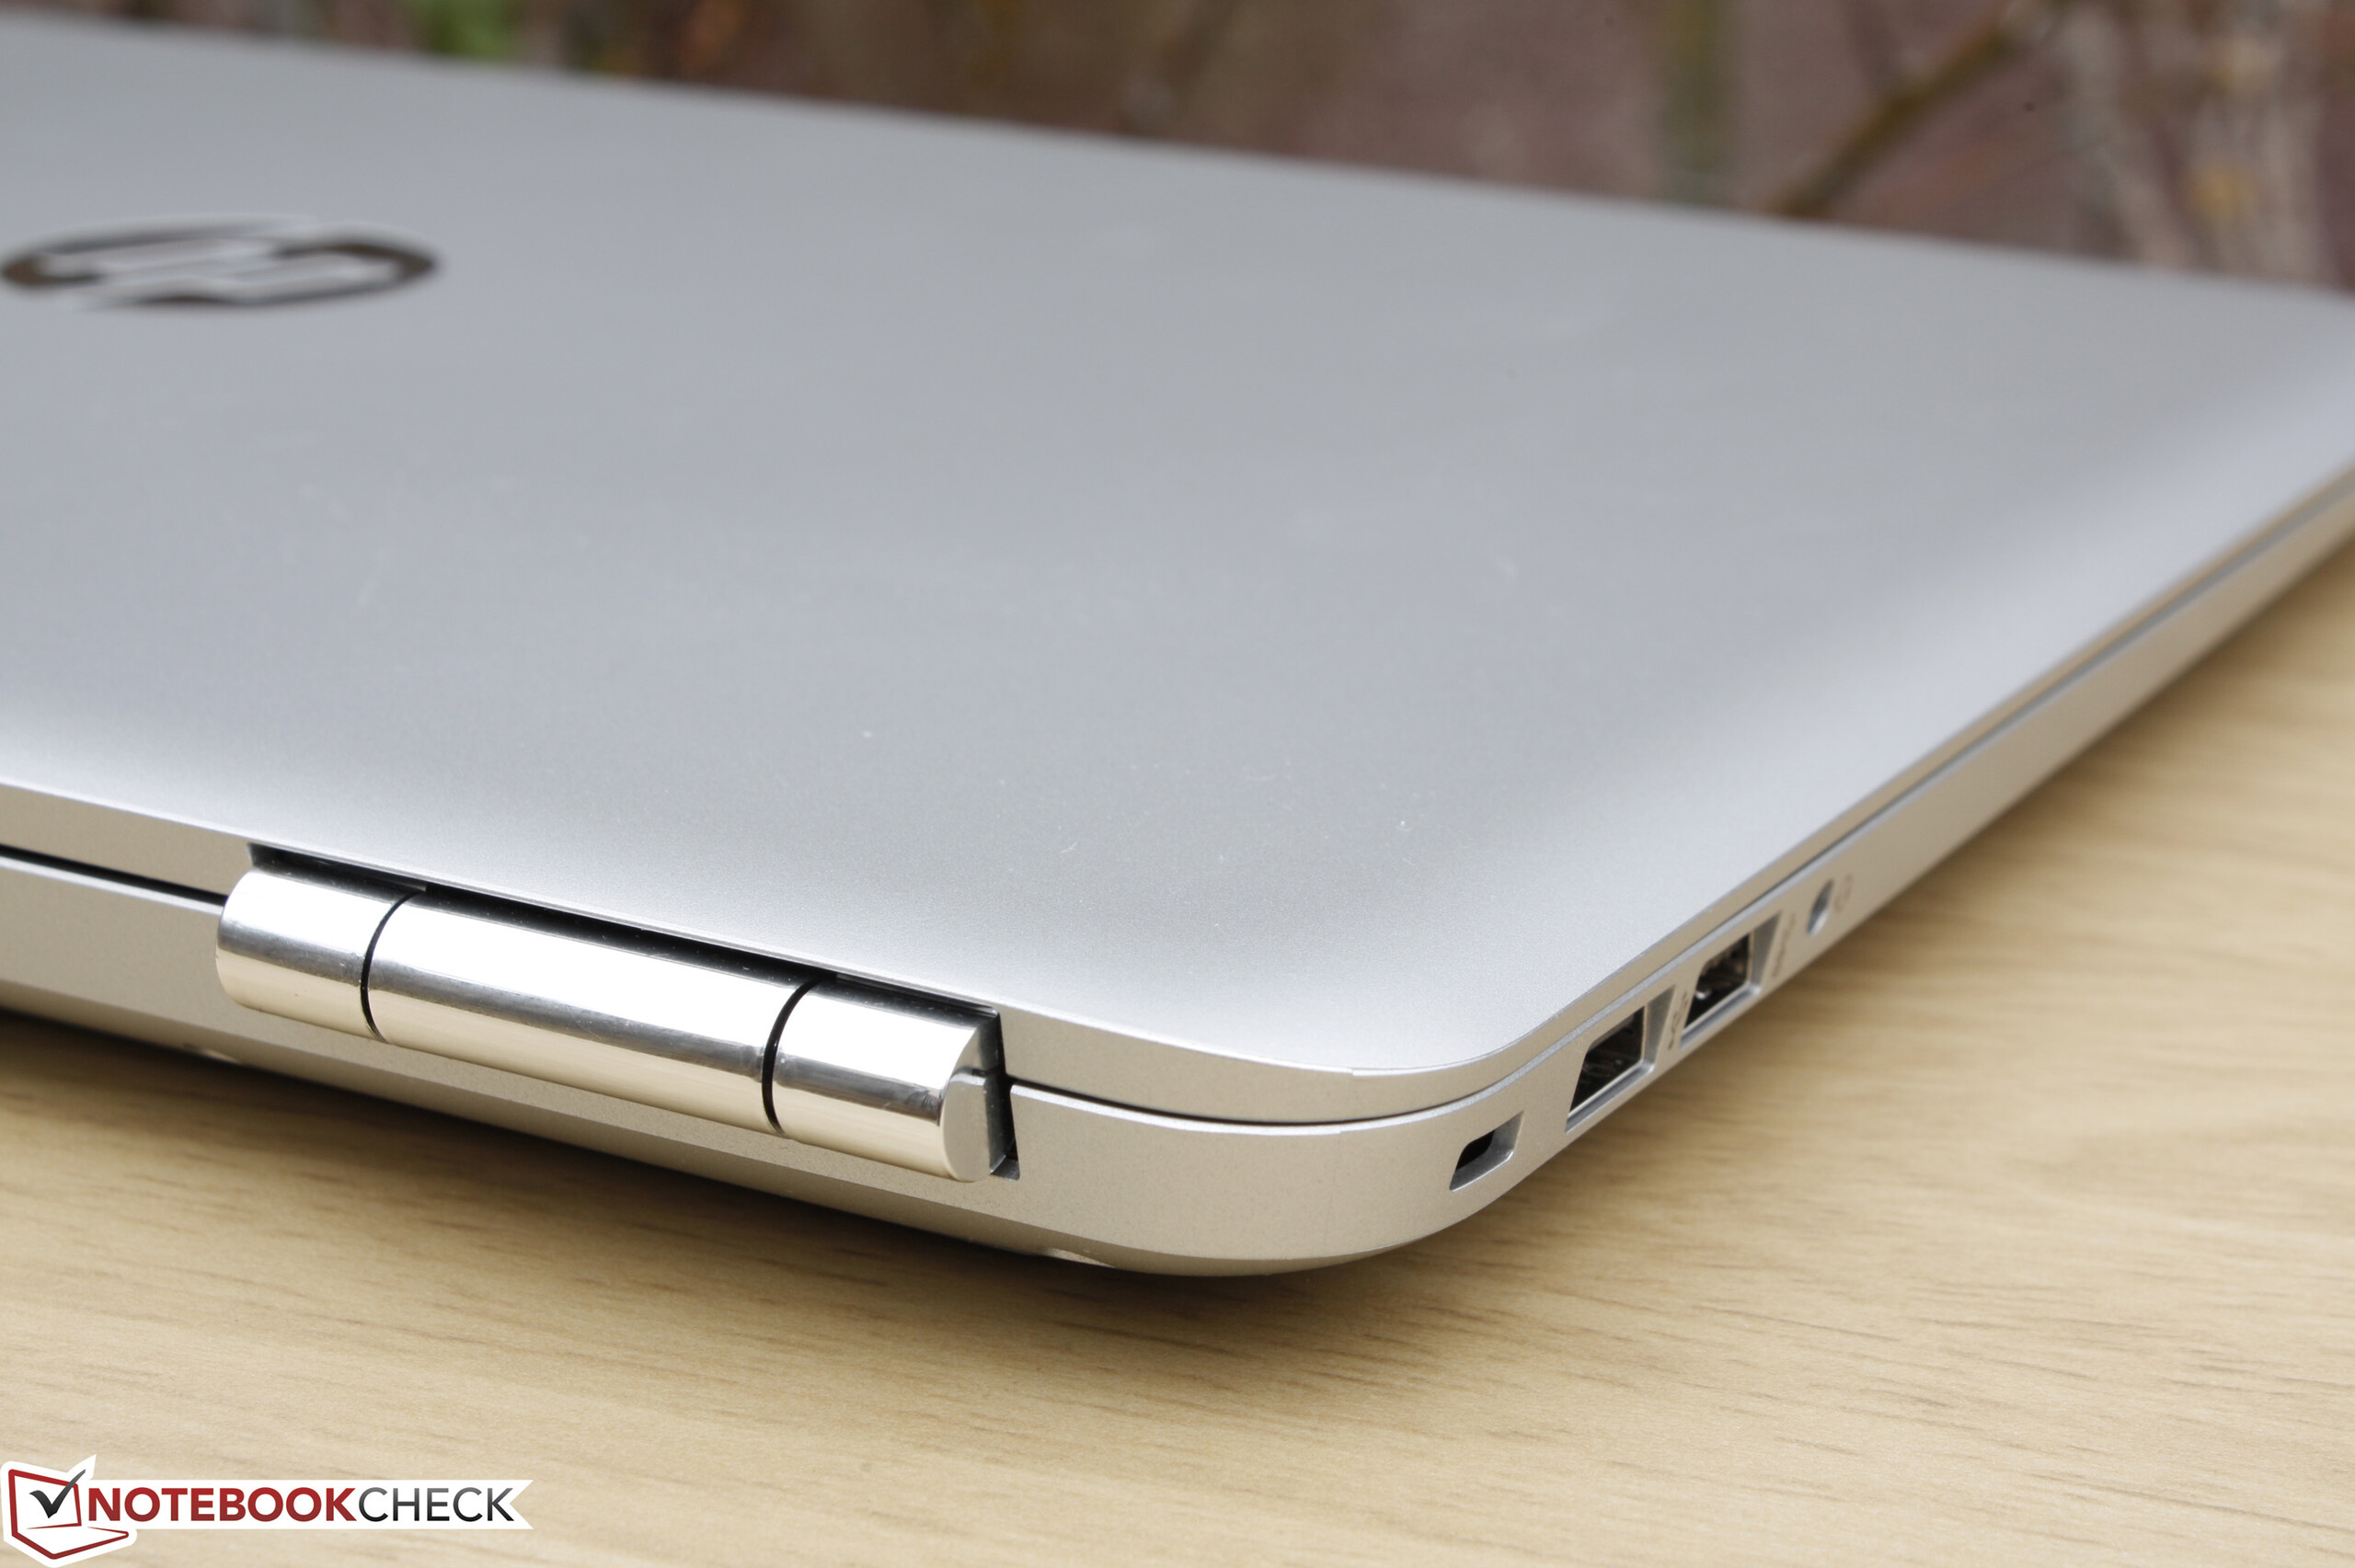
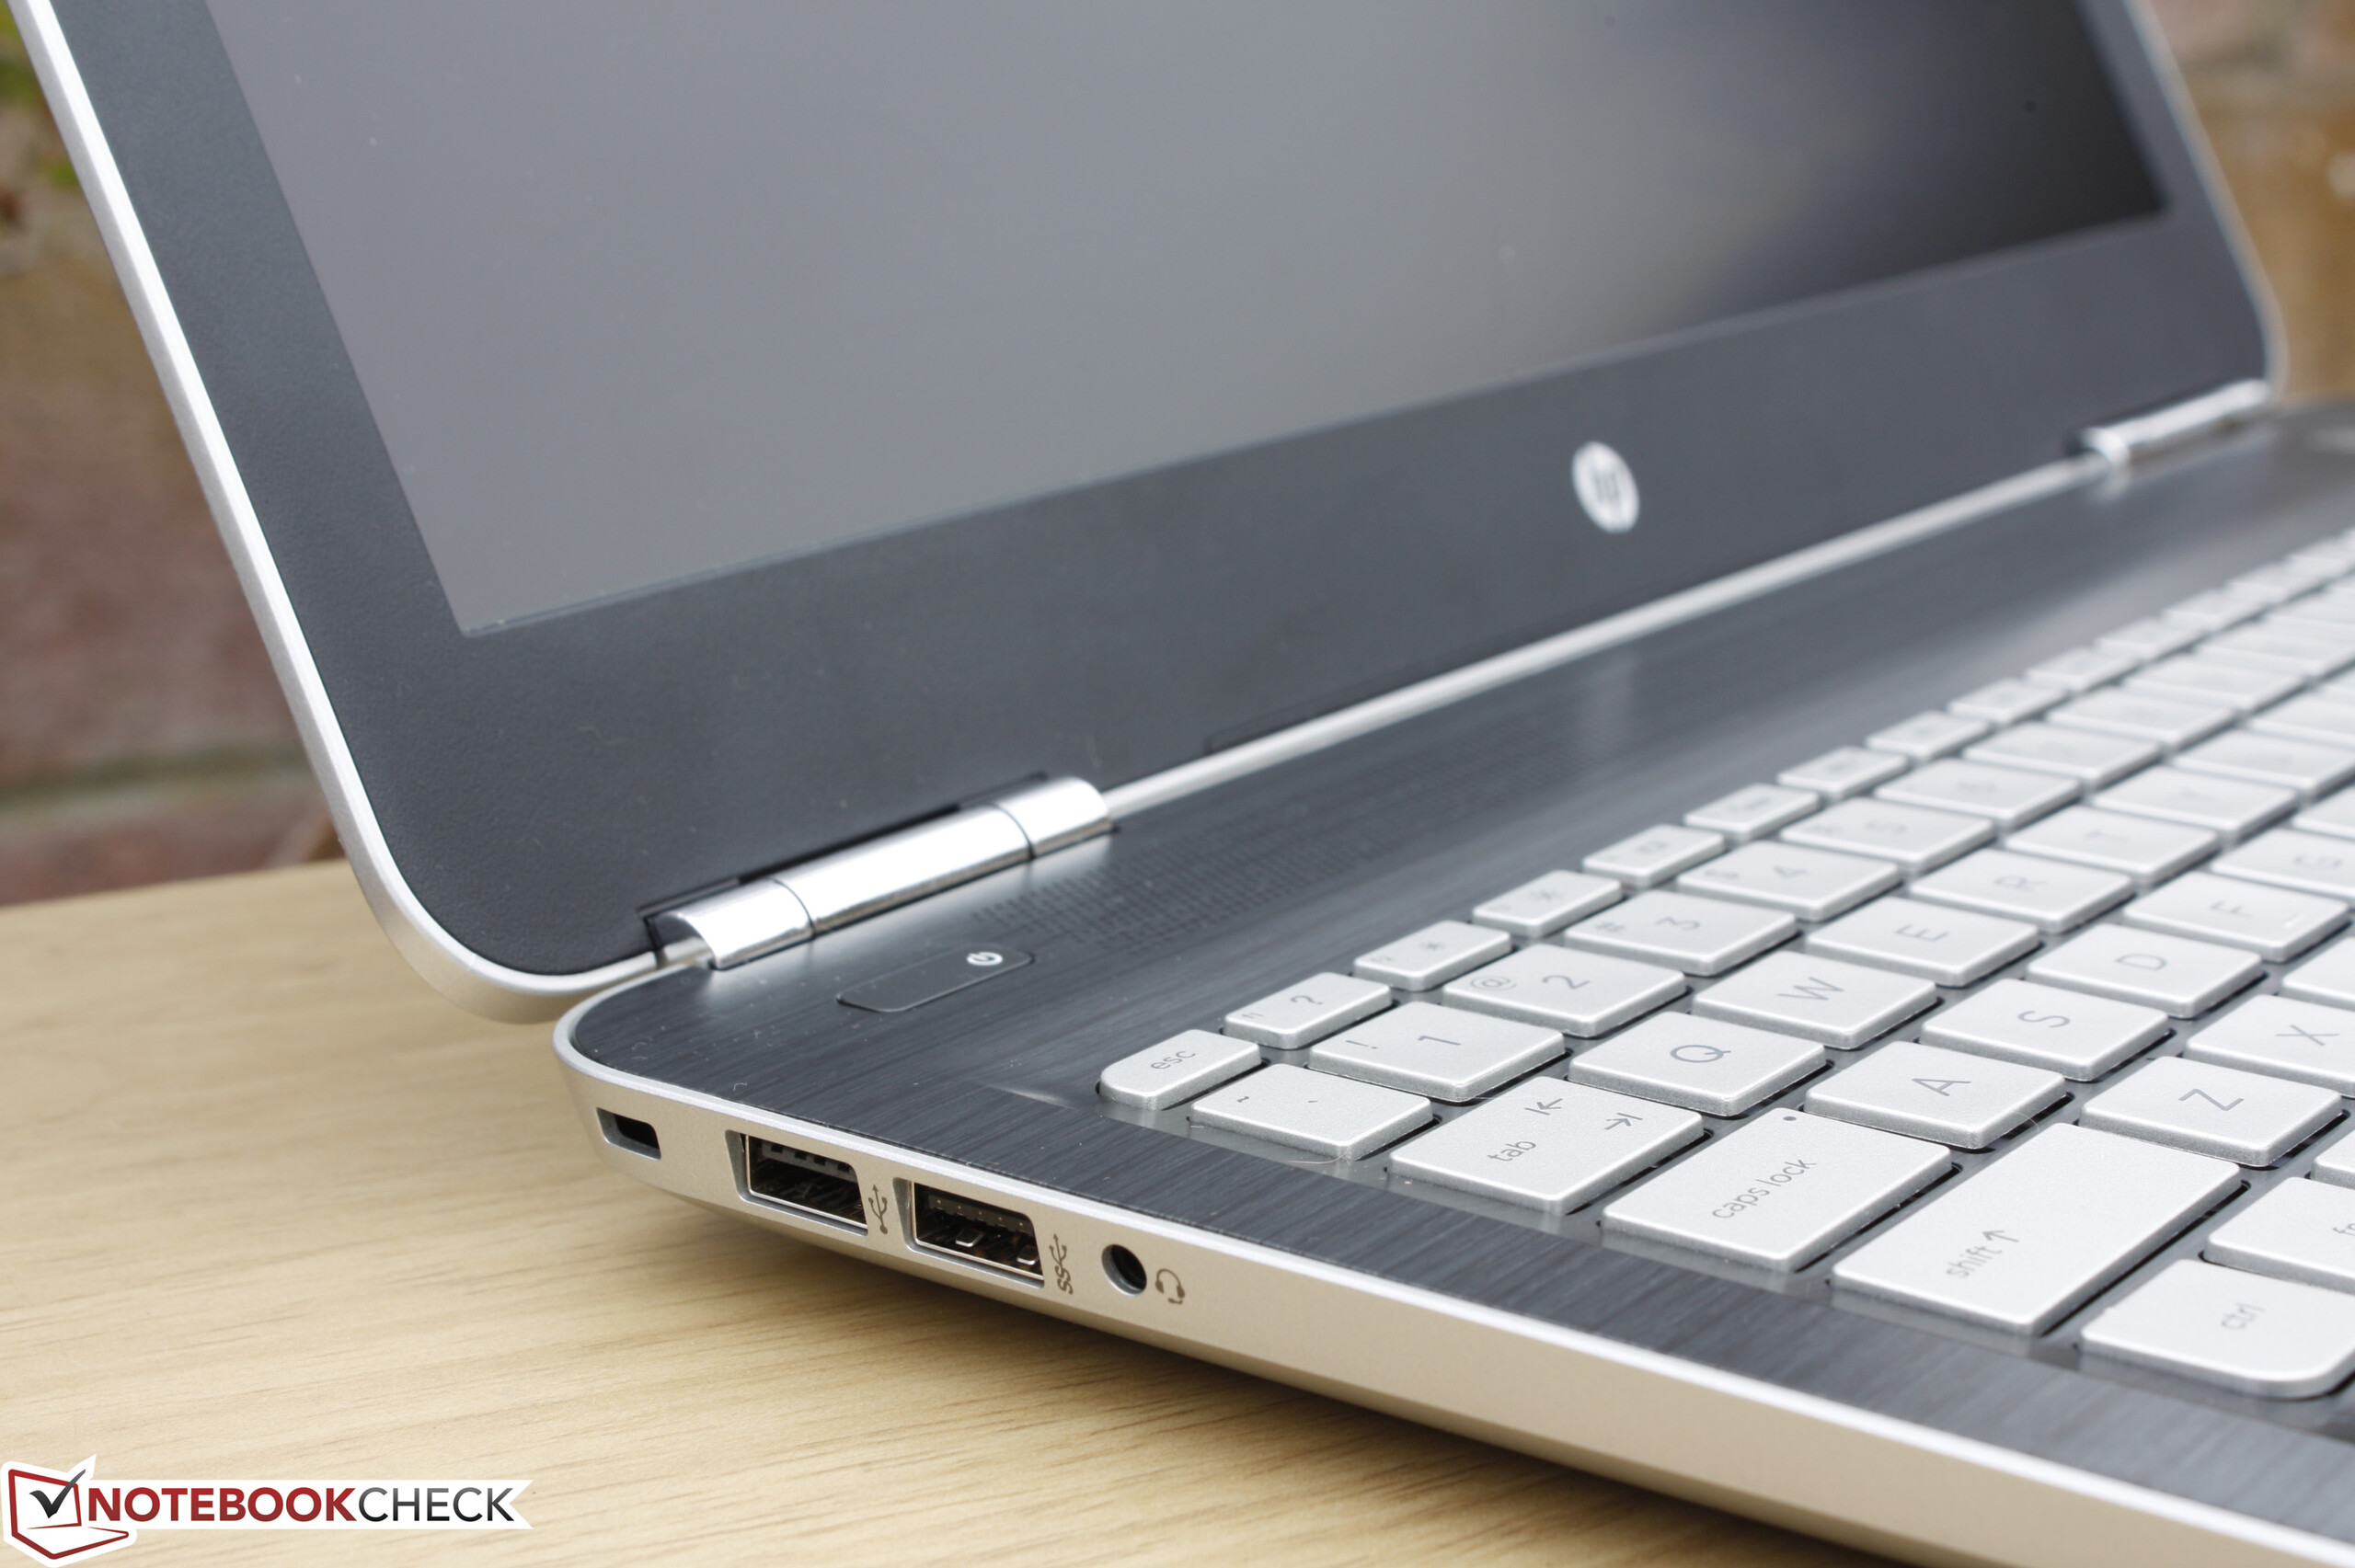
Pur non essendo deludente, l'ultimo Pavilion 15 ha essenzialmente un rinnovo dello chassis rispetto al suo predecessore e non offre nulla per distinguersi dalla massa. Non sarebbe un problema se non ci fossero Asus UX501 o Dell XPS 15, entrambi con GPU high performance GTX 960M. L'XPS 15 è nettamente più leggero r portatile e diventa difficile raccomandare l'HP con valide alternative da 15" già disponibili. In questo caso, il principale vantaggio del Pavilion 15 sta nel prezzo inferiore e potrebbe valere la pena passare alla configurazione UHD per il pannello FHD che si accoppia ad una GPU più adeguata.
Un sistema barebones multimedia e gaming per un prezzo inferiore rispetto alla concorrenza. Hardware e features sono poco sorprendenti rispetto alla concorrenza, ma le sue capacità gaming dovrebbero attirare i gamers che non vogliono spendere molto.
Nota: si tratta di una recensione breve, con alcune sezioni non tradotte, per la versione integrale in inglese guardate qui.
HP Pavilion 15 UHD T9Y85AV
- 08/05/2016 v5.1 (old)
Allen Ngo
Price comparison
