Recensione Breve del Portatile MSI GL62 6QF
| |||||||||||||||||||||||||
Distribuzione della luminosità: 83 %
Al centro con la batteria: 216 cd/m²
Contrasto: 450:1 (Nero: 0.48 cd/m²)
ΔE ColorChecker Calman: 9.98 | ∀{0.5-29.43 Ø4.73}
ΔE Greyscale Calman: 10.91 | ∀{0.09-98 Ø4.97}
100% sRGB (Argyll 1.6.3 3D)
75% AdobeRGB 1998 (Argyll 1.6.3 3D)
84.1% AdobeRGB 1998 (Argyll 3D)
99.8% sRGB (Argyll 3D)
85.8% Display P3 (Argyll 3D)
Gamma: 2.31
CCT: 13185 K
| MSI GL62-6QFi781H11 CMN N156HGE-EAL (CMN15D2) | Acer Aspire V15 Nitro BE VN7-592G-79DV Sharp LQ156D1JW02D | Asus G501VW-FY081T Samsung 156HL01-104 | Gigabyte P55K v5 Name: AU Optronics B156HAN01.2, ID: AUO12ED | Schenker XMG A516 LG Philips LP156WF6 (LGD046F) | HP Omen 15-ax007ng LGD0519 | |
|---|---|---|---|---|---|---|
| Display | 6% | -14% | -16% | -23% | -36% | |
| Display P3 Coverage (%) | 85.8 | 86.2 0% | 66.8 -22% | 65.9 -23% | 64.7 -25% | 59.9 -30% 40.34 -53% |
| sRGB Coverage (%) | 99.8 | 100 0% | 97.3 -3% | 91 -9% | 83.2 -17% | 85.9 -14% 60.3 -40% |
| AdobeRGB 1998 Coverage (%) | 84.1 | 99.5 18% | 68.6 -18% | 60.8 -28% | 61.6 -27% 41.73 -50% | |
| Response Times | -12% | -43% | -7% | 1% | -32% | |
| Response Time Grey 50% / Grey 80% * (ms) | 43 ? | 49 ? -14% | 50 ? -16% | 37.2 ? 13% | 41 ? 5% | 55 ? -28% |
| Response Time Black / White * (ms) | 23 ? | 25 ? -9% | 39 ? -70% | 29.2 ? -27% | 24 ? -4% | 31 ? -35% |
| PWM Frequency (Hz) | 1000 ? | 1000 ? | 200 ? | |||
| Screen | 57% | 43% | 30% | 39% | 13% | |
| Brightness middle (cd/m²) | 216 | 303 40% | 341 58% | 274.9 27% | 312 44% | 214 -1% |
| Brightness (cd/m²) | 202 | 291 44% | 312 54% | 259 28% | 303 50% | 203 0% |
| Brightness Distribution (%) | 83 | 83 0% | 83 0% | 72 -13% | 92 11% | 79 -5% |
| Black Level * (cd/m²) | 0.48 | 0.22 54% | 0.32 33% | 0.367 24% | 0.3 37% | 0.28 42% |
| Contrast (:1) | 450 | 1377 206% | 1066 137% | 749 66% | 1040 131% | 764 70% |
| Colorchecker dE 2000 * | 9.98 | 3.47 65% | 4.23 58% | 3.39 66% | 5.11 49% | 6.04 39% |
| Colorchecker dE 2000 max. * | 17.12 | 6.79 60% | 8.02 53% | 5.76 66% | 8.96 48% | 12 30% |
| Greyscale dE 2000 * | 10.91 | 1.17 89% | 4.69 57% | 4.21 61% | 4.41 60% | 5.91 46% |
| Gamma | 2.31 95% | 2.35 94% | 2.53 87% | 2.18 101% | 2.5 88% | 2.44 90% |
| CCT | 13185 49% | 6658 98% | 7549 86% | 6069 107% | 6789 96% | 7362 88% |
| Color Space (Percent of AdobeRGB 1998) (%) | 75 | 86 15% | 63 -16% | 59.2 -21% | 55 -27% | 38 -49% |
| Color Space (Percent of sRGB) (%) | 100 | 100 0% | 97 -3% | 90.9 -9% | 83 -17% | 60 -40% |
| Media totale (Programma / Settaggio) | 17% /
38% | -5% /
20% | 2% /
18% | 6% /
21% | -18% /
-8% |
* ... Meglio usare valori piccoli
Tempi di risposta del Display
| ↔ Tempi di risposta dal Nero al Bianco | ||
|---|---|---|
| 23 ms ... aumenta ↗ e diminuisce ↘ combinato | ↗ 7 ms Incremento | 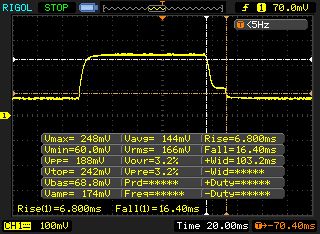 |
| ↘ 16 ms Calo | ||
| Lo schermo mostra buoni tempi di risposta durante i nostri tests, ma potrebbe essere troppo lento per i gamers competitivi. In confronto, tutti i dispositivi di test variano da 0.1 (minimo) a 240 (massimo) ms. » 52 % di tutti i dispositivi è migliore. Questo significa che i tempi di risposta rilevati sono peggiori rispetto alla media di tutti i dispositivi testati (19.9 ms). | ||
| ↔ Tempo di risposta dal 50% Grigio all'80% Grigio | ||
| 43 ms ... aumenta ↗ e diminuisce ↘ combinato | ↗ 21 ms Incremento | 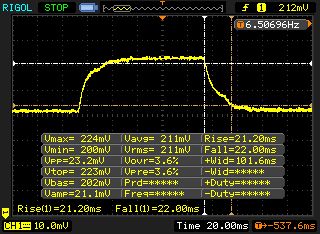 |
| ↘ 22 ms Calo | ||
| Lo schermo mostra tempi di risposta lenti nei nostri tests e sarà insoddisfacente per i gamers. In confronto, tutti i dispositivi di test variano da 0.165 (minimo) a 636 (massimo) ms. » 71 % di tutti i dispositivi è migliore. Questo significa che i tempi di risposta rilevati sono peggiori rispetto alla media di tutti i dispositivi testati (31.1 ms). | ||
Sfarfallio dello schermo / PWM (Pulse-Width Modulation)
| flickering dello schermo / PWM rilevato | 1000 Hz | ≤ 80 % settaggio luminosita' | 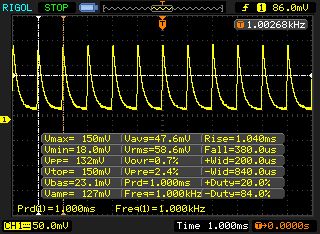 |
Il display sfarfalla a 1000 Hz (Probabilmente a causa dell'uso di PWM) Flickering rilevato ad una luminosita' di 80 % o inferiore. Non dovrebbe verificarsi flickering o PWM sopra questo valore di luminosita'. La frequenza di 1000 Hz è abbastanza alta, quindi la maggioranza degli utenti sensibili al PWM non dovrebbero notare alcun flickering. In confronto: 52 % di tutti i dispositivi testati non utilizza PWM per ridurre la luminosita' del display. Se è rilevato PWM, una media di 7801 (minimo: 5 - massimo: 343500) Hz è stata rilevata. | |||
| Cinebench R15 | |
| CPU Single 64Bit | |
| Asus G501VW-FY081T | |
| Schenker XMG A516 | |
| HP Omen 15-ax007ng | |
| Gigabyte P55K v5 | |
| MSI GL62-6QFi781H11 | |
| Acer Aspire V15 Nitro BE VN7-592G-79DV | |
| CPU Multi 64Bit | |
| Schenker XMG A516 | |
| Gigabyte P55K v5 | |
| HP Omen 15-ax007ng | |
| Asus G501VW-FY081T | |
| MSI GL62-6QFi781H11 | |
| Acer Aspire V15 Nitro BE VN7-592G-79DV | |
| Cinebench R11.5 | |
| CPU Single 64Bit | |
| Schenker XMG A516 | |
| Asus G501VW-FY081T | |
| HP Omen 15-ax007ng | |
| Acer Aspire V15 Nitro BE VN7-592G-79DV | |
| MSI GL62-6QFi781H11 | |
| Gigabyte P55K v5 | |
| CPU Multi 64Bit | |
| Gigabyte P55K v5 | |
| MSI GL62-6QFi781H11 | |
| HP Omen 15-ax007ng | |
| Schenker XMG A516 | |
| Asus G501VW-FY081T | |
| Acer Aspire V15 Nitro BE VN7-592G-79DV | |
| PCMark 7 Score | 5666 punti | |
| PCMark 8 Home Score Accelerated v2 | 3603 punti | |
| PCMark 8 Creative Score Accelerated v2 | 4375 punti | |
| PCMark 8 Work Score Accelerated v2 | 4951 punti | |
Aiuto | ||
| PCMark 7 - Score | |
| Schenker XMG A516 | |
| Acer Aspire V15 Nitro BE VN7-592G-79DV | |
| HP Omen 15-ax007ng | |
| MSI GL62-6QFi781H11 | |
| Asus G501VW-FY081T | |
| PCMark 8 | |
| Home Score Accelerated v2 | |
| HP Omen 15-ax007ng | |
| Gigabyte P55K v5 | |
| MSI GL62-6QFi781H11 | |
| Asus G501VW-FY081T | |
| Acer Aspire V15 Nitro BE VN7-592G-79DV | |
| Creative Score Accelerated v2 | |
| HP Omen 15-ax007ng | |
| Gigabyte P55K v5 | |
| Acer Aspire V15 Nitro BE VN7-592G-79DV | |
| Asus G501VW-FY081T | |
| MSI GL62-6QFi781H11 | |
| Work Score Accelerated v2 | |
| HP Omen 15-ax007ng | |
| Gigabyte P55K v5 | |
| MSI GL62-6QFi781H11 | |
| Asus G501VW-FY081T | |
| Acer Aspire V15 Nitro BE VN7-592G-79DV | |

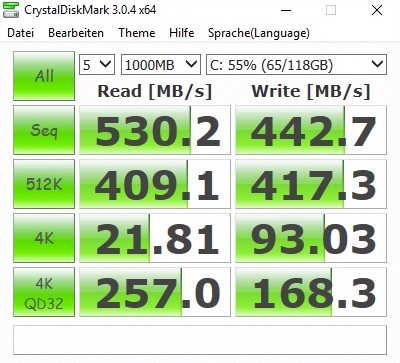
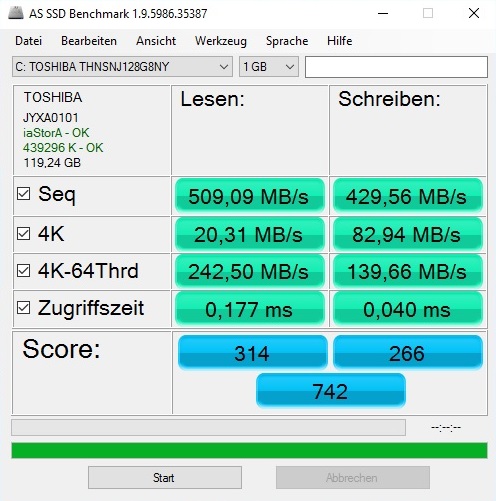
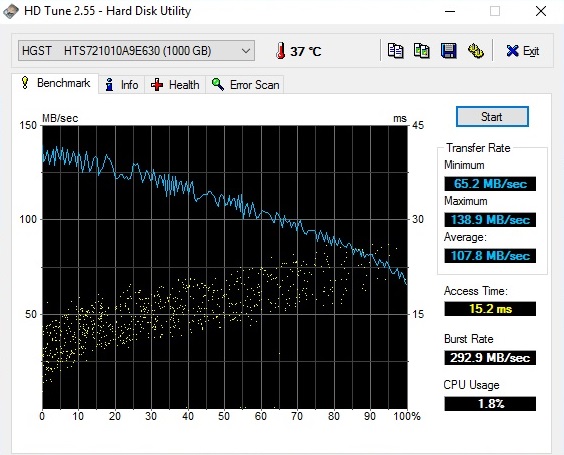
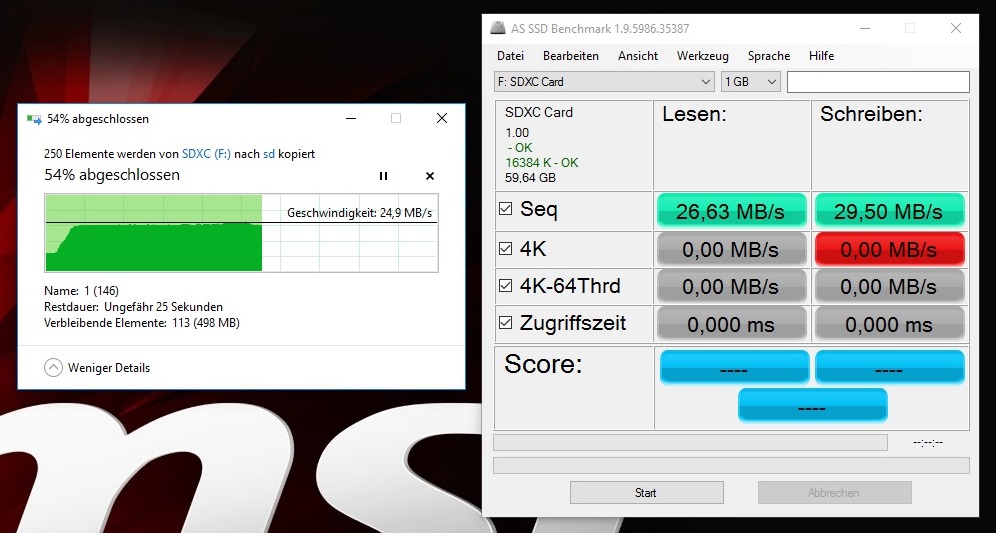
| MSI GL62-6QFi781H11 Toshiba HG6 THNSNJ128G8NY | Acer Aspire V15 Nitro BE VN7-592G-79DV Lite-On CV1-8B512 M.2 512 GB | Asus G501VW-FY081T Samsung CM871 MZNLF128HCHP | Gigabyte P55K v5 SanDisk SD8SN8U1T001122 | Schenker XMG A516 Samsung SSD 950 Pro 256GB m.2 NVMe | HP Omen 15-ax007ng Adata IM2S3138E-128GM-B | |
|---|---|---|---|---|---|---|
| AS SSD | 1% | -46% | -5% | 166% | -8% | |
| Seq Read (MB/s) | 509 | 514 1% | 504 -1% | 467.6 -8% | 2005 294% | 478.3 -6% |
| Seq Write (MB/s) | 429.6 | 424.8 -1% | 126.9 -70% | 360.4 -16% | 916 113% | 161 -63% |
| 4K Read (MB/s) | 20.31 | 21.75 7% | 13.87 -32% | 25.09 24% | 48.47 139% | 29.31 44% |
| 4K Write (MB/s) | 82.9 | 67.9 -18% | 30.66 -63% | 46.73 -44% | 136.8 65% | 73.3 -12% |
| Score Total (Points) | 742 | 859 16% | 269 -64% | 868 17% | 2356 218% | 704 -5% |
| 3DMark 11 Performance | 5178 punti | |
| 3DMark Ice Storm Standard Score | 64476 punti | |
| 3DMark Cloud Gate Standard Score | 16887 punti | |
| 3DMark Fire Strike Score | 3954 punti | |
Aiuto | ||
| 3DMark | |
| 1920x1080 Fire Strike Score | |
| Schenker XMG A516 | |
| HP Omen 15-ax007ng | |
| Gigabyte P55K v5 | |
| Asus G501VW-FY081T | |
| Acer Aspire V15 Nitro BE VN7-592G-79DV | |
| MSI GL62-6QFi781H11 | |
| 1920x1080 Fire Strike Graphics | |
| Schenker XMG A516 | |
| HP Omen 15-ax007ng | |
| Gigabyte P55K v5 | |
| Asus G501VW-FY081T | |
| Acer Aspire V15 Nitro BE VN7-592G-79DV | |
| MSI GL62-6QFi781H11 | |
| 3DMark 11 | |
| 1280x720 Performance | |
| Schenker XMG A516 | |
| HP Omen 15-ax007ng | |
| Gigabyte P55K v5 | |
| Acer Aspire V15 Nitro BE VN7-592G-79DV | |
| Asus G501VW-FY081T | |
| MSI GL62-6QFi781H11 | |
| 1280x720 Performance GPU | |
| Schenker XMG A516 | |
| HP Omen 15-ax007ng | |
| Gigabyte P55K v5 | |
| Asus G501VW-FY081T | |
| Acer Aspire V15 Nitro BE VN7-592G-79DV | |
| MSI GL62-6QFi781H11 | |
| Unigine Heaven 4.0 - Extreme Preset DX11 | |
| Schenker XMG A516 | |
| HP Omen 15-ax007ng | |
| MSI GL62-6QFi781H11 | |
| basso | medio | alto | ultra | |
|---|---|---|---|---|
| FIFA 16 (2015) | 177.8 | 145 | 103 | |
| Anno 2205 (2015) | 100.7 | 62.5 | 28.7 | 11.2 |
| Assassin's Creed Syndicate (2015) | 50.6 | 46.8 | 29.6 | 5.2 |
| Rainbow Six Siege (2015) | 162.7 | 111 | 57.5 | 45.7 |
| XCOM 2 (2016) | 66.1 | 32.1 | 20.1 | 8.7 |
| Hitman 2016 (2016) | 46.5 | 46 | 28.2 | 27.4 |
| Need for Speed 2016 (2016) | 70.7 | 67.4 | 40 | 28.4 |
| Doom (2016) | 69.4 | 57.2 | 33.6 | 28.4 |
| Overwatch (2016) | 184.9 | 142.3 | 69.1 | 39.7 |
| Mirror's Edge Catalyst (2016) | 96.2 | 61.8 | 30 | 24.3 |
Rumorosità
| Idle |
| 35 / 36 / 37 dB(A) |
| DVD |
| 39 / dB(A) |
| Sotto carico |
| 41 / 46 dB(A) |
 | ||
30 dB silenzioso 40 dB(A) udibile 50 dB(A) rumoroso |
||
min: | ||
| MSI GL62-6QFi781H11 GeForce GTX 960M, 6700HQ | Acer Aspire V15 Nitro BE VN7-592G-79DV GeForce GTX 960M, 6700HQ | Asus G501VW-FY081T GeForce GTX 960M, 6700HQ | Gigabyte P55K v5 GeForce GTX 965M, 6700HQ | Schenker XMG A516 GeForce GTX 965M, 6700HQ | HP Omen 15-ax007ng GeForce GTX 965M, 6700HQ | |
|---|---|---|---|---|---|---|
| Noise | 2% | 4% | 4% | 5% | 1% | |
| off /ambiente * (dB) | 30 | 31.3 -4% | 31.2 -4% | 29 3% | 30 -0% | |
| Idle Minimum * (dB) | 35 | 31.2 11% | 32.1 8% | 32 9% | 31 11% | 32 9% |
| Idle Average * (dB) | 36 | 31.2 13% | 32.1 11% | 33 8% | 32 11% | 33 8% |
| Idle Maximum * (dB) | 37 | 36.2 2% | 32.1 13% | 33 11% | 38 -3% | 36 3% |
| Load Average * (dB) | 41 | 45.3 -10% | 43.3 -6% | 41 -0% | 40 2% | 43 -5% |
| Load Maximum * (dB) | 46 | 47.3 -3% | 44.3 4% | 50 -9% | 45 2% | 49 -7% |
* ... Meglio usare valori piccoli
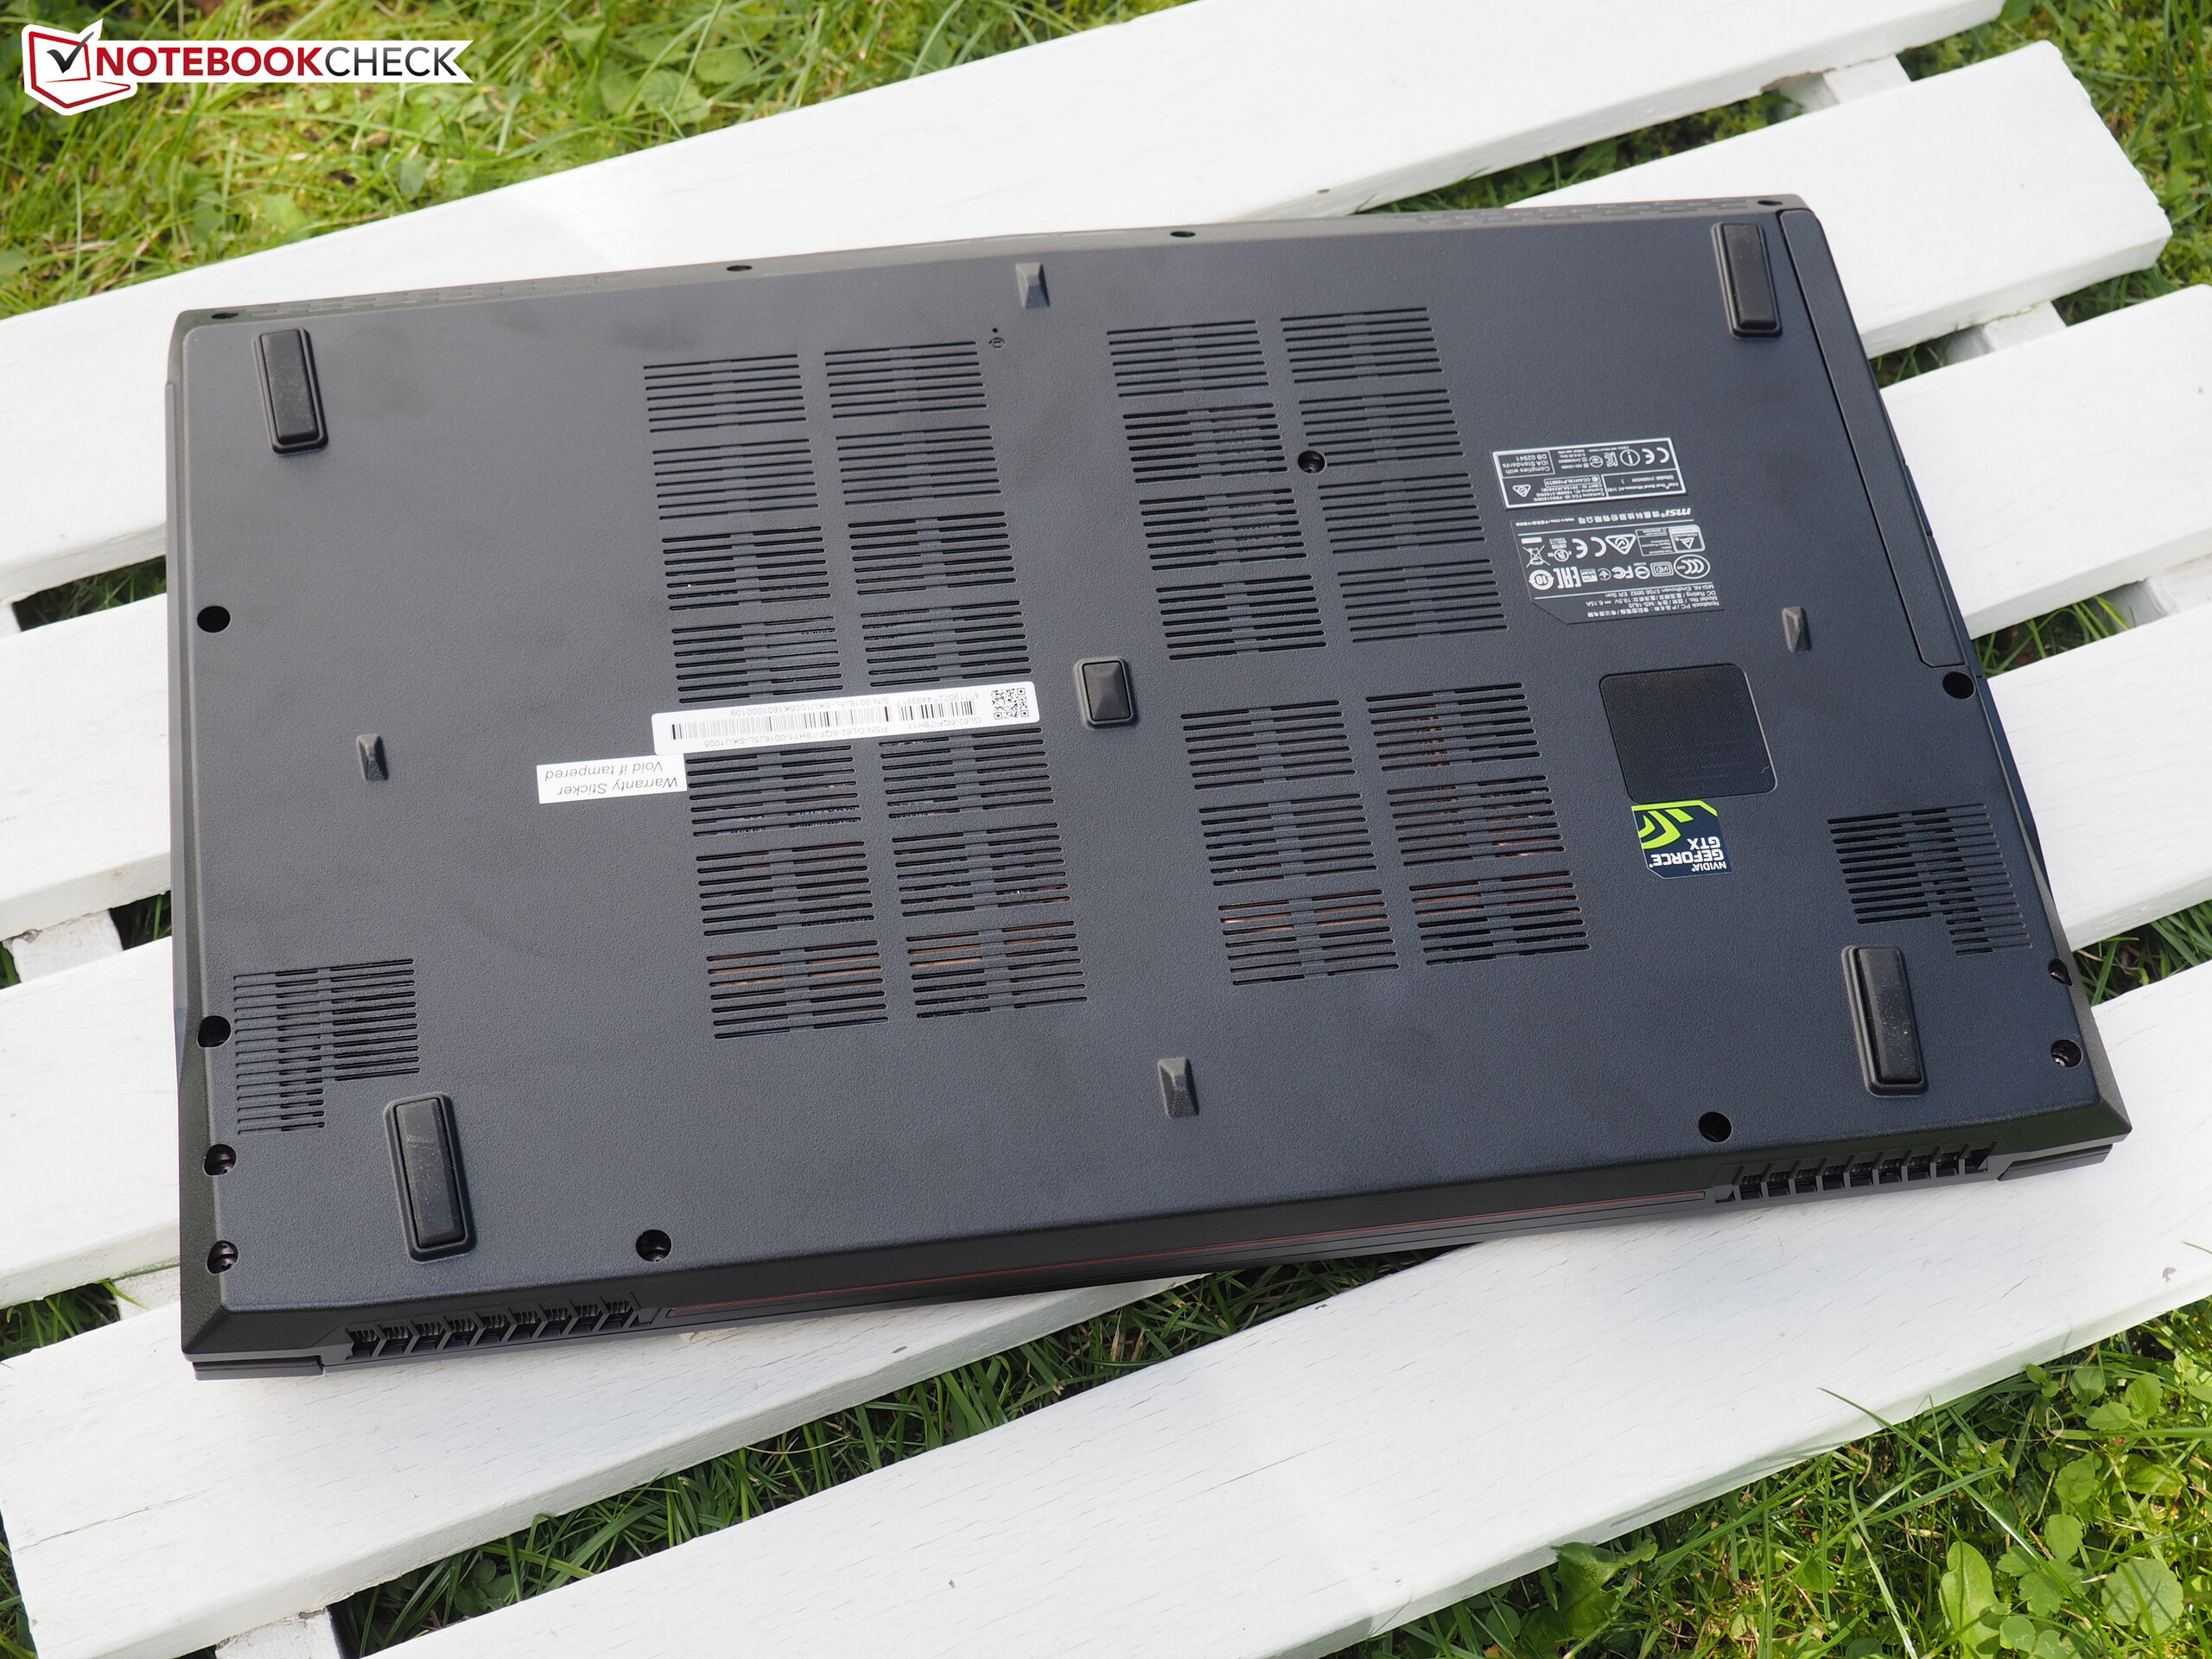
(-) La temperatura massima sul lato superiore è di 49.1 °C / 120 F, rispetto alla media di 40.4 °C / 105 F, che varia da 21.2 a 68.8 °C per questa classe Gaming.
(±) Il lato inferiore si riscalda fino ad un massimo di 43.4 °C / 110 F, rispetto alla media di 43.2 °C / 110 F
(+) In idle, la temperatura media del lato superiore è di 26.7 °C / 80 F, rispetto alla media deld ispositivo di 33.9 °C / 93 F.
(-) I poggiapolsi e il touchpad possono diventare molto caldi al tatto con un massimo di 42.9 °C / 109.2 F.
(-) La temperatura media della zona del palmo della mano di dispositivi simili e'stata di 28.8 °C / 83.8 F (-14.1 °C / -25.4 F).
| MSI GL62-6QFi781H11 GeForce GTX 960M, 6700HQ | Acer Aspire V15 Nitro BE VN7-592G-79DV GeForce GTX 960M, 6700HQ | Asus G501VW-FY081T GeForce GTX 960M, 6700HQ | Gigabyte P55K v5 GeForce GTX 965M, 6700HQ | Schenker XMG A516 GeForce GTX 965M, 6700HQ | HP Omen 15-ax007ng GeForce GTX 965M, 6700HQ | |
|---|---|---|---|---|---|---|
| Heat | -8% | 6% | 5% | -24% | -5% | |
| Maximum Upper Side * (°C) | 49.1 | 50.1 -2% | 41 16% | 52.6 -7% | 52.4 -7% | 48.5 1% |
| Maximum Bottom * (°C) | 43.4 | 56.2 -29% | 48.2 -11% | 50.2 -16% | 53.1 -22% | 59 -36% |
| Idle Upper Side * (°C) | 29.2 | 28.3 3% | 26.4 10% | 22.6 23% | 39.3 -35% | 28.7 2% |
| Idle Bottom * (°C) | 29.6 | 31.1 -5% | 26.7 10% | 23.4 21% | 39.5 -33% | 25.7 13% |
* ... Meglio usare valori piccoli
| Off / Standby | |
| Idle | |
| Sotto carico |
|
Leggenda:
min: | |
| MSI GL62-6QFi781H11 GeForce GTX 960M, 6700HQ | Acer Aspire V15 Nitro BE VN7-592G-79DV GeForce GTX 960M, 6700HQ | Asus G501VW-FY081T GeForce GTX 960M, 6700HQ | Gigabyte P55K v5 GeForce GTX 965M, 6700HQ | Schenker XMG A516 GeForce GTX 965M, 6700HQ | HP Omen 15-ax007ng GeForce GTX 965M, 6700HQ | |
|---|---|---|---|---|---|---|
| Power Consumption | 4% | 21% | 2% | -12% | 11% | |
| Idle Minimum * (Watt) | 10 | 8.9 11% | 6.9 31% | 10.1 -1% | 11 -10% | 7 30% |
| Idle Average * (Watt) | 14 | 13.9 1% | 10.7 24% | 13.3 5% | 15 -7% | 11 21% |
| Idle Maximum * (Watt) | 19 | 15.6 18% | 13.2 31% | 15.4 19% | 22 -16% | 19 -0% |
| Load Average * (Watt) | 82 | 89 -9% | 82 -0% | 75.8 8% | 75 9% | 79 4% |
| Load Maximum * (Watt) | 118 | 118 -0% | 94 20% | 144 -22% | 160 -36% | 119 -1% |
* ... Meglio usare valori piccoli
| MSI GL62-6QFi781H11 41.4 Wh | Acer Aspire V15 Nitro BE VN7-592G-79DV 52 Wh | Asus G501VW-FY081T 60 Wh | Gigabyte P55K v5 63 Wh | Schenker XMG A516 62 Wh | HP Omen 15-ax007ng 61.5 Wh | |
|---|---|---|---|---|---|---|
| Autonomia della batteria | 33% | 61% | 48% | 45% | 48% | |
| Reader / Idle (h) | 5.7 | 8.8 54% | 10.2 79% | 8.4 47% | 6.5 14% | 7.8 37% |
| WiFi v1.3 (h) | 2.6 | 3.6 38% | 5.5 112% | 4.9 88% | 4.5 73% | |
| Load (h) | 1.2 | 1.3 8% | 1.1 -8% | 1.3 8% | 2.1 75% | 1.6 33% |
| H.264 (h) | 3.9 | 5.1 | 4.4 | 4.1 |
Pro
Contro
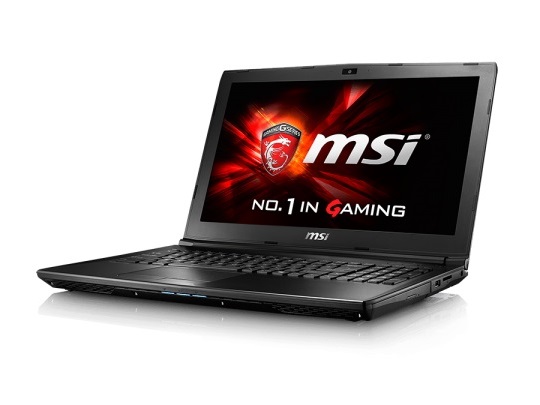
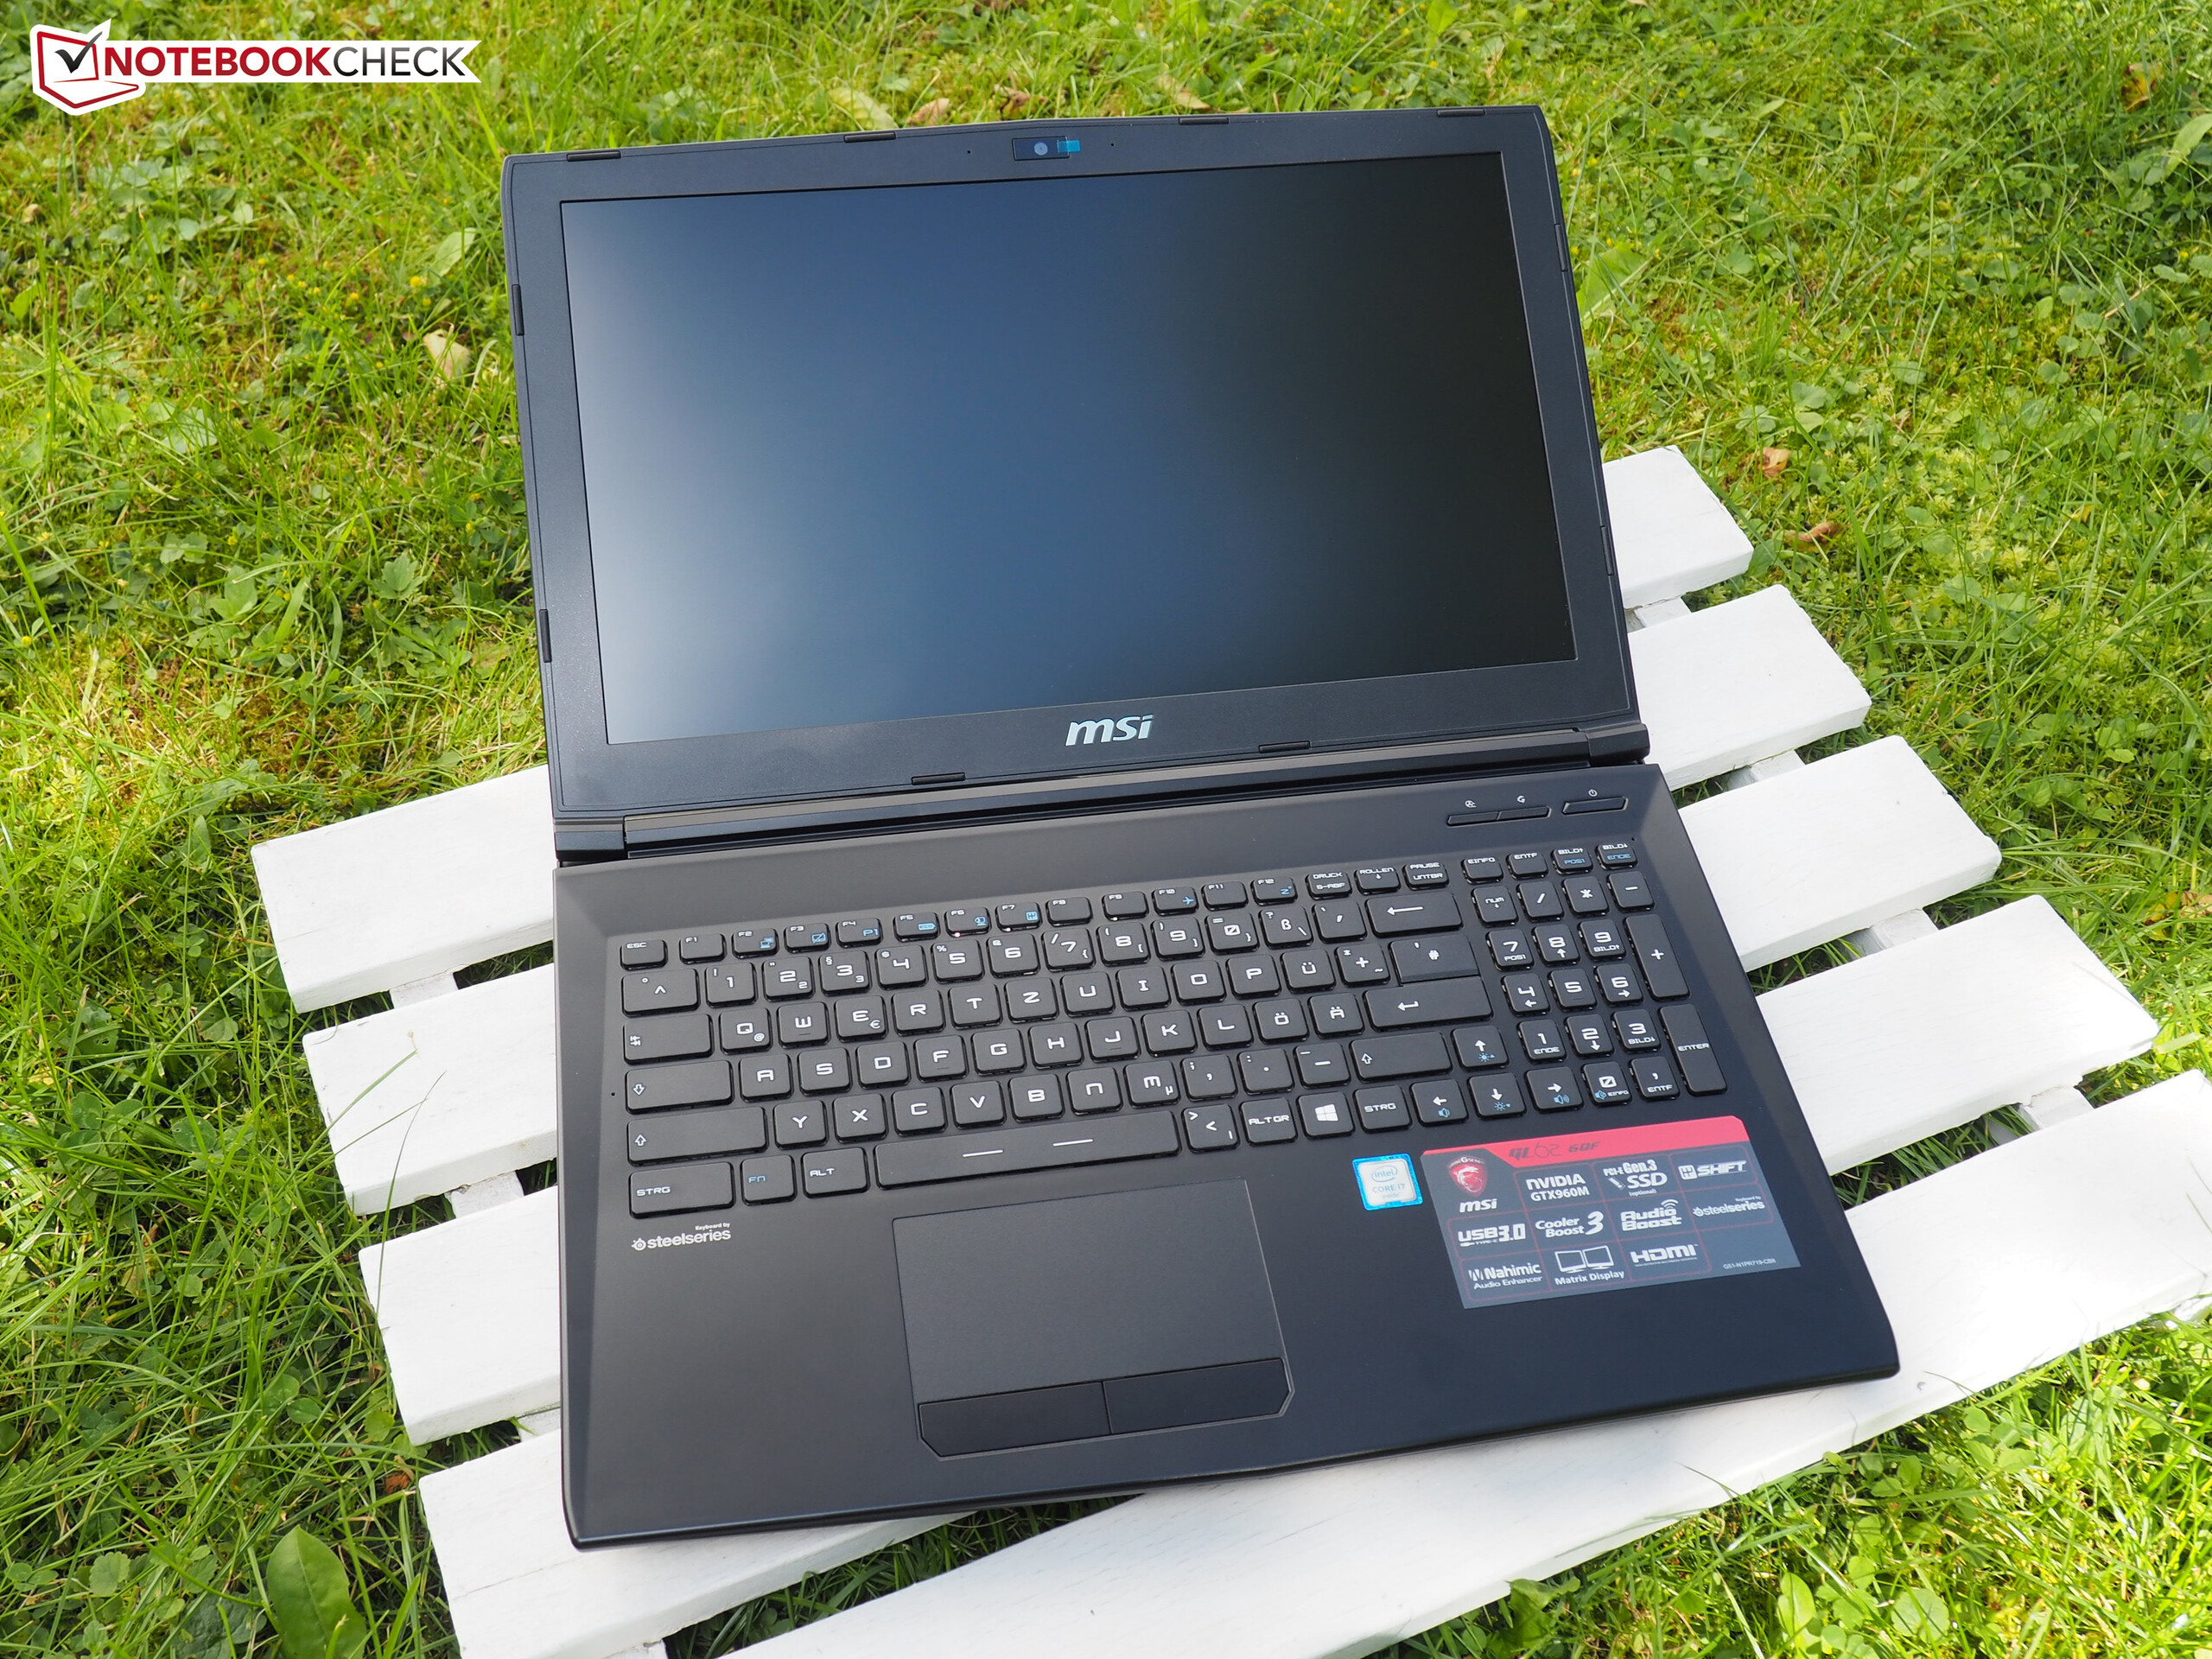
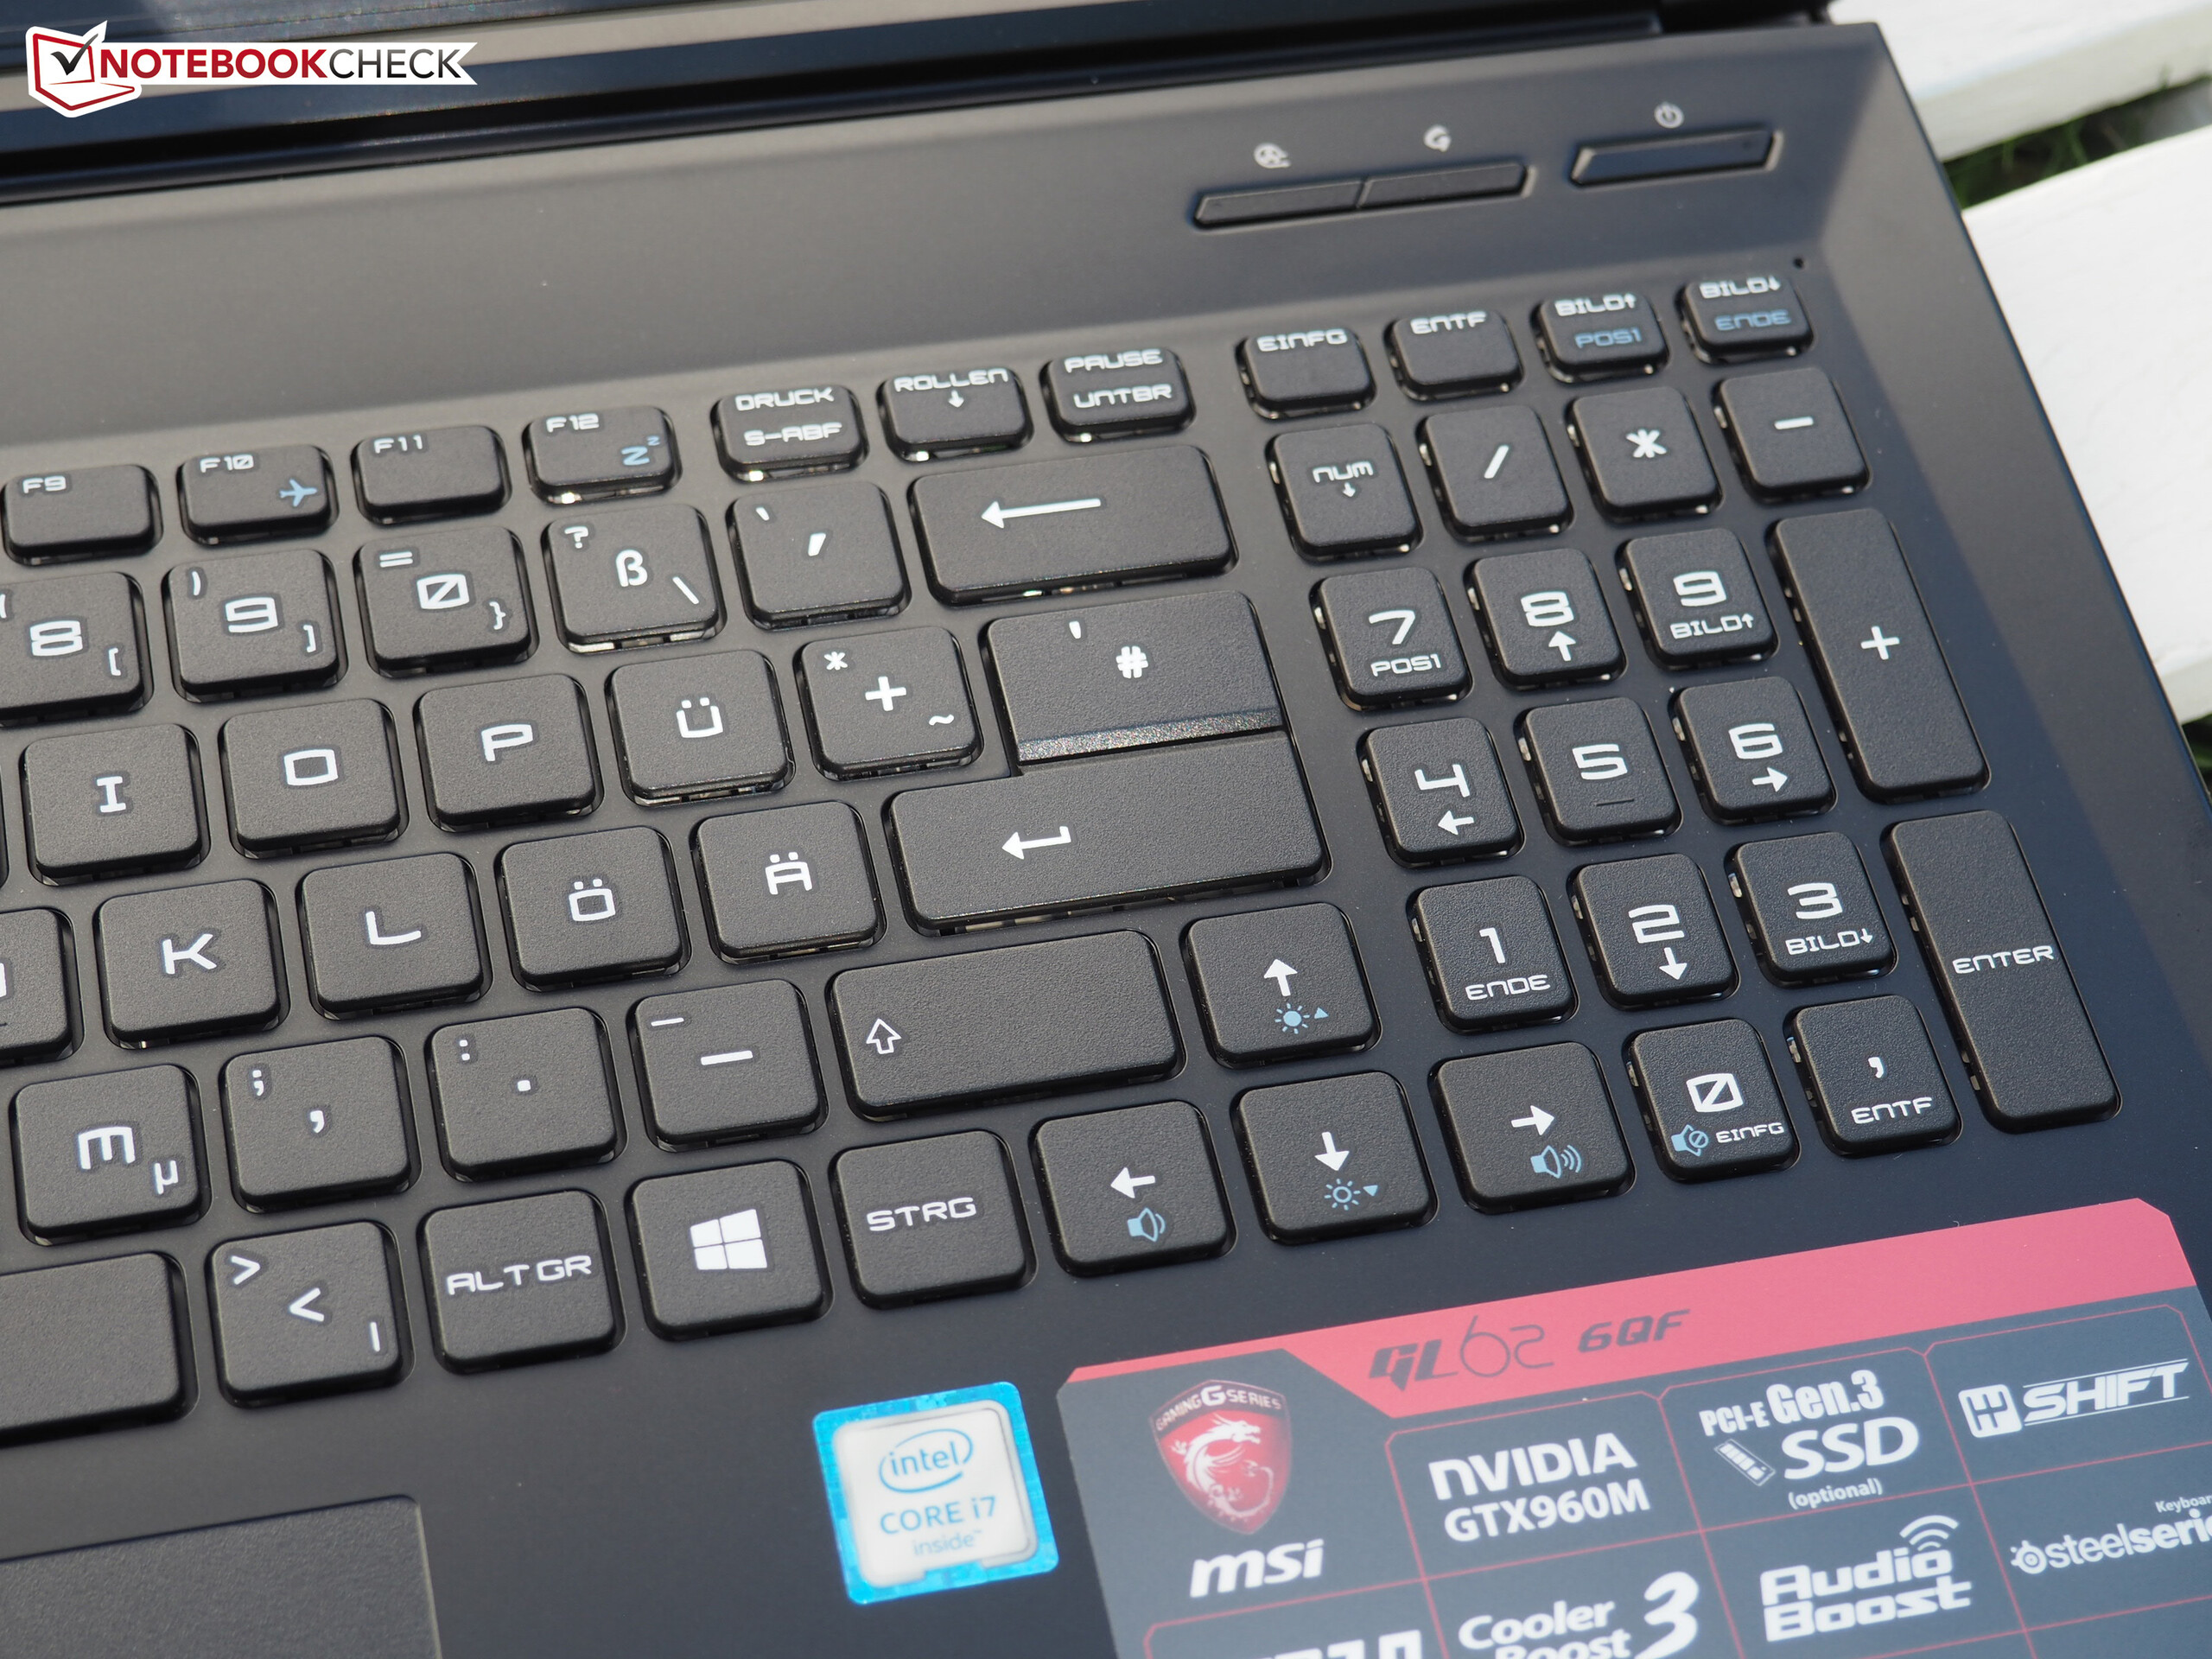
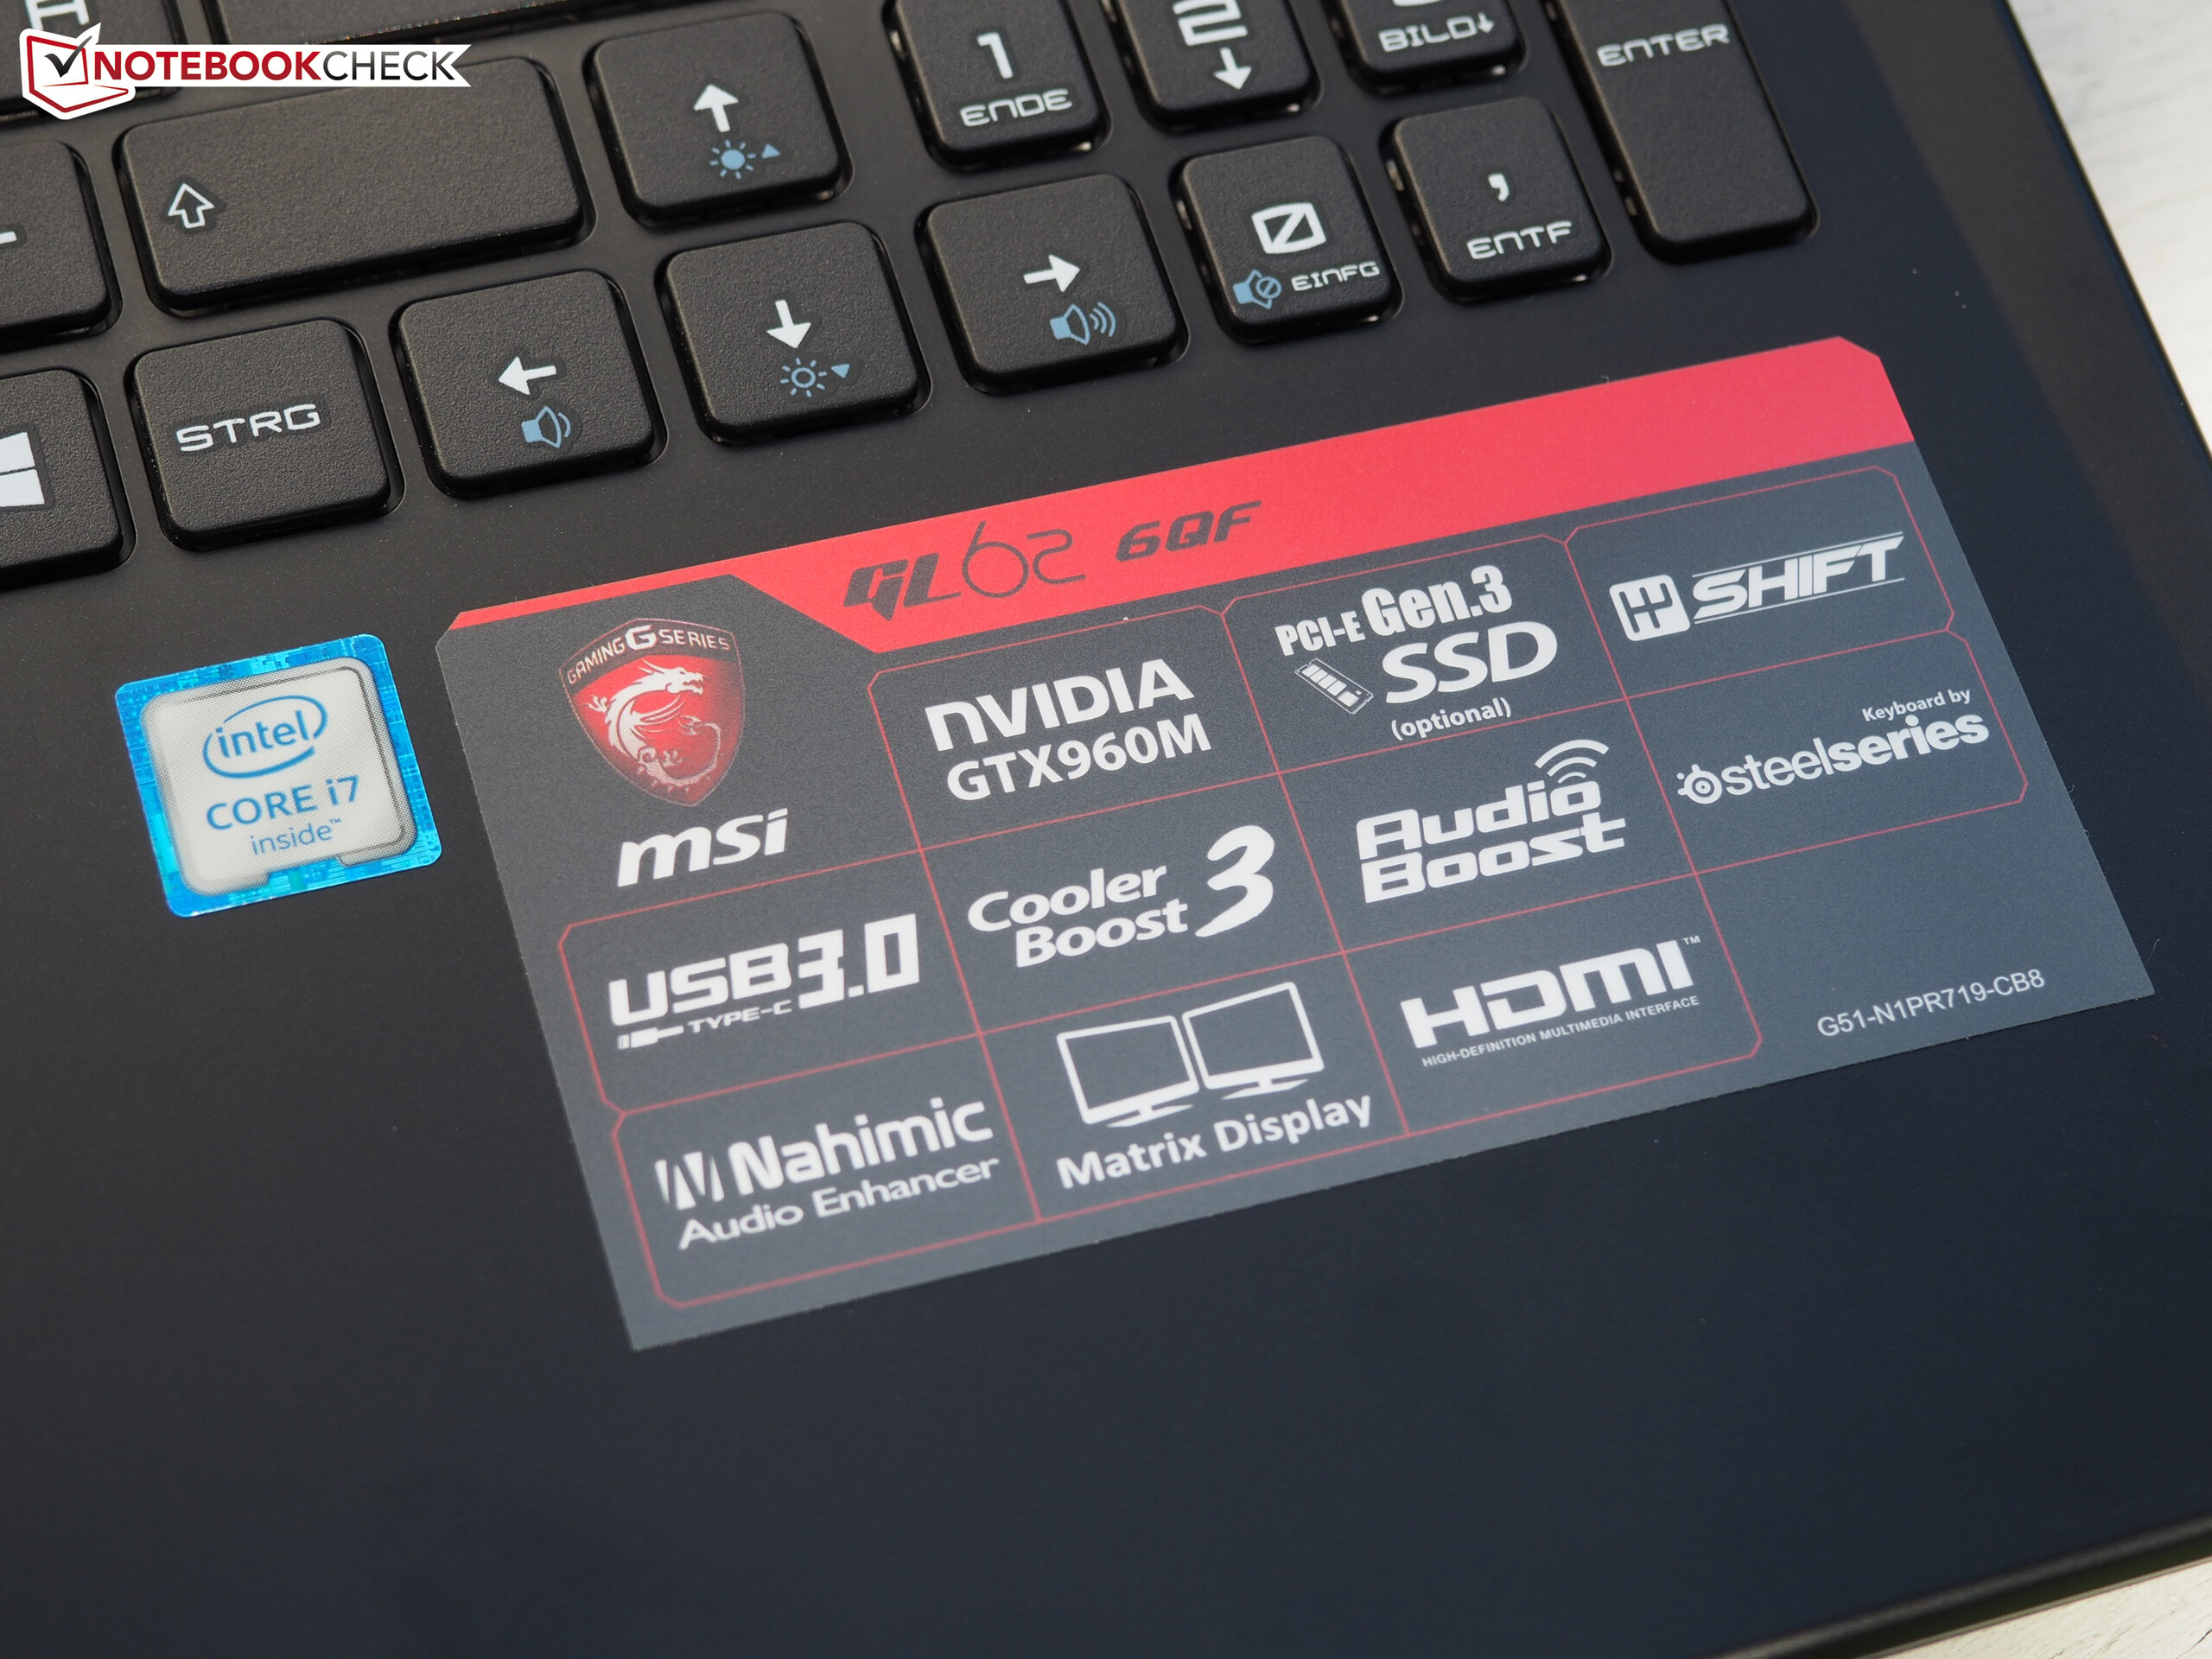
A primo impatto, il GL62-6QFi781H11 potrebbe apparire una alternativa economica ai più costosi portatili gaming MSI. Ed attualmente non c'è molto da criticare in termini di prestazioni. CPU Quad-core, GTX 960M e solid-state disk: abbastanza per un costo di 1100 Euro (~$1218).
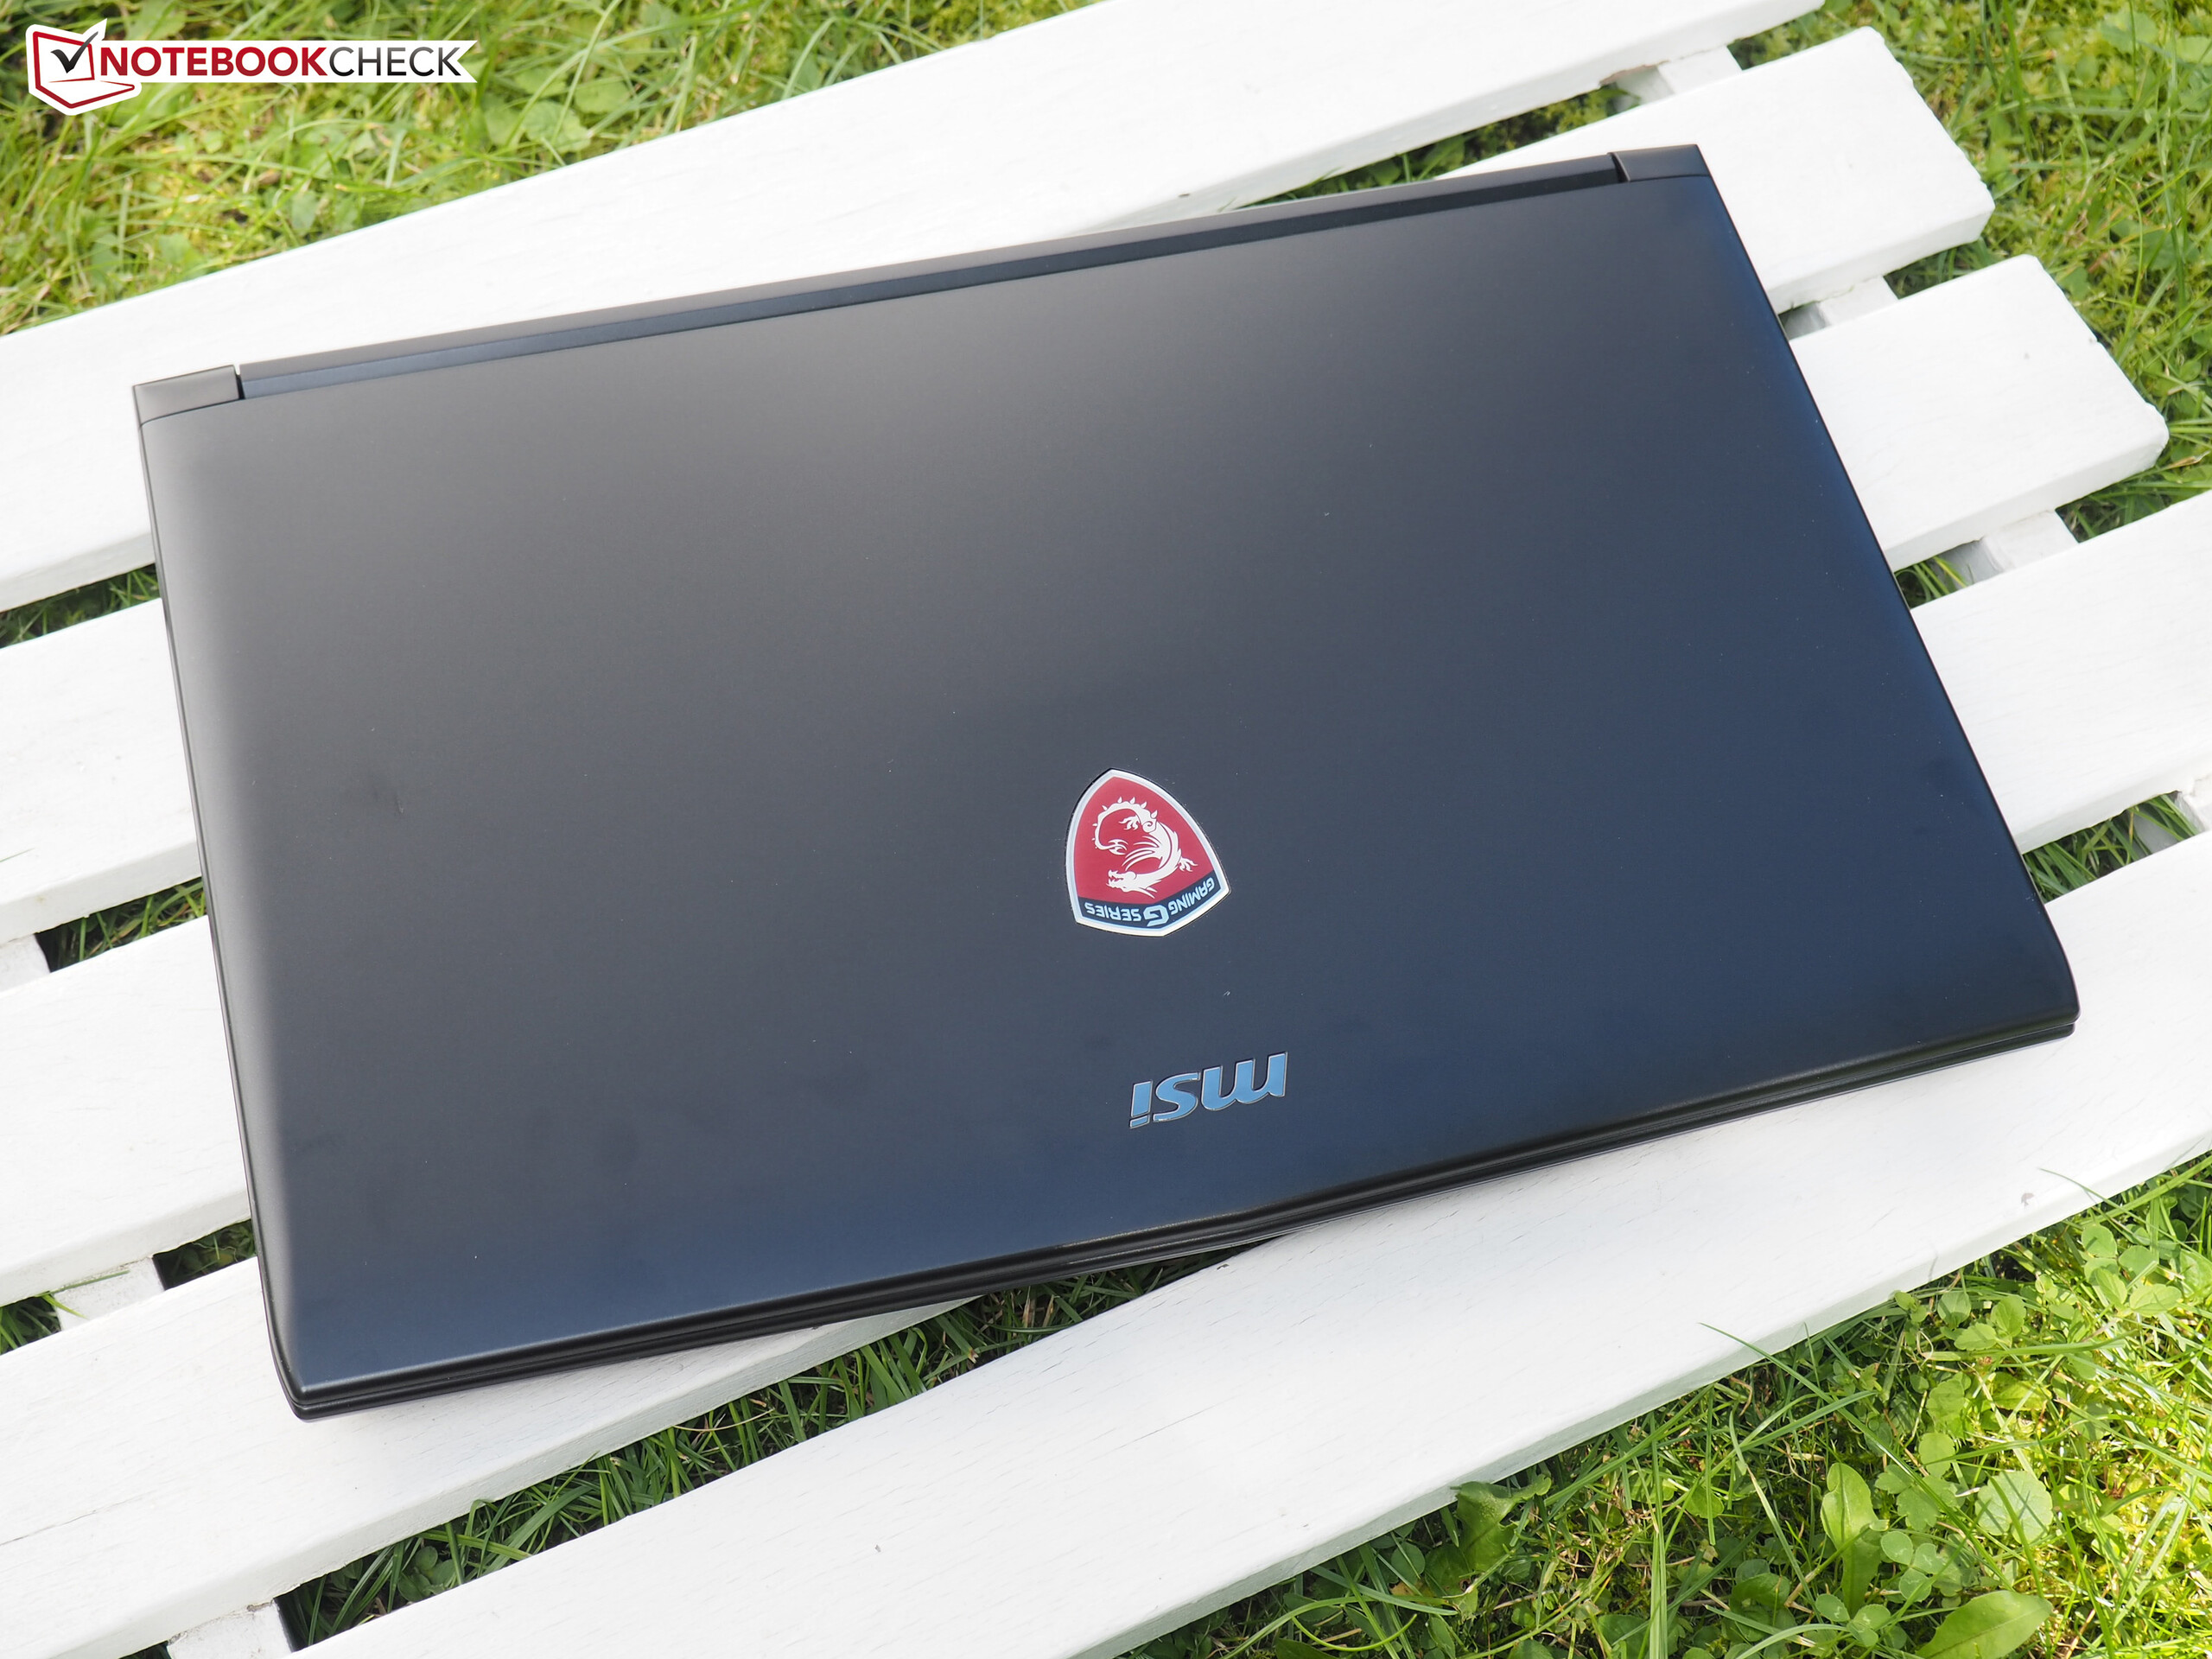
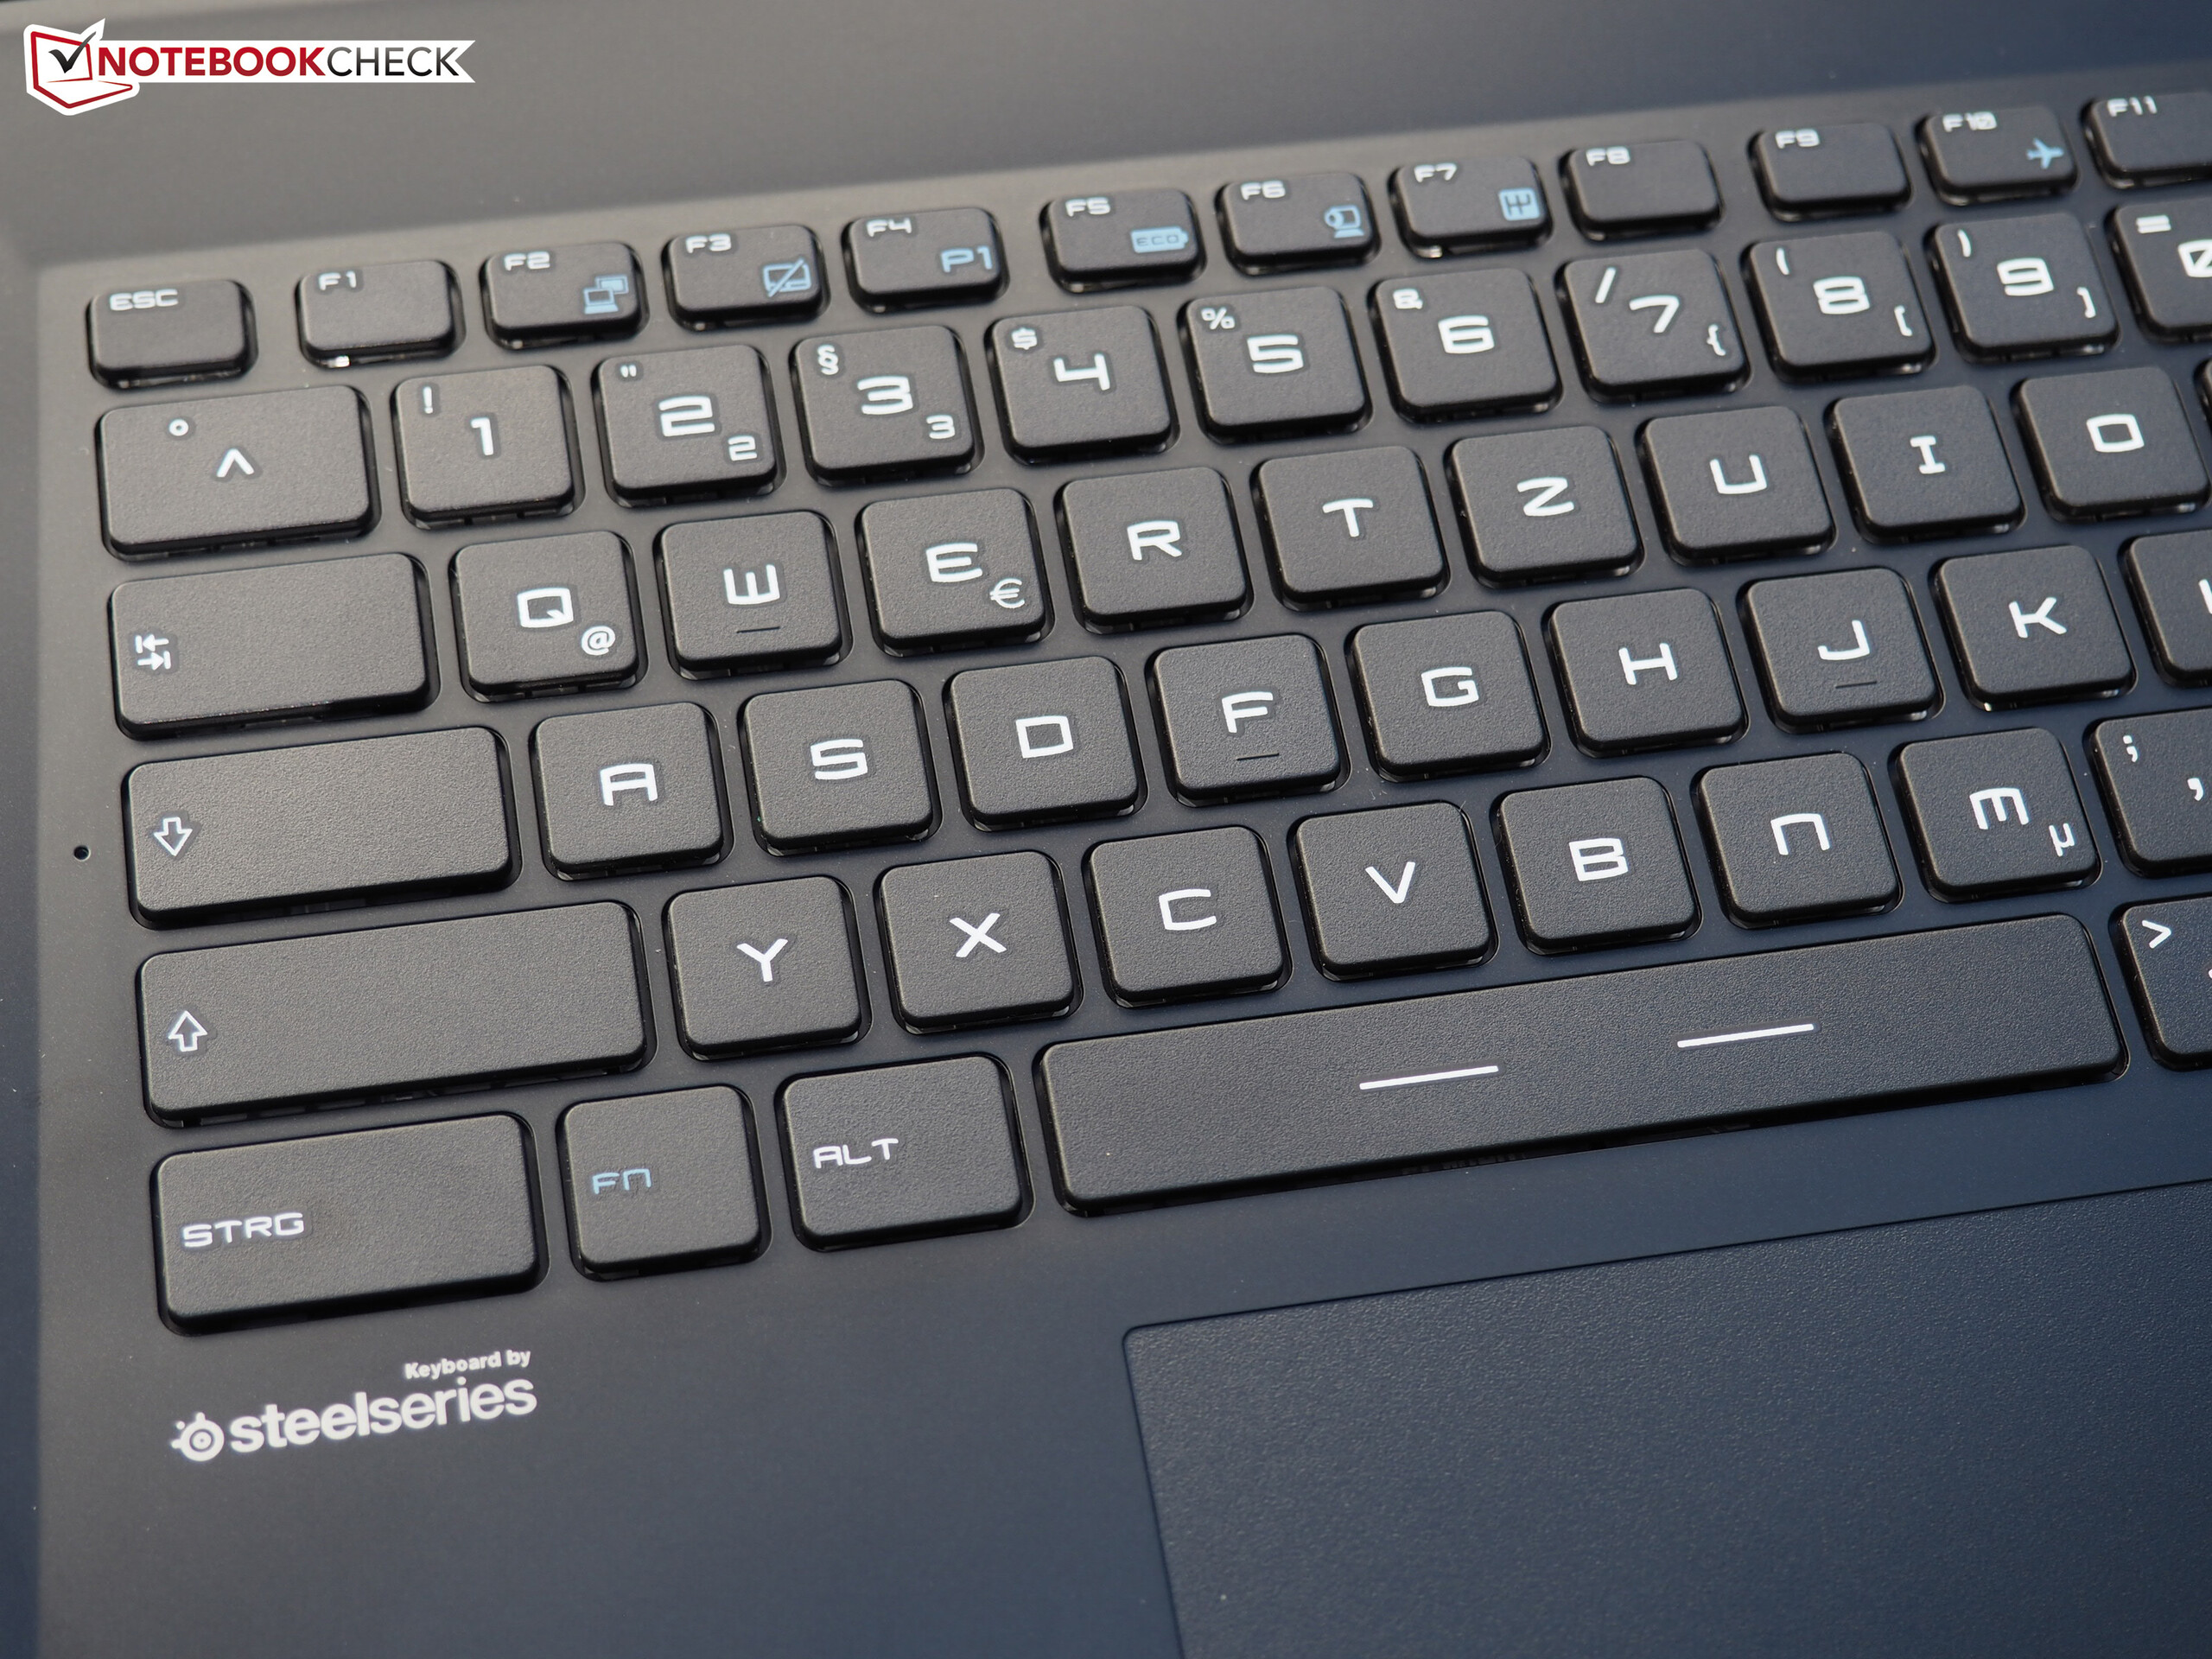
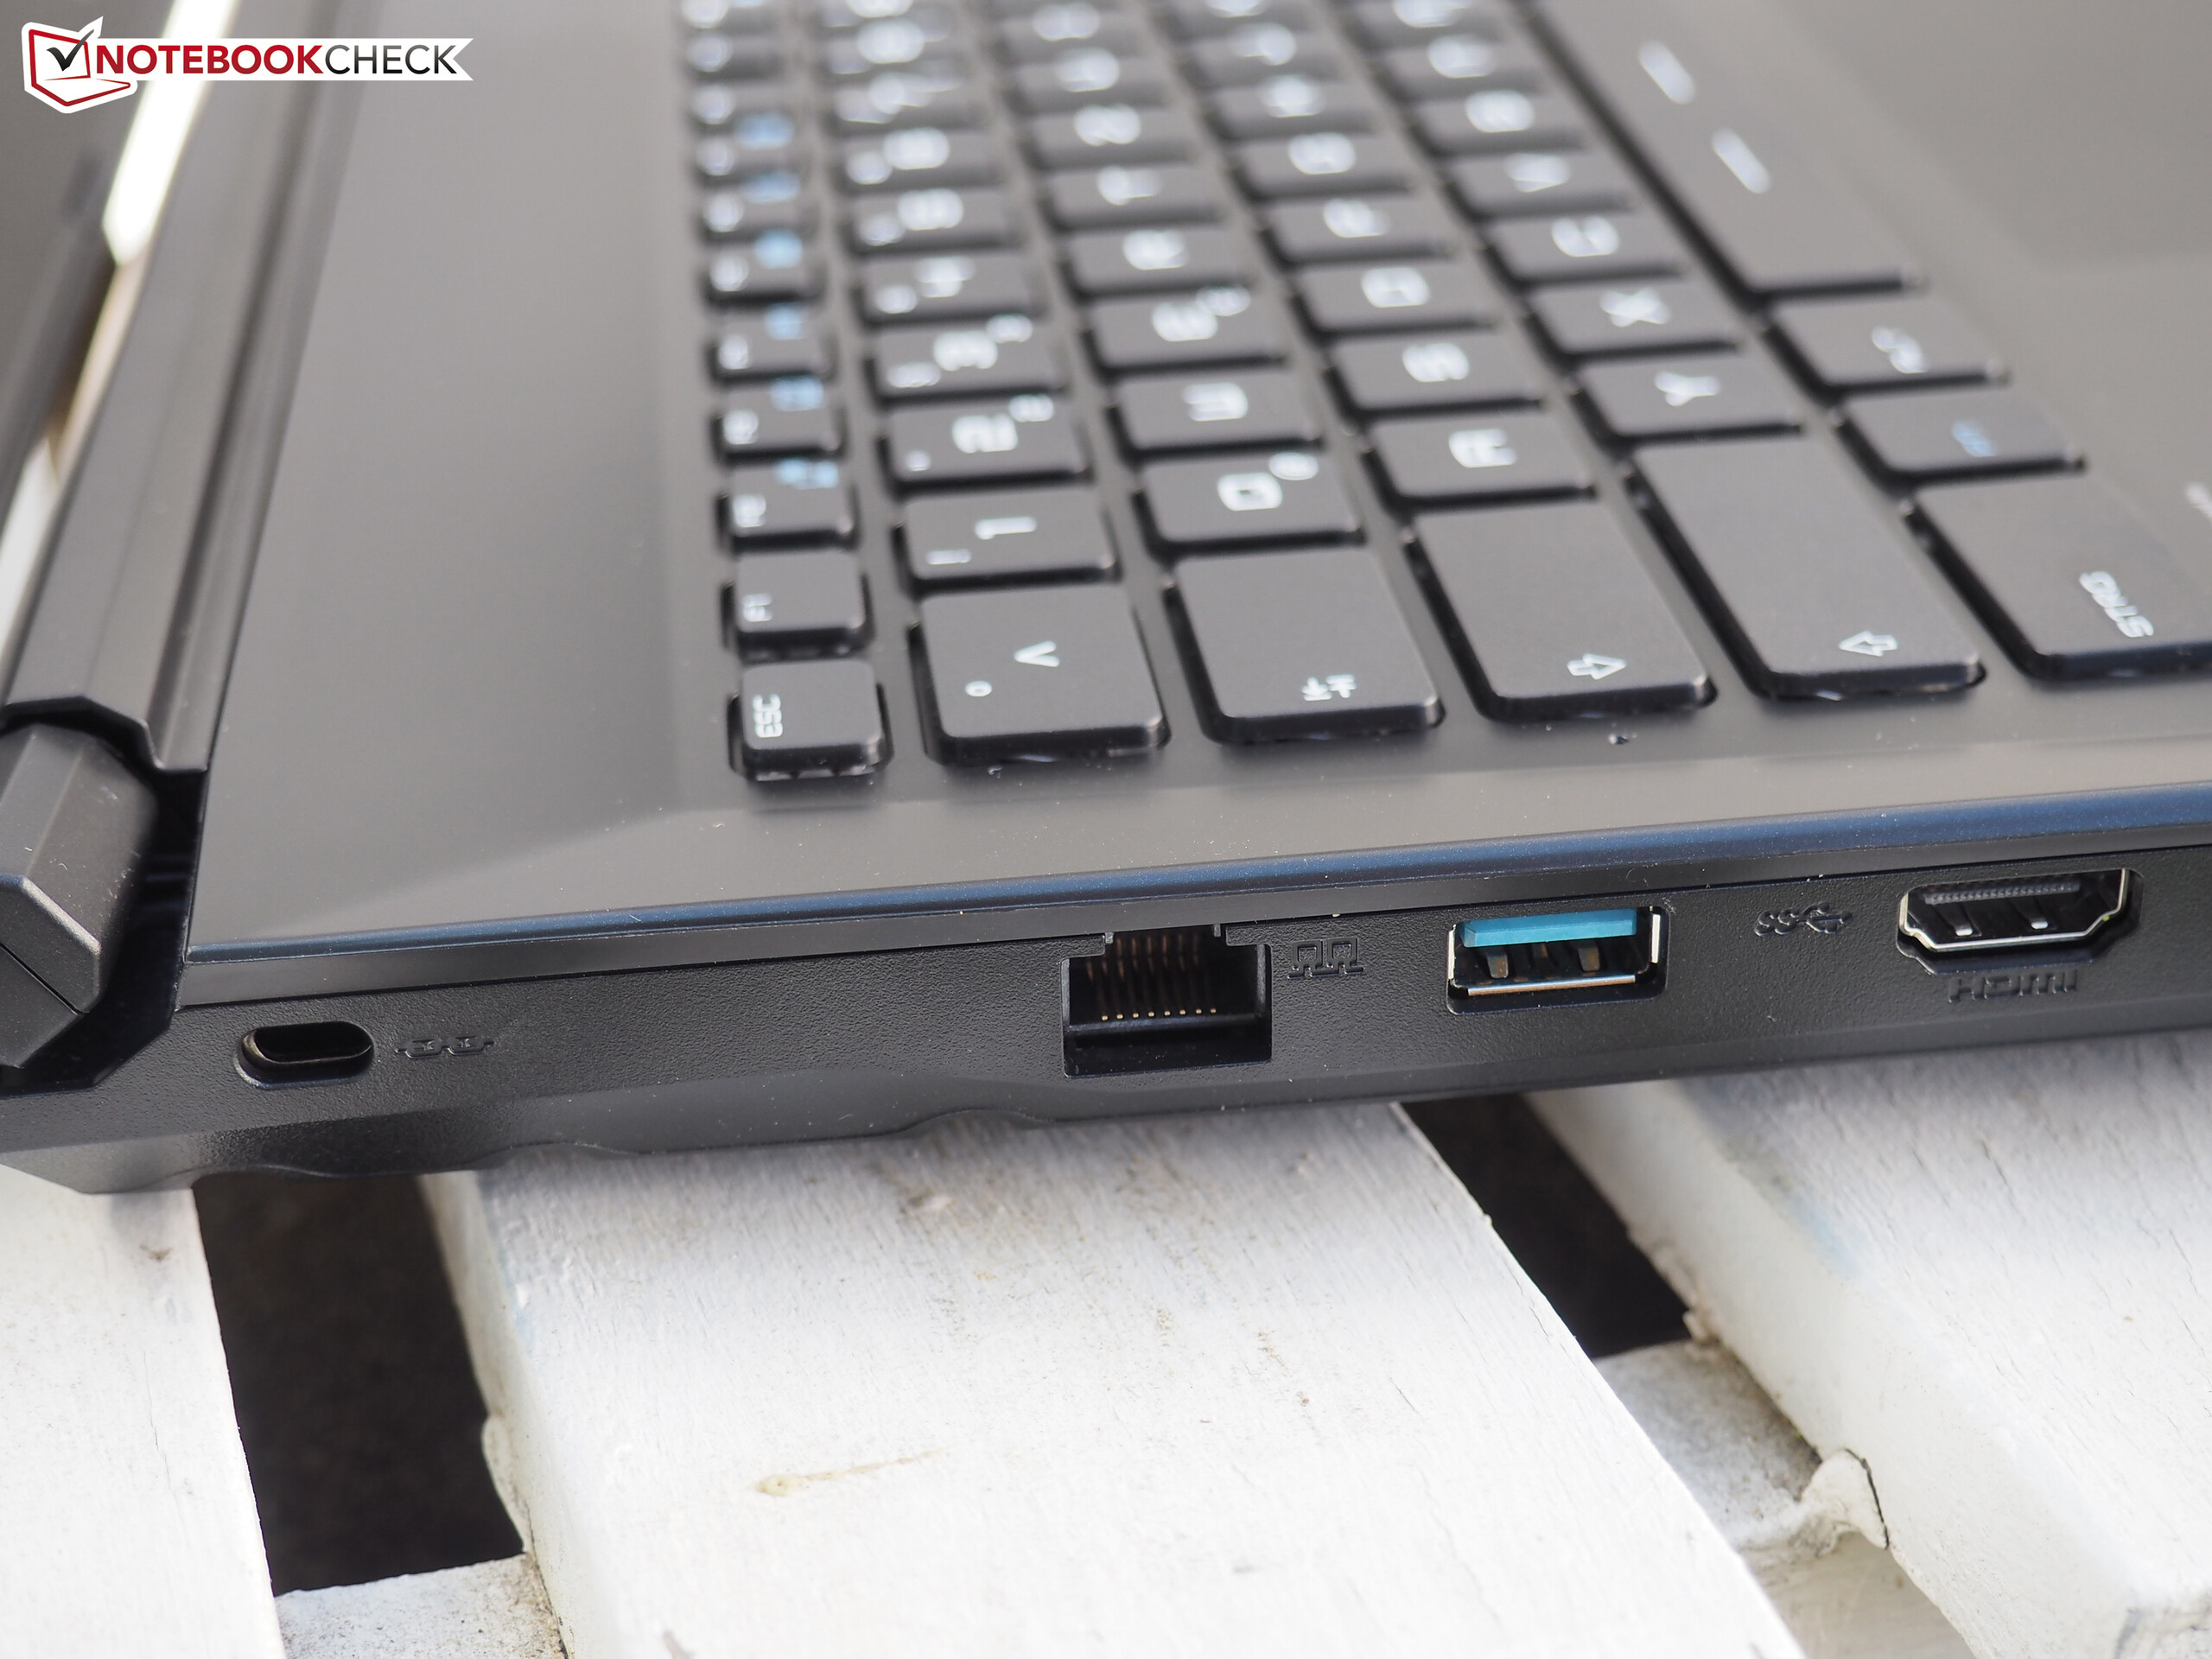
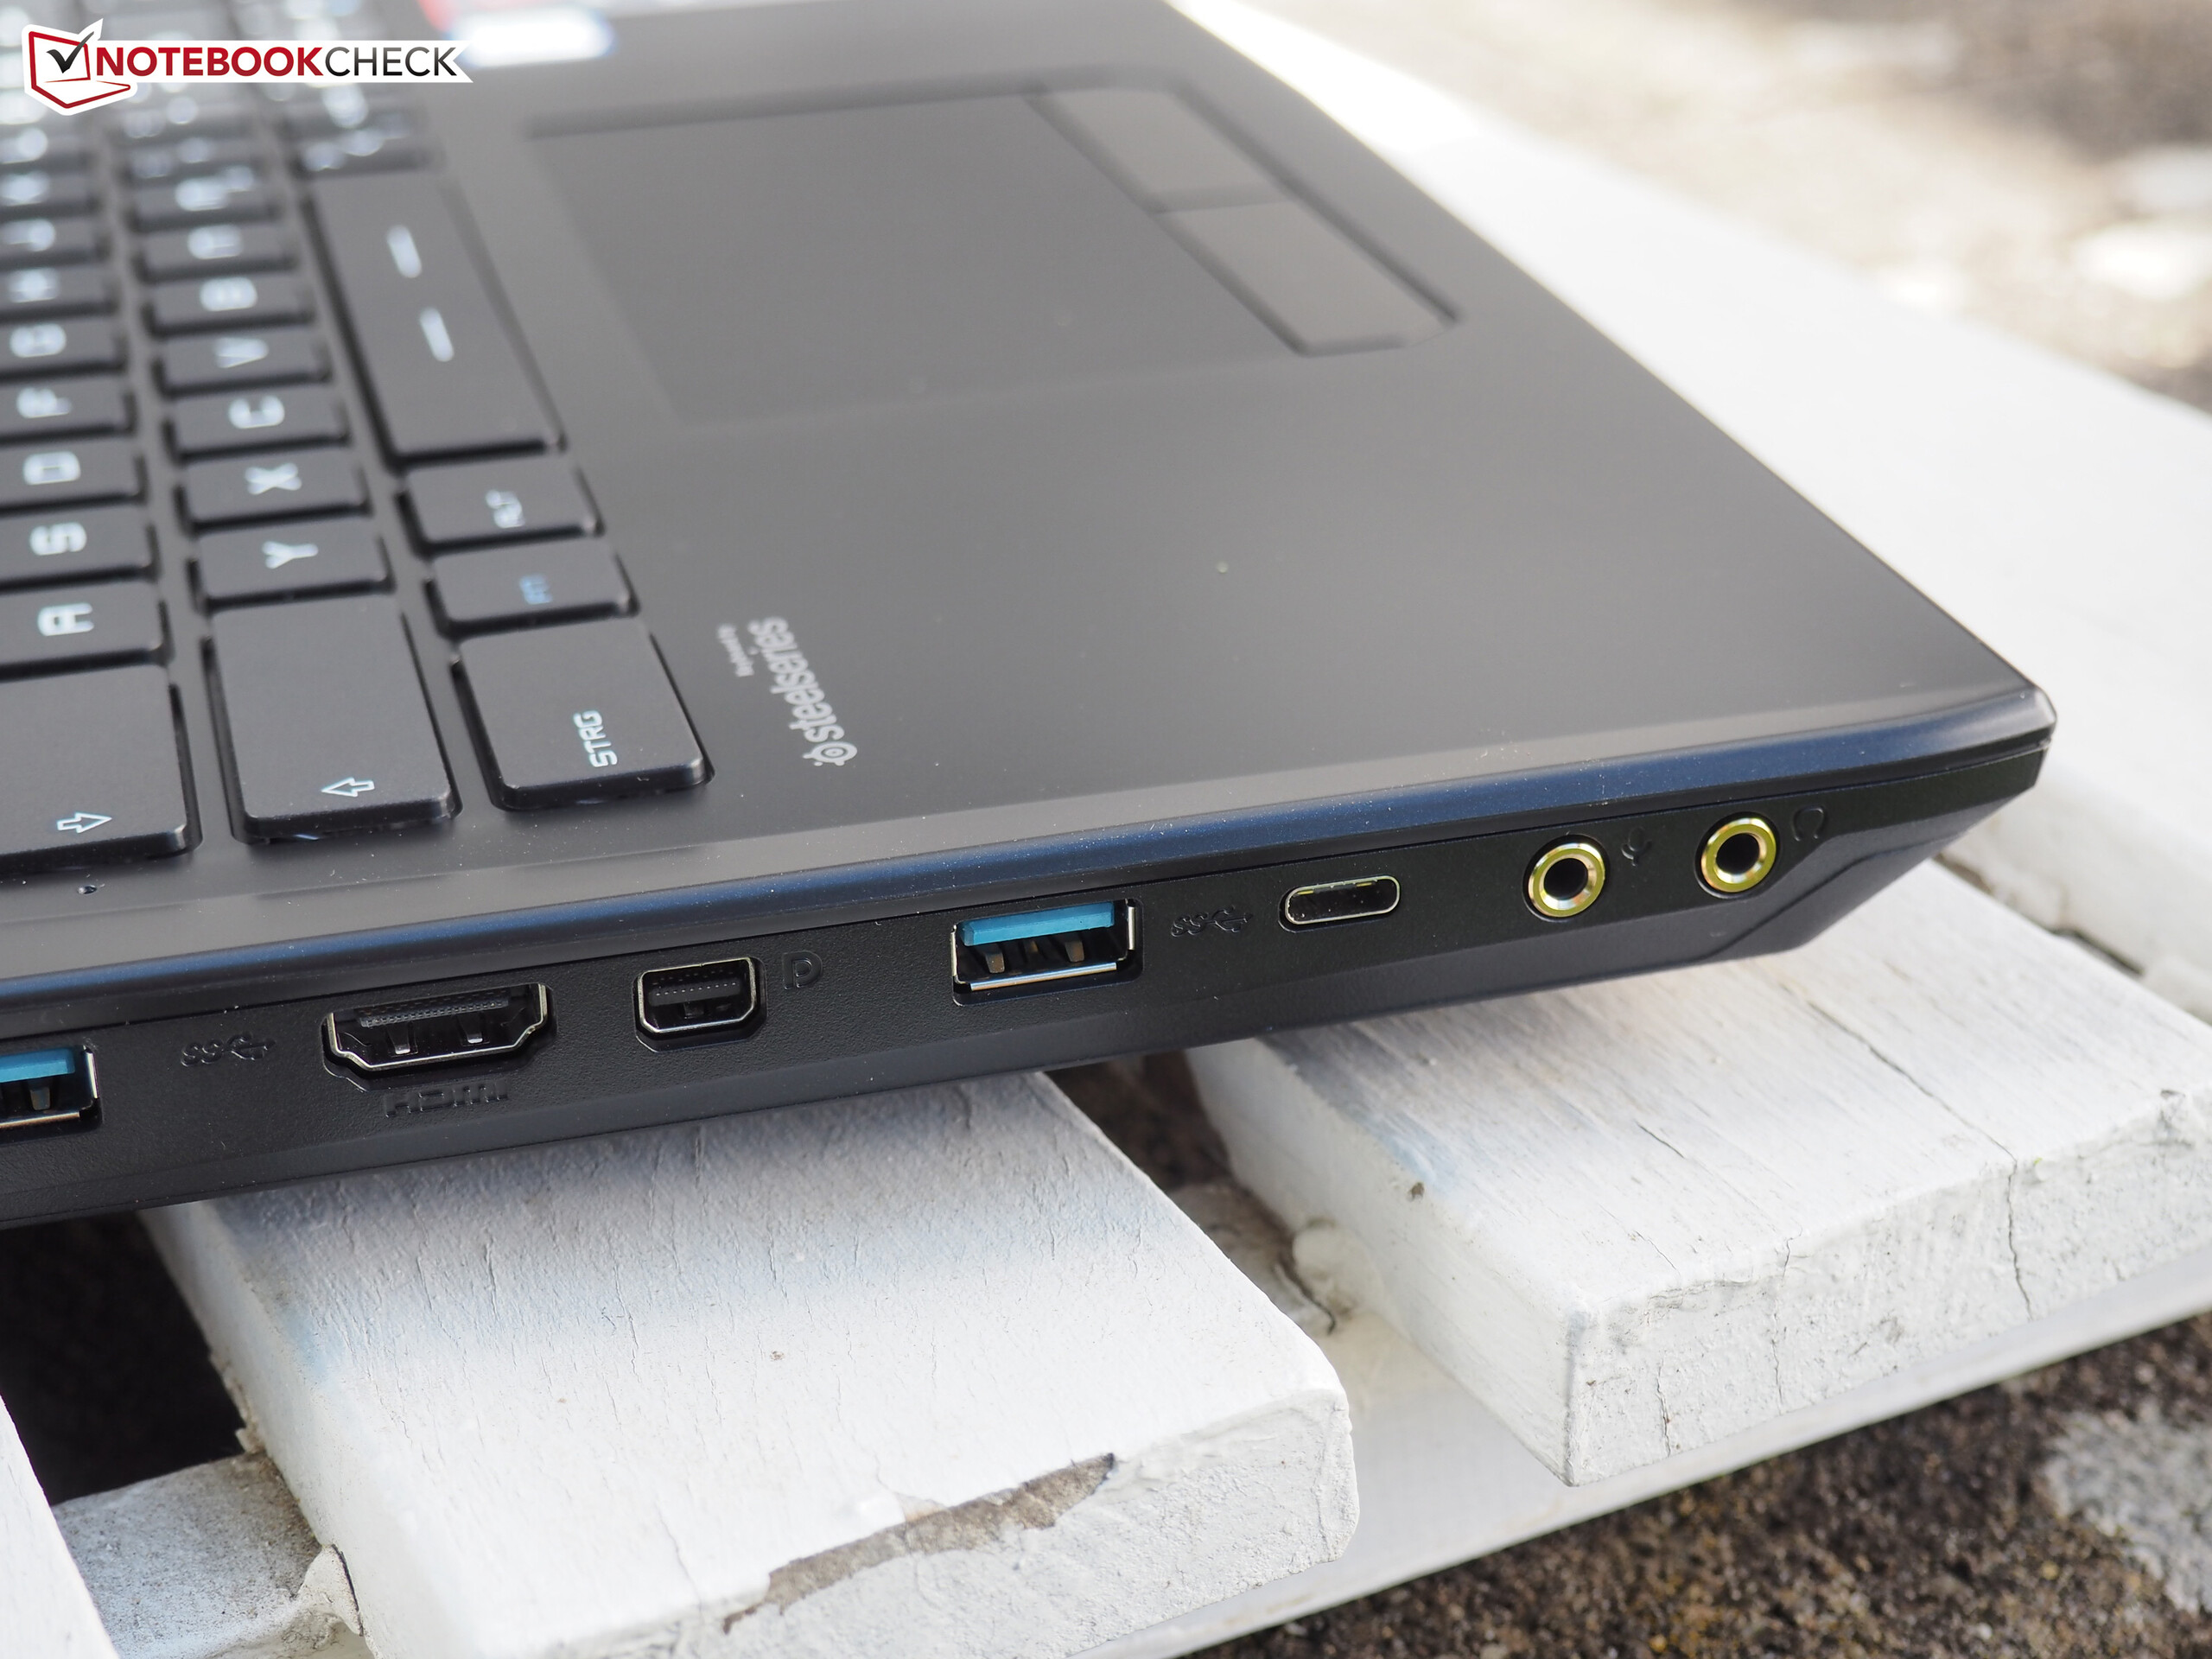
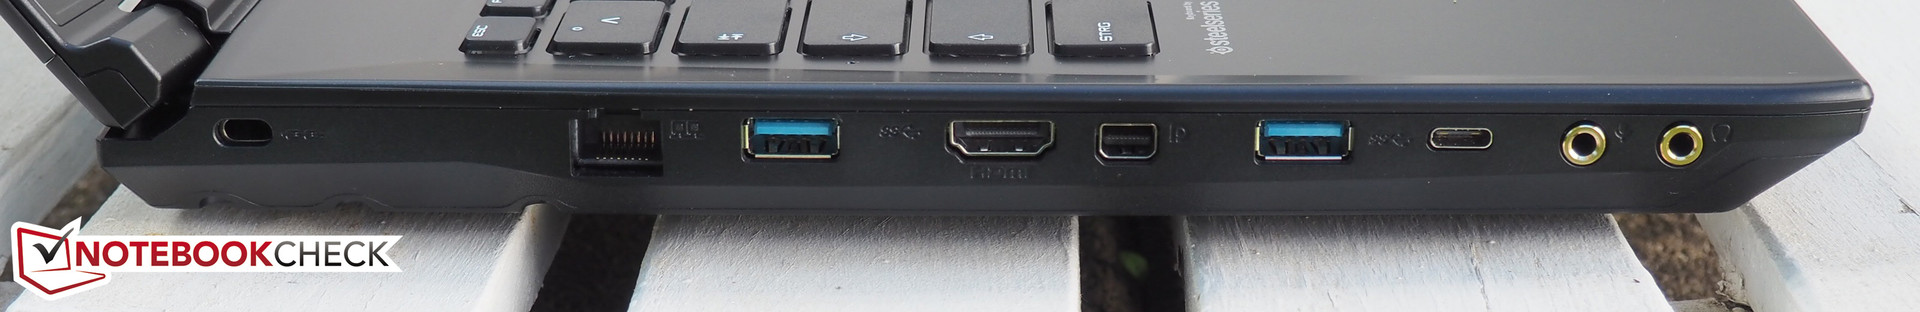
Tuttavia, questo dispositivo da 15" difficilmente ha chance contro il GE62. MSI non solo rinunzia a una porta USB 3.1 Gen. 2, ma anche ad elementi in metallo e all'illuminazione della tastiera. La principale pecca è il pannello TN scuro con contrasto basso. Quest'ultimo impedisce la raccomandazione del GL62.
I gamers attenti al portafogli potrebbero guardare il simile Omen 15 (79%). Il rivale HP non offre una porta USB 3.1, ma avrete un display IPS, superiore in molti aspetti. Sia l'Asus G501VW che l'Acer V15 Nitro hanno punteggi migliori con l'84 e l'85%.
Nota: si tratta di una recensione breve, con alcune sezioni non tradotte, per la versione integrale in inglese guardate qui.
MSI GL62-6QFi781H11
- 06/26/2016 v5.1 (old)
Florian Glaser
Price comparison