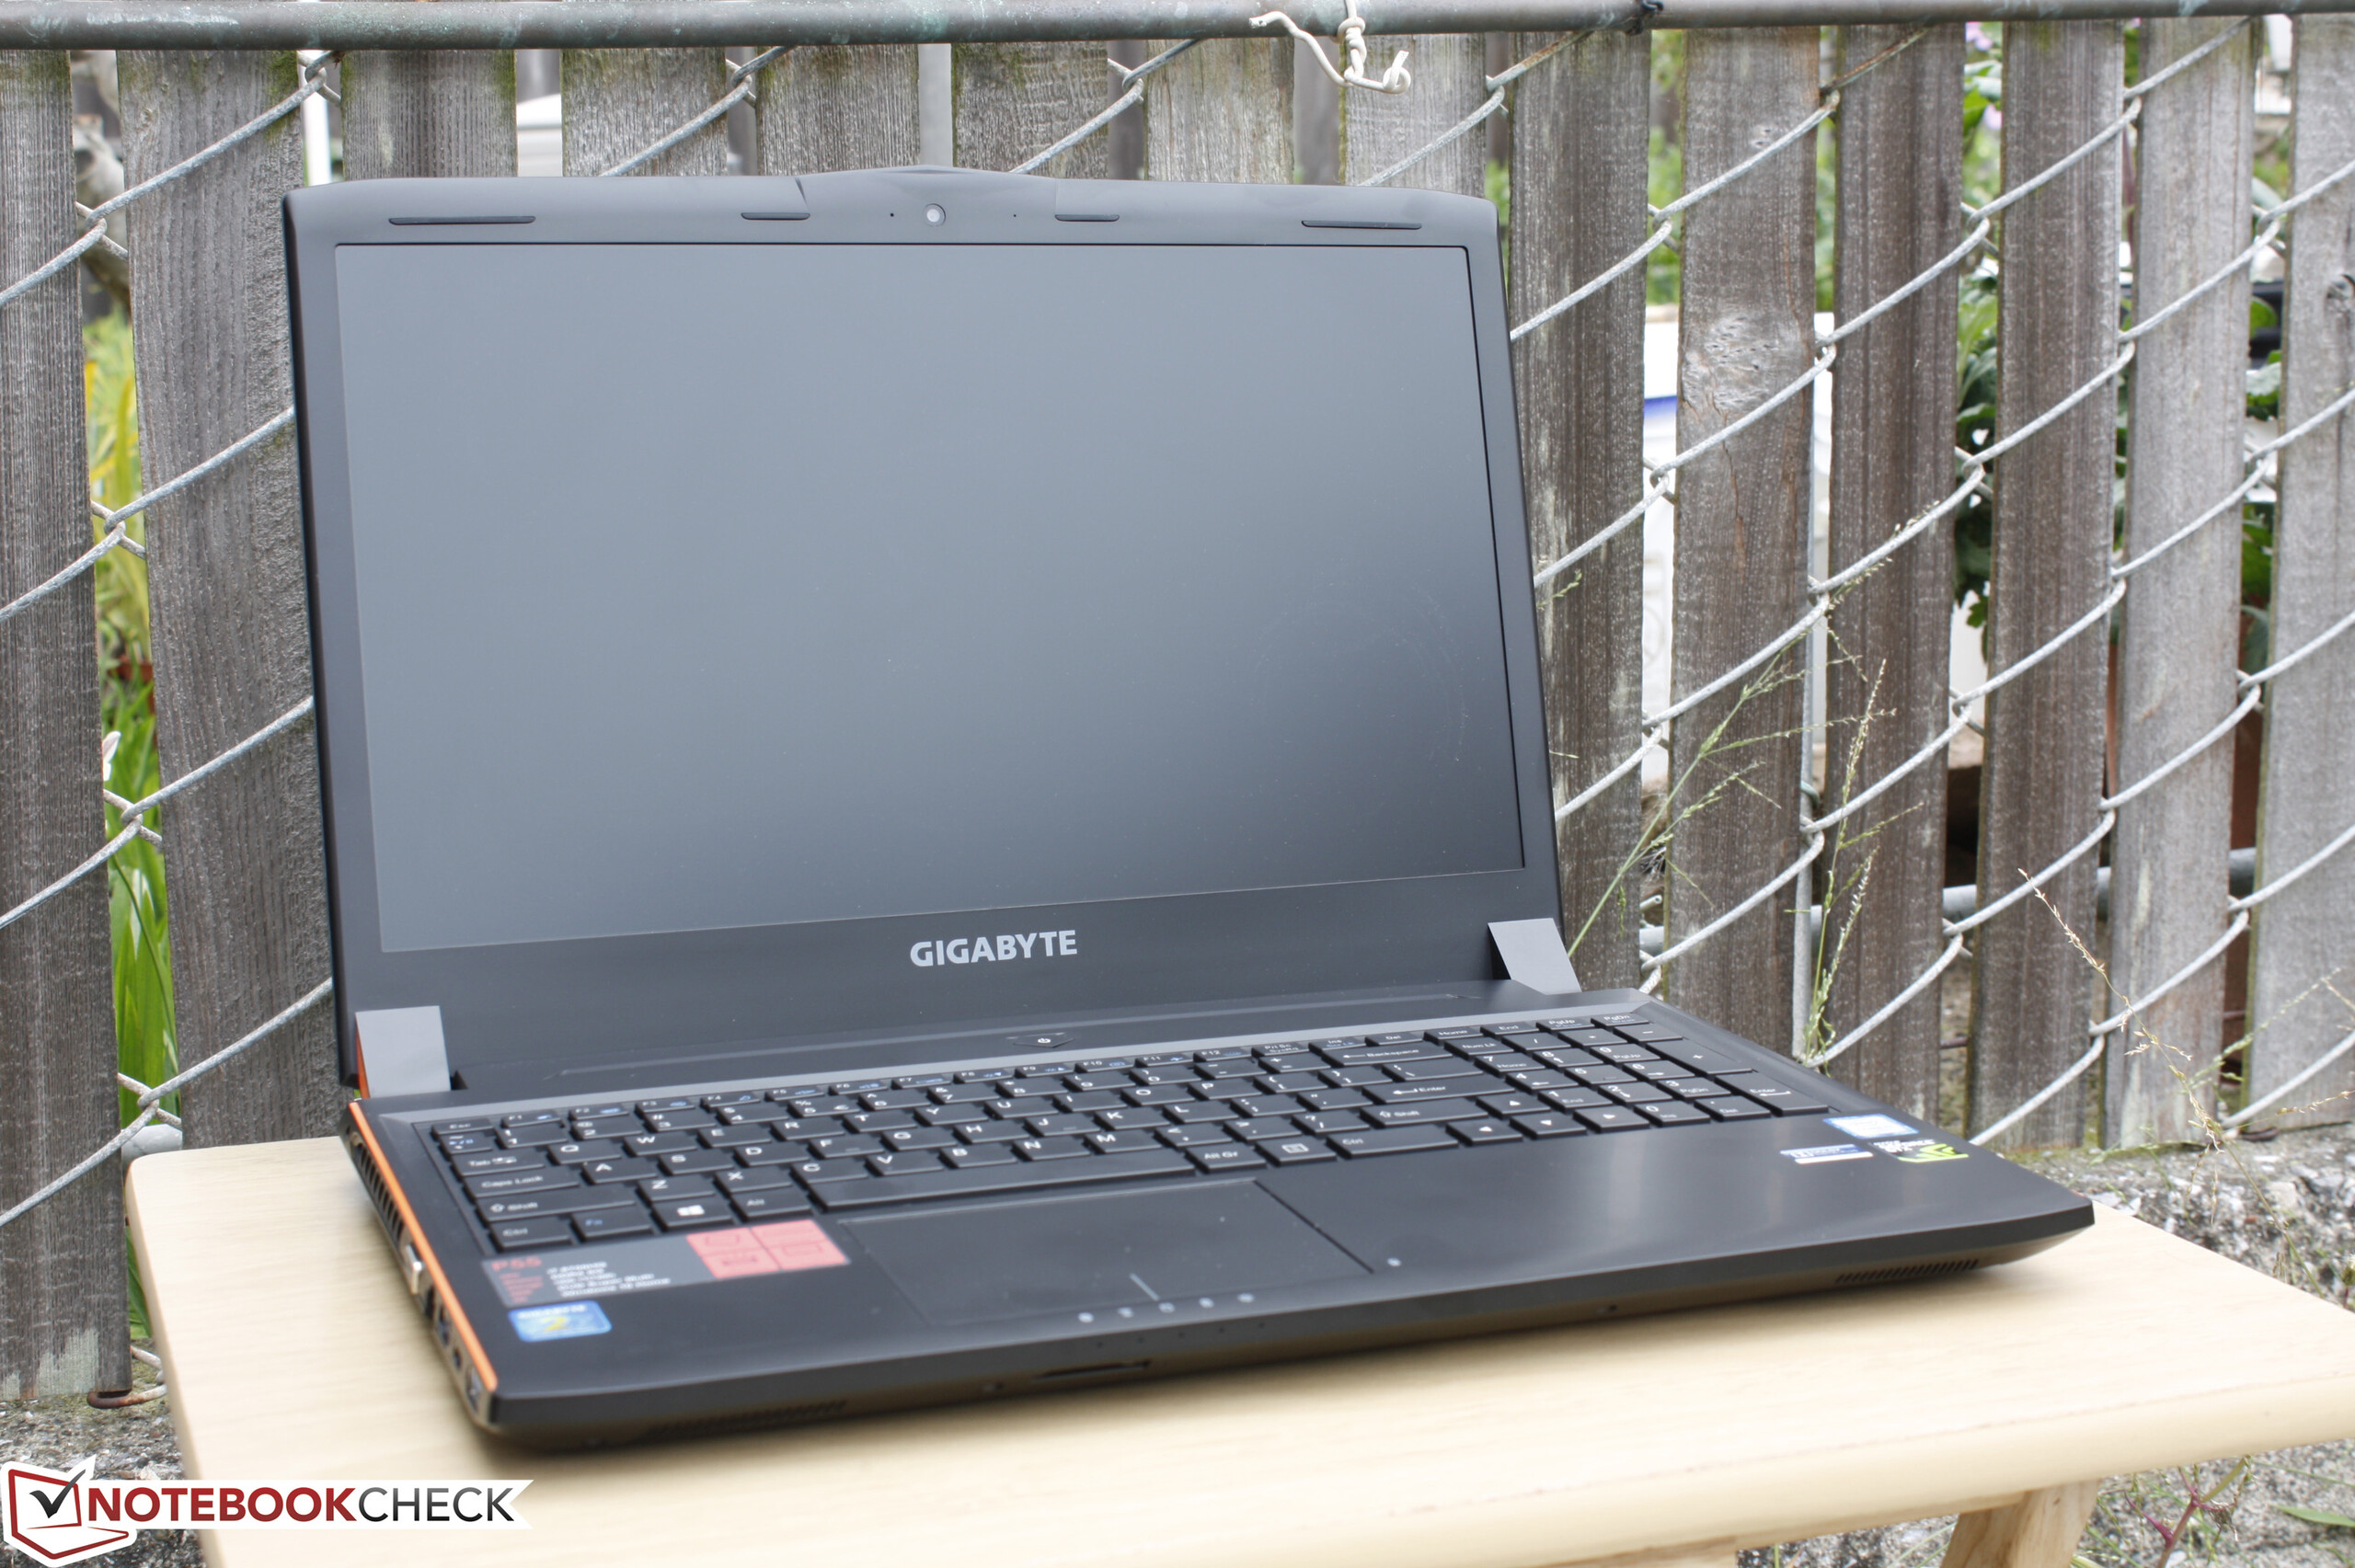
Recensione Breve del Portatile Gigabyte P55K v5


| |||||||||||||||||||||||||
Distribuzione della luminosità: 72 %
Al centro con la batteria: 274.9 cd/m²
Contrasto: 749:1 (Nero: 0.367 cd/m²)
ΔE ColorChecker Calman: 3.39 | ∀{0.5-29.43 Ø4.71}
ΔE Greyscale Calman: 4.21 | ∀{0.09-98 Ø4.96}
90.9% sRGB (Argyll 1.6.3 3D)
59.2% AdobeRGB 1998 (Argyll 1.6.3 3D)
91% sRGB (Argyll 3D)
65.9% Display P3 (Argyll 3D)
Gamma: 2.18
CCT: 6069 K
| Gigabyte P55K v5 15.6", 1920x1080 | Dell XPS 15 9550 i7 FHD 15.6", 1920x1080 | MSI GS60-6QE4K16H21 15.6", 3840x2160 | Asus GL552JX-CN154H 15.6", 1920x1080 | Acer Aspire V15 Nitro BE VN7-592G-79DV 15.6", 3840x2160 | |
|---|---|---|---|---|---|
| Display | 6% | -16% | 5% | 21% | |
| Display P3 Coverage (%) | 65.9 | 68.5 4% | 53.1 -19% | 67.8 3% | 86.2 31% |
| sRGB Coverage (%) | 91 | 97.2 7% | 80 -12% | 97.5 7% | 100 10% |
| AdobeRGB 1998 Coverage (%) | 70.4 | 54.8 | 70 | 99.5 | |
| Response Times | -72% | 2% | -9% | ||
| Response Time Grey 50% / Grey 80% * (ms) | 37.2 ? | 64 ? -72% | 40 ? -8% | 49 ? -32% | |
| Response Time Black / White * (ms) | 29.2 ? | 50 ? -71% | 26 ? 11% | 25 ? 14% | |
| PWM Frequency (Hz) | 1316 ? | 1000 ? | |||
| Screen | 2% | -33% | 10% | 27% | |
| Brightness middle (cd/m²) | 274.9 | 371.5 35% | 212 -23% | 326 19% | 303 10% |
| Brightness (cd/m²) | 259 | 356 37% | 197 -24% | 317 22% | 291 12% |
| Brightness Distribution (%) | 72 | 92 28% | 78 8% | 91 26% | 83 15% |
| Black Level * (cd/m²) | 0.367 | 0.252 31% | 0.49 -34% | 0.31 16% | 0.22 40% |
| Contrast (:1) | 749 | 1474 97% | 433 -42% | 1052 40% | 1377 84% |
| Colorchecker dE 2000 * | 3.39 | 5.55 -64% | 7.8 -130% | 4.14 -22% | 3.47 -2% |
| Colorchecker dE 2000 max. * | 5.76 | 10.95 -90% | 6.79 -18% | ||
| Greyscale dE 2000 * | 4.21 | 7.1 -69% | 5.23 -24% | 5.46 -30% | 1.17 72% |
| Gamma | 2.18 101% | 2.1 105% | 3.05 72% | 2.44 90% | 2.35 94% |
| CCT | 6069 107% | 6693 97% | 7574 86% | 6658 98% | |
| Color Space (Percent of AdobeRGB 1998) (%) | 59.2 | 63.4 7% | 50 -16% | 64 8% | 86 45% |
| Color Space (Percent of sRGB) (%) | 90.9 | 97.9 8% | 80 -12% | 97 7% | 100 10% |
| Media totale (Programma / Settaggio) | -21% /
-8% | -16% /
-25% | 8% /
9% | 13% /
21% |
* ... Meglio usare valori piccoli
Tempi di risposta del Display
| ↔ Tempi di risposta dal Nero al Bianco | ||
|---|---|---|
| 29.2 ms ... aumenta ↗ e diminuisce ↘ combinato | ↗ 12 ms Incremento | 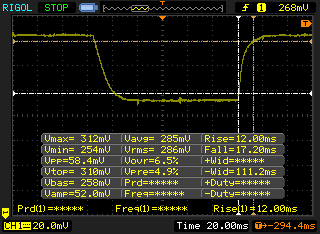 |
| ↘ 17.2 ms Calo | ||
| Lo schermo mostra tempi di risposta relativamente lenti nei nostri tests e potrebbe essere troppo lento per i gamers. In confronto, tutti i dispositivi di test variano da 0.1 (minimo) a 240 (massimo) ms. » 78 % di tutti i dispositivi è migliore. Questo significa che i tempi di risposta rilevati sono peggiori rispetto alla media di tutti i dispositivi testati (19.8 ms). | ||
| ↔ Tempo di risposta dal 50% Grigio all'80% Grigio | ||
| 37.2 ms ... aumenta ↗ e diminuisce ↘ combinato | ↗ 16 ms Incremento | 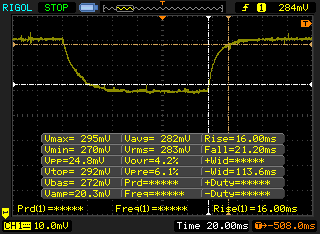 |
| ↘ 21.2 ms Calo | ||
| Lo schermo mostra tempi di risposta lenti nei nostri tests e sarà insoddisfacente per i gamers. In confronto, tutti i dispositivi di test variano da 0.165 (minimo) a 636 (massimo) ms. » 54 % di tutti i dispositivi è migliore. Questo significa che i tempi di risposta rilevati sono peggiori rispetto alla media di tutti i dispositivi testati (31 ms). | ||
Sfarfallio dello schermo / PWM (Pulse-Width Modulation)
| flickering dello schermo / PWM non rilevato | 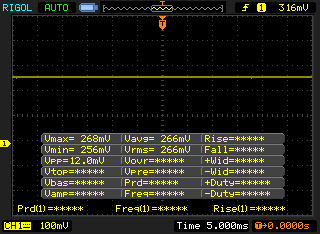 | ||
In confronto: 52 % di tutti i dispositivi testati non utilizza PWM per ridurre la luminosita' del display. Se è rilevato PWM, una media di 7754 (minimo: 5 - massimo: 343500) Hz è stata rilevata. | |||
| Cinebench R15 | |
| CPU Single 64Bit (ordina per valore) | |
| Gigabyte P55K v5 | |
| Eurocom Sky DLX7 | |
| Aorus X7 Pro v5 | |
| MSI PX60 QD-034US | |
| Lenovo IdeaPad Y50 | |
| CPU Multi 64Bit (ordina per valore) | |
| Gigabyte P55K v5 | |
| Eurocom Sky DLX7 | |
| Aorus X7 Pro v5 | |
| MSI PX60 QD-034US | |
| Lenovo IdeaPad Y50 | |
| Cinebench R11.5 | |
| CPU Single 64Bit (ordina per valore) | |
| Gigabyte P55K v5 | |
| Eurocom Sky DLX7 | |
| Aorus X7 Pro v5 | |
| MSI PX60 QD-034US | |
| Lenovo IdeaPad Y50 | |
| CPU Multi 64Bit (ordina per valore) | |
| Gigabyte P55K v5 | |
| Eurocom Sky DLX7 | |
| Aorus X7 Pro v5 | |
| MSI PX60 QD-034US | |
| Lenovo IdeaPad Y50 | |
| Cinebench R10 | |
| Rendering Multiple CPUs 32Bit (ordina per valore) | |
| Gigabyte P55K v5 | |
| Eurocom Sky DLX7 | |
| Aorus X7 Pro v5 | |
| MSI PX60 QD-034US | |
| Lenovo IdeaPad Y50 | |
| Rendering Single 32Bit (ordina per valore) | |
| Gigabyte P55K v5 | |
| Eurocom Sky DLX7 | |
| Aorus X7 Pro v5 | |
| MSI PX60 QD-034US | |
| Lenovo IdeaPad Y50 | |
| wPrime 2.10 - 1024m (ordina per valore) | |
| Gigabyte P55K v5 | |
| Eurocom Sky DLX7 | |
| MSI PX60 QD-034US | |
| Lenovo IdeaPad Y50 | |
| Super Pi Mod 1.5 XS 32M - 32M (ordina per valore) | |
| Gigabyte P55K v5 | |
| Eurocom Sky DLX7 | |
| MSI PX60 QD-034US | |
| Lenovo IdeaPad Y50 | |
* ... Meglio usare valori piccoli
| PCMark 8 | |
| Home Score Accelerated v2 (ordina per valore) | |
| Gigabyte P55K v5 | |
| Asus GL552VW-DH74 | |
| Dell XPS 15 9550 i7 FHD | |
| MSI GS60-6QE4K16H21 | |
| Acer Aspire V15 Nitro BE VN7-592G-79DV | |
| Work Score Accelerated v2 (ordina per valore) | |
| Gigabyte P55K v5 | |
| Asus GL552VW-DH74 | |
| Dell XPS 15 9550 i7 FHD | |
| Acer Aspire V15 Nitro BE VN7-592G-79DV | |
| Creative Score Accelerated v2 (ordina per valore) | |
| Gigabyte P55K v5 | |
| Asus GL552VW-DH74 | |
| Dell XPS 15 9550 i7 FHD | |
| Acer Aspire V15 Nitro BE VN7-592G-79DV | |
| PCMark 8 Home Score Accelerated v2 | 3845 punti | |
| PCMark 8 Creative Score Accelerated v2 | 4621 punti | |
| PCMark 8 Work Score Accelerated v2 | 4964 punti | |
Aiuto | ||
| Gigabyte P55K v5 GeForce GTX 965M, 6700HQ, SanDisk SD8SN8U1T001122 | Gigabyte P55W v5 GeForce GTX 970M, 6700HQ, Samsung SM951 MZVPV128 NVMe | Dell XPS 15 9550 i7 FHD GeForce GTX 960M, 6700HQ, Samsung PM951 NVMe 512 GB | MSI GS60-6QE4K16H21 GeForce GTX 970M, 6700HQ, Hynix HFS256G3MND | Acer Aspire V15 Nitro BE VN7-592G-79DV GeForce GTX 960M, 6700HQ, Lite-On CV1-8B512 M.2 512 GB | |
|---|---|---|---|---|---|
| AS SSD | 100% | 133% | 12% | 14% | |
| Copy Game MB/s (MB/s) | 377.5 | 463.7 23% | 805 113% | 346.1 -8% | |
| Copy Program MB/s (MB/s) | 178.2 | 278.4 56% | 325.3 83% | 276.5 55% | |
| Copy ISO MB/s (MB/s) | 354.5 | 558 57% | 1127 218% | 457.1 29% | |
| Score Total (Points) | 868 | 2201 154% | 2410 178% | 998 15% | 859 -1% |
| Score Write (Points) | 311 | 342 10% | 675 117% | 352 13% | 354 14% |
| Score Read (Points) | 366 | 1265 246% | 1180 222% | 425 16% | 333 -9% |
| Access Time Write * (ms) | 0.085 | 0.033 61% | 0.035 59% | 0.112 -32% | 0.053 38% |
| Access Time Read * (ms) | 0.087 | 0.066 24% | 0.038 56% | 0.089 -2% | 0.071 18% |
| 4K-64 Write (MB/s) | 227.9 | 175.5 -23% | 513 125% | 232.2 2% | 243.8 7% |
| 4K-64 Read (MB/s) | 294.6 | 1045 255% | 990 236% | 344.7 17% | 259.4 -12% |
| 4K Write (MB/s) | 46.73 | 112.7 141% | 105.4 126% | 80.9 73% | 67.9 45% |
| 4K Read (MB/s) | 25.09 | 45.15 80% | 31.86 27% | 28.77 15% | 21.75 -13% |
| Seq Write (MB/s) | 360.4 | 536 49% | 570 58% | 389.3 8% | 424.8 18% |
| Seq Read (MB/s) | 467.6 | 1739 272% | 1579 238% | 516 10% | 514 10% |
* ... Meglio usare valori piccoli

| 3DMark 11 | |
| 1280x720 Performance Combined (ordina per valore) | |
| Gigabyte P55K v5 | |
| DogHouse Systems Mobius SS | |
| Gigabyte P55W v5 | |
| Asus GL552VW-DH74 | |
| Asus N752VX-GC131T | |
| 1280x720 Performance GPU (ordina per valore) | |
| Gigabyte P55K v5 | |
| DogHouse Systems Mobius SS | |
| Gigabyte P55W v5 | |
| Asus GL552VW-DH74 | |
| Asus N752VX-GC131T | |
| 1280x720 Performance (ordina per valore) | |
| Gigabyte P55K v5 | |
| DogHouse Systems Mobius SS | |
| Gigabyte P55W v5 | |
| Asus GL552VW-DH74 | |
| Asus N752VX-GC131T | |
| 3DMark | |
| Fire Strike Extreme Combined (ordina per valore) | |
| Gigabyte P55K v5 | |
| DogHouse Systems Mobius SS | |
| Asus GL552VW-DH74 | |
| Asus N752VX-GC131T | |
| Fire Strike Extreme Graphics (ordina per valore) | |
| Gigabyte P55K v5 | |
| DogHouse Systems Mobius SS | |
| Asus GL552VW-DH74 | |
| Asus N752VX-GC131T | |
| 1920x1080 Fire Strike Combined (ordina per valore) | |
| Gigabyte P55K v5 | |
| DogHouse Systems Mobius SS | |
| Gigabyte P55W v5 | |
| Asus GL552VW-DH74 | |
| Asus N752VX-GC131T | |
| 1920x1080 Fire Strike Graphics (ordina per valore) | |
| Gigabyte P55K v5 | |
| DogHouse Systems Mobius SS | |
| Gigabyte P55W v5 | |
| Asus GL552VW-DH74 | |
| Asus N752VX-GC131T | |
| Fire Strike Extreme Score (ordina per valore) | |
| Gigabyte P55K v5 | |
| DogHouse Systems Mobius SS | |
| Asus GL552VW-DH74 | |
| Asus N752VX-GC131T | |
| 1920x1080 Fire Strike Score (ordina per valore) | |
| Gigabyte P55K v5 | |
| DogHouse Systems Mobius SS | |
| Gigabyte P55W v5 | |
| Asus GL552VW-DH74 | |
| Asus N752VX-GC131T | |
| 3DMark 11 Performance | 7269 punti | |
| 3DMark Ice Storm Standard Score | 83531 punti | |
| 3DMark Cloud Gate Standard Score | 18013 punti | |
| 3DMark Fire Strike Score | 4760 punti | |
| 3DMark Fire Strike Extreme Score | 2433 punti | |
Aiuto | ||
| Sleeping Dogs | |
| 1366x768 High Preset AA:High | |
| DogHouse Systems Mobius SS | |
| Aorus X3 Plus v5 | |
| Gigabyte P55K v5 | |
| Lenovo Ideapad Y700 15ISK 80NV | |
| MSI PX60 QD-034US | |
| 1920x1080 Extreme Preset AA:Extreme | |
| DogHouse Systems Mobius SS | |
| Aorus X3 Plus v5 | |
| Gigabyte P55K v5 | |
| Lenovo Ideapad Y700 15ISK 80NV | |
| MSI PX60 QD-034US | |
| BioShock Infinite | |
| 1366x768 High Preset | |
| DogHouse Systems Mobius SS | |
| Aorus X3 Plus v5 | |
| Gigabyte P55K v5 | |
| Lenovo Ideapad Y700 15ISK 80NV | |
| MSI PX60 QD-034US | |
| 1920x1080 Ultra Preset, DX11 (DDOF) | |
| DogHouse Systems Mobius SS | |
| Aorus X3 Plus v5 | |
| Gigabyte P55K v5 | |
| Lenovo Ideapad Y700 15ISK 80NV | |
| MSI PX60 QD-034US | |
| Metro: Last Light | |
| 1366x768 High (DX11) AF:16x | |
| DogHouse Systems Mobius SS | |
| Aorus X3 Plus v5 | |
| Gigabyte P55K v5 | |
| Lenovo Ideapad Y700 15ISK 80NV | |
| MSI PX60 QD-034US | |
| 1920x1080 Very High (DX11) AF:16x | |
| DogHouse Systems Mobius SS | |
| Aorus X3 Plus v5 | |
| Gigabyte P55K v5 | |
| Lenovo Ideapad Y700 15ISK 80NV | |
| MSI PX60 QD-034US | |
| Thief | |
| 1366x768 High Preset AA:FXAA & Low SS AF:4x | |
| DogHouse Systems Mobius SS | |
| Aorus X3 Plus v5 | |
| Gigabyte P55K v5 | |
| Lenovo Ideapad Y700 15ISK 80NV | |
| MSI PX60 QD-034US | |
| 1920x1080 Very High Preset AA:FXAA & High SS AF:8x | |
| DogHouse Systems Mobius SS | |
| Aorus X3 Plus v5 | |
| Gigabyte P55K v5 | |
| Lenovo Ideapad Y700 15ISK 80NV | |
| MSI PX60 QD-034US | |
| Batman: Arkham Knight | |
| 1920x1080 High / On (Interactive Smoke & Paper Debris Off) AA:SM AF:8x | |
| DogHouse Systems Mobius SS | |
| Aorus X3 Plus v5 | |
| Gigabyte P55K v5 | |
| Lenovo Ideapad Y700 15ISK 80NV | |
| 1920x1080 High / On AA:SM AF:16x | |
| DogHouse Systems Mobius SS | |
| Lenovo Ideapad Y700 15ISK 80NV | |
| Gigabyte P55K v5 | |
| Metal Gear Solid V | |
| 1920x1080 High / On | |
| DogHouse Systems Mobius SS | |
| Gigabyte P55K v5 | |
| Aorus X3 Plus v5 | |
| Lenovo Ideapad Y700 15ISK 80NV | |
| MSI PX60 QD-034US | |
| 1920x1080 Extra High / On | |
| DogHouse Systems Mobius SS | |
| Aorus X3 Plus v5 | |
| Gigabyte P55K v5 | |
| Lenovo Ideapad Y700 15ISK 80NV | |
| MSI PX60 QD-034US | |
| Fallout 4 | |
| 1920x1080 High Preset AA:T AF:16x | |
| DogHouse Systems Mobius SS | |
| Aorus X3 Plus v5 | |
| Gigabyte P55K v5 | |
| Lenovo Ideapad Y700 15ISK 80NV | |
| 1920x1080 Ultra Preset AA:T AF:16x | |
| DogHouse Systems Mobius SS | |
| Aorus X3 Plus v5 | |
| Gigabyte P55K v5 | |
| Lenovo Ideapad Y700 15ISK 80NV | |
| Rise of the Tomb Raider | |
| 1920x1080 High Preset AA:FX AF:4x | |
| DogHouse Systems Mobius SS | |
| Gigabyte P55K v5 | |
| 1920x1080 Very High Preset AA:FX AF:16x | |
| DogHouse Systems Mobius SS | |
| Gigabyte P55K v5 | |
| basso | medio | alto | ultra | |
|---|---|---|---|---|
| Sleeping Dogs (2012) | 150.1 | 105.8 | 32.9 | |
| BioShock Infinite (2013) | 148.1 | 132.2 | 52.4 | |
| Metro: Last Light (2013) | 115.6 | 74 | 39.2 | |
| Thief (2014) | 75.9 | 66.2 | 34.8 | |
| Batman: Arkham Knight (2015) | 75 | 39 | 24 | |
| Metal Gear Solid V (2015) | 60 | 60 | 47.1 | |
| Fallout 4 (2015) | 60.2 | 39.3 | 30.7 | |
| Rise of the Tomb Raider (2016) | 60.8 | 36.6 | 28.3 |
| Gigabyte P55K v5 GeForce GTX 965M, 6700HQ, SanDisk SD8SN8U1T001122 | Dell XPS 15 9550 i7 FHD GeForce GTX 960M, 6700HQ, Samsung PM951 NVMe 512 GB | MSI GS60-6QE4K16H21 GeForce GTX 970M, 6700HQ, Hynix HFS256G3MND | Acer Aspire V15 Nitro BE VN7-592G-79DV GeForce GTX 960M, 6700HQ, Lite-On CV1-8B512 M.2 512 GB | Gigabyte P35X v5 GeForce GTX 980M, 6700HQ, Samsung SM951 MZVPV256HDGL m.2 PCI-e | |
|---|---|---|---|---|---|
| Noise | 9% | -6% | -3% | -3% | |
| off /ambiente * (dB) | 29 | 31.3 -8% | |||
| Idle Minimum * (dB) | 32 | 29.2 9% | 35 -9% | 31.2 2% | 32.2 -1% |
| Idle Average * (dB) | 33 | 29.3 11% | 36 -9% | 31.2 5% | 32.3 2% |
| Idle Maximum * (dB) | 33 | 29.5 11% | 37 -12% | 36.2 -10% | 32.6 1% |
| Load Average * (dB) | 41 | 36.5 11% | 40 2% | 45.3 -10% | 44.4 -8% |
| Load Maximum * (dB) | 50 | 47.7 5% | 50 -0% | 47.3 5% | 54.6 -9% |
* ... Meglio usare valori piccoli
Rumorosità
| Idle |
| 32 / 33 / 33 dB(A) |
| DVD |
| 37 / dB(A) |
| Sotto carico |
| 41 / 50 dB(A) |
 | ||
30 dB silenzioso 40 dB(A) udibile 50 dB(A) rumoroso |
||
min: | ||
(-) La temperatura massima sul lato superiore è di 52.6 °C / 127 F, rispetto alla media di 40.4 °C / 105 F, che varia da 21.2 a 68.8 °C per questa classe Gaming.
(-) Il lato inferiore si riscalda fino ad un massimo di 50.2 °C / 122 F, rispetto alla media di 43.2 °C / 110 F
(+) In idle, la temperatura media del lato superiore è di 21.7 °C / 71 F, rispetto alla media deld ispositivo di 33.9 °C / 93 F.
(-) I poggiapolsi e il touchpad possono diventare molto caldi al tatto con un massimo di 44.6 °C / 112.3 F.
(-) La temperatura media della zona del palmo della mano di dispositivi simili e'stata di 28.8 °C / 83.8 F (-15.8 °C / -28.5 F).
| Gigabyte P55K v5 GeForce GTX 965M, 6700HQ, SanDisk SD8SN8U1T001122 | Gigabyte P55W v5 GeForce GTX 970M, 6700HQ, Samsung SM951 MZVPV128 NVMe | Dell XPS 15-9550 i7 GeForce GTX 960M, 6700HQ, Samsung PM951 NVMe 512 GB | MSI GS60 6QE-046XPL GeForce GTX 970M, 6700HQ, Toshiba HG6 THNSNJ256G8NU | Acer Aspire V15 Nitro BE VN7-592G-79DV GeForce GTX 960M, 6700HQ, Lite-On CV1-8B512 M.2 512 GB | |
|---|---|---|---|---|---|
| Power Consumption | -2% | -26% | -45% | 1% | |
| Idle Minimum * (Watt) | 10.1 | 9 11% | 12.5 -24% | 12.8 -27% | 8.9 12% |
| Idle Average * (Watt) | 13.3 | 13 2% | 19.6 -47% | 19.1 -44% | 13.9 -5% |
| Idle Maximum * (Watt) | 15.4 | 17 -10% | 22.8 -48% | 23.6 -53% | 15.6 -1% |
| Load Average * (Watt) | 75.8 | 81 -7% | 102 -35% | 147.9 -95% | 89 -17% |
| Load Maximum * (Watt) | 144 | 152 -6% | 107 26% | 155.9 -8% | 118 18% |
* ... Meglio usare valori piccoli
| Off / Standby | |
| Idle | |
| Sotto carico |
|
Leggenda:
min: | |
| Gigabyte P55K v5 61 Wh | Gigabyte P55W v5 61 Wh | Dell XPS 15 9550 i7 FHD 84 Wh | MSI GS60-6QE4K16H21 47 Wh | Acer Aspire V15 Nitro BE VN7-592G-79DV 52 Wh | |
|---|---|---|---|---|---|
| Autonomia della batteria | 20% | 73% | -42% | -7% | |
| Reader / Idle (h) | 8.4 | 10.1 20% | 16.3 94% | 3.6 -57% | 8.8 5% |
| WiFi v1.3 (h) | 4.9 | 5.8 18% | 9.1 86% | 2.6 -47% | 3.6 -27% |
| Load (h) | 1.3 | 1.6 23% | 1.8 38% | 1 -23% | 1.3 0% |
Pro
Contro

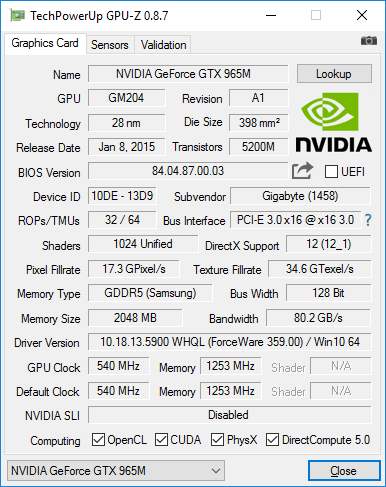
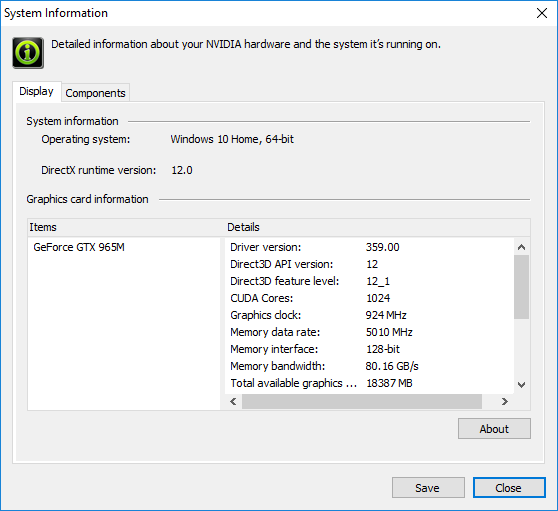
The Gigabyte P55K v5 is defined by its GTX 965M GPU and lower starting prices compared to its P55W v5 counterpart. Users can expect about a 25 percent decrease in FPS performance when moving from the GTX 970M to the GTX 965M while potentially saving hundreds of dollars. Overall horsepower will still be good enough for 1080p gameplay on High to Ultra settings at a smooth 30 FPS with a few exceptions. If this is more than acceptable, then the P55K is an easier recommendation.
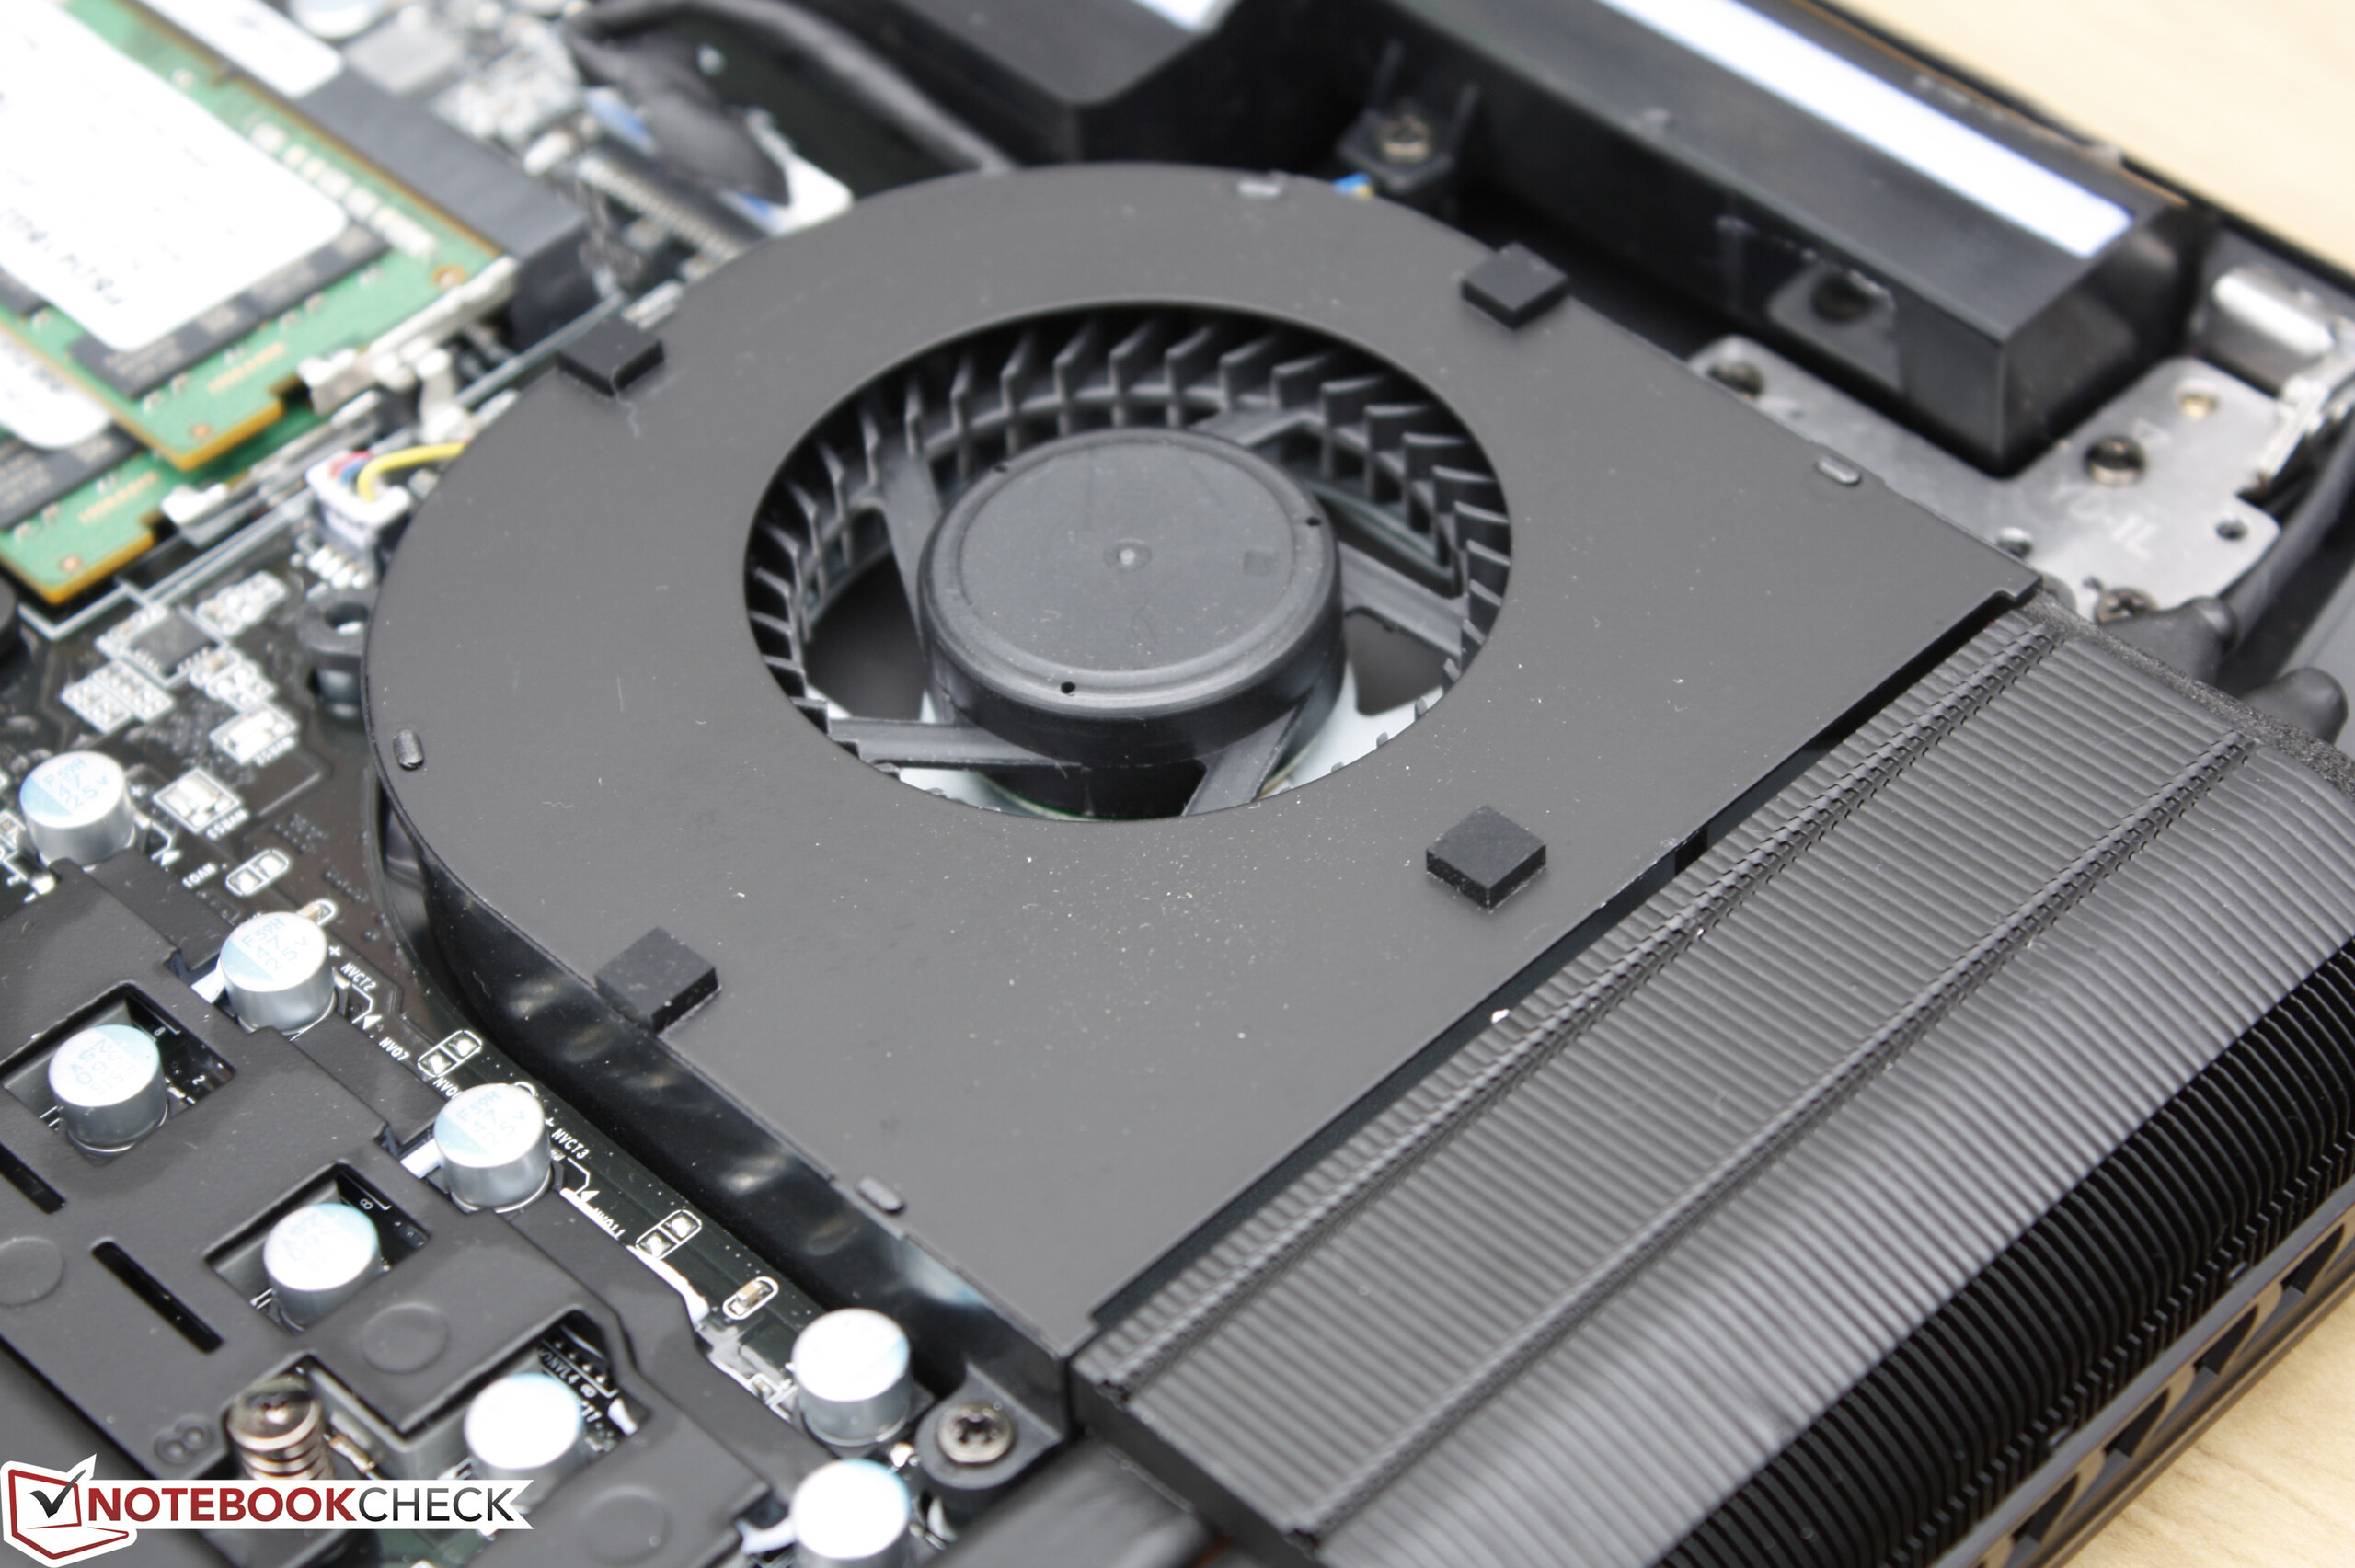
Aside from the performance hit, we were hoping to see reduced fan noise, longer runtimes, and lower core temperatures than its more powerful P55W v5 sibling. This is unfortunately not the case as we were unable to reproduce any consistent results to prove that the less powerful P55K is any quieter or cooler under similar conditions. The display panel, however, is measurably more accurate than the one on our P55W test unit, so digital artists may want to cherry pick specific SKUs for the higher sRGB coverage as well.
The GTX 965M in the P55K v5 lies comfortably between the GTX 960M and GTX 970M, though the system overall does not necessarily run any quieter, cooler, or longer than its more powerful P55W v5 SKU.
Nota: si tratta di una recensione breve, con alcune sezioni non tradotte, per la versione integrale in inglese guardate qui.
Gigabyte P55K v5
- 04/29/2016 v5.1 (old)
Allen Ngo
Price comparison
