Recensione Breve del Portatile Gigabyte P55W v5
| |||||||||||||||||||||||||
Distribuzione della luminosità: 89 %
Al centro con la batteria: 254 cd/m²
Contrasto: 907:1 (Nero: 0.28 cd/m²)
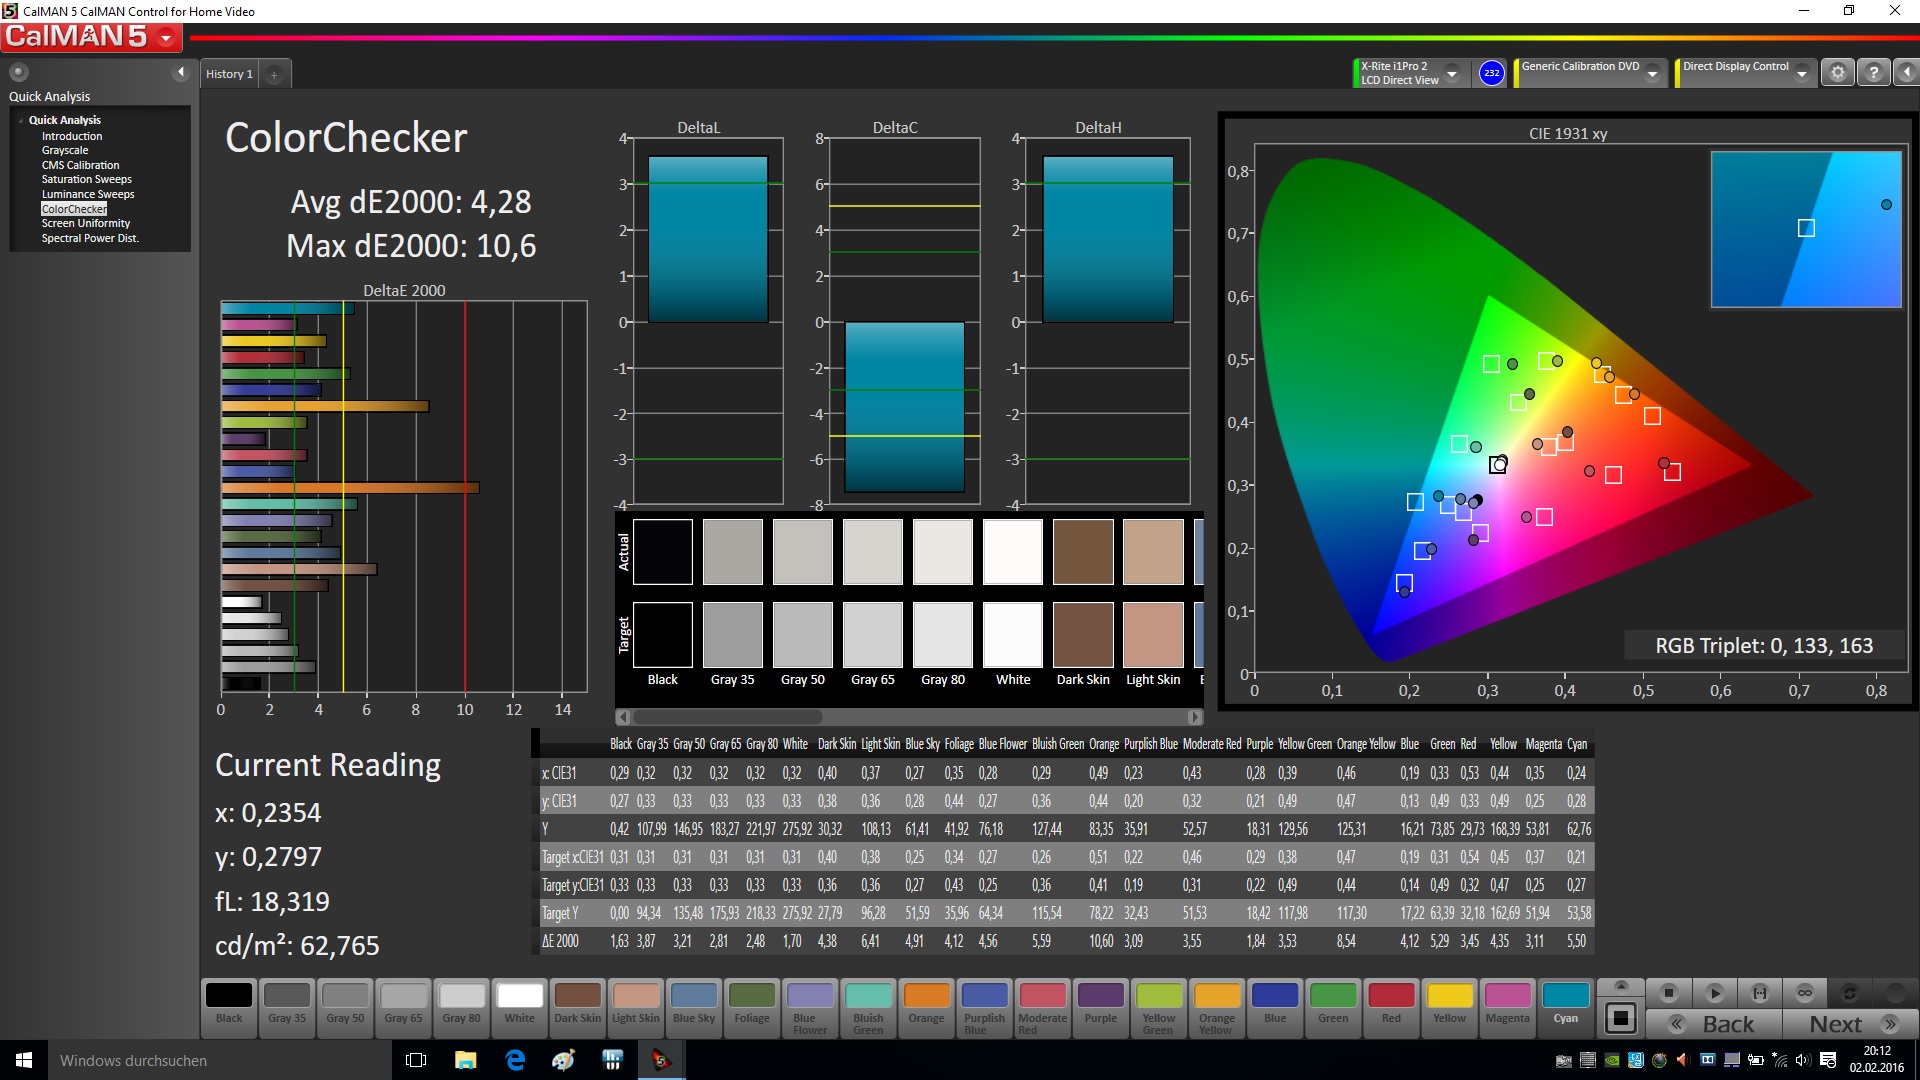
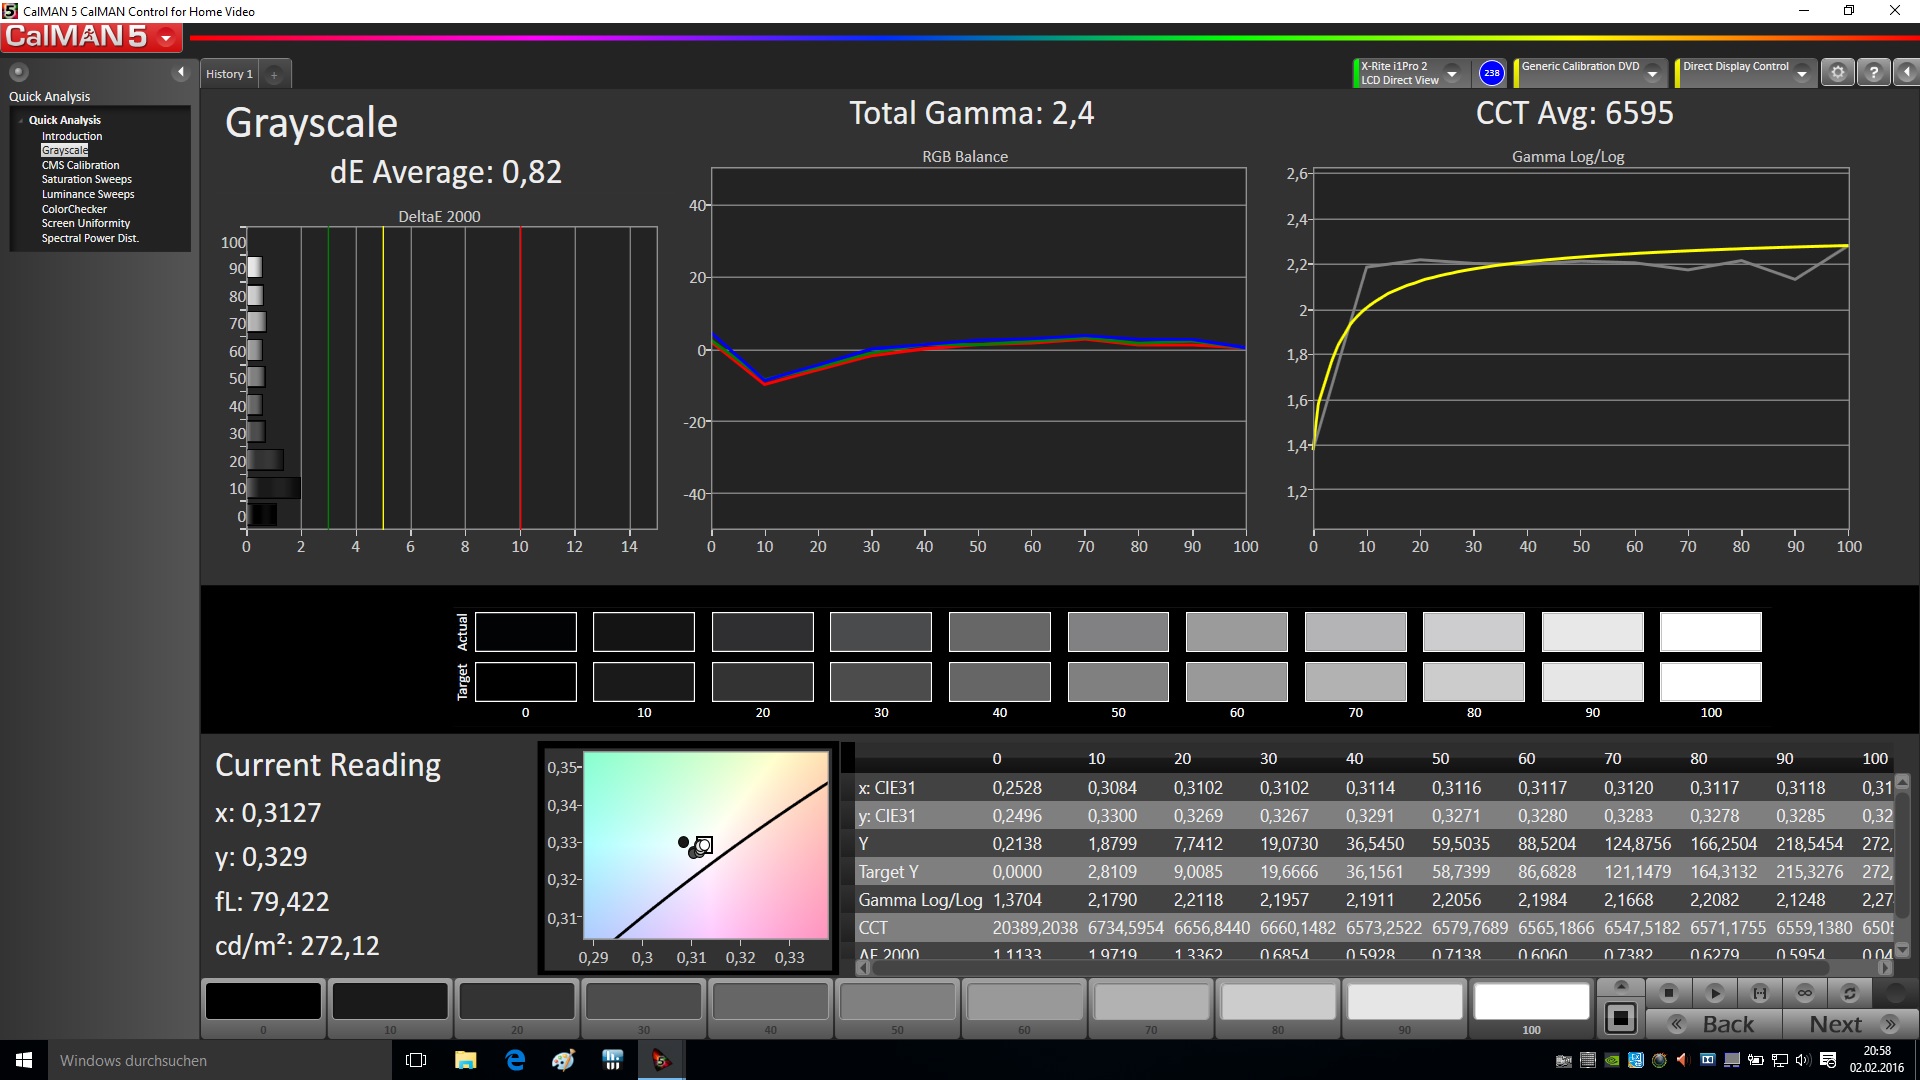
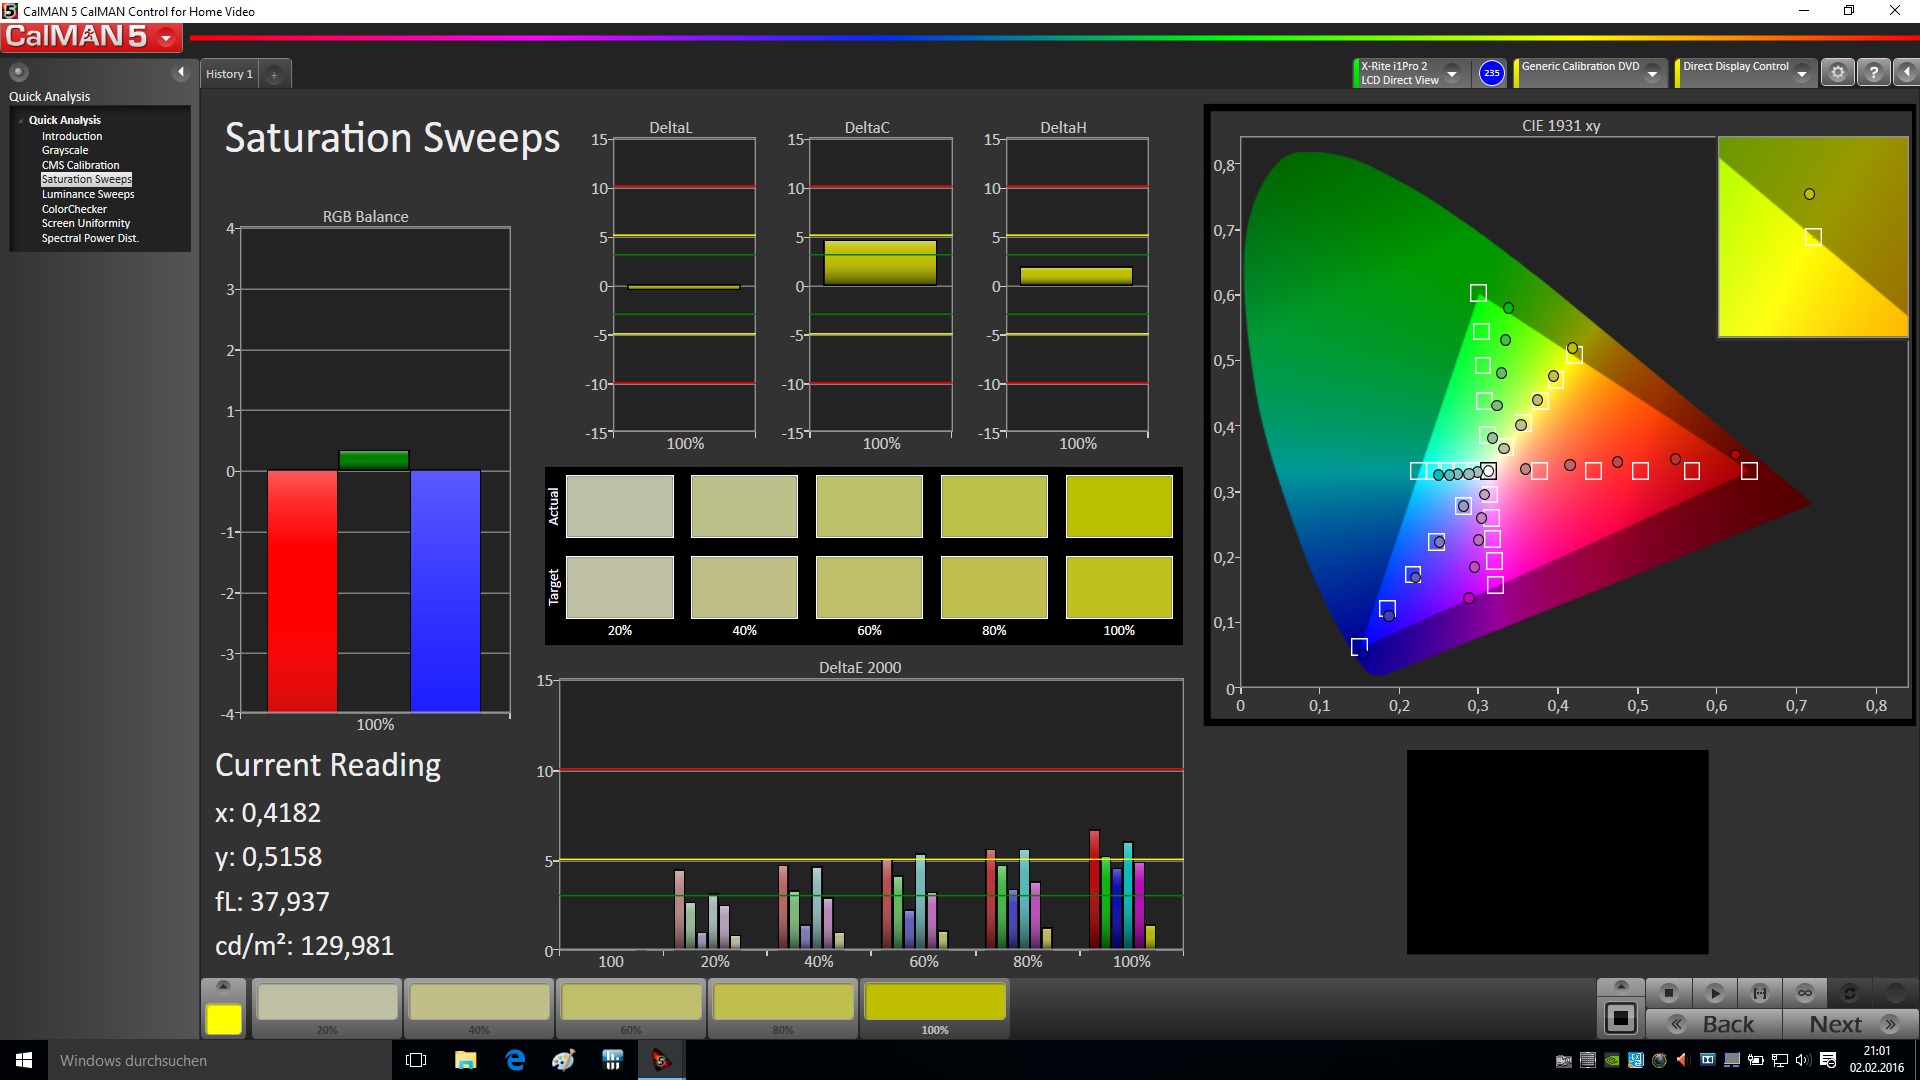
ΔE ColorChecker Calman: 4.28 | ∀{0.5-29.43 Ø4.71}
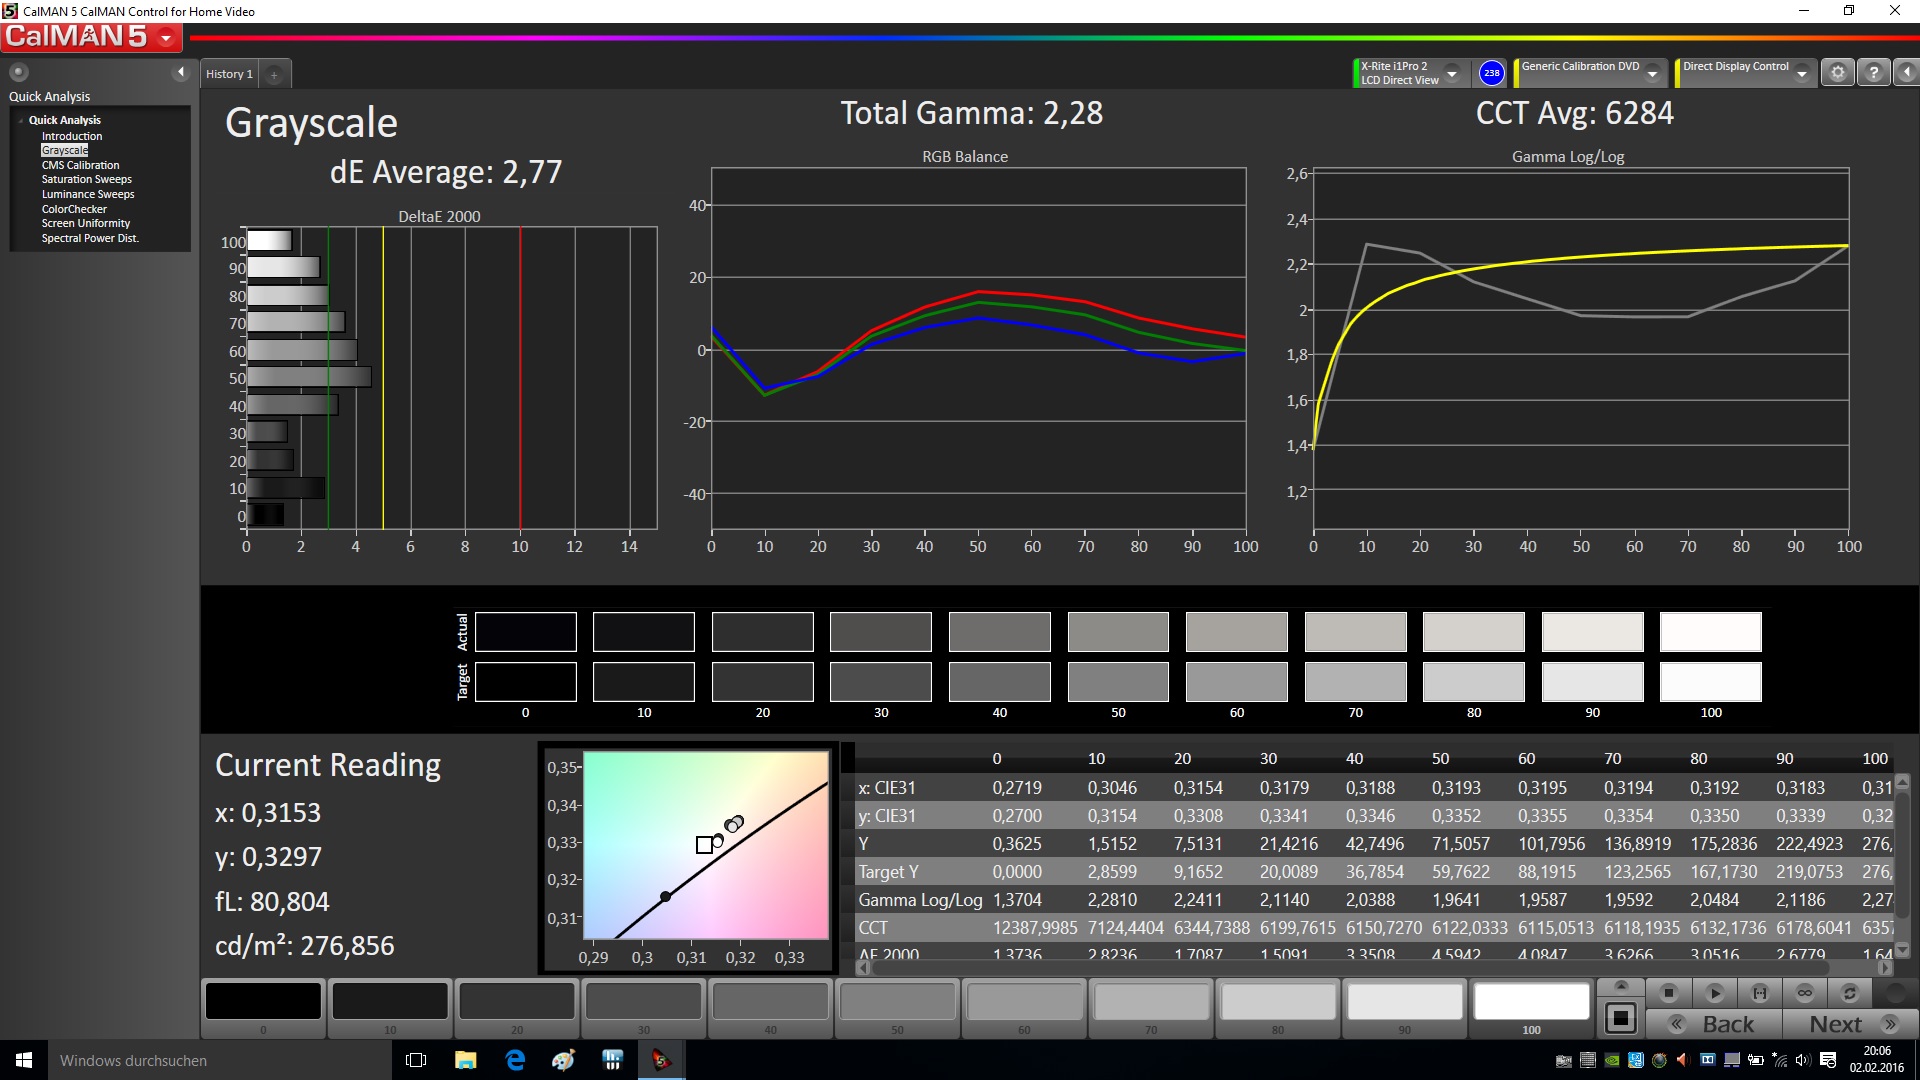
ΔE Greyscale Calman: 2.77 | ∀{0.09-98 Ø4.96}
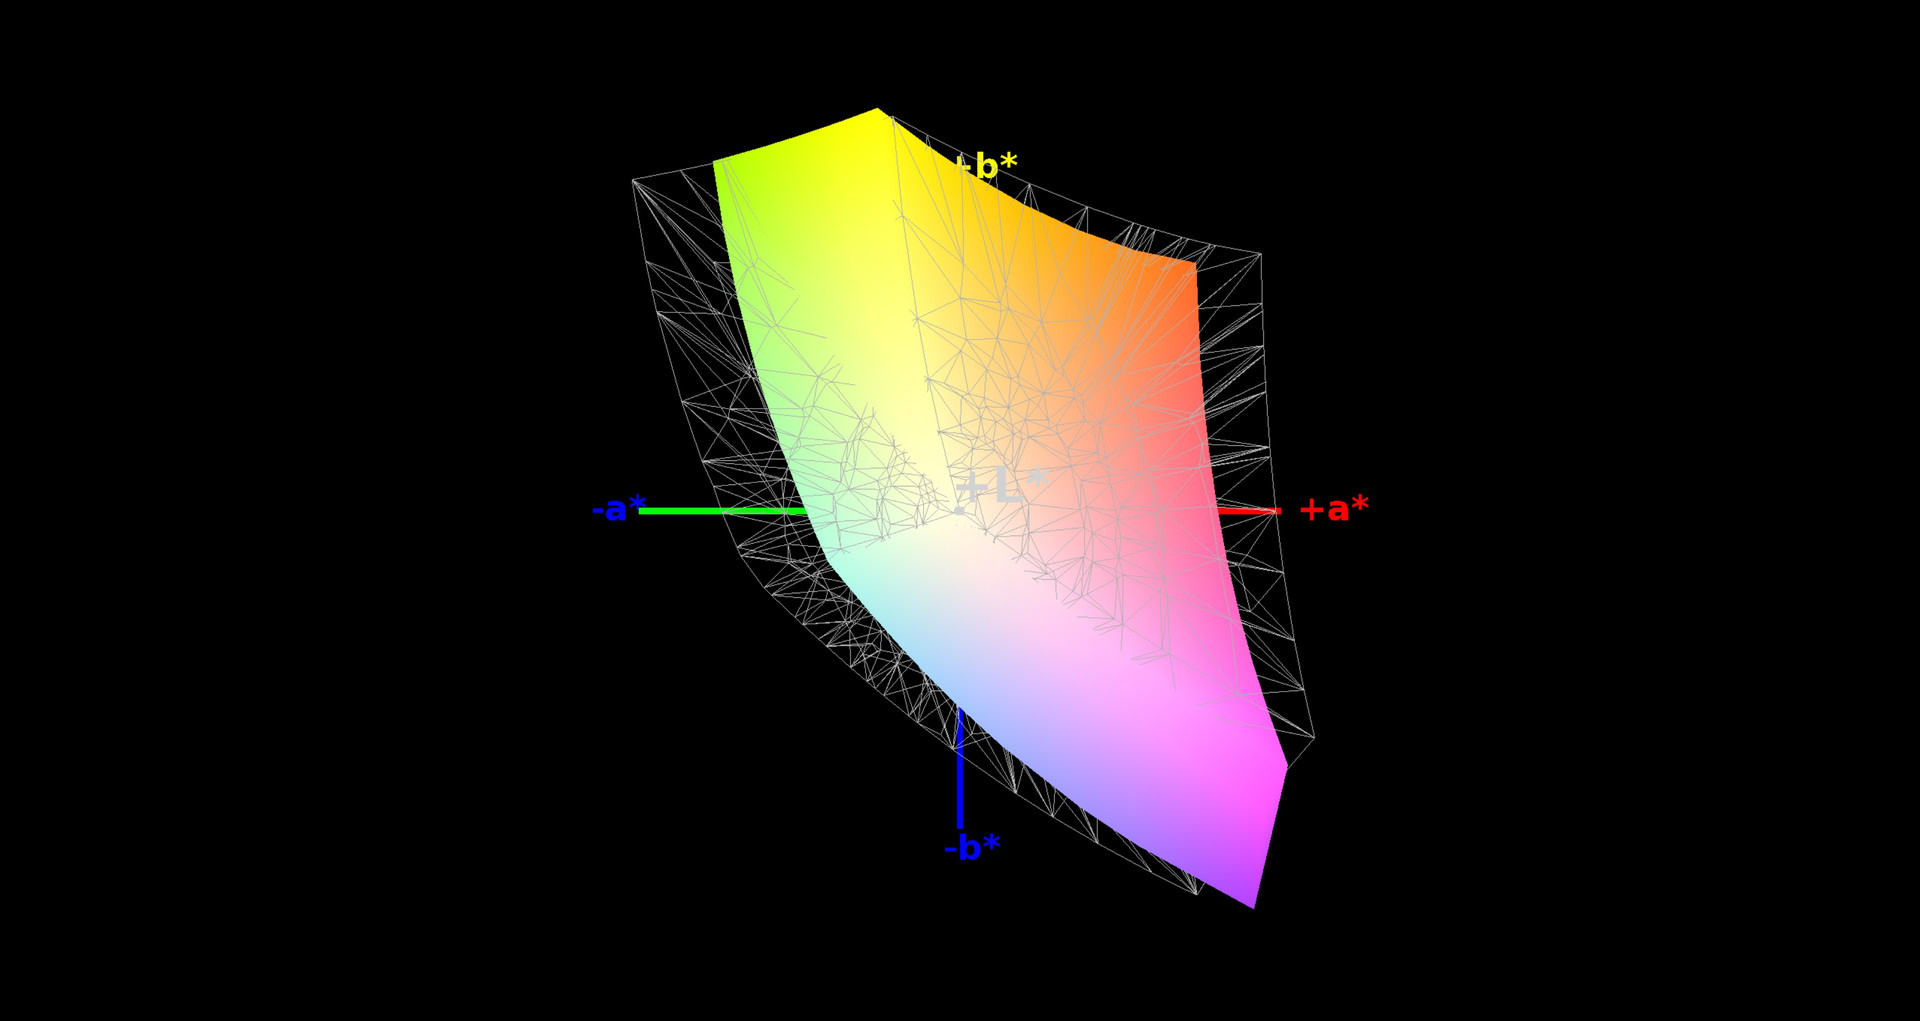
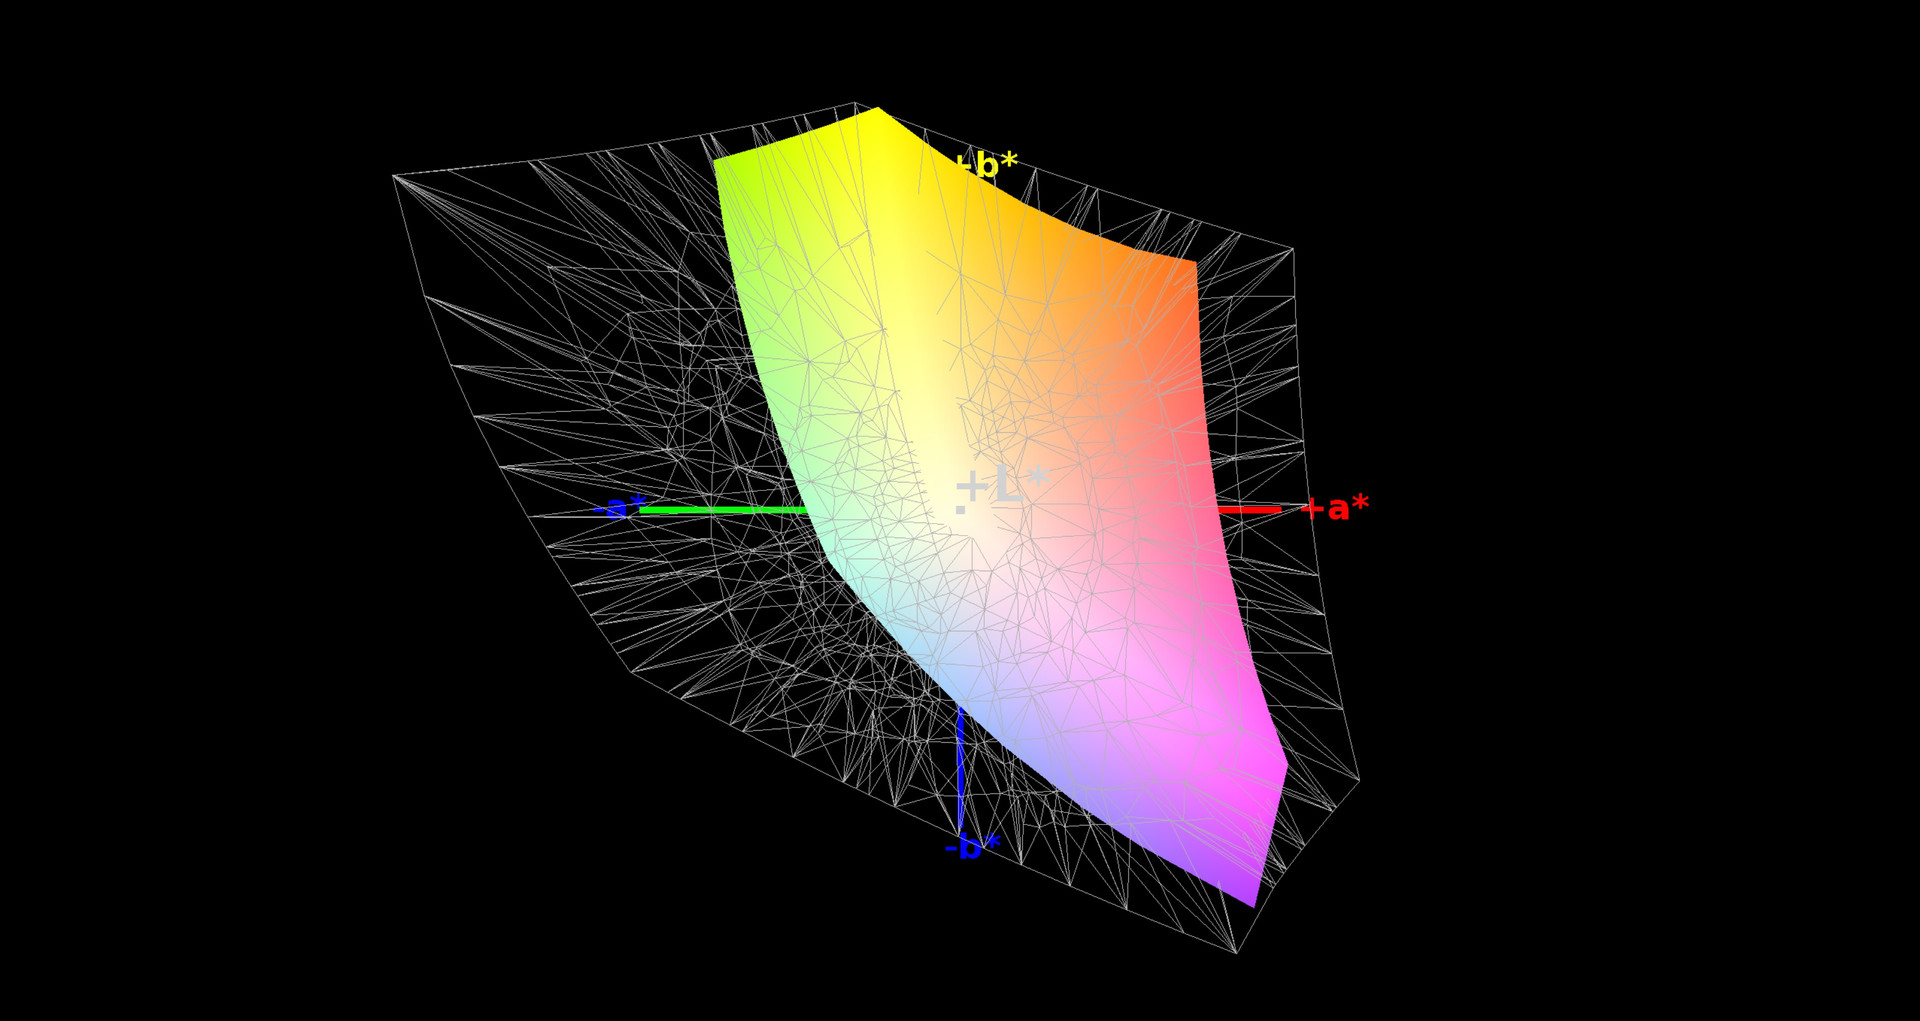
73% sRGB (Argyll 1.6.3 3D)
47% AdobeRGB 1998 (Argyll 1.6.3 3D)
51.2% AdobeRGB 1998 (Argyll 3D)
73.5% sRGB (Argyll 3D)
50.1% Display P3 (Argyll 3D)
Gamma: 2.28
CCT: 6284 K
| Gigabyte P55W v5 LG Philips LP156WF4-SPH1 | Gigabyte P55 V4 LG Philips, ID: LGD040E, Name: 156WF4 | MSI GS60-6QE4K16H21 Samsung 156FL02-P01 (SDC424B) | MSI GE62-6QD16H11 LG Philips LP156WF6 | Acer Predator 15 G9-591-74ZV LG LP156WF6-SPP1 (LGD04D5) | Schenker XMG P506 Samsung 156HL01-102 (SDC324C) | |
|---|---|---|---|---|---|---|
| Display | 18% | 7% | 22% | 24% | 33% | |
| Display P3 Coverage (%) | 50.1 | 64 28% | 53.1 6% | 64.5 29% | 66 32% | 66.4 33% |
| sRGB Coverage (%) | 73.5 | 80.6 10% | 80 9% | 85.6 16% | 85.8 17% | 96 31% |
| AdobeRGB 1998 Coverage (%) | 51.2 | 58.9 15% | 54.8 7% | 62.5 22% | 62.7 22% | 68.6 34% |
| Response Times | 7% | 15% | 19% | |||
| Response Time Grey 50% / Grey 80% * (ms) | 44 ? | 40 ? 9% | 31 ? 30% | 31 ? 30% | ||
| Response Time Black / White * (ms) | 27 ? | 26 ? 4% | 27 ? -0% | 25 ? 7% | ||
| PWM Frequency (Hz) | 1316 ? | |||||
| Screen | 7% | -37% | 10% | 5% | -4% | |
| Brightness middle (cd/m²) | 254 | 262.3 3% | 212 -17% | 300 18% | 310 22% | 310 22% |
| Brightness (cd/m²) | 267 | 265 -1% | 197 -26% | 291 9% | 287 7% | 299 12% |
| Brightness Distribution (%) | 89 | 89 0% | 78 -12% | 88 -1% | 86 -3% | 84 -6% |
| Black Level * (cd/m²) | 0.28 | 0.259 7% | 0.49 -75% | 0.32 -14% | 0.36 -29% | 0.35 -25% |
| Contrast (:1) | 907 | 1013 12% | 433 -52% | 938 3% | 861 -5% | 886 -2% |
| Colorchecker dE 2000 * | 4.28 | 4.29 -0% | 7.8 -82% | 3.51 18% | 3.83 11% | 4.1 4% |
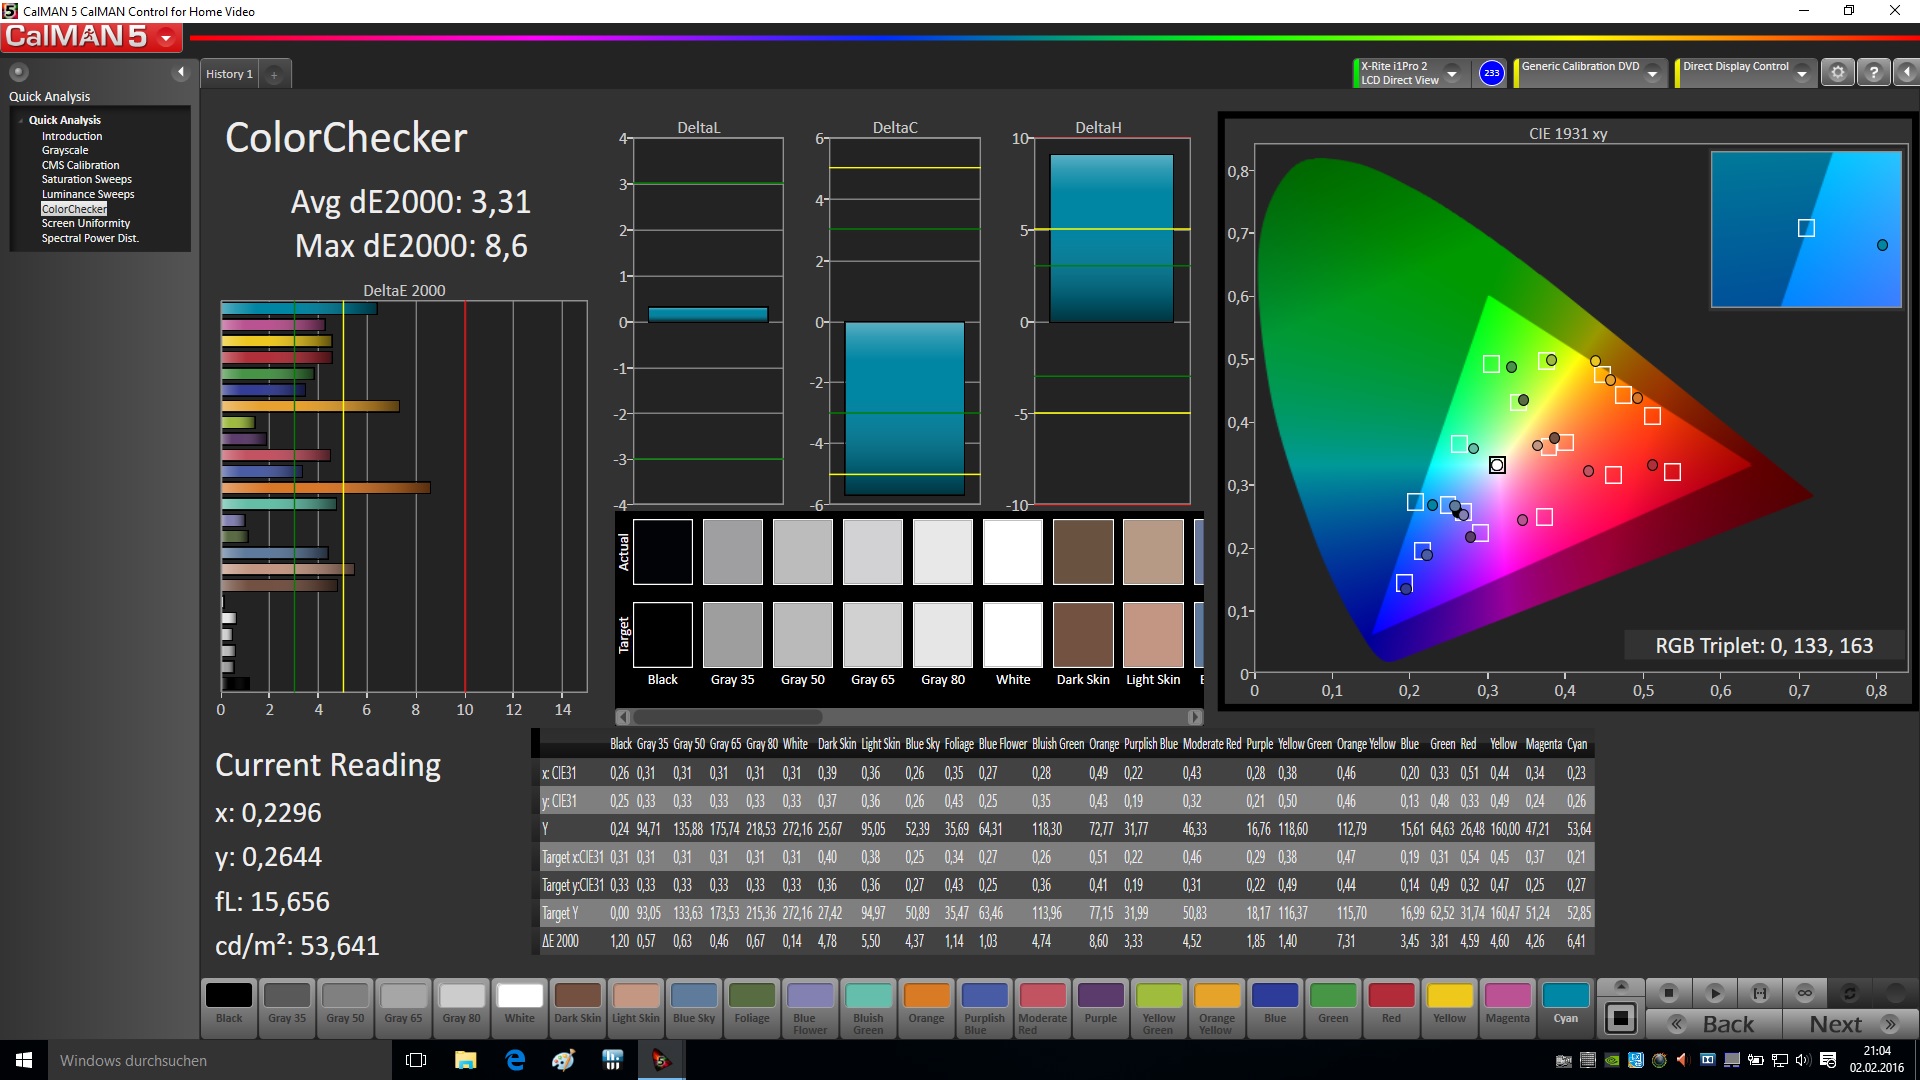
| Colorchecker dE 2000 max. * | 10.6 | 8.72 18% | ||||
| Greyscale dE 2000 * | 2.77 | 2.28 18% | 5.23 -89% | 2.52 9% | 2.53 9% | 5.7 -106% |
| Gamma | 2.28 96% | 2.31 95% | 3.05 72% | 2.38 92% | 2.42 91% | 2.53 87% |
| CCT | 6284 103% | 6350 102% | 6693 97% | 6759 96% | 6934 94% | 7454 87% |
| Color Space (Percent of AdobeRGB 1998) (%) | 47 | 53 13% | 50 6% | 56 19% | 56 19% | 63 34% |
| Color Space (Percent of sRGB) (%) | 73 | 80.3 10% | 80 10% | 86 18% | 86 18% | 96 32% |
| Media totale (Programma / Settaggio) | 13% /
10% | -8% /
-22% | 16% /
13% | 16% /
11% | 15% /
5% |
* ... Meglio usare valori piccoli
Sfarfallio dello schermo / PWM (Pulse-Width Modulation)
| flickering dello schermo / PWM non rilevato | 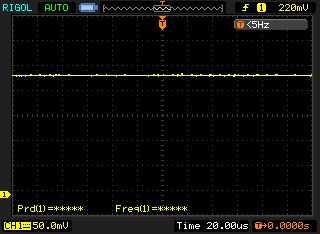 | ||
In confronto: 52 % di tutti i dispositivi testati non utilizza PWM per ridurre la luminosita' del display. Se è rilevato PWM, una media di 7757 (minimo: 5 - massimo: 343500) Hz è stata rilevata. | |||
Tempi di risposta del Display
| ↔ Tempi di risposta dal Nero al Bianco | ||
|---|---|---|
| 27 ms ... aumenta ↗ e diminuisce ↘ combinato | ↗ 7 ms Incremento | 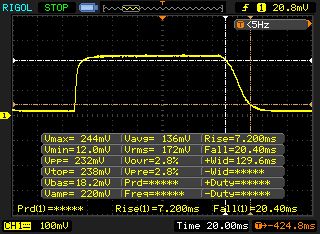 |
| ↘ 20 ms Calo | ||
| Lo schermo mostra tempi di risposta relativamente lenti nei nostri tests e potrebbe essere troppo lento per i gamers. In confronto, tutti i dispositivi di test variano da 0.1 (minimo) a 240 (massimo) ms. » 67 % di tutti i dispositivi è migliore. Questo significa che i tempi di risposta rilevati sono peggiori rispetto alla media di tutti i dispositivi testati (19.8 ms). | ||
| ↔ Tempo di risposta dal 50% Grigio all'80% Grigio | ||
| 44 ms ... aumenta ↗ e diminuisce ↘ combinato | ↗ 18 ms Incremento | 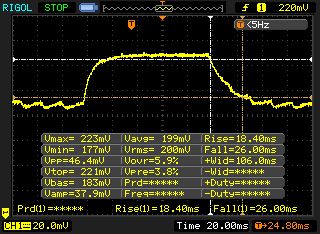 |
| ↘ 26 ms Calo | ||
| Lo schermo mostra tempi di risposta lenti nei nostri tests e sarà insoddisfacente per i gamers. In confronto, tutti i dispositivi di test variano da 0.165 (minimo) a 636 (massimo) ms. » 73 % di tutti i dispositivi è migliore. Questo significa che i tempi di risposta rilevati sono peggiori rispetto alla media di tutti i dispositivi testati (31 ms). | ||
| Cinebench R10 | |
| Rendering Multiple CPUs 32Bit (ordina per valore) | |
| Gigabyte P55W v5 | |
| Gigabyte P55 V4 | |
| MSI GS60-6QE4K16H21 | |
| MSI GE62-6QD16H11 | |
| Acer Predator 15 G9-591-74ZV | |
| Schenker XMG P506 | |
| Rendering Single 32Bit (ordina per valore) | |
| Gigabyte P55W v5 | |
| Gigabyte P55 V4 | |
| MSI GS60-6QE4K16H21 | |
| MSI GE62-6QD16H11 | |
| Acer Predator 15 G9-591-74ZV | |
| Schenker XMG P506 | |
| Geekbench 3 | |
| 32 Bit Multi-Core Score (ordina per valore) | |
| Gigabyte P55W v5 | |
| 32 Bit Single-Core Score (ordina per valore) | |
| Gigabyte P55W v5 | |
| Sunspider - 1.0 Total Score (ordina per valore) | |
| Gigabyte P55W v5 | |
| MSI GS60-6QE4K16H21 | |
| JetStream 1.1 - 1.1 Total (ordina per valore) | |
| Gigabyte P55W v5 | |
| Mozilla Kraken 1.1 - Total (ordina per valore) | |
| Gigabyte P55W v5 | |
| Octane V2 - Total Score (ordina per valore) | |
| Gigabyte P55W v5 | |
| Peacekeeper - --- (ordina per valore) | |
| Gigabyte P55W v5 | |
* ... Meglio usare valori piccoli
| PCMark 7 Score | 5124 punti | |
| PCMark 8 Home Score Accelerated v2 | 3832 punti | |
| PCMark 8 Creative Score Accelerated v2 | 4579 punti | |
| PCMark 8 Work Score Accelerated v2 | 4852 punti | |
Aiuto | ||
| PCMark 8 - Home Score Accelerated v2 (ordina per valore) | |
| Gigabyte P55W v5 | |
| Gigabyte P55 V4 | |
| MSI GS60-6QE4K16H21 | |
| MSI GE62-6QD16H11 | |
| Acer Predator 15 G9-591-74ZV | |
| PCMark 7 - Score (ordina per valore) | |
| Gigabyte P55W v5 | |
| Gigabyte P55 V4 | |
| MSI GS60-6QE4K16H21 | |
| MSI GE62-6QD16H11 | |
| Acer Predator 15 G9-591-74ZV | |
| Schenker XMG P506 | |

| 3DMark 06 Standard Score | 24611 punti | |
| 3DMark 11 Performance | 8932 punti | |
| 3DMark Ice Storm Standard Score | 64844 punti | |
| 3DMark Cloud Gate Standard Score | 20087 punti | |
| 3DMark Fire Strike Score | 6565 punti | |
Aiuto | ||
| 3DMark 11 - 1280x720 Performance (ordina per valore) | |
| Gigabyte P55W v5 | |
| Gigabyte P55 V4 | |
| MSI GS60-6QE4K16H21 | |
| MSI GE62-6QD16H11 | |
| Acer Predator 15 G9-591-74ZV | |
| Schenker XMG P506 | |
| 3DMark | |
| 1280x720 Ice Storm Standard Score (ordina per valore) | |
| Gigabyte P55W v5 | |
| Gigabyte P55 V4 | |
| MSI GS60-6QE4K16H21 | |
| MSI GE62-6QD16H11 | |
| Acer Predator 15 G9-591-74ZV | |
| Schenker XMG P506 | |
| 1280x720 Cloud Gate Standard Score (ordina per valore) | |
| Gigabyte P55W v5 | |
| Gigabyte P55 V4 | |
| MSI GS60-6QE4K16H21 | |
| MSI GE62-6QD16H11 | |
| Acer Predator 15 G9-591-74ZV | |
| Schenker XMG P506 | |
| 1280x720 Sky Diver Score (ordina per valore) | |
| Gigabyte P55W v5 | |
| Acer Predator 15 G9-591-74ZV | |
| Schenker XMG P506 | |
| 1920x1080 Fire Strike Score (ordina per valore) | |
| Gigabyte P55W v5 | |
| Gigabyte P55 V4 | |
| MSI GS60-6QE4K16H21 | |
| MSI GE62-6QD16H11 | |
| Acer Predator 15 G9-591-74ZV | |
| Schenker XMG P506 | |
| 3DMark 06 - 1280x1024 Standard Score AA:0x AF:0x (ordina per valore) | |
| Gigabyte P55W v5 | |
| Gigabyte P55 V4 | |
| basso | medio | alto | ultra | |
|---|---|---|---|---|
| Tomb Raider (2013) | 278.8 | 233.7 | 186.8 | 87.5 |
| BioShock Infinite (2013) | 158.4 | 140.8 | 133.1 | 69.7 |
| Dirt Rally (2015) | 167.7 | 92.4 | 77.3 | 57.3 |
| Batman: Arkham Knight (2015) | 91 | 84 | 57 | 36 |
| Anno 2205 (2015) | 117.5 | 102.6 | 54.9 | 17.4 |
| Call of Duty: Black Ops 3 (2015) | 100.1 | 97 | 59.6 | 55.7 |
| Just Cause 3 (2015) | 85.3 | 77.7 | 56.4 | 47.8 |
| Rise of the Tomb Raider (2016) | 102.1 | 70.4 | 44.6 | 37.1 |
| XCOM 2 (2016) | 66.2 | 47 | 34.8 | 16.5 |
| Tomb Raider - 1920x1080 Ultra Preset AA:FX AF:16x (ordina per valore) | |
| Gigabyte P55W v5 | |
| Gigabyte P55 V4 | |
| MSI GE62-6QD16H11 | |
| BioShock Infinite - 1920x1080 Ultra Preset, DX11 (DDOF) (ordina per valore) | |
| Gigabyte P55W v5 | |
| Gigabyte P55 V4 | |
| Dirt Rally - 1920x1080 Ultra Preset AA:4x MS (ordina per valore) | |
| Gigabyte P55W v5 | |
| MSI GE62-6QD16H11 | |
| Schenker XMG P506 | |
| Batman: Arkham Knight - 1920x1080 High / On AA:SM AF:16x (ordina per valore) | |
| Gigabyte P55W v5 | |
| Schenker XMG P506 | |
| Anno 2205 - 1920x1080 High Preset AA:4x (ordina per valore) | |
| Gigabyte P55W v5 | |
| MSI GS60-6QE4K16H21 | |
| Acer Predator 15 G9-591-74ZV | |
| Call of Duty: Black Ops 3 - 1920x1080 Extra / On AA:T2x SM (ordina per valore) | |
| Gigabyte P55W v5 | |
| Acer Predator 15 G9-591-74ZV | |
| Just Cause 3 - 1920x1080 Very High / On AA:SM AF:16x (ordina per valore) | |
| Gigabyte P55W v5 | |
| Rise of the Tomb Raider - 1920x1080 Very High Preset AA:FX AF:16x (ordina per valore) | |
| Gigabyte P55W v5 | |
| XCOM 2 - 1920x1080 High Preset AA:FX AF:8x (ordina per valore) | |
| Gigabyte P55W v5 | |
Rumorosità
| Idle |
| 33 / 34 / 35 dB(A) |
| DVD |
| 36 / dB(A) |
| Sotto carico |
| 43 / 49 dB(A) |
 | ||
30 dB silenzioso 40 dB(A) udibile 50 dB(A) rumoroso |
||
min: | ||
| Gigabyte P55W v5 6700HQ, GeForce GTX 970M | Gigabyte P55 V4 5700HQ, GeForce GTX 970M | MSI GS60-6QE4K16H21 6700HQ, GeForce GTX 970M | MSI GE62-6QD16H11 6700HQ, GeForce GTX 960M | Acer Predator 15 G9-591-74ZV 6700HQ, GeForce GTX 980M | Schenker XMG P506 6700HQ, GeForce GTX 970M | |
|---|---|---|---|---|---|---|
| Noise | 9% | -3% | -0% | -3% | 1% | |
| Idle Minimum * (dB) | 33 | 28.8 13% | 35 -6% | 33 -0% | 31 6% | 30.8 7% |
| Idle Average * (dB) | 34 | 28.9 15% | 36 -6% | 34 -0% | 32 6% | 32.8 4% |
| Idle Maximum * (dB) | 35 | 29 17% | 37 -6% | 38 -9% | 42 -20% | 35.9 -3% |
| Load Average * (dB) | 43 | 39 9% | 40 7% | 42 2% | 47 -9% | 42.2 2% |
| Load Maximum * (dB) | 49 | 52.3 -7% | 50 -2% | 46 6% | 48 2% | 51 -4% |
* ... Meglio usare valori piccoli
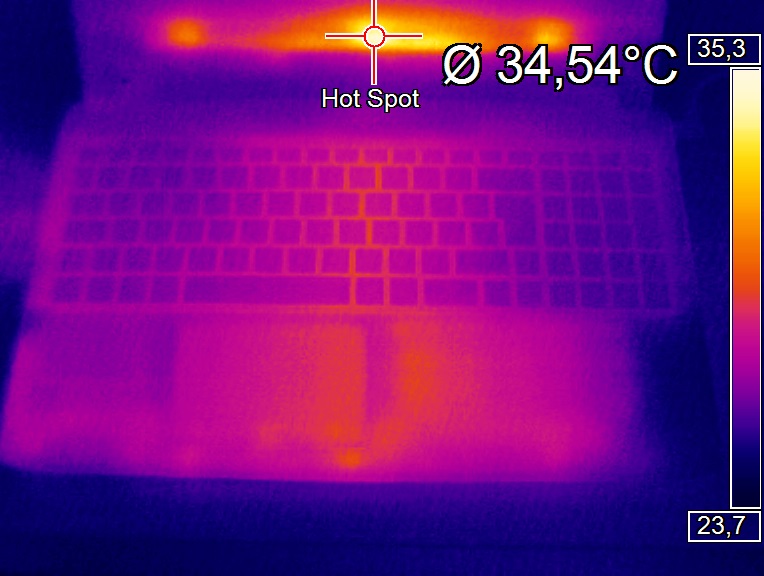
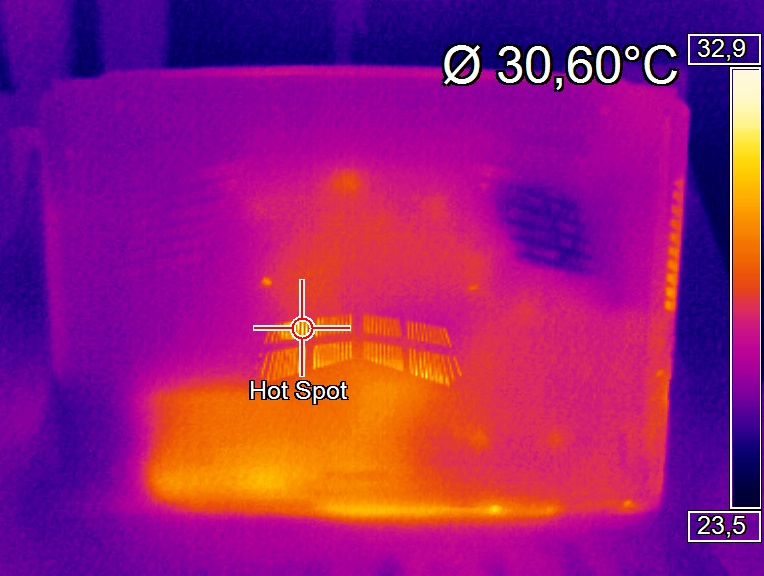
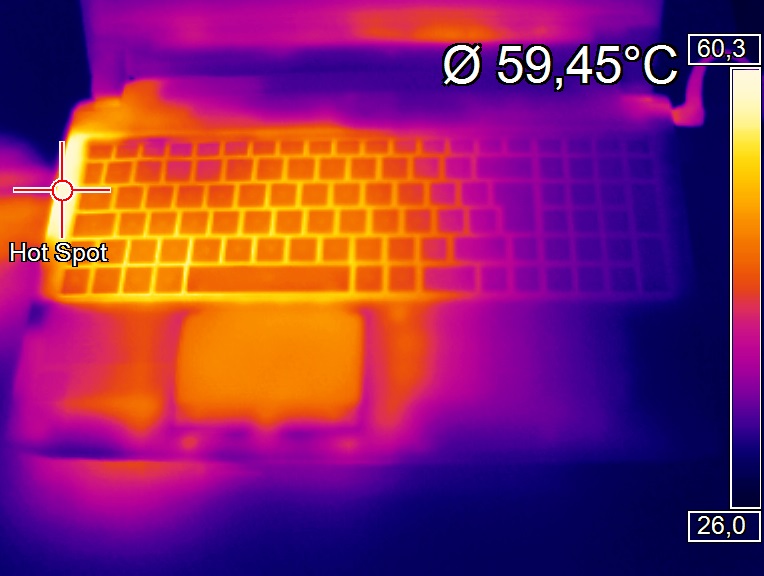
(-) La temperatura massima sul lato superiore è di 50 °C / 122 F, rispetto alla media di 40.4 °C / 105 F, che varia da 21.2 a 68.8 °C per questa classe Gaming.
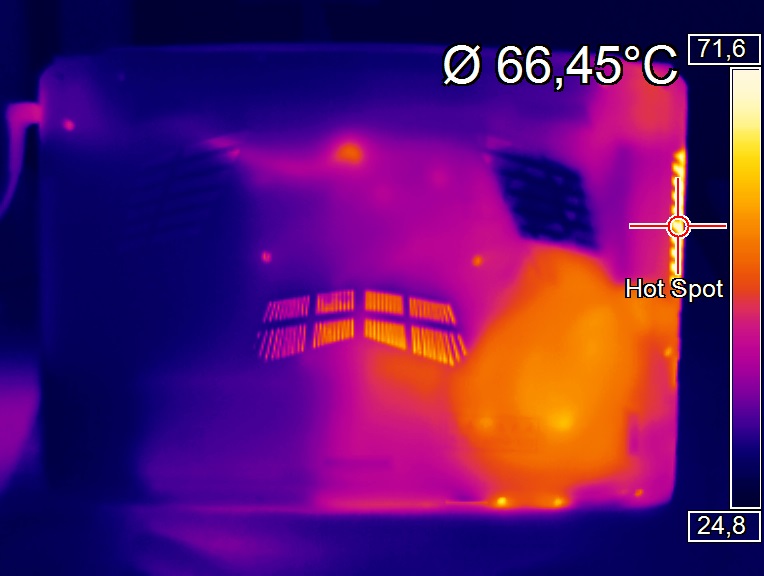
(-) Il lato inferiore si riscalda fino ad un massimo di 57.7 °C / 136 F, rispetto alla media di 43.2 °C / 110 F
(+) In idle, la temperatura media del lato superiore è di 25 °C / 77 F, rispetto alla media deld ispositivo di 33.9 °C / 93 F.
(-) I poggiapolsi e il touchpad possono diventare molto caldi al tatto con un massimo di 45.4 °C / 113.7 F.
(-) La temperatura media della zona del palmo della mano di dispositivi simili e'stata di 28.8 °C / 83.8 F (-16.6 °C / -29.9 F).
| Gigabyte P55W v5 6700HQ, GeForce GTX 970M | Gigabyte P55 V4 5700HQ, GeForce GTX 970M | MSI GS60-6QE4K16H21 6700HQ, GeForce GTX 970M | MSI GE62-6QD16H11 6700HQ, GeForce GTX 960M | Acer Predator 15 G9-591-74ZV 6700HQ, GeForce GTX 980M | Schenker XMG P506 6700HQ, GeForce GTX 970M | |
|---|---|---|---|---|---|---|
| Heat | -18% | -10% | -26% | -7% | -11% | |
| Maximum Upper Side * (°C) | 50 | 48.2 4% | 51.4 -3% | 53.3 -7% | 49.8 -0% | 49.3 1% |
| Maximum Bottom * (°C) | 57.7 | 50.2 13% | 68.9 -19% | 49.3 15% | 59.2 -3% | 60.4 -5% |
| Idle Upper Side * (°C) | 25.7 | 35.6 -39% | 27.1 -5% | 41.2 -60% | 32.2 -25% | 31.4 -22% |
| Idle Bottom * (°C) | 27.2 | 41.2 -51% | 30.4 -12% | 40.8 -50% | 26.9 1% | 32.3 -19% |
* ... Meglio usare valori piccoli
| Off / Standby | |
| Idle | |
| Sotto carico |
|
Leggenda:
min: | |
| Gigabyte P55W v5 6700HQ, GeForce GTX 970M | MSI GS60-6QE4K16H21 6700HQ, GeForce GTX 970M | MSI GE62-6QD16H11 6700HQ, GeForce GTX 960M | Acer Predator 15 G9-591-74ZV 6700HQ, GeForce GTX 980M | Schenker XMG P506 6700HQ, GeForce GTX 970M | |
|---|---|---|---|---|---|
| Power Consumption | -47% | -61% | -23% | -10% | |
| Idle Minimum * (Watt) | 9 | 17 -89% | 20 -122% | 12 -33% | 10.5 -17% |
| Idle Average * (Watt) | 13 | 22 -69% | 24 -85% | 16 -23% | 14.6 -12% |
| Idle Maximum * (Watt) | 17 | 28 -65% | 30 -76% | 22 -29% | 20.7 -22% |
| Load Average * (Watt) | 81 | 91 -12% | 97 -20% | 100 -23% | 81.8 -1% |
| Load Maximum * (Watt) | 152 | 149 2% | 155 -2% | 162 -7% | 146.3 4% |
* ... Meglio usare valori piccoli
| Gigabyte P55W v5 61 Wh | Gigabyte P55 V4 57 Wh | MSI GS60-6QE4K16H21 47 Wh | MSI GE62-6QD16H11 53 Wh | Acer Predator 15 G9-591-74ZV Wh | Schenker XMG P506 60 Wh | |
|---|---|---|---|---|---|---|
| Autonomia della batteria | -16% | -52% | -55% | 22% | -25% | |
| Reader / Idle (h) | 10.1 | 8.6 -15% | 3.6 -64% | 3.1 -69% | 11.2 11% | 5.2 -49% |
| H.264 (h) | 5.5 | 2.3 -58% | 7.4 35% | |||
| WiFi v1.3 (h) | 5.8 | 3.9 -33% | 2.6 -55% | 2.5 -57% | ||
| Load (h) | 1.6 | 1.6 0% | 1 -37% | 1 -37% | 1.9 19% | 1.6 0% |
Pro
Contro
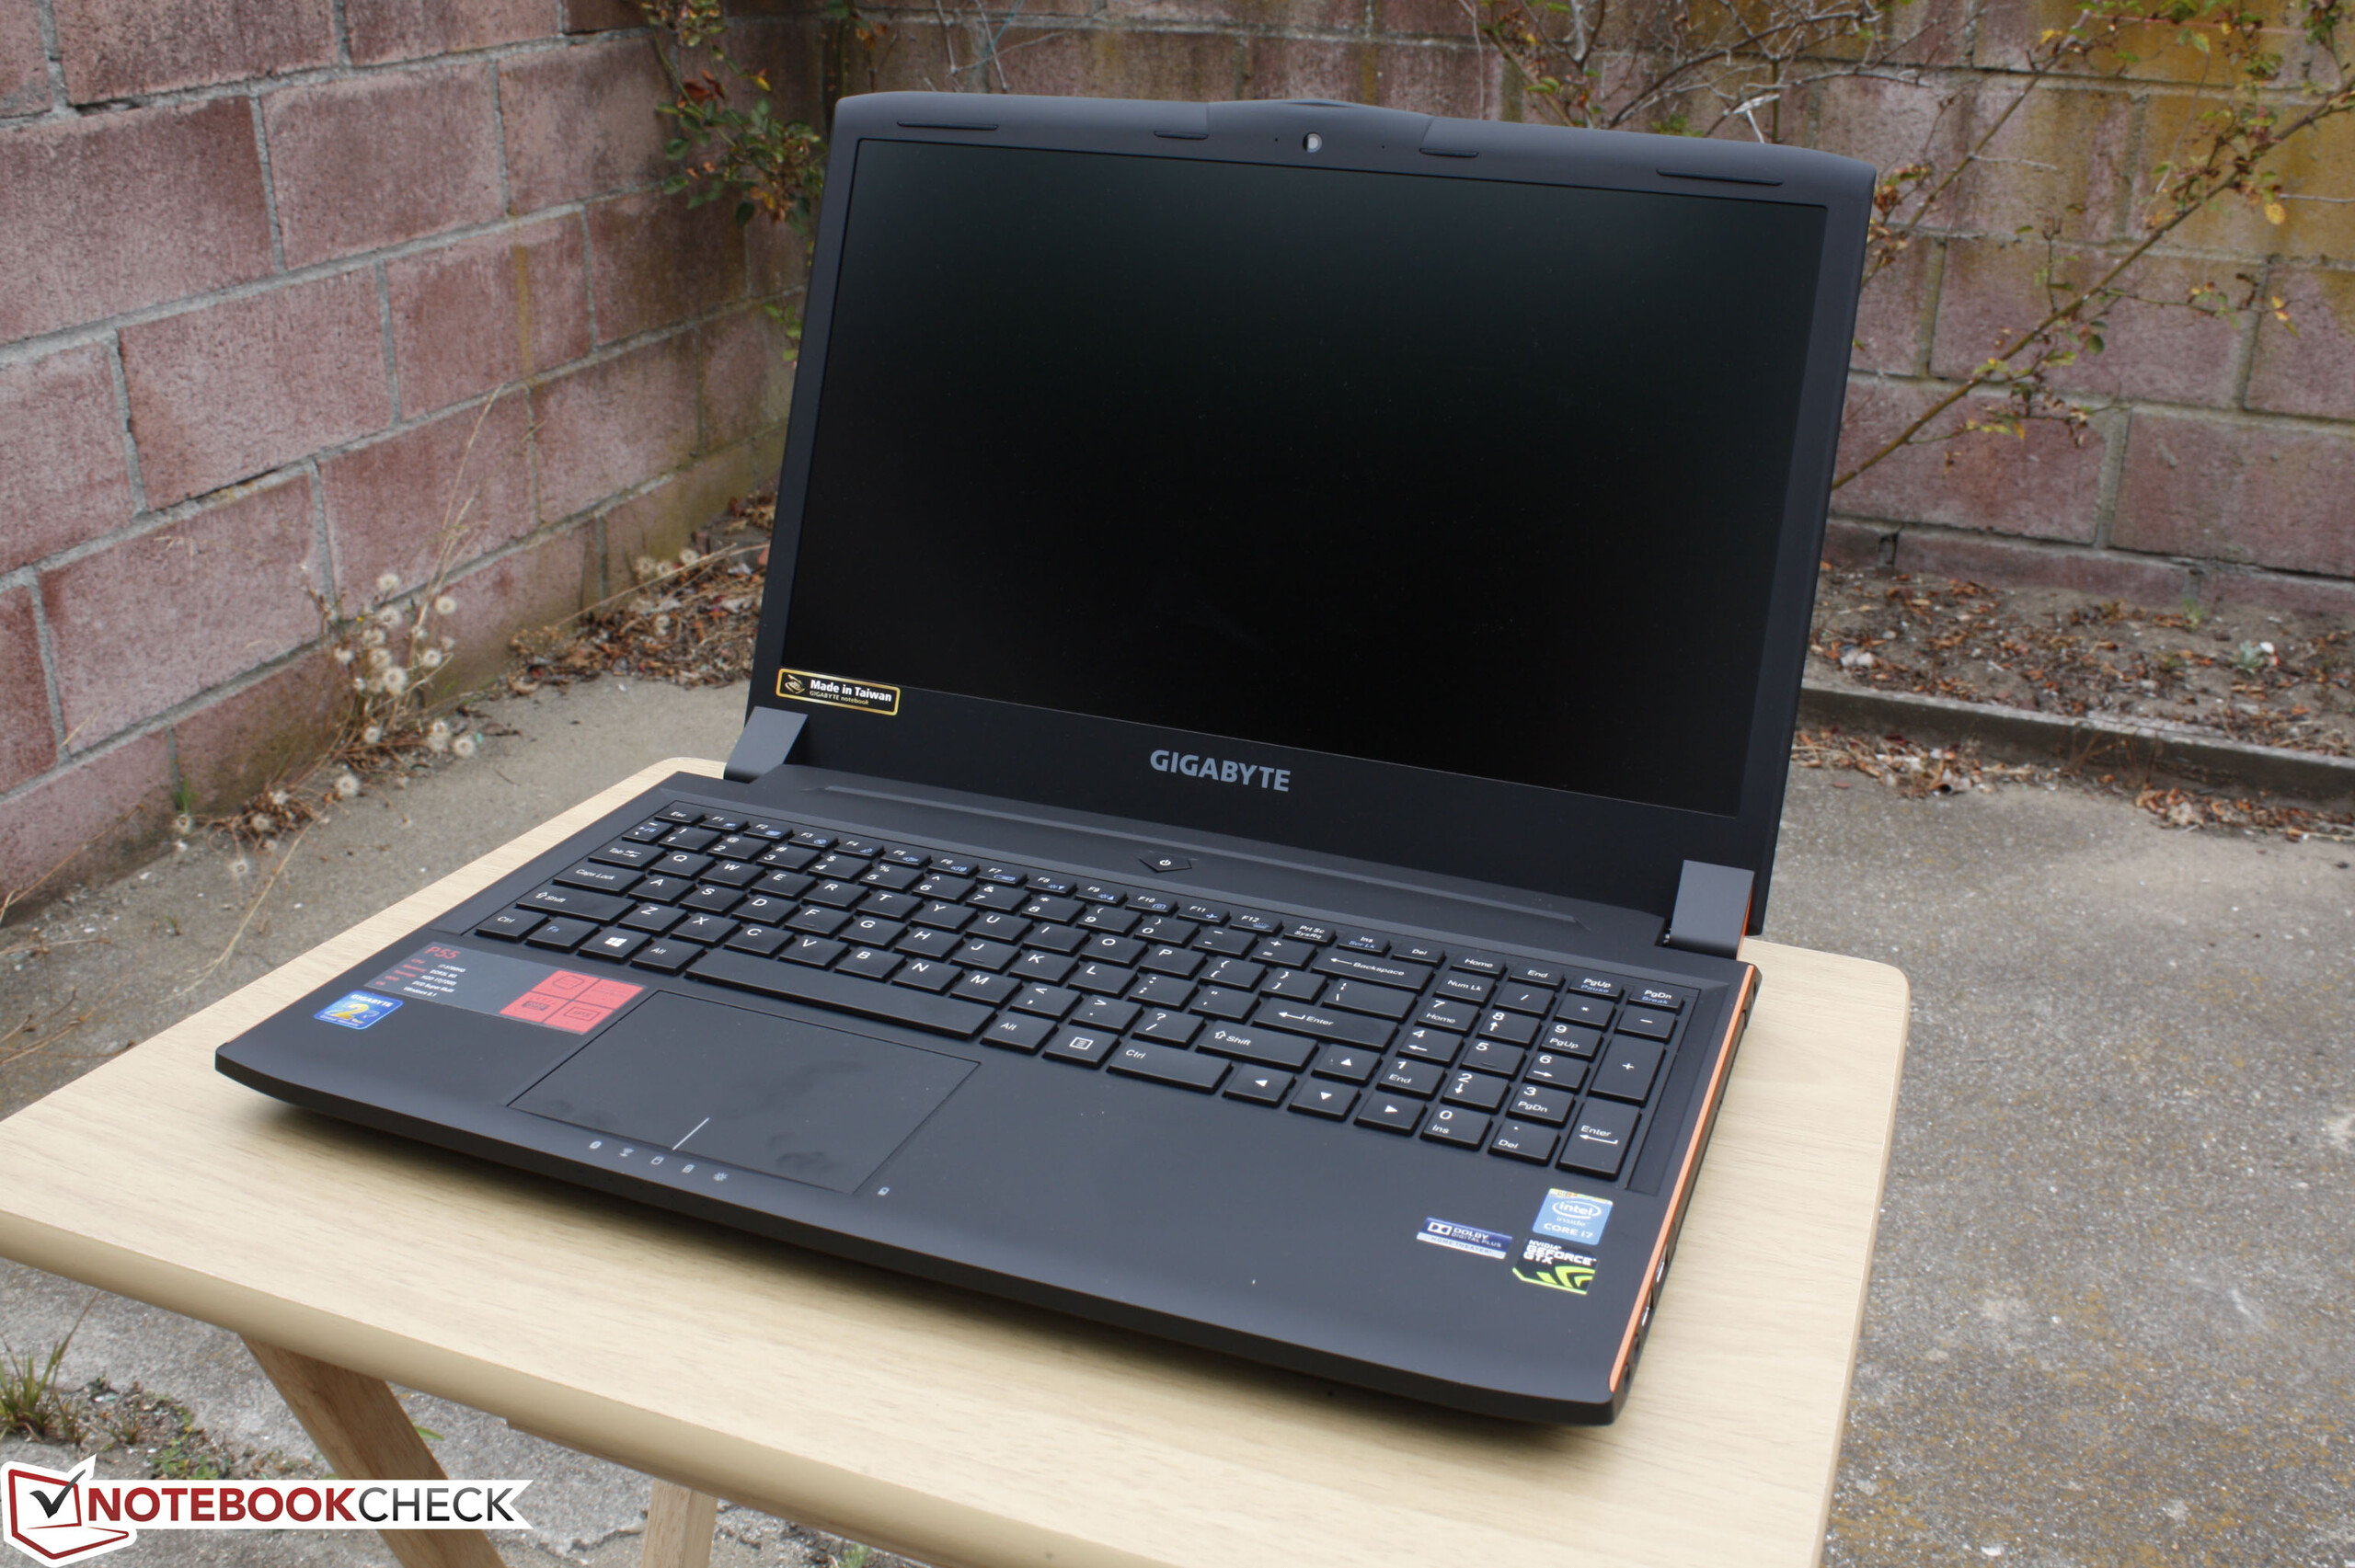
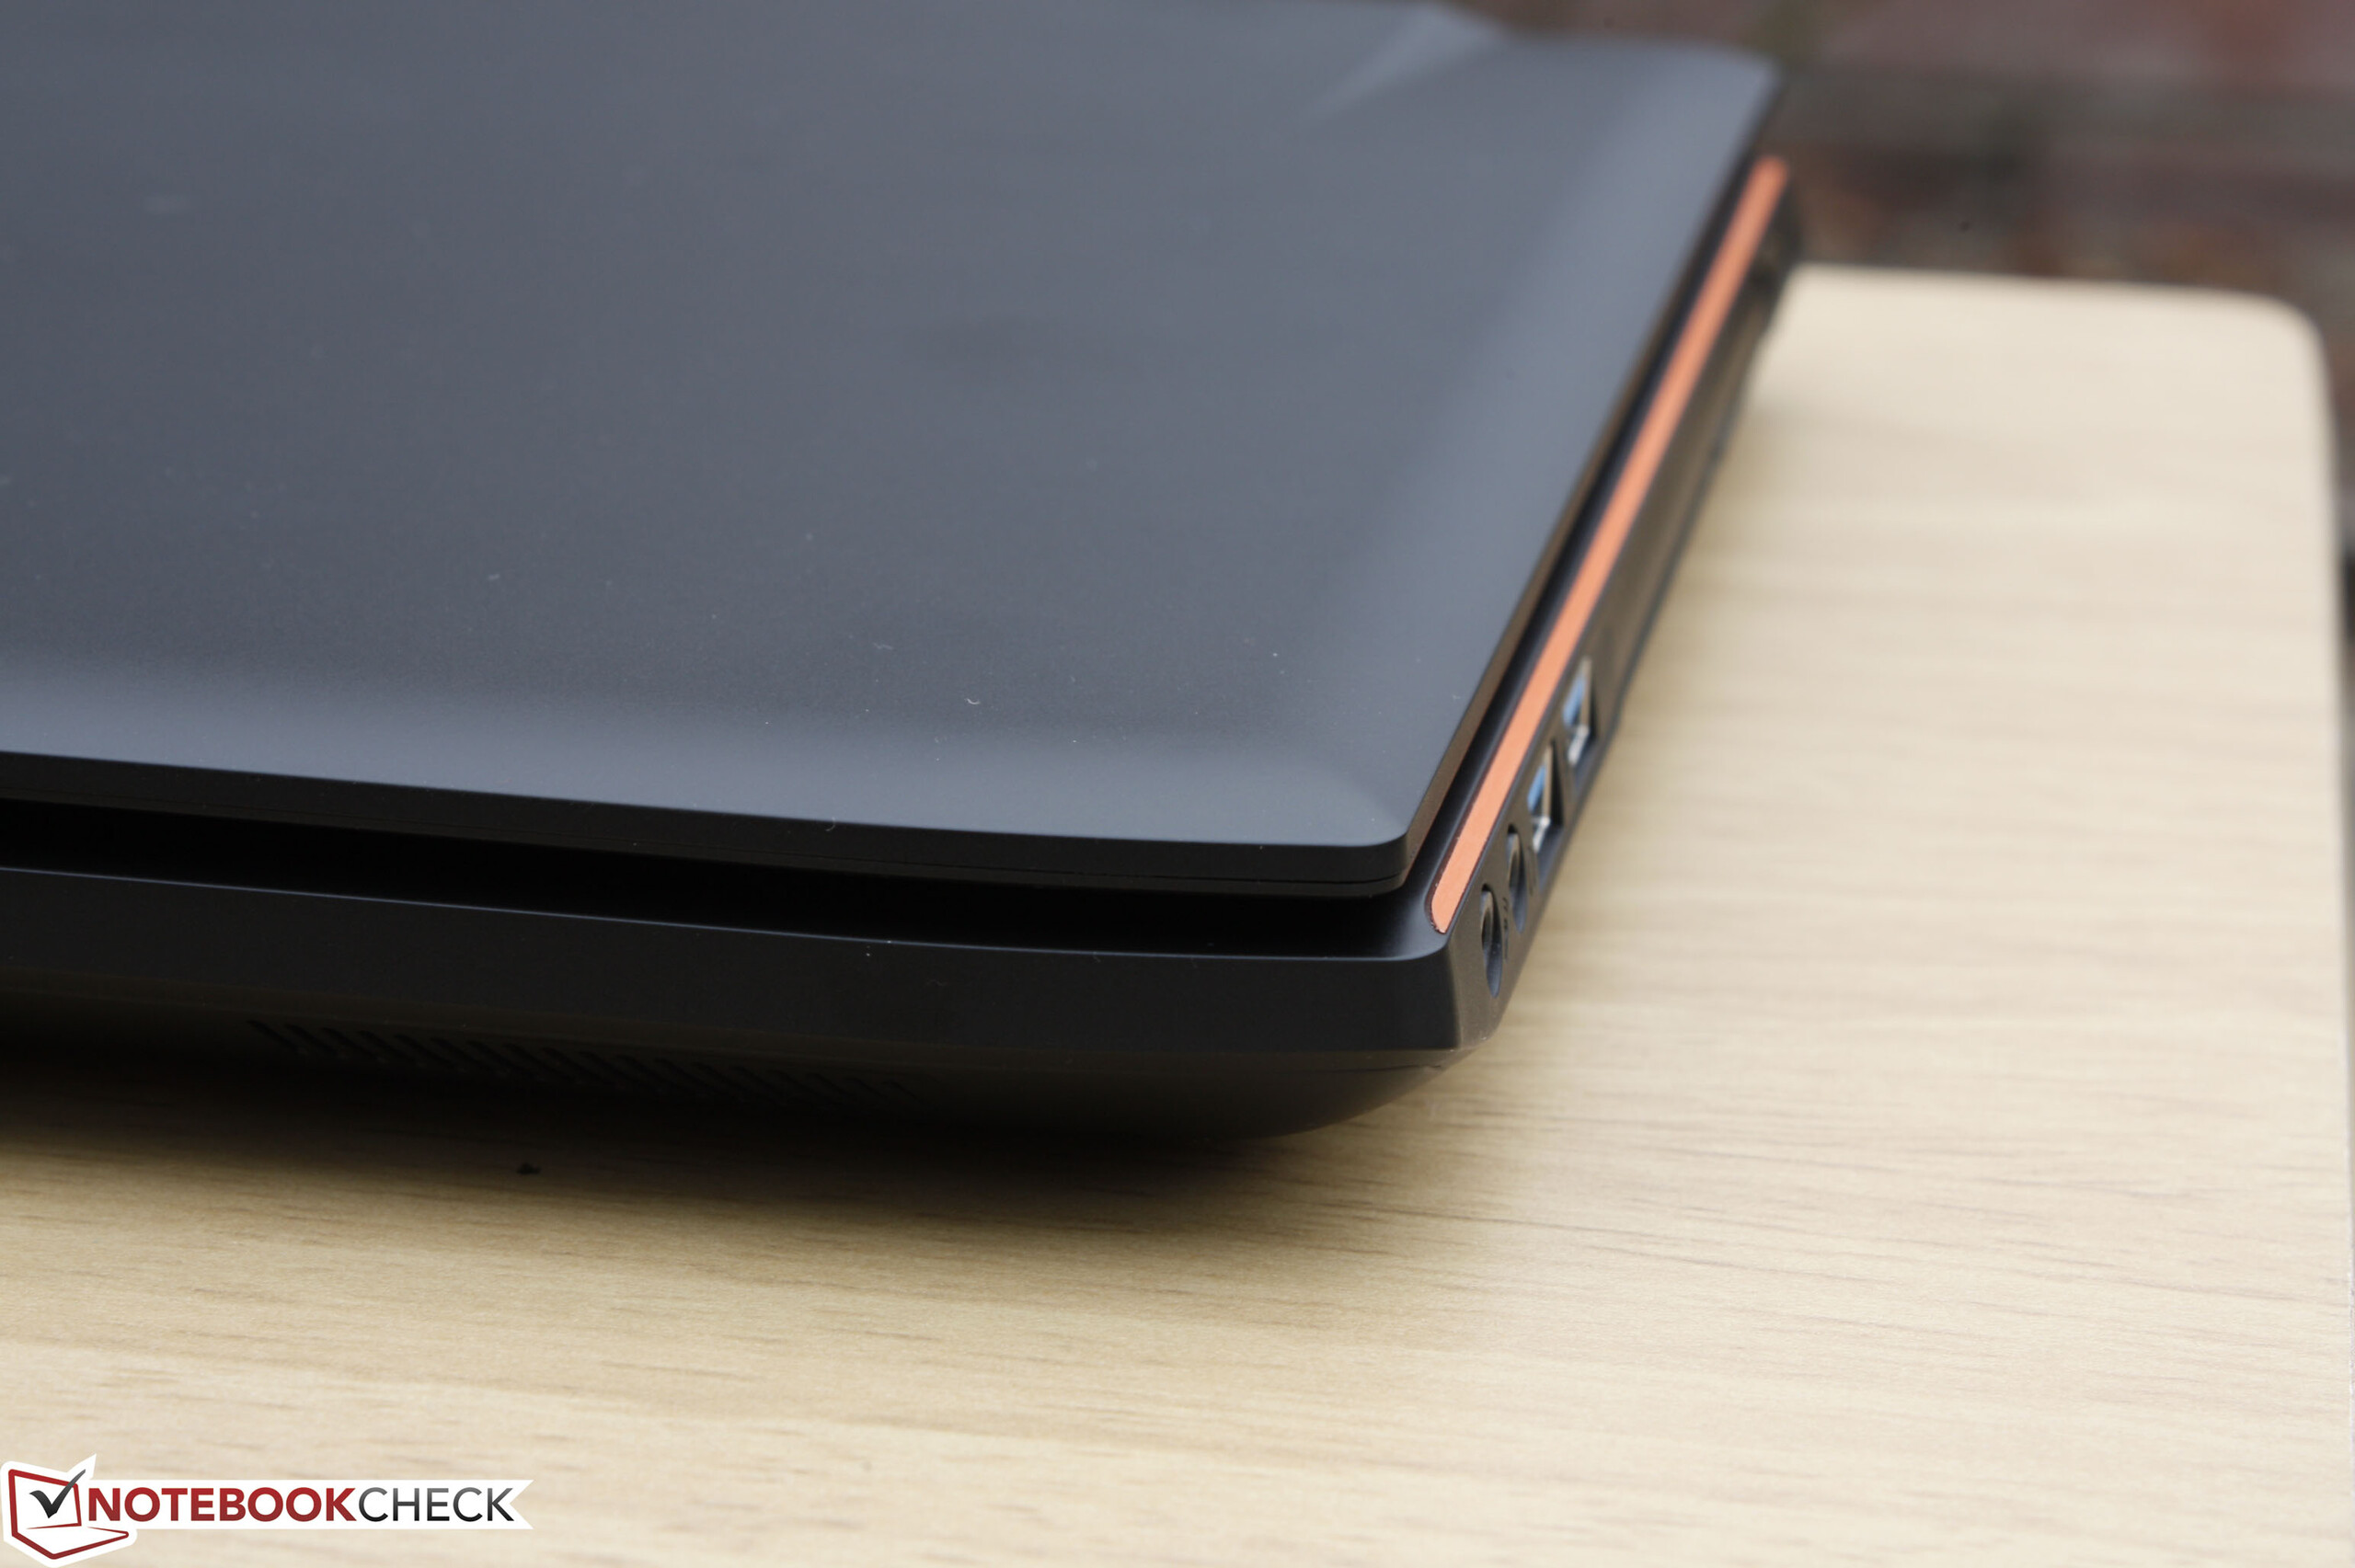
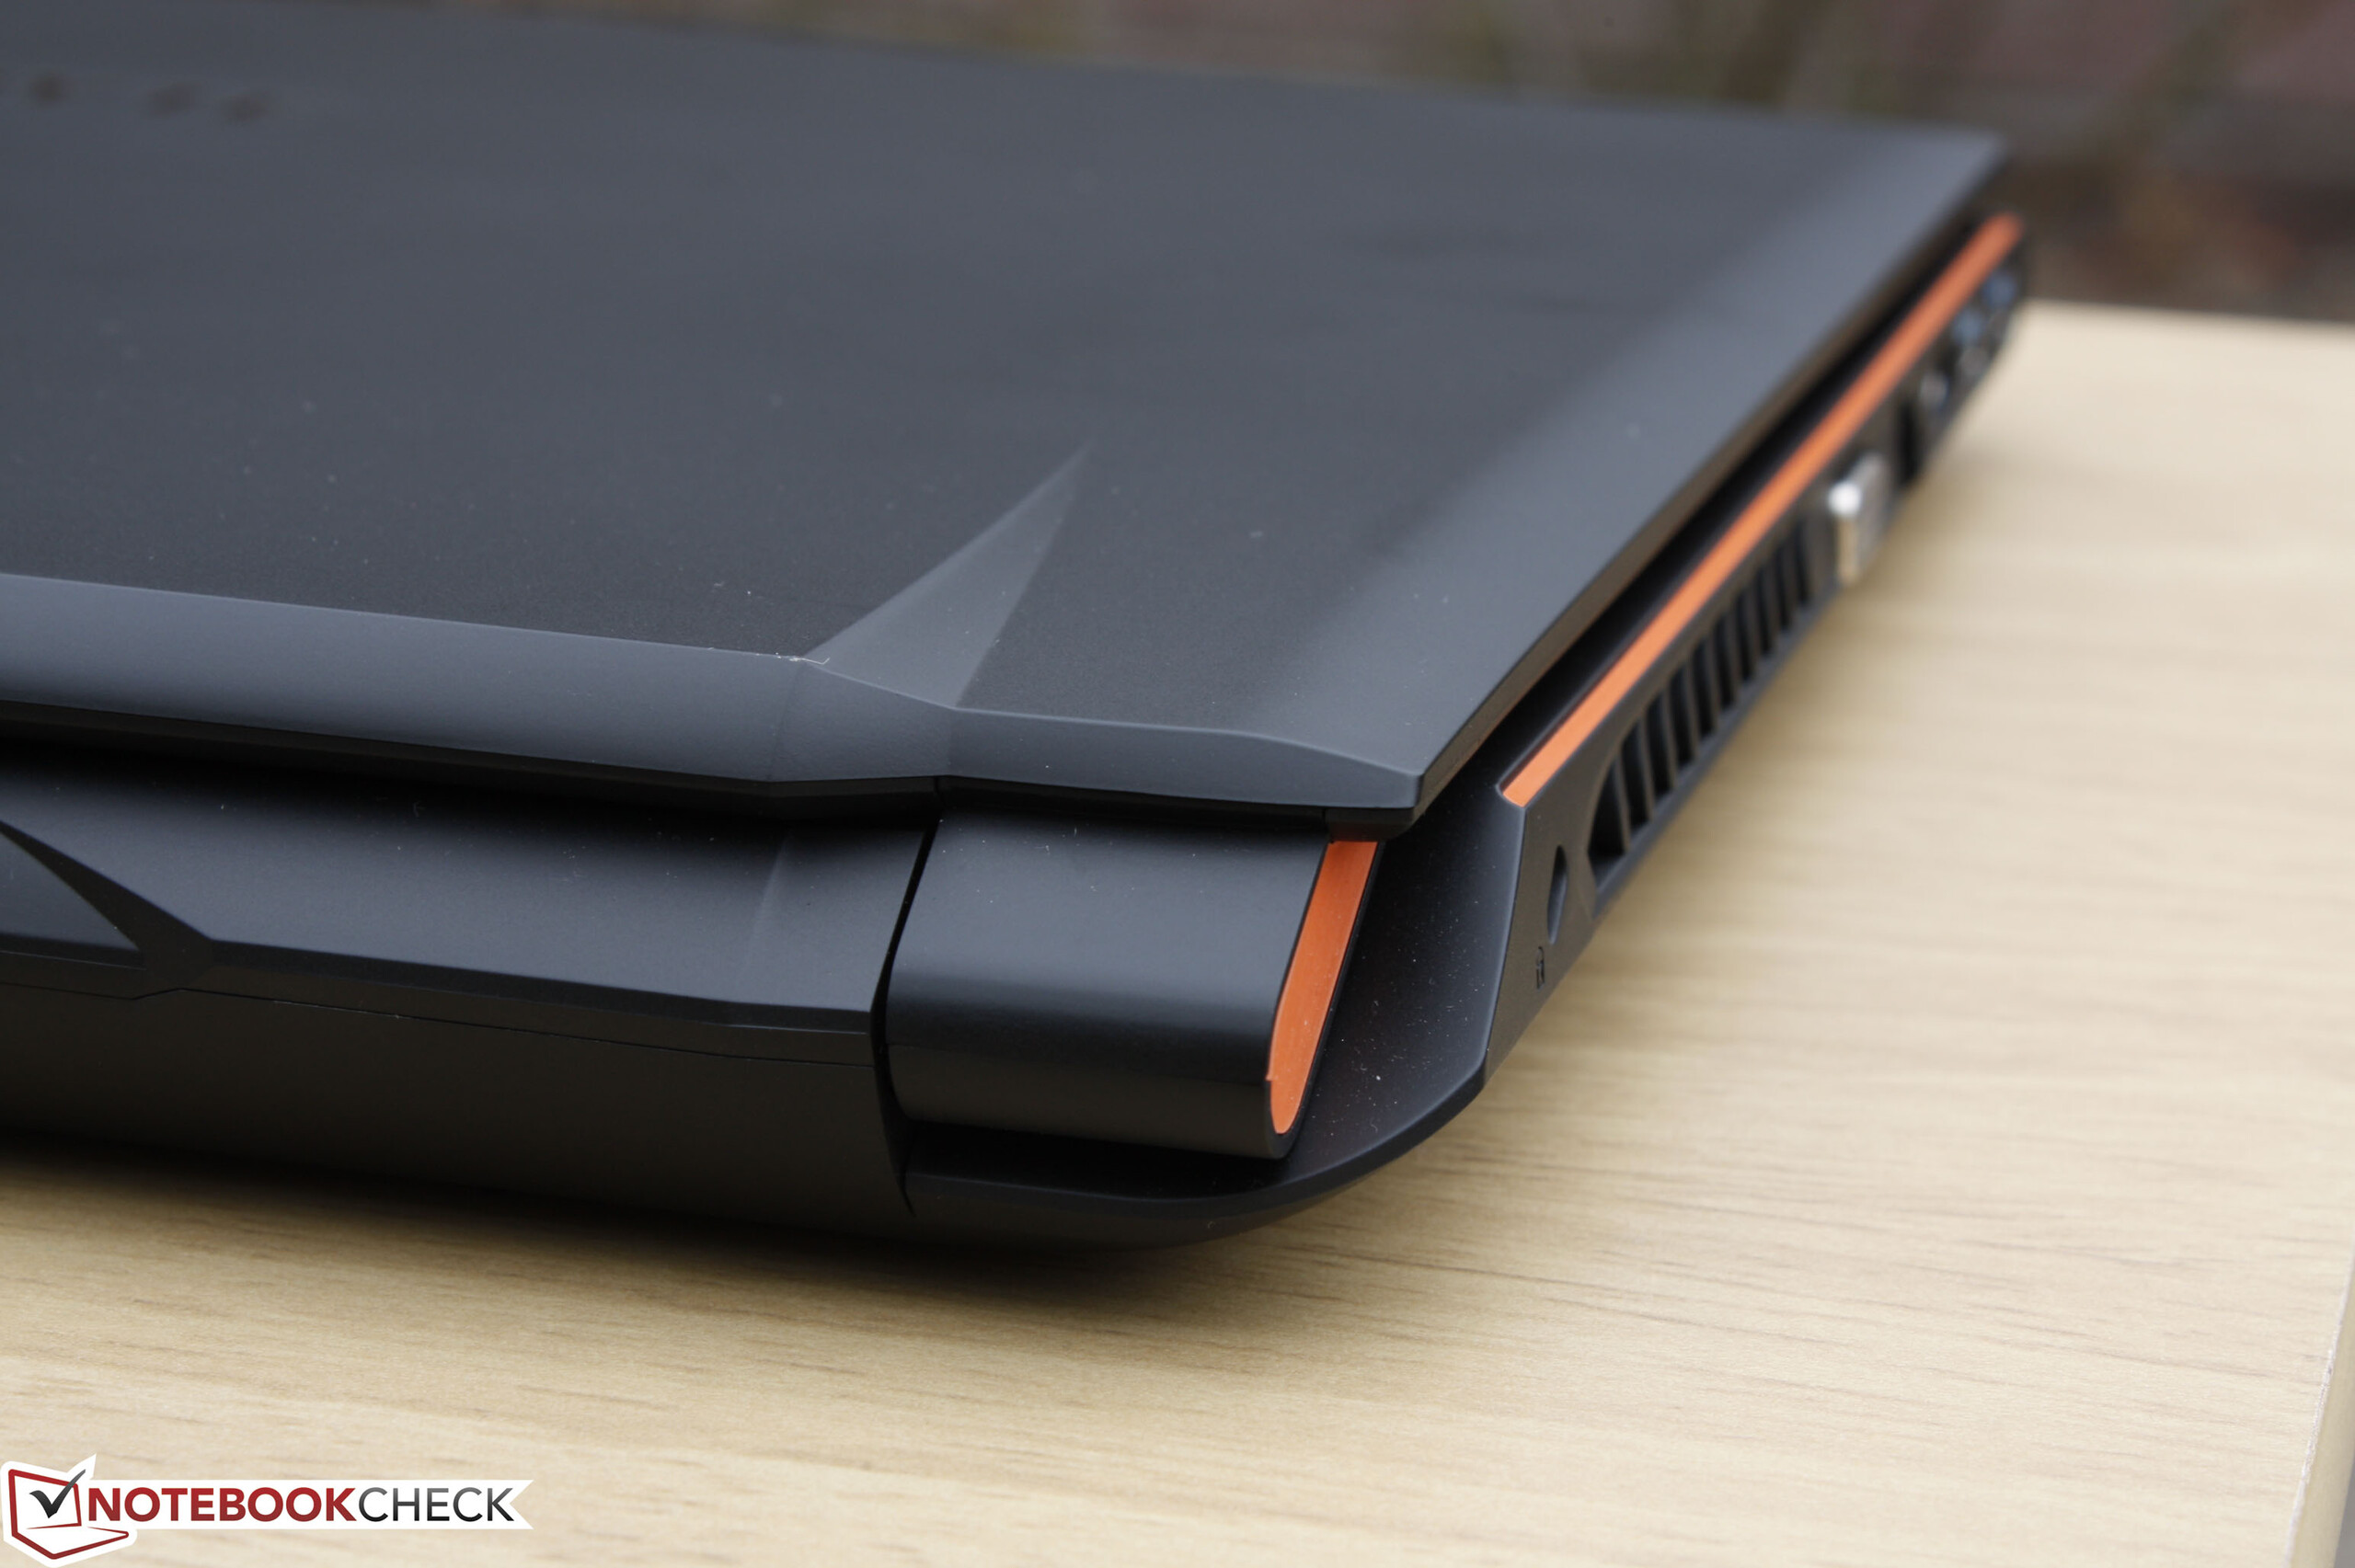
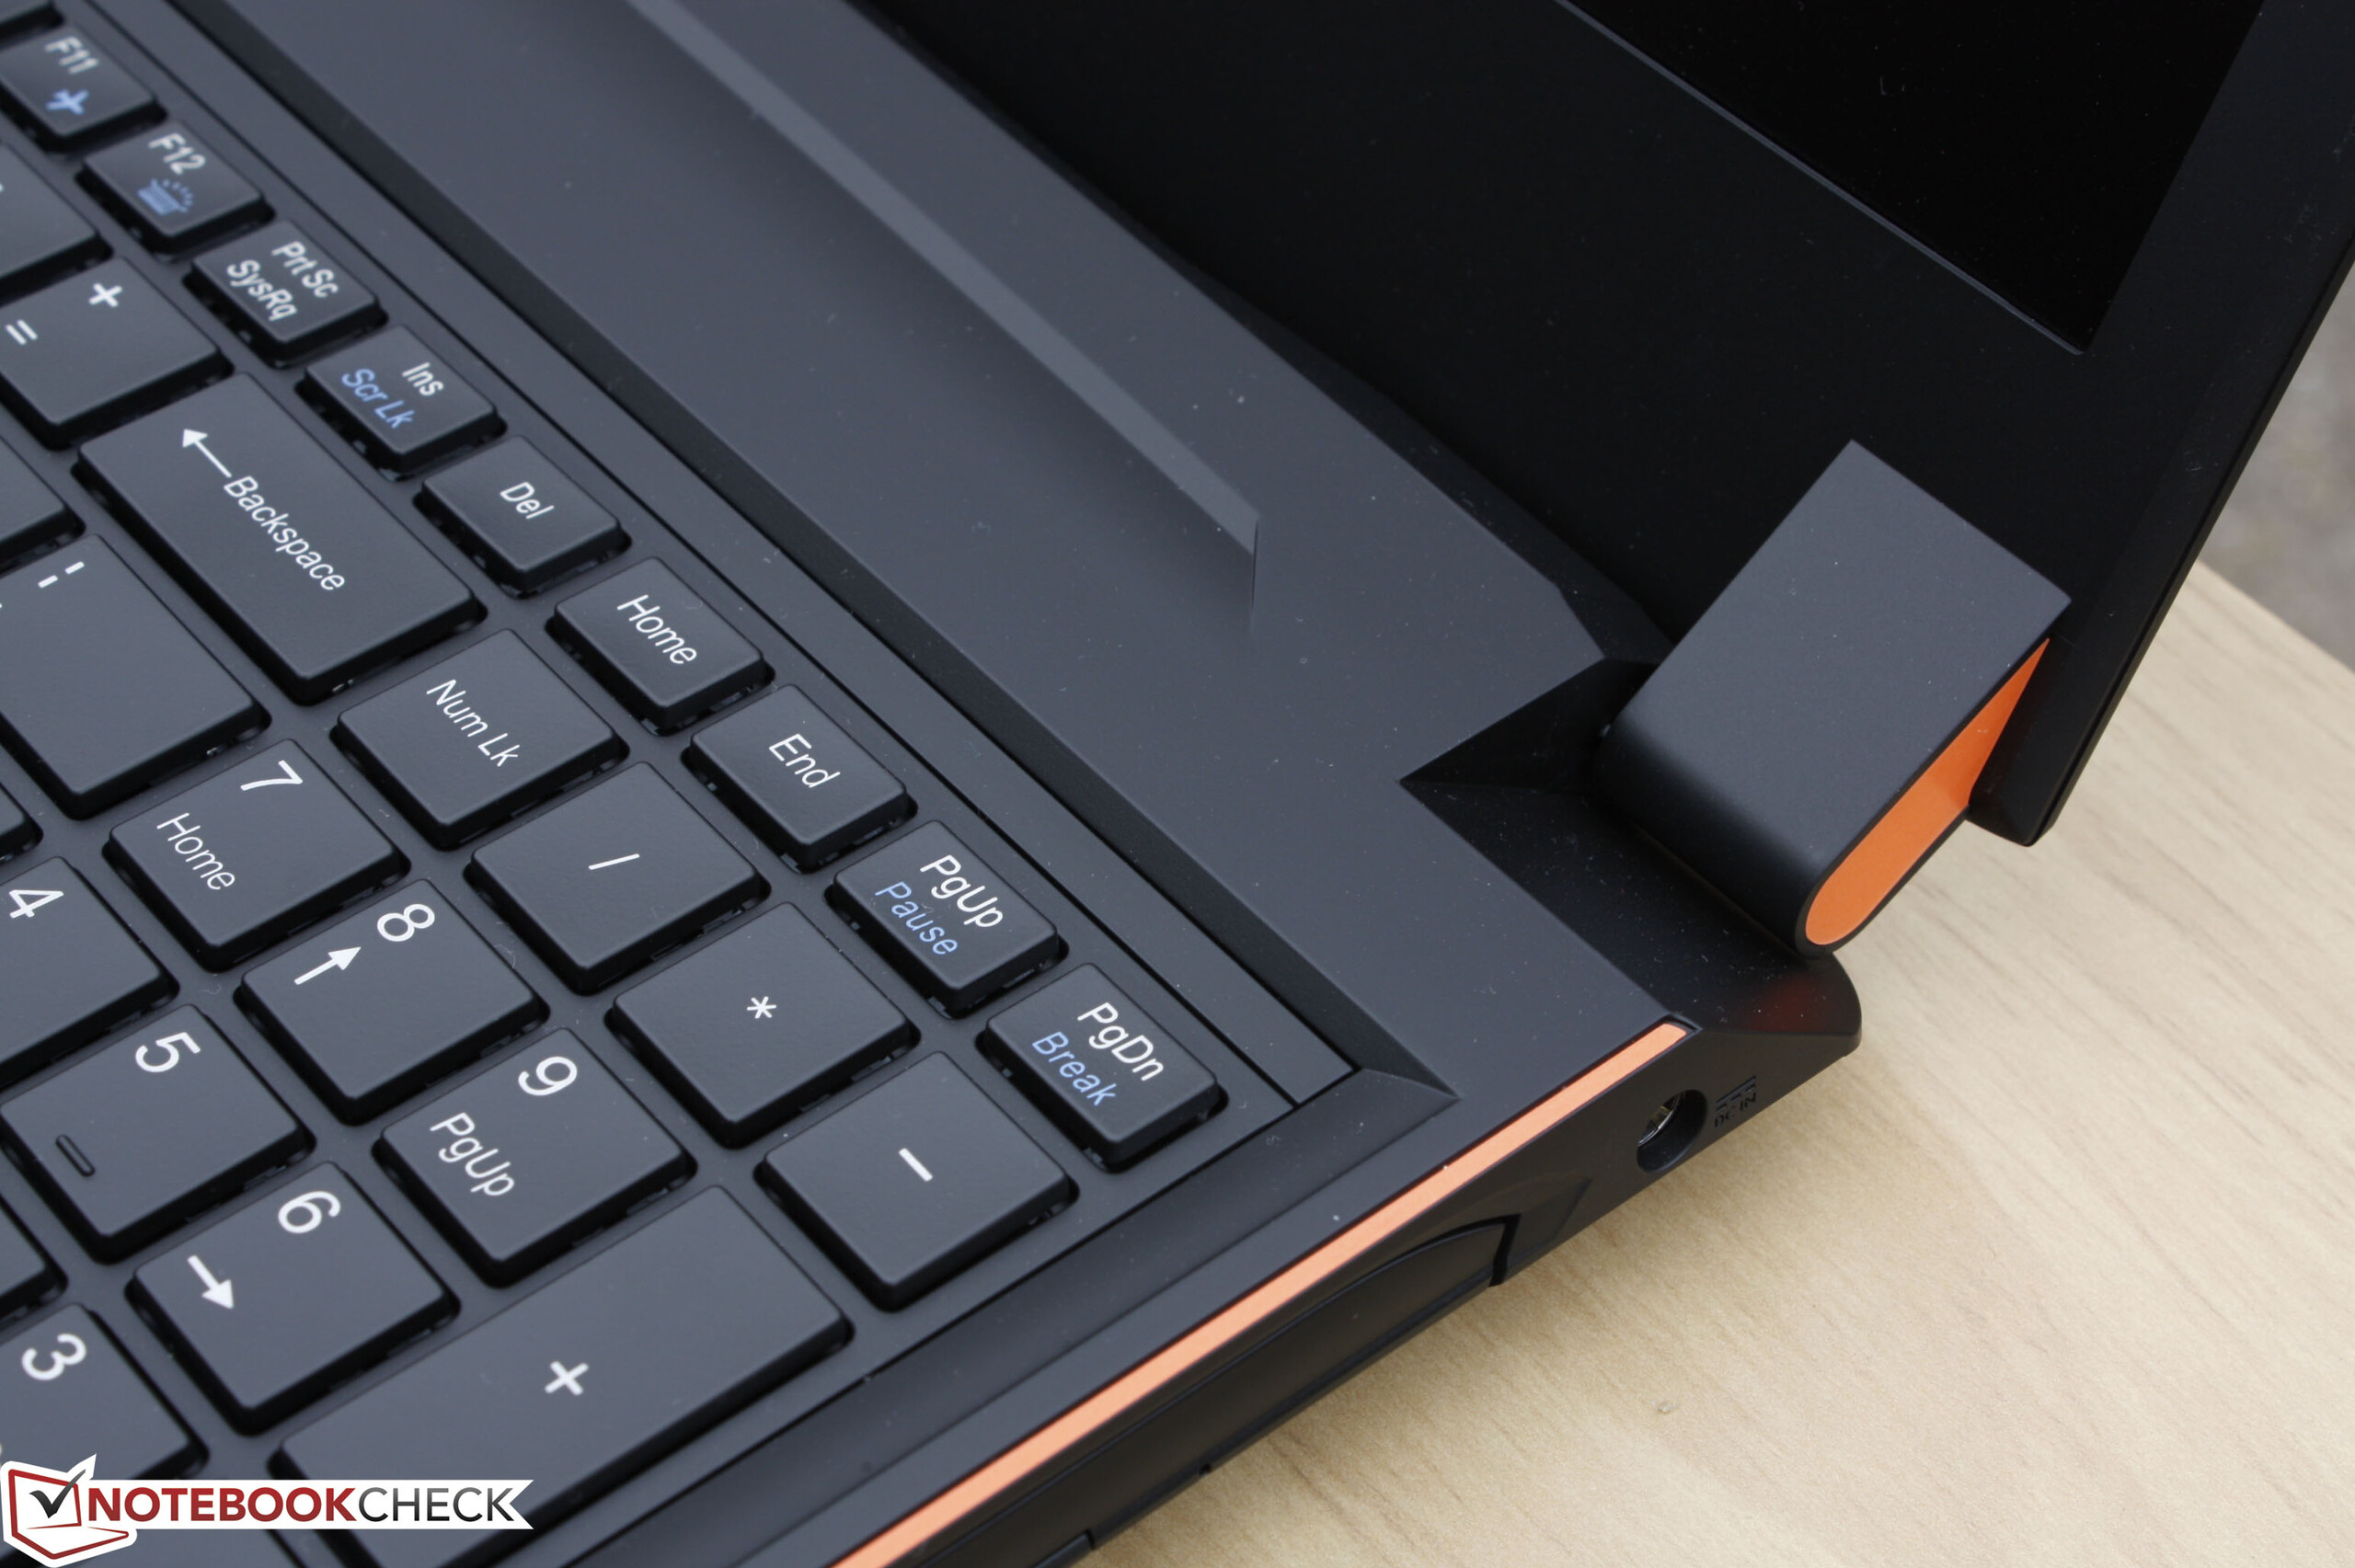
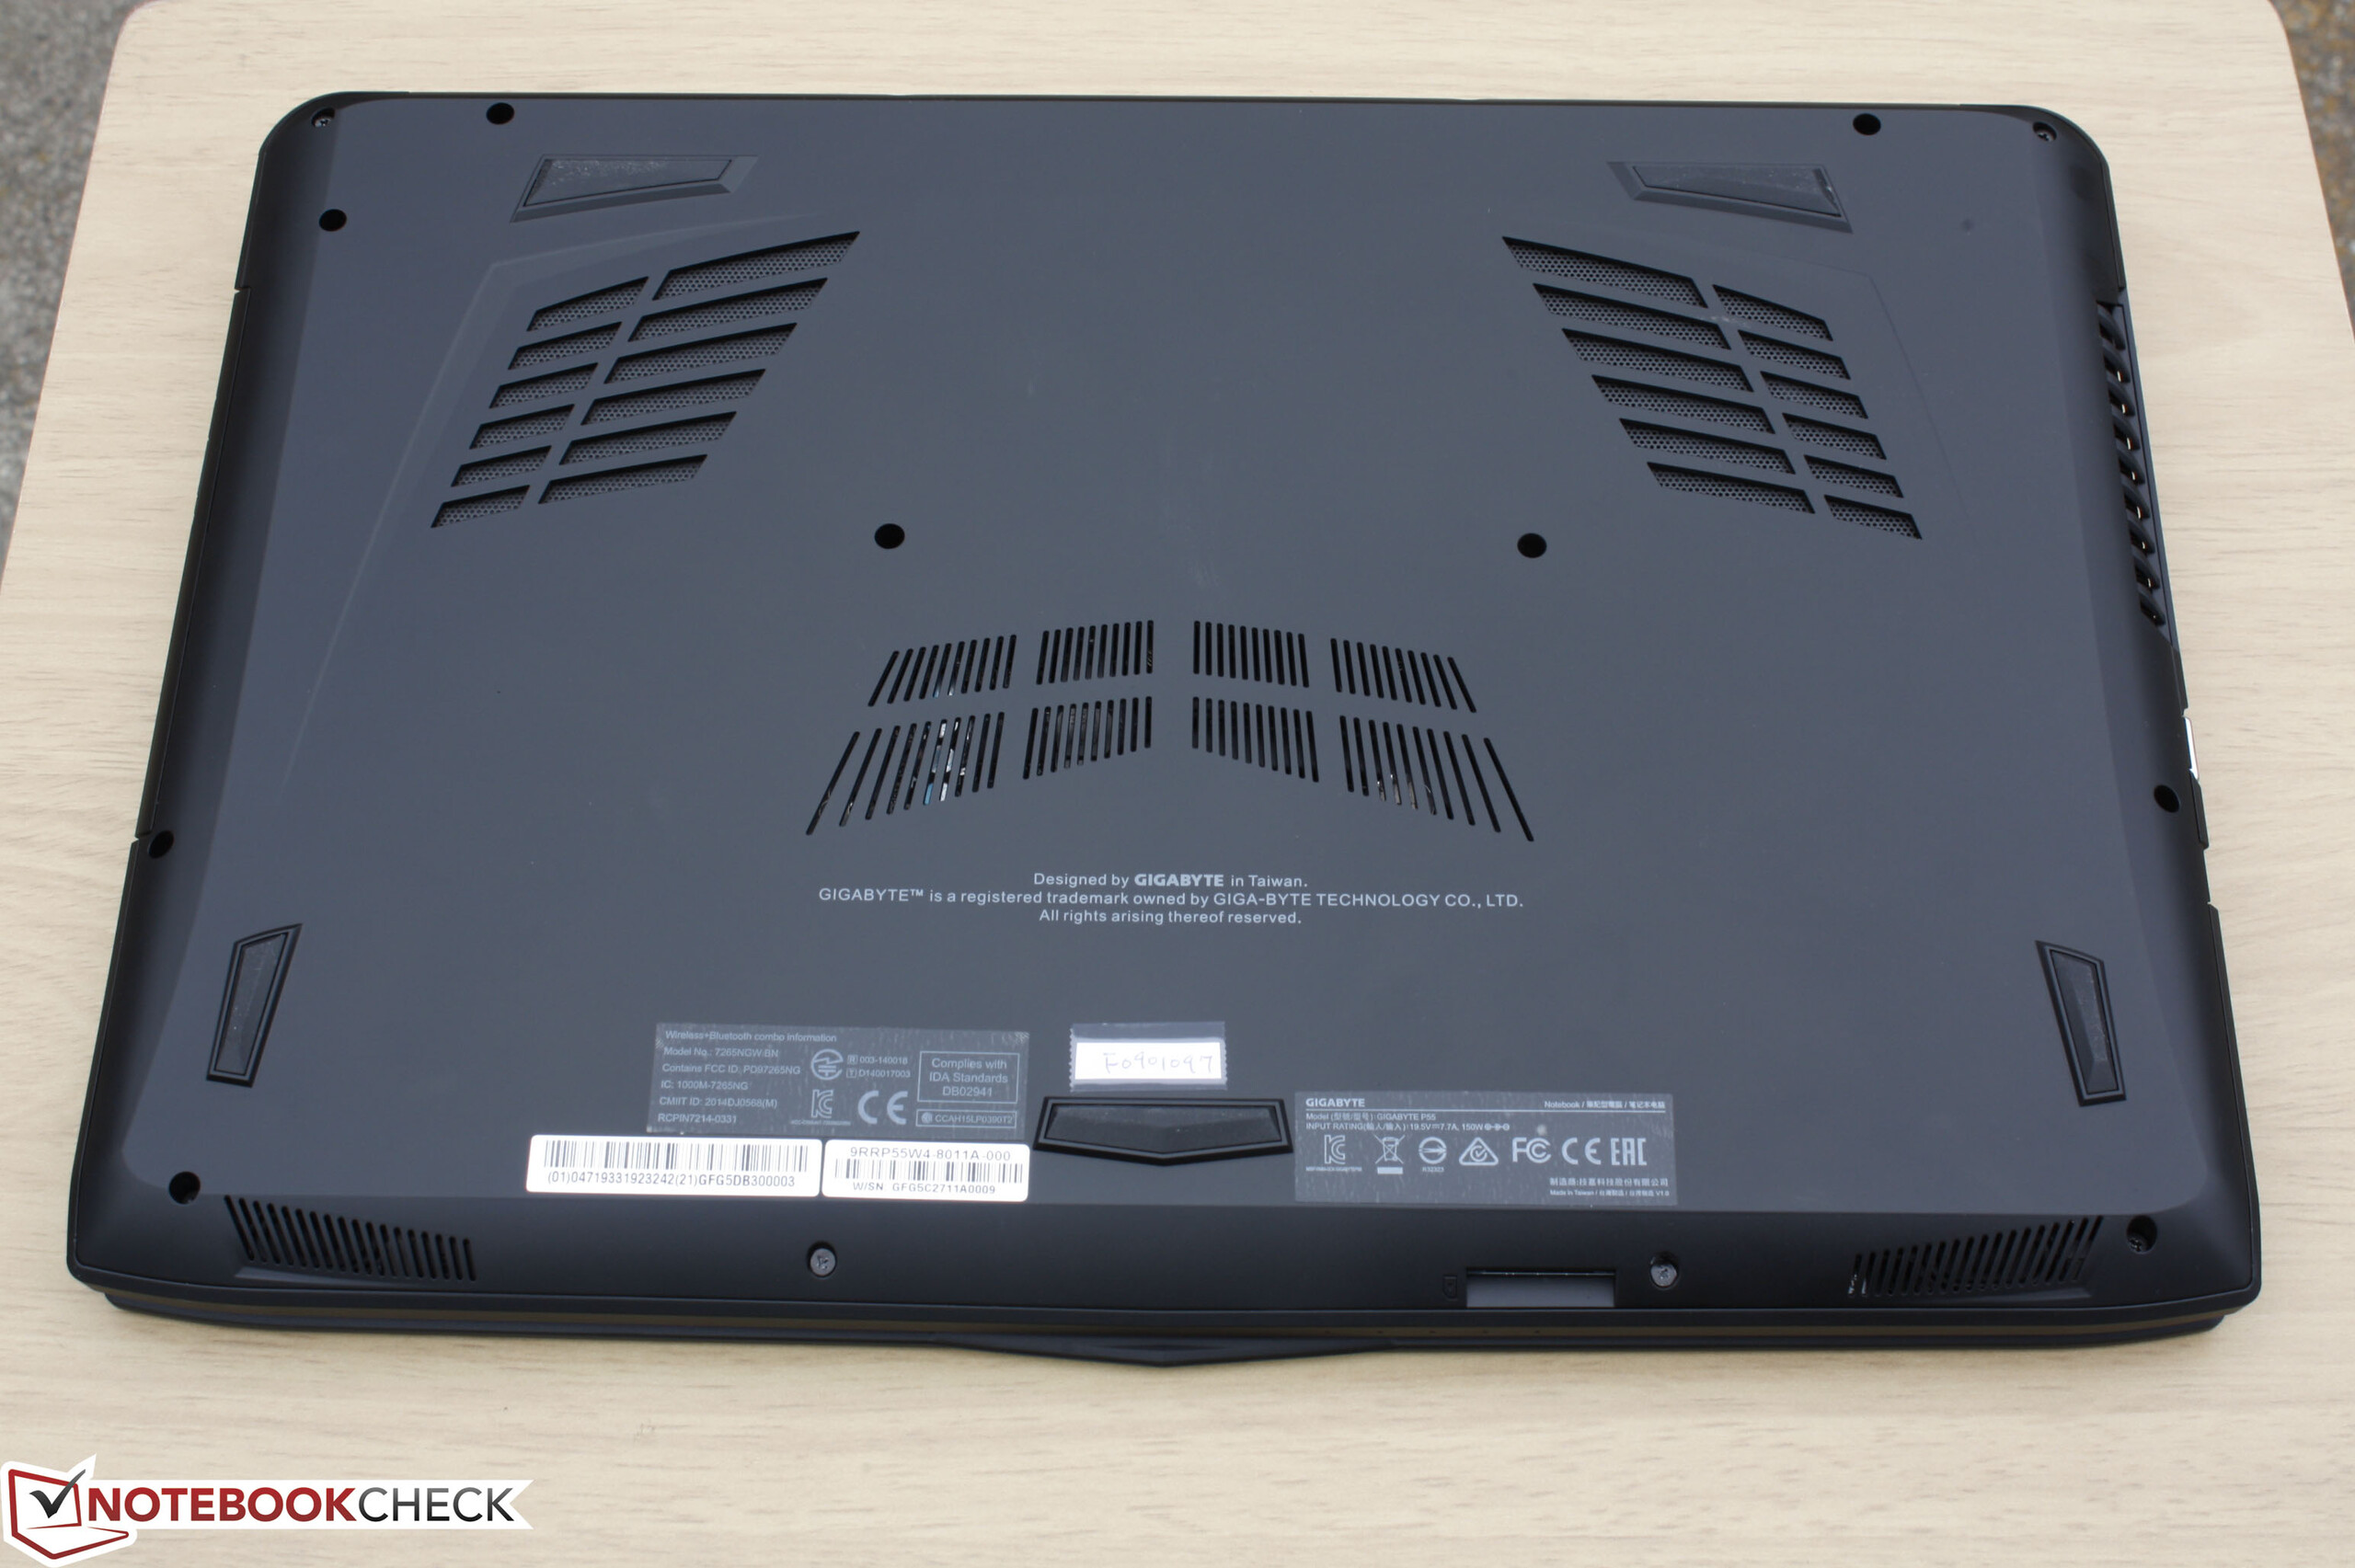
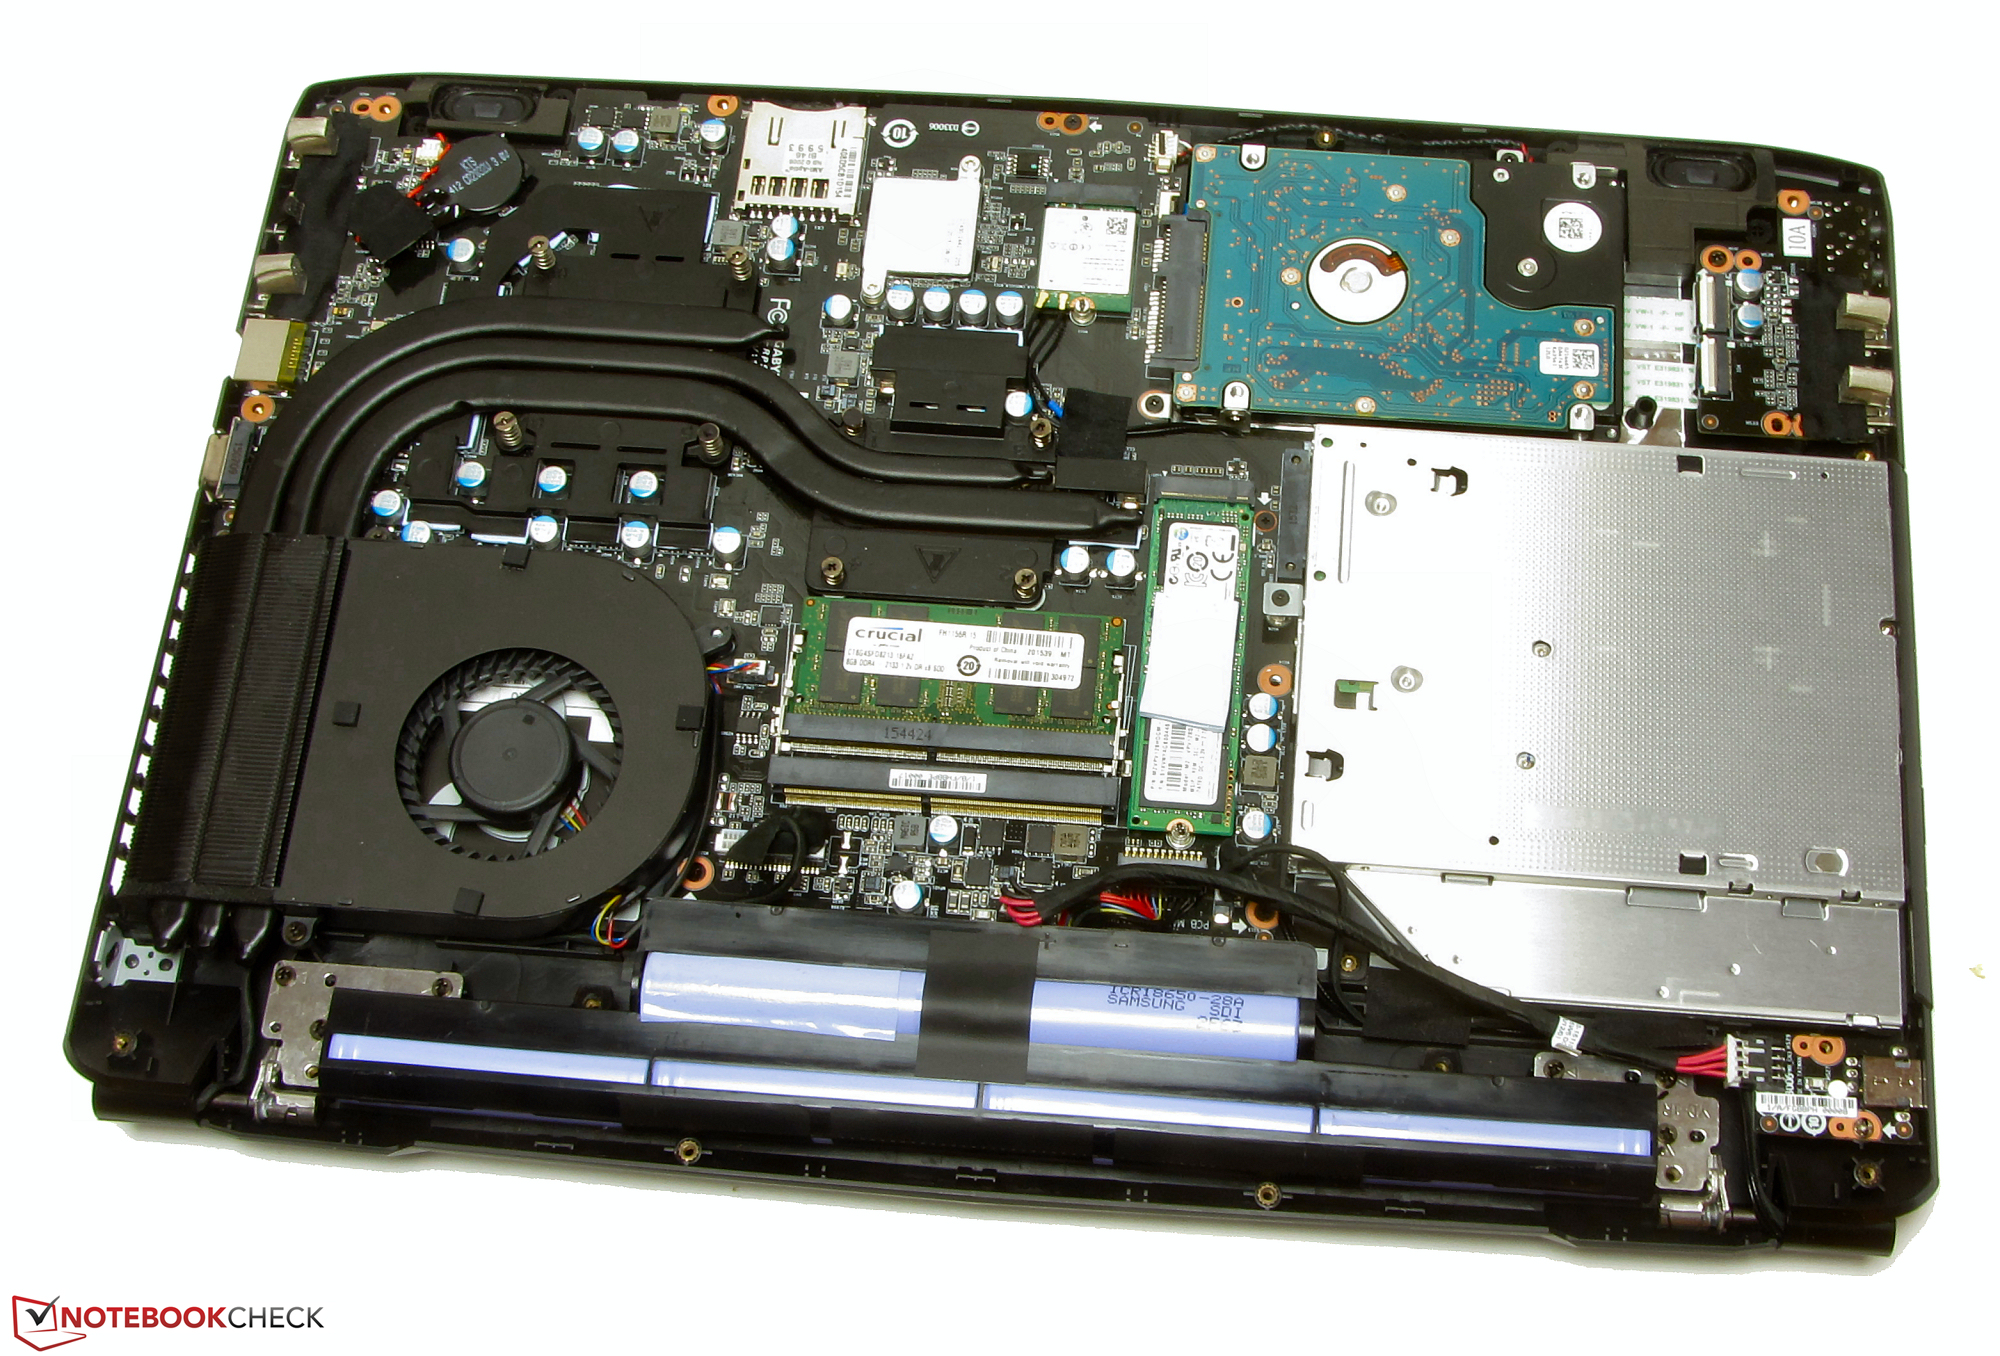
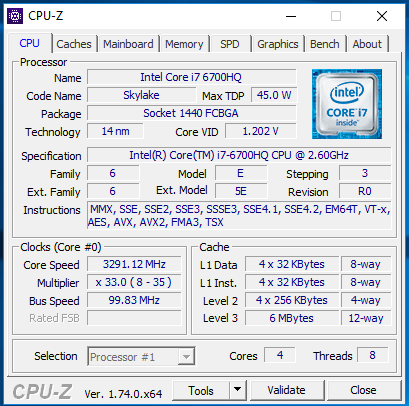
Il Gigabyte P55W v5 è un portatile gaming da 15.6". Il processore Core i7 utilizzato fornisce buona potenza di calcolo per tutti gli scenari applicativi. La GeForce GTX 970M riproduce tutti i giochi attuali in modo fluido. Un velocissimo SSD NVMe garantisce un sistema scattante. Grazie all'esistenza di un hard drive da 2.5, lo spazio di archiviazione abbonda. Entrambi i dispositivi di archiviazione possono essere facilmente sostituiti con modelli superiori. Sebbene il P55W v5 non abbia una cover di manutenzione, la base è facile da rimuovere. La buona tastiera sorprende su un portatile gaming. Lo stesso vale per l'ampia autonomia nei test reali sulla batteria. Il pannello matto Full HD IPS ha buoni angoli di visuale e contrasto decente. Tuttavia, non è molto luminoso.
Gigabyte aggiorna il suo P55W v5. Le modifiche e e le innovazioni (NVMe, DDR4 RAM, USB 3.1, and Skylake CPU) sono ragionevoli.
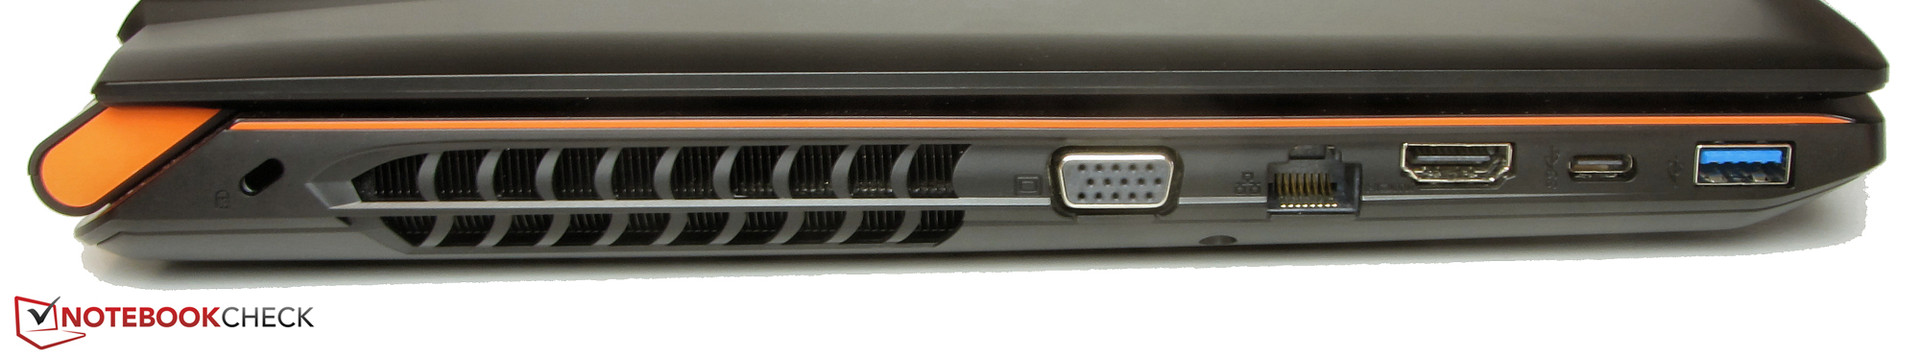
Tuttavia, Gigabyte avrebbe dovuto seguire meglio questo percorso. Ad esempio, una DisplayPort sarebbe stata opportuna e più memoria grafica sarebbe stata apprezzata. Forse Gigabyte terrà conto di questo sul P55W v6.
Nota: si tratta di una recensione breve, con alcune sezioni non tradotte, per la versione integrale in inglese guardate qui.
Gigabyte P55W v5
- 02/29/2016 v5 (old)
Sascha Mölck