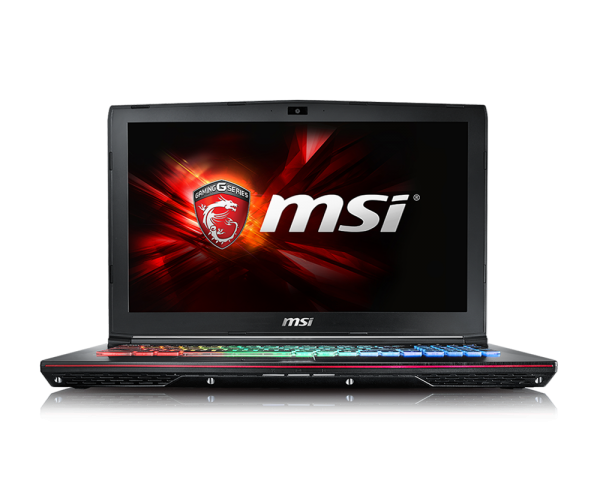
Recensione Breve del portatile MSI GE62 6QD Apache Pro

| |||||||||||||||||||||||||
Distribuzione della luminosità: 88 %
Al centro con la batteria: 300 cd/m²
Contrasto: 938:1 (Nero: 0.32 cd/m²)
ΔE ColorChecker Calman: 3.51 | ∀{0.5-29.43 Ø4.72}
ΔE Greyscale Calman: 2.52 | ∀{0.09-98 Ø4.97}
86% sRGB (Argyll 1.6.3 3D)
56% AdobeRGB 1998 (Argyll 1.6.3 3D)
62.5% AdobeRGB 1998 (Argyll 3D)
85.6% sRGB (Argyll 3D)
64.5% Display P3 (Argyll 3D)
Gamma: 2.38
CCT: 6759 K
| MSI GE62-6QD16H11 LG Philips LP156WF6 | MSI GE62-2QFUi716H11 Samsung SDC4852 | Nexoc G515 II LG Philips LP156WF4-SPL1 (LGD044F) | Lenovo Ideapad Y700 15ISK 80NW LG Philips | Dell Inspiron 15 7559 LG Philips LGD04D9 / 156UD2 / Dell P/N: 53FC4 | Alienware 15 R2 (Skylake) Samsung 4NDDJ_156HL (SDC4C48) | |
|---|---|---|---|---|---|---|
| Display | -14% | -36% | -36% | 2% | -34% | |
| Display P3 Coverage (%) | 64.5 | 52.2 -19% | 38.59 -40% | 38.55 -40% | 63.4 -2% | 40.3 -38% |
| sRGB Coverage (%) | 85.6 | 78.7 -8% | 57.8 -32% | 57.6 -33% | 90 5% | 60.2 -30% |
| AdobeRGB 1998 Coverage (%) | 62.5 | 54 -14% | 39.88 -36% | 39.86 -36% | 64.6 3% | 41.67 -33% |
| Response Times | -11% | 1% | -31% | |||
| Response Time Grey 50% / Grey 80% * (ms) | 31 ? | 40.8 ? -32% | 32 ? -3% | 48.8 ? -57% | ||
| Response Time Black / White * (ms) | 27 ? | 24 ? 11% | 26 ? 4% | 28 ? -4% | ||
| PWM Frequency (Hz) | 58.1 | 200 ? | ||||
| Screen | -22% | -35% | -45% | -35% | -39% | |
| Brightness middle (cd/m²) | 300 | 268 -11% | 232 -23% | 258.6 -14% | 276 -8% | 180 -40% |
| Brightness (cd/m²) | 291 | 227 -22% | 216 -26% | 242 -17% | 273 -6% | 179 -38% |
| Brightness Distribution (%) | 88 | 74 -16% | 82 -7% | 88 0% | 85 -3% | 83 -6% |
| Black Level * (cd/m²) | 0.32 | 0.39 -22% | 0.3 6% | 0.277 13% | 0.78 -144% | 0.19 41% |
| Contrast (:1) | 938 | 687 -27% | 773 -18% | 934 0% | 354 -62% | 947 1% |
| Colorchecker dE 2000 * | 3.51 | 4.12 -17% | 6.26 -78% | 8.1 -131% | 4.05 -15% | 6.74 -92% |
| Colorchecker dE 2000 max. * | 8.72 | |||||
| Greyscale dE 2000 * | 2.52 | 3.65 -45% | 4.98 -98% | 7.23 -187% | 4.68 -86% | 6.44 -156% |
| Gamma | 2.38 92% | 2.5 88% | 2.25 98% | 1.99 111% | 2.55 86% | 2.29 96% |
| CCT | 6759 96% | 6423 101% | 6968 93% | 6567 99% | 6871 95% | 6465 101% |
| Color Space (Percent of AdobeRGB 1998) (%) | 56 | 49 -12% | 37 -34% | 36.5 -35% | 58 4% | 38 -32% |
| Color Space (Percent of sRGB) (%) | 86 | 58 -33% | 57.2 -33% | 90 5% | 60 -30% | |
| Media totale (Programma / Settaggio) | -18% /
-19% | -36% /
-35% | -31% /
-38% | -11% /
-22% | -35% /
-37% |
* ... Meglio usare valori piccoli
Tempi di risposta del Display
| ↔ Tempi di risposta dal Nero al Bianco | ||
|---|---|---|
| 27 ms ... aumenta ↗ e diminuisce ↘ combinato | ↗ 8 ms Incremento | 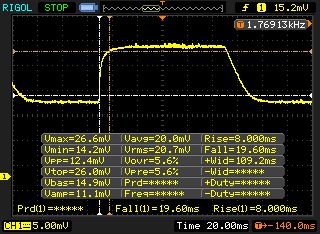 |
| ↘ 19 ms Calo | ||
| Lo schermo mostra tempi di risposta relativamente lenti nei nostri tests e potrebbe essere troppo lento per i gamers. In confronto, tutti i dispositivi di test variano da 0.1 (minimo) a 240 (massimo) ms. » 67 % di tutti i dispositivi è migliore. Questo significa che i tempi di risposta rilevati sono peggiori rispetto alla media di tutti i dispositivi testati (19.8 ms). | ||
| ↔ Tempo di risposta dal 50% Grigio all'80% Grigio | ||
| 31 ms ... aumenta ↗ e diminuisce ↘ combinato | ↗ 11 ms Incremento | 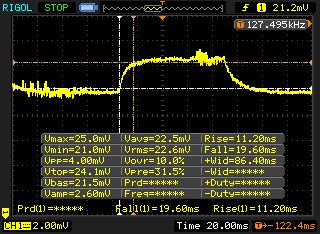 |
| ↘ 20 ms Calo | ||
| Lo schermo mostra tempi di risposta lenti nei nostri tests e sarà insoddisfacente per i gamers. In confronto, tutti i dispositivi di test variano da 0.165 (minimo) a 636 (massimo) ms. » 42 % di tutti i dispositivi è migliore. Questo significa che i tempi di risposta rilevati sono simili alla media di tutti i dispositivi testati (31 ms). | ||
Sfarfallio dello schermo / PWM (Pulse-Width Modulation)
| flickering dello schermo / PWM non rilevato | 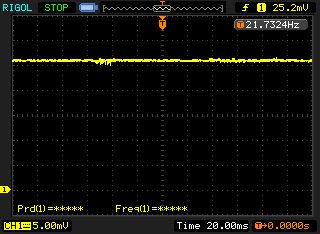 | ||
In confronto: 52 % di tutti i dispositivi testati non utilizza PWM per ridurre la luminosita' del display. Se è rilevato PWM, una media di 7747 (minimo: 5 - massimo: 343500) Hz è stata rilevata. | |||
| Cinebench R15 | |
| CPU Multi 64Bit (ordina per valore) | |
| MSI GE62-6QD16H11 | |
| Nexoc G515 II | |
| Dell Inspiron 15 7559 | |
| Lenovo Ideapad Y700 15ISK 80NW | |
| MSI GE62-2QEUi716H21BW | |
| MSI GE62-2QFUi716H11 | |
| Alienware 15 R2 (Skylake) | |
| CPU Single 64Bit (ordina per valore) | |
| MSI GE62-6QD16H11 | |
| Nexoc G515 II | |
| Dell Inspiron 15 7559 | |
| Lenovo Ideapad Y700 15ISK 80NW | |
| MSI GE62-2QEUi716H21BW | |
| MSI GE62-2QFUi716H11 | |
| Alienware 15 R2 (Skylake) | |
| Cinebench R11.5 | |
| CPU Multi 64Bit (ordina per valore) | |
| MSI GE62-6QD16H11 | |
| Nexoc G515 II | |
| Dell Inspiron 15 7559 | |
| Lenovo Ideapad Y700 15ISK 80NW | |
| MSI GE62-2QEUi716H21BW | |
| MSI GE62-2QFUi716H11 | |
| Alienware 15 R2 (Skylake) | |
| CPU Single 64Bit (ordina per valore) | |
| MSI GE62-6QD16H11 | |
| Nexoc G515 II | |
| Dell Inspiron 15 7559 | |
| Lenovo Ideapad Y700 15ISK 80NW | |
| MSI GE62-2QEUi716H21BW | |
| MSI GE62-2QFUi716H11 | |
| Alienware 15 R2 (Skylake) | |
| Cinebench R10 | |
| Rendering Multiple CPUs 32Bit (ordina per valore) | |
| MSI GE62-6QD16H11 | |
| Nexoc G515 II | |
| Dell Inspiron 15 7559 | |
| Lenovo Ideapad Y700 15ISK 80NW | |
| MSI GE62-2QEUi716H21BW | |
| MSI GE62-2QFUi716H11 | |
| Rendering Single 32Bit (ordina per valore) | |
| MSI GE62-6QD16H11 | |
| Nexoc G515 II | |
| Dell Inspiron 15 7559 | |
| Lenovo Ideapad Y700 15ISK 80NW | |
| MSI GE62-2QEUi716H21BW | |
| MSI GE62-2QFUi716H11 | |
| PCMark 7 Score | 5839 punti | |
| PCMark 8 Home Score Accelerated v2 | 3703 punti | |
| PCMark 8 Creative Score Accelerated v2 | 4610 punti | |
| PCMark 8 Work Score Accelerated v2 | 4797 punti | |
Aiuto | ||
| PCMark 7 - Score (ordina per valore) | |
| MSI GE62-6QD16H11 | |
| Nexoc G515 II | |
| Lenovo Ideapad Y700 15ISK 80NW | |
| Dell Inspiron 15 7559 | |
| MSI GE62-2QEUi716H21BW | |
| MSI GE62-2QFUi716H11 | |
| Alienware 15 R2 (Skylake) | |
| PCMark 8 | |
| Home Score Accelerated v2 (ordina per valore) | |
| MSI GE62-6QD16H11 | |
| Nexoc G515 II | |
| Lenovo Ideapad Y700 15ISK 80NW | |
| Dell Inspiron 15 7559 | |
| MSI GE62-2QEUi716H21BW | |
| MSI GE62-2QEUi716H21BW | |
| MSI GE62-2QFUi716H11 | |
| Alienware 15 R2 (Skylake) | |
| Creative Score Accelerated v2 (ordina per valore) | |
| MSI GE62-6QD16H11 | |
| Lenovo Ideapad Y700 15ISK 80NW | |
| MSI GE62-2QEUi716H21BW | |
| MSI GE62-2QEUi716H21BW | |
| MSI GE62-2QFUi716H11 | |
| Alienware 15 R2 (Skylake) | |
| Work Score Accelerated v2 (ordina per valore) | |
| MSI GE62-6QD16H11 | |
| Nexoc G515 II | |
| Lenovo Ideapad Y700 15ISK 80NW | |
| Dell Inspiron 15 7559 | |
| MSI GE62-2QEUi716H21BW | |
| MSI GE62-2QEUi716H21BW | |
| MSI GE62-2QFUi716H11 | |
| Alienware 15 R2 (Skylake) | |

| MSI GE62-6QD16H11 Samsung SSD 850 EVO M.2 250 GB | Nexoc G515 II Samsung SM951 MZHPV256HDGL m.2 PCI-e | Lenovo Ideapad Y700 15ISK 80NW Samsung MZNLN128HCGR-000L2 | Dell Inspiron 15 7559 SK hynix SC300 M.2 | MSI GE62-2QEUi716H21BW Kingston RBU-SNS8100S3256GD1 | |
|---|---|---|---|---|---|
| AS SSD | 103% | 12% | -33% | 6% | |
| Seq Read (MB/s) | 500 | 1863 273% | 492 -2% | 509 2% | 502 0% |
| Seq Write (MB/s) | 449.1 | 1174 161% | 151 -66% | 202 -55% | 329.6 -27% |
| 4K Read (MB/s) | 21.05 | 39.56 88% | 34.29 63% | 25.01 19% | 33.07 57% |
| 4K Write (MB/s) | 72.9 | 92.6 27% | 94 29% | 59.3 -19% | 67.7 -7% |
| Access Time Read * (ms) | 0.168 | 0.053 68% | 0.094 44% | 0.106 37% | 0.099 41% |
| Access Time Write * (ms) | 0.041 | 0.041 -0% | 0.039 5% | 0.116 -183% | 0.052 -27% |
* ... Meglio usare valori piccoli
| 3DMark 11 Performance | 5865 punti | |
| 3DMark Ice Storm Standard Score | 69304 punti | |
| 3DMark Cloud Gate Standard Score | 17764 punti | |
| 3DMark Fire Strike Score | 4018 punti | |
Aiuto | ||
| 3DMark 11 - 1280x720 Performance (ordina per valore) | |
| MSI GE62-6QD16H11 | |
| Nexoc G515 II | |
| Lenovo Ideapad Y700 15ISK 80NW | |
| Dell Inspiron 15 7559 | |
| MSI GE62-2QEUi716H21BW | |
| MSI GE62-2QFUi716H11 | |
| Alienware 15 R2 (Skylake) | |
| 3DMark | |
| 1280x720 Cloud Gate Standard Score (ordina per valore) | |
| MSI GE62-6QD16H11 | |
| Nexoc G515 II | |
| Lenovo Ideapad Y700 15ISK 80NW | |
| Dell Inspiron 15 7559 | |
| MSI GE62-2QEUi716H21BW | |
| MSI GE62-2QFUi716H11 | |
| Alienware 15 R2 (Skylake) | |
| 1920x1080 Fire Strike Score (ordina per valore) | |
| MSI GE62-6QD16H11 | |
| Nexoc G515 II | |
| Lenovo Ideapad Y700 15ISK 80NW | |
| Dell Inspiron 15 7559 | |
| MSI GE62-2QEUi716H21BW | |
| MSI GE62-2QFUi716H11 | |
| Alienware 15 R2 (Skylake) | |
| basso | medio | alto | ultra | |
|---|---|---|---|---|
| Tomb Raider (2013) | 171 | 156.7 | 108.9 | 52.9 |
| Dirt Rally (2015) | 213.1 | 104.7 | 72.4 | 34.36 |
| The Witcher 3 (2015) | 83.6 | 52.3 | 27.4 | 15.2 |
| Metal Gear Solid V (2015) | 59.9 | 59.9 | 59.6 | 40.3 |
| Fallout 4 (2015) | 98.8 | 68.6 | 33.52 | 25.8 |
| Tomb Raider | |
| 1366x768 High Preset AA:FX AF:8x (ordina per valore) | |
| MSI GE62-6QD16H11 | |
| Lenovo Ideapad Y700 15ISK 80NW | |
| MSI GE62-2QEUi716H21BW | |
| MSI GE62-2QFUi716H11 | |
| Alienware 15 R2 (Skylake) | |
| 1920x1080 Ultra Preset AA:FX AF:16x (ordina per valore) | |
| MSI GE62-6QD16H11 | |
| Lenovo Ideapad Y700 15ISK 80NW | |
| MSI GE62-2QEUi716H21BW | |
| MSI GE62-2QFUi716H11 | |
| Alienware 15 R2 (Skylake) | |
| The Witcher 3 | |
| 1366x768 Medium Graphics & Postprocessing (ordina per valore) | |
| MSI GE62-6QD16H11 | |
| Nexoc G515 II | |
| 1920x1080 High Graphics & Postprocessing (Nvidia HairWorks Off) (ordina per valore) | |
| MSI GE62-6QD16H11 | |
| Nexoc G515 II | |
| Alienware 15 R2 (Skylake) | |
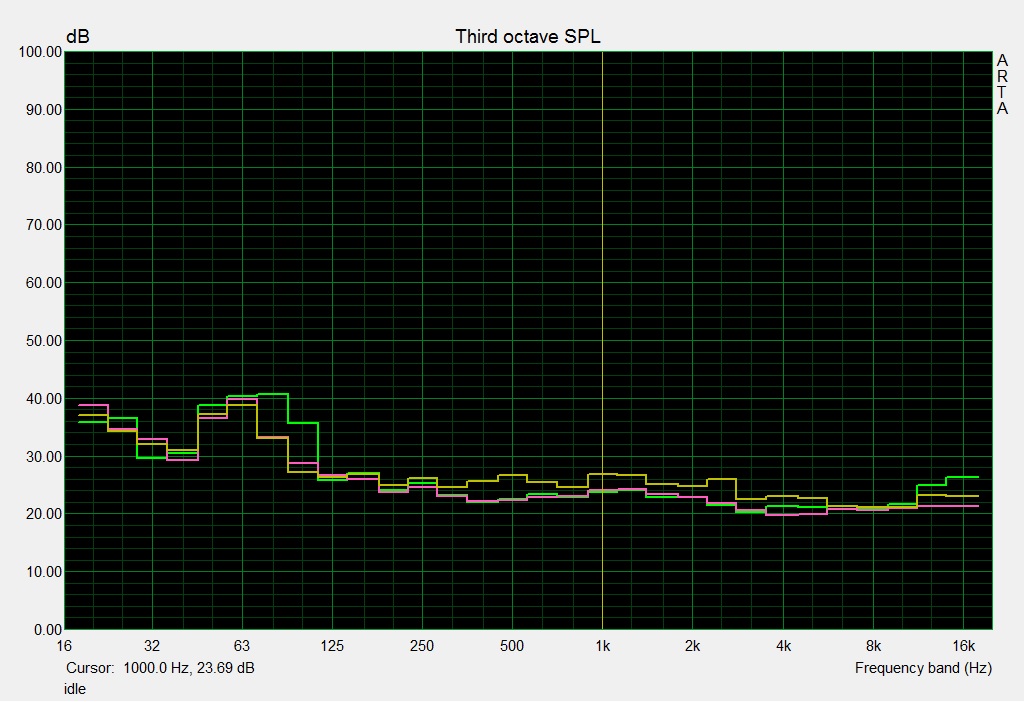
Rumorosità
| Idle |
| 33 / 34 / 38 dB(A) |
| HDD |
| 34 dB(A) |
| DVD |
| 39 / dB(A) |
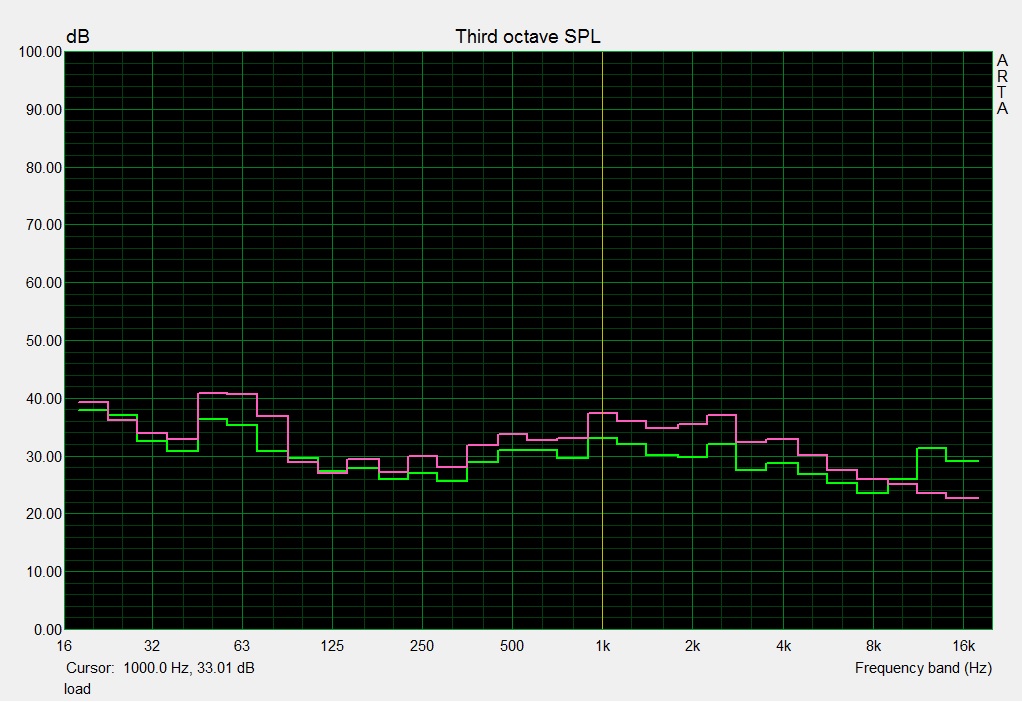
| Sotto carico |
| 42 / 46 dB(A) |
 | ||
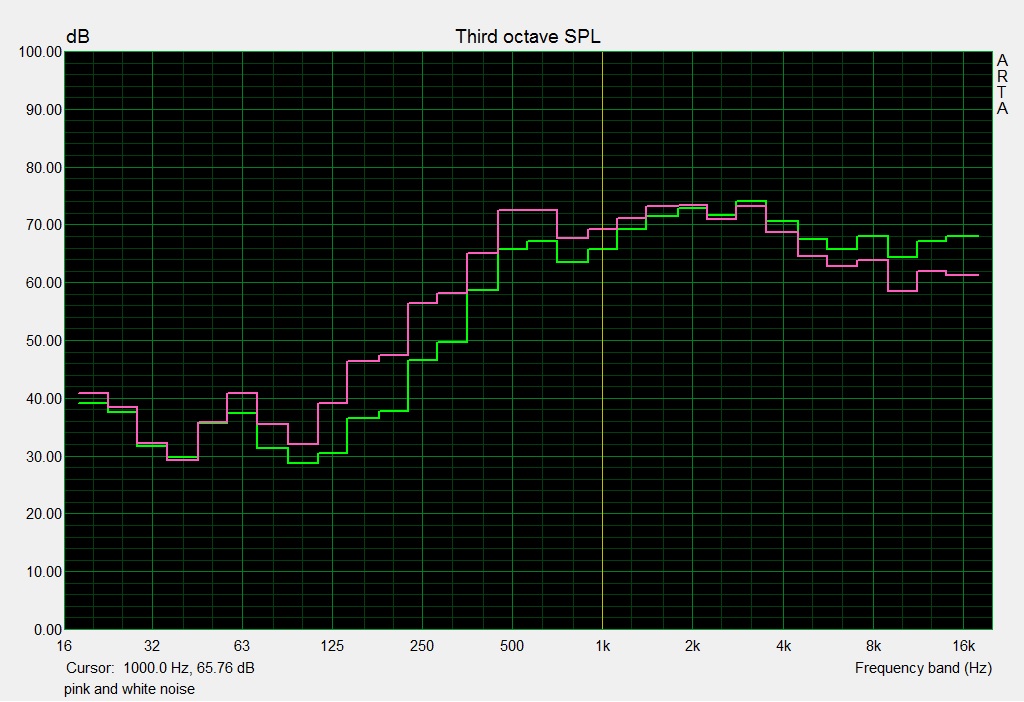
30 dB silenzioso 40 dB(A) udibile 50 dB(A) rumoroso |
||
min: | ||
| MSI GE62-6QD16H11 6700HQ, GeForce GTX 960M | Nexoc G515 II 6700HQ, GeForce GTX 960M | Lenovo Ideapad Y700 15ISK 80NW 6700HQ, GeForce GTX 960M | Dell Inspiron 15 7559 6700HQ, GeForce GTX 960M | MSI GE62-2QEUi716H21BW 4720HQ, GeForce GTX 965M | Alienware 15 R2 (Skylake) 6700HQ, GeForce GTX 980M | |
|---|---|---|---|---|---|---|
| Noise | 9% | 6% | 3% | 2% | 1% | |
| Idle Minimum * (dB) | 33 | 29.4 11% | 30.4 8% | 32.6 1% | 29.2 12% | 33.6 -2% |
| Idle Average * (dB) | 34 | 30.2 11% | 30.5 10% | 32.6 4% | 32.6 4% | 33.8 1% |
| Idle Maximum * (dB) | 38 | 35.6 6% | 33.3 12% | 32.6 14% | 35 8% | 34 11% |
| Load Average * (dB) | 42 | 39.8 5% | 41.4 1% | 40.5 4% | 42.6 -1% | 39.3 6% |
| Load Maximum * (dB) | 46 | 41.6 10% | 47 -2% | 49.1 -7% | 52.4 -14% | 51.4 -12% |
* ... Meglio usare valori piccoli
(-) La temperatura massima sul lato superiore è di 53.3 °C / 128 F, rispetto alla media di 40.4 °C / 105 F, che varia da 21.2 a 68.8 °C per questa classe Gaming.
(-) Il lato inferiore si riscalda fino ad un massimo di 49.3 °C / 121 F, rispetto alla media di 43.2 °C / 110 F
(±) In idle, la temperatura media del lato superiore è di 36.7 °C / 98 F, rispetto alla media deld ispositivo di 33.9 °C / 93 F.
(-) I poggiapolsi e il touchpad possono diventare molto caldi al tatto con un massimo di 49.5 °C / 121.1 F.
(-) La temperatura media della zona del palmo della mano di dispositivi simili e'stata di 28.8 °C / 83.8 F (-20.7 °C / -37.3 F).
| MSI GE62-6QD16H11 6700HQ, GeForce GTX 960M | Nexoc G515 II 6700HQ, GeForce GTX 960M | Lenovo Ideapad Y700 15ISK 80NW 6700HQ, GeForce GTX 960M | Dell Inspiron 15 7559 6700HQ, GeForce GTX 960M | MSI GE62-2QEUi716H21BW 4720HQ, GeForce GTX 965M | MSI GE62-2QFUi716H11 4720HQ, GeForce GTX 970M | Alienware 15 R2 (Skylake) 6700HQ, GeForce GTX 980M | |
|---|---|---|---|---|---|---|---|
| Heat | -6% | 22% | 10% | 6% | 8% | 9% | |
| Maximum Upper Side * (°C) | 53.3 | 56.8 -7% | 43.8 18% | 54 -1% | 49.9 6% | 53.4 -0% | 48 10% |
| Maximum Bottom * (°C) | 49.3 | 62 -26% | 47.8 3% | 53.4 -8% | 43.7 11% | 43.3 12% | 57.3 -16% |
| Idle Upper Side * (°C) | 41.2 | 39.6 4% | 27.4 33% | 30.4 26% | 37.1 10% | 34.7 16% | 31.9 23% |
| Idle Bottom * (°C) | 40.8 | 39.1 4% | 26.8 34% | 31.3 23% | 41.5 -2% | 39.6 3% | 33.4 18% |
* ... Meglio usare valori piccoli
| Off / Standby | |
| Idle | |
| Sotto carico |
|
Leggenda:
min: | |
| MSI GE62-6QD16H11 6700HQ, GeForce GTX 960M | Nexoc G515 II 6700HQ, GeForce GTX 960M | Dell Inspiron 15 7559 6700HQ, GeForce GTX 960M | MSI GE62-2QEUi716H21BW 4720HQ, GeForce GTX 965M | MSI GE62-2QFUi716H11 4720HQ, GeForce GTX 970M | Alienware 15 R2 (Skylake) 6700HQ, GeForce GTX 980M | |
|---|---|---|---|---|---|---|
| Power Consumption | 29% | 32% | 14% | 12% | 16% | |
| Idle Minimum * (Watt) | 20 | 11.2 44% | 9.4 53% | 15 25% | 14.7 26% | 11.4 43% |
| Idle Average * (Watt) | 24 | 14.6 39% | 14.4 40% | 20.8 13% | 20.9 13% | 16.5 31% |
| Idle Maximum * (Watt) | 30 | 21.8 27% | 15 50% | 25.4 15% | 25.6 15% | 22 27% |
| Load Average * (Watt) | 97 | 78.3 19% | 102 -5% | 91.8 5% | 101 -4% | 94.2 3% |
| Load Maximum * (Watt) | 155 | 132.6 14% | 120 23% | 136 12% | 138.8 10% | 192.2 -24% |
* ... Meglio usare valori piccoli
| MSI GE62-6QD16H11 53 Wh | Nexoc G515 II 62 Wh | Lenovo Ideapad Y700 15ISK 80NW 60 Wh | Dell Inspiron 15 7559 74 Wh | MSI GE62-2QEUi716H21BW 51 Wh | MSI GE62-2QFUi716H11 51 Wh | Alienware 15 R2 (Skylake) 96 Wh | |
|---|---|---|---|---|---|---|---|
| Autonomia della batteria | 79% | 139% | 122% | 21% | 17% | 207% | |
| Reader / Idle (h) | 3.1 | 10.3 232% | 11.8 281% | 4.5 45% | 3.9 26% | 12.8 313% | |
| H.264 (h) | 2.3 | 2.7 17% | 2.8 22% | 7.6 230% | |||
| WiFi v1.3 (h) | 2.5 | 4.2 68% | 5.9 136% | 3.9 56% | 2.7 8% | 7.4 196% | |
| Load (h) | 1 | 1.9 90% | 1.5 50% | 1.3 30% | 1 0% | 1.1 10% | 1.9 90% |
| WiFi (h) | 3 |
Pro
Contro
Abbiamo iniziato bene. Il nostro modello fa un lavoro abbastanza buono nella sua categoria sebbene l'update Skylake sia lontano dalle promesse di MSI relativamente alle prestazioni. I gamers troveranno importanti feature:
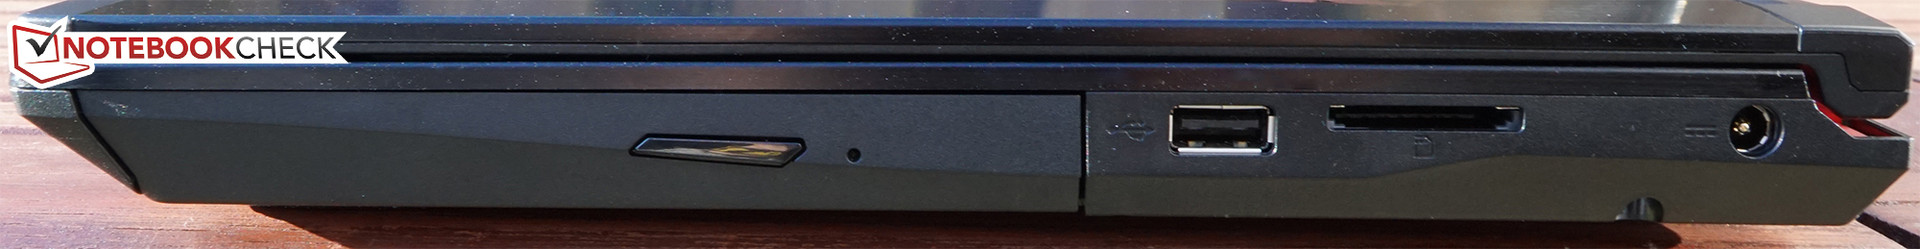
La principale highlight dell'MSI GE62 6QD è lo schermo Full HD che supera i rivali in tutte le categorie. Siamo alla pari per potenza gaming e routine performance. La nuvoa porta USB 3.1 non è un argomento di acquisto, ma è comunque utile per il futuro.
Purtroppo il sistema pecca nei punteggi secondari. Consuma troppo e le temperature sono troppo alte, mentre la batteria dura poco. Sebbene la rumorosità sia limitata potrebbe essere fastidiosa.
Il GE62 2QE con GTX 965M costa 1450 Euro (~$1583); attraente se pensiamo ai 1500 Euro (~$1637) del nostro modello. Chi cerca un sistema aggiornato e bilanciato deve guardare alla concorrenza. Nexoc G515 II in versione SSD parte da 1250 Euro (~$1364); il Dell Inspiron 15 7559 parte da 1100 Euro (~$1201, con SSHD).
Nota: si tratta di una recensione breve, con alcune sezioni non tradotte, per la versione integrale in inglese guardate qui.
MSI GE62-6QD16H11
- 02/16/2016 v5 (old)
Oliver Moebel