Recensione breve del Portatile HP Pavilion 15z-bw000 (A10-9620P, HD)
| SD Card Reader | |
| average JPG Copy Test (av. of 3 runs) | |
| Lenovo ThinkPad E570-20H6S00000 | |
| Acer Aspire E15 E5-553G-109A | |
| HP 15-ba077ng | |
| HP Pavilion 15z-bw000 | |
| Asus X555DA-BB11 | |
| Dell Inspiron 15 5000 5567-1753 | |
| maximum AS SSD Seq Read Test (1GB) | |
| Acer Aspire E15 E5-553G-109A | |
| Lenovo ThinkPad E570-20H6S00000 | |
| HP 15-ba077ng | |
| HP Pavilion 15z-bw000 | |
| Dell Inspiron 15 5000 5567-1753 | |
| Asus X555DA-BB11 | |
| |||||||||||||||||||||||||
Distribuzione della luminosità: 83 %
Al centro con la batteria: 251.3 cd/m²
Contrasto: 524:1 (Nero: 0.48 cd/m²)
ΔE ColorChecker Calman: 9.9 | ∀{0.5-29.43 Ø4.71}
ΔE Greyscale Calman: 11.7 | ∀{0.09-98 Ø4.96}
56.8% sRGB (Argyll 1.6.3 3D)
39.17% AdobeRGB 1998 (Argyll 1.6.3 3D)
39.17% AdobeRGB 1998 (Argyll 3D)
56.8% sRGB (Argyll 3D)
37.92% Display P3 (Argyll 3D)
Gamma: 2.05
CCT: 11713 K
| HP Pavilion 15z-bw000 BOE06A4, TN LED, 15.6", 1366x768 | Asus X555DA-BB11 TN LED, 15.6", 1920x1080 | Dell Inspiron 15 5000 5567-1753 BOE NT15N41, TN LED, 15.6", 1920x1080 | Acer Aspire E15 E5-553G-109A Chi Mei CMN15C4 / N156HGE-EAB, TN LED, 15.6", 1920x1080 | Lenovo ThinkPad E570-20H6S00000 AUO B156HAN04.4, IPS LED, 15.6", 1920x1080 | Lenovo Ideapad 110-15ACL 15.6", 1366x768 | |
|---|---|---|---|---|---|---|
| Display | -7% | -4% | 5% | 2% | -1% | |
| Display P3 Coverage (%) | 37.92 | 35.12 -7% | 36.24 -4% | 39.72 5% | 38.65 2% | 37.39 -1% |
| sRGB Coverage (%) | 56.8 | 52.7 -7% | 54.6 -4% | 59.2 4% | 58 2% | 56.2 -1% |
| AdobeRGB 1998 Coverage (%) | 39.17 | 36.29 -7% | 37.44 -4% | 41.07 5% | 39.94 2% | 38.63 -1% |
| Response Times | -2% | 17% | 16% | -12% | -22% | |
| Response Time Grey 50% / Grey 80% * (ms) | 41.6 ? | 42 ? -1% | 43 ? -3% | 42.4 ? -2% | 44.8 ? -8% | 58 ? -39% |
| Response Time Black / White * (ms) | 22 ? | 22.4 ? -2% | 14 ? 36% | 14.6 ? 34% | 25.6 ? -16% | 23 ? -5% |
| PWM Frequency (Hz) | 198.4 ? | 28740 | 200 ? | |||
| Screen | 10% | -11% | -2% | 31% | 6% | |
| Brightness middle (cd/m²) | 251.3 | 242.7 -3% | 145 -42% | 224 -11% | 242 -4% | 253 1% |
| Brightness (cd/m²) | 243 | 232 -5% | 144 -41% | 201 -17% | 243 0% | 246 1% |
| Brightness Distribution (%) | 83 | 88 6% | 90 8% | 75 -10% | 75 -10% | 86 4% |
| Black Level * (cd/m²) | 0.48 | 0.52 -8% | 0.49 -2% | 0.46 4% | 0.24 50% | 0.43 10% |
| Contrast (:1) | 524 | 467 -11% | 296 -44% | 487 -7% | 1008 92% | 588 12% |
| Colorchecker dE 2000 * | 9.9 | 4.9 51% | 9.27 6% | 10.5 -6% | 4.65 53% | |
| Colorchecker dE 2000 max. * | 22.9 | 20.3 11% | 16.9 26% | 16.8 27% | 9.64 58% | |
| Greyscale dE 2000 * | 11.7 | 2.7 77% | 12.28 -5% | 11.23 4% | 3.39 71% | |
| Gamma | 2.05 107% | 2.34 94% | 2.03 108% | 2.12 104% | 2.7 81% | |
| CCT | 11713 55% | 6876 95% | 10732 61% | 11096 59% | 6246 104% | |
| Color Space (Percent of AdobeRGB 1998) (%) | 39.17 | 33.5 -14% | 35 -11% | 38 -3% | 36.69 -6% | |
| Color Space (Percent of sRGB) (%) | 56.8 | 52.5 -8% | 55 -3% | 59 4% | 57.66 2% | |
| Media totale (Programma / Settaggio) | 0% /
5% | 1% /
-6% | 6% /
2% | 7% /
19% | -6% /
-2% |
* ... Meglio usare valori piccoli
Tempi di risposta del Display
| ↔ Tempi di risposta dal Nero al Bianco | ||
|---|---|---|
| 22 ms ... aumenta ↗ e diminuisce ↘ combinato | ↗ 16 ms Incremento | 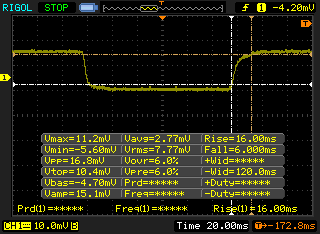 |
| ↘ 6 ms Calo | ||
| Lo schermo mostra buoni tempi di risposta durante i nostri tests, ma potrebbe essere troppo lento per i gamers competitivi. In confronto, tutti i dispositivi di test variano da 0.1 (minimo) a 240 (massimo) ms. » 49 % di tutti i dispositivi è migliore. Questo significa che i tempi di risposta rilevati sono peggiori rispetto alla media di tutti i dispositivi testati (19.8 ms). | ||
| ↔ Tempo di risposta dal 50% Grigio all'80% Grigio | ||
| 41.6 ms ... aumenta ↗ e diminuisce ↘ combinato | ↗ 14.8 ms Incremento | 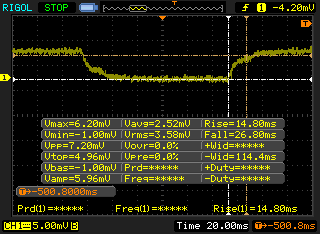 |
| ↘ 26.8 ms Calo | ||
| Lo schermo mostra tempi di risposta lenti nei nostri tests e sarà insoddisfacente per i gamers. In confronto, tutti i dispositivi di test variano da 0.165 (minimo) a 636 (massimo) ms. » 67 % di tutti i dispositivi è migliore. Questo significa che i tempi di risposta rilevati sono peggiori rispetto alla media di tutti i dispositivi testati (31 ms). | ||
Sfarfallio dello schermo / PWM (Pulse-Width Modulation)
| flickering dello schermo / PWM rilevato | 198.4 Hz | ≤ 99 % settaggio luminosita' | 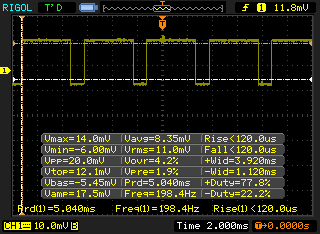 |
Il display sfarfalla a 198.4 Hz (Probabilmente a causa dell'uso di PWM) Flickering rilevato ad una luminosita' di 99 % o inferiore. Non dovrebbe verificarsi flickering o PWM sopra questo valore di luminosita'. La frequenza di 198.4 Hz è relativamente bassa, quindi gli utenti sensibili potrebbero notare il flickering ed accusare stanchezza agli occhi a questo livello di luminosità e a livelli inferiori. In confronto: 52 % di tutti i dispositivi testati non utilizza PWM per ridurre la luminosita' del display. Se è rilevato PWM, una media di 7747 (minimo: 5 - massimo: 343500) Hz è stata rilevata. | |||
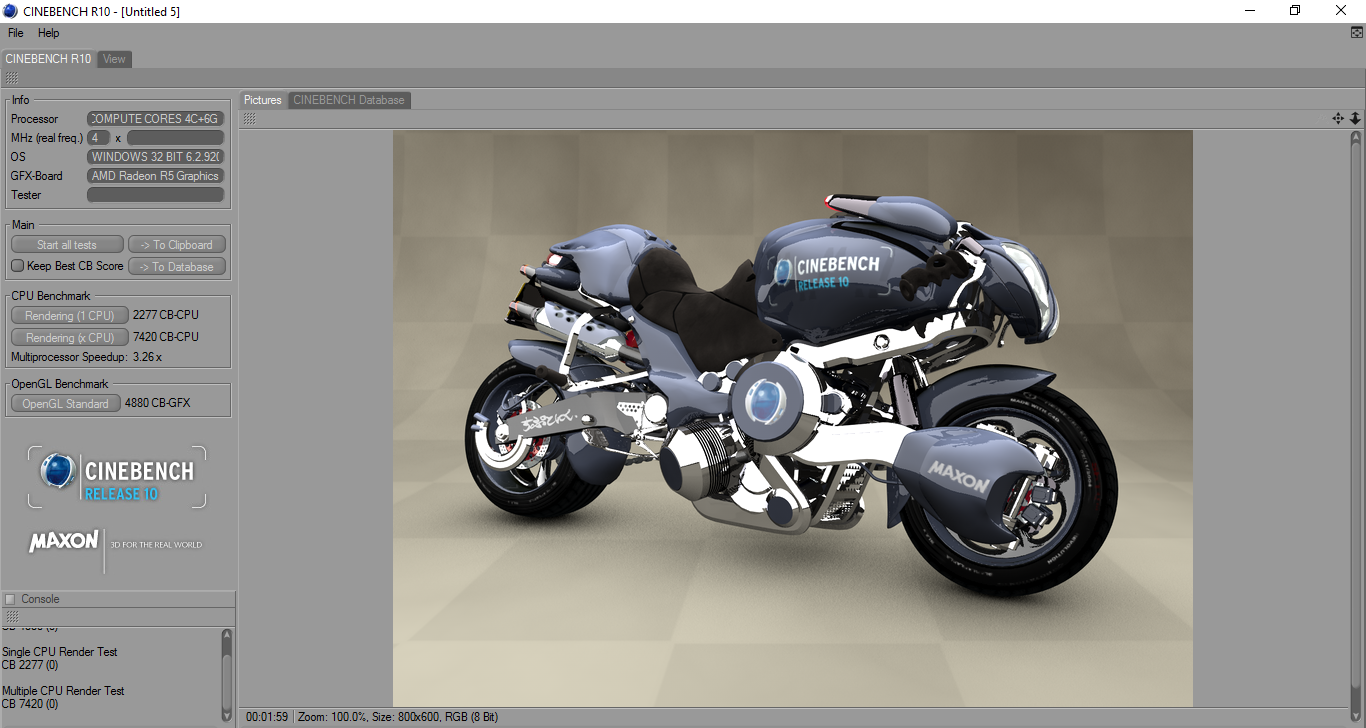
| Cinebench R10 | |
| Rendering Multiple CPUs 32Bit | |
| Dell Inspiron 15 5000 5567-1753 | |
| HP Pavilion 15z-bw000 | |
| HP 15-ba077ng | |
| Acer Aspire E15 E5-553G-109A | |
| Asus X555DA-BB11 | |
| Rendering Single 32Bit | |
| Dell Inspiron 15 5000 5567-1753 | |
| HP 15-ba077ng | |
| HP Pavilion 15z-bw000 | |
| Acer Aspire E15 E5-553G-109A | |
| Asus X555DA-BB11 | |
| wPrime 2.10 - 1024m | |
| Asus X555DA-BB11 | |
| HP Pavilion 15z-bw000 | |
* ... Meglio usare valori piccoli
| PCMark 8 Home Score Accelerated v2 | 2624 punti | |
| PCMark 8 Creative Score Accelerated v2 | 3075 punti | |
| PCMark 8 Work Score Accelerated v2 | 3669 punti | |
| PCMark 10 Score | 2080 punti | |
Aiuto | ||
| HP Pavilion 15z-bw000 Avolusion MD1TBLSSHD | Asus X555DA-BB11 Seagate Momentus SpinPoint M8 ST1000LM024 HN-M101MBB | Dell Inspiron 15 5000 5567-1753 SanDisk X400 SED 256GB, SATA (SD8TB8U-256G) | HP 15-ba077ng SanDisk Z400s SD8SNAT-256G | Acer Aspire E15 E5-553G-109A Liteonit CV3-8D128 | Lenovo ThinkPad E570-20H6S00000 Toshiba THNSF5256GPUK | |
|---|---|---|---|---|---|---|
| CrystalDiskMark 3.0 | -26% | 6943% | 4243% | 4443% | 11273% | |
| Read Seq (MB/s) | 109.6 | 106.9 -2% | 502 358% | 447.4 308% | 348.6 218% | 1140 940% |
| Write Seq (MB/s) | 104.6 | 97.5 -7% | 458.1 338% | 243.3 133% | 311.8 198% | 468.1 348% |
| Read 512 (MB/s) | 36.88 | 32.28 -12% | 382.8 938% | 333.4 804% | 295.9 702% | 759 1958% |
| Write 512 (MB/s) | 56.3 | 35.39 -37% | 385.7 585% | 283.1 403% | 185.8 230% | 414 635% |
| Read 4k (MB/s) | 0.436 | 0.373 -14% | 29.25 6609% | 20.99 4714% | 23.76 5350% | 34.3 7767% |
| Write 4k (MB/s) | 1.212 | 0.636 -48% | 55.9 4512% | 62.7 5073% | 44.94 3608% | 123.4 10082% |
| Read 4k QD32 (MB/s) | 1.234 | 0.694 -44% | 285.2 23012% | 143.1 11496% | 171.6 13806% | 530 42850% |
| Write 4k QD32 (MB/s) | 1.242 | 0.682 -45% | 239.6 19191% | 138 11011% | 143.2 11430% | 319.2 25600% |

| 3DMark | |
| 1280x720 Cloud Gate Standard Graphics | |
| Lenovo ThinkPad E570-20H6S00000 | |
| Acer Aspire E15 E5-553G-109A | |
| Dell Inspiron 15 5000 5567-1753 | |
| HP Pavilion 15z-bw000 | |
| Asus X555DA-BB11 | |
| 1920x1080 Fire Strike Graphics | |
| Lenovo ThinkPad E570-20H6S00000 | |
| Acer Aspire E15 E5-553G-109A | |
| Dell Inspiron 15 5000 5567-1753 | |
| HP Pavilion 15z-bw000 | |
| Asus X555DA-BB11 | |
| 1920x1080 Ice Storm Extreme Graphics | |
| Dell Inspiron 15 5000 5567-1753 | |
| HP Pavilion 15z-bw000 | |
| Asus X555DA-BB11 | |
| 3DMark 11 Performance | 1686 punti | |
| 3DMark Ice Storm Standard Score | 37793 punti | |
| 3DMark Cloud Gate Standard Score | 4365 punti | |
| 3DMark Fire Strike Score | 898 punti | |
| 3DMark Fire Strike Extreme Score | 464 punti | |
Aiuto | ||
| basso | medio | alto | ultra | |
|---|---|---|---|---|
| Tomb Raider (2013) | 51.8 | 29.1 | 21.3 | |
| BioShock Infinite (2013) | 45.9 | 28.7 | 21.8 | |
| Rise of the Tomb Raider (2016) | 19 | 12.2 |
Rumorosità
| Idle |
| 31 / 31.2 / 31.3 dB(A) |
| Sotto carico |
| 34.4 / 38.9 dB(A) |
 | ||
30 dB silenzioso 40 dB(A) udibile 50 dB(A) rumoroso |
||
min: | ||
| HP Pavilion 15z-bw000 Radeon R5 (Carrizo), A10-9620P, Avolusion MD1TBLSSHD | Asus X555DA-BB11 Radeon R6 (Carrizo), A10-8700P, Seagate Momentus SpinPoint M8 ST1000LM024 HN-M101MBB | Dell Inspiron 15 5000 5567-1753 Radeon R7 M445, i7-7500U, SanDisk X400 SED 256GB, SATA (SD8TB8U-256G) | HP 15-ba077ng Radeon R7 (Bristol Ridge), A12-9700P, SanDisk Z400s SD8SNAT-256G | Acer Aspire E15 E5-553G-109A Radeon R8 M445DX, A12-9700P, Liteonit CV3-8D128 | Lenovo ThinkPad E570-20H6S00000 GeForce GTX 950M, i5-7200U, Toshiba THNSF5256GPUK | Lenovo Ideapad 110-15ACL Radeon R5 (Beema/Carrizo-L), A8-7410 | Acer Aspire E5-774-54HJ HD Graphics 620, i5-7200U, Western Digital Scorpio Blue WD5000LPCX-24C6HT0 | Apple MacBook 12 (Early 2016) 1.1 GHz HD Graphics 515, 6Y30, Apple SSD AP0256 | |
|---|---|---|---|---|---|---|---|---|---|
| Noise | 0% | -5% | 2% | 1% | 3% | 4% | 3% | ||
| off /ambiente * (dB) | 28.3 | 28.9 -2% | 30.6 -8% | 30.6 -8% | 30.5 -8% | 29 -2% | 30.4 -7% | 30.5 -8% | |
| Idle Minimum * (dB) | 31 | 31.6 -2% | 30.6 1% | 31.5 -2% | 31.4 -1% | 29 6% | 30.9 -0% | 30.8 1% | |
| Idle Average * (dB) | 31.2 | 32 -3% | 30.6 2% | 31.8 -2% | 31.4 -1% | 29 7% | 30.9 1% | 30.8 1% | |
| Idle Maximum * (dB) | 31.3 | 32.4 -4% | 30.6 2% | 31.8 -2% | 31.9 -2% | 29 7% | 31 1% | 30.8 2% | |
| Load Average * (dB) | 34.4 | 33.3 3% | 41.9 -22% | 31.4 9% | 33.7 2% | 34.3 -0% | 31.8 8% | 32.1 7% | |
| Load Maximum * (dB) | 38.9 | 35.5 9% | 41.8 -7% | 33.4 14% | 33.8 13% | 40.1 -3% | 31.9 18% | 33.8 13% | |
| Witcher 3 ultra * (dB) | 40.6 |
* ... Meglio usare valori piccoli
(+) La temperatura massima sul lato superiore è di 38 °C / 100 F, rispetto alla media di 36.8 °C / 98 F, che varia da 21 a 71 °C per questa classe Multimedia.
(±) Il lato inferiore si riscalda fino ad un massimo di 40.8 °C / 105 F, rispetto alla media di 39.1 °C / 102 F
(+) In idle, la temperatura media del lato superiore è di 26.2 °C / 79 F, rispetto alla media deld ispositivo di 31.3 °C / 88 F.
(±) I poggiapolsi e il touchpad possono diventare molto caldi al tatto con un massimo di 36 °C / 96.8 F.
(-) La temperatura media della zona del palmo della mano di dispositivi simili e'stata di 28.7 °C / 83.7 F (-7.3 °C / -13.1 F).
HP Pavilion 15z-bw000 analisi audio
(±) | potenza degli altiparlanti media ma buona (75 dB)
Bassi 100 - 315 Hz
(-) | quasi nessun basso - in media 17.5% inferiori alla media
(-) | bassi non lineari (16.2% delta rispetto alla precedente frequenza)
Medi 400 - 2000 Hz
(+) | medi bilanciati - solo only 2.6% rispetto alla media
(±) | linearità dei medi adeguata (10.4% delta rispetto alla precedente frequenza)
Alti 2 - 16 kHz
(+) | Alti bilanciati - appena 1.9% dalla media
(±) | la linearità degli alti è media (9.1% delta rispetto alla precedente frequenza)
Nel complesso 100 - 16.000 Hz
(±) | la linearità complessiva del suono è media (18.8% di differenza rispetto alla media
Rispetto alla stessa classe
» 58% di tutti i dispositivi testati in questa classe è stato migliore, 8% simile, 34% peggiore
» Il migliore ha avuto un delta di 5%, medio di 17%, peggiore di 45%
Rispetto a tutti i dispositivi testati
» 43% di tutti i dispositivi testati in questa classe è stato migliore, 8% similare, 49% peggiore
» Il migliore ha avuto un delta di 4%, medio di 23%, peggiore di 134%
Apple MacBook 12 (Early 2016) 1.1 GHz analisi audio
(+) | gli altoparlanti sono relativamente potenti (83.6 dB)
Bassi 100 - 315 Hz
(±) | bassi ridotti - in media 11.3% inferiori alla media
(±) | la linearità dei bassi è media (14.2% delta rispetto alla precedente frequenza)
Medi 400 - 2000 Hz
(+) | medi bilanciati - solo only 2.4% rispetto alla media
(+) | medi lineari (5.5% delta rispetto alla precedente frequenza)
Alti 2 - 16 kHz
(+) | Alti bilanciati - appena 2% dalla media
(+) | alti lineari (4.5% delta rispetto alla precedente frequenza)
Nel complesso 100 - 16.000 Hz
(+) | suono nel complesso lineare (10.2% differenza dalla media)
Rispetto alla stessa classe
» 7% di tutti i dispositivi testati in questa classe è stato migliore, 2% simile, 90% peggiore
» Il migliore ha avuto un delta di 5%, medio di 18%, peggiore di 53%
Rispetto a tutti i dispositivi testati
» 5% di tutti i dispositivi testati in questa classe è stato migliore, 1% similare, 94% peggiore
» Il migliore ha avuto un delta di 4%, medio di 23%, peggiore di 134%
| Off / Standby | |
| Idle | |
| Sotto carico |
|
Leggenda:
min: | |
| HP Pavilion 15z-bw000 A10-9620P, Radeon R5 (Carrizo), Avolusion MD1TBLSSHD, TN LED, 1366x768, 15.6" | Asus X555DA-BB11 A10-8700P, Radeon R6 (Carrizo), Seagate Momentus SpinPoint M8 ST1000LM024 HN-M101MBB, TN LED, 1920x1080, 15.6" | Dell Inspiron 15 5000 5567-1753 i7-7500U, Radeon R7 M445, SanDisk X400 SED 256GB, SATA (SD8TB8U-256G), TN LED, 1920x1080, 15.6" | HP 15-ba077ng A12-9700P, Radeon R7 (Bristol Ridge), SanDisk Z400s SD8SNAT-256G, TN LED, 1920x1080, 15.6" | Acer Aspire E15 E5-553G-109A A12-9700P, Radeon R8 M445DX, Liteonit CV3-8D128, TN LED, 1920x1080, 15.6" | Lenovo ThinkPad E570-20H6S00000 i5-7200U, GeForce GTX 950M, Toshiba THNSF5256GPUK, IPS LED, 1920x1080, 15.6" | Acer Aspire E5-774-54HJ i5-7200U, HD Graphics 620, Western Digital Scorpio Blue WD5000LPCX-24C6HT0, TN LED, 1920x1080, 17.3" | |
|---|---|---|---|---|---|---|---|
| Power Consumption | -21% | -4% | 14% | -37% | -4% | -6% | |
| Idle Minimum * (Watt) | 5.38 | 8.3 -54% | 4 26% | 4.4 18% | 7.2 -34% | 2.8 48% | 5.3 1% |
| Idle Average * (Watt) | 7.9 | 8.6 -9% | 5.4 32% | 6.8 14% | 10.3 -30% | 6.3 20% | 10.1 -28% |
| Idle Maximum * (Watt) | 8.98 | 13.1 -46% | 8.3 8% | 8.9 1% | 11.9 -33% | 6.9 23% | 10.5 -17% |
| Load Average * (Watt) | 34.74 | 31.2 10% | 54 -55% | 30.9 11% | 48.2 -39% | 51.6 -49% | 34.3 1% |
| Load Maximum * (Watt) | 42.41 | 43.9 -4% | 55.4 -31% | 31 27% | 63 -49% | 69.7 -64% | 37 13% |
| Witcher 3 ultra * (Watt) | 51.8 |
* ... Meglio usare valori piccoli
| HP Pavilion 15z-bw000 A10-9620P, Radeon R5 (Carrizo), 31 Wh | Asus X555DA-BB11 A10-8700P, Radeon R6 (Carrizo), 37 Wh | Dell Inspiron 15 5000 5567-1753 i7-7500U, Radeon R7 M445, 42 Wh | Acer Aspire E15 E5-553G-109A A12-9700P, Radeon R8 M445DX, 40 Wh | Lenovo ThinkPad E570-20H6S00000 i5-7200U, GeForce GTX 950M, 41 Wh | Acer Aspire E5-774-54HJ i5-7200U, HD Graphics 620, 41 Wh | |
|---|---|---|---|---|---|---|
| Autonomia della batteria | 0% | 52% | -3% | 113% | 43% | |
| Reader / Idle (h) | 6.4 | 7.3 14% | 7.8 22% | 6 -6% | 14.7 130% | |
| WiFi v1.3 (h) | 3.7 | 2.9 -22% | 7 89% | 4.3 16% | 7.7 108% | 5.3 43% |
| Load (h) | 1.1 | 1.2 9% | 1.6 45% | 0.9 -18% | 2.2 100% |
Pro
Contro


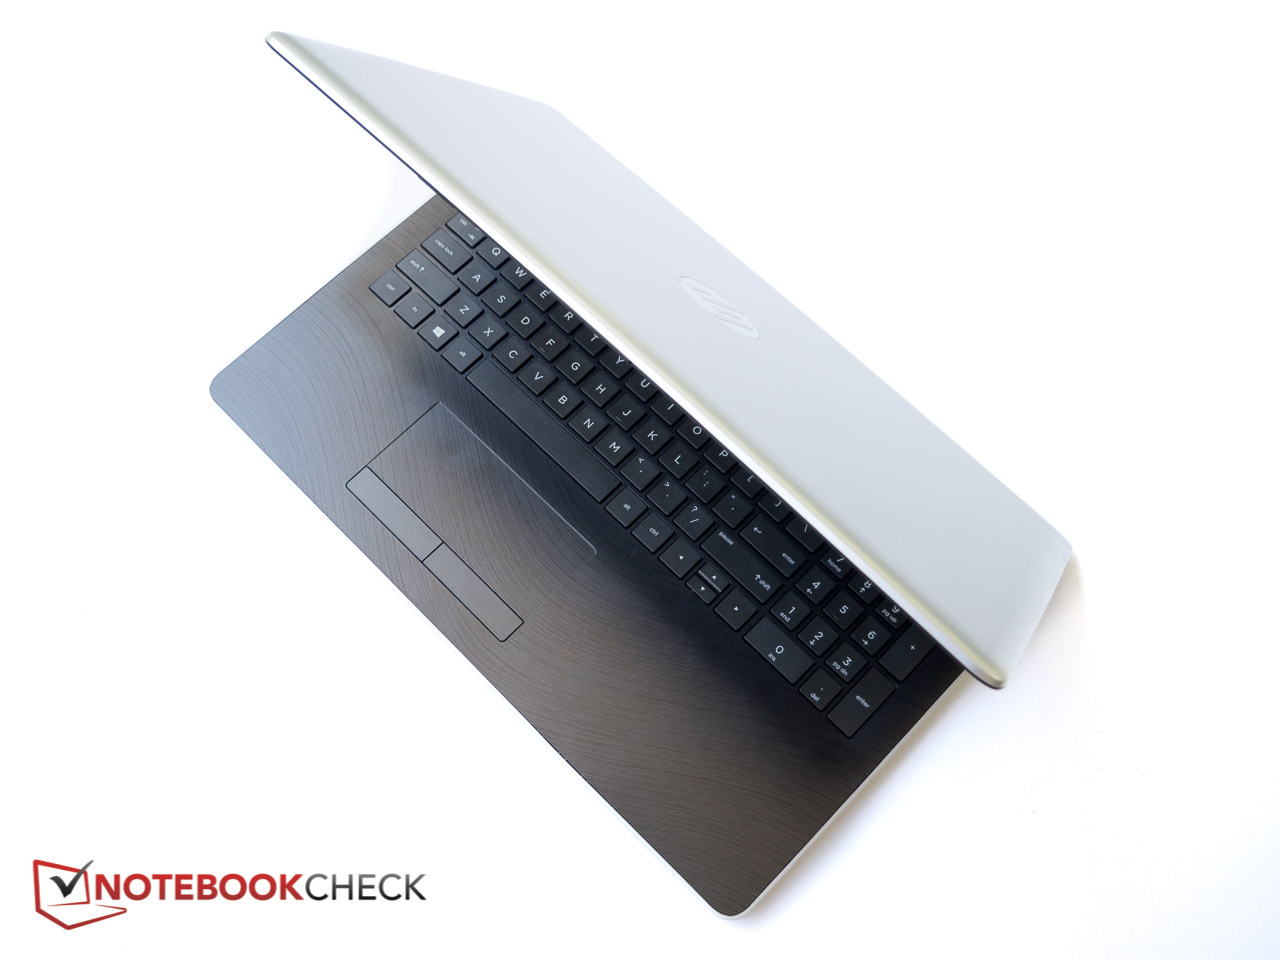
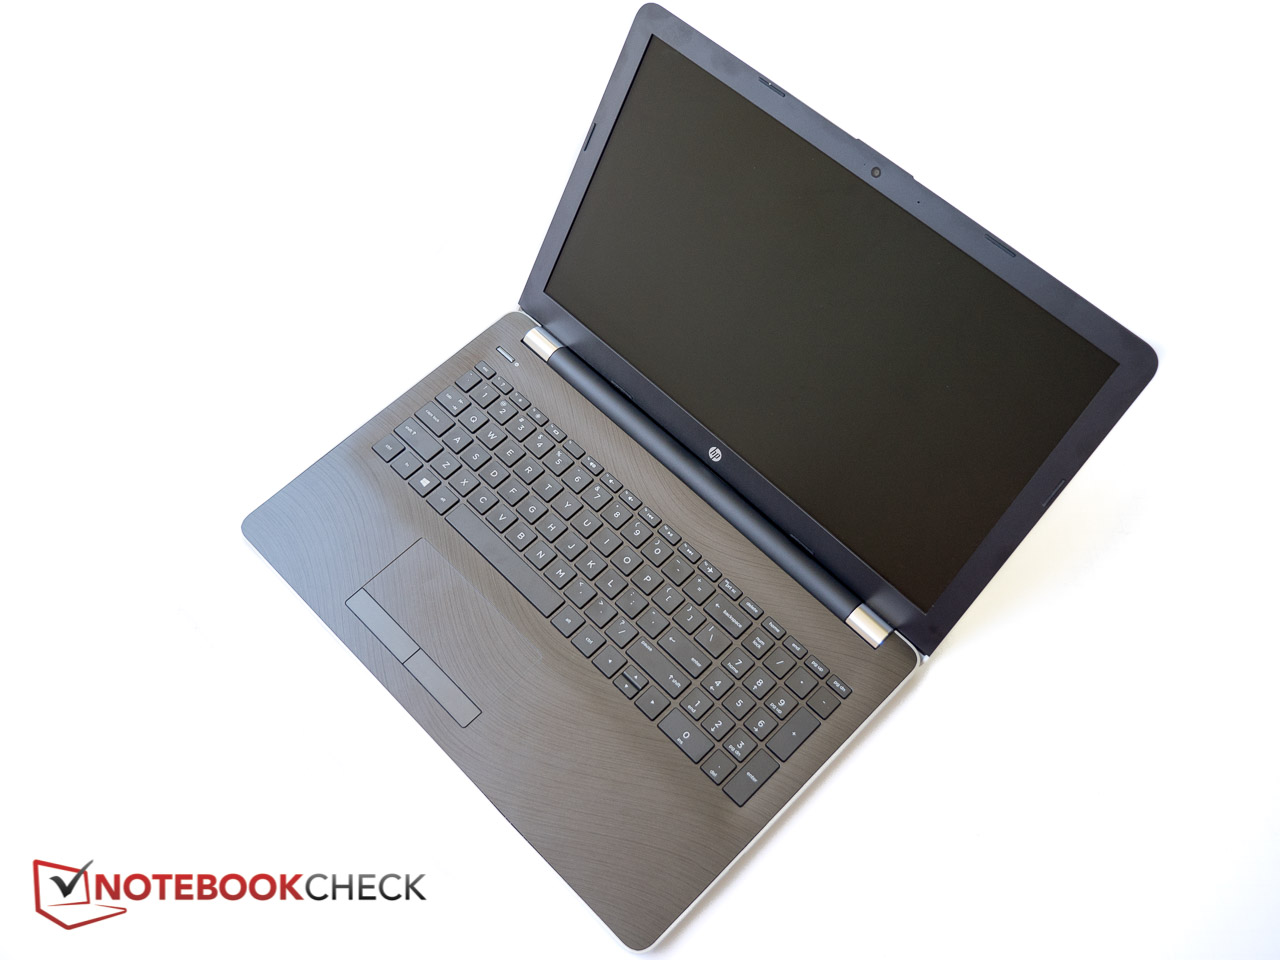
Il Pavilion 15z è un portatile leggero, discreto ma entry-level da 15.6". Il processore AMD APU non si avvicina nemmeno alle attuali generazioni di CPUs Intel ULV, sebbene la Radeon R5 iGP offra prestazioni decenti per gestire almeno qualche gioco datato con settaggi bassi.
Il sistema è rallentato da un lento hard drive, il display HD TN ha angoli di visuale limitati e la batteria ha poca autonomia.
Con tanti modelli entry-level, sarà difficile per l'HP Pavilion 15z - emergere dalla massa.
Nota: si tratta di una recensione breve, con alcune sezioni non tradotte, per la versione integrale in inglese guardate qui.
HP Pavilion 15z-bw000
- 07/15/2017 v6 (old)
Bernie Pechlaner
Price comparison
