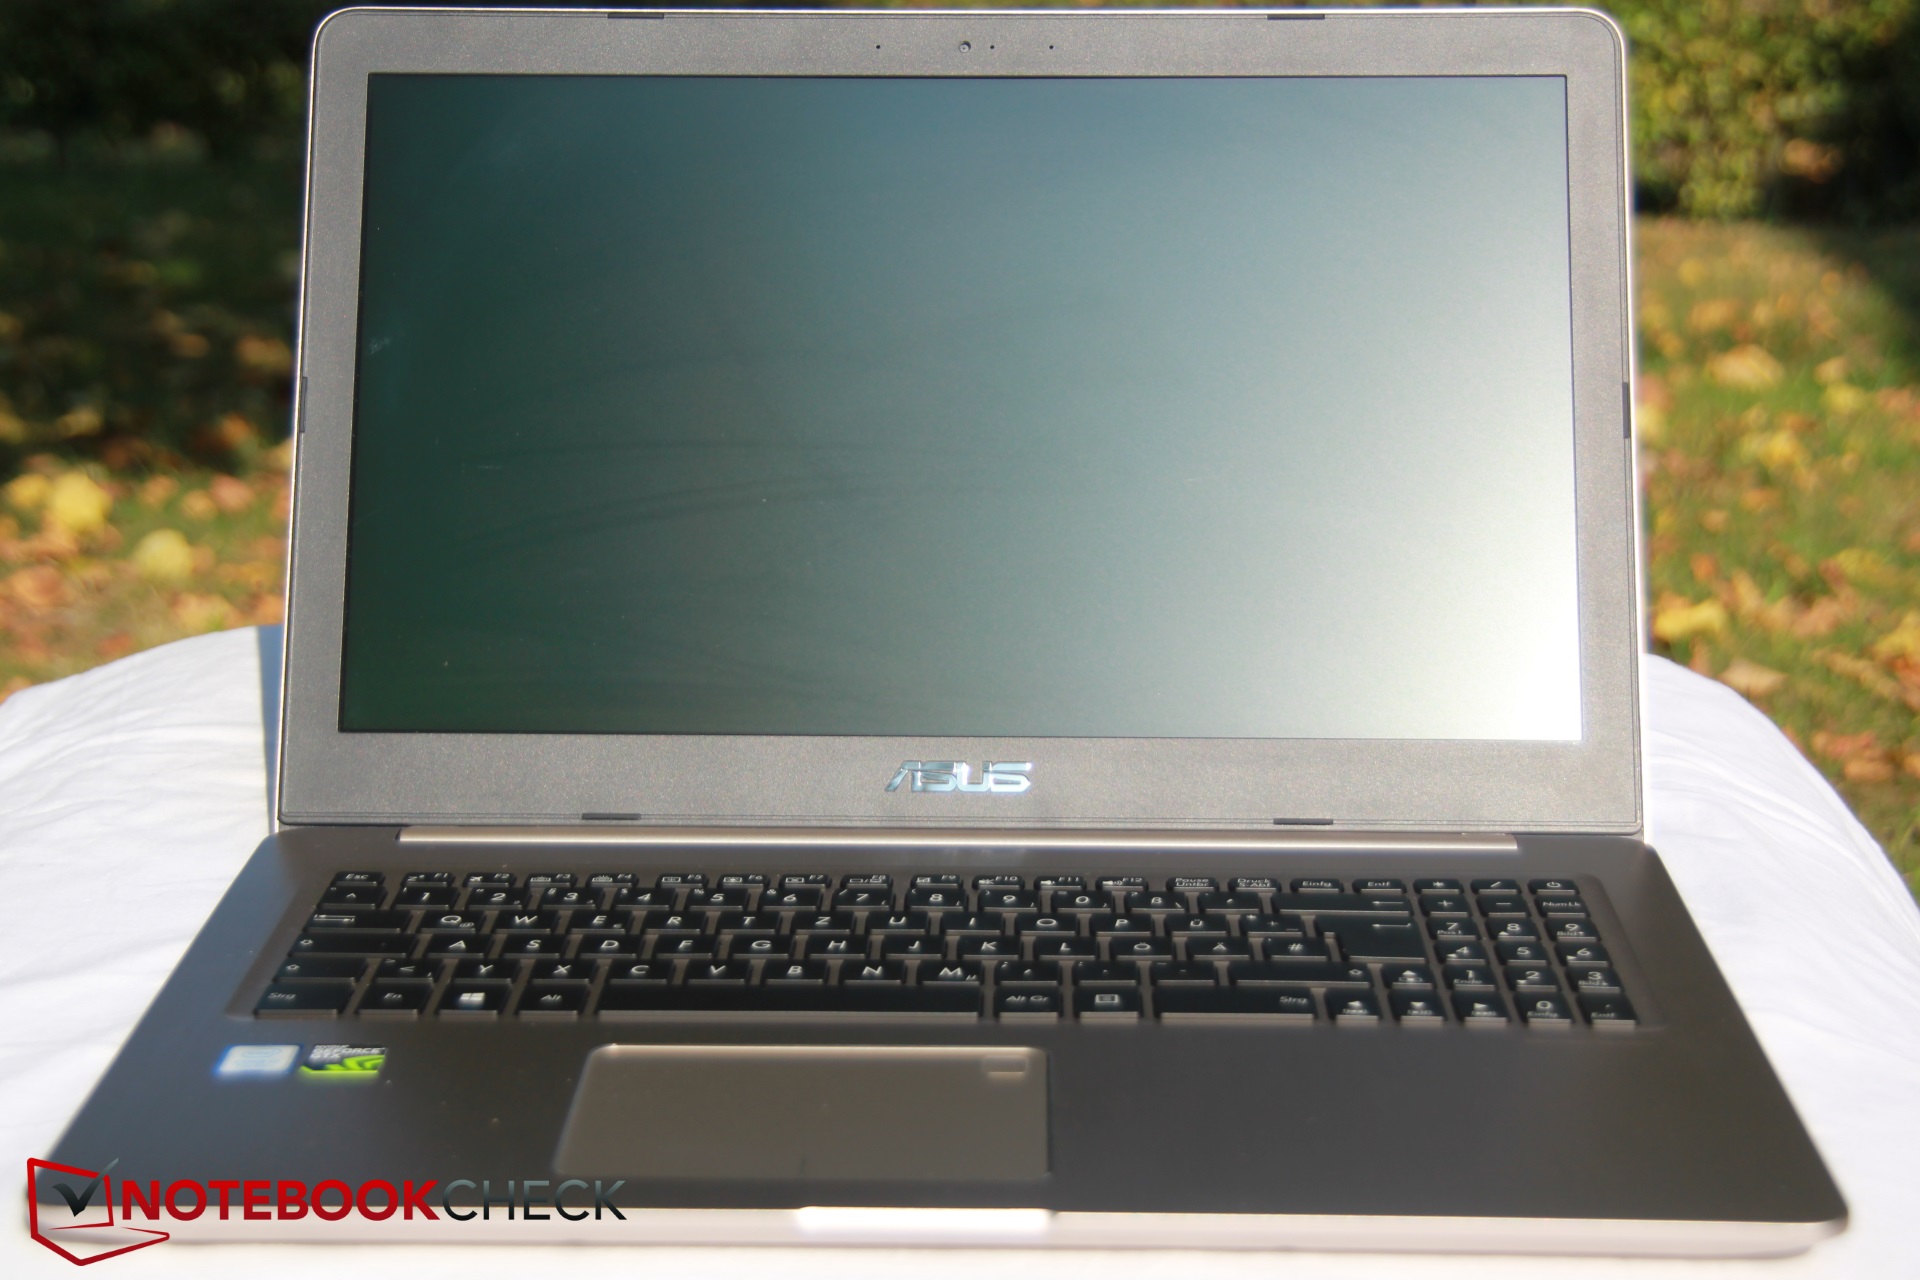
Recensione breve del Portatile Asus VivoBook Pro 15 (i7-7700HQ, GTX 1050)
| |||||||||||||||||||||||||
Distribuzione della luminosità: 85 %
Al centro con la batteria: 246 cd/m²
Contrasto: 515:1 (Nero: 0.48 cd/m²)
ΔE ColorChecker Calman: 5.39 | ∀{0.5-29.43 Ø4.72}
ΔE Greyscale Calman: 5.25 | ∀{0.09-98 Ø4.97}
60% sRGB (Argyll 1.6.3 3D)
38% AdobeRGB 1998 (Argyll 1.6.3 3D)
41.27% AdobeRGB 1998 (Argyll 3D)
59.8% sRGB (Argyll 3D)
39.92% Display P3 (Argyll 3D)
Gamma: 2.48
CCT: 7609 K
| Asus VivoBook Pro 15 N580VD-DM028T INNOLUX N156HGA-EAB, , 1920x1080, 15.6" | Asus ZenBook Pro UX550VD CMN15E8 (N156HCE-EN1), , 1920x1080, 15.6" | Gigabyte Sabre 15G ID: LGD0533, Name: LG Display LP156WF6-SPK3, , 1920x1080, 15.6" | HP Pavilion 15t-X7P42AV AU Optronics AUO41ED, , 1920x1080, 15.6" | Acer Aspire VX15 VX5-591G-589S BOE CQ NV156HFM-N42, , 1920x1080, 15.6" | Dell XPS 15 2017 9560 (7300HQ, Full-HD) Sharp SHP1453 LQ156M1, , 1920x1080, 15.6" | |
|---|---|---|---|---|---|---|
| Display | 59% | -2% | -5% | 1% | 70% | |
| Display P3 Coverage (%) | 39.92 | 65.7 65% | 38.97 -2% | 38.03 -5% | 40.56 2% | 68.9 73% |
| sRGB Coverage (%) | 59.8 | 90.3 51% | 58.2 -3% | 56.5 -6% | 59.4 -1% | 98.9 65% |
| AdobeRGB 1998 Coverage (%) | 41.27 | 65.9 60% | 40.3 -2% | 39.29 -5% | 41.9 2% | 70.9 72% |
| Response Times | -49% | -35% | -55% | -84% | -163% | |
| Response Time Grey 50% / Grey 80% * (ms) | 44 ? | 38.8 ? 12% | 32 ? 27% | 44.4 ? -1% | 46 ? -5% | 54 ? -23% |
| Response Time Black / White * (ms) | 13 ? | 27.2 ? -109% | 25.6 ? -97% | 27.2 ? -109% | 34 ? -162% | 52.4 ? -303% |
| PWM Frequency (Hz) | 25000 ? | 25910 ? | 20000 ? | 20000 ? | ||
| Screen | 36% | -18% | -16% | 23% | 46% | |
| Brightness middle (cd/m²) | 247 | 335 36% | 248.4 1% | 209.7 -15% | 277 12% | 400 62% |
| Brightness (cd/m²) | 224 | 313 40% | 241 8% | 193 -14% | 268 20% | 392 75% |
| Brightness Distribution (%) | 85 | 83 -2% | 84 -1% | 75 -12% | 91 7% | 89 5% |
| Black Level * (cd/m²) | 0.48 | 0.27 44% | 0.3 37% | 0.19 60% | 0.26 46% | 0.26 46% |
| Contrast (:1) | 515 | 1241 141% | 828 61% | 1104 114% | 1065 107% | 1538 199% |
| Colorchecker dE 2000 * | 5.39 | 4.7 13% | 7.5 -39% | 7.8 -45% | 5.05 6% | 4.9 9% |
| Colorchecker dE 2000 max. * | 7.98 | 8.1 -2% | 25.2 -216% | 24.1 -202% | 8.93 -12% | 11 -38% |
| Greyscale dE 2000 * | 5.25 | 5.8 -10% | 6.5 -24% | 7.3 -39% | 2.97 43% | 7.2 -37% |
| Gamma | 2.48 89% | 2.06 107% | 2.19 100% | 2.39 92% | 2.39 92% | 2.11 104% |
| CCT | 7609 85% | 6518 100% | 7852 83% | 5771 113% | 6466 101% | 6911 94% |
| Color Space (Percent of AdobeRGB 1998) (%) | 38 | 58.7 54% | 37 -3% | 39.3 3% | 38 0% | 64.2 69% |
| Color Space (Percent of sRGB) (%) | 60 | 90.1 50% | 57.9 -3% | 56.5 -6% | 59 -2% | 98.9 65% |
| Media totale (Programma / Settaggio) | 15% /
30% | -18% /
-17% | -25% /
-19% | -20% /
4% | -16% /
23% |
* ... Meglio usare valori piccoli
Tempi di risposta del Display
| ↔ Tempi di risposta dal Nero al Bianco | ||
|---|---|---|
| 13 ms ... aumenta ↗ e diminuisce ↘ combinato | ↗ 10 ms Incremento | 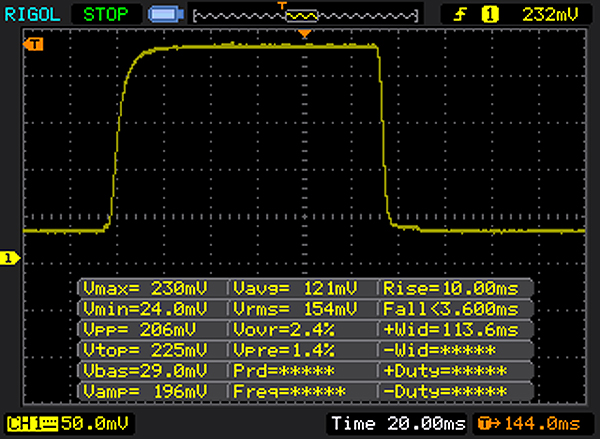 |
| ↘ 3 ms Calo | ||
| Lo schermo mostra buoni tempi di risposta durante i nostri tests, ma potrebbe essere troppo lento per i gamers competitivi. In confronto, tutti i dispositivi di test variano da 0.1 (minimo) a 240 (massimo) ms. » 33 % di tutti i dispositivi è migliore. Questo significa che i tempi di risposta rilevati sono migliori rispettto alla media di tutti i dispositivi testati (19.8 ms). | ||
| ↔ Tempo di risposta dal 50% Grigio all'80% Grigio | ||
| 44 ms ... aumenta ↗ e diminuisce ↘ combinato | ↗ 25 ms Incremento | 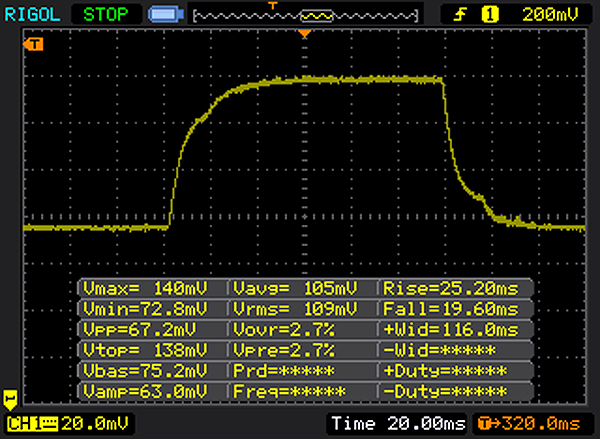 |
| ↘ 19 ms Calo | ||
| Lo schermo mostra tempi di risposta lenti nei nostri tests e sarà insoddisfacente per i gamers. In confronto, tutti i dispositivi di test variano da 0.165 (minimo) a 636 (massimo) ms. » 73 % di tutti i dispositivi è migliore. Questo significa che i tempi di risposta rilevati sono peggiori rispetto alla media di tutti i dispositivi testati (31 ms). | ||
Sfarfallio dello schermo / PWM (Pulse-Width Modulation)
| flickering dello schermo / PWM rilevato | 25000 Hz | ≤ 30 % settaggio luminosita' | 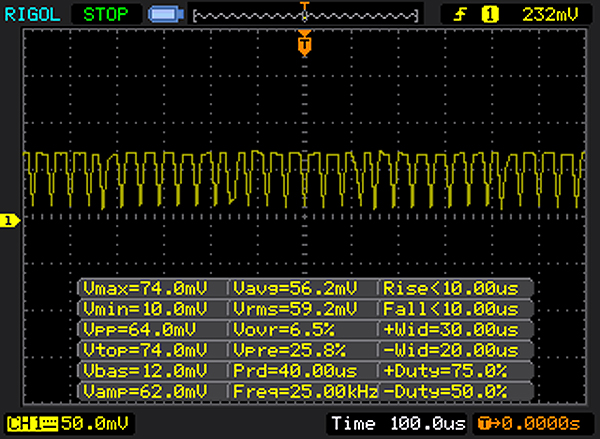 |
Il display sfarfalla a 25000 Hz (Probabilmente a causa dell'uso di PWM) Flickering rilevato ad una luminosita' di 30 % o inferiore. Non dovrebbe verificarsi flickering o PWM sopra questo valore di luminosita'. La frequenza di 25000 Hz è abbastanza alta, quindi la maggioranza degli utenti sensibili al PWM non dovrebbero notare alcun flickering. In confronto: 52 % di tutti i dispositivi testati non utilizza PWM per ridurre la luminosita' del display. Se è rilevato PWM, una media di 7772 (minimo: 5 - massimo: 343500) Hz è stata rilevata. | |||
| Cinebench R11.5 | |
| CPU Multi 64Bit | |
| Gigabyte Sabre 15G | |
| Asus VivoBook Pro 15 N580VD-DM028T | |
| HP Pavilion 15t-X7P42AV | |
| CPU Single 64Bit | |
| Gigabyte Sabre 15G | |
| HP Pavilion 15t-X7P42AV | |
| Asus VivoBook Pro 15 N580VD-DM028T | |
| Cinebench R10 | |
| Rendering Multiple CPUs 64Bit | |
| Asus VivoBook Pro 15 N580VD-DM028T | |
| Rendering Single CPUs 64Bit | |
| Asus VivoBook Pro 15 N580VD-DM028T | |
| PCMark 8 Home Score Accelerated v2 | 3833 punti | |
| PCMark 8 Work Score Accelerated v2 | 4934 punti | |
Aiuto | ||
| Asus VivoBook Pro 15 N580VD-DM028T Micron 1100 MTFDDAV256TBN | Asus ZenBook Pro UX550VD Samsung PM961 NVMe MZVLW512HMJP | HP Pavilion 15t-X7P42AV Samsung CM871a MZNTY128HDHP | Acer Aspire VX15 VX5-591G-589S Hynix HFS128G39TND | Dell XPS 15 2017 9560 (7300HQ, Full-HD) WDC WD10SPCX-75KHST0 + SanDisk Z400s M.2 2242 32 GB Cache | |
|---|---|---|---|---|---|
| CrystalDiskMark 3.0 | 142% | 9% | -3% | -80% | |
| Read Seq (MB/s) | 483.9 | 1434 196% | 522 8% | 510 5% | 123 -75% |
| Write Seq (MB/s) | 408.3 | 1365 234% | 476.6 17% | 137.6 -66% | 74.2 -82% |
| Read 512 (MB/s) | 319 | 614 92% | 399.7 25% | 362.1 14% | 101.7 -68% |
| Write 512 (MB/s) | 346.7 | 688 98% | 185.4 -47% | 137.2 -60% | 42.51 -88% |
| Read 4k (MB/s) | 24.77 | 60.6 145% | 33.12 34% | 35.18 42% | 10.84 -56% |
| Write 4k (MB/s) | 79.4 | 158 99% | 89.8 13% | 104.8 32% | 1.021 -99% |
| Read 4k QD32 (MB/s) | 246.1 | 617 151% | 400.9 63% | 375.8 53% | 69.8 -72% |
| Write 4k QD32 (MB/s) | 241.5 | 525 117% | 140.2 -42% | 138.1 -43% | 1.057 -100% |

| 3DMark | |
| 1280x720 Cloud Gate Standard Graphics | |
| Dell XPS 15 2017 9560 (7300HQ, Full-HD) | |
| Gigabyte Sabre 15G | |
| HP Pavilion 15t-X7P42AV | |
| Asus VivoBook Pro 15 N580VD-DM028T | |
| Asus ZenBook Pro UX550VD | |
| 1920x1080 Fire Strike Graphics | |
| Dell XPS 15 2017 9560 (7300HQ, Full-HD) | |
| Gigabyte Sabre 15G | |
| HP Pavilion 15t-X7P42AV | |
| Asus ZenBook Pro UX550VD | |
| Asus VivoBook Pro 15 N580VD-DM028T | |
| 3DMark 11 Performance | 7558 punti | |
| 3DMark Cloud Gate Standard Score | 20059 punti | |
| 3DMark Fire Strike Score | 5452 punti | |
Aiuto | ||
| The Witcher 3 | |
| 1024x768 Low Graphics & Postprocessing (ordina per valore) | |
| Asus VivoBook Pro 15 N580VD-DM028T | |
| HP Pavilion 15t-X7P42AV | |
| Dell XPS 15 2017 9560 (7300HQ, Full-HD) | |
| 1366x768 Medium Graphics & Postprocessing (ordina per valore) | |
| Asus VivoBook Pro 15 N580VD-DM028T | |
| Asus ZenBook Pro UX550VD | |
| HP Pavilion 15t-X7P42AV | |
| Dell XPS 15 2017 9560 (7300HQ, Full-HD) | |
| 1920x1080 High Graphics & Postprocessing (Nvidia HairWorks Off) (ordina per valore) | |
| Asus VivoBook Pro 15 N580VD-DM028T | |
| Asus ZenBook Pro UX550VD | |
| Gigabyte Sabre 15G | |
| HP Pavilion 15t-X7P42AV | |
| Dell XPS 15 2017 9560 (7300HQ, Full-HD) | |
| basso | medio | alto | ultra | |
|---|---|---|---|---|
| The Witcher 3 (2015) | 111.4 | 69.8 | 31.02 | 20 |
| Rise of the Tomb Raider (2016) | 124.2 | 69.3 | 39.12 | 31.59 |
| Asus VivoBook Pro 15 N580VD-DM028T GeForce GTX 1050 Mobile, i7-7700HQ, Micron 1100 MTFDDAV256TBN | Asus ZenBook Pro UX550VD GeForce GTX 1050 Mobile, i7-7700HQ, Samsung PM961 NVMe MZVLW512HMJP | Gigabyte Sabre 15G GeForce GTX 1050 Mobile, i7-7700HQ, Liteonit CV3-8D128 | HP Pavilion 15t-X7P42AV GeForce GTX 1050 Mobile, i7-7700HQ, Samsung CM871a MZNTY128HDHP | Acer Aspire VX15 VX5-591G-589S GeForce GTX 1050 Mobile, i5-7300HQ, Hynix HFS128G39TND | Dell XPS 15 2017 9560 (7300HQ, Full-HD) GeForce GTX 1050 Mobile, i5-7300HQ, WDC WD10SPCX-75KHST0 + SanDisk Z400s M.2 2242 32 GB Cache | |
|---|---|---|---|---|---|---|
| Noise | 7% | -7% | -5% | 7% | -6% | |
| off /ambiente * (dB) | 30.5 | 29.4 4% | 28.2 8% | 29.3 4% | 30 2% | 30.3 1% |
| Idle Minimum * (dB) | 30.6 | 29.4 4% | 33 -8% | 32.3 -6% | 30 2% | 31.6 -3% |
| Idle Average * (dB) | 30.9 | 29.9 3% | 33.3 -8% | 32.3 -5% | 30 3% | 31.6 -2% |
| Idle Maximum * (dB) | 31.9 | 29.9 6% | 34.7 -9% | 32.4 -2% | 31.1 3% | 33.4 -5% |
| Load Average * (dB) | 38.6 | 38.3 1% | 44.5 -15% | 44.4 -15% | 31.3 19% | 47.8 -24% |
| Witcher 3 ultra * (dB) | 47.3 | 39.8 16% | 49.2 -4% | |||
| Load Maximum * (dB) | 45.7 | 39.6 13% | 52.8 -16% | 49.2 -8% | 38.9 15% | 47.8 -5% |
* ... Meglio usare valori piccoli
Rumorosità
| Idle |
| 30.6 / 30.9 / 31.9 dB(A) |
| HDD |
| 30.9 dB(A) |
| Sotto carico |
| 38.6 / 45.7 dB(A) |
 | ||
30 dB silenzioso 40 dB(A) udibile 50 dB(A) rumoroso |
||
min: | ||
(±) La temperatura massima sul lato superiore è di 41.8 °C / 107 F, rispetto alla media di 36.8 °C / 98 F, che varia da 21 a 71 °C per questa classe Multimedia.
(+) Il lato inferiore si riscalda fino ad un massimo di 36.8 °C / 98 F, rispetto alla media di 39.1 °C / 102 F
(+) In idle, la temperatura media del lato superiore è di 25.2 °C / 77 F, rispetto alla media deld ispositivo di 31.3 °C / 88 F.
(-) Riproducendo The Witcher 3, la temperatura media per il lato superiore e' di 38.8 °C / 102 F, rispetto alla media del dispositivo di 31.3 °C / 88 F.
(+) I poggiapolsi e il touchpad raggiungono la temperatura massima della pelle (34.8 °C / 94.6 F) e quindi non sono caldi.
(-) La temperatura media della zona del palmo della mano di dispositivi simili e'stata di 28.7 °C / 83.7 F (-6.1 °C / -10.9 F).
| Asus VivoBook Pro 15 N580VD-DM028T GeForce GTX 1050 Mobile, i7-7700HQ, Micron 1100 MTFDDAV256TBN | Asus ZenBook Pro UX550VD GeForce GTX 1050 Mobile, i7-7700HQ, Samsung PM961 NVMe MZVLW512HMJP | Gigabyte Sabre 15G GeForce GTX 1050 Mobile, i7-7700HQ, Liteonit CV3-8D128 | HP Pavilion 15t-X7P42AV GeForce GTX 1050 Mobile, i7-7700HQ, Samsung CM871a MZNTY128HDHP | Acer Aspire VX15 VX5-591G-589S GeForce GTX 1050 Mobile, i5-7300HQ, Hynix HFS128G39TND | Dell XPS 15 2017 9560 (7300HQ, Full-HD) GeForce GTX 1050 Mobile, i5-7300HQ, WDC WD10SPCX-75KHST0 + SanDisk Z400s M.2 2242 32 GB Cache | |
|---|---|---|---|---|---|---|
| Heat | -9% | -8% | 6% | -16% | -14% | |
| Maximum Upper Side * (°C) | 41.8 | 43.6 -4% | 43.6 -4% | 41.8 -0% | 47.2 -13% | 47.6 -14% |
| Maximum Bottom * (°C) | 36.8 | 44.5 -21% | 40.2 -9% | 33.4 9% | 42.2 -15% | 42.1 -14% |
| Idle Upper Side * (°C) | 26.2 | 28 -7% | 27.8 -6% | 24.4 7% | 31.8 -21% | 29.9 -14% |
| Idle Bottom * (°C) | 25.9 | 26.7 -3% | 29.2 -13% | 23.8 8% | 29.5 -14% | 29.8 -15% |
* ... Meglio usare valori piccoli
Asus VivoBook Pro 15 N580VD-DM028T analisi audio
(-) | altoparlanti non molto potenti (71.6 dB)
Bassi 100 - 315 Hz
(±) | bassi ridotti - in media 10.1% inferiori alla media
(±) | la linearità dei bassi è media (11.8% delta rispetto alla precedente frequenza)
Medi 400 - 2000 Hz
(+) | medi bilanciati - solo only 1.6% rispetto alla media
(+) | medi lineari (4.9% delta rispetto alla precedente frequenza)
Alti 2 - 16 kHz
(+) | Alti bilanciati - appena 1.3% dalla media
(+) | alti lineari (3% delta rispetto alla precedente frequenza)
Nel complesso 100 - 16.000 Hz
(+) | suono nel complesso lineare (9.3% differenza dalla media)
Rispetto alla stessa classe
» 13% di tutti i dispositivi testati in questa classe è stato migliore, 0% simile, 87% peggiore
» Il migliore ha avuto un delta di 5%, medio di 17%, peggiore di 45%
Rispetto a tutti i dispositivi testati
» 3% di tutti i dispositivi testati in questa classe è stato migliore, 1% similare, 96% peggiore
» Il migliore ha avuto un delta di 4%, medio di 24%, peggiore di 134%
Apple MacBook 12 (Early 2016) 1.1 GHz analisi audio
(+) | gli altoparlanti sono relativamente potenti (83.6 dB)
Bassi 100 - 315 Hz
(±) | bassi ridotti - in media 11.3% inferiori alla media
(±) | la linearità dei bassi è media (14.2% delta rispetto alla precedente frequenza)
Medi 400 - 2000 Hz
(+) | medi bilanciati - solo only 2.4% rispetto alla media
(+) | medi lineari (5.5% delta rispetto alla precedente frequenza)
Alti 2 - 16 kHz
(+) | Alti bilanciati - appena 2% dalla media
(+) | alti lineari (4.5% delta rispetto alla precedente frequenza)
Nel complesso 100 - 16.000 Hz
(+) | suono nel complesso lineare (10.2% differenza dalla media)
Rispetto alla stessa classe
» 7% di tutti i dispositivi testati in questa classe è stato migliore, 2% simile, 91% peggiore
» Il migliore ha avuto un delta di 5%, medio di 18%, peggiore di 53%
Rispetto a tutti i dispositivi testati
» 5% di tutti i dispositivi testati in questa classe è stato migliore, 1% similare, 94% peggiore
» Il migliore ha avuto un delta di 4%, medio di 24%, peggiore di 134%
| Off / Standby | |
| Idle | |
| Sotto carico |
|
Leggenda:
min: | |
| Asus VivoBook Pro 15 N580VD-DM028T i7-7700HQ, GeForce GTX 1050 Mobile, Micron 1100 MTFDDAV256TBN, TN, 1920x1080, 15.6" | Asus ZenBook Pro UX550VD i7-7700HQ, GeForce GTX 1050 Mobile, Samsung PM961 NVMe MZVLW512HMJP, IPS, 1920x1080, 15.6" | Gigabyte Sabre 15G i7-7700HQ, GeForce GTX 1050 Mobile, Liteonit CV3-8D128, IPS, 1920x1080, 15.6" | HP Pavilion 15t-X7P42AV i7-7700HQ, GeForce GTX 1050 Mobile, Samsung CM871a MZNTY128HDHP, IPS, 1920x1080, 15.6" | Acer Aspire VX15 VX5-591G-589S i5-7300HQ, GeForce GTX 1050 Mobile, Hynix HFS128G39TND, IPS, 1920x1080, 15.6" | Dell XPS 15 2017 9560 (7300HQ, Full-HD) i5-7300HQ, GeForce GTX 1050 Mobile, WDC WD10SPCX-75KHST0 + SanDisk Z400s M.2 2242 32 GB Cache, LED IGZO IPS InfinityEdge, 1920x1080, 15.6" | |
|---|---|---|---|---|---|---|
| Power Consumption | -2% | -14% | -19% | -27% | -12% | |
| Idle Minimum * (Watt) | 4.7 | 5.05 -7% | 8 -70% | 8.29 -76% | 8.4 -79% | 6.6 -40% |
| Idle Average * (Watt) | 7.7 | 8.2 -6% | 10.9 -42% | 8.9 -16% | 13.1 -70% | 9 -17% |
| Idle Maximum * (Watt) | 10.9 | 12.2 -12% | 11 -1% | 10.2 6% | 14.2 -30% | 10.7 2% |
| Load Average * (Watt) | 82 | 82 -0% | 76.7 6% | 77.1 6% | 50 39% | 77.5 5% |
| Witcher 3 ultra * (Watt) | 109 | 93.1 15% | 94.9 13% | |||
| Load Maximum * (Watt) | 120 | 120 -0% | 106.4 11% | 136.6 -14% | 111 7% | 130 -8% |
* ... Meglio usare valori piccoli
| Asus VivoBook Pro 15 N580VD-DM028T i7-7700HQ, GeForce GTX 1050 Mobile, 47 Wh | Asus ZenBook Pro UX550VD i7-7700HQ, GeForce GTX 1050 Mobile, 73 Wh | Gigabyte Sabre 15G i7-7700HQ, GeForce GTX 1050 Mobile, 47 Wh | HP Pavilion 15t-X7P42AV i7-7700HQ, GeForce GTX 1050 Mobile, 63.3 Wh | Acer Aspire VX15 VX5-591G-589S i5-7300HQ, GeForce GTX 1050 Mobile, 52.5 Wh | Dell XPS 15 2017 9560 (7300HQ, Full-HD) i5-7300HQ, GeForce GTX 1050 Mobile, 56 Wh | |
|---|---|---|---|---|---|---|
| Autonomia della batteria | 32% | -20% | 31% | -15% | -7% | |
| Reader / Idle (h) | 10.2 | 17.7 74% | 8.2 -20% | 16 57% | 9.4 -8% | |
| H.264 (h) | 5.9 | 7.8 32% | ||||
| WiFi v1.3 (h) | 6.5 | 8.9 37% | 4.4 -32% | 6.5 0% | 5.5 -15% | 5.6 -14% |
| Load (h) | 1.4 | 1.2 -14% | 1.3 -7% | 1.9 36% | 1.4 0% | |
| Witcher 3 ultra (h) | 1.1 |
Pro
Contro

L'Asus VivoBook Pro 15 ha uno chassis elegante e convince con la sua efficienza in idle, un buon peso, e temperature adeguate.
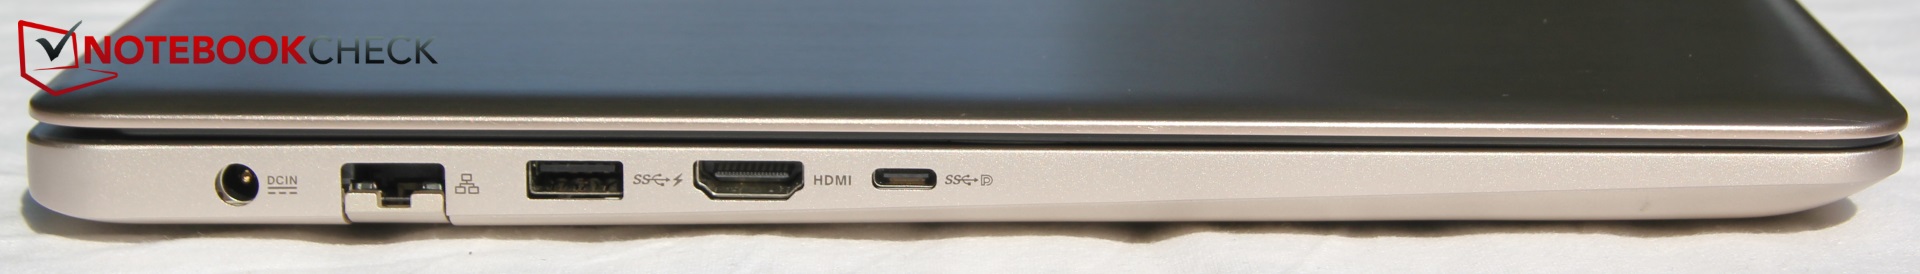
Ma abbiamo qualche problema a raccomandare il VivoBook, in quanto ci sono delle pecche, il throttling estremo con la batteria, e la ventola che pulsa. Questi problemi potrebbero essere risolti con aggiornamenti software. Tuttavia, anche il display resta dietro la concorrenza e la selezione di porte è scarsa. Si tratta in questo caso di uno dei dispositivi più costosi.
Attualmente, gli aspetti negativi definiscono l'impressione complessiva. Non sembra un problema del laptop, ma piuttosto del firmware. Asus dovrebbe risolvere velocemente, così il VivoBook potrebbe essere un buon portatile. Pensiamo anche che il prezzo attualmente sia troppo alto, e alcuni concorrenti sono più economici.
L'Asus VivoBook Pro 15 deve risolvere qualche bug come le latenze, il quando si usa la batteria, e il comportamento della ventola. Inoltre il pannello TN lascia a desiderare, pertanto il prezzo attuale non è giustificato.
Nota: si tratta di una recensione breve, con alcune sezioni non tradotte, per la versione integrale in inglese guardate qui.
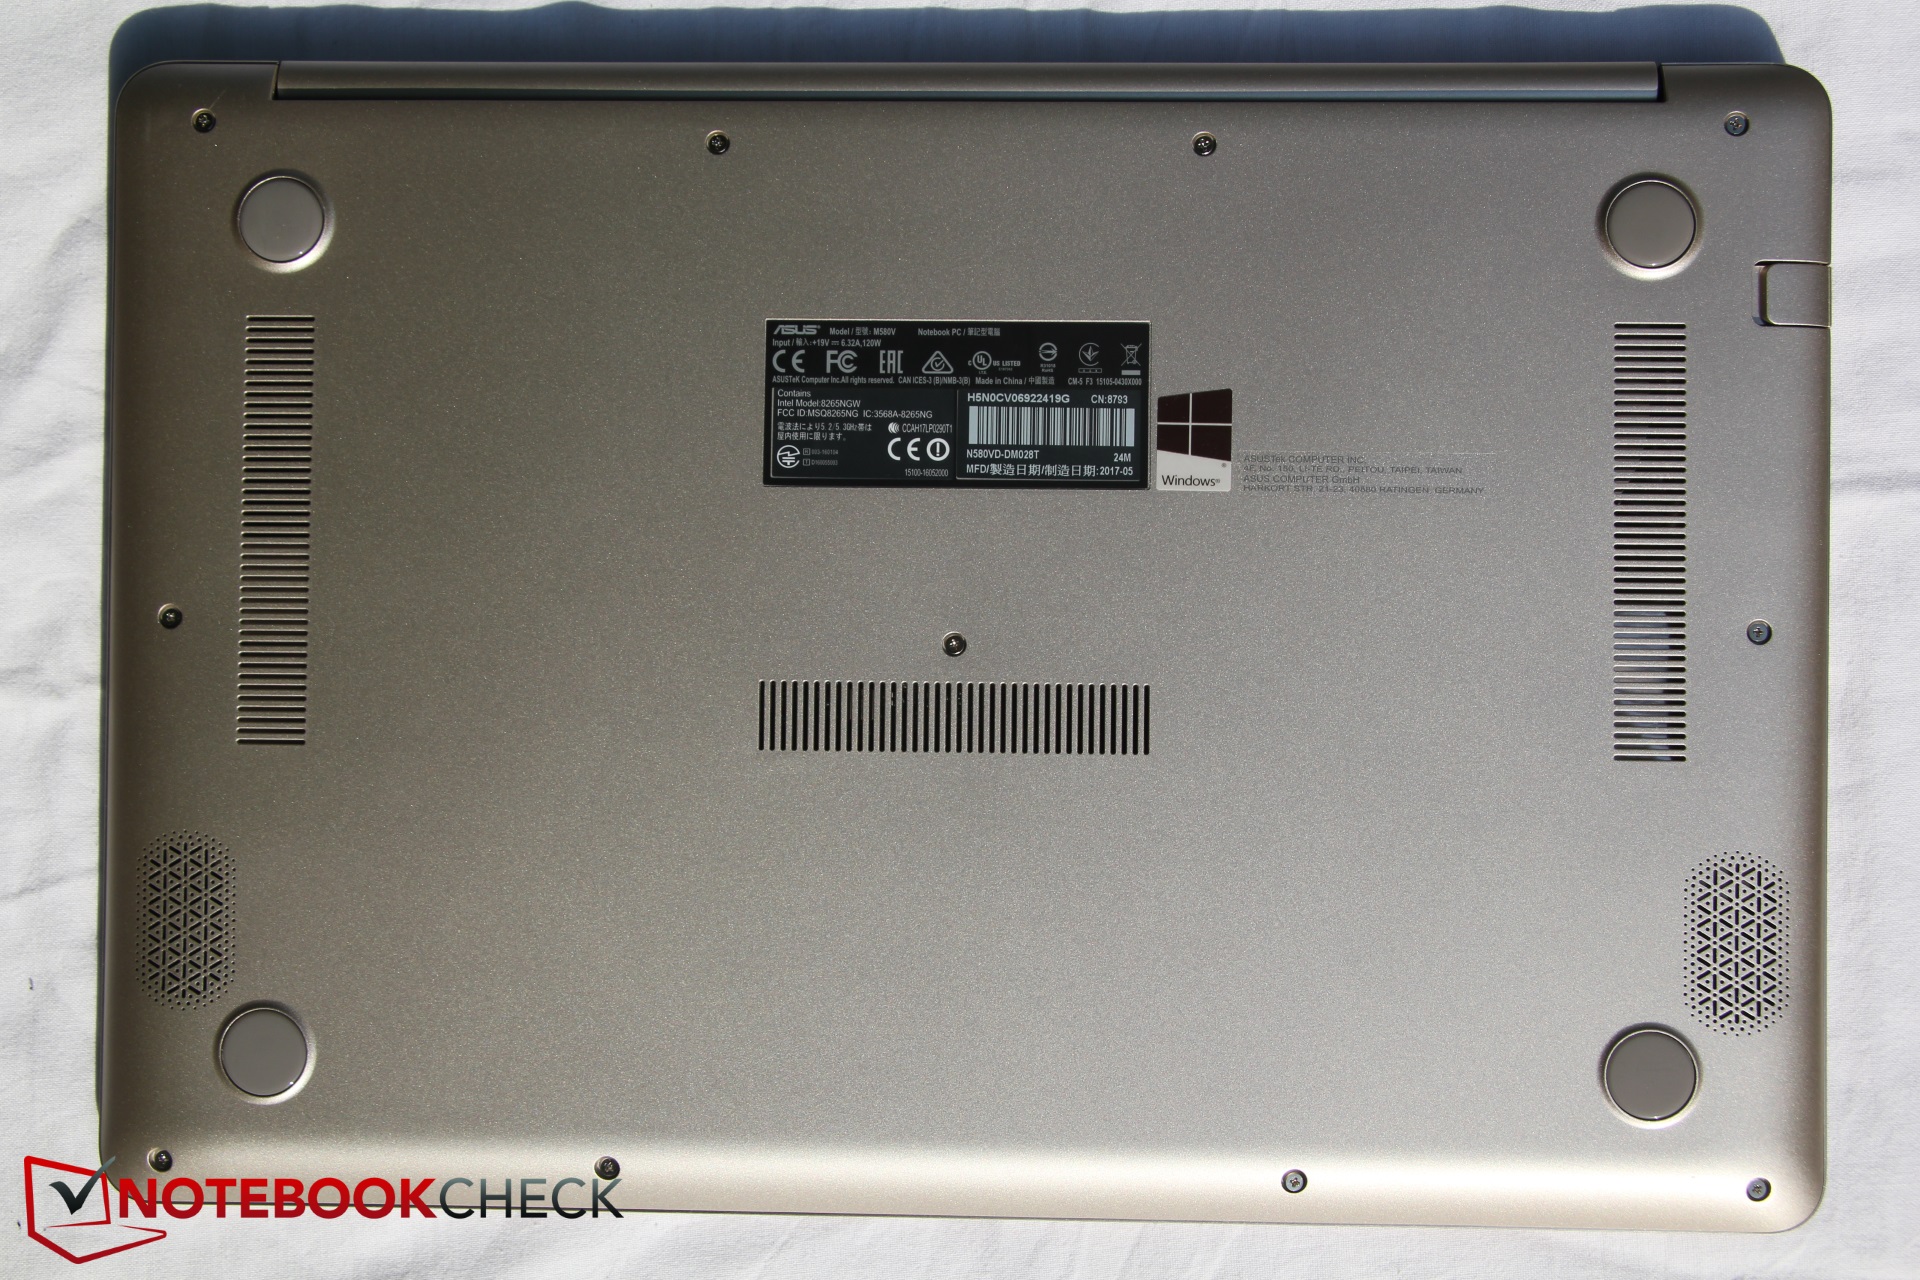
Asus VivoBook Pro 15 N580VD-DM028T
- 10/09/2017 v6 (old)
Christian Hintze
Price comparison
