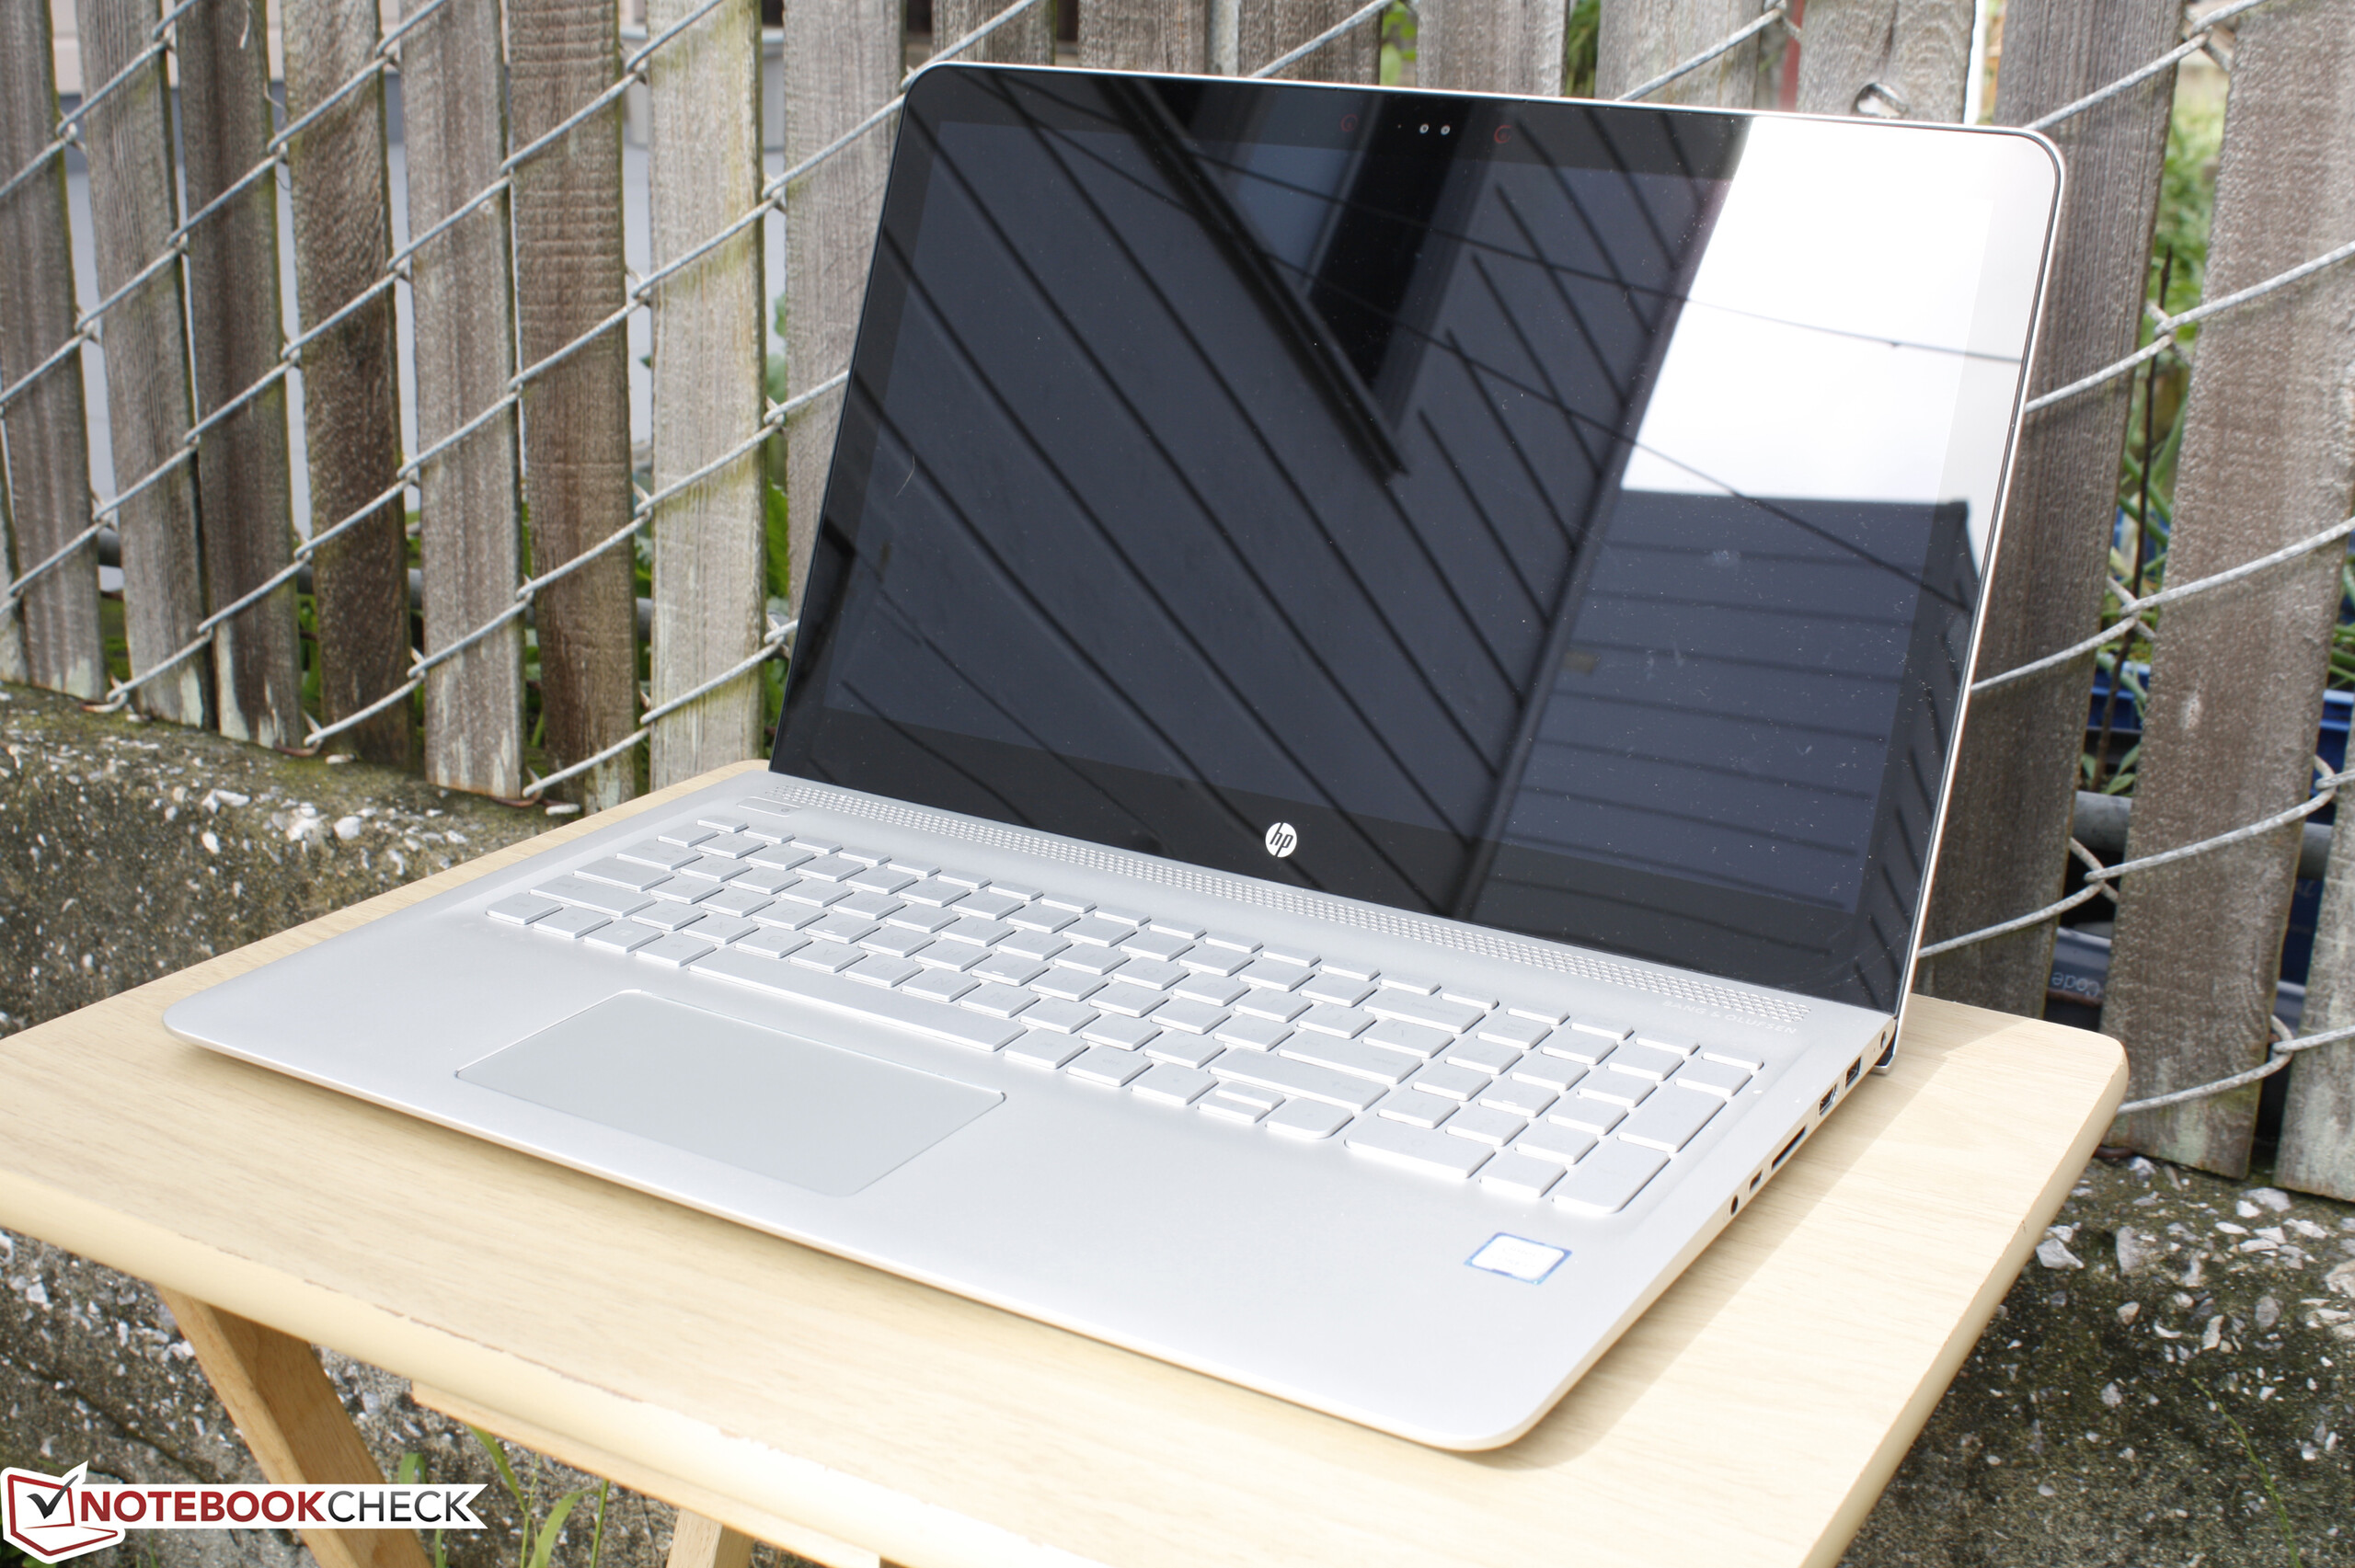
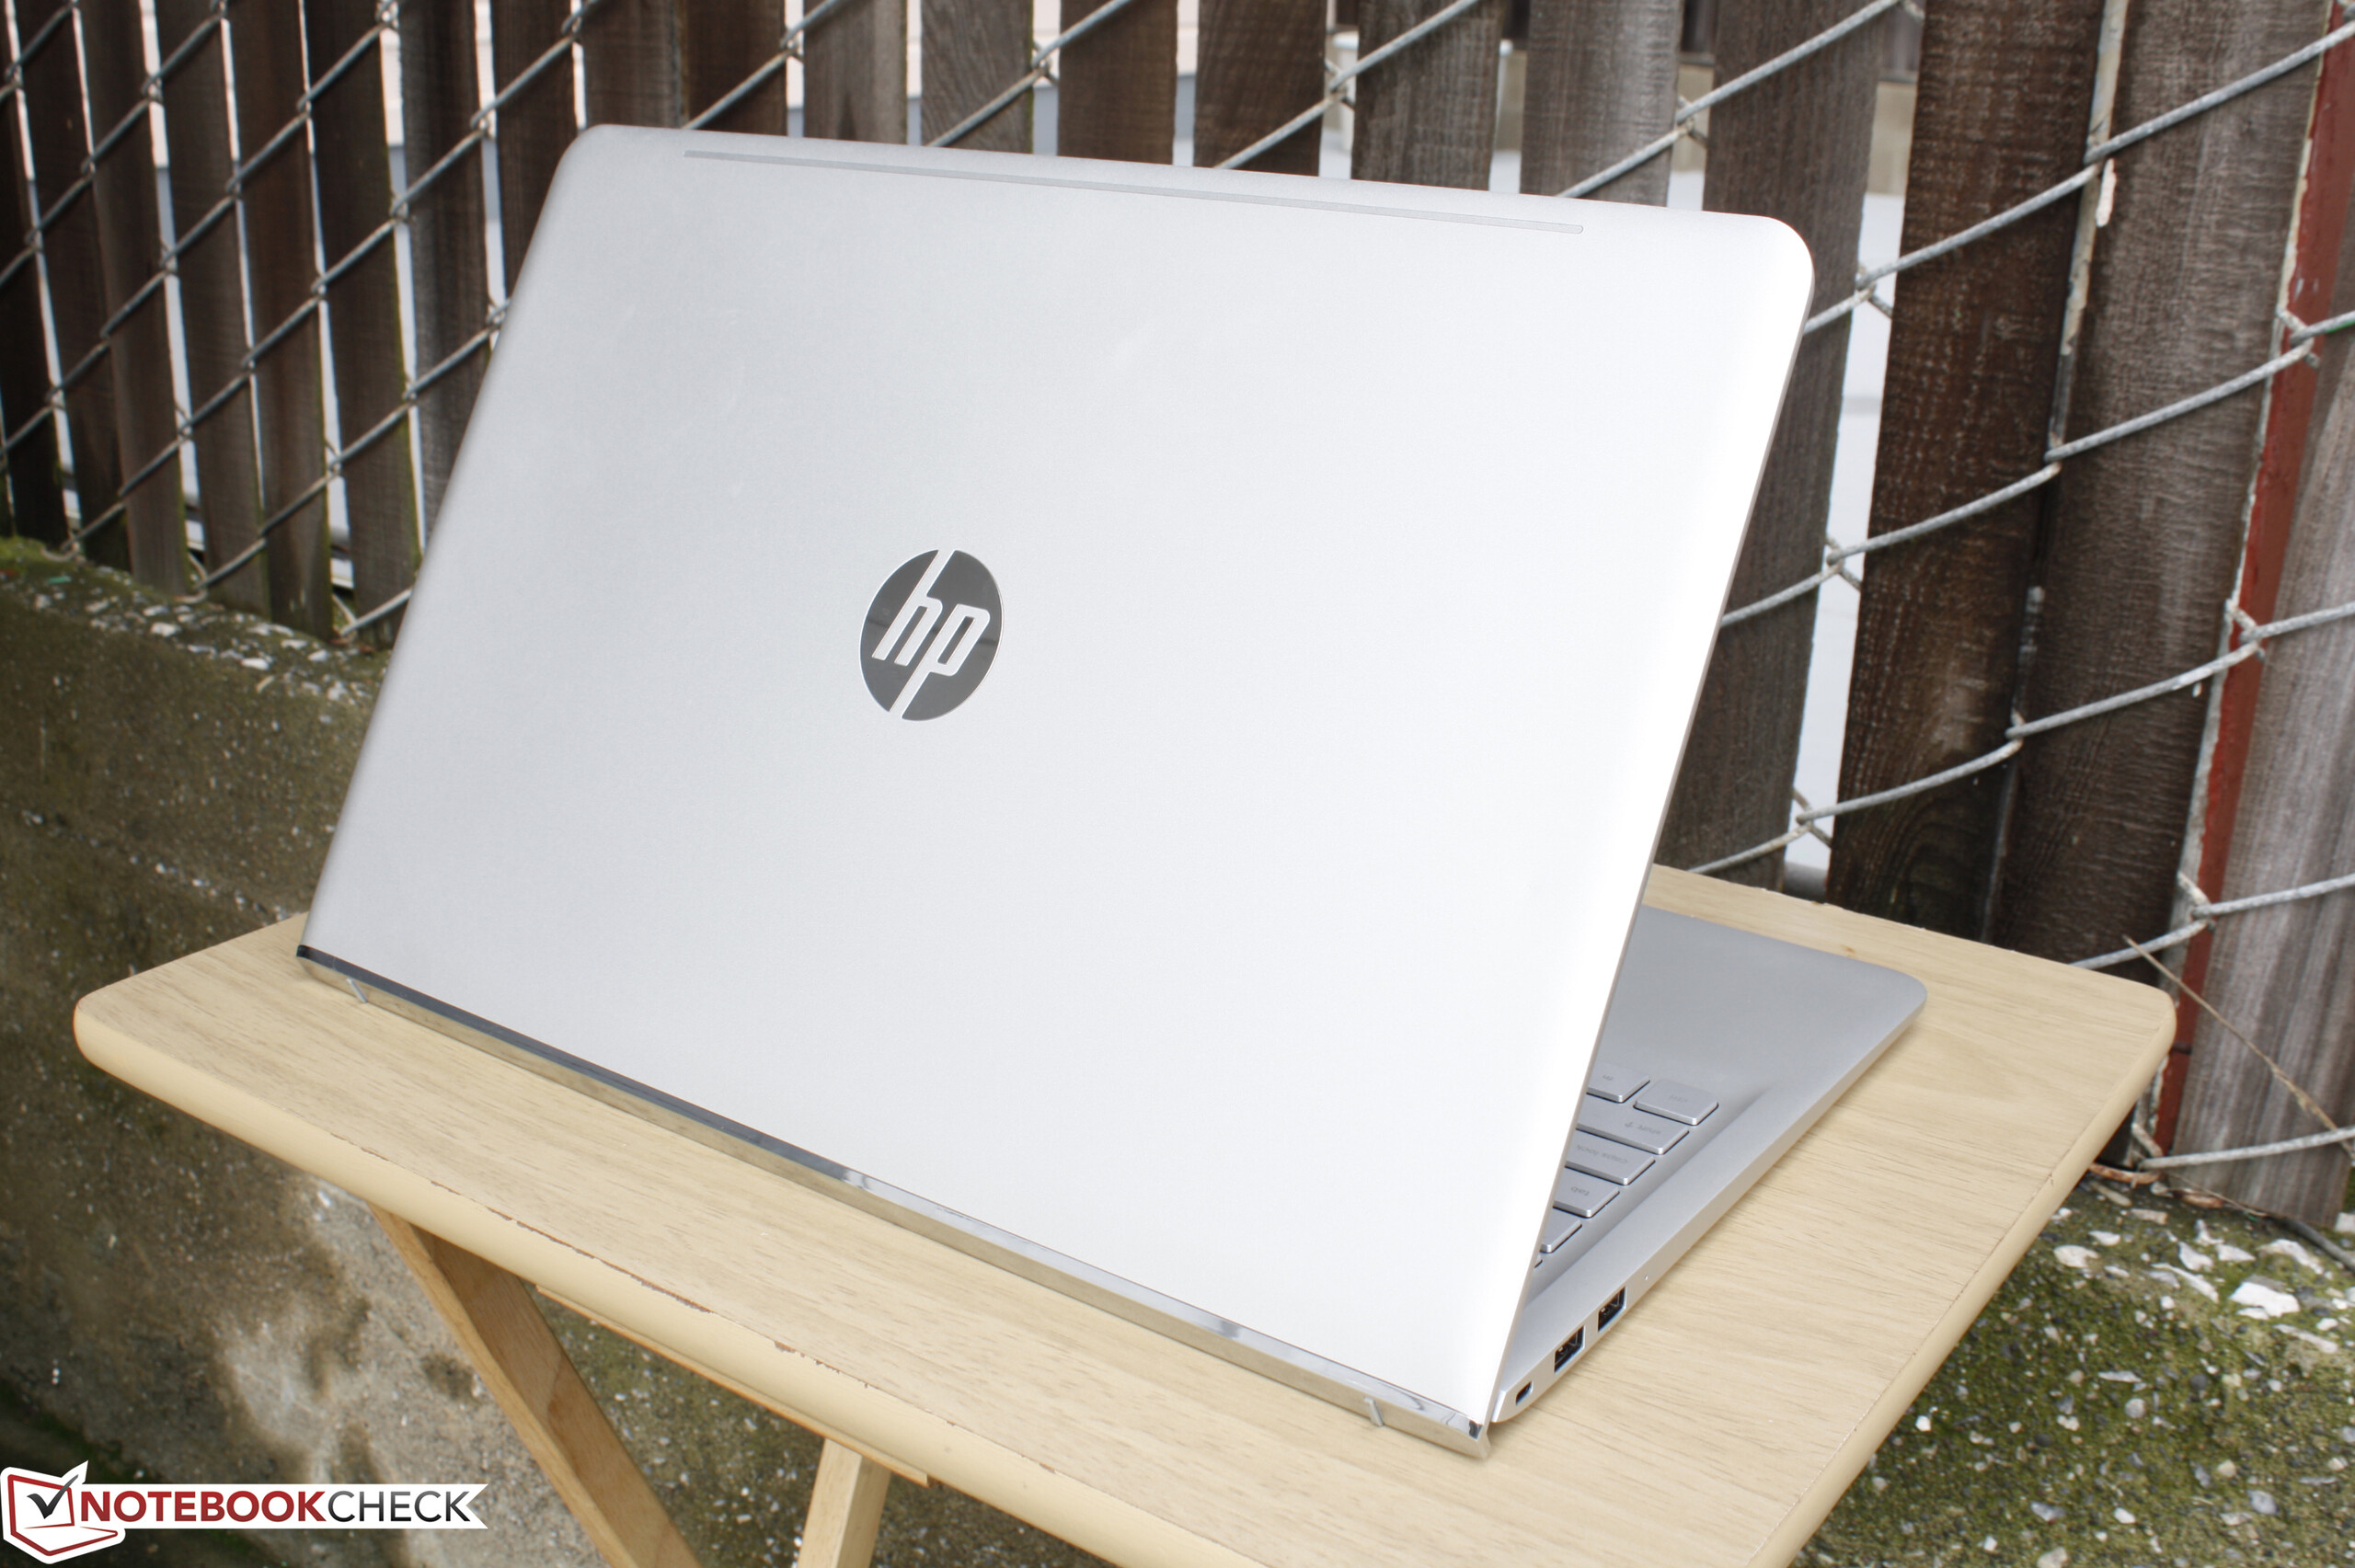
Recensione breve del portatile HP Envy 15 as133cl


| SD Card Reader | |
| average JPG Copy Test (av. of 3 runs) | |
| Dell XPS 13 9360 FHD i5 | |
| HP Envy 15-as133cl | |
| HP 17-y044ng | |
| maximum AS SSD Seq Read Test (1GB) | |
| Dell XPS 13 9360 FHD i5 | |
| HP Envy 15-as133cl | |
| HP 17-y044ng | |
| Networking | |
| iperf3 transmit AX12 | |
| Dell XPS 13 9360 FHD i5 | |
| HP Envy 15-as133cl | |
| HP 15-ba077ng | |
| iperf3 receive AX12 | |
| HP Envy 15-as133cl | |
| Dell XPS 13 9360 FHD i5 | |
| HP 15-ba077ng | |
| |||||||||||||||||||||||||
Distribuzione della luminosità: 83 %
Al centro con la batteria: 262.3 cd/m²
Contrasto: 1093:1 (Nero: 0.24 cd/m²)
ΔE ColorChecker Calman: 5 | ∀{0.5-29.43 Ø4.71}
ΔE Greyscale Calman: 3.2 | ∀{0.09-98 Ø4.96}
63.5% sRGB (Argyll 1.6.3 3D)
40.5% AdobeRGB 1998 (Argyll 1.6.3 3D)
44.41% AdobeRGB 1998 (Argyll 3D)
64.3% sRGB (Argyll 3D)
42.95% Display P3 (Argyll 3D)
Gamma: 2.45
CCT: 6817 K
| HP Envy 15-as133cl Chi Mei CMN15D8, IPS, 15.6", 1920x1080 | Dell XPS 15 2017 9560 (7300HQ, Full-HD) Sharp SHP1453 LQ156M1, LED IGZO IPS InfinityEdge, 15.6", 1920x1080 | HP 15-ba077ng BOE, TN LED, 15.6", 1920x1080 | Acer Aspire E15 E5-553G-109A Chi Mei CMN15C4 / N156HGE-EAB, TN LED, 15.6", 1920x1080 | HP Pavilion 15t-au100 CTO (W0P31AV) BOE0693, IPS, 15.6", 1920x1080 | Lenovo Ideapad 310-15IKB BOE NT156FHM-N31, TN LED, 15.6", 1920x1080 | |
|---|---|---|---|---|---|---|
| Display | 58% | -7% | -8% | 1% | -11% | |
| Display P3 Coverage (%) | 42.95 | 68.9 60% | 39.98 -7% | 39.72 -8% | 43.27 1% | 38.07 -11% |
| sRGB Coverage (%) | 64.3 | 98.9 54% | 60.2 -6% | 59.2 -8% | 64.9 1% | 57.3 -11% |
| AdobeRGB 1998 Coverage (%) | 44.41 | 70.9 60% | 41.31 -7% | 41.07 -8% | 44.71 1% | 39.34 -11% |
| Response Times | -49% | 16% | 28% | -4% | 17% | |
| Response Time Grey 50% / Grey 80% * (ms) | 44.4 ? | 54 ? -22% | 42 ? 5% | 42.4 ? 5% | 42 ? 5% | 43 ? 3% |
| Response Time Black / White * (ms) | 30 ? | 52.4 ? -75% | 22 ? 27% | 14.6 ? 51% | 33.6 ? -12% | 21 ? 30% |
| PWM Frequency (Hz) | 1000 ? | 50 ? | 28740 | 198.4 | ||
| Screen | 19% | -71% | -54% | -10% | -33% | |
| Brightness middle (cd/m²) | 262.3 | 400 52% | 209 -20% | 224 -15% | 186.5 -29% | 185 -29% |
| Brightness (cd/m²) | 240 | 392 63% | 200 -17% | 201 -16% | 174 -27% | 184 -23% |
| Brightness Distribution (%) | 83 | 89 7% | 88 6% | 75 -10% | 69 -17% | 95 14% |
| Black Level * (cd/m²) | 0.24 | 0.26 -8% | 0.56 -133% | 0.46 -92% | 0.18 25% | 0.28 -17% |
| Contrast (:1) | 1093 | 1538 41% | 373 -66% | 487 -55% | 1036 -5% | 661 -40% |
| Colorchecker dE 2000 * | 5 | 4.9 2% | 12.21 -144% | 10.5 -110% | 5.7 -14% | 8.07 -61% |
| Colorchecker dE 2000 max. * | 20.6 | 11 47% | 20.66 -0% | 16.8 18% | 22.5 -9% | 14.83 28% |
| Greyscale dE 2000 * | 3.2 | 7.2 -125% | 13.48 -321% | 11.23 -251% | 4.4 -38% | 8.83 -176% |
| Gamma | 2.45 90% | 2.11 104% | 2.34 94% | 2.12 104% | 2.35 94% | 2.47 89% |
| CCT | 6817 95% | 6911 94% | 15364 42% | 11096 59% | 6963 93% | 10628 61% |
| Color Space (Percent of AdobeRGB 1998) (%) | 40.5 | 64.2 59% | 38 -6% | 38 -6% | 44.71 10% | 36.2 -11% |
| Color Space (Percent of sRGB) (%) | 63.5 | 98.9 56% | 60 -6% | 59 -7% | 64.95 2% | 57 -10% |
| Media totale (Programma / Settaggio) | 9% /
18% | -21% /
-46% | -11% /
-34% | -4% /
-7% | -9% /
-22% |
* ... Meglio usare valori piccoli
Tempi di risposta del Display
| ↔ Tempi di risposta dal Nero al Bianco | ||
|---|---|---|
| 30 ms ... aumenta ↗ e diminuisce ↘ combinato | ↗ 6.4 ms Incremento | 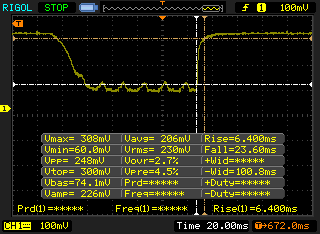 |
| ↘ 23.6 ms Calo | ||
| Lo schermo mostra tempi di risposta lenti nei nostri tests e sarà insoddisfacente per i gamers. In confronto, tutti i dispositivi di test variano da 0.1 (minimo) a 240 (massimo) ms. » 80 % di tutti i dispositivi è migliore. Questo significa che i tempi di risposta rilevati sono peggiori rispetto alla media di tutti i dispositivi testati (19.8 ms). | ||
| ↔ Tempo di risposta dal 50% Grigio all'80% Grigio | ||
| 44.4 ms ... aumenta ↗ e diminuisce ↘ combinato | ↗ 16 ms Incremento | 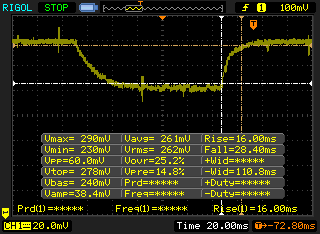 |
| ↘ 28.4 ms Calo | ||
| Lo schermo mostra tempi di risposta lenti nei nostri tests e sarà insoddisfacente per i gamers. In confronto, tutti i dispositivi di test variano da 0.165 (minimo) a 636 (massimo) ms. » 76 % di tutti i dispositivi è migliore. Questo significa che i tempi di risposta rilevati sono peggiori rispetto alla media di tutti i dispositivi testati (30.9 ms). | ||
Sfarfallio dello schermo / PWM (Pulse-Width Modulation)
| flickering dello schermo / PWM rilevato | 1000 Hz | ≤ 99 % settaggio luminosita' | 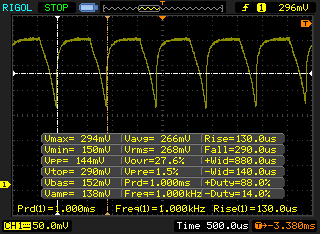 |
Il display sfarfalla a 1000 Hz (Probabilmente a causa dell'uso di PWM) Flickering rilevato ad una luminosita' di 99 % o inferiore. Non dovrebbe verificarsi flickering o PWM sopra questo valore di luminosita'. La frequenza di 1000 Hz è abbastanza alta, quindi la maggioranza degli utenti sensibili al PWM non dovrebbero notare alcun flickering. In confronto: 52 % di tutti i dispositivi testati non utilizza PWM per ridurre la luminosita' del display. Se è rilevato PWM, una media di 7741 (minimo: 5 - massimo: 343500) Hz è stata rilevata. | |||
| wPrime 2.10 - 1024m | |
| Lenovo Y40-59423035 | |
| Fujitsu LifeBook A557 PL | |
| HP Envy 15-as133cl | |
* ... Meglio usare valori piccoli
| PCMark 8 | |
| Home Score Accelerated v2 | |
| Dell Inspiron 15 5000 5567-1753 | |
| HP Envy 15-as133cl | |
| Asus Zenbook UX310UQ-GL011T | |
| Acer TravelMate P249-M-5452 | |
| Work Score Accelerated v2 | |
| Dell Inspiron 15 5000 5567-1753 | |
| Asus Zenbook UX310UQ-GL011T | |
| HP Envy 15-as133cl | |
| Acer TravelMate P249-M-5452 | |
| Creative Score Accelerated v2 | |
| Dell Inspiron 15 5000 5567-1753 | |
| Asus Zenbook UX310UQ-GL011T | |
| HP Envy 15-as133cl | |
| Acer TravelMate P249-M-5452 | |
| PCMark 8 Home Score Accelerated v2 | 3809 punti | |
| PCMark 8 Creative Score Accelerated v2 | 4361 punti | |
| PCMark 8 Work Score Accelerated v2 | 4594 punti | |
Aiuto | ||
| HP Envy 15-as133cl HGST Travelstar 5K1000 HTS541010A7E630 | Dell XPS 15 2017 9560 (7300HQ, Full-HD) WDC WD10SPCX-75KHST0 + SanDisk Z400s M.2 2242 32 GB Cache | HP 15-ba077ng SanDisk Z400s SD8SNAT-256G | Acer Aspire E15 E5-553G-109A Liteonit CV3-8D128 | HP Pavilion 15t-au100 CTO (W0P31AV) Toshiba MQ01ABD100 | |
|---|---|---|---|---|---|
| CrystalDiskMark 3.0 | 1425% | 5547% | 5871% | 1% | |
| Read Seq (MB/s) | 103.2 | 123 19% | 447.4 334% | 348.6 238% | 109.5 6% |
| Write Seq (MB/s) | 102.6 | 74.2 -28% | 243.3 137% | 311.8 204% | 105.2 3% |
| Read 512 (MB/s) | 31.46 | 101.7 223% | 333.4 960% | 295.9 841% | 34.08 8% |
| Write 512 (MB/s) | 46.3 | 42.51 -8% | 283.1 511% | 185.8 301% | 40.02 -14% |
| Read 4k (MB/s) | 0.366 | 10.84 2862% | 20.99 5635% | 23.76 6392% | 0.429 17% |
| Write 4k (MB/s) | 1.008 | 1.021 1% | 62.7 6120% | 44.94 4358% | 1.008 0% |
| Read 4k QD32 (MB/s) | 0.828 | 69.8 8330% | 143.1 17183% | 171.6 20625% | 0.81 -2% |
| Write 4k QD32 (MB/s) | 1.015 | 1.057 4% | 138 13496% | 143.2 14008% | 0.893 -12% |

| 3DMark 11 | |
| 1280x720 Performance GPU | |
| Acer Aspire V3-572PG-604M | |
| Asus Zenbook UX310UQ-GL011T | |
| Dell Inspiron 15 5000 5567-1753 | |
| HP 250 G4 T6P08ES | |
| Lenovo U31-70 80M5003EGE | |
| HP Envy 15-as133cl | |
| Fujitsu LifeBook A557 PL | |
| Acer TravelMate P249-M-5452 | |
| 1280x720 Performance Combined | |
| Dell Inspiron 15 5000 5567-1753 | |
| Asus Zenbook UX310UQ-GL011T | |
| Acer Aspire V3-572PG-604M | |
| HP Envy 15-as133cl | |
| HP 250 G4 T6P08ES | |
| Lenovo U31-70 80M5003EGE | |
| Acer TravelMate P249-M-5452 | |
| Fujitsu LifeBook A557 PL | |
| 3DMark | |
| 1280x720 Cloud Gate Standard Graphics | |
| Dell Inspiron 15 5000 5567-1753 | |
| Acer Aspire V3-572PG-604M | |
| HP Envy 15-as133cl | |
| Asus Zenbook UX310UQ-GL011T | |
| Lenovo U31-70 80M5003EGE | |
| Fujitsu LifeBook A557 PL | |
| Acer TravelMate P249-M-5452 | |
| HP 250 G4 T6P08ES | |
| 1920x1080 Fire Strike Graphics | |
| Acer Aspire V3-572PG-604M | |
| Asus Zenbook UX310UQ-GL011T | |
| Dell Inspiron 15 5000 5567-1753 | |
| Lenovo U31-70 80M5003EGE | |
| HP 250 G4 T6P08ES | |
| HP Envy 15-as133cl | |
| Fujitsu LifeBook A557 PL | |
| Acer TravelMate P249-M-5452 | |
| 1920x1080 Ice Storm Extreme Graphics | |
| HP Envy 15-as133cl | |
| Asus Zenbook UX310UQ-GL011T | |
| Dell Inspiron 15 5000 5567-1753 | |
| Acer TravelMate P249-M-5452 | |
| 3DMark 11 Performance | 1780 punti | |
| 3DMark Ice Storm Standard Score | 72759 punti | |
| 3DMark Cloud Gate Standard Score | 6756 punti | |
| 3DMark Fire Strike Score | 929 punti | |
| 3DMark Fire Strike Extreme Score | 427 punti | |
Aiuto | ||
| basso | medio | alto | ultra | |
|---|---|---|---|---|
| BioShock Infinite (2013) | 52.7 | 30.7 | 26.4 | 8.3 |
| Rise of the Tomb Raider (2016) | 20.2 | 12.1 | ||
| Overwatch (2016) | 49.5 | 35.1 |
Rumorosità
| Idle |
| 32.5 / 32.5 / 32.5 dB(A) |
| HDD |
| 33.8 dB(A) |
| Sotto carico |
| 38.7 / 32.5 dB(A) |
 | ||
30 dB silenzioso 40 dB(A) udibile 50 dB(A) rumoroso |
||
min: | ||
| HP Envy 15-as133cl HD Graphics 620, i7-7500U, HGST Travelstar 5K1000 HTS541010A7E630 | Dell XPS 15 2017 9560 (7300HQ, Full-HD) GeForce GTX 1050 Mobile, i5-7300HQ, WDC WD10SPCX-75KHST0 + SanDisk Z400s M.2 2242 32 GB Cache | HP 15-ba077ng Radeon R7 (Bristol Ridge), A12-9700P, SanDisk Z400s SD8SNAT-256G | Acer Aspire E15 E5-553G-109A Radeon R8 M445DX, A12-9700P, Liteonit CV3-8D128 | HP Pavilion 15t-au100 CTO (W0P31AV) GeForce 940MX, i7-7500U, Toshiba MQ01ABD100 | Lenovo Ideapad 310-15IKB HD Graphics 620, i5-7200U, Hynix HFS128G3MND | |
|---|---|---|---|---|---|---|
| Noise | -12% | 4% | 3% | -7% | 1% | |
| off /ambiente * (dB) | 30 | 30.3 -1% | 30.6 -2% | 30.5 -2% | 29 3% | |
| Idle Minimum * (dB) | 32.5 | 31.6 3% | 31.5 3% | 31.4 3% | 32.2 1% | 30.6 6% |
| Idle Average * (dB) | 32.5 | 31.6 3% | 31.8 2% | 31.4 3% | 32.2 1% | 30.6 6% |
| Idle Maximum * (dB) | 32.5 | 33.4 -3% | 31.8 2% | 31.9 2% | 33.7 -4% | 30.6 6% |
| Load Average * (dB) | 38.7 | 47.8 -24% | 31.4 19% | 33.7 13% | 39.4 -2% | 36.8 5% |
| Load Maximum * (dB) | 32.5 | 47.8 -47% | 33.4 -3% | 33.8 -4% | 42.2 -30% | 38.2 -18% |
| Witcher 3 ultra * (dB) | 40.6 |
* ... Meglio usare valori piccoli
(+) La temperatura massima sul lato superiore è di 35.6 °C / 96 F, rispetto alla media di 36.8 °C / 98 F, che varia da 21 a 71 °C per questa classe Multimedia.
(+) Il lato inferiore si riscalda fino ad un massimo di 39.4 °C / 103 F, rispetto alla media di 39.1 °C / 102 F
(+) In idle, la temperatura media del lato superiore è di 23 °C / 73 F, rispetto alla media deld ispositivo di 31.3 °C / 88 F.
(+) I poggiapolsi e il touchpad sono piu' freddi della temperatura della pelle con un massimo di 24.6 °C / 76.3 F e sono quindi freddi al tatto.
(+) La temperatura media della zona del palmo della mano di dispositivi simili e'stata di 28.7 °C / 83.7 F (+4.1 °C / 7.4 F).
HP Envy 15-as133cl analisi audio
(±) | potenza degli altiparlanti media ma buona (77.2 dB)
Bassi 100 - 315 Hz
(-) | quasi nessun basso - in media 16.6% inferiori alla media
(±) | la linearità dei bassi è media (13.8% delta rispetto alla precedente frequenza)
Medi 400 - 2000 Hz
(+) | medi bilanciati - solo only 1.9% rispetto alla media
(+) | medi lineari (4.3% delta rispetto alla precedente frequenza)
Alti 2 - 16 kHz
(+) | Alti bilanciati - appena 2.6% dalla media
(±) | la linearità degli alti è media (9.8% delta rispetto alla precedente frequenza)
Nel complesso 100 - 16.000 Hz
(±) | la linearità complessiva del suono è media (20% di differenza rispetto alla media
Rispetto alla stessa classe
» 66% di tutti i dispositivi testati in questa classe è stato migliore, 8% simile, 26% peggiore
» Il migliore ha avuto un delta di 5%, medio di 17%, peggiore di 45%
Rispetto a tutti i dispositivi testati
» 51% di tutti i dispositivi testati in questa classe è stato migliore, 8% similare, 40% peggiore
» Il migliore ha avuto un delta di 4%, medio di 23%, peggiore di 134%
Apple MacBook 12 (Early 2016) 1.1 GHz analisi audio
(+) | gli altoparlanti sono relativamente potenti (83.6 dB)
Bassi 100 - 315 Hz
(±) | bassi ridotti - in media 11.3% inferiori alla media
(±) | la linearità dei bassi è media (14.2% delta rispetto alla precedente frequenza)
Medi 400 - 2000 Hz
(+) | medi bilanciati - solo only 2.4% rispetto alla media
(+) | medi lineari (5.5% delta rispetto alla precedente frequenza)
Alti 2 - 16 kHz
(+) | Alti bilanciati - appena 2% dalla media
(+) | alti lineari (4.5% delta rispetto alla precedente frequenza)
Nel complesso 100 - 16.000 Hz
(+) | suono nel complesso lineare (10.2% differenza dalla media)
Rispetto alla stessa classe
» 7% di tutti i dispositivi testati in questa classe è stato migliore, 2% simile, 90% peggiore
» Il migliore ha avuto un delta di 5%, medio di 18%, peggiore di 53%
Rispetto a tutti i dispositivi testati
» 5% di tutti i dispositivi testati in questa classe è stato migliore, 1% similare, 94% peggiore
» Il migliore ha avuto un delta di 4%, medio di 23%, peggiore di 134%
| Off / Standby | |
| Idle | |
| Sotto carico |
|
Leggenda:
min: | |
| HP Envy 15-as133cl | Dell XPS 15 2017 9560 (7300HQ, Full-HD) | HP 15-ba077ng | Acer Aspire E15 E5-553G-109A | HP Pavilion 15t-au100 CTO (W0P31AV) | Lenovo Ideapad 310-15IKB | |
|---|---|---|---|---|---|---|
| Power Consumption | -145% | -7% | -76% | -56% | -7% | |
| Idle Minimum * (Watt) | 4.6 | 6.6 -43% | 4.4 4% | 7.2 -57% | 6.16 -34% | 3.5 24% |
| Idle Average * (Watt) | 7.7 | 9 -17% | 6.8 12% | 10.3 -34% | 8.48 -10% | 6.1 21% |
| Idle Maximum * (Watt) | 7.8 | 10.7 -37% | 8.9 -14% | 11.9 -53% | 9.62 -23% | 7 10% |
| Load Average * (Watt) | 30.5 | 77.5 -154% | 30.9 -1% | 48.2 -58% | 41.63 -36% | 31.2 -2% |
| Load Maximum * (Watt) | 22.7 | 130 -473% | 31 -37% | 63 -178% | 63.22 -179% | 42.9 -89% |
| Witcher 3 ultra * (Watt) | 51.8 |
* ... Meglio usare valori piccoli
| HP Envy 15-as133cl i7-7500U, HD Graphics 620, 52 Wh | Dell XPS 15 2017 9560 (7300HQ, Full-HD) i5-7300HQ, GeForce GTX 1050 Mobile, 56 Wh | HP 15-ba077ng A12-9700P, Radeon R7 (Bristol Ridge), 41 Wh | Acer Aspire E15 E5-553G-109A A12-9700P, Radeon R8 M445DX, 40 Wh | HP Pavilion 15t-au100 CTO (W0P31AV) i7-7500U, GeForce 940MX, 41 Wh | Lenovo Ideapad 310-15IKB i5-7200U, HD Graphics 620, 30 Wh | |
|---|---|---|---|---|---|---|
| Autonomia della batteria | -1% | 14% | -33% | -7% | -7% | |
| Reader / Idle (h) | 9.6 | 9.4 -2% | 12.4 29% | 6 -37% | 7.3 -24% | 10.2 6% |
| WiFi v1.3 (h) | 6.8 | 5.6 -18% | 4.9 -28% | 4.3 -37% | 3.7 -46% | 3.8 -44% |
| Load (h) | 1.2 | 1.4 17% | 1.7 42% | 0.9 -25% | 1.8 50% | 1.4 17% |
Pro
Contro
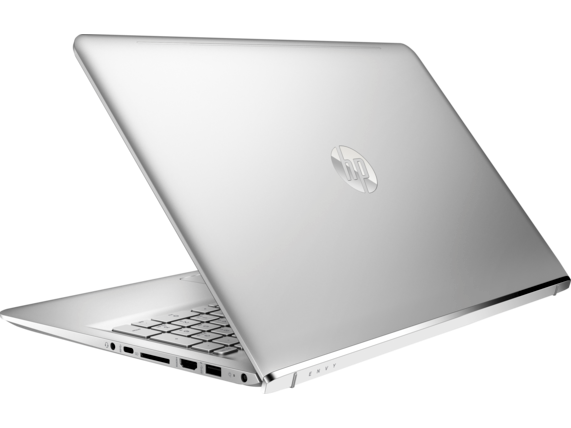
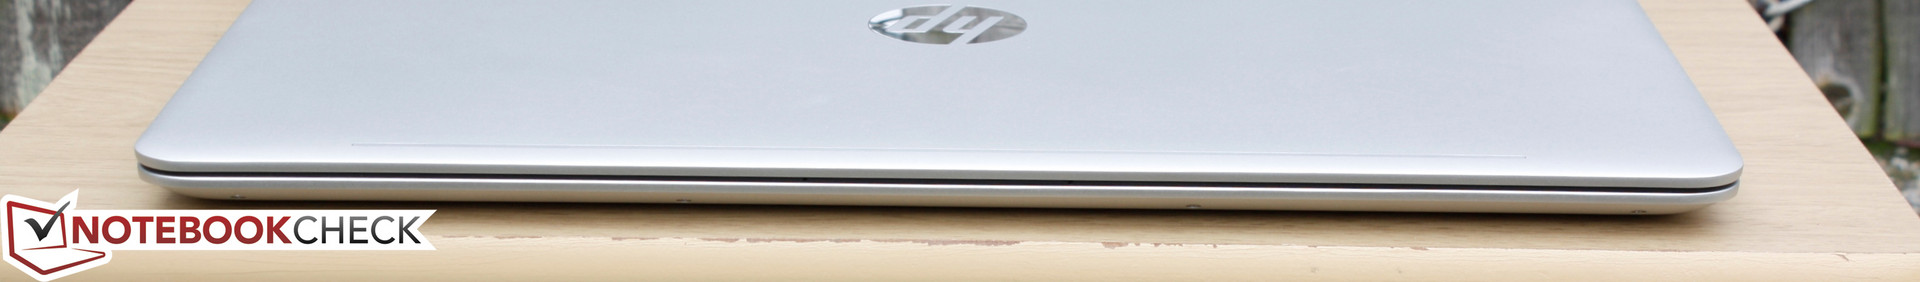
Nulla di particolare si fa notare nell'Envy 15. Il suo chassis ed il design sottile lo rendono più attraente rispetto ai portatili concorrenti di Acer o Lenovo nella fascia sotto i $900 USD e l'autonomia è abbastanza buona, ma le prestazioni complessive sono un po' deludenti. La ventola è sempre attiva, i tasti della tastiera e del clickpad sono troppo soffici, e la copertura sRGB è limitata, la funzione touchscreen è forzata su tutte le SKUs, e la cover dovrebbe essere più salda ed oscillare di meno. Raccomandiamo di evitare le SKUs con HDD primario e scegliere invece una con SSD NVMe per avere un sistema con prestazioni migliori in quanto la possibilità di manutenzione è complicata.
Se vogliamo guardare alla concorrenza, potete dare uno sguardo all'XPS 15 9550. Configurando l'Envy 15 con un SSD da 256 GB farete salire il prezzo a 4 cifre quindi allo stesso livello delle SKUS entry-level XPS 15 9550, Spectre 15 x360, o Asus Zenbook.
Nota: si tratta di una recensione breve, con alcune sezioni non tradotte, per la versione integrale in inglese guardate qui.
HP Envy 15-as133cl
- 02/13/2017 v6 (old)
Allen Ngo
Price comparison
