Recensione breve del Portatile Lenovo IdeaPad 310-15IKB
| SD Card Reader | |
| average JPG Copy Test (av. of 3 runs) | |
| Dell XPS 13 9360 FHD i5 | |
| Lenovo Ideapad 310-15IKB | |
| Acer TravelMate X3 X349-M-7261 | |
| maximum AS SSD Seq Read Test (1GB) | |
| Dell XPS 13 9360 FHD i5 | |
| Acer TravelMate X3 X349-M-7261 | |
| Lenovo Ideapad 310-15IKB | |
| Networking | |
| iperf Server (receive) TCP 1 m | |
| Xiaomi Mi Notebook Air 13.3 2016 | |
| Acer Aspire E5-774-54HJ (jseb) | |
| Lenovo Ideapad 310-15IKB | |
| iperf Client (transmit) TCP 1 m | |
| Xiaomi Mi Notebook Air 13.3 2016 | |
| Acer Aspire E5-774-54HJ (jseb) | |
| Lenovo Ideapad 310-15IKB | |
| |||||||||||||||||||||||||
Distribuzione della luminosità: 95 %
Al centro con la batteria: 185 cd/m²
Contrasto: 661:1 (Nero: 0.28 cd/m²)
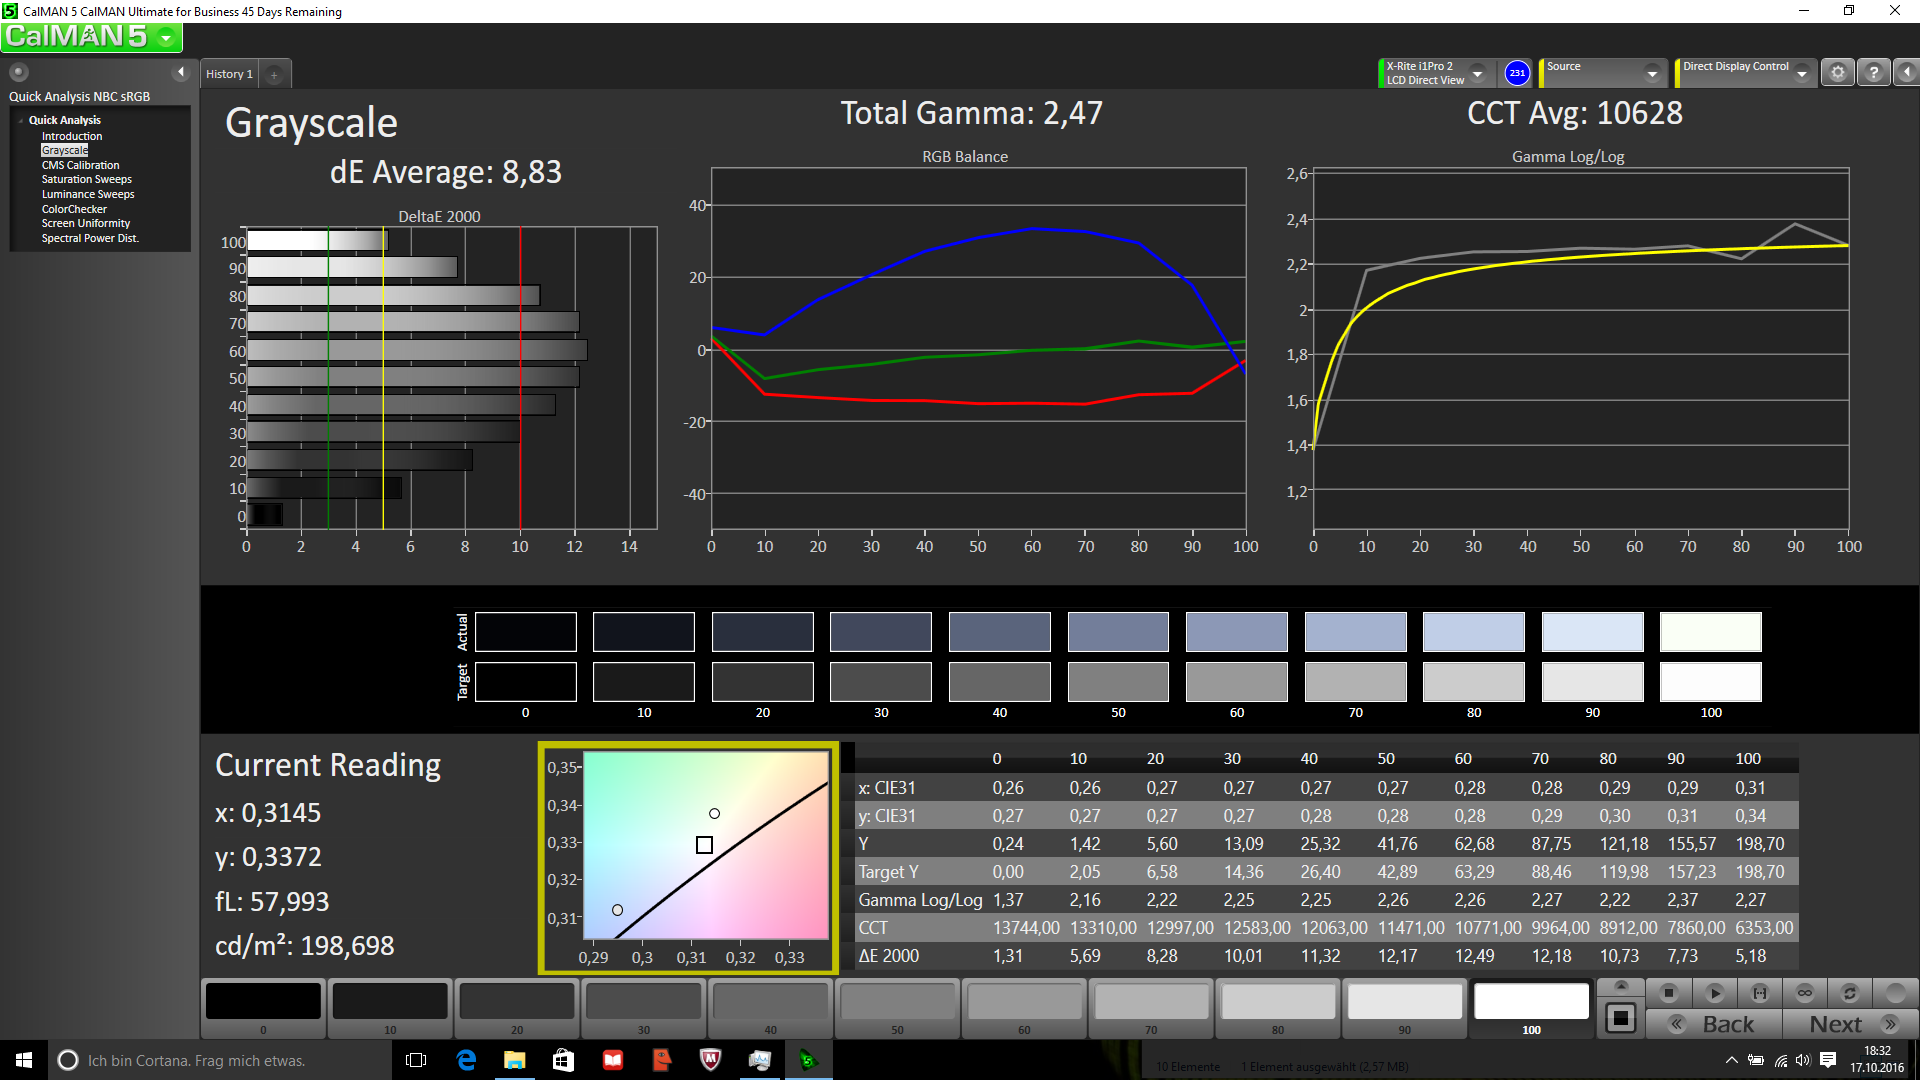
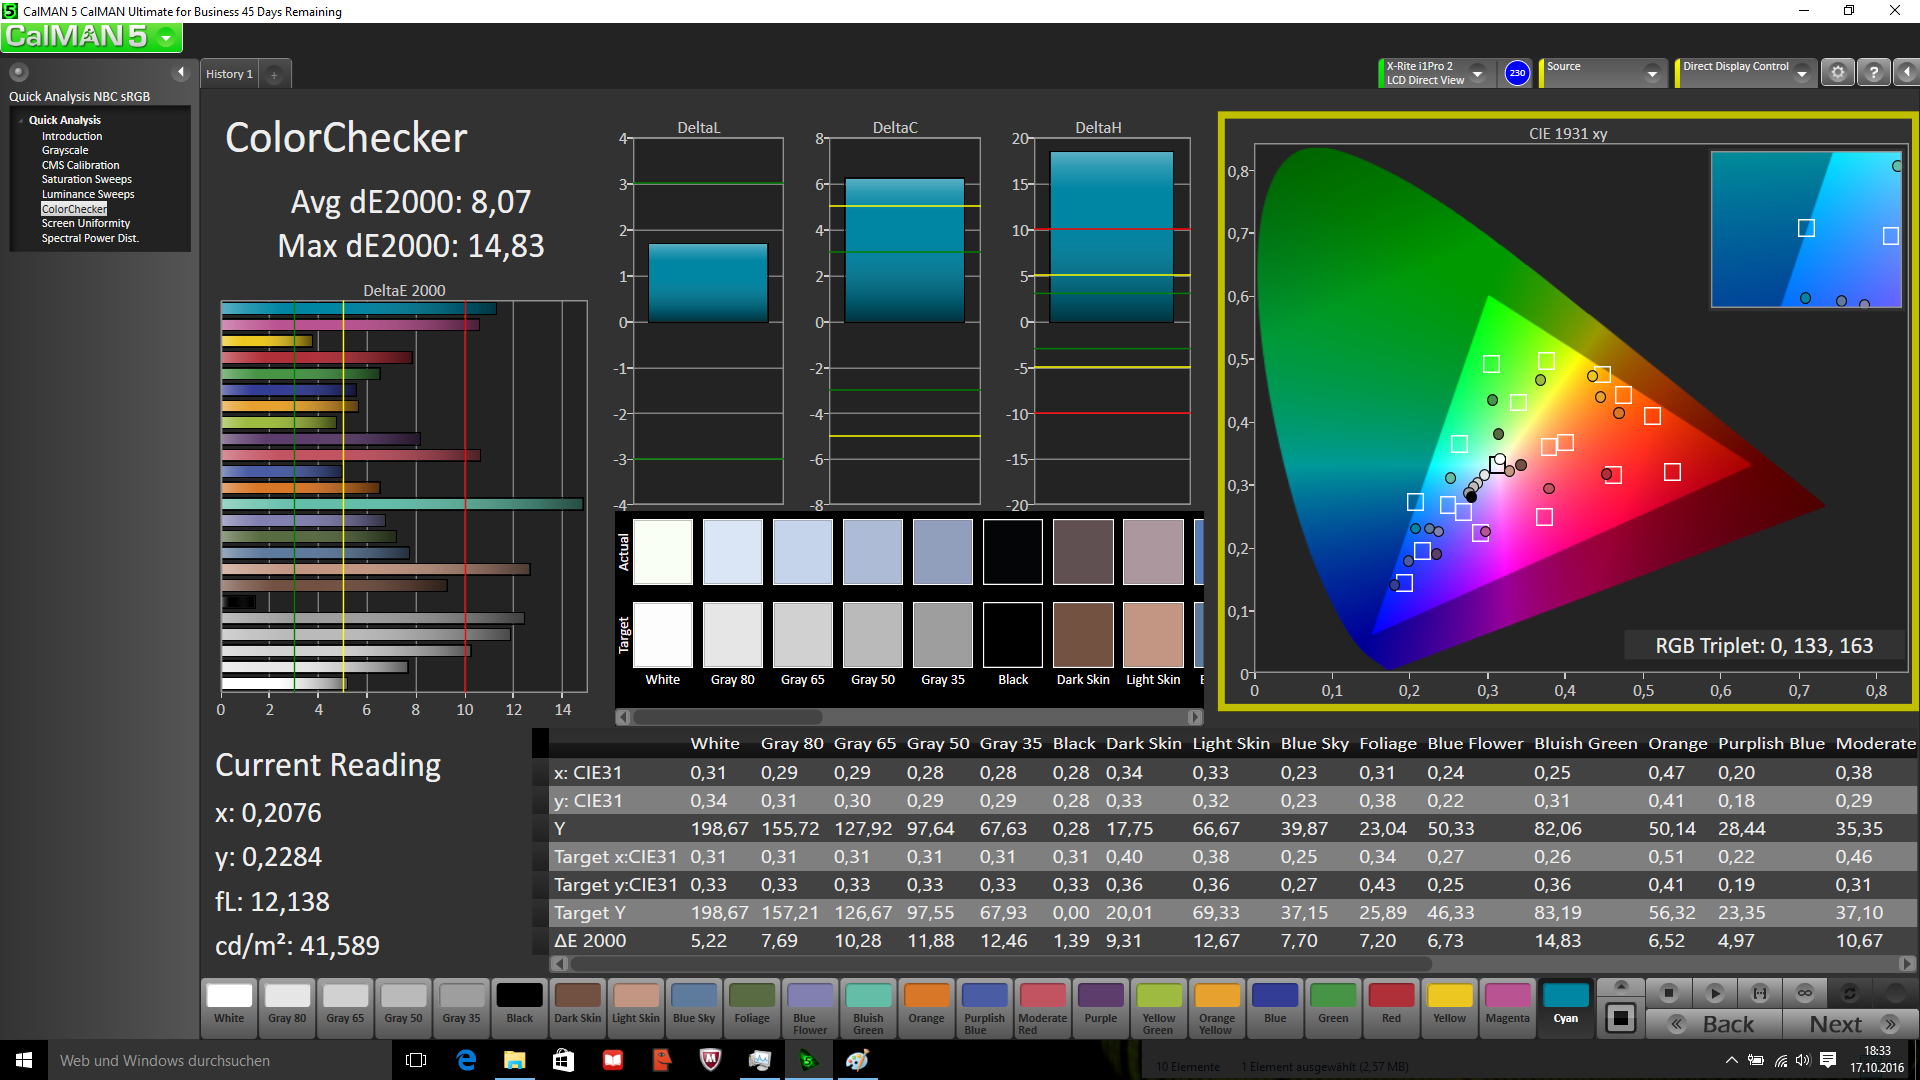
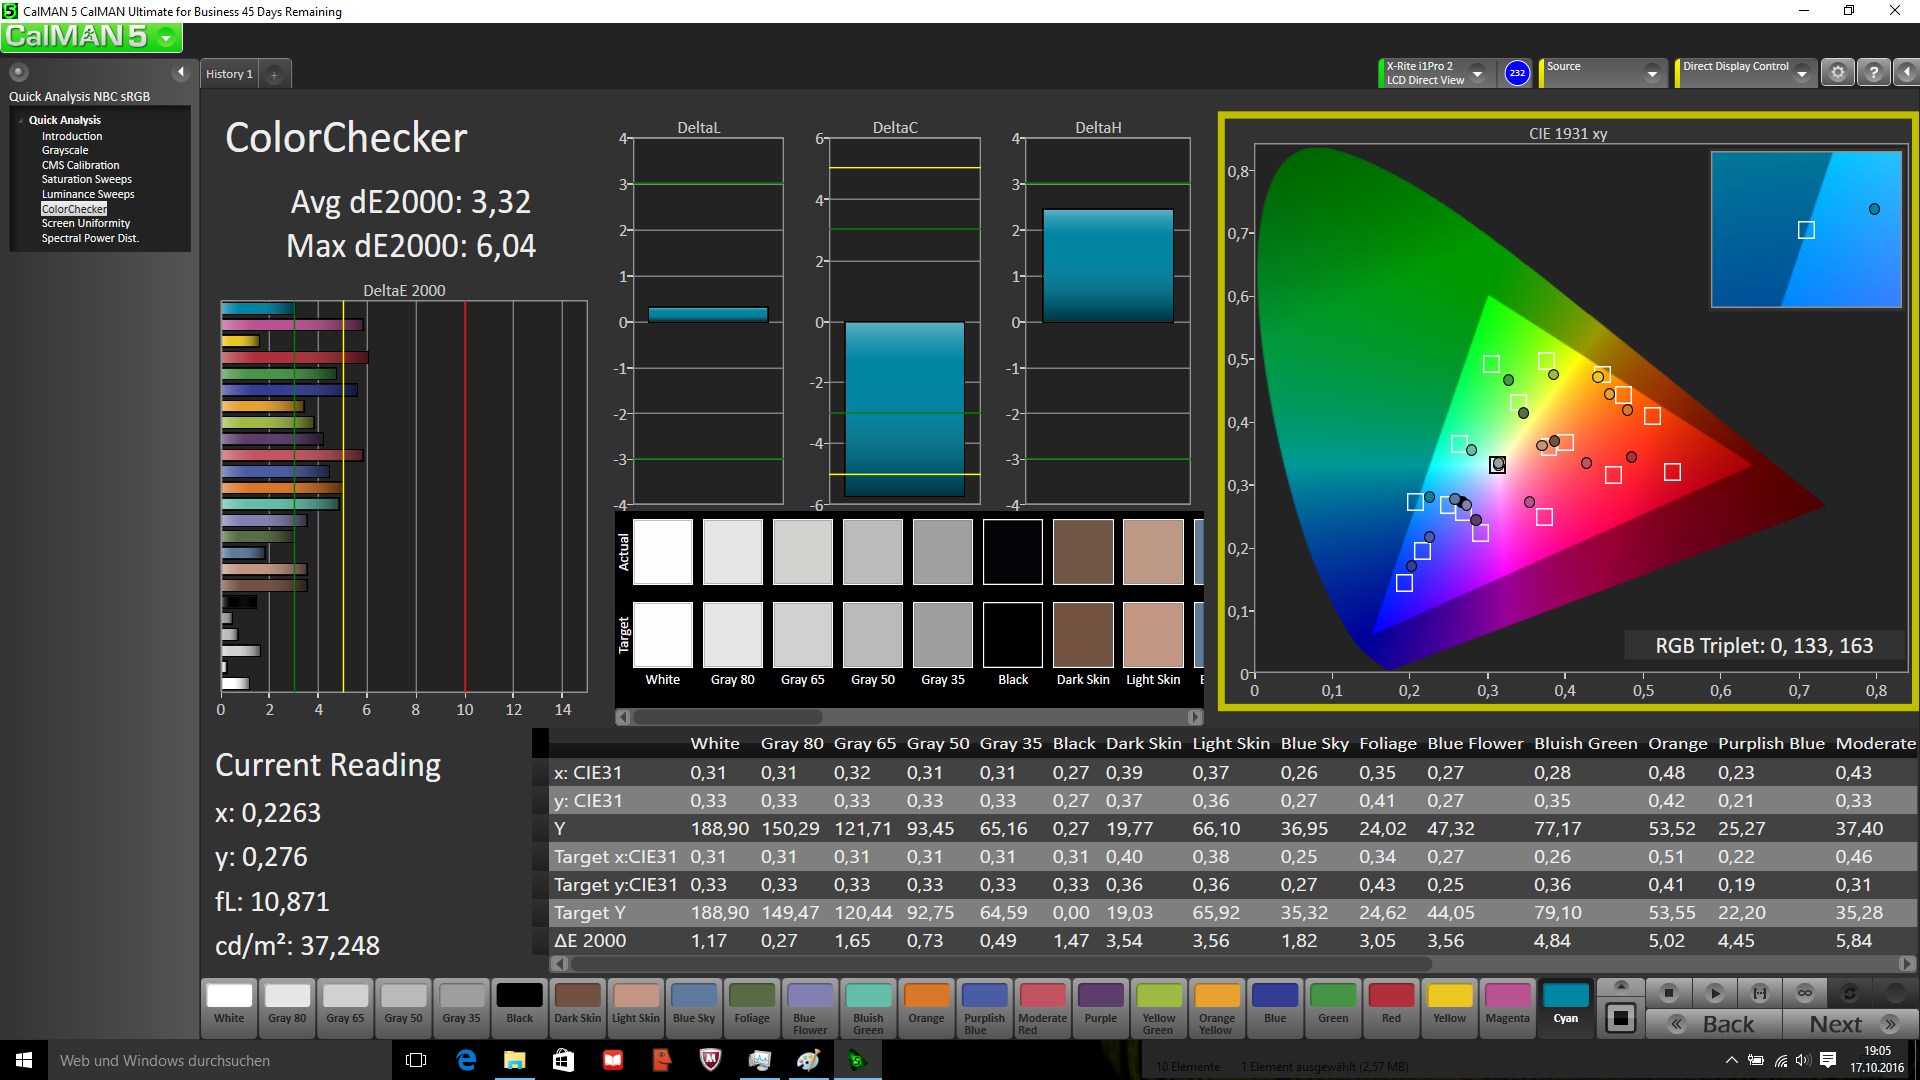
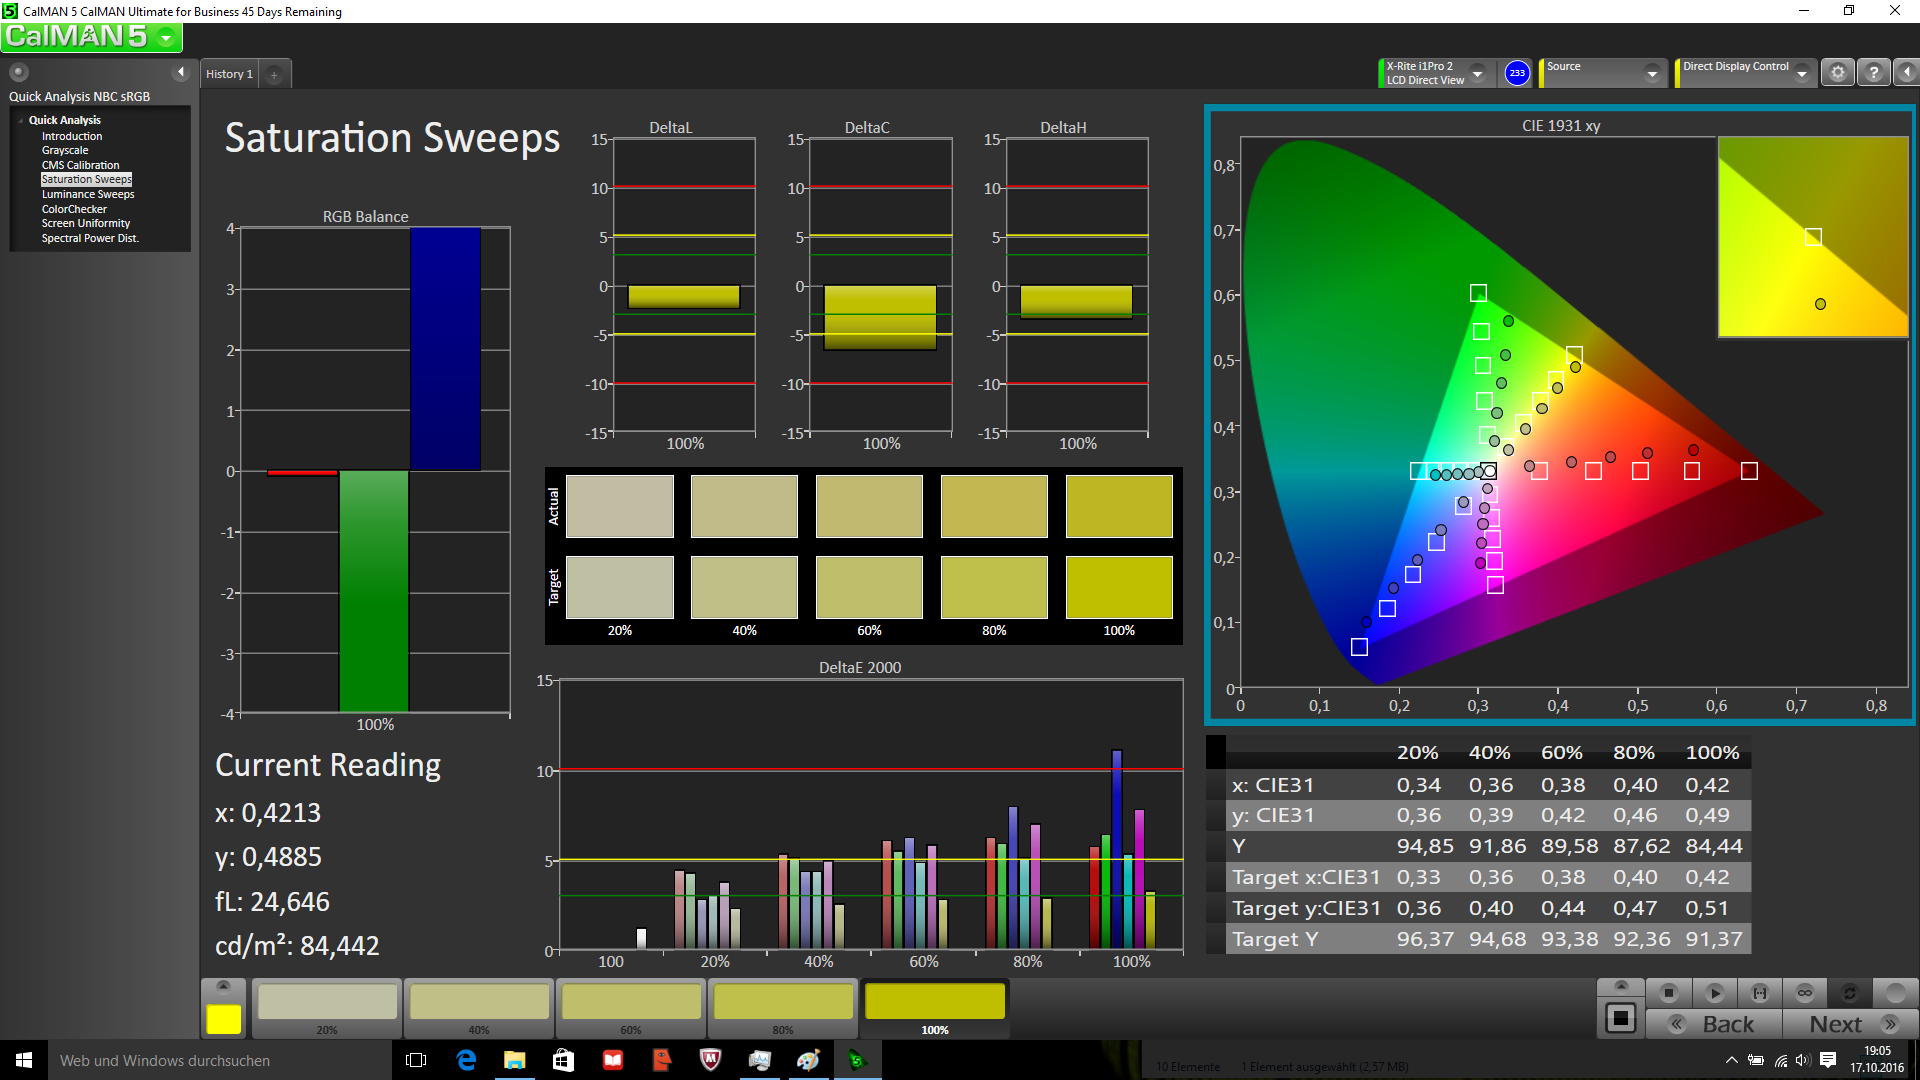
ΔE ColorChecker Calman: 8.07 | ∀{0.5-29.43 Ø4.72}
ΔE Greyscale Calman: 8.83 | ∀{0.09-98 Ø4.97}
57% sRGB (Argyll 1.6.3 3D)
36.2% AdobeRGB 1998 (Argyll 1.6.3 3D)
39.34% AdobeRGB 1998 (Argyll 3D)
57.3% sRGB (Argyll 3D)
38.07% Display P3 (Argyll 3D)
Gamma: 2.47
CCT: 10628 K
| Lenovo Ideapad 310-15IKB BOE NT156FHM-N31, , 1920x1080, 15.6" | Lenovo IdeaPad 510-15IKB 80SV0087GE BOE HF NV156FHM-N42, , 1920x1080, 15.6" | Acer Aspire E5-774-54HJ AU Optronics B173HTN01.1, , 1920x1080, 17.3" | HP 250 G5 SP X0N33EA AU Optronics AUO38ED, , 1920x1080, 15.6" | Medion Akoya P6670 LG Philips LP156WF6-SPK3, , 1920x1080, 15.6" | Lenovo Ideapad 310-15ISK LG Philips LP156WHU-TPG1, , 1366x768, 15.6" | |
|---|---|---|---|---|---|---|
| Display | 12% | 73% | -4% | 0% | -3% | |
| Display P3 Coverage (%) | 38.07 | 42.66 12% | 71.3 87% | 36.51 -4% | 38.14 0% | 37.06 -3% |
| sRGB Coverage (%) | 57.3 | 64.1 12% | 91.7 60% | 55 -4% | 57.2 0% | 55.8 -3% |
| AdobeRGB 1998 Coverage (%) | 39.34 | 44.08 12% | 67.1 71% | 37.72 -4% | 39.43 0% | 38.29 -3% |
| Response Times | -50% | -4% | 1% | -2% | 16% | |
| Response Time Grey 50% / Grey 80% * (ms) | 43 ? | 51 ? -19% | 42 ? 2% | 40 ? 7% | 42 ? 2% | 27 ? 37% |
| Response Time Black / White * (ms) | 21 ? | 38 ? -81% | 23 ? -10% | 22 ? -5% | 22 ? -5% | 22 ? -5% |
| PWM Frequency (Hz) | 50 ? | 1000 ? | 50 | 50 ? | ||
| Screen | 36% | 30% | -19% | 2% | -6% | |
| Brightness middle (cd/m²) | 185 | 291 57% | 353 91% | 219 18% | 287 55% | 200 8% |
| Brightness (cd/m²) | 184 | 265 44% | 320 74% | 222 21% | 269 46% | 198 8% |
| Brightness Distribution (%) | 95 | 86 -9% | 82 -14% | 85 -11% | 74 -22% | 83 -13% |
| Black Level * (cd/m²) | 0.28 | 0.23 18% | 0.38 -36% | 0.39 -39% | 0.65 -132% | 0.28 -0% |
| Contrast (:1) | 661 | 1265 91% | 929 41% | 562 -15% | 442 -33% | 714 8% |
| Colorchecker dE 2000 * | 8.07 | 4.78 41% | 5.07 37% | 12.67 -57% | 5.42 33% | 10.63 -32% |
| Colorchecker dE 2000 max. * | 14.83 | 9.51 36% | 10.12 32% | 20.99 -42% | 9.54 36% | 15.69 -6% |
| Greyscale dE 2000 * | 8.83 | 3.49 60% | 13.38 -52% | 13.82 -57% | 5.14 42% | 11.19 -27% |
| Gamma | 2.47 89% | 2.58 85% | 2.69 82% | 2.63 84% | 2.48 89% | 1.78 124% |
| CCT | 10628 61% | 6013 108% | 15991 41% | 15633 42% | 6952 93% | 11258 58% |
| Color Space (Percent of AdobeRGB 1998) (%) | 36.2 | 40 10% | 60.1 66% | 35 -3% | 36 -1% | 35 -3% |
| Color Space (Percent of sRGB) (%) | 57 | 64 12% | 91.6 61% | 55 -4% | 57 0% | 56 -2% |
| Media totale (Programma / Settaggio) | -1% /
20% | 33% /
34% | -7% /
-13% | 0% /
1% | 2% /
-2% |
* ... Meglio usare valori piccoli
Tempi di risposta del Display
| ↔ Tempi di risposta dal Nero al Bianco | ||
|---|---|---|
| 21 ms ... aumenta ↗ e diminuisce ↘ combinato | ↗ 5 ms Incremento | 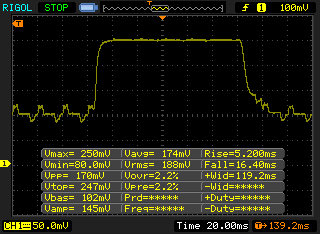 |
| ↘ 16 ms Calo | ||
| Lo schermo mostra buoni tempi di risposta durante i nostri tests, ma potrebbe essere troppo lento per i gamers competitivi. In confronto, tutti i dispositivi di test variano da 0.1 (minimo) a 240 (massimo) ms. » 47 % di tutti i dispositivi è migliore. Questo significa che i tempi di risposta rilevati sono simili alla media di tutti i dispositivi testati (19.8 ms). | ||
| ↔ Tempo di risposta dal 50% Grigio all'80% Grigio | ||
| 43 ms ... aumenta ↗ e diminuisce ↘ combinato | ↗ 21 ms Incremento | 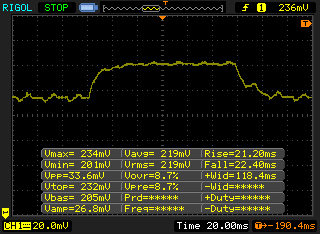 |
| ↘ 22 ms Calo | ||
| Lo schermo mostra tempi di risposta lenti nei nostri tests e sarà insoddisfacente per i gamers. In confronto, tutti i dispositivi di test variano da 0.165 (minimo) a 636 (massimo) ms. » 71 % di tutti i dispositivi è migliore. Questo significa che i tempi di risposta rilevati sono peggiori rispetto alla media di tutti i dispositivi testati (31 ms). | ||
Sfarfallio dello schermo / PWM (Pulse-Width Modulation)
| flickering dello schermo / PWM non rilevato | ||
In confronto: 52 % di tutti i dispositivi testati non utilizza PWM per ridurre la luminosita' del display. Se è rilevato PWM, una media di 7763 (minimo: 5 - massimo: 343500) Hz è stata rilevata. | ||
| PCMark 8 - Home Score Accelerated v2 | |
| Lenovo IdeaPad 510-15IKB 80SV0087GE | |
| Lenovo Ideapad 310-15ISK | |
| Lenovo Ideapad 310-15IKB | |
| Medion Akoya P6670 | |
| HP 250 G5 SP X0N33EA | |
| Acer Aspire E5-774-54HJ | |
| PCMark 8 Home Score Accelerated v2 | 3457 punti | |
Aiuto | ||
| Lenovo Ideapad 310-15IKB Hynix HFS128G3MND | Lenovo IdeaPad 510-15IKB 80SV0087GE Liteonit CV3-DE256 | HP 250 G5 SP X0N33EA SanDisk Z400s SD8SNAT-256G | Medion Akoya P6670 Phison S11-128G | Dell XPS 13 9360 FHD i5 Toshiba NVMe THNSN5256GPUK | |
|---|---|---|---|---|---|
| AS SSD | 24% | -1% | 15% | 75% | |
| Seq Read (MB/s) | 511 | 479.8 -6% | 495.8 -3% | 492.2 -4% | 1179 131% |
| Seq Write (MB/s) | 200.6 | 377.8 88% | 316.9 58% | 385.2 92% | 372.8 86% |
| 4K Read (MB/s) | 24.49 | 32.4 32% | 19.37 -21% | 40.83 67% | 29.52 21% |
| 4K Write (MB/s) | 63.6 | 59.7 -6% | 75.3 18% | 77.2 21% | 92 45% |
| 4K-64 Read (MB/s) | 302.9 | 345.5 14% | 137.4 -55% | 371.3 23% | 723 139% |
| 4K-64 Write (MB/s) | 145.4 | 203.7 40% | 198.8 37% | 271.9 87% | 197.7 36% |
| Access Time Read * (ms) | 0.117 | 0.127 -9% | 0.111 5% | 0.174 -49% | 0.055 53% |
| Access Time Write * (ms) | 0.116 | 0.066 43% | 0.157 -35% | 0.321 -177% | 0.035 70% |
| Score Read (Points) | 378 | 426 13% | 206 -46% | 461 22% | 870 130% |
| Score Write (Points) | 229 | 301 31% | 306 34% | 388 69% | 327 43% |
* ... Meglio usare valori piccoli

| 3DMark 11 - 1280x720 Performance GPU | |
| Medion Akoya P6670 | |
| Lenovo IdeaPad 510-15IKB 80SV0087GE | |
| Lenovo Ideapad 310-15ISK | |
| Lenovo Ideapad 310-15IKB | |
| HP 250 G5 SP X0N33EA | |
| 3DMark 11 Performance | 1621 punti | |
| 3DMark Cloud Gate Standard Score | 5728 punti | |
| 3DMark Fire Strike Score | 825 punti | |
Aiuto | ||
| basso | medio | alto | ultra | |
|---|---|---|---|---|
| BioShock Infinite (2013) | 54.1 | 31.21 | 25.79 | |
| Company of Heroes 2 (2013) | 24.62 | 18.7 | ||
| Rise of the Tomb Raider (2016) | 19.8 |
Rumorosità
| Idle |
| 30.6 / 30.6 / 30.6 dB(A) |
| Sotto carico |
| 36.8 / 38.2 dB(A) |
 | ||
30 dB silenzioso 40 dB(A) udibile 50 dB(A) rumoroso |
||
min: | ||
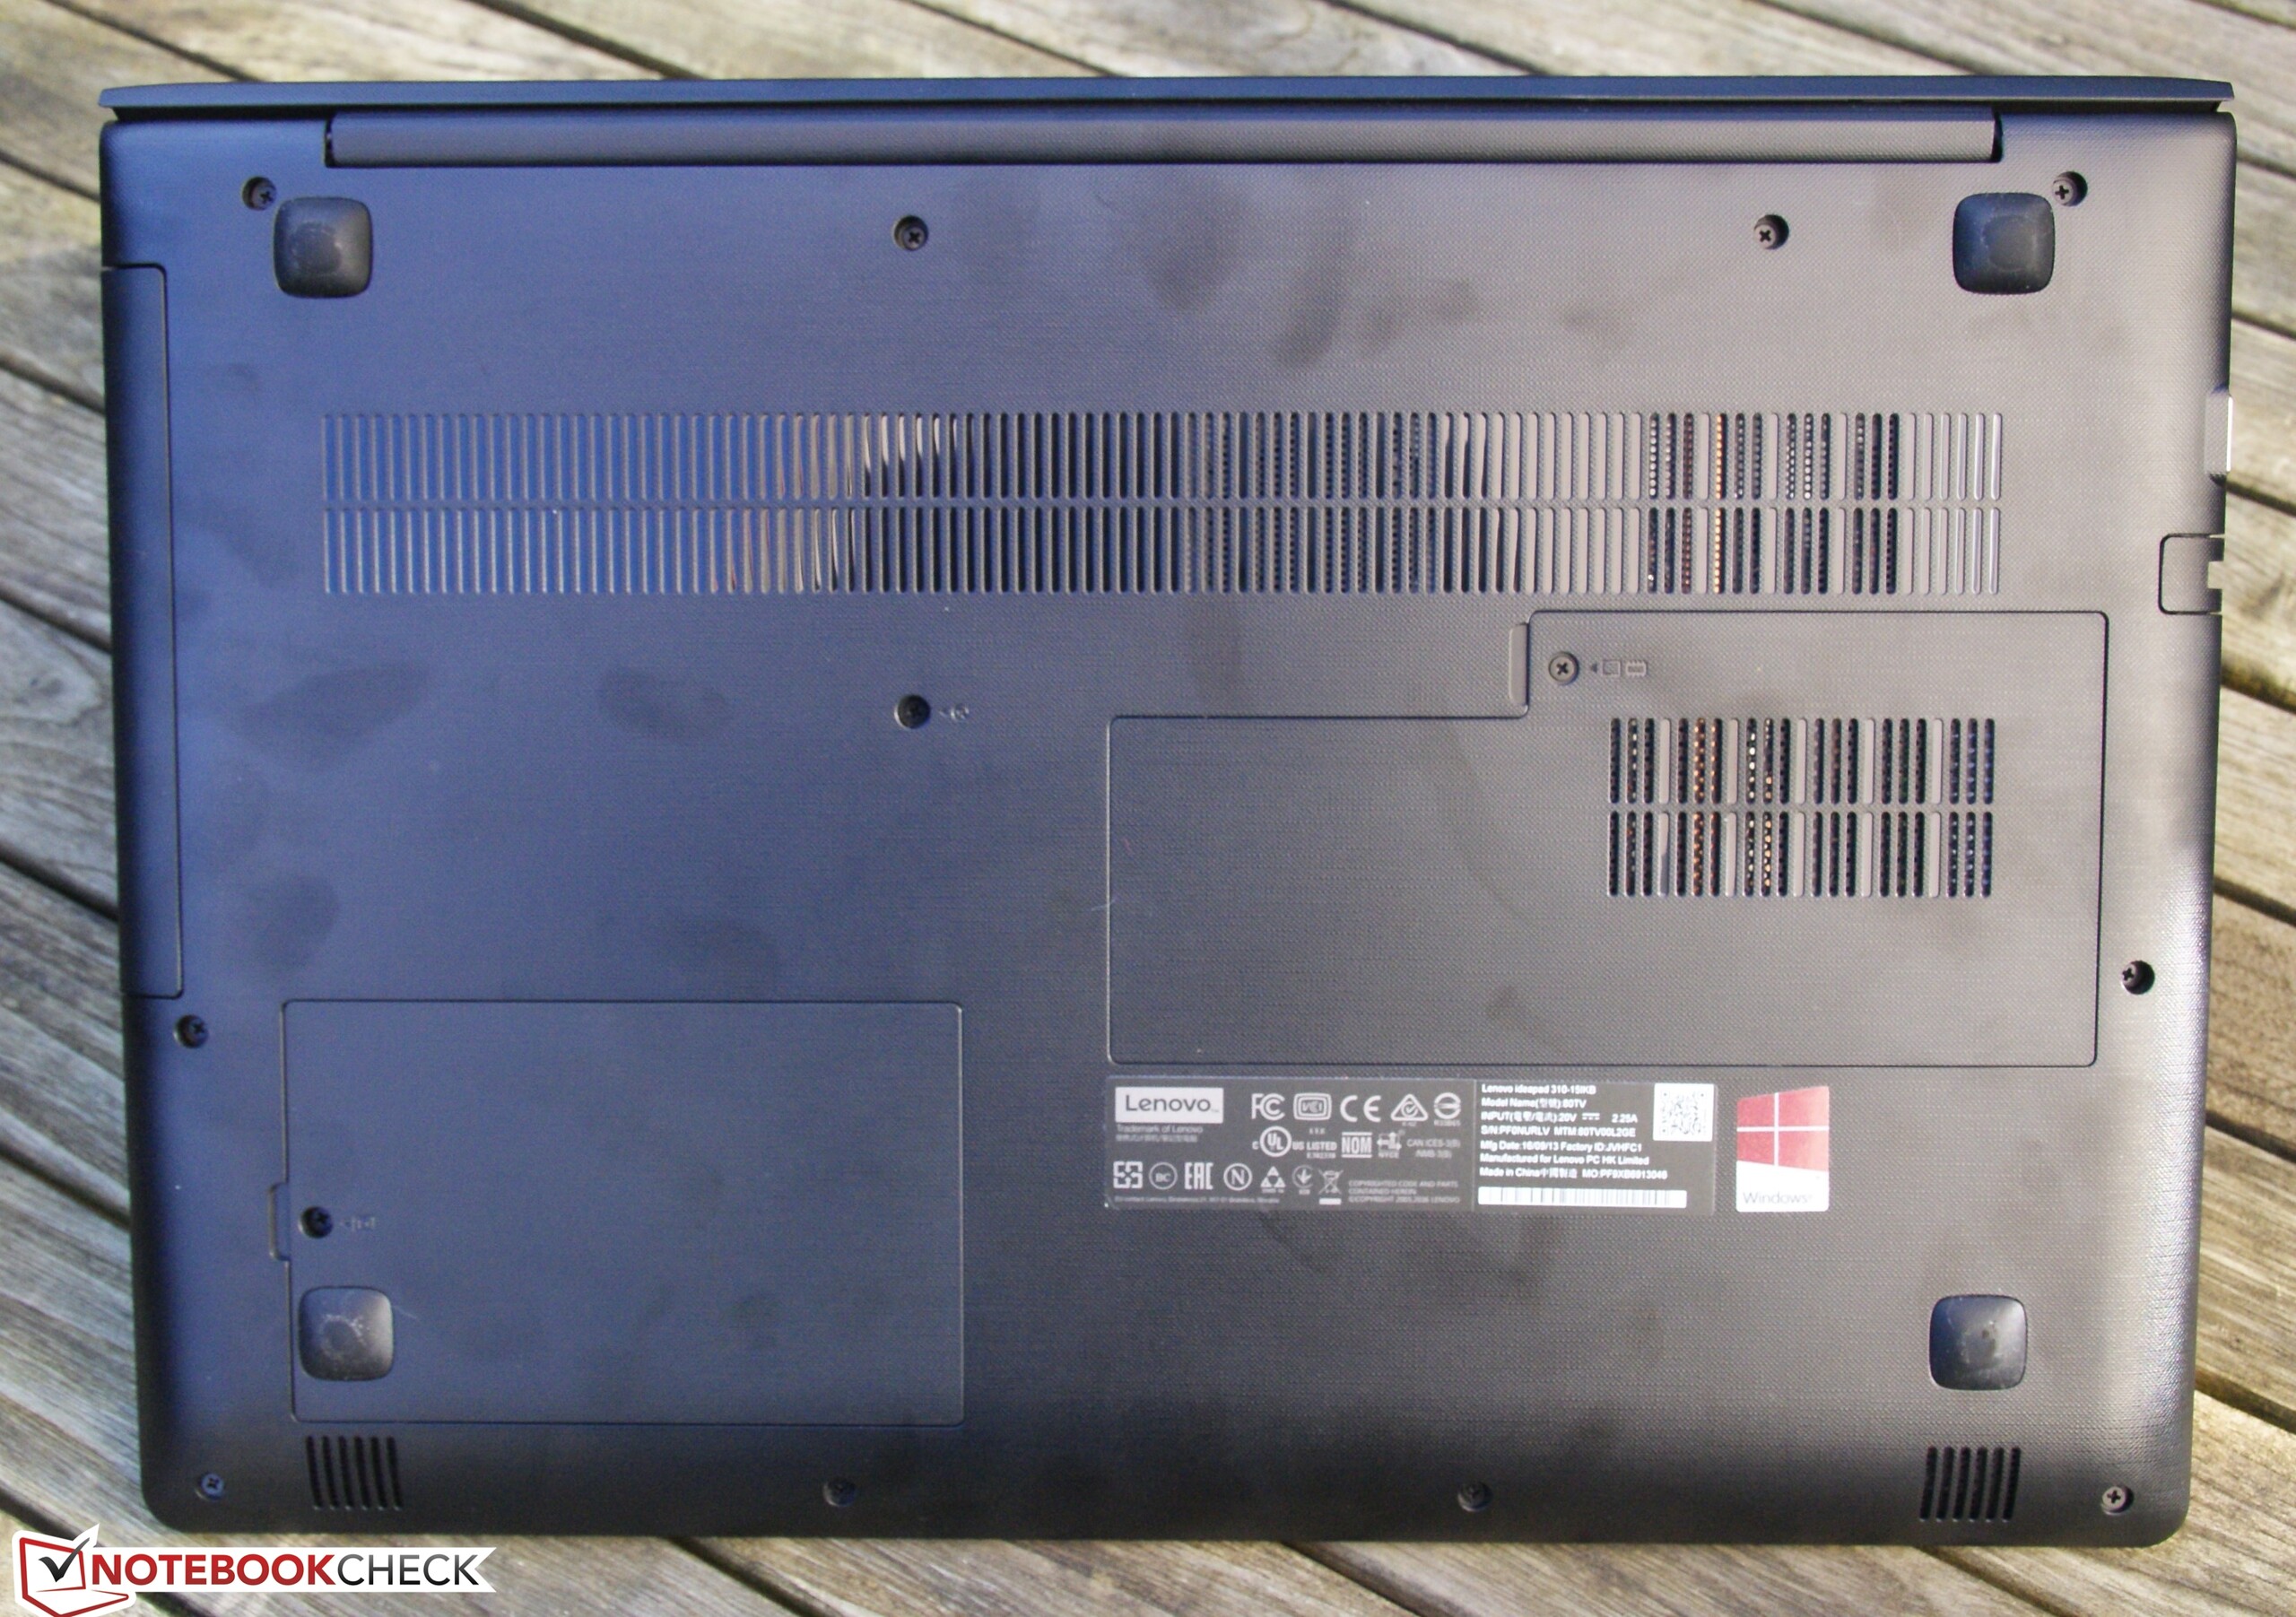
(+) La temperatura massima sul lato superiore è di 34.1 °C / 93 F, rispetto alla media di 34.3 °C / 94 F, che varia da 21.2 a 62.5 °C per questa classe Office.
(+) Il lato inferiore si riscalda fino ad un massimo di 35.6 °C / 96 F, rispetto alla media di 36.8 °C / 98 F
(+) In idle, la temperatura media del lato superiore è di 25 °C / 77 F, rispetto alla media deld ispositivo di 29.5 °C / 85 F.
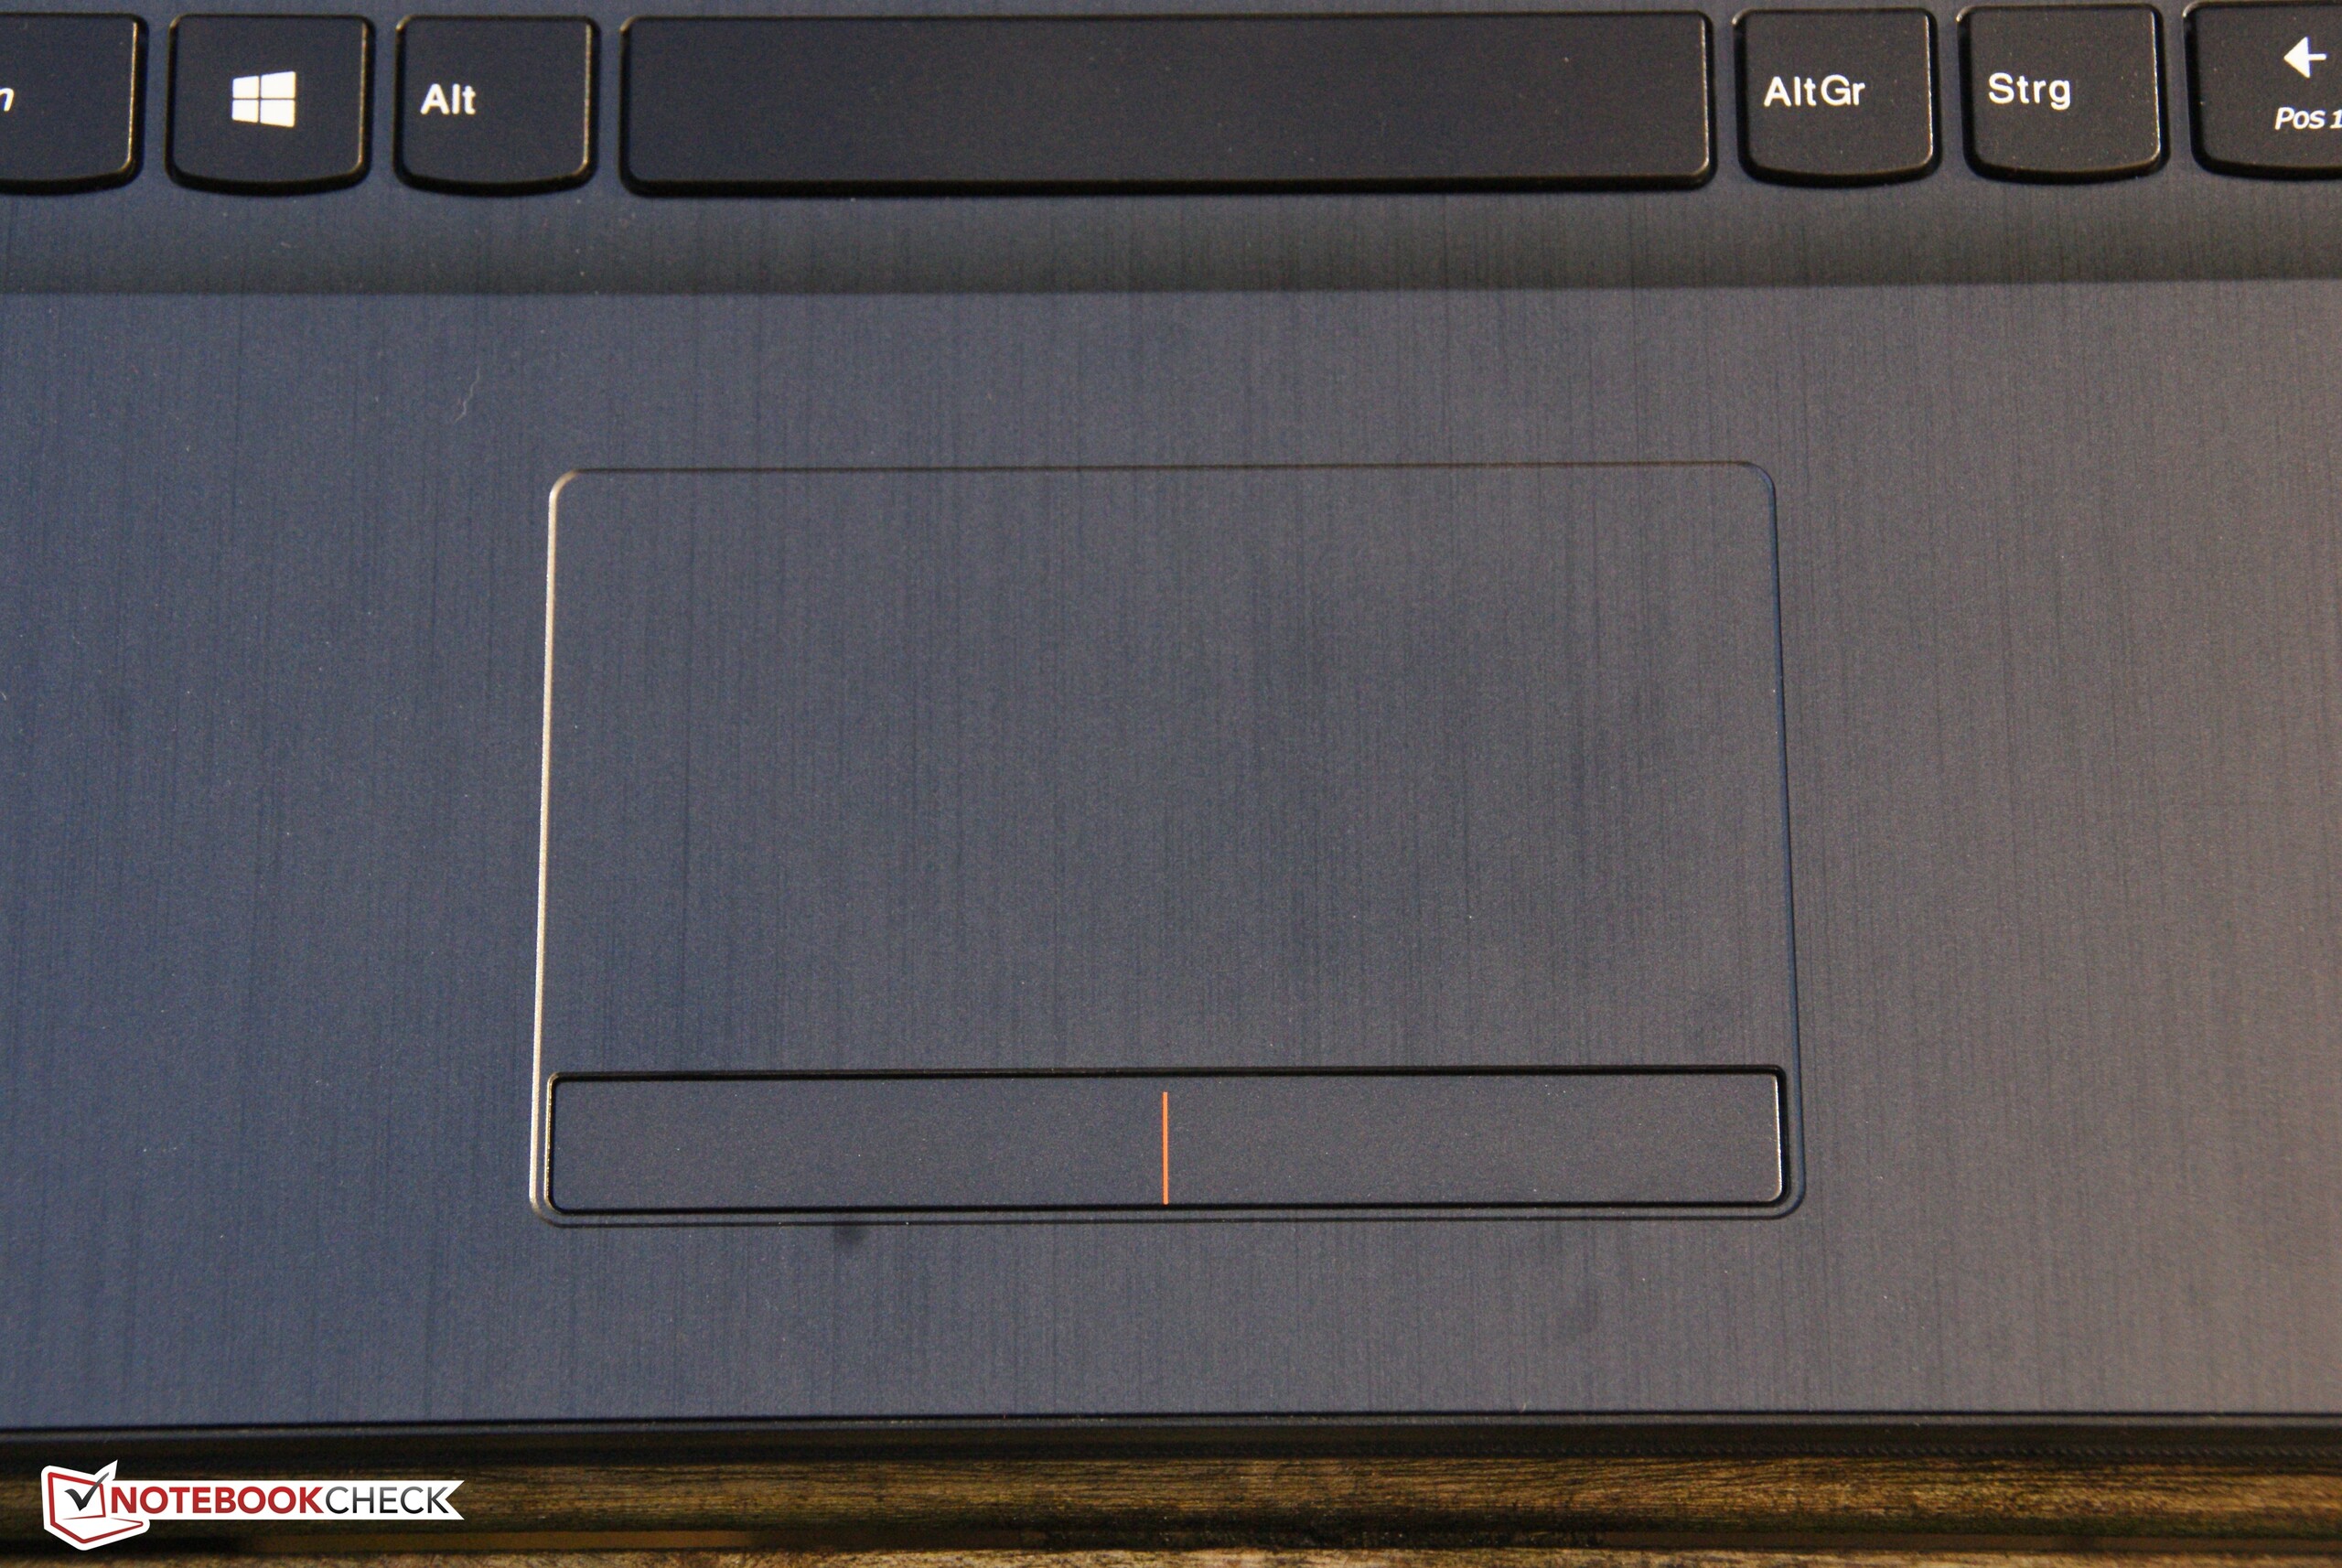
(+) I poggiapolsi e il touchpad sono piu' freddi della temperatura della pelle con un massimo di 30.2 °C / 86.4 F e sono quindi freddi al tatto.
(-) La temperatura media della zona del palmo della mano di dispositivi simili e'stata di 27.5 °C / 81.5 F (-2.7 °C / -4.9 F).
Lenovo Ideapad 310-15IKB analisi audio
(±) | potenza degli altiparlanti media ma buona (76 dB)
Bassi 100 - 315 Hz
(±) | bassi ridotti - in media 11% inferiori alla media
(±) | la linearità dei bassi è media (13.8% delta rispetto alla precedente frequenza)
Medi 400 - 2000 Hz
(+) | medi bilanciati - solo only 3.2% rispetto alla media
(±) | linearità dei medi adeguata (7.8% delta rispetto alla precedente frequenza)
Alti 2 - 16 kHz
(+) | Alti bilanciati - appena 2.4% dalla media
(+) | alti lineari (5.7% delta rispetto alla precedente frequenza)
Nel complesso 100 - 16.000 Hz
(±) | la linearità complessiva del suono è media (15.1% di differenza rispetto alla media
Rispetto alla stessa classe
» 14% di tutti i dispositivi testati in questa classe è stato migliore, 4% simile, 82% peggiore
» Il migliore ha avuto un delta di 7%, medio di 21%, peggiore di 53%
Rispetto a tutti i dispositivi testati
» 21% di tutti i dispositivi testati in questa classe è stato migliore, 4% similare, 75% peggiore
» Il migliore ha avuto un delta di 4%, medio di 24%, peggiore di 134%
Apple MacBook 12 (Early 2016) 1.1 GHz analisi audio
(+) | gli altoparlanti sono relativamente potenti (83.6 dB)
Bassi 100 - 315 Hz
(±) | bassi ridotti - in media 11.3% inferiori alla media
(±) | la linearità dei bassi è media (14.2% delta rispetto alla precedente frequenza)
Medi 400 - 2000 Hz
(+) | medi bilanciati - solo only 2.4% rispetto alla media
(+) | medi lineari (5.5% delta rispetto alla precedente frequenza)
Alti 2 - 16 kHz
(+) | Alti bilanciati - appena 2% dalla media
(+) | alti lineari (4.5% delta rispetto alla precedente frequenza)
Nel complesso 100 - 16.000 Hz
(+) | suono nel complesso lineare (10.2% differenza dalla media)
Rispetto alla stessa classe
» 7% di tutti i dispositivi testati in questa classe è stato migliore, 2% simile, 91% peggiore
» Il migliore ha avuto un delta di 5%, medio di 18%, peggiore di 53%
Rispetto a tutti i dispositivi testati
» 5% di tutti i dispositivi testati in questa classe è stato migliore, 1% similare, 94% peggiore
» Il migliore ha avuto un delta di 4%, medio di 24%, peggiore di 134%
| Off / Standby | |
| Idle | |
| Sotto carico |
|
Leggenda:
min: | |
| Lenovo Ideapad 310-15IKB i5-7200U, HD Graphics 620, Hynix HFS128G3MND, TN LED, 1920x1080, 15.6" | Lenovo IdeaPad 510-15IKB 80SV0087GE i7-7500U, GeForce 940MX, Liteonit CV3-DE256, IPS, 1920x1080, 15.6" | HP 250 G5 SP X0N33EA 6200U, HD Graphics 520, SanDisk Z400s SD8SNAT-256G, TN, 1920x1080, 15.6" | Medion Akoya P6670 6200U, GeForce 940MX, Phison S11-128G, IPS, 1920x1080, 15.6" | Lenovo Ideapad 310-15ISK 6500U, GeForce 920MX, WDC Scorpio Blue WD10JPCX-24UE4T0, TN LED, 1366x768, 15.6" | |
|---|---|---|---|---|---|
| Power Consumption | -22% | 12% | -49% | -40% | |
| Idle Minimum * (Watt) | 3.5 | 3.9 -11% | 3.6 -3% | 6.7 -91% | 7 -100% |
| Idle Average * (Watt) | 6.1 | 7.4 -21% | 6 2% | 9.2 -51% | 8 -31% |
| Idle Maximum * (Watt) | 7 | 9.5 -36% | 6.4 9% | 9.7 -39% | 8.4 -20% |
| Load Average * (Watt) | 31.2 | 41 -31% | 26 17% | 40.6 -30% | 38.8 -24% |
| Load Maximum * (Watt) | 42.9 | 48 -12% | 28.1 34% | 58 -35% | 52.8 -23% |
* ... Meglio usare valori piccoli
| Lenovo Ideapad 310-15IKB i5-7200U, HD Graphics 620, 30 Wh | Lenovo IdeaPad 510-15IKB 80SV0087GE i7-7500U, GeForce 940MX, 30 Wh | HP 250 G5 SP X0N33EA 6200U, HD Graphics 520, 41 Wh | Medion Akoya P6670 6200U, GeForce 940MX, 44 Wh | Lenovo Ideapad 310-15ISK 6500U, GeForce 920MX, 31 Wh | |
|---|---|---|---|---|---|
| Autonomia della batteria | 21% | 29% | 24% | 45% | |
| Reader / Idle (h) | 10.2 | 10.6 4% | |||
| WiFi v1.3 (h) | 3.8 | 4.6 21% | 5.8 53% | 4.7 24% | 5.5 45% |
| Load (h) | 1.4 | 1.8 29% | |||
| H.264 (h) | 5.2 |
Pro
Contro
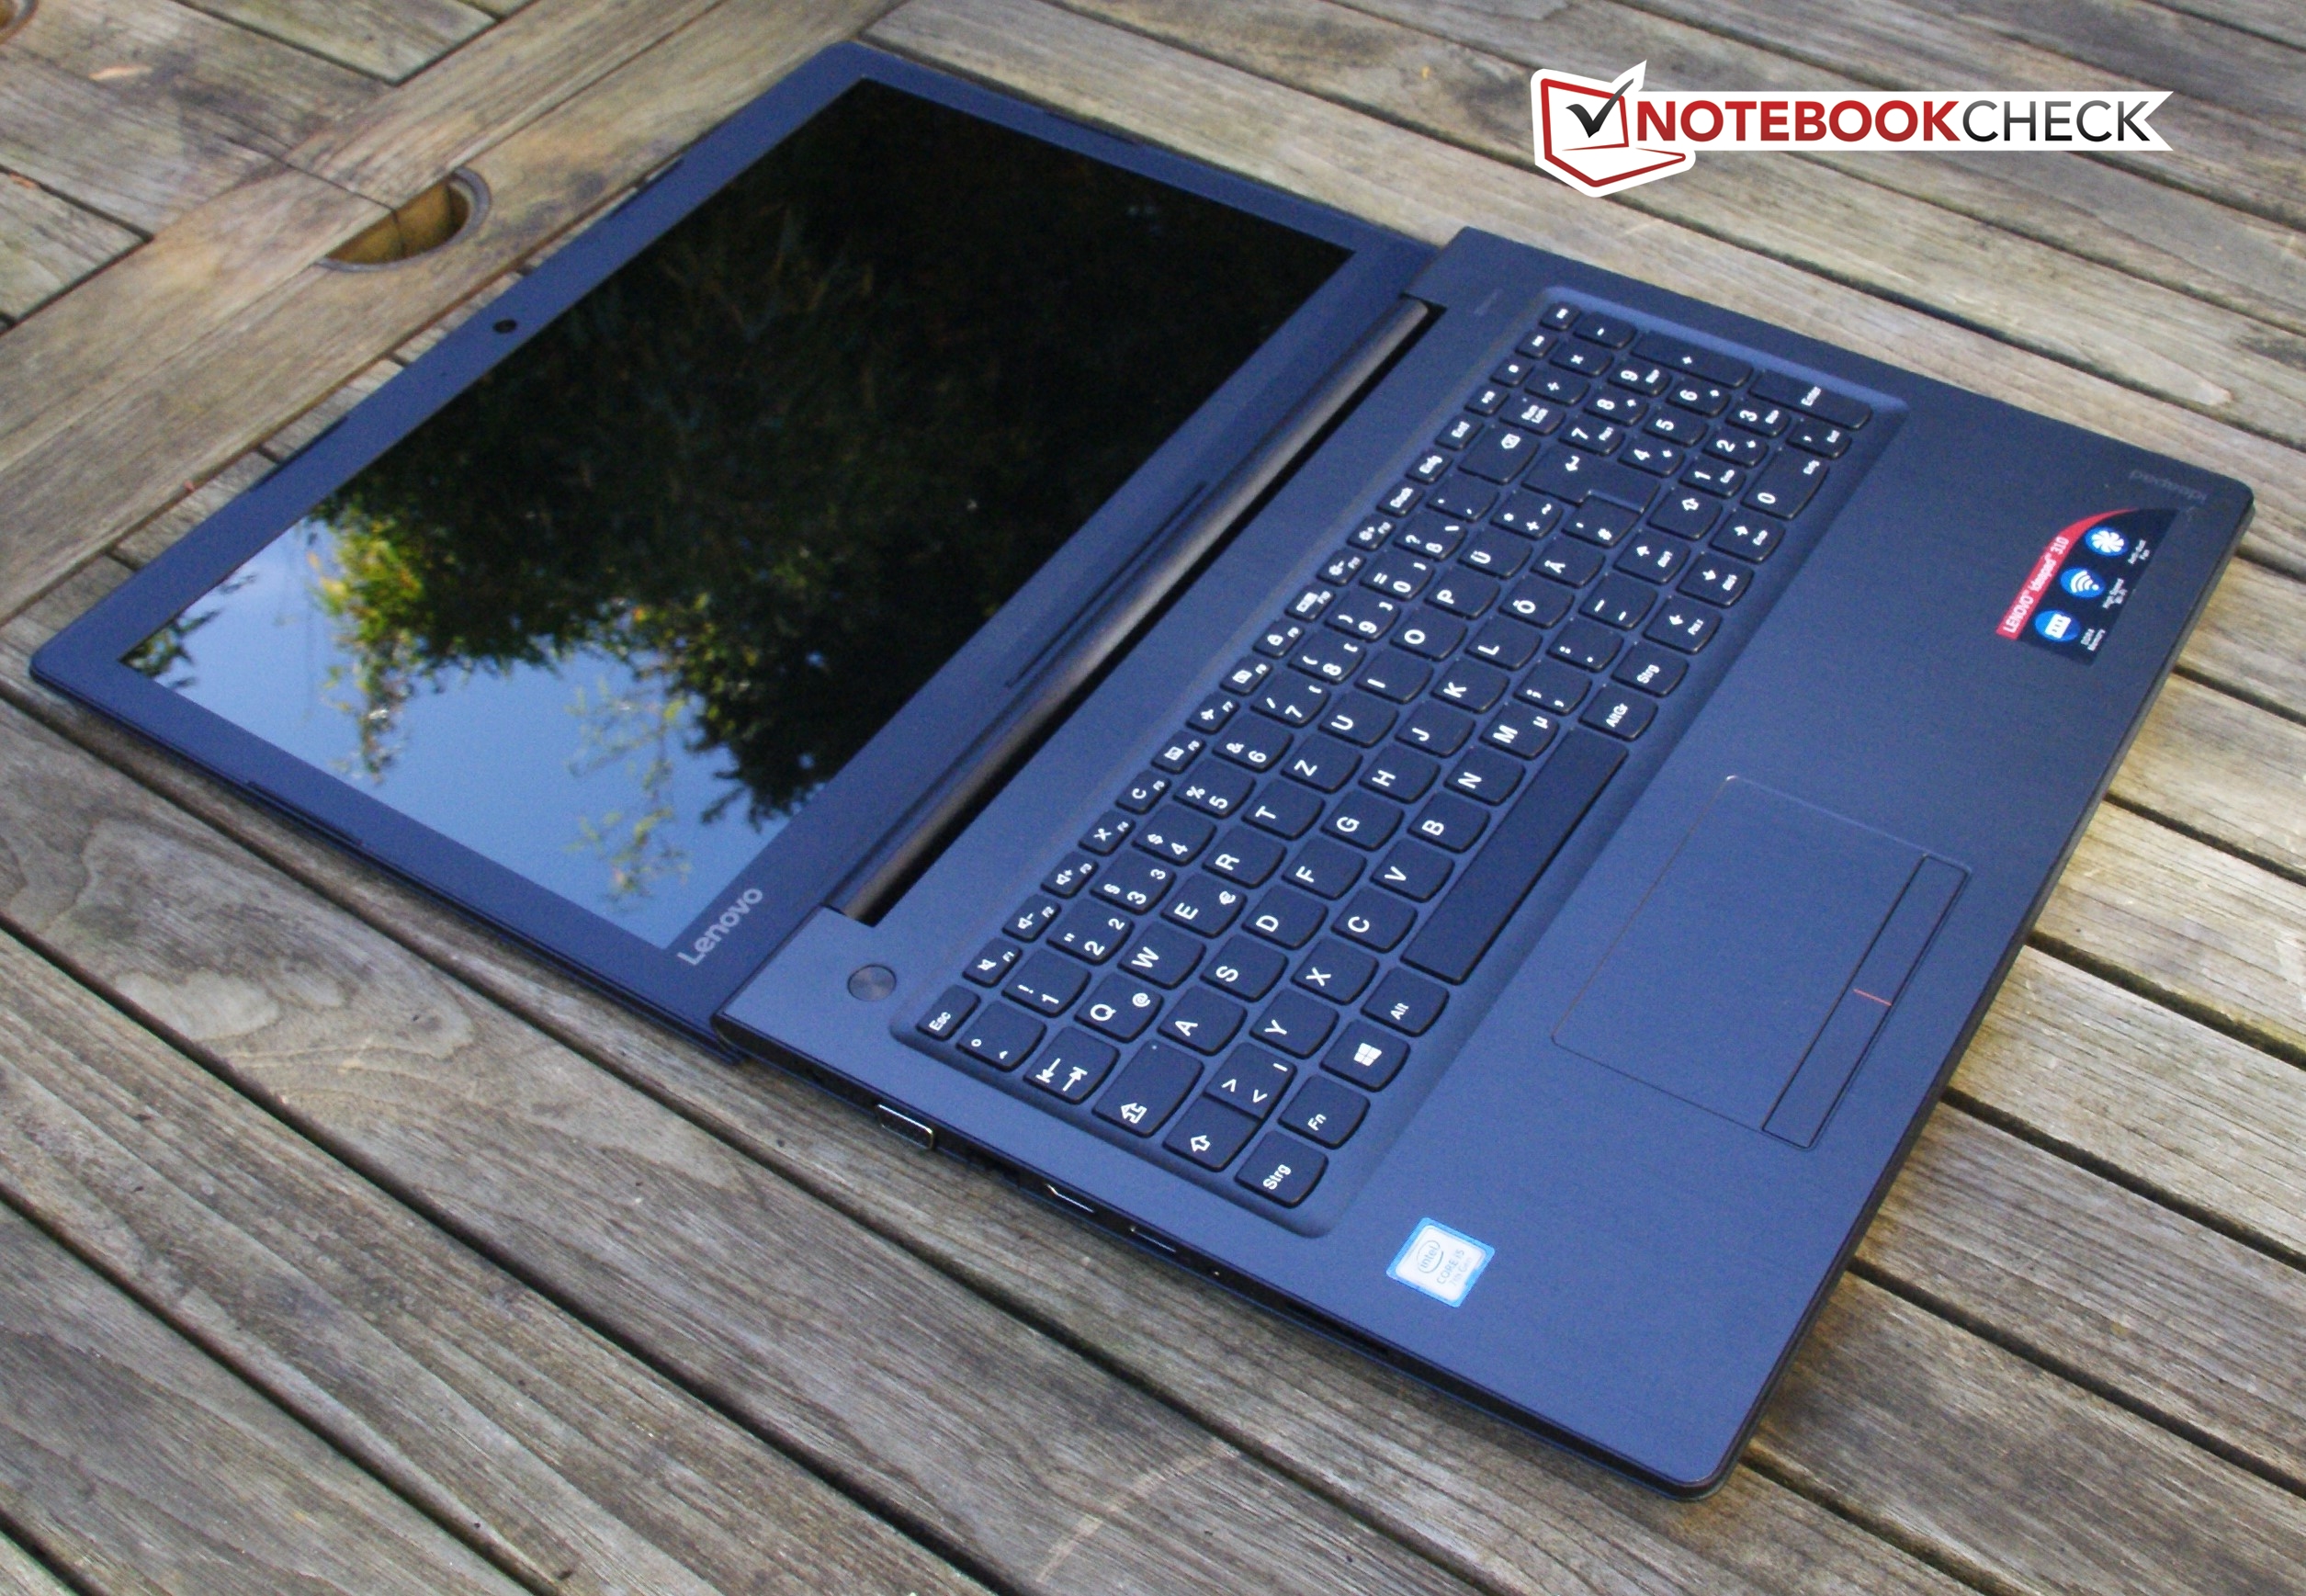
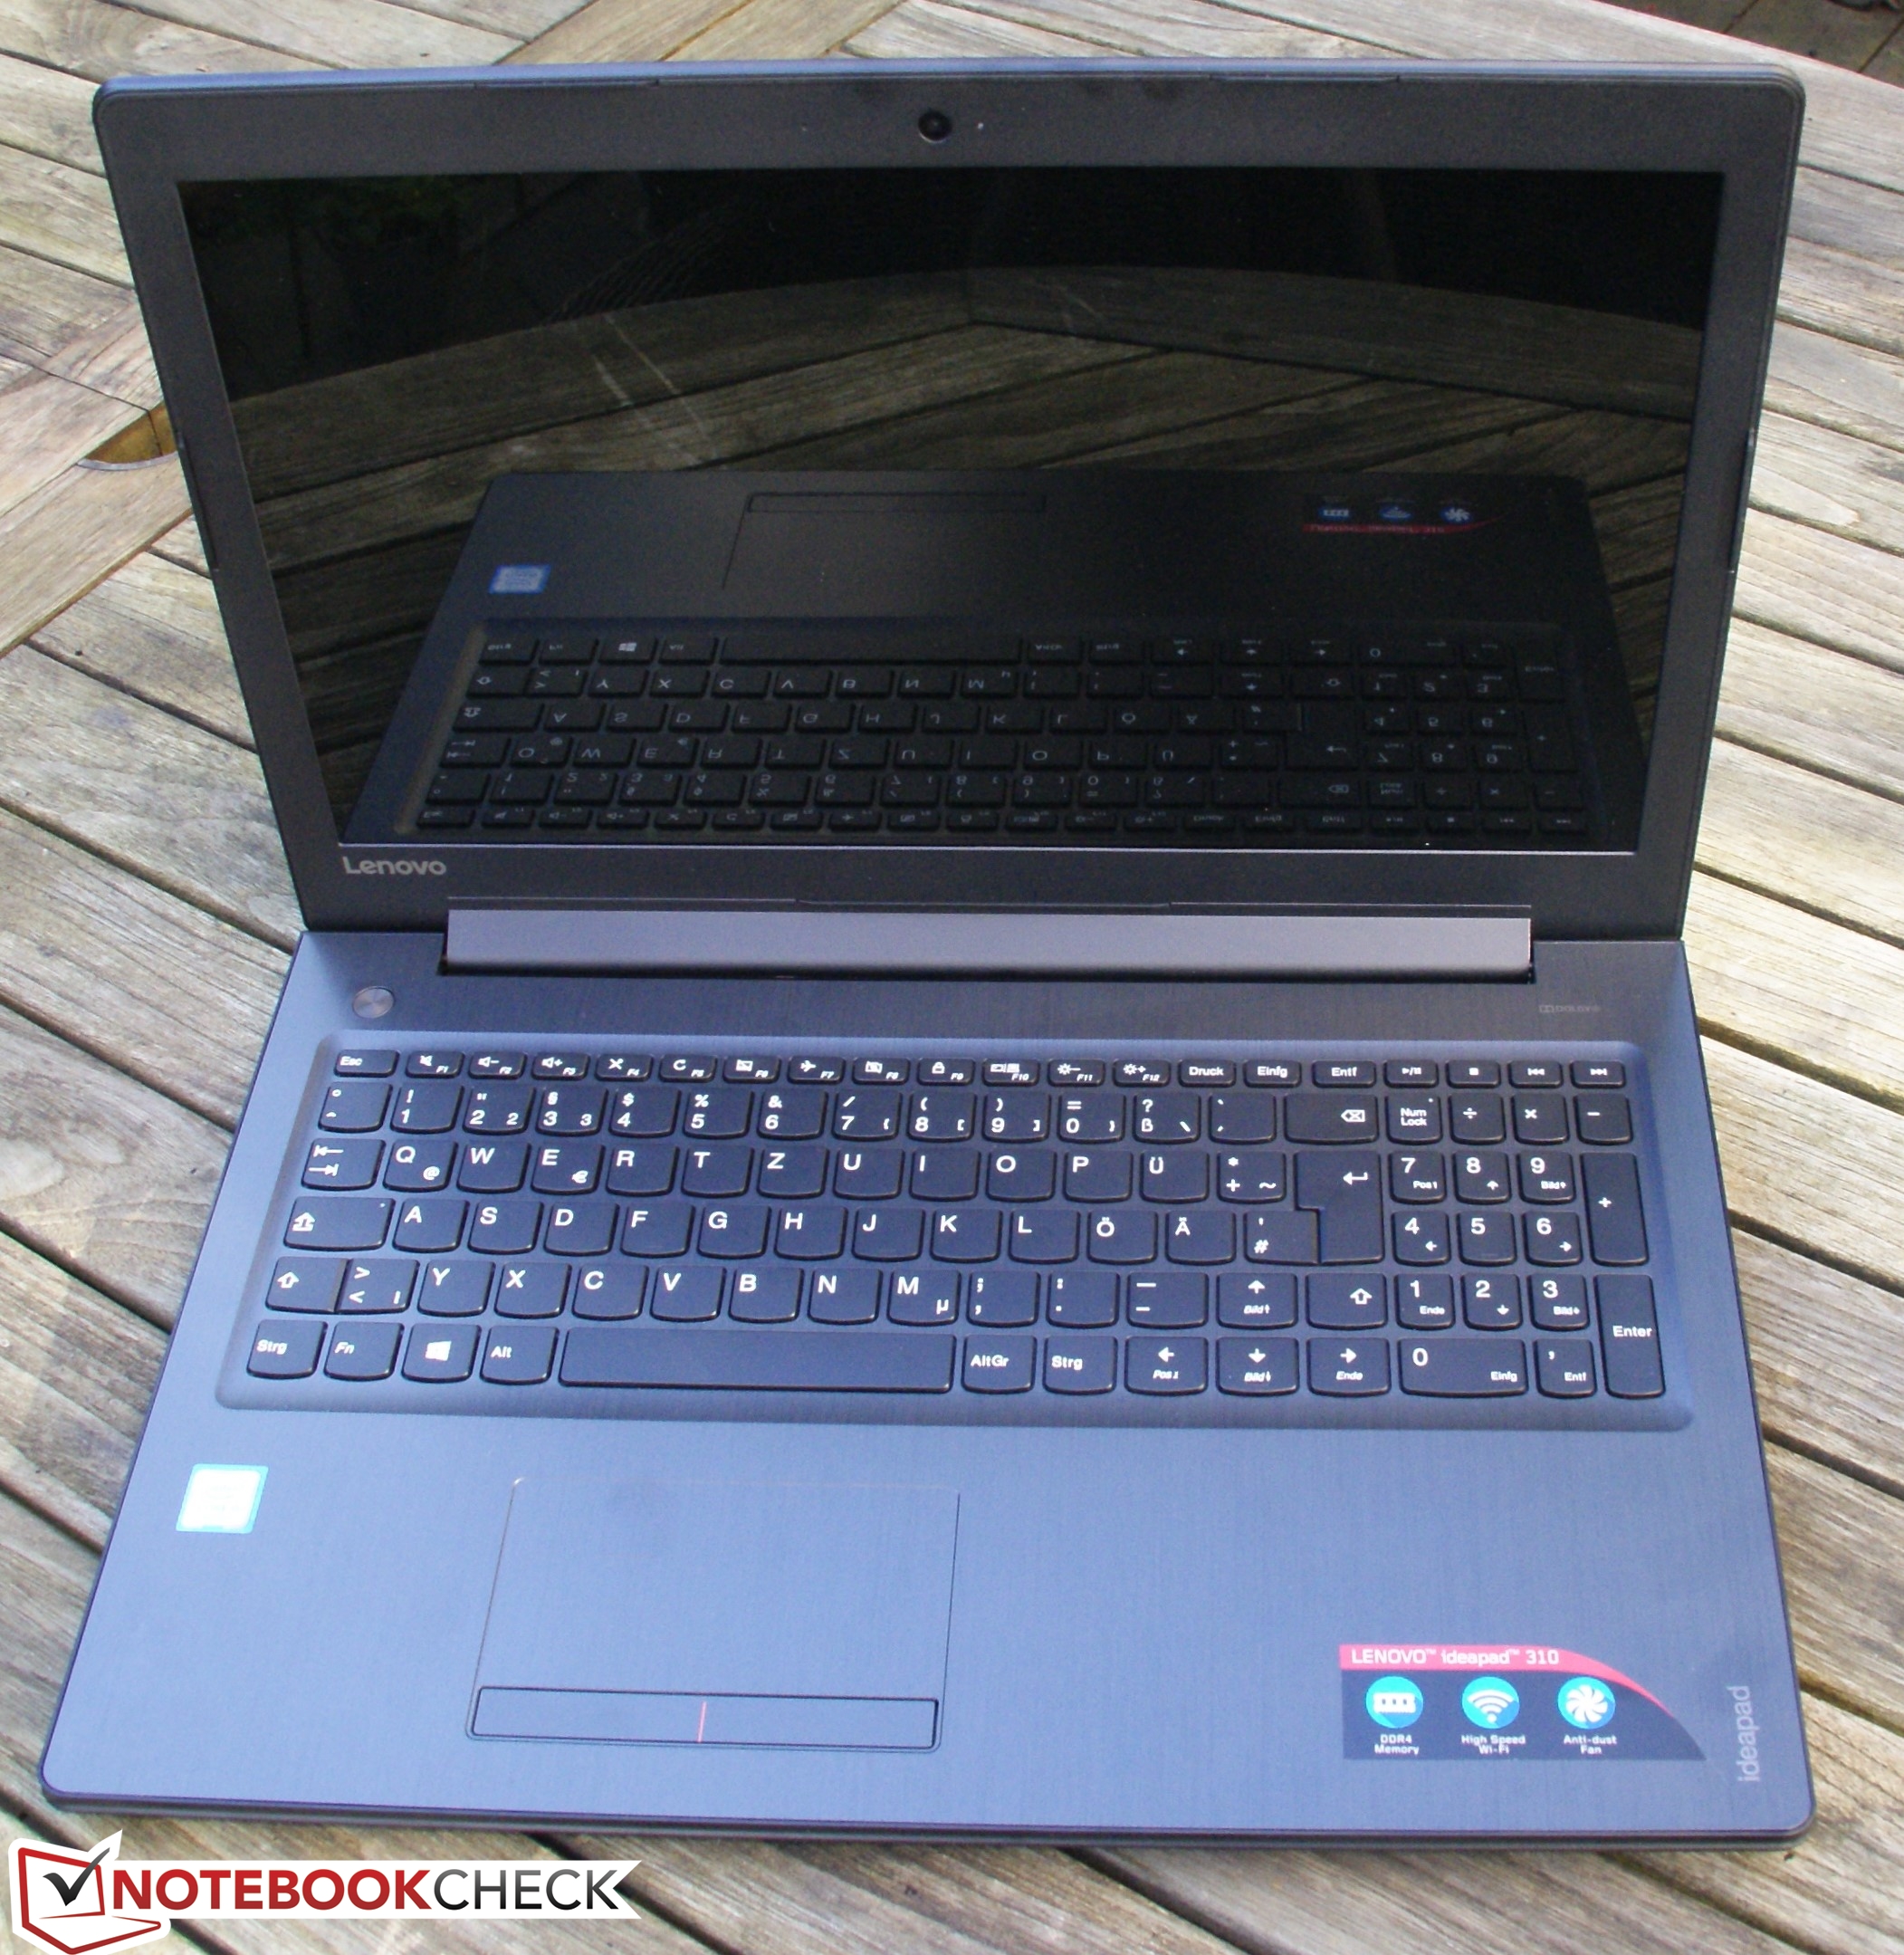
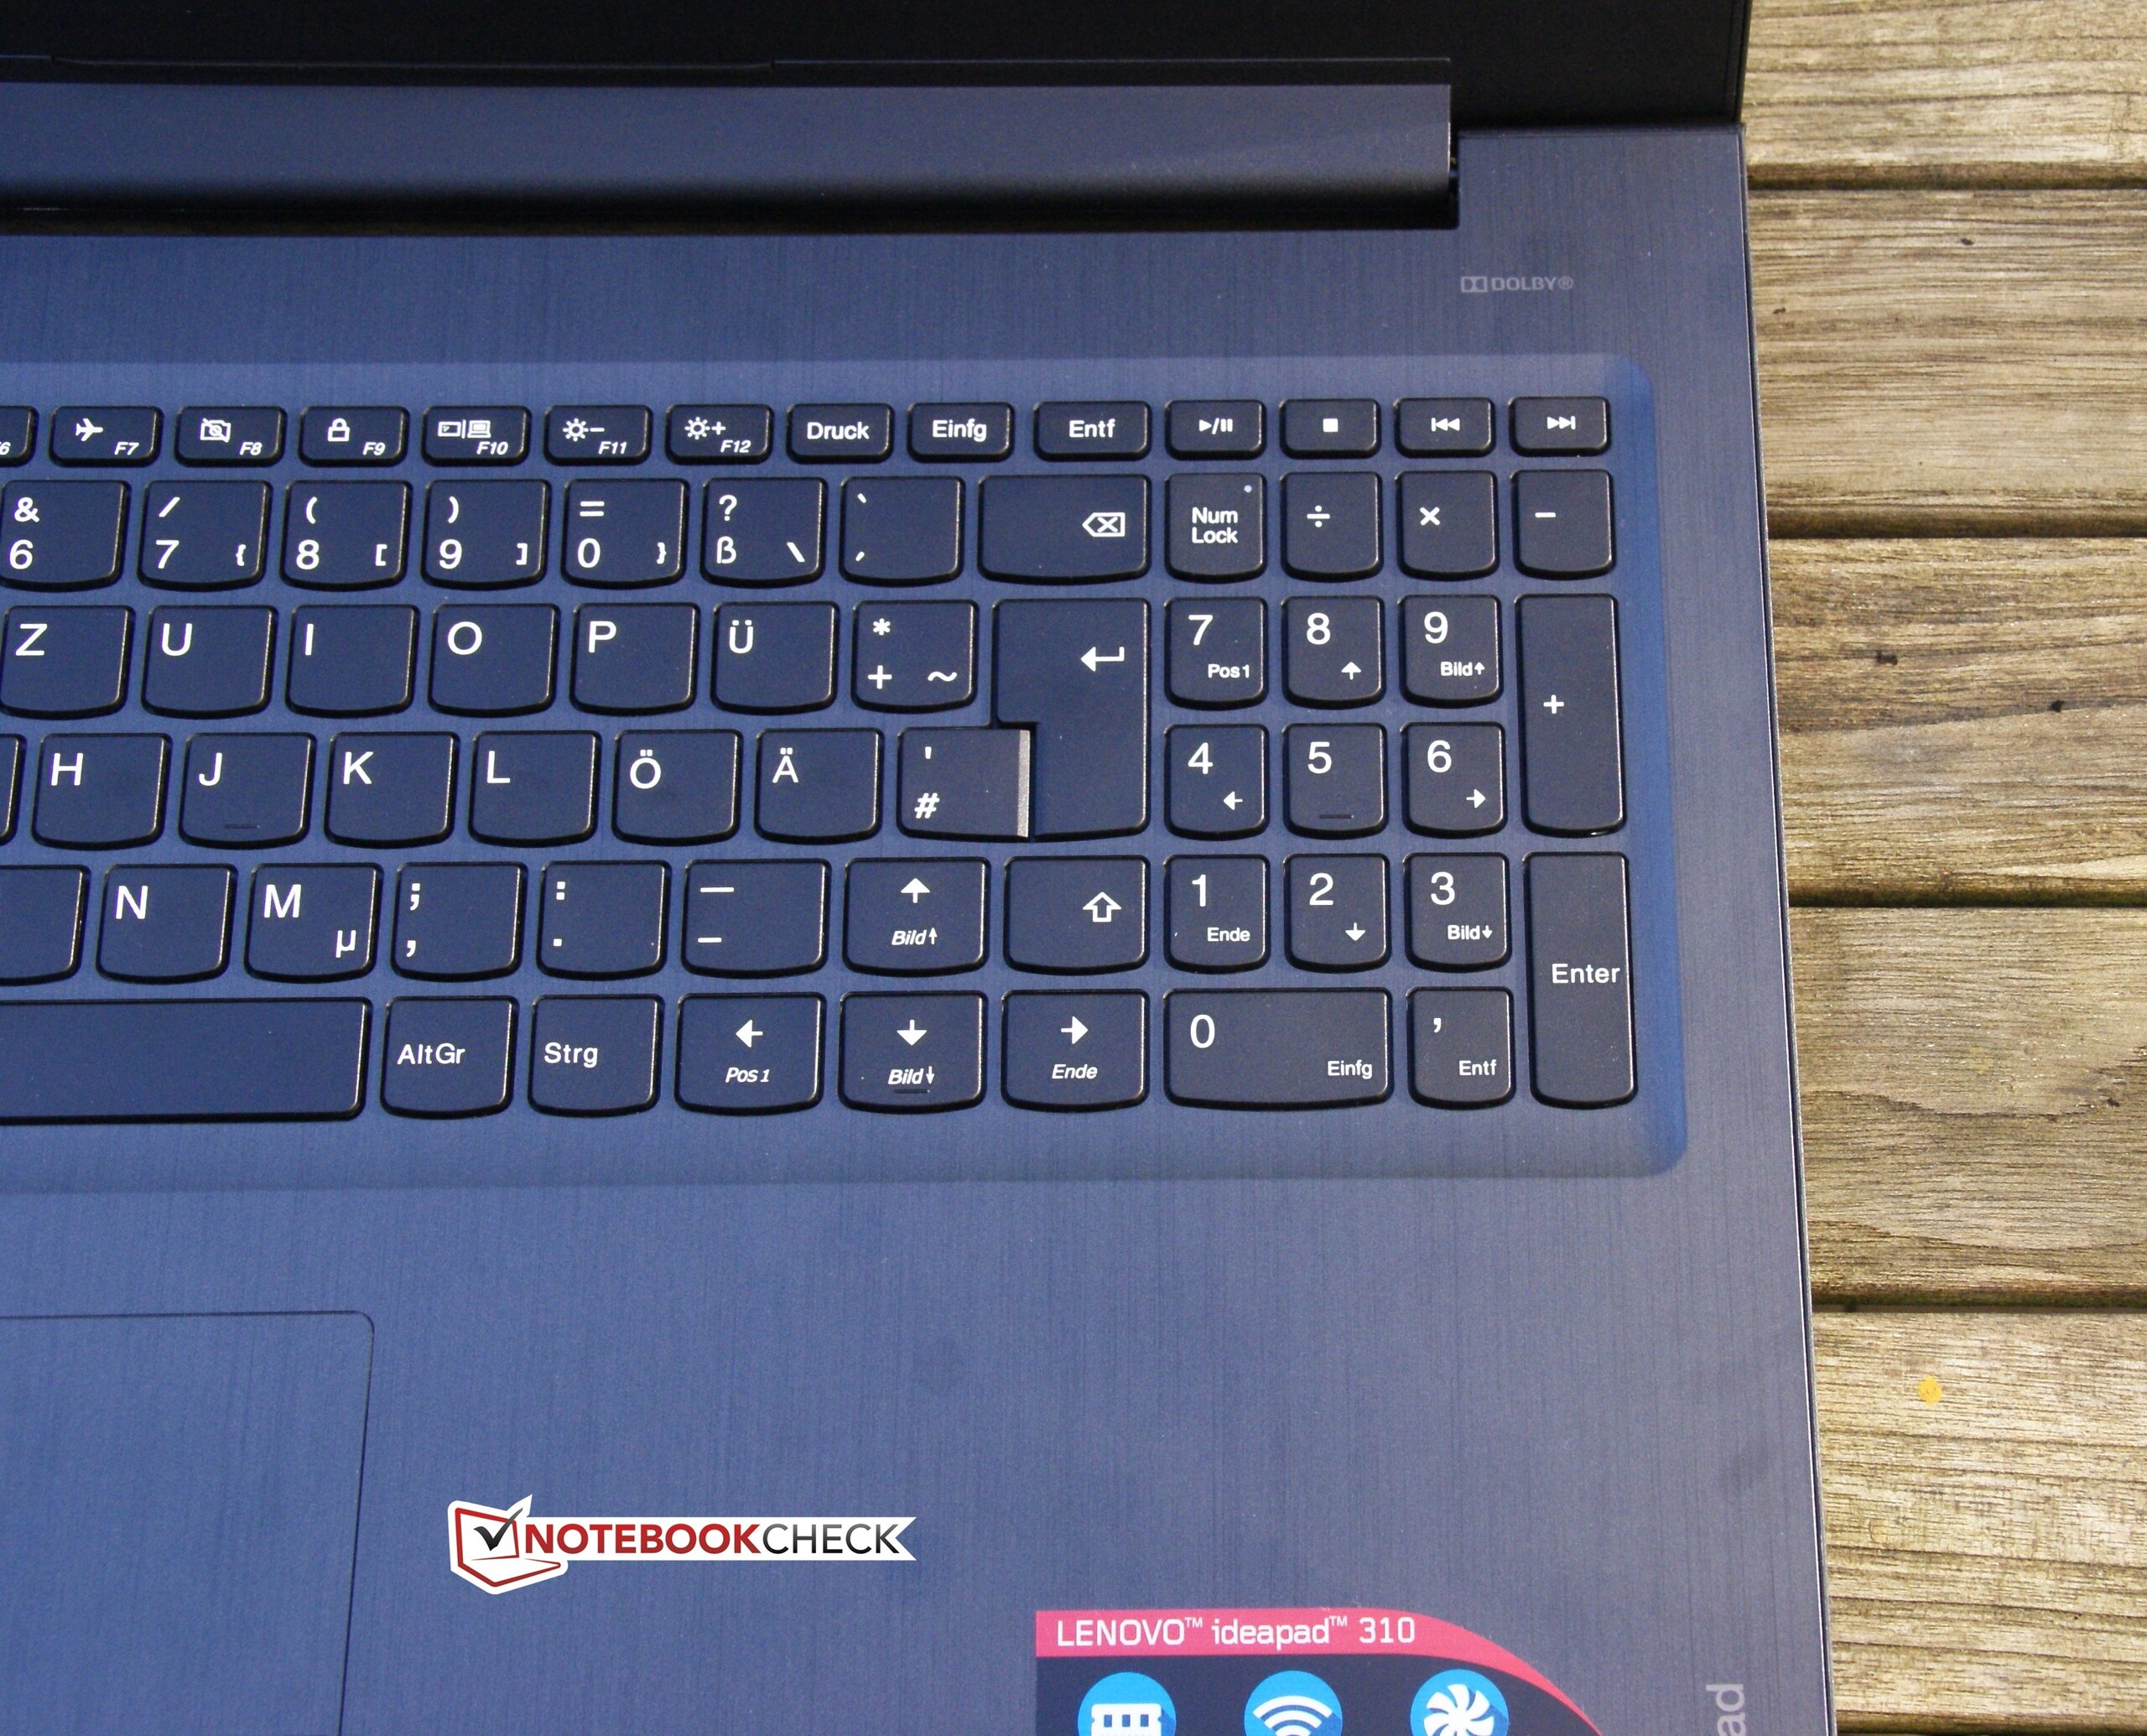
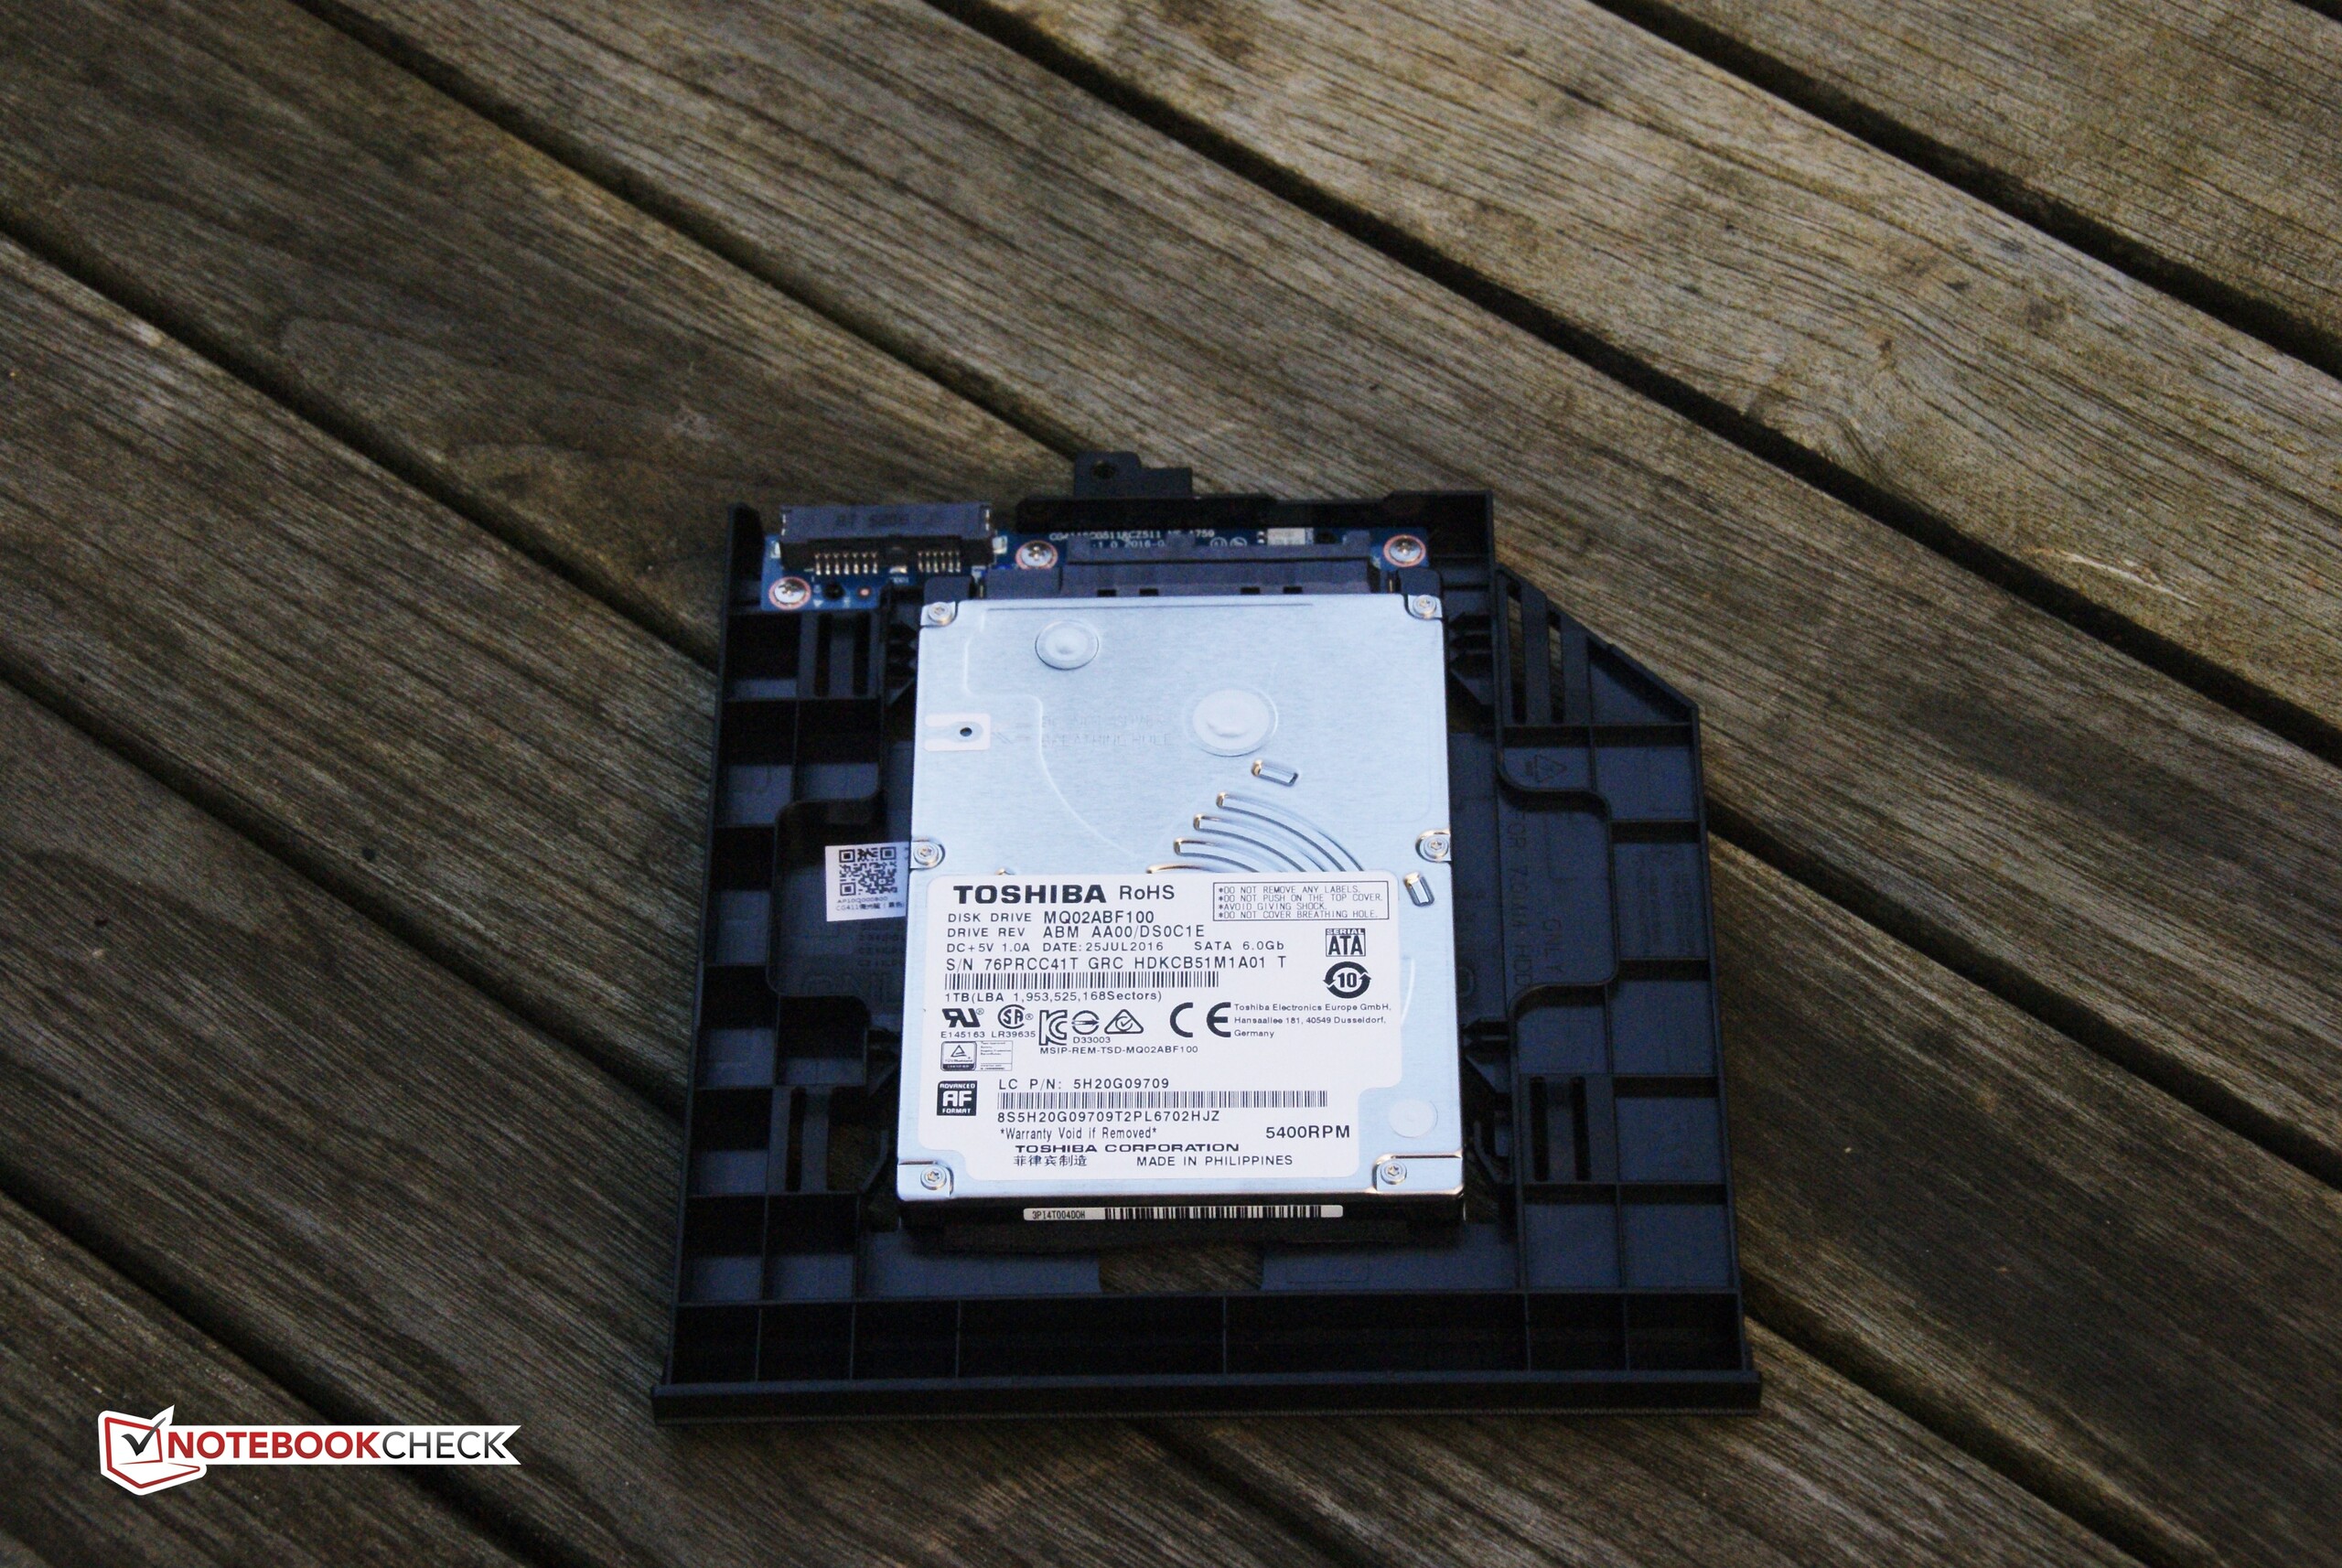
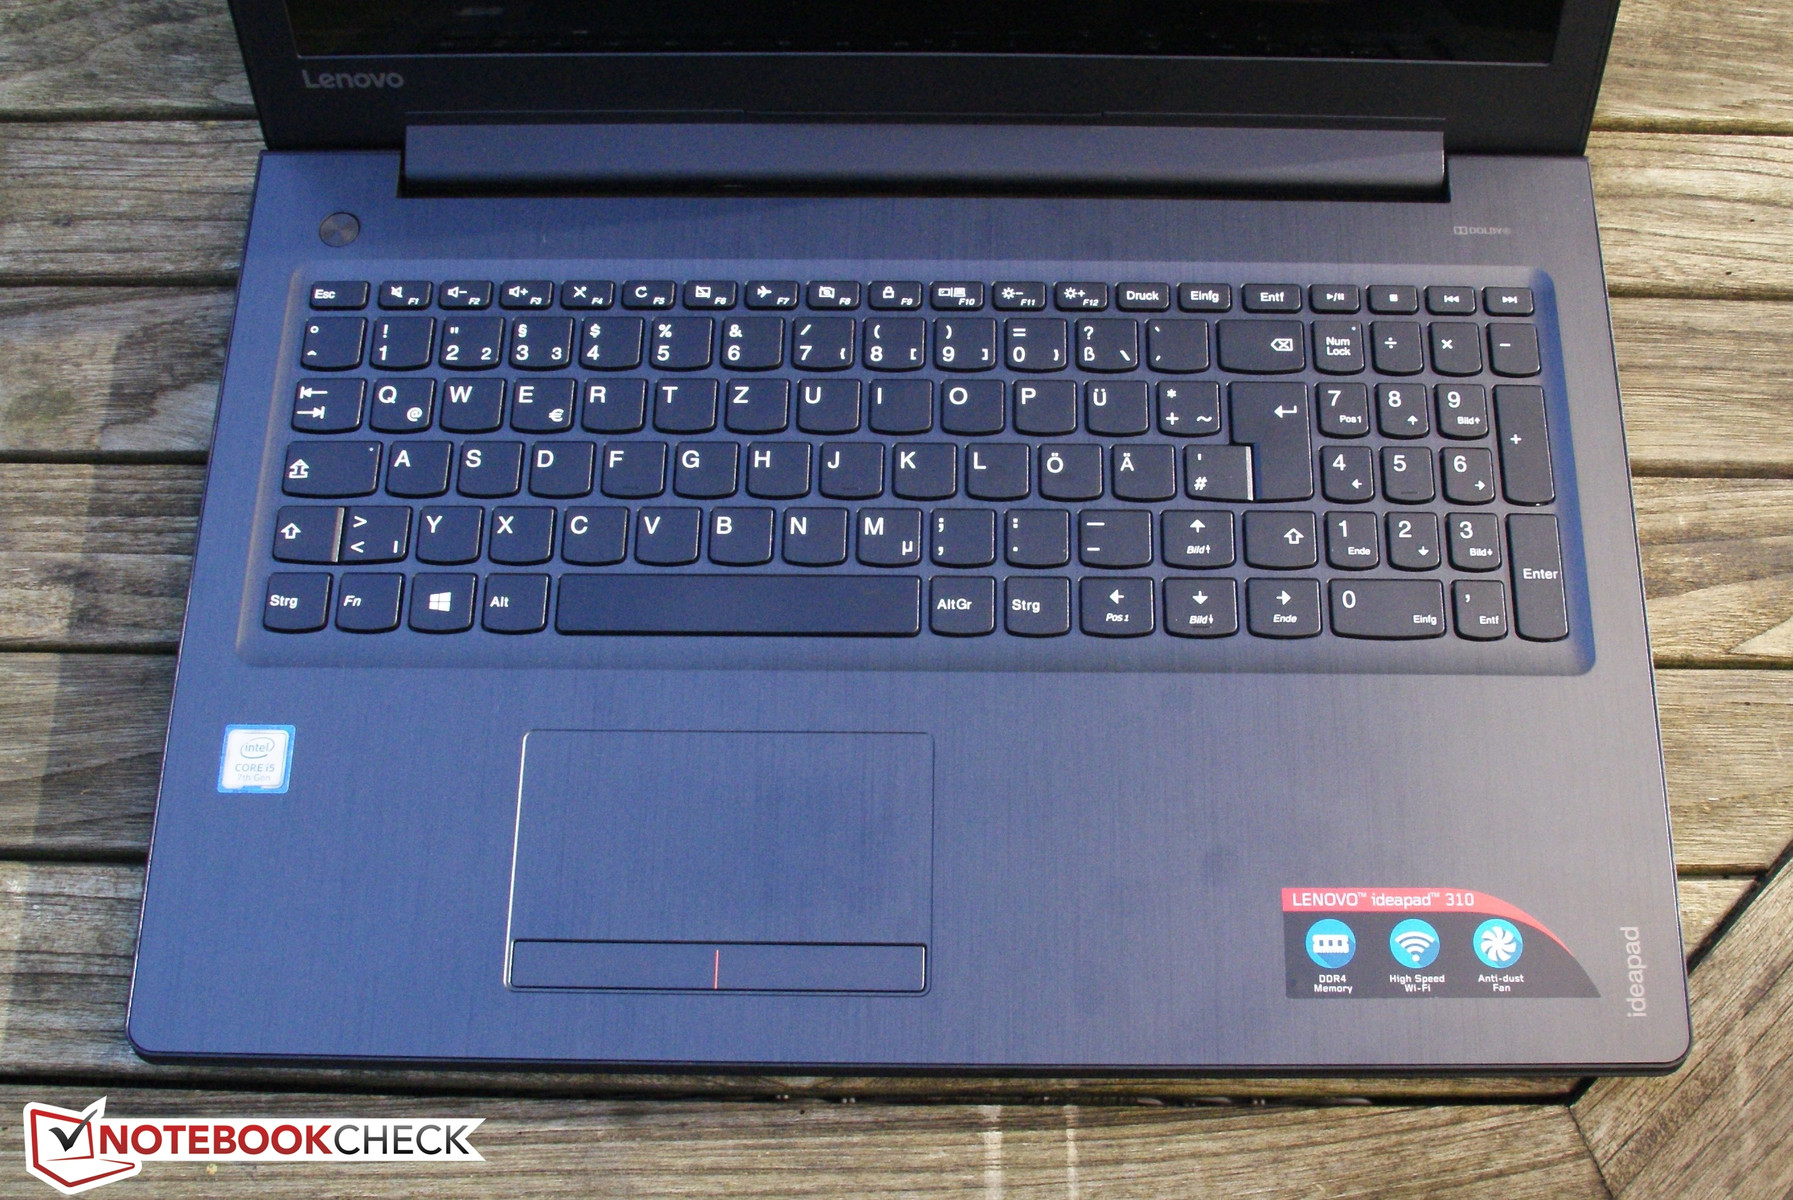
Il Lenovo IdeaPad 310-15IKB punta ad essere un tuttofare multimedia e da ufficio. Tuttavia, per essere un vero portatile multimedia, ha bisogno di uno schermo migliore e di una GPU più potente. D'altro canto, il portatile è un buon dispositivo da ufficio con qualche punto debole. Se vi piace lavorare in silenzio, questo modello non fa per voi, in quanto l'HDD dell'IdeaPad ha una rumorosità costante. Questo problema può essere risolto cambiando l'HDD con un SSD. I tasti del mouse sono altrettanto fastidiosi da usare, ma la tastiera è affidabile. Non è possibile usarlo all'aperto a causa del display scarso e della batteria piccola.
Alla fine del test, non abbiamo molti argomenti per raccomandare l'IdeaPad. E' effettivamente nella media e non emerge dalla massa.
Perché dovreste comprare l'IdeaPad 310-15IKB? Il motivo principale è il prezzo. Questo portatile è più economico rispetto al altri concorrenti. Tuttavia, d'altro canto, conviene spendere di più ed avere un pannello IPS nettamente migliore. Questo è un aspetto particolarmente importante, in quando la scarsa qualità del nostro schermo è uno dei principali punti deboli.
Nota: si tratta di una recensione breve, con alcune sezioni non tradotte, per la versione integrale in inglese guardate qui.
Lenovo Ideapad 310-15IKB
- 11/29/2016 v5.1 (old)
Benjamin Herzig