Intel HD Graphics 405 (Braswell)
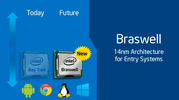
L'Intel HD Graphics 405 (Braswell) è una scheda grafica integrata nei SoCs low end della serie Braswell (i.e. Pentium N3710). Si basa sulla stessa architettura della GPU integrata delle schede grafiche Broadwell (i.e. HD Graphics 5300), ma offre meno shader cores e velocità clock inferiori.
La GPU era chiamata semplicemente Intel HD Graphics (Broadwell) prima del 2016 ed includeva anche la versione più lenta 12 EUs nel modello Celeron. Il nome Graphics 405 attualmente si riferisce solo alle versioni 16-core dei modelli Pentium. La versione 12 EU ora è chiamata Intel HD Graphics 400.
La velocità clock e la configurazione della memoria possono ancora variare da modello a modello.
Le prestazioni gaming sono ancora adatte solo per i giochi più vecchi e meno pesanti. Spesso anche il processore ha prestazioni gaming limitate (i.e. nel dual-core N3000).
Il SoC integra anche un motore decoding video che dovrebbe essere in grado di gestire i videos 4K H.265.
HD Graphics Serie Nome in codice Braswell Architettura Gen. 8 Pipelines 16 - unified Velocità del core 320 - 700 (Boost) MHz Larghezza del bus di memoria 64/128 Bit Memoria condivisa si API DirectX 11.2, Shader 5.0 tecnologia 14 nm Data dell'annuncio 01.04.2016
CPU in HD Graphics 405 (Braswell) GPU Base Speed GPU Boost / Turbo Intel Pentium N3710 4 x 1600 MHz, 6 W 400 MHz 700 MHz Intel Atom x7-Z8750 4 x 1600 MHz 400 MHz 600 MHz min. - max. 400 MHz 600 - 700 MHz
Benchmark Performance Rating - 3DMark 11 + Fire Strike + Time Spy
1.8 pt (2%)
...
Intel HD Graphics 405 (Braswell)
...
3DMark - 3DMark Ice Storm Unlimited Graphics
min: 19812 media: 23763 media: 23763 (3%) massimo: 27714 Points
Intel HD Graphics (Cherry Trail) -12%
Intel HD Graphics 405 (Braswell)
AMD Radeon R4 (Stoney Ridge) 54%
...
3DMark - 3DMark Ice Storm Extreme Graphics
min: 12601 media: 14069 media: 14068.5 (2%) massimo: 15536 Points
Intel HD Graphics 405 (Braswell)
...
NVIDIA GeForce RTX 3080 Laptop GPU 2852%
3DMark - 3DMark Cloud Gate Score
min: 1743 media: 2000 media: 1933 (2%) massimo: 2392 Points
...
Intel HD Graphics 405 (Braswell)
AMD Radeon R2 (Stoney Ridge) 5%
AMD Radeon R4 (Stoney Ridge) 5%
...
3DMark - 3DMark Cloud Gate Graphics
min: 1767 media: 2206 media: 2113 (1%) massimo: 2831 Points
...
AMD Radeon HD 8180 -32%
Intel HD Graphics (Cherry Trail) -16%
Intel HD Graphics 405 (Braswell)
...
3DMark - 3DMark Fire Strike Standard Score
min: 216 media: 237.5 media: 237.5 (1%) massimo: 259 Points
AMD Radeon HD 8180 -31%
Intel HD Graphics 405 (Braswell)
...
3DMark - 3DMark Fire Strike Standard Graphics
min: 231 media: 254.5 media: 254.5 (0%) massimo: 278 Points
Intel HD Graphics (Cherry Trail) -8%
Intel HD Graphics 405 (Braswell)
...
3DMark - 3DMark Ice Storm Graphics
min: 26056 media: 28119 media: 28119 (4%) massimo: 30182 Points
...
Intel HD Graphics 405 (Braswell)
...
3DMark 11 - 3DM11 Performance Score
min: 451 media: 523 media: 537 (1%) massimo: 565 Points
...
Intel HD Graphics 405 (Braswell)
...
3DMark 11 - 3DM11 Performance GPU
min: 408 media: 469.1 media: 473 (1%) massimo: 496 Points
...
Intel HD Graphics 405 (Braswell)
...
3DMark Vantage 3DM Vant. Perf. total + 3DMark Vantage - 3DM Vant. Perf. total
2081 Points (1%)
...
Intel HD Graphics 405 (Braswell)
AMD Radeon R2 (Stoney Ridge) 3%
...
3DM Vant. Perf. GPU no PhysX + 3DMark Vantage - 3DM Vant. Perf. GPU no PhysX
1730 Points (1%)
...
Intel HD Graphics 405 (Braswell)
...
3DMark 06 3DMark 06 - Standard 1280x1024 +
min: 2274 media: 2920 media: 2920 (4%) massimo: 3566 Points
...
Intel HD Graphics (Cherry Trail) -3%
Intel HD Graphics 405 (Braswell)
NVIDIA NVS 2100M 2%
...
Unigine Heaven 2.1 - Heaven 2.1 high
7.4 fps (1%)
...
Intel HD Graphics (Cherry Trail) -23%
Intel HD Graphics 405 (Braswell)
AMD Radeon R2 (Stoney Ridge) 5%
AMD Radeon R4 (Stoney Ridge) 13%
...
Cinebench R10 Cinebench R10 Shading (32bit) + Cinebench R10 - Cinebench R10 Shading (32bit)
min: 2412 media: 2685 media: 2753 (12%) massimo: 2822 punti
Intel Graphics Media Accelerator (GMA) 500 -99%
...
Intel HD Graphics 405 (Braswell)
...
Cinebench R11.5 Cinebench R11.5 OpenGL 64 Bit + Cinebench R11.5 - Cinebench R11.5 OpenGL 64 Bit
min: 10.24 media: 11.7 media: 11.7 (4%) massimo: 13.06 fps
...
ATI Mobility Radeon HD 5145 -11%
Intel HD Graphics 405 (Braswell)
Intel HD Graphics (Broadwell) 10%
...
Cinebench R15 Cinebench R15 OpenGL 64 Bit + Cinebench R15 - Cinebench R15 OpenGL 64 Bit
min: 10.3 media: 13.8 media: 14.1 (4%) massimo: 15.74 fps
...
Intel HD Graphics 405 (Braswell)
AMD Radeon R2 (Stoney Ridge) 9%
...
Cinebench R15 OpenGL Ref. Match 64 Bit + Cinebench R15 - Cinebench R15 OpenGL Ref. Match 64 Bit
min: 9 media: 83.2 media: 98 (98%) massimo: 98 %
Intel HD Graphics 405 (Braswell)
...
GFXBench (DX / GLBenchmark) 2.7 GFXBench 2.7 T-Rex HD Onscreen C24Z16 + GFXBench (DX / GLBenchmark) 2.7 - GFXBench 2.7 T-Rex HD Onscreen C24Z16
55.5 fps (2%)
...
Intel HD Graphics (Broadwell) -9%
Intel Iris Plus Graphics G7 (Ice Lake 64 EU) -4%
Intel HD Graphics 405 (Braswell)
AMD Radeon R2 (Stoney Ridge) 1%
NVIDIA GeForce GTX 1050 Ti Max-Q 2%
NVIDIA GeForce GTX 1050 Max-Q 2%
Intel UHD Graphics Xe G4 48EUs 5%
...
GFXBench T-Rex HD Offscreen C24Z16 + GFXBench (DX / GLBenchmark) 2.7 - GFXBench T-Rex HD Offscreen C24Z16
41.3 fps (0%)
...
Intel HD Graphics 405 (Braswell)
AMD Radeon R2 (Stoney Ridge) 3%
Intel HD Graphics (Broadwell) 14%
...
GFXBench 3.0 - GFXBench 3.0 Manhattan
33 fps (9%)
...
Intel UHD Graphics 615 -7%
Intel HD Graphics 405 (Braswell)
NVIDIA GeForce GTX 1050 Max-Q 22%
AMD Radeon RX Vega 8 (Ryzen 2000/3000) 25%
AMD Radeon RX Vega 10 26%
...
GFXBench 3.0 - GFXBench 3.0 Manhattan Offscreen
20.3 fps (2%)
...
AMD Radeon R2 (Stoney Ridge) -19%
AMD Radeon R4 (Stoney Ridge) -9%
AMD Radeon R6 M340DX -1%
Intel HD Graphics 405 (Braswell)
Intel HD Graphics (Broadwell) 6%
...
Apple M1 Max 32-Core GPU 5944%
GFXBench - GFXBench Car Chase Onscreen
18.8 fps (1%)
Intel HD Graphics (Cherry Trail) -68%
...
AMD Radeon R2 (Stoney Ridge) -21%
Intel UHD Graphics 615 -6%
AMD Radeon R4 (Stoney Ridge) -3%
Intel HD Graphics 405 (Braswell)
Intel Iris Plus Graphics G7 (Ice Lake 64 EU) 28%
NVIDIA GeForce GTX 1050 Max-Q 33%
...
NVIDIA GeForce RTX 3070 Laptop GPU 18751%
GFXBench - GFXBench Car Chase Offscreen
9.9 fps (0%)
...
Intel HD Graphics (Cherry Trail) -26%
Intel HD Graphics 405 (Braswell)
AMD Radeon R2 (Stoney Ridge) 5%
AMD Radeon R4 (Stoney Ridge) 36%
Intel UHD Graphics 615 63%
...
NVIDIA GeForce RTX 3070 Laptop GPU 243900%
LuxMark v2.0 64Bit - LuxMark v2.0 Room GPU
min: 56 media: 68 media: 68 (0%) massimo: 80 Samples/s
...
Intel HD Graphics (Cherry Trail) -14%
Intel HD Graphics 405 (Braswell)
Intel HD Graphics (Broadwell) 26%
...
LuxMark v2.0 64Bit - LuxMark v2.0 Sala GPU
min: 81 media: 102.5 media: 102.5 (0%) massimo: 124 Samples/s
...
Intel HD Graphics (Cherry Trail) -14%
Intel HD Graphics 405 (Braswell)
AMD Radeon R2 (Stoney Ridge) 10%
...
ComputeMark v2.1 - ComputeMark v2.1 Result
min: 388 media: 390.5 media: 390.5 (1%) massimo: 393 punti
...
Intel HD Graphics (Broadwell) -4%
Intel HD Graphics 405 (Braswell)
AMD Radeon R2 (Stoney Ridge) 11%
...
Power Consumption - Furmark Stress Test Power Consumption - external Monitor *
9.8 Watt (2%)
Intel HD Graphics 405 (Braswell)
Qualcomm Adreno 680 29%
Intel UHD Graphics 615 115%
...
- Valori di benchmark per questa scheda grafica
- Valori medi di benchmark per questa scheda grafica
* Numeri più piccoli rappresentano prestazioni supeiori
Benchmarks per i giochi I seguenti benchmarks deirivano dai benchmarks dei portatili recensiti. Le prestazioni dipendono dalla scheda grafica utilizzata, dal clock rate, dal processore, dai settaggi di sistema, dai drivers, e dai sistemi operativi. Quindi i risultati non sono rappresentativi per i portatili con questa GPU. Per informazioni dettagliate sui risultati del benchmark, cliccate sul numero di fps.
Intel HD Graphics 405 (Braswell)
AMD Radeon RX Vega 7 495%
...
» Il Benchmark indica che il gioco non è utilizzabile con i settaggi testati.
Intel HD Graphics 405 (Braswell)
AMD Radeon RX Vega 10 261%
AMD Radeon RX Vega 8 (Ryzen 2000/3000) 332%
...
Intel HD Graphics 405 (Braswell)
AMD Radeon RX Vega 10 274%
AMD Radeon RX Vega 8 (Ryzen 2000/3000) 340%
...
Intel HD Graphics 405 (Braswell)
AMD Radeon RX Vega 10 322%
AMD Radeon RX Vega 8 (Ryzen 2000/3000) 404%
...
» Il Benchmark indica che il gioco non è utilizzabile con i settaggi testati.
Apple M1 8-Core GPU
...
Intel HD Graphics 405 (Braswell)
Apple M1 8-Core GPU
Intel HD Graphics 405 (Braswell)
Apple M1 8-Core GPU 146%
» Giocabile con tutti i portatili testati con dettagli basso.
Intel HD Graphics 405 (Braswell)
» Il Benchmark indica che il gioco non è utilizzabile con i settaggi testati.
Intel HD Graphics 405 (Braswell)
» Il Benchmark indica che il gioco non è utilizzabile con i settaggi testati.
Intel HD Graphics 405 (Braswell)
» Giocabile con tutti i portatili testati con dettagli alto.
Intel HD Graphics 405 (Braswell)
AMD Radeon R2 (Stoney Ridge) 1%
Intel HD Graphics (Cherry Trail) 9%
AMD Radeon R4 (Stoney Ridge) 17%
...
AMD Radeon Pro 560X 772%
» Il Benchmark indica che il gioco non è utilizzabile con i settaggi testati.
Intel HD Graphics (Cherry Trail) -17%
Intel HD Graphics 405 (Braswell)
AMD Radeon R2 (Stoney Ridge) 65%
...
» Il Benchmark indica che il gioco non è utilizzabile con i settaggi testati.
Intel HD Graphics 405 (Braswell)
...
AMD FirePro W4190M -1%
Intel HD Graphics 405 (Braswell)
Intel HD Graphics 630 35%
...
» Il Benchmark indica che il gioco non è utilizzabile con i settaggi testati.
Intel HD Graphics 405 (Braswell)
AMD Radeon R5 (Bristol Ridge) 94%
...
Intel HD Graphics 405 (Braswell)
AMD Radeon R5 (Bristol Ridge) 123%
...
» Il Benchmark indica che il gioco non è utilizzabile con i settaggi testati.
Intel HD Graphics (Cherry Trail) -6%
Intel HD Graphics 405 (Braswell)
AMD Radeon R4 (Stoney Ridge) 58%
AMD Radeon R2 (Stoney Ridge) 81%
...
Intel HD Graphics 405 (Braswell)
AMD Radeon R4 (Stoney Ridge) 16%
AMD Radeon R2 (Stoney Ridge) 24%
...
» Il Benchmark indica che il gioco non è utilizzabile con i settaggi testati.
Intel HD Graphics 405 (Braswell)
Intel UHD Graphics G1 (Ice Lake 32 EU) 61%
AMD Radeon R2 (Stoney Ridge) 77%
...
Intel HD Graphics 405 (Braswell)
AMD Radeon R2 (Stoney Ridge) 63%
...
» Il Benchmark indica che il gioco non è utilizzabile con i settaggi testati.
Intel HD Graphics 405 (Braswell)
...
Intel HD Graphics 405 (Braswell)
AMD Radeon R5 (Bristol Ridge) 123%
...
» Il Benchmark indica che il gioco non è utilizzabile con i settaggi testati.
Intel HD Graphics 405 (Braswell)
Intel Iris Plus Graphics G4 (Ice Lake 48 EU) 44%
...
Intel HD Graphics 405 (Braswell)
...
» Il Benchmark indica che il gioco non è utilizzabile con i settaggi testati.
Intel HD Graphics (Cherry Trail) -25%
Intel HD Graphics 405 (Braswell)
AMD Radeon R2 (Stoney Ridge) 33%
...
Intel HD Graphics (Cherry Trail) -21%
Intel HD Graphics 405 (Braswell)
AMD Radeon R2 (Stoney Ridge) 55%
...
» Il Benchmark indica che il gioco non è utilizzabile con i settaggi testati.
Intel HD Graphics (Cherry Trail) -25%
Intel HD Graphics 405 (Braswell)
AMD Radeon R5 (Bristol Ridge) 61%
...
Intel HD Graphics (Cherry Trail) -43%
Intel HD Graphics 405 (Braswell)
AMD Radeon R5 (Bristol Ridge) 59%
...
» Il Benchmark indica che il gioco non è utilizzabile con i settaggi testati.
Intel HD Graphics (Cherry Trail) -15%
Intel HD Graphics 405 (Braswell)
AMD Radeon R2 (Stoney Ridge) 42%
...
Intel HD Graphics 405 (Braswell)
...
» Il Benchmark indica che il gioco non è utilizzabile con i settaggi testati.
Intel HD Graphics (Cherry Trail) -20%
Intel HD Graphics 405 (Braswell)
AMD Radeon R2 (Stoney Ridge) 26%
AMD Radeon R4 (Stoney Ridge) 38%
...
Intel HD Graphics (Cherry Trail) -25%
Intel HD Graphics 405 (Braswell)
AMD Radeon R4 (Stoney Ridge) 38%
AMD Radeon R2 (Stoney Ridge) 42%
...
» Il Benchmark indica che il gioco non è utilizzabile con i settaggi testati.
Intel HD Graphics (Cherry Trail) -31%
AMD Radeon R2 (Stoney Ridge) -1%
Intel HD Graphics 405 (Braswell)
AMD Radeon R4 (Stoney Ridge) 11%
AMD Radeon R5 (Bristol Ridge) 31%
...
Intel HD Graphics (Cherry Trail) -16%
Intel HD Graphics 405 (Braswell)
AMD Radeon R2 (Stoney Ridge) 2%
AMD Radeon R4 (Stoney Ridge) 6%
...
NVIDIA GeForce RTX 2080 Super Mobile 774%
» Il Benchmark indica che il gioco non è utilizzabile con i settaggi testati.
...
AMD Radeon R2 (Stoney Ridge) -40%
Intel HD Graphics 405 (Braswell)
AMD Radeon R4 (Stoney Ridge) 18%
Intel HD Graphics (Broadwell) 20%
...
Intel HD Graphics 405 (Braswell)
AMD Radeon R2 (Stoney Ridge) 4%
Intel HD Graphics (Broadwell) 8%
...
» Giocabile con tutti i portatili testati con dettagli basso.
Intel HD Graphics (Cherry Trail) -21%
AMD Radeon R2 (Stoney Ridge) -7%
Intel HD Graphics 405 (Braswell)
Intel HD Graphics (Broadwell) 15%
AMD Radeon R4 (Stoney Ridge) 25%
...
Intel HD Graphics (Cherry Trail) -25%
Intel HD Graphics 405 (Braswell)
AMD Radeon R2 (Stoney Ridge) 14%
Intel HD Graphics (Broadwell) 24%
...
» Il Benchmark indica che il gioco non è utilizzabile con i settaggi testati.
...
Intel HD Graphics (Cherry Trail) -43%
Intel HD Graphics 405 (Braswell)
AMD Radeon R4 (Stoney Ridge) 7%
Intel HD Graphics (Broadwell) 21%
...
...
Intel HD Graphics (Cherry Trail) -29%
Intel HD Graphics 405 (Braswell)
AMD Radeon R2 (Stoney Ridge) 6%
Intel HD Graphics (Broadwell) 41%
...
» Il Benchmark indica che il gioco non è utilizzabile con i settaggi testati.
AMD Radeon R2 (Stoney Ridge) -6%
Intel HD Graphics 405 (Braswell)
AMD Radeon R7 M260 37%
...
...
AMD Radeon R2 (Stoney Ridge) -24%
Intel HD Graphics 405 (Braswell)
...
» Il Benchmark indica che il gioco non è utilizzabile con i settaggi testati.
...
Intel HD Graphics (Cherry Trail) -8%
Intel HD Graphics 405 (Braswell)
AMD Radeon R2 (Stoney Ridge) 6%
...
...
Intel HD Graphics (Cherry Trail) -19%
Intel HD Graphics 405 (Braswell)
AMD Radeon R2 (Stoney Ridge) 6%
...
» Giocabile con tutti i portatili testati con dettagli basso.
Intel HD Graphics 405 (Braswell)
AMD Radeon R2 (Stoney Ridge) 1%
...
AMD Radeon R2 (Stoney Ridge) -4%
Intel HD Graphics 405 (Braswell)
...
» Il Benchmark indica che il gioco non è utilizzabile con i settaggi testati.
Intel HD Graphics (Cherry Trail) -51%
AMD Radeon R2 (Stoney Ridge) -9%
Intel HD Graphics 405 (Braswell)
AMD Radeon R4 (Stoney Ridge) 13%
Intel HD Graphics (Broadwell) 14%
...
Intel HD Graphics (Cherry Trail) -13%
Intel HD Graphics 405 (Braswell)
AMD Radeon R2 (Stoney Ridge) 13%
...
» Giocabile con tutti i portatili testati con dettagli basso.
Intel HD Graphics 405 (Braswell)
...
» Il Benchmark indica che il gioco non è utilizzabile con i settaggi testati.
Intel HD Graphics (Cherry Trail) -19%
Intel HD Graphics 405 (Braswell)
...
Intel HD Graphics 405 (Braswell)
...
Intel HD Graphics 405 (Braswell)
...
» Il Benchmark indica che il gioco non è utilizzabile con i settaggi testati.
...
Intel HD Graphics (Cherry Trail) -6%
Intel HD Graphics 405 (Braswell)
...
...
Intel HD Graphics (Cherry Trail) -19%
Intel HD Graphics 405 (Braswell)
...
...
Intel HD Graphics 405 (Braswell)
Intel HD Graphics (Broadwell) 17%
...
» Il Benchmark indica che il gioco non è utilizzabile con i settaggi testati.
...
Intel HD Graphics (Cherry Trail) -1%
Intel HD Graphics 405 (Braswell)
...
...
Intel HD Graphics 405 (Braswell)
Intel HD Graphics (Cherry Trail) 0%
AMD Radeon R2 (Stoney Ridge) 23%
...
...
Intel HD Graphics (Cherry Trail) -15%
Intel HD Graphics 405 (Braswell)
AMD Radeon R2 (Stoney Ridge) 17%
...
» Il Benchmark indica che il gioco non è utilizzabile con i settaggi testati.
...
Intel HD Graphics 405 (Braswell)
AMD Radeon R2 (Stoney Ridge) 1%
AMD Radeon R4 (Stoney Ridge) 5%
...
...
Intel HD Graphics 405 (Braswell)
AMD Radeon R2 (Stoney Ridge) 6%
AMD Radeon R4 (Stoney Ridge) 17%
...