Notebookcheck Logo

AMD Radeon HD 8550G

AMD Radeon HD 8550G

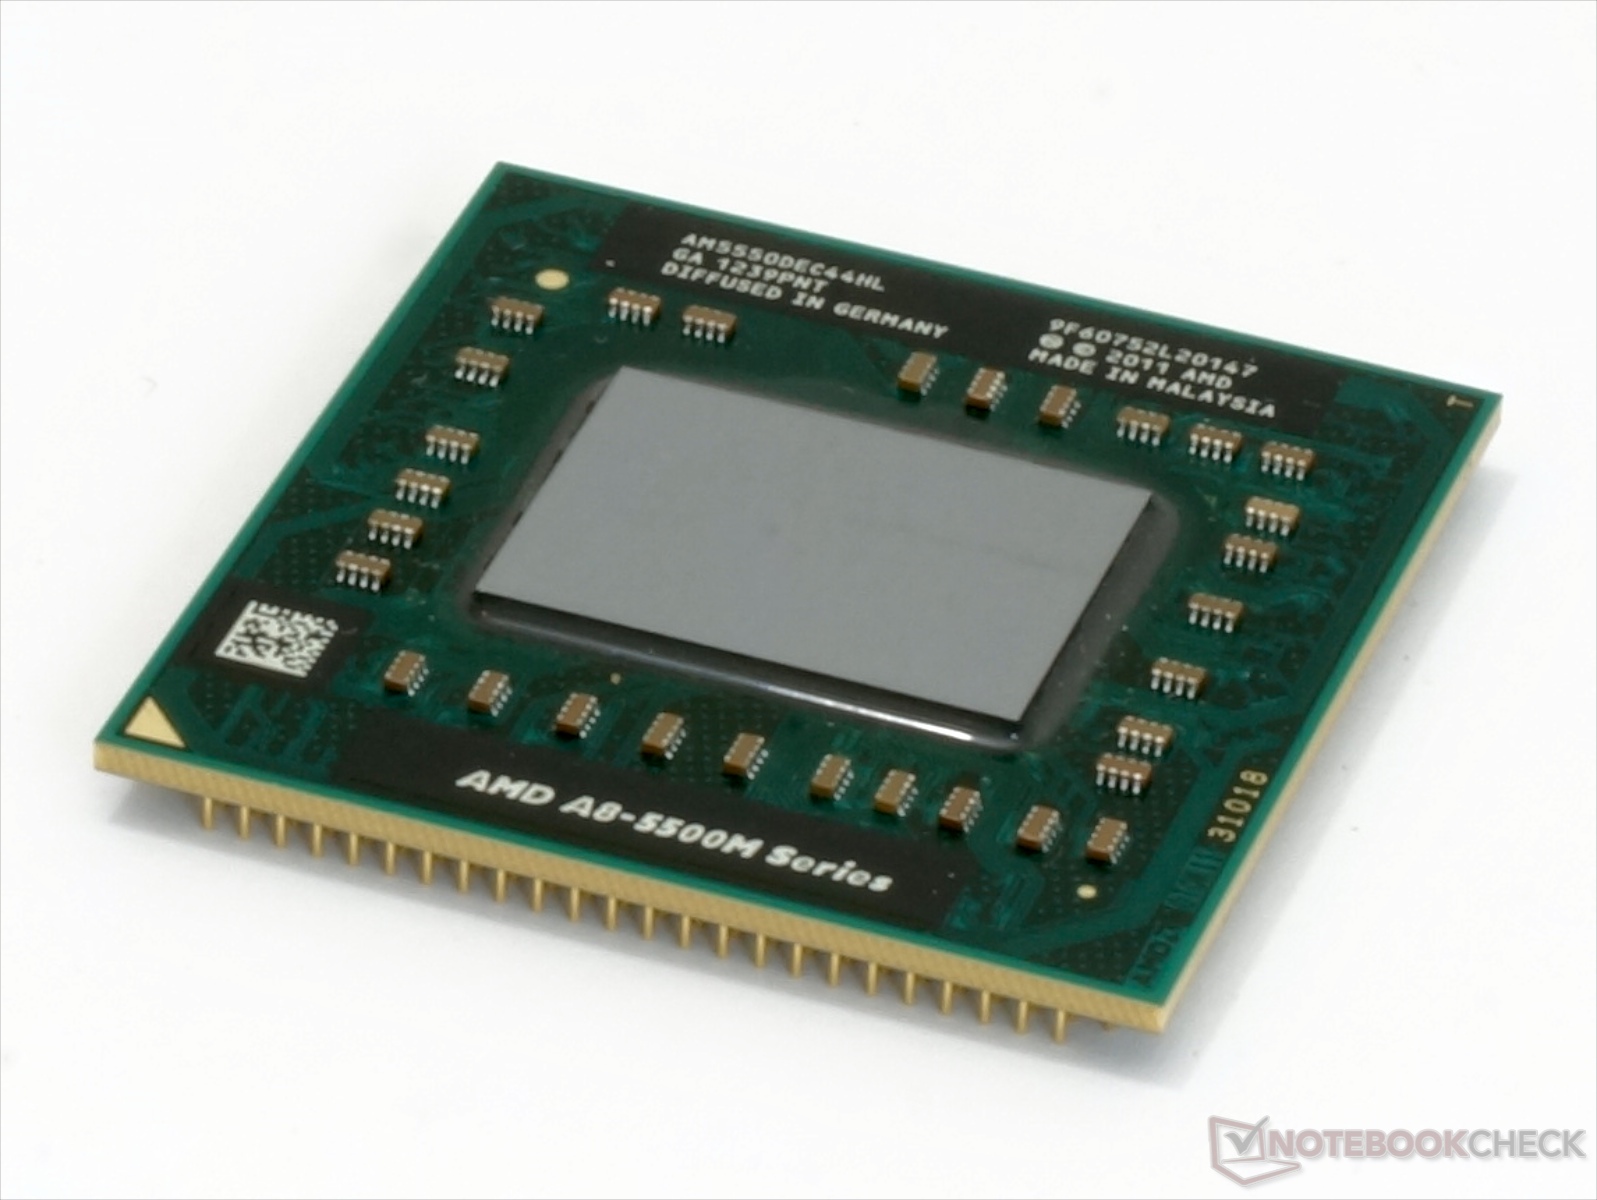
L'AMD Radeon HD 8550G è una scheda grafica integrata nei processori APUs AMD Richland (A8-5550M). Offre solo 256 shader cores VLIW4 (8650G: 384). La 8550G non ha memoria grafica dedicata, ma condivide la memoria principale con i cores CPU.

I decoder video UVD3 supporta il decoding di videos HD MPEG-4 AVC/H.264, VC-1, MPEG-2, Flash ed ora anche Multi-View Codec (MVC) e MPEG-4 part 2 (DivX, xVid) con la scheda grafica.

In base ai clock rates di 515 - 720 MHz (Turbo), le prestazioni dovrebbero essere di qualche punto percentuale sopra la Radeon HD 7640G. Pertanto, la Radeon HD 8550G ha prestazioni simili ad una Radeon HD 7570M dedicata. Tuttavia, senza la veloce memoria dual-channel le prestazioni calano in modo drammatico.

Gli shaders del chip possono essere utilizzati anche per calcoli generici.

L'APU è realizzata in 32nm ed a un TDP di 35 watts. Questo consente al chip di essere utilizzato su portatili da 13 a 14 pollici o superiori.

Radeon HD 8000G Serie

Radeon HD 8650G 384 @ 0.53 - 0.72 GHz
Radeon HD 8510G 384 @ 0.45 - 0.55 GHz
Radeon HD 8550G 256 @ 0.52 - 0.72 GHz
Radeon HD 8610G 384 @ 0.53 - 0.63 GHz
Radeon HD 8450G 192 @ 0.53 - 0.72 GHz
Radeon HD 8410G 192 @ 0.45 - 0.6 GHz
Radeon HD 8350G 128 @ 0.51 - 0.72 GHz
Radeon HD 8310G 128 @ 0.42 - 0.55 GHz
Nome in codiceRichland
ArchitetturaTerascale 3
Pipelines256 - unified
Velocità del core515 - 720 (Boost) MHz
Memoria condivisasi
APIDirectX 11, Shader 5.0, OpenGL 4.2
tecnologia32 nm
Dimensione del portatilemisura media
Data dell'annuncio12.03.2013
CPU in Radeon HD 8550GGPU Base SpeedGPU Boost / Turbo
AMD A8-5550M4 x 2100 MHz, 35 W515 MHz720 MHz
AMD A8-5557M4 x 2100 MHz, 35 W554 MHz720 MHz
min. - max.515 - 554 MHz720 MHz

Benchmark

Performance Rating - 3DMark 11 + Fire Strike + Time Spy
0.4 pt (1%)
3DMark - 3DMark Ice Storm Unlimited Graphics
67801 Points (8%)
3DMark - 3DMark Ice Storm Extreme Graphics
41713 Points (5%)
3DMark 11 - 3DM11 Performance Score
1280 Points (2%)
3DMark 11 - 3DM11 Performance GPU
1179 Points (1%)
171.8 -85%
...
1141 -3%
AMD Radeon HD 6730M
1141 -3%
1143 -3%
1144 -3%
AMD Radeon HD 6750M
1147 -3%
1148 -3%
1152 -2%
1161 -2%
Intel UHD Graphics 615
1175 0%
AMD Radeon HD 8550G
1179
1203 2%
1233 5%
1233 5%
1245 6%
1259 7%
1261 7%
1286 9%
1296 10%
1307 11%
...
59943 4984%
max:
106023 8893%
0%
100%
3DMark Vantage
3DM Vant. Perf. total +
3DM Vant. Perf. GPU no PhysX +
3DMark Vantage - 3DM Vant. Perf. GPU no PhysX
3741 Points (2%)
3DMark 06 3DMark 06 - Standard 1280x1024 +
3DMark 06
7314 Points (10%)
Unigine Heaven 3.0 - Unigine Heaven 3.0 OpenGL
5.4 fps (2%)
SPECviewperf 12
specvp12 sw-03 +
SPECviewperf 12 - specvp12 sw-03
17.2 fps (4%)
specvp12 snx-02 +
specvp12 showcase-01 +
SPECviewperf 12 - specvp12 showcase-01
6.6 fps (1%)
specvp12 mediacal-01 +
SPECviewperf 12 - specvp12 mediacal-01
2.1 fps (1%)
specvp12 maya-04 +
SPECviewperf 12 - specvp12 maya-04
8.9 fps (2%)
specvp12 energy-01 +
SPECviewperf 12 - specvp12 energy-01
0.2 fps (0%)
specvp12 creo-01 +
SPECviewperf 12 - specvp12 creo-01
8.5 fps (3%)
specvp12 catia-04 +
SPECviewperf 12 - specvp12 catia-04
11.7 fps (2%)
Cinebench R10 Cinebench R10 Shading (32bit) +
Cinebench R10 - Cinebench R10 Shading (32bit)
5224 punti (4%)
Cinebench R11.5 Cinebench R11.5 OpenGL 64 Bit +
Cinebench R15
Cinebench R15 OpenGL 64 Bit +
Cinebench R15 - Cinebench R15 OpenGL 64 Bit
28.9 fps (2%)
Cinebench R15 OpenGL Ref. Match 64 Bit +
Cinebench R15 - Cinebench R15 OpenGL Ref. Match 64 Bit
98 % (98%)
GFXBench (DX / GLBenchmark) 2.7
GFXBench T-Rex HD Offscreen C24Z16 +
LuxMark v2.0 64Bit - LuxMark v2.0 Room GPU
62 Samples/s (0%)
LuxMark v2.0 64Bit - LuxMark v2.0 Sala GPU
132 Samples/s (0%)
- Valori di benchmark per questa scheda grafica
- Valori medi di benchmark per questa scheda grafica
* Numeri più piccoli rappresentano prestazioni supeiori

Benchmarks per i giochi

I seguenti benchmarks deirivano dai benchmarks dei portatili recensiti. Le prestazioni dipendono dalla scheda grafica utilizzata, dal clock rate, dal processore, dai settaggi di sistema, dai drivers, e dai sistemi operativi. Quindi i risultati non sono rappresentativi per i portatili con questa GPU. Per informazioni dettagliate sui risultati del benchmark, cliccate sul numero di fps.

basso 1024x768
30.6  fps    + Confronta
medio 1366x768
19  fps    + Confronta
» Il Benchmark indica che il gioco non è utilizzabile con i settaggi testati.
basso 1280x720
28  fps    + Confronta
medio 1344x756
18  fps    + Confronta
» Il Benchmark indica che il gioco non è utilizzabile con i settaggi testati.
Fifa 15

Fifa 15

2014
basso 1280x720
48 (!)  fps    + Confronta
alto 1366x768
31.1  fps    + Confronta
ultra 1920x1080
16.9  fps    + Confronta
» Giocabile con tutti i portatili testati con dettagli basso.
basso 1024x768
39  fps    + Confronta
medio 1366x768
22.2  fps    + Confronta
alto 1920x1080
8.6  fps    + Confronta
» Giocabile con tutti i portatili testati con dettagli basso.
basso 1024x768
93  fps    + Confronta
medio 1366x768
39  fps    + Confronta
alto 1920x1080
17.1  fps    + Confronta
» Giocabile con tutti i portatili testati con dettagli medio.
basso 1024x768
20.3  fps    + Confronta
medio 1366x768
14.8  fps    + Confronta
» Il Benchmark indica che il gioco non è utilizzabile con i settaggi testati.
basso 1280x720
33.1  fps    + Confronta
medio 1280x720
29.8  fps    + Confronta
alto 1920x1080
13.4  fps    + Confronta
» Il Benchmark indica che il gioco non è utilizzabile con i settaggi testati.
basso 1024x768
36  fps    + Confronta
medio 1366x768
28  fps    + Confronta
alto 1366x768
18.2  fps    + Confronta
ultra 1920x1080
9.7  fps    + Confronta
» Giocabile con tutti i portatili testati con dettagli basso.
Titanfall

Titanfall

2014
basso 1024x768
52  fps    + Confronta
medio 1366x768
26  fps    + Confronta
alto 1366x768
20  fps    + Confronta
» Giocabile con tutti i portatili testati con dettagli basso.
Thief

Thief

2014
basso 1024x768
18.7  fps    + Confronta
medio 1366x768
12  fps    + Confronta
» Il Benchmark indica che il gioco non è utilizzabile con i settaggi testati.
basso 1024x768
27.5  fps    + Confronta
medio 1366x768
22.5  fps    + Confronta
alto 1366x768
11.3  fps    + Confronta
» Il Benchmark indica che il gioco non è utilizzabile con i settaggi testati.
basso 1024x768
33.6  fps    + Confronta
medio 1366x768
19.7  fps    + Confronta
» Il Benchmark indica che il gioco non è utilizzabile con i settaggi testati.
basso 1024x768
33.6  fps    + Confronta
medio 1366x768
23.5  fps    + Confronta
alto 1366x768
16.6  fps    + Confronta
ultra 1920x1080
5.3  fps    + Confronta
» Il Benchmark indica che il gioco non è utilizzabile con i settaggi testati.
F1 2013

F1 2013

2013
basso 1024x768
60  fps    + Confronta
medio 1366x768
38  fps    + Confronta
alto 1366x768
34  fps    + Confronta
ultra 1920x1080
16  fps    + Confronta
» Giocabile con tutti i portatili testati con dettagli medio.
Fifa 14

Fifa 14

2013
ultra 1920x1080
63  fps    + Confronta
» Giocabile con tutti i portatili testati con dettagli ultra.
basso 1024x768
47.7  fps    + Confronta
medio 1366x768
34.8  fps    + Confronta
alto 1366x768
27.5  fps    + Confronta
ultra 1920x1080
7  fps    + Confronta
» Giocabile con tutti i portatili testati con dettagli basso.
Dota 2

Dota 2

2013
basso 1024x768
53  fps    + Confronta
medio 1366x768
36.6  fps    + Confronta
ultra 1920x1080
17.7  fps    + Confronta
» Giocabile con tutti i portatili testati con dettagli medio.
basso 1024x768
17.1  fps    + Confronta
» Il Benchmark indica che il gioco non è utilizzabile con i settaggi testati.
GRID 2

GRID 2

2013
basso 1024x768
47  fps    + Confronta
medio 1366x768
34  fps    + Confronta
alto 1366x768
28.8  fps    + Confronta
ultra 1920x1080
12.5  fps    + Confronta
» Giocabile con tutti i portatili testati con dettagli basso.
basso 1024x768
27.6  fps    + Confronta
medio 1366x768
20.7  fps    + Confronta
alto 1366x768
10  fps    + Confronta
ultra 1920x1080
5  fps    + Confronta
» Il Benchmark indica che il gioco non è utilizzabile con i settaggi testati.
basso 1280x720
52  fps    + Confronta
» Giocabile con tutti i portatili testati con dettagli basso.
medio 1366x768
54  fps    + Confronta
alto 1366x768
33  fps    + Confronta
ultra 1920x1080
11.7  fps    + Confronta
» Giocabile con tutti i portatili testati con dettagli medio.
basso 1024x768
61  fps    + Confronta
medio 1366x768
29  fps    + Confronta
alto 1366x768
19  fps    + Confronta
ultra 1920x1080
8  fps    + Confronta
» Giocabile con tutti i portatili testati con dettagli basso.
Crysis 3

Crysis 3

2013
basso 1024x768
27  fps    + Confronta
medio 1366x768
16.7  fps    + Confronta
» Il Benchmark indica che il gioco non è utilizzabile con i settaggi testati.
basso 1024x768
24.8  fps    + Confronta
medio 1366x768
22.4  fps    + Confronta
alto 1366x768
11.2  fps    + Confronta
ultra 1920x1080
5.2  fps    + Confronta
» Il Benchmark indica che il gioco non è utilizzabile con i settaggi testati.
basso 1024x768
52  fps    + Confronta
medio 1366x768
42  fps    + Confronta
alto 1366x768
34  fps    + Confronta
ultra 1920x1080
20  fps    + Confronta
» Giocabile con tutti i portatili testati con dettagli medio.
basso 1024x768
43  fps    + Confronta
medio 1366x768
31  fps    + Confronta
alto 1366x768
20.3  fps    + Confronta
ultra 1920x1080
12.7  fps    + Confronta
» Giocabile con tutti i portatili testati con dettagli basso.
ultra 1920x1080
39  fps    + Confronta
» Giocabile con tutti i portatili testati con dettagli ultra.
basso 1024x768
45  fps    + Confronta
medio 1366x768
33  fps    + Confronta
alto 1366x768
13.4  fps    + Confronta
ultra 1920x1080
5  fps    + Confronta
» Giocabile con tutti i portatili testati con dettagli basso.
basso 1280x720
42  fps    + Confronta
medio 1366x768
29.4  fps    + Confronta
alto 1366x768
19.7  fps    + Confronta
» Giocabile con tutti i portatili testati con dettagli basso.
basso 1024x768
81  fps    + Confronta
alto 1366x768
32.6  fps    + Confronta
ultra 1920x1080
14  fps    + Confronta
» Giocabile con tutti i portatili testati con dettagli basso.
bassomedioaltoultraQHD4K
Call of Duty: Advanced Warfare30.619
Middle-earth: Shadow of Mordor2818
Fifa 154831.116.9
Risen 3: Titan Lords3922.28.6
GRID: Autosport933917.1
Watch Dogs20.314.8
Wolfenstein: The New Order33.129.813.4
The Elder Scrolls Online362818.29.7
Titanfall522620
Thief18.712
Assassin´s Creed IV: Black Flag27.522.511.3
Call of Duty: Ghosts33.619.7
Battlefield 433.623.516.65.3
F1 201360383416
Fifa 1463
Total War: Rome II47.734.827.57
Dota 25336.617.7
Company of Heroes 217.1
GRID 2473428.812.5
Metro: Last Light27.620.7105
BioShock Infinite52
StarCraft II: Heart of the Swarm543311.7
Tomb Raider6129198
Crysis 32716.7
Hitman: Absolution24.822.411.25.2
Dishonored52423420
Borderlands 2433120.312.7
Counter-Strike: GO39
Sleeping Dogs453313.45
The Elder Scrolls V: Skyrim4229.419.7
Deus Ex Human Revolution8132.614
< 30 fps
< 60 fps
< 120 fps
≥ 120 fps
8
16
4
16
9

15
5

15
1
1


Per conoscere altri giochi che potrebbero essere utilizzabili e per una lista completa di tutti i giochi e delle schede grafiche visitate la nostra Gaming List

v1.26
log 05. 14:52:14

#0 no ids found in url (should be separated by "_") +0s ... 0s

#1 not redirecting to Ajax server +0s ... 0s

#2 did not recreate cache, as it is less than 5 days old! Created at Mon, 04 Mar 2024 05:34:43 +0100 +0.001s ... 0.001s

#3 no comparison url found in template nbc.compare_page_1 needed +0.038s ... 0.039s

#4 no comparison url found in template nbc.compare_page_1 needed +0s ... 0.04s

#5 no comparison url found in template nbc.compare_page_1 needed +0s ... 0.04s

#6 no comparison url found in template nbc.compare_page_1 needed +0s ... 0.041s

#7 no comparison url found in template nbc.compare_page_1 needed +0s ... 0.041s

#8 no comparison url found in template nbc.compare_page_1 needed +0s ... 0.041s

#9 no comparison url found in template nbc.compare_page_1 needed +0s ... 0.042s

#10 composed specs +0s ... 0.042s

#11 did output specs +0s ... 0.042s

#12 start showIntegratedCPUs +0s ... 0.042s

#13 getting avg benchmarks for device 4042 +0.031s ... 0.072s

#14 got single benchmarks 4042 +0.008s ... 0.08s

#15 got avg benchmarks for devices +0s ... 0.08s

#16 min, max, avg, median took s +0.644s ... 0.724s

#17 before gaming benchmark output +0s ... 0.724s

#18 Got 90 rows for game benchmarks. +0.006s ... 0.73s

#19 composed SQL query for gamebenchmarks +0s ... 0.73s

#20 got data and put it in $dataArray +0.022s ... 0.753s

#21 benchmarks composed for output. +0.833s ... 1.585s

#22 no comparison url found in template nbc.compare_page_1 needed +0.003s ... 1.588s

#23 return log +0s ... 1.588s

Nessuna recensione trovato per questa scheda grafica

Please share our article, every link counts!

Classe 1

GeForce RTX 2080 Super Mobile

Classe 2

M1 Max 32-Core GPU *
GeForce RTX 2070 Super Mobile
M1 Max 24-Core GPU *
Radeon RX 5700M *
M1 Pro 16-Core GPU *
Radeon PRO W6600M *
GeForce RTX 2070 Super Max-Q
M1 Pro 14-Core GPU *
Quadro P4200
Quadro P5000 Max-Q *
GeForce RTX 3050 4GB Laptop GPU
Quadro P4000 Max-Q
Radeon RX 580X (Laptop) *
Radeon RX 580 (Laptop)
Radeon Pro 5300M
Radeon RX 5300M
Quadro P3000 Max-Q *
Radeon Pro WX 7100 *
Radeon RX 570X (Laptop) *
Radeon RX 570 (Laptop) *
Radeon RX 470 (Laptop) *

Classe 3

GeForce GTX 1050 Ti Mobile
Radeon 680M
Quadro P2000 Max-Q
Radeon R9 M395X
GeForce GTX 1050 Ti Max-Q *
WX Vega M GL
Radeon R9 M485X
GeForce GTX 1050 Max-Q *
Radeon 660M
Radeon RX 560X (Laptop)
Radeon RX 560 (Laptop)
Radeon Pro 560X
Radeon Pro 560
Radeon Pro 460
Radeon Pro WX 4130 *
Quadro P620 *
Radeon RX 550X (Laptop)
Radeon Pro 555X
Radeon Pro 555
Radeon Pro 455
Quadro P600
Radeon RX 540X *
Radeon Pro WX 2100 *
Radeon Pro WX 3100 *
Radeon Pro 450
Radeon 630
Radeon 540X *
Quadro P520
Quadro P500 *
Iris Plus Graphics G7 (Ice Lake 64 EU) *
Vega 10 *
Iris Pro Graphics 580
Vega 9
FirePro W5130M
UHD Graphics Xe G4 48EUs *
UHD Graphics 32EUs
UHD Graphics Xe 32EUs (Tiger Lake-H) *
UHD Graphics 750
Vega 7
Radeon R7 M465
Vega 8
Iris Plus Graphics G4 (Ice Lake 48 EU)
Quadro M600M
FirePro W4190M
Radeon R7 M445
UHD Graphics 24EUs (Alder Lake-N) *
Radeon R7 M340
Radeon 610M *
UHD Graphics G1 (Ice Lake 32 EU)
UHD Graphics Xe 16EUs (Tiger Lake-H) *
Radeon R5 (Bristol Ridge)
Adreno 690 *
Adreno 685 *
Adreno 680 *

Classe 4

UHD Graphics 730
Radeon R5 M315 *
Radeon R5 M420 *
UHD Graphics 617
UHD Graphics 615
Radeon R4 (Stoney Ridge)
Radeon R2 (Stoney Ridge)
HD Graphics (Broadwell)

Classe 5

Posizione approssimativa dell'adattatore grafico