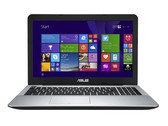
Recensione breve del notebook Asus X555LD-XX283H
Intel Core i3-4010U | NVIDIA GeForce 820M | 15.60" | 2.3 kg
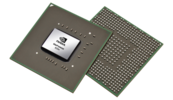
La NVIDIA GeForce 820M (o GT 820M) è una scheda grafica entry-level DirectX 11 compatibile lanciata nel gennaio 2014. Il suo core si basa sul chip 28nm GF117 chip (architettura Fermi) e monta una memoria DDR3 64-bit. Oltre ad un clock rate leggermente diverso, la 820M è quasi identica alle vecchie GeForce 710M e GT 720M.
Architettura
Il GF117 si basa sul chip GF108 ottimizzato (GeForce GT 540M) ed offre 96 shaders, 16 TMUs e 4 ROPs. Ogni shader core ha un clocked con velocità doppia rispetto al resto del chip grafico, una tecnica conosciuta come. Maggiori informazioni sulla Fermi si trovano nella pagina della GPU GT 435M.
Da notare che il GF117 non offre porte grafiche dedicate e di conseguenza può essere usato solo unitamente ad Optimus.
La 820M supporta il GPU Boost 2.0, che può effettuare l'overclock automatico della scheda se il sistema di raffreddamento del portatile lo consente. Questa feature è disponibile su alcuni notebook con scheda grafica della serie 800M.
Prestazioni
Nei nostri gaming benchmarks, le prestazioni 3D della GeForce 820M sono simili alla precedente GT 720M ed alla Intel Iris Graphics 5100. Questo colloca la scheda nel segmento entry level. I giochi attuali (del 2013/2014) risultano fluidi solo con settaggi bassi.
Features
Gli shader cores (chiamati anche CUDA cores) possono essere usati per calcoli generici con APIs come CUDA, DirectCompute 2.1 ed OpenCL. PhysX è teoricamente possibile, ma la 820M è troppo lenta per gestire contemporaneamente PhysX ed il rendering 3D dei giochi attuali. La 3D Vision non è supportata stando a quando dichiara Nvidia.
Consumo energetico
Il consumo energetico della Geforce 820M dovrebbe essere simile alla vecchia GT 720M. Ne consegue che, la GPU è adatta a portatili da 13 pollici o superiori.
GeForce 800M Serie
| ||||||||||||||||
| Nome in codice | N15V-GM | |||||||||||||||
| Architettura | Fermi | |||||||||||||||
| Pipelines | 96 - unified | |||||||||||||||
| Velocità del core | 775 MHz | |||||||||||||||
| Velocità de Shader | 1550 MHz | |||||||||||||||
| Velocità della memoria | 1800 MHz | |||||||||||||||
| Larghezza del bus di memoria | 64 Bit | |||||||||||||||
| Tipo di memoria | DDR3 | |||||||||||||||
| Max. quantità di memoria | 2048 MB | |||||||||||||||
| Memoria condivisa | no | |||||||||||||||
| API | DirectX 12 (FL 11_0), Shader 5.0 | |||||||||||||||
| Consumo di corrente | 15 Watt | |||||||||||||||
| Transistor Count | 585 Milioni | |||||||||||||||
| tecnologia | 28 nm | |||||||||||||||
| Caratteristiche | PhysX, Verde Drivers, CUDA, Play, Optimus, GPU Boost 2.0, GameWorks | |||||||||||||||
| Data dell'annuncio | 07.01.2014 | |||||||||||||||
| Link alla pagina del produttore | www.geforce.com | |||||||||||||||
I seguenti benchmarks deirivano dai benchmarks dei portatili recensiti. Le prestazioni dipendono dalla scheda grafica utilizzata, dal clock rate, dal processore, dai settaggi di sistema, dai drivers, e dai sistemi operativi. Quindi i risultati non sono rappresentativi per i portatili con questa GPU. Per informazioni dettagliate sui risultati del benchmark, cliccate sul numero di fps.


Per conoscere altri giochi che potrebbero essere utilizzabili e per una lista completa di tutti i giochi e delle schede grafiche visitate la nostra Gaming List

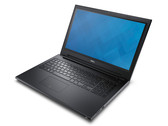
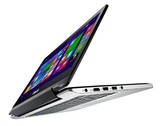
Lenovo IdeaPad Z40-59422614: Intel Core i5-4200U, 14.00", 2.1 kg
recensione » Recensione breve del portatile Lenovo Z40-59422614
Acer Aspire E1-772G 54208G1TMnsk: Intel Core i5-4200M, 17.30", 3.2 kg
recensione » Recensione breve del Notebook Acer Aspire E1-772G 54208G1TMnsk
Asus ASUSPRO P550LDV-XO1303G: Intel Core i3-4030U, 15.60", 2.3 kg
Recensioni esterne » Asus ASUSPRO P550LDV-XO1303G
HP 15-L0Z35EA: Intel Core i5-5200U, 15.60", 2.2 kg
Recensioni esterne » HP 15-L0Z35EA
Asus Transformer Book Flip TP300LD-C4031H: Intel Core i7-4510U, 13.30", 1.8 kg
Recensioni esterne » Asus Transformer Book Flip TP300LD-C4031H
Acer Aspire R14 R3-471TG-552E: Intel Core i5-4210U, 14.00", 2 kg
Recensioni esterne » Acer Aspire R14 R3-471TG-552E
Asus X751MD: Intel Pentium N3530, 17.30", 2.8 kg
Recensioni esterne » Asus X751MD
Asus Transformer Book Flip TP300LD-C4030H: Intel Core i5-4210U, 13.30", 1.7 kg
Recensioni esterne » Asus Transformer Book Flip TP300LD-C4030H
MSI CX61-2PC385W7W: Intel Core i3-4100M, 15.60", 2.4 kg
Recensioni esterne » MSI CX61-2PC385W7W
Asus Transformer Book Flip TP550LA-BH71T-CB: Intel Core i7-4500U, 15.60", 2.6 kg
Recensioni esterne » Asus Transformer Book Flip TP550LA-BH71T-CB
Dell Inspiron 15 3542-2293: Intel Core i5-4210U, 15.60", 2.3 kg
Recensioni esterne » Dell Inspiron 15-3542
Asus X555LD: Intel Core i3-4030U, 15.60", 2.3 kg
Recensioni esterne » Asus X555LD
Acer Extensa 2510G: Intel Core i3-4030U, 15.60", 2.5 kg
Recensioni esterne » Acer Extensa 2510G
Acer Aspire E5-471G-53XG: Intel Core i5-4210U, 14.00", 2.1 kg
Recensioni esterne » Acer Aspire E5-471G-53XG
Asus X550LDV-XO552H: Intel Core i7-4510U, 15.60", 2.3 kg
Recensioni esterne » Asus X550LDV-XO552H
Lenovo G710: Intel Pentium 3550M, 17.30", 2.9 kg
Recensioni esterne » Lenovo G710
Lenovo IdeaPad Z40-59422614: Intel Core i5-4200U, 14.00", 2.1 kg
Recensioni esterne » Lenovo IdeaPad Z40-59422614
Asus R752LD-TY057: Intel Core i3-4010U, 17.30", 2.7 kg
Recensioni esterne » Asus R752LD-TY057
Acer Aspire E5-471G-527B: Intel Core i5-4210U, 14.00", 2.1 kg
Recensioni esterne » Acer Aspire E5-471G-527B
Lenovo Ideapad Flex 2 14-59420166: Intel Core i5-4210U, 14.00", 1.9 kg
Recensioni esterne » Lenovo Ideapad Flex 2 14-59420166
Asus X550LDV-XO610H: Intel Core i5-4210U, 15.60", 2.3 kg
Recensioni esterne » Asus X550LDV-XO610H
Dell Inspiron 3542: Intel Core i5-4210U, 15.60", 2.3 kg
Recensioni esterne » Dell Inspiron 3542
Acer Aspire E1-472G-6844: Intel Core i5-4200U, 14.00", 2.1 kg
Recensioni esterne » Acer Aspire E1-472G-6844
Posizione approssimativa dell'adattatore grafico
I nostri Top 10
» Top 10 Portatili Multimedia
» Top 10 Portatili Gaming
» Top 10 Portatili Gaming Leggeri
» Top 10 Portatili da Ufficio e Business economici
» Top 10 Portatili Premium da Ufficio/Business
» Top 10 Portatili sotto i 300 Euro
» Top 10 Portatili sotto i 500 Euro
» Top 10 dei Portatili Workstation
» Top 10 Subnotebooks
» Top 10 Ultrabooks
» Top 10 Convertibili
» Top 10 Tablets
» Top 10 Tablets Windows
» Top 10 Smartphones