Notebookcheck Logo

AMD Radeon HD 8650G

AMD Radeon HD 8650G

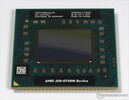
L'AMD Radeon HD 8650G è una scheda grafica delle APUs AMD Richland (A10-5750M). Offre un totale di 384 shader cores (architettura VLIW4) ed ha un clock da 533 - 720 MHz (Turbo). La 8650G non ha memoria grafica dedicata, ma condivide la memoria principale con i cores CPU.

Il decoder video integrato (probabilmente l'UVD3) consente la piena decodifica di videos HD Multi-View Codec (MVC), MPEG-4 Part 2 (DivX, xVid), MPEG-4 AVC/H.264 ed Adobe Flash.

Secondo AMD, le prestazioni dovrebbero essere di circa il 20 percento superiori alla HD 7660G (3DMark 11: P1400). Pertanto, la Radeon HD 8650G dovrebbe collocarsi appena sopra la HD 7670M dedicata o alla NVIDIA GeForce GT 630M. Tuttavia, senza la veloce memoria dual-channel le prestazioni calano drammaticamente.

Gli shaders del chip possono essere utilizzanti anche per calcoli generici.

L'APU è realizzata in 32nm ed ha un TDP di 35 watts. Questo consente al chip di essere utilizzato nei portatili da 13 o 14 pollici o superiori.

Radeon HD 8000G Serie

Radeon HD 8650G 384 @ 0.53 - 0.72 GHz
Radeon HD 8510G 384 @ 0.45 - 0.55 GHz
Radeon HD 8550G 256 @ 0.52 - 0.72 GHz
Radeon HD 8610G 384 @ 0.53 - 0.63 GHz
Radeon HD 8450G 192 @ 0.53 - 0.72 GHz
Radeon HD 8410G 192 @ 0.45 - 0.6 GHz
Radeon HD 8350G 128 @ 0.51 - 0.72 GHz
Radeon HD 8310G 128 @ 0.42 - 0.55 GHz
Nome in codiceRichland
ArchitetturaTerascale 3
Pipelines384 - unified
Velocità del core533 - 720 (Boost) MHz
Memoria condivisasi
APIDirectX 11, Shader 5.0, OpenGL 4.2
tecnologia32 nm
Dimensione del portatilemisura media
Data dell'annuncio01.05.2013
CPU in Radeon HD 8650GGPU Base SpeedGPU Boost / Turbo
AMD A10-5750M4 x 2500 MHz, 35 W533 MHz720 MHz
AMD A10-5757M4 x 2500 MHz, 35 W600 MHz720 MHz
min. - max.533 - 600 MHz720 MHz

Benchmark

Performance Rating - 3DMark 11 + Fire Strike + Time Spy
0.4 pt (1%)
3DMark - 3DMark Ice Storm Unlimited Graphics
71794 Points (7%)
3DMark - 3DMark Ice Storm Extreme Graphics
45270 Points (6%)
3DMark - 3DMark Cloud Gate Score
min: 2932     media: 3843     media: 4180 (4%)     massimo: 4416 Points
3DMark - 3DMark Cloud Gate Graphics
min: 5414     media: 6133     media: 6453 (2%)     massimo: 6532 Points
3DMark - 3DMark Fire Strike Standard Score
min: 758     media: 813     media: 834 (1%)     massimo: 846 Points
3DMark - 3DMark Fire Strike Standard Graphics
min: 827     media: 882     media: 905 (1%)     massimo: 915 Points
3DMark - 3DMark Ice Storm Graphics
min: 42390     media: 55222     media: 55619 (6%)     massimo: 67658 Points
3DMark 11 - 3DM11 Performance Score
min: 1148     media: 1432     media: 1479.5 (2%)     massimo: 1549 Points
3DMark 11 - 3DM11 Performance GPU
min: 1122     media: 1361     media: 1433 (1%)     massimo: 1453 Points
3DMark Vantage
3DM Vant. Perf. total +
3DMark Vantage - 3DM Vant. Perf. total
min: 4462     media: 4689     media: 4689 (1%)     massimo: 4916 Points
3DM Vant. Perf. GPU no PhysX +
3DMark Vantage - 3DM Vant. Perf. GPU no PhysX
min: 3961     media: 4169     media: 4168.5 (2%)     massimo: 4376 Points
3DMark 03 - 3DMark 03 - Standard
22299 Points (12%)
3DMark 06 3DMark 06 - Standard 1280x1024 +
3DMark 06
min: 5699     media: 6733     media: 6732.5 (9%)     massimo: 7766 Points
Unigine Heaven 3.0 - Unigine Heaven 3.0 OpenGL
6.2 fps (3%)
Cinebench R10 Cinebench R10 Shading (32bit) +
Cinebench R10 - Cinebench R10 Shading (32bit)
5411 punti (4%)
Cinebench R11.5 Cinebench R11.5 OpenGL 64 Bit +
Cinebench R11.5 - Cinebench R11.5 OpenGL 64 Bit
min: 23.98     media: 27.6     media: 27.6 (9%)     massimo: 31.26 fps
Cinebench R15
Cinebench R15 OpenGL 64 Bit +
Cinebench R15 - Cinebench R15 OpenGL 64 Bit
min: 28.34     media: 31.7     media: 33 (2%)     massimo: 33.6 fps
Cinebench R15 OpenGL Ref. Match 64 Bit +
Cinebench R15 - Cinebench R15 OpenGL Ref. Match 64 Bit
98 % (98%)
GFXBench (DX / GLBenchmark) 2.7
GFXBench T-Rex HD Offscreen C24Z16 +
GFXBench (DX / GLBenchmark) 2.7 - GFXBench T-Rex HD Offscreen C24Z16
100 fps (1%)
LuxMark v2.0 64Bit - LuxMark v2.0 Room GPU
180 Samples/s (1%)
ComputeMark v2.1 - ComputeMark v2.1 Result
983 punti (1%)
- Valori di benchmark per questa scheda grafica
- Valori medi di benchmark per questa scheda grafica
* Numeri più piccoli rappresentano prestazioni supeiori

Benchmarks per i giochi

I seguenti benchmarks deirivano dai benchmarks dei portatili recensiti. Le prestazioni dipendono dalla scheda grafica utilizzata, dal clock rate, dal processore, dai settaggi di sistema, dai drivers, e dai sistemi operativi. Quindi i risultati non sono rappresentativi per i portatili con questa GPU. Per informazioni dettagliate sui risultati del benchmark, cliccate sul numero di fps.

basso 1280x720
52.4  fps    + Confronta
medio 1920x1080
39.5  fps    + Confronta
alto 1920x1080
29.3  fps    + Confronta
ultra 1920x1080
26.3  fps    + Confronta
QHD 2560x1440
20.8  fps    + Confronta
4K 3840x2160
10.2  fps    + Confronta
» Giocabile con tutti i portatili testati con dettagli medio.
World of Tanks enCore

World of Tanks enCore

2018
basso 1366x768
89  fps    + Confronta
medio 1920x1080
10  fps    + Confronta
» Giocabile con tutti i portatili testati con dettagli basso.
basso 1280x720
17.8 19.2 ~ 19 fps    + Confronta
medio 1920x1080
18.1  fps    + Confronta
alto 1920x1080
17.1  fps    + Confronta
4K 3840x2160
16.9  fps    + Confronta
» Il Benchmark indica che il gioco non è utilizzabile con i settaggi testati.
Dirt 4

Dirt 4

2017
basso 1280x720
21.7  fps    + Confronta
» Il Benchmark indica che il gioco non è utilizzabile con i settaggi testati.
basso 1280x720
58.1  fps    + Confronta
» Giocabile con tutti i portatili testati con dettagli basso.
Prey

Prey

2017
basso 1280x720
21.4  fps    + Confronta
» Il Benchmark indica che il gioco non è utilizzabile con i settaggi testati.
basso 1280x720
17.6  fps    + Confronta
» Il Benchmark indica che il gioco non è utilizzabile con i settaggi testati.
basso 1280x720
10.6  fps    + Confronta
» Il Benchmark indica che il gioco non è utilizzabile con i settaggi testati.
For Honor

For Honor

2017
basso 1280x720
19.8  fps    + Confronta
» Il Benchmark indica che il gioco non è utilizzabile con i settaggi testati.
basso 1280x720
30.3  fps    + Confronta
medio 1366x768
22.7  fps    + Confronta
» Il Benchmark indica che il gioco non è utilizzabile con i settaggi testati.
basso 1280x720
68.2  fps    + Confronta
medio 1366x768
46.4  fps    + Confronta
» Giocabile con tutti i portatili testati con dettagli medio.
basso 1280x720
22.9  fps    + Confronta
medio 1366x768
13.4  fps    + Confronta
» Il Benchmark indica che il gioco non è utilizzabile con i settaggi testati.
basso 1024x768
25.6  fps    + Confronta
medio 1366x768
11.2  fps    + Confronta
» Il Benchmark indica che il gioco non è utilizzabile con i settaggi testati.
basso 1280x720
15.1  fps    + Confronta
» Il Benchmark indica che il gioco non è utilizzabile con i settaggi testati.
Doom

Doom

2016
basso 1280x720
14.3  fps    + Confronta
» Il Benchmark indica che il gioco non è utilizzabile con i settaggi testati.
basso 1280x720
13.4  fps    + Confronta
» Il Benchmark indica che il gioco non è utilizzabile con i settaggi testati.
basso 1280x720
17  fps    + Confronta
» Il Benchmark indica che il gioco non è utilizzabile con i settaggi testati.
XCOM 2

XCOM 2

2016
basso 1280x720
16.5  fps    + Confronta
» Il Benchmark indica che il gioco non è utilizzabile con i settaggi testati.
basso 1024x768
12.8  fps    + Confronta
medio 1366x768
6.5  fps    + Confronta
» Il Benchmark indica che il gioco non è utilizzabile con i settaggi testati.
basso 1024x768
30.8  fps    + Confronta
medio 1366x768
18.7  fps    + Confronta
» Il Benchmark indica che il gioco non è utilizzabile con i settaggi testati.
basso 1024x768
12.2  fps    + Confronta
» Il Benchmark indica che il gioco non è utilizzabile con i settaggi testati.
basso 1024x768
21.4  fps    + Confronta
» Il Benchmark indica che il gioco non è utilizzabile con i settaggi testati.
basso 1366x768
48.5  fps    + Confronta
medio 1366x768
34.9  fps    + Confronta
» Giocabile con tutti i portatili testati con dettagli basso.
basso 1024x768
48.6  fps    + Confronta
medio 1366x768
31  fps    + Confronta
alto 1920x1080
12  fps    + Confronta
» Giocabile con tutti i portatili testati con dettagli basso.
basso 1280x720
28.9 62 ~ 45 fps    + Confronta
medio 1366x768
26.8 37.4 ~ 32 fps    + Confronta
alto 1920x1080
16.8  fps    + Confronta
ultra 1920x1080
15.5  fps    + Confronta
4K 3840x2160
3.9  fps    + Confronta
» Giocabile con la maggior parte dei portatili testati con dettagli basso.
basso 1024x768
15.6  fps    + Confronta
» Il Benchmark indica che il gioco non è utilizzabile con i settaggi testati.
basso 1024x768
114  fps    + Confronta
medio 1366x768
31.5  fps    + Confronta