Recensioni Notebook con NVIDIA GeForce RTX 5060 Laptop la scheda grafica
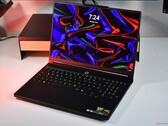
Esagerato o geniale? Recensione dell’Asus TUF Gaming A18
Con il TUF Gaming A18, Asus propone un portatile XXL dal prezzo relativamente accessibile, il cui ampio display è ideale non solo per i film, ma anche per i videogiochi. Abbiamo testato una configurazione dotata di Ryzen 7 260 e GeForce RTX 5060 e l’abbiamo confrontata con i più recenti modelli concorrenti da 18 pollici.
AMD Ryzen 7 260, NVIDIA GeForce RTX 5060 Laptop, 18", 2.7 kgRecensione del portatile Lenovo Legion 5 15AGP11: Computer per il gaming AMD con schermo OLED e 32 GB di RAM
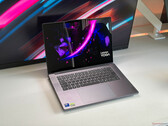
I portatili da gaming Lenovo Legion, dal segmento premium a quello di fascia media. Il Lenovo Legion 5 15AGP11 appartiene alla fascia media: pur comportando alcuni compromessi, include comunque componenti di alta qualità, come uno schermo OLED. Grazie alla combinazione di CPU AMD Ryzen e schede grafiche Nvidia GeForce, questo portatile ha ottenuto ottimi risultati nel nostro test.
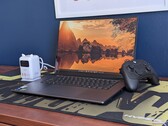
AMD Ryzen AI 7 450, NVIDIA GeForce RTX 5060 Laptop, 15.3", 1.9 kgRecensione del portatile gaming Lenovo LOQ 15: Un pugno nell’occhio o un vero e proprio richiamo visivo?
La maggior parte dei portatili si confonde tra la solita marea di modelli grigi e neri, ma la versione in vivace “Surge Green” del Lenovo LOQ 15AHP11 si rifiuta di passare inosservata. La nostra recensione vi svelerà se questo portatile da gaming da 15 pollici possiede le prestazioni necessarie per essere all’altezza del suo aspetto accattivante.
AMD Ryzen 7 250, NVIDIA GeForce RTX 5060 Laptop, 15.3", 2.2 kgRecensione del Lenovo Yoga Pro 7i Aura Edition: Eccellente computer portatile multimediale da 15 pollici con OLED da 1.100 nit
Lenovo è uno dei pochi produttori con dispositivi da 15 pollici e il nuovo Yoga Pro 7i 15 Aura Edition è un impressionante laptop multimediale a partire da 2679 dollari con CPU Intel Panther Lake, GPU GeForce RTX 5060, 32 GB di RAM e uno splendido touchscreen OLED da 165 Hz.
Intel Core Ultra 9 386H, NVIDIA GeForce RTX 5060 Laptop, 15.3", 1.7 kgRecensione del Lenovo Pro 9i 16 G11 Aura Edition: Una controparte diretta del Dell XPS 16
Tolto di mezzo il nome "Yoga", il nuovo Pro 9i 16 G11 prende di mira l'XPS 16 con un maggior numero di porte integrate, un touchscreen più luminoso e una vera grafica discreta Nvidia. I cacciatori di prestazioni e i creatori di contenuti dovrebbero prendere in considerazione l'ultimo modello multimediale di Lenovo.
Intel Core Ultra 9 386H, NVIDIA GeForce RTX 5060 Laptop, 16", 1.9 kgLenovo Legion 7 16 AGP11: AMD Ryzen AI 9 HX 470, 16.00", 1.8 kg
recensione » Recensione del Lenovo Legion 7a 16 G11 - gaming Laptop OLED leggero con AMD Ryzen 400
Medion Erazer Deputy 15 P1 MD62761: Intel Core 7 250H, 15.60", 2.2 kg
recensione » Recensione del Medion Erazer Deputy 15 P1: Può un computer economico portatile tedesco competere con i grandi gamers?
MSI Cyborg 17 B13WFKG: Intel Core i7-13620H, 17.30", 2.6 kg
recensione » Gaming a buon mercato per le masse? L'MSI Cyborg 17 si confronta con la concorrenza
Schenker XMG Apex 17 M25: AMD Ryzen 9 9955HX, 17.30", 2.8 kg
recensione » Recensione dell'XMG Apex 17: Il laptop RTX 5060 con Ryzen 9 9955HX supera persino alcuni rivali RTX 5070
Schenker XMG Core 16 VE M25: AMD Ryzen 7 255, 16.00", 2.1 kg
recensione » Recensione del gaming laptop XMG Core 16 VE (M25): Sfida al Lenovo Legion
Lenovo ThinkBook 16p G6 21R00013GE: Intel Core Ultra 7 255HX, 16.00", 2.1 kg
recensione » Recensione del Lenovo ThinkBook 16p G6 - Uno dei migliori portatili multimediali da 16 pollici
Tulpar T6 V3.5: Intel Core i7-14700HX, 16.00", 2.4 kg
recensione » Recensione del Tulpar T6 V3.5: gaming Laptop economico con RTX 5060
HP Omen 16-ap0091ng: AMD Ryzen 9 8940HX, 16.00", 2.4 kg
recensione » Recensione del portatile HP Omen 16: Il miglior gamer economico?
Lenovo Legion 7 16IAX10: Intel Core Ultra 7 255HX, 16.00", 2 kg
recensione » Recensione del Lenovo Legion 7 16IAX10: Formidabile concorrente del Razer Blade 16
Schenker XMG Core 15 (M25): AMD Ryzen AI 7 350, 15.30", 1.9 kg
recensione » Recensione del gaming laptop XMG Core 15 (M25): Il concorrente tedesco del Legion 5
Lenovo Yoga Pro 9 16IAH G10 RTX 5060: Intel Core Ultra 7 255H, 16.00", 1.9 kg
recensione » Recensione del Lenovo Yoga Pro 9i 16IAH G10 Aura Edition: Il grande computer portatile multimediale impressiona con l'OLED da 1.100 nit
Lenovo LOQ 15AHP10: AMD Ryzen 7 250, 15.60", 2.4 kg
recensione » Recensione del notebook Lenovo LOQ 15: La RTX 5060 mobile celebra il suo debutto
Lenovo Legion 5 15AHP G10: AMD Ryzen 7 260, 15.10", 1.9 kg
recensione » Recensione del computer portatile Lenovo Legion 5 15: Il miglior gamer mainstream nel 2025
MSI Stealth A16 5060 Engineering Sample: AMD Ryzen AI 7 350, 16.00"
recensione » Nvidia GeForce RTX 5060 Laptop Performance Preview - Quasi al livello della RTX 5070 Laptop
Acer Predator Helios Neo 16S AI PHN16S-I51: Intel Core Ultra 9 386H, 16.00", 2.2 kg
Recensioni esterne » Acer Predator Helios Neo 16S AI PHN16S-I51 - Recensioni e Specifiche
Lenovo Yoga Pro 9i 16 Gen 11: Intel Core Ultra 9 386H, 16.00", 1.9 kg
Recensioni esterne » Lenovo Yoga Pro 9 16i Gen 11 - Recensioni e Specifiche
Lenovo Legion 7 16 AGP11: AMD Ryzen AI 9 HX 470, 16.00", 1.8 kg
Recensioni esterne » Lenovo Legion 7 16 AGP11 - Recensioni e Specifiche
MSI Cyborg 17 B13WFKG: Intel Core i7-13620H, 17.30", 2.6 kg
Recensioni esterne » MSI Cyborg 17 B13WFKG - Recensioni e Specifiche
Gigabyte Gaming A18: AMD Ryzen 7 260, 18.00", 2.8 kg
Recensioni esterne » Gigabyte Gaming A18
MSI Stealth 16 AI+ B3WF: Intel Core Ultra 9 386H, 16.00", 2 kg
Recensioni esterne » MSI Stealth 16 AI+ B3WF
Lenovo Pro 9 16IPH11: Intel Core Ultra 9 386H, 16.00", 1.9 kg
Recensioni esterne » Lenovo Pro 9 16IPH11
Lenovo Yoga Pro 7 15IPH11: Intel Core Ultra 9 386H, 15.30", 1.7 kg
Recensioni esterne » Lenovo Yoga Pro 7 15IPH11
Lenovo Legion 5i 15IPH11: Intel Core Ultra 7 356H, 15.30", 1.9 kg
Recensioni esterne » Lenovo Legion 5i 15IPH11
Lenovo Legion 7a 16AGP11: AMD Ryzen AI 7 450, 16.00", 1.8 kg
Recensioni esterne » Lenovo Legion 7a 16AGP11
Lenovo Legion 5a 15AGP11: AMD Ryzen AI 9 465, 15.30", 1.9 kg
Recensioni esterne » Lenovo Legion 5a 15AGP11
MSI Cyborg 15 B2RWFKG: Intel Core 7 240H, 15.60", 2.1 kg
Recensioni esterne » MSI Cyborg 15 B2RWFKG
HP Omen 16-am0000ng: Intel Core i9-14900HX, 16.00", 2.4 kg
Recensioni esterne » HP Omen 16-am0000ng
Acer Swift X 14 AI SFX14-61G, Ryzen AI 7 350: AMD Ryzen AI 7 350, 14.50", 1.6 kg
Recensioni esterne » Acer Swift X 14 AI SFX14-61G, Ryzen AI 7 350
Asus TUF Gaming A14 FA401GM: AMD Ryzen AI 9 465, 14.00", 1.5 kg
Recensioni esterne » Asus TUF Gaming A14 FA401GM
Acer Swift X 14 OLED SFX14-73G: Intel Core Ultra 7 255H, 14.50", 1.6 kg
Recensioni esterne » Acer Swift X 14 OLED SFX14-73G
Gigabyte Aero X16 1WH: AMD Ryzen AI 7 350, 16.00"
Recensioni esterne » Gigabyte Aero X16 1WH
Asus ROG Zephyrus G14 GA403: AMD Ryzen AI 9 465, 14.00", 1.5 kg
Recensioni esterne » Asus ROG Zephyrus G14 GA403
Acer Nitro 16S AI AN16S-61: AMD Ryzen AI 7 350, 16.00", 2.2 kg
Recensioni esterne » Acer Nitro 16S AI AN16S-61
Medion Erazer Deputy 15 P1 MD62761: Intel Core 7 250H, 15.60", 2.2 kg
Recensioni esterne » Medion Erazer Deputy 15 P1 MD62761
Asus ROG Zephyrus G14 GU405: Intel Core Ultra 9 386H, 14.00", 1.5 kg
Recensioni esterne » Asus ROG Zephyrus G14 GU405
HP Victus 15-fb3000ng: AMD Ryzen AI 7 350, 15.60", 2.3 kg
Recensioni esterne » HP Victus 15-fb3000ng
MSI Katana 15 HX B14WFK: Intel Core i7-14650HX, 15.60", 2.4 kg
Recensioni esterne » MSI Katana 15 HX B14WFK
Acer Nitro V 17 AI ANV17-61: AMD Ryzen AI 7 350, 17.30", 2.7 kg
Recensioni esterne » Acer Nitro V 17 AI ANV17-61
Lenovo LOQ 15IRX10, i7-14700HX: Intel Core i7-14700HX, 15.60", 2.4 kg
Recensioni esterne » Lenovo LOQ 15IRX10, i7-14700HX
Acer Predator Helios Neo 14 AI PHN14-71, RTX 5060: Intel Core Ultra 9 285H, 14.50", 1.9 kg
Recensioni esterne » Acer Predator Helios Neo 14 AI PHN14-71, RTX 5060
Acer Predator Helios Neo 16S AI PHN16S-71, RTX 5060: Intel Core Ultra 7 255HX, 16.00", 2.3 kg
Recensioni esterne » Acer Predator Helios Neo 16S AI PHN16S-71, RTX 5060
Dell 16 Premium, RTX 5060: Intel Core Ultra 7 255H, 16.30", 2.3 kg
Recensioni esterne » Dell 16 Premium, RTX 5060
Gigabyte Gaming A16 3VH: AMD Ryzen 7 260, 16.00", 2.2 kg
Recensioni esterne » Gigabyte Gaming A16 3VH
Lenovo ThinkBook 16p G6 IAX: Intel Core Ultra 9 275HX, 16.00", 2.1 kg
Recensioni esterne » Lenovo ThinkBook 16p G6 IAX
Acer Nitro V 16S AI ANV16S-61: AMD Ryzen AI 7 350, 16.00", 2.2 kg
Recensioni esterne » Acer Nitro V 16S AI ANV16S-61
HP Victus 15-fa2000ng: Intel Core i7-13620H, 15.60", 2.3 kg
Recensioni esterne » HP Victus 15-fa2000ng
Asus TUF Gaming A16 FA608UM: AMD Ryzen 7 260, 16.00", 2.2 kg
Recensioni esterne » Asus TUF Gaming A16 FA608UM
Lenovo Legion Y7000 2025: Intel Core Ultra 7 155H, 15.30", 2 kg
Recensioni esterne » Lenovo Legion Y7000 2025
Lenovo Legion 5 15AHP G10: AMD Ryzen 7 260, 15.10", 1.9 kg
Recensioni esterne » Lenovo Legion 5 15AHP G10
HP Omen 16-ap0091ng: AMD Ryzen 9 8940HX, 16.00", 2.4 kg
Recensioni esterne » HP Omen 16-ap0091ng
HP Omen 16-ap0000ng: AMD Ryzen AI 7 350, 16.00", 2.4 kg
Recensioni esterne » HP Omen 16-ap0000ng
Acer Nitro V16 AI ANV16-42, RTX 5060: AMD Ryzen 7 260, 16.00", 2.4 kg
Recensioni esterne » Acer Nitro V16 AI ANV16-42, RTX 5060
Alienware 16 Aurora, RTX 5060 : Intel Core 7 240H, 16.00", 2.6 kg
Recensioni esterne » Alienware 16 Aurora, RTX 5060
Asus TUF Gaming A18 FA808UM: AMD Ryzen 7 260, 18.00", 2.7 kg
Recensioni esterne » Asus TUF Gaming A18 FA808UM
Gigabyte Gaming A16 CVH: Intel Core i7-13620H, 16.00", 2.2 kg
Recensioni esterne » Gigabyte Gaming A16 CVH
HP Victus 15-fa2000na: Intel Core 7 240H, 15.60", 2.2 kg
Recensioni esterne » HP Victus 15-fa2000na
Asus Zephyrus G16 GA605KM: AMD Ryzen AI 7 350, 16.00", 1.9 kg
Recensioni esterne » Asus Zephyrus G16 GA605KM
Lenovo Legion Pro 5 16ADR10: AMD Ryzen 7 8745HX, 16.00", 2.3 kg
Recensioni esterne » Lenovo Legion Pro 5 16ADR10
Acer Nitro V 15 ANV15-52: Intel Core i7-13620H, 15.60", 2.1 kg
Recensioni esterne » Acer Nitro V 15 ANV15-52
Lenovo LOQ 17IRX10, RTX 5060: Intel Core i7-14700HX, 17.30", 2.9 kg
Recensioni esterne » Lenovo LOQ 17IRX10, RTX 5060
Lenovo LOQ 15AHP10: AMD Ryzen 7 250, 15.60", 2.4 kg
Recensioni esterne » Lenovo LOQ 15AHP10
Lenovo Legion 5 15IRX10, i7-14700HX RTX 5060: Intel Core i7-14700HX, 15.10", 1.9 kg
Recensioni esterne » Lenovo Legion 5 15IRX10, i7-14700HX RTX 5060
Asus ROG Zephyrus G14 GA403UM: AMD Ryzen 9 270, 14.00", 1.5 kg
Recensioni esterne » Asus ROG Zephyrus G14 GA403UM
Lenovo Yoga Pro 9 16IAH10, Ultra 9 285H: Intel Core Ultra 9 285H, 16.00", 2.1 kg
Recensioni esterne » Lenovo Yoga Pro 9 16IAH10, Ultra 9 285H
Honor MagicBook Pro 16 Hunter 2025: Intel Core Ultra 9 285H, 16.00", 1.9 kg
Recensioni esterne » Honor MagicBook Pro 16 Hunter 2025
Lenovo Legion 5 15IRX10, i7-13650HX RTX 5060: Intel Core i7-13650HX, 15.10", 1.9 kg
Recensioni esterne » Lenovo Legion 5 15IRX10, i7-13650HX RTX 5060
Asus TUF Gaming F16 FX608JMR: Intel Core i7-14650HX, 16.00", 2.2 kg
Recensioni esterne » Asus TUF Gaming F16 FX608JMR
Lenovo LOQ 15IRX10: Intel Core i5-13450HX, 15.60", 2.4 kg
Recensioni esterne » Lenovo LOQ 15IRX10
MSI Crosshair 16 HX AI D2XWFKG: Intel Core Ultra 9 285HX, 16.00", 2.5 kg
Recensioni esterne » MSI Crosshair 16 HX AI D2XWFKG
Asus V16 V3607VM: Intel Core 7 240H, 16.00", 2 kg
Recensioni esterne » Asus V16 V3607VM
Asus TUF Gaming A14 FA401KM, R7 260: AMD Ryzen 7 260, 14.00", 1.5 kg
Recensioni esterne » Asus TUF Gaming A14 FA401KM, R7 260
Gigabyte Aero X16 1VH: AMD Ryzen AI 7 350, 16.00", 1.9 kg
Recensioni esterne » Gigabyte Aero X16 1VH
Monster Tulpar T7 V26.2.5: Intel Core i7-13620H, 17.30", 2.7 kg
Recensioni esterne » Monster Tulpar T7 V26.2.5
Lenovo Yoga Pro 9 16IAH G10 RTX 5060: Intel Core Ultra 7 255H, 16.00", 1.9 kg
Recensioni esterne » Lenovo Yoga Pro 9 16IAH G10 RTX 5060
Asus ROG Strix G16 G615JMR: Intel Core i7-14650HX, 16.00", 2.7 kg
Recensioni esterne » Asus ROG Strix G16 G615JMR
Lenovo Legion 7 16IAX10: Intel Core Ultra 7 255HX, 16.00", 2 kg
Recensioni esterne » Lenovo Legion 7 16IAX10
Acer Nitro V14 AI ANV14-62: AMD Ryzen AI 7 350, 14.50", 1.7 kg
Recensioni esterne » Acer Nitro V14 AI ANV14-62
Asus TUF Gaming A14 FA401KM: AMD Ryzen AI 7 350, 14.00", 1.5 kg
Recensioni esterne » Asus TUF Gaming A14 FA401KM
Alienware 16X Aurora: Intel Core Ultra 7 255HX, 16.00", 2.7 kg
Recensioni esterne » Alienware 16X Aurora
Asus ROG Strix G16 G615LM: Intel Core Ultra 9 275HX, 16.00", 2.7 kg
Recensioni esterne » Asus ROG Strix G16 G615LM
Lenovo Legion 5 15AGP11: AMD Ryzen AI 7 450, 15.30", 1.9 kg
» Questo portatile da gaming Lenovo Legion è un ottimo strumento di lavoro, con un'unica eccezione
» Lenovo Legion 5 o LOQ: quale laptop da gaming AMD è migliore?
Lenovo Yoga Pro 7 15IPH11: Intel Core Ultra 9 386H, 15.30", 1.7 kg
» Quando il MacBook Pro di Apple è improvvisamente l'alternativa più conveniente, i computer portatili come il Lenovo Yoga Pro 7i 15 hanno un problema
» Lenovo fa pagare più di 2600 dollari per lo Yoga Pro 7i 15, è questa la nuova realtà?
» Lo Yoga Pro 7i 15 G11 di Lenovo è uno dei primi computer portatili multimediali con la nuova RTX 5070 da 12 GB
Lenovo Pro 9 16IPH11: Intel Core Ultra 9 386H, 16.00", 1.9 kg
» Con quasi 1600 nit, il display OLED di Lenovo Pro 9 16 Aura è uno dei più luminosi che si possano acquistare
Lenovo Legion 7 16 AGP11: AMD Ryzen AI 9 HX 470, 16.00", 1.8 kg
» Legion 7a 16 di Lenovo è troppo caro a 2049 dollari, quando Legion 5 15 offre le stesse prestazioni di gioco a 1350 dollari
Lenovo Pro 9 16IPH11: Intel Core Ultra 9 386H, 16.00", 1.9 kg
» Le pagine dei prodotti di Lenovo, sgranate e a bassa risoluzione, fanno sembrare terribile l'altrimenti elegante Pro 9i 16 Aura
» Lenovo Pro 9 16 G11 Aura funziona in modo molto più silenzioso in modalità Bilanciata, con un piccolo impatto sulla grafica
» Il Core Ultra 9 386H è appena più veloce del Core Ultra 9 285H nei primi test di benchmark
Lenovo Legion 7 16 AGP11: AMD Ryzen AI 9 HX 470, 16.00", 1.8 kg
» Il gaming laptop Legion 7a 16 di Lenovo è ancora più leggero di prima, ma sacrifica le prestazioni
Schenker XMG Apex 17 M25: AMD Ryzen 9 9955HX, 17.30", 2.8 kg
» Gemma nascosta per i creatori di contenuti? Il display QHD di XMG Apex 17 offre colori estremamente precisi dopo la calibrazione
» Il laptop RTX 5060 funziona il 60% più silenzioso in modalità Intrattenimento con una perdita di prestazioni del 12%: XMG Apex 17 testato
» XMG Apex 17 diventa significativamente più costoso: il laptop RTX 5060 più veloce ora parte da 2.000 euro
» Il re delle CPU nei portatili da gioco: XMG Apex 17 con Ryzen 9 9955HX batte tutti i rivali RTX 5060 e RTX 5070
» RTX 5060 batte RTX 5070: XMG Apex 17 sorprende con prestazioni di gioco inaspettatamente elevate
Lenovo ThinkBook 16p G6 21R00013GE: Intel Core Ultra 7 255HX, 16.00", 2.1 kg
» Il ThinkBook 16p G6 di Lenovo è un ottimo computer portatile multimediale
HP Omen 16-ap0091ng: AMD Ryzen 9 8940HX, 16.00", 2.4 kg
» Grandi cambiamenti per i giocatori di omen quest'anno - Recensione di HP Omen 16
Lenovo Legion 7 16IAX10: Intel Core Ultra 7 255HX, 16.00", 2 kg
» Lenovo Legion 7i 16 Gen 10 supera la maggior parte degli altri computer portatili ultrasottili con grafica RTX 5060 simile
» Lenovo lancia il portatile Legion, più leggero persino del Razer Blade 16 o dell'MSI Stealth 16 AI
Lenovo Legion 5 15AHP G10: AMD Ryzen 7 260, 15.10", 1.9 kg
» Non deve sempre essere un Pro: Lenovo Legion 5 15 offre quasi tutto ciò che i giocatori desiderano
» Lenovo distribuisce il Legion 5 15 con uno dei migliori pannelli OLED disponibili
HP Omen 16-ap0091ng: AMD Ryzen 9 8940HX, 16.00", 2.4 kg
» Omen 16: un ottimo giocatore economico con un centro di controllo infestato da pubblicità