Notebookcheck Logo

AMD Radeon Steam Deck 8CU

AMD Radeon Radeon Steam Deck 8CU

La GPU AMD Radeon Steam Deck APU è una scheda grafica integrata (iGPU) nella CPU personalizzata di Steam Deck OLED con 8 CU. I core grafici utilizzano l'architettura RDNA 2 e hanno un clock da 1000 (minimo) a 1600 MHz (massimo).

Il SoC è prodotto presso TSMC nel processo N6 (6nm).

Nome in codiceRDNA 2 Sephiroth
ArchitetturaRDNA 2
Pipelines512 - unified
TMUs32
ROPs16
Raytracing Cores8
Velocità del core1900 (Boost) MHz
CacheL1: 512 KB, L2: 1 MB, L3: 8 MB
Memoria condivisano
APIDirectX 12_1
tecnologia6 nm
Data dell'annuncio09.11.2023
CPU in Radeon Radeon Steam Deck 8CUGPU Base SpeedGPU Boost / Turbo
AMD Ryzen Z2 A4 x 2800 MHz, 28 W200 MHz1800 MHz
AMD Steam Deck OLED APU4 x 2400 MHz, 15 W1000 MHz1600 MHz
min. - max.200 - 1000 MHz1600 - 1800 MHz

Benchmark

3DMark - 3DMark Steel Nomad Light
1678 Points (4%)
3DMark - 3DMark Fire Strike Standard Score
4902 Points (7%)
3DMark - 3DMark Fire Strike Standard Graphics
5444 Points (5%)
3DMark - 3DMark Time Spy Score
1938 Points (5%)
3DMark - 3DMark Time Spy Graphics
1769 Points (4%)
107.5 -94%
...
1478 -16%
1496 -15%
AMD Radeon Pro 560X
1614 -9%
NVIDIA GeForce GTX 1050 Max-Q
1615 -9%
1616 -9%
1672 -5%
1705 -4%
1724 -3%
1735 -2%
AMD Radeon Steam Deck 8CU
1769
AMD Radeon RX 560X (Laptop)
1788 1%
1796 2%
1810 2%
1814 3%
1846 4%
1989 12%
2021 14%
2046 16%
NVIDIA Quadro P2000 Max-Q
2049 16%
...
Nvidia RTX PRO 5000 Blackwell Generation Laptop
23742 1242%
max:
NVIDIA GeForce RTX 5090
46337 2519%
0%
100%
Restrict / Search: Model: Max. age: years
3DMark 11 - 3DM11 Performance Score
7795 Points (9%)
3DMark 11 - 3DM11 Performance GPU
8133 Points (6%)
171.8 -98%
...
AMD Radeon Pro 560X
7590 -7%
7662 -6%
7692 -5%
7793 -4%
7808 -4%
7944 -2%
AMD Radeon RX 560X (Laptop)
7970 -2%
8067 -1%
8129 0%
AMD Radeon Steam Deck 8CU
8133
NVIDIA Quadro P2000 Max-Q
8148 0%
8289 2%
AMD Radeon RX 560 (Laptop)
8323 2%
8387 3%
8453 4%
8553 5%
8656 6%
NVIDIA GeForce GTX 1050 Ti Max-Q
8781 8%
8851 9%
...
Nvidia RTX PRO 5000 Blackwell Generation Laptop
68846 747%
max:
NVIDIA GeForce RTX 5090
129772 1496%
0%
100%
Restrict / Search: Model: Max. age: years
Cinebench R15
Cinebench R15 OpenGL 64 Bit +
Cinebench R15 - Cinebench R15 OpenGL 64 Bit
73.2 fps (4%)
Cinebench R15 OpenGL Ref. Match 64 Bit +
Cinebench R15 - Cinebench R15 OpenGL Ref. Match 64 Bit
97.9 % (98%)
Basemark GPU 1.2 - Basemark GPU 1.2 Vulkan Official Medium Offscreen 1080
315 fps (8%)
Geekbench 6.5 - Geekbench 6.5 GPU OpenCL
206281 punti (54%)
Geekbench 6.5 - Geekbench 6.5 GPU Vulkan
min: 16988     media: 18020     media: 18019.5 (4%)     massimo: 19051 punti
Power Consumption - Furmark Stress Test Power Consumption - external Monitor *
min: 27.7     media: 32.2     media: 32.2 (4%)     massimo: 36.6 Watt
0510152025303540Tooltip
Power Consumption - Cyberpunk 2077 Power Consumption 150cd *
34.2 Watt (10%)
05101520253035Tooltip
Power Consumption - Cyberpunk 2077 Power Consumption - external Monitor *
33.8 Watt (4%)
051015202530Tooltip
Power Consumption - Power Efficiency - Cyberpunk 2077 ultra
0.4 fps per Watt (1%)
- Valori di benchmark per questa scheda grafica
red legend - Valori medi di benchmark per questa scheda grafica
* Numeri più piccoli rappresentano prestazioni supeiori

Benchmarks per i giochi

I seguenti benchmarks deirivano dai benchmarks dei portatili recensiti. Le prestazioni dipendono dalla scheda grafica utilizzata, dal clock rate, dal processore, dai settaggi di sistema, dai drivers, e dai sistemi operativi. Quindi i risultati non sono rappresentativi per i portatili con questa GPU. Per informazioni dettagliate sui risultati del benchmark, cliccate sul numero di fps.

F1 24

F1 24

2024
basso 1920x1080
51.7  fps    + Confronta
medio 1920x1080
47.4  fps    + Confronta
alto 1920x1080
32.7  fps    + Confronta
ultra 1920x1080
6.9  fps    + Confronta
» Giocabile con tutti i portatili testati con dettagli medio.
basso 1920x1080
25 25.9 ~ 25 fps    + Confronta
medio 1920x1080
19.5  fps    + Confronta
alto 1920x1080
15.4 21.1 ~ 18 fps    + Confronta
ultra 1920x1080
12.4  fps    + Confronta
» Il Benchmark indica che il gioco non è utilizzabile con i settaggi testati.
Additional Benchmarks
Low Preset (FSR off) 1280x720
40.1
Steam Deck 1280x800
47.3
30min Start Ultra Preset (FSR off) 1920x1080
12.8
basso 1920x1080
26.5  fps    + Confronta
medio 1920x1080
21.1  fps    + Confronta
alto 1920x1080
17.2  fps    + Confronta
ultra 1920x1080
16.8  fps    + Confronta
» Il Benchmark indica che il gioco non è utilizzabile con i settaggi testati.
basso 1280x720
48  fps    + Confronta
medio 1920x1080
31  fps    + Confronta
alto 1920x1080
30  fps    + Confronta
ultra 1920x1080
28  fps    + Confronta
» Giocabile con tutti i portatili testati con dettagli basso.
basso 1280x720
59  fps    + Confronta
medio 1920x1080
39  fps    + Confronta
alto 1920x1080
33  fps    + Confronta
» Giocabile con tutti i portatili testati con dettagli medio.
basso 1280x720
41 71 ~ 56 fps    + Confronta
medio 1920x1080
28 32 ~ 30 fps    + Confronta
alto 1920x1080
28 29 ~ 29 fps    + Confronta
ultra 1920x1080
24 25 ~ 25 fps    + Confronta
» Giocabile con tutti i portatili testati con dettagli basso.
Strange Brigade

Strange Brigade

2018
basso 1280x720
125.5  fps    + Confronta
medio 1920x1080
48.4  fps    + Confronta
alto 1920x1080
37 39.6 ~ 38 fps    + Confronta
ultra 1920x1080
30 33.6 ~ 32 fps    + Confronta
» Giocabile con tutti i portatili testati con dettagli alto.
Far Cry 5

Far Cry 5

2018
alto 1920x1080
27  fps    + Confronta
ultra 1920x1080
23  fps    + Confronta
» Il Benchmark indica che il gioco non è utilizzabile con i settaggi testati.
Additional Benchmarks
Low Preset TAA 1920x1080
41
basso 1280x720
35.9  fps    + Confronta
medio 1920x1080
26.9  fps    + Confronta
alto 1920x1080
22.7  fps    + Confronta
» Giocabile con tutti i portatili testati con dettagli basso.
basso 1280x720
51.9 54.8 ~ 53 fps    + Confronta
medio 1920x1080
28  fps    + Confronta
alto 1920x1080
17.9 18.4 ~ 18 fps    + Confronta
» Giocabile con tutti i portatili testati con dettagli basso.
basso 1280x720
72.9 88.2 ~ 81 fps    + Confronta
medio 1366x768
62.5  fps    + Confronta
alto 1920x1080
57.9  fps    + Confronta
ultra 1920x1080
48.7  fps    + Confronta
» Giocabile con tutti i portatili testati con dettagli ultra.
GTA V

GTA V

2015
ultra 1920x1080
19.5  fps    + Confronta
» Il Benchmark indica che il gioco non è utilizzabile con i settaggi testati.
bassomedioaltoultraQHD4K
F1 2451.747.432.76.91
Cyberpunk 2077 2.2 Phantom Liberty2519.51812.4
Baldur's Gate 326.521.117.216.8
Guardians of the Galaxy48313028
Horizon Zero Dawn593933
Shadow of the Tomb Raider56302925
Strange Brigade125.548.43832
Far Cry 52723
X-Plane 11.1135.926.922.7
Final Fantasy XV Benchmark532818
Dota 2 Reborn8162.557.948.7
GTA V19.5
bassomedioaltoultraQHD4K
< 30 fps
< 60 fps
< 120 fps
≥ 120 fps
2
6
1
1
4
5
1
6
5

7
2


Per conoscere altri giochi che potrebbero essere utilizzabili e per una lista completa di tutti i giochi e delle schede grafiche visitate la nostra Gaming List

v1.34
log 01. 23:34:20

#0 ran 0s before starting gpusingle class +0s ... 0s

#1 no ids found in url (should be separated by "_") +0s ... 0s

#2 not redirecting to Ajax server +0s ... 0s

#3 did not recreate cache, as it is less than 5 days old! Created at Sat, 01 Nov 2025 05:35:47 +0100 +0.001s ... 0.001s

#4 composed specs +0.023s ... 0.024s

#5 did output specs +0s ... 0.024s

#6 start showIntegratedCPUs +0s ... 0.024s

#7 getting avg benchmarks for device 12320 +0.013s ... 0.037s

#8 got single benchmarks 12320 +0.01s ... 0.047s

#9 got avg benchmarks for devices +0s ... 0.047s

#10 min, max, avg, median took s +0.318s ... 0.365s

#11 before gaming benchmark output +0s ... 0.365s

#12 Got 51 rows for game benchmarks. +0.015s ... 0.38s

#13 composed SQL query for gamebenchmarks +0s ... 0.38s

#14 got data and put it in $dataArray +0.007s ... 0.387s

#15 benchmarks composed for output. +0.086s ... 0.473s

#16 no comparison url found in template nbc.compare_page_1 needed +0.003s ... 0.475s

#17 return log +0s ... 0.475s

Recensioni Notebook con AMD Radeon Steam Deck 8CU la scheda grafica

Recensione del palmare Asus ROG Xbox Ally: Più lento dello Steam Deck OLED

Recensione del palmare Asus ROG Xbox Ally: Più lento dello Steam Deck OLED

ROG Xbox Ally è la versione più economica della nuova linea di portatili di Asus. Al prezzo di 599 euro, è un testa a testa con lo Steam Deck OLED di Valve, ma ...
AMD Ryzen Z2 A | AMD Radeon Steam Deck 8CU | 7.00" | 670 gr
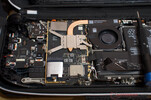
Recensione dello Steam Deck 1 TB OLED: Prestazioni minimaliste, massimo divertimento di gioco

Recensione dello Steam Deck 1 TB OLED: Prestazioni minimaliste, massimo divertimento di gioco

Per gli appassionati di tecnologia che sono costantemente a caccia dell'hardware più potente e dei punteggi più alti in tutti i benchmark, lo Steam Deck OLED sa...
AMD Steam Deck OLED APU | AMD Radeon Steam Deck 8CU | 7.40" | 640 gr

Asus ROG Xbox Ally: AMD Ryzen Z2 A, 7.00", 0.7 kg
   » L'Asus ROG Xbox Ally di base è troppo lento e troppo costoso

   » Le deboli forniture di Asus ROG Xbox Ally X trapelano suggerendo che Microsoft non ha molta fiducia nella console portatile

Valve Steam Deck 1 TB OLED : AMD Steam Deck OLED APU, 7.40", 0.6 kg
   » FSR 4 ora funziona su Steam Deck e offre un enorme aumento della qualità dell'immagine nei giochi supportati

   » Battlefield 1 abbandona la compatibilità con Steam Deck e l'anti-cheat del kernel nel nuovo aggiornamento

   » SteamOS si avvicina ai palmari di terze parti con il display Asus ROG Ally e il supporto VRR in Gamescope

   » Steam Deck OLED o palmare Windows? Non è solo una questione di gusti

   » Gaming Linux Nobara 39 rilasciato come pacchetto completo con supporto Steam Deck OLED

Please share our article, every link counts!
Mail Logo

Classe 1

Classe 2

GeForce RTX 2080 Super Mobile
RTX PRO 2000 Blackwell Generation Laptop *
M1 Max 32-Core GPU *
GeForce RTX 2070 Super Mobile
M1 Max 24-Core GPU *
Radeon 8050S *
Radeon RX 5700M *
M1 Pro 16-Core GPU *
Radeon PRO W6600M *
GeForce RTX 2070 Super Max-Q
M1 Pro 14-Core GPU *
RTX PRO 1000 Blackwell Generation Laptop *
Quadro P4200
Radeon 8040S *
Arc B 12 Xe3 Panther Lake iGPU

Classe 3

Quadro P5000 Max-Q *
GeForce RTX 3050 4GB Laptop GPU
Arc 140T *
Arc 130T *
Quadro P4000 Max-Q
Radeon RX 580X (Laptop) *
Radeon RX 580 (Laptop)
Radeon Pro 5300M
Radeon RX 5300M
Quadro P3000 Max-Q *
Radeon Pro WX 7100 *
Radeon RX 570X (Laptop) *
Radeon RX 570 (Laptop) *
Radeon RX 470 (Laptop) *
GeForce GTX 1050 Ti Mobile
Radeon 680M
Quadro P2000 Max-Q
Radeon R9 M395X
GeForce GTX 1050 Ti Max-Q *
WX Vega M GL
Radeon R9 M485X
GeForce GTX 1050 Max-Q *
Radeon 660M
Radeon RX 560X (Laptop)
Radeon RX 560 (Laptop)
Radeon Pro 560X
Radeon Pro 560
Radeon Pro 460
Radeon Pro WX 4130 *
Quadro P620 *
Radeon RX 550X (Laptop)
Radeon Pro 555X
Radeon Pro 555
Radeon Pro 455
Quadro P600
Graphics 3-Core iGPU (Arrow Lake) *
Radeon RX 540X *
Radeon Pro WX 2100 *
Radeon Pro WX 3100 *
Graphics 2-Core iGPU (Arrow Lake) *
Radeon Pro 450
Radeon 630
Radeon 540X *
Quadro P520
Quadro P500 *
Iris Plus Graphics G7 (Ice Lake 64 EU) *
Vega 10 *
Iris Pro Graphics 580
Vega 9
FirePro W5130M
UHD Graphics Xe G4 48EUs *
UHD Graphics 32EUs
UHD Graphics Xe 32EUs (Tiger Lake-H) *
UHD Graphics 750
UHD Graphics 730
Vega 7
Radeon R7 M465
Vega 8
Iris Plus Graphics G4 (Ice Lake 48 EU)
Quadro M600M
FirePro W4190M
Radeon R7 M445
UHD Graphics 24EUs (Alder Lake-N) *
Radeon R7 M340
Radeon 610M *
UHD Graphics G1 (Ice Lake 32 EU)
UHD Graphics Xe 16EUs (Tiger Lake-H) *
Radeon R5 (Bristol Ridge)
Adreno 690 *
Adreno 685 *
Adreno 680 *

Classe 4

Posizione approssimativa dell'adattatore grafico

Klaus Hinum (Update: 2024-02-24)