Recensioni Notebook con Intel HD Graphics (Bay Trail) la scheda grafica
Recensione breve del Tablet Fujitsu Stylistic V535 (Z3795,128 GB, LTE)
Rinforzato per il lavoro duro. Con queste parole, Fujitsu lancia il tablet Stylistic V535. Questo 8.3" ha molte features di comunicazione, molta memoria, e una CPU da 64-bit. Le specifiche sono eccellenti. Tuttavia, la realtà è un'altra: il raffreddamento passivo rovina i piani.
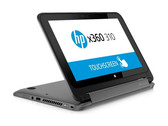
Intel Atom Z3795, HD Graphics (Bay Trail), 8.3", 550 grRecensione breve del Convertibile HP x360 310 G1
Scatolo pieghevole? E' più un subnotebook o un convertibile 360°? Questo piccolo dispositivo da 11.6" offre ottime prestazioni, manifattura e spazio di archiviazione. Tuttavia, non ha un buon display ed una tastiera adeguata.
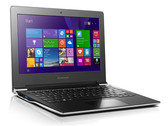
Intel Pentium N3540, HD Graphics (Bay Trail), 11.6", 1.5 kgRecensione Breve del Subnotebook Lenovo S21e-20 80M4004MGE
200 Euro. Che Windows avrete a questo prezzo? Questo dispositivo da 11" gira con Windows 10 Home 64 bit. Tuttavia, ci sono alcune pecche, come tastiera e chassis debole.
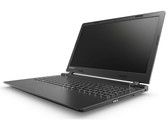
Intel Pentium N3540, HD Graphics (Bay Trail), 11.6", 1.1 kgRecensione Breve del Portatile Lenovo B50-10 80QR0013GE
Senza Senso. 299 Euro (~$333) per il B50-10. E avrete un portatile Bay Trail con Windows 10. Tuttavia, non è una macchina da scrivere portatile. Lenovo taglia sulla batteria (24 Wh), ed il portatile conseguentemente ha una autonomia limitata.
Intel Pentium N3540, HD Graphics (Bay Trail), 15.6", 2.3 kgRecensione breve del Convertibile Acer One 10 S1002-17HU
Le sottili differenze. A primo impatto, l'Acer One 10 e l'Aspire Switch 10E che abbiamo testato da poco sembrano molto simili. Uno sguardo ravvicinato, tuttavia mostra varie modifiche (prevalentemente importanti) - ma nessuna modifica ha riguardato l'architettura del processore.
Intel Atom Z3735F, HD Graphics (Bay Trail), 10.1", 1.2 kgHP Pro Tablet 408 G1 L3S97AA: Intel Atom Z3736F, 8.00", 0.4 kg
recensione » Recensione Brece del Tablet HP Pro Tablet 408 G1
HP Pro Tablet 10 EE G1: Intel Atom Z3735F, 10.10", 0.9 kg
recensione » Recensione Breve del Tablet HP Pro Tablet 10 EE G1
Lenovo IdeaPad Miix 300-10IBY: Intel Atom Z3735F, 10.10", 1.2 kg
recensione » Recensione Breve del Convertibile Lenovo IdeaPad Miix 300-10IBY
Acer Aspire E13 ES1-311-P87D: Intel Pentium N3540, 13.30", 1.6 kg
recensione » Recensione Breve del Portatile Acer Aspire E13 ES1-311
Lenovo Ideapad 100S 80R2: Intel Atom Z3735F, 11.60", 1 kg
recensione » Recensione Breve del portatile Lenovo Ideapad 100S
Lenovo IdeaPad 100-15IBY: Intel Pentium N3540, 15.60", 2.3 kg
recensione » Recensione Breve del portatile Lenovo IdeaPad 100-15
HP Pavilion x2 10-n013dx: Intel Atom Z3736F, 10.10", 1.2 kg
recensione » Recensione breve del convertibile HP Pavilion x2 10-n013dx
Asus X200MA-BING-KX366B: Intel Celeron N2830, 11.60", 1.2 kg
recensione » Recensione Breve del Portatile Asus X200MA
Panasonic Toughpad FZ-B2: Intel Celeron N2930, 7.00", 0.6 kg
recensione » Recensione Breve del Tablet Panasonic Toughpad FZ-B2
Toshiba CB30-B-104: Intel Celeron N2840, 13.30", 1.3 kg
recensione » Recensione Breve del Toshiba Chromebook 2 CB30-B
Dell Chromebook 11-3120: Intel Celeron N2840, 11.60", 1.2 kg
recensione » Recensione Breve del portatile Dell Chromebook 11 (3120)
Acer Aspire Switch 10E SW3-013: Intel Atom Z3735F, 10.10", 1.2 kg
recensione » Recensione Breve del Convertibile Acer Aspire Switch 10E SW3-013
Acer Iconia Tab 10 A3-A30: Intel Atom Z3735F, 10.10", 0.5 kg
recensione » Recensione breve del tablet Acer Iconia Tab 10 A3-A30
Toshiba Satellite Click Mini L9W-B-102: Intel Atom Z3735F, 8.90", 0.5 kg
recensione » Recensione Breve del Convertibile Toshiba Satellite Click Mini L9W-B
Acer Aspire E15 ES1-512-P1SM: Intel Pentium N3540, 15.60", 2.2 kg
recensione » Recensione Breve del Portatile Acer Aspire E15 Start ES1-512-P1SM
Dell Venue 11 Pro 5130-9356: Intel Atom Z3795, 10.80", 0.8 kg
recensione » Recensione Breve del Tablet Dell Venue 11 Pro 5130-9356
Acer Iconia One 8: Intel Atom Z3735G, 8.00", 0.3 kg
recensione » Recensione Breve del Tablet Acer Iconia One 8
Samsung Chromebook XE500C12-K01US: Intel Celeron N2840, 11.60", 1.2 kg
recensione » Recensione Breve del portatile Samsung Chromebook 2 (XE500C12)
HP Stream 13-c002ng: Intel Celeron N2840, 13.30", 1.6 kg
recensione » Recensione Breve del portatile HP Stream 13
Asus Transformer Book T100TAL-DK021P: Intel Atom Z3735D, 10.10", 1.2 kg
recensione » Recensione del Convertibile Asus Transformer Book T100TAL
Dell Venue 10 Pro 5055: Intel Atom Z3735F, 10.10", 0.7 kg
recensione » Recensione breve del convertibile Dell Venue 10 Pro 5055
Dell Latitude 11 3150: Intel Pentium N3540, 11.00", 1.4 kg
recensione » Recensione breve del notebook Dell Latitude 11 3150
Lenovo Miix 3 8: Intel Atom Z3735F, 7.85", 0.4 kg
recensione » Recensione breve del Tablet Lenovo Miix 3 8
Asus T100CHI-B1-BK: Intel Atom Z3775, 10.10", 1.1 kg
recensione » Recensione Breve del Tablet Convertibile Asus Transformer Book T100 Chi
Lenovo ThinkPad Yoga 11e 20D9000QGE: Intel Celeron N2930, 11.60", 1.6 kg
recensione » Recensione Breve del portatile Lenovo ThinkPad Yoga 11e
Lenovo Yoga Tablet 2 8: Intel Atom Z3745, 8.00", 0.4 kg
recensione » Recensione breve del Tablet Lenovo Yoga Tablet 2 8
Prestigio Multipad Visconte 3 3G: Intel Atom Z3735F, 10.10", 0.7 kg
recensione » Recensione breve del Notebook Prestigio Multipad Visconte 3 3G
MSI S100: Intel Atom Z3740D, 10.10", 0.6 kg
recensione » Recensione convertibile MSI S100
Lenovo Miix 3 10: Intel Atom Z3735F, 10.10", 0.6 kg
recensione » Recensione breve del Convertibile Lenovo Miix 3 10
Asus C300MA-DB01: Intel Celeron N2830, 13.30", 1.4 kg
recensione » Recensione breve del Chromebook Asus C300MA
HP Stream 11 X360: Intel Celeron N2840, 11.60", 1.6 kg
recensione » Recensione breve del convertibile notebook HP Stream 11 X360 con 3G
Lenovo Tab S8: Intel Atom Z3745, 8.00", 0.3 kg
recensione » Recensione breve del tablet Lenovo Tab S8
Asus X751MA-TY148H: Intel Pentium N3530, 17.30", 2.8 kg
recensione » Aggiornamento recensione Portatile Asus X751MA-TY148H
Lenovo N20 Chromebook: Intel Celeron N2830, 11.60", 1.2 kg
recensione » Aggiornamento recensione Lenovo N20 Chromebook
Acer Iconia Tab 8 W: Intel Atom Z3735G, 8.00", 0.4 kg
recensione » Recensione breve del Tablet Acer Iconia Tab 8 W W1-810-16HN
Trekstor SurfTab Wintron 10.1: Intel Atom Z3735F, 10.10", 0.7 kg
recensione » Recensione breve del Tablet Trekstor SurfTab Wintron 10.1
HP Stream 7 5700ng: Intel Atom Z3735G, 7.00", 0.4 kg
recensione » Recensione breve del Tablet HP Stream 7 5700ng
HP Stream 8 5900ng: Intel Atom Z3735G, 8.00", 0.4 kg
recensione » Recensione breve del Tablet HP Stream 8 5900ng
Acer Travelmate B115-MP-C2TQ: Intel Celeron N2930, 11.60", 1.4 kg
recensione » Recensione breve aggiornamento Netbook Acer TravelMate B115-MP-C2TQ
Dell Venue 8 Pro 3845: Intel Atom Z3735G, 8.00", 0.4 kg
recensione » Aggiornamento recensione Tablet Dell Venue 8 Pro (Modello 3845)
Lenovo Yoga 2-1051F: Intel Atom Z3745, 10.10", 0.9 kg
recensione » Aggiornamento recensione tablet Windows Lenovo Yoga 2 1051F
Toshiba Satellite Radius 11 L10-B-101 : Intel Celeron N2840, 11.60", 1.3 kg
recensione » Recensione Breve del Convertibile Toshiba Satellite Radius 11 L10-B-101
Acer Aspire ES1-111-C56A: Intel Celeron N2840, 11.60", 1.3 kg
recensione » Recensione Breve del Netbook Acer Aspire ES1-111-C56A
HP Pavilion 10-k000ng x2: Intel Atom Z3736F, 10.10", 0.6 kg
recensione » Recensione breve del Tablet HP Pavilion 10-k000ng x2
Asus EeeBook X205TA-FD005BS: Intel Atom Z3735F, 11.60", 1 kg
recensione » Prime impressioni: recensione Asus EeeBook X205TA-FD005BS
Lenovo Yoga Tablet 2 Pro: Intel Atom Z3745, 13.30", 1 kg
recensione » Recensione breve del Lenovo Yoga Tablet 2 Pro
Asus EeeBook X205TA-FD005BS: Intel Atom Z3735F, 11.60", 1 kg
recensione » Recensione breve del Netbook Asus EeeBook X205TA-FD005BS
HP 14-r003ng: Intel Pentium N3530, 14.00", 2 kg
recensione » Recensione breve del notebook HP 14-r003ng
Dell Inspiron 15-3531: Intel Celeron N2830, 15.60", 2.1 kg
recensione » Recensione breve del Dell Inspiron 15-3531
Lenovo S20-30: Intel Celeron N2830, 11.60", 1.3 kg
recensione » Recensione breve netbook Lenovo S20-30
Acer Aspire Switch 10 SW5-012-13DP: Intel Atom Z3735F, 10.10", 1.1 kg
recensione » Aggiornamento breve del Convertibile Acer Aspire Switch 10 Full HD
Asus Memo Pad 8 ME181CX: Intel Atom Z3745, 8.00", 0.3 kg
recensione » Recensione breve dell'Asus Memo Pad 8 ME181CX Tablet (Pro 7 Entertainment Pad)
Point of View WinTab 800W: Intel Atom Z3735G, 8.00", 0.3 kg
recensione » Recensione breve del Tablet Point of View Mobii WinTab 800W
Acer CB3-111: Intel Celeron N2840, 11.60", 1.3 kg
recensione » Recensione breve dell'Acer Chromebook 11 CB3-111
Lenovo Yoga Tablet 2 1050F: Intel Atom Z3745, 10.10", 0.6 kg
recensione » Recensione breve Lenovo Yoga Tablet 2 (10.1 inch/Wi-Fi/1050F)
Lenovo G50-30: Intel Celeron N2830, 15.60", 2.1 kg
recensione » Aggiornamento recensione del portatile Lenovo G50-30
Toshiba Satellite Click 2 L30W-BST2N23: Intel Pentium N3530, 13.30", 2.1 kg
recensione » Recensione breve del Convertibile Toshiba Satellite Click 2 L30W
Acer Aspire E15 ES1-511-C50C: Intel Celeron N2930, 15.60", 2.4 kg
recensione » Aggiornamento della recensione breve dell'Acer Aspire E15 ES1-511-C50C
HP 250 G3: Intel Celeron N2830, 15.60", 2.1 kg
recensione » Recensione breve del Notebook HP 250 G3
Asus X551MAV-SX391B: Intel Celeron N2830, 15.60", 2.2 kg
recensione » Recensione breve aggiornamento portatile Asus X551MAV-SX391B
Acer Extensa 2509-C052: Intel Celeron N2930, 15.60", 2.3 kg
recensione » Recensione breve del Notebook Acer Extensa 2509-C052
Packard Bell Easynote TF71BM-C8R1: Intel Celeron N2830, 15.60", 2.4 kg
recensione » Recensione breve del Notebook Packard Bell EasyNote TF71BM-C8R1
Asus Transformer Book T200TA: Intel Atom Z3775, 11.60", 1.6 kg
recensione » Recensione Completa del Convertibile Asus Transformer Book T200TA
Acer Iconia Tab 8: Intel Atom Z3745, 8.00", 0.4 kg
recensione » Recensione breve del Tablet Acer Iconia Tab 8 A1-840FHD
Lenovo N20p-59426642 Chromebook: Intel Celeron N2830, 11.60", 1.3 kg
recensione » Recensione breve del Chromebook Lenovo N20p-59426642 Dual-Mode
Lenovo ThinkPad Yoga 11e: Intel Celeron N2930, 11.60", 1.7 kg
recensione » Recensione breve del Chromebook Lenovo ThinkPad Yoga 11e
Toshiba WT8-B-102: Intel Atom Z3735G, 8.00", 0.4 kg
recensione » Recensione Breve del Tablet Toshiba WT8-B-102
Acer Aspire V3-111P-P06A: Intel Pentium N3530, 11.60", 1.4 kg
recensione » Recensione Breve dell'update del portatile Acer Aspire V3-111P-P06A
Fujitsu Stylistic Q584: Intel Atom Z3770, 10.10", 0.7 kg
recensione » Recensione breve del Table Fujitsu Stylistic Q584
HP ElitePad 1000 G2: Intel Atom Z3795, 10.10", 0.7 kg
recensione » Recensione breve del tablet HP ElitePad 1000 G2 (F1Q77EA)
Acer Aspire E3-111-C6LG: Intel Celeron N2930, 11.60", 1.3 kg
recensione » Recensione Breve del Portatile Acer Aspire E3-111-C6LG
Asus Transformer Pad TF303CL-1D050A: Intel Atom Z3745, 10.10", 0.6 kg
recensione » Recensione Breve del Tablet Asus Transformer Pad TF303CL-1D050A
Asus C200MA-KX003: Intel Celeron N2830, 11.60", 1.2 kg
recensione » Recensione breve dell'Asus C200MA-KX003 Chromebook
Lenovo B50-30: Intel Celeron N2815, 15.60", 2.2 kg
recensione » Recensione breve del notebook Lenovo B50-30
Asus Memo Pad HD 7 ME176C: Intel Atom Z3745, 7.00", 0.3 kg
recensione » Recensione breve del tablet Asus Memo Pad HD 7 ME176C
Lenovo ThinkPad 10: Intel Atom Z3795, 10.10", 0.6 kg
recensione » Recensione breve del tablet Lenovo ThinkPad 10 Multimode
Acer Aspire Switch 10 SW5-011-12VU: Intel Atom Z3745D, 10.10", 1.1 kg
recensione » Recensione breve del Convertibile Acer Aspire Switch 10 SW5-011-12VU
Asus Transformer Pad TF103C-1B072A: Intel Atom Z3745, 10.10", 0.6 kg
recensione » Recensione breve del Tablet Asus Transformer Pad TF103C-1B072A
Dell Venue 11 Pro 5130: Intel Atom Z3770, 10.80", 0.8 kg
recensione » Recensione breve del Tablet Dell Venue 11 Pro 5130
Lenovo IdeaPad Flex 10: Intel Celeron N2806, 10.10", 1.2 kg
recensione » Recensione breve del Portatile Lenovo IdeaPad Flex 10
Lenovo Miix 2 10: Intel Atom Z3740D, 10.00", 1.1 kg
recensione » Recensione breve del Tablet Lenovo Miix 2 10
HP Pavilion 11-n070eg x360: Intel Celeron N2820, 11.60", 1.5 kg
recensione » Recensione Breve del Convertibile HP Pavilion 11-n070eg x360
Lenovo IdeaPad Yoga 2 11: Intel Pentium N3520, 11.60", 1.3 kg
recensione » Recensione breve Lenovo IdeaPad Yoga 2 11 Convertible
Asus F200MA-CT067H: Intel Celeron N2815, 11.60", 1.2 kg
recensione » Recensione breve del Notebook Asus F200MA-CT067H
Asus F551MA-SX063H: Intel Pentium N3520, 15.60", 2.2 kg
recensione » Recensione Breve del Notebook Asus F551MA-SX063H
Asus VivoTab Note 8 (M80TA): Intel Atom Z3740, 8.00", 0.4 kg
recensione » Recensione breve del tablet Asus VivoTab Note 8 (M80TA)
HP Pavilion 11-h000sg: Intel Pentium N3510, 11.60", 1.6 kg
recensione » Recensione breve del Convertibile HP Pavilion 11-h000sg
Acer Iconia W4-820-2466: Intel Atom Z3740, 8.10", 0.4 kg
recensione » Recensione breve del Tablet Acer Iconia W4-820-2466
Acer Aspire E1-510P-2671: Intel Celeron N2920, 15.60", 2.3 kg
recensione » Recensione breve del Notebook Acer Aspire E1-510P-2671
Sony VAIO Fit 11A multi-flip SVF11AN1L2ES: Intel Celeron N2920, 11.60", 1.2 kg
recensione » Recensione breve del Convertibile Sony Vaio Fit multi-flip SV-F11AN1L2ES
Toshiba Satellite C50-A-1JU: Intel Pentium N3520, 15.60", 2.4 kg
recensione » Recensione breve del portatile Update Toshiba Satellite C50-A-1JU
Toshiba Encore WT8-A-102: Intel Atom Z3740, 8.00", 0.5 kg
recensione » Recensione breve tablet Toshiba Encore WT8-A-102
Toshiba Satellite NB10t-A-101: Intel Celeron N2810, 11.60", 1.5 kg
recensione » Recensione breve del Netbook Toshiba Satellite NB10t-A-101
Dell Venue 8 Pro: Intel Atom Z3740D, 8.00", 0.4 kg
recensione » Recensione breve del Tablet Dell Venue 8 Pro
Packard Bell EasyNote ME69BMP: Intel Celeron N2805, 10.00", 1.1 kg
recensione » Recensione breve netbook Packard Bell EasyNote ME69BMP
Lenovo Miix 2 8: Intel Atom Z3740, 8.00", 0.3 kg
recensione » Recensione breve del Tablet Lenovo Miix 2 8
Asus Transformer Book T100TA-C1-GR: Intel Atom Z3740, 10.10", 1.1 kg
recensione » Recensione breve del Convertibile Asus Transformer Book T100TA-C1-GR
HP Chromebook 14-ak045wm: Intel Celeron N2940, 14.00", 1.7 kg
Recensioni esterne » HP Chromebook 14-ak045wm
Wortmann Terra Pad 1085: Intel Atom Z3745, 10.10", 0.8 kg
Recensioni esterne » Wortmann Terra Pad 1085
Medion Akoya E4213-MD99559 : Intel Celeron N2840, 14.00", 1.7 kg
Recensioni esterne » Medion Akoya E4213-MD99559
HP Stream 13-c000nd: Intel Celeron N2840, 13.30", 1.8 kg
Recensioni esterne » HP Stream 13-c000nd
HP Stream 11-d000nd: Intel Celeron N2840, 11.60", 1.3 kg
Recensioni esterne » HP Stream 11-d000nd
Prestigio MultiPad Visconte A PMP1014TE: Intel Atom Z3735F, 10.10", 0.6 kg
Recensioni esterne » Prestigio MultiPad Visconte A PMP1014TE
Prestigio Smartbook 141A: Intel Atom Z3735F, 14.10", 1.4 kg
Recensioni esterne » Prestigio Smartbook 141A
Acer Chromebook 11 CB3-131-C457: Intel Celeron N2840, 11.60", 1.1 kg
Recensioni esterne » Acer Chromebook 11 CB3-131-C457
Dell Latitude 11 3150: Intel Pentium N3540, 11.00", 1.4 kg
Recensioni esterne » Dell Latitude 11 3150
ODYS Cosmo Windows X9: Intel Atom Z3735F, 8.90", 0.4 kg
Recensioni esterne » ODYS Cosmo Windows X9
Dell Latitude 11-3150-4500: Intel Celeron N2840, 11.60", 1.4 kg
Recensioni esterne » Dell Latitude 11-3150-4500
Prestigio Smartbook 116A02: Intel Atom Z3735F, 11.60", 1.6 kg
Recensioni esterne » Prestigio Smartbook 116A02
Asus Chromebook C300MA-RO005: Intel Celeron N2830, 13.30", 1.4 kg
Recensioni esterne » Asus Chromebook C300MA-RO005
Medion Akoya E8201T-MD99751: Intel Atom Z3735G, 8.00", 0.3 kg
Recensioni esterne » Medion Akoya E8201T-MD99751
Medion Akoya E1235T-MD99776: Intel Atom Z3735F, 10.10", 1.2 kg
Recensioni esterne » Medion Akoya E1235T-MD99776
Medion Akoya E8201T-MD99751: Intel Atom Z3735G, 8.00", 0.3 kg
Recensioni esterne » Medion Lifetab E8201T-MD99751
Medion Akoya S6217-MD99567: Intel Pentium N3540, 15.60", 3.3 kg
Recensioni esterne » Medion Akoya S6217-MD99567
Lenovo B50-10 80QR0013GE: Intel Pentium N3540, 15.60", 2.3 kg
Recensioni esterne » Lenovo B50-10 80QR0013GE
HP Stream 13-c003: Intel Celeron N2840, 13.30", 1.6 kg
Recensioni esterne » HP Stream 13-c003
Acer Chromebook 11 CB3-131-C1CA: Intel Celeron N2840, 11.60", 1.1 kg
Recensioni esterne » Acer Chromebook 11 CB3-131-C1CA
Lenovo S21e-20 80M4004MGE: Intel Pentium N3540, 11.60", 1.1 kg
Recensioni esterne » Lenovo S21e-20 80M4004MGE
Asus EeeBook E402MA-WX0031T: Intel Celeron N2840, 14.10", 1.7 kg
Recensioni esterne » Asus EeeBook E402MA-WX0031T
Medion Lifetab P10325: Intel Atom Z3735F, 10.10", 0.6 kg
Recensioni esterne » Medion Lifetab P10325
HP Chromebook 11 G4: Intel Celeron N2840, 11.60", 1.3 kg
Recensioni esterne » HP Chromebook 11 G4
Archos 90 Cesium: Intel Atom Z3735F, 8.90", 0.8 kg
Recensioni esterne » Archos 90 Cesium
Medion Akoya S1219T-MD99348: Intel Atom Z3735F, 10.10", 1 kg
Recensioni esterne » Medion Akoya S1219T-MD99348
Acer Iconia Tab 10 A3-A30-197H: Intel Atom Z3735F, 10.10", 0.5 kg
Recensioni esterne » Acer Iconia Tab 10 A3-A30-197H
Lenovo B50-10-80QR0013GE: Intel Pentium N3540, 15.60", 1.9 kg
Recensioni esterne » Lenovo B50-10-80QR0013GE
Asus EeeBook F205TA-FD0065TS: Intel Atom Z3735F, 11.60", 1 kg
Recensioni esterne » Asus EeeBook F205TA-FD0065TS
Asus R515MA-SX570B: Intel Celeron N2840, 15.60", 2.3 kg
Recensioni esterne » Asus R515MA-SX570B
Acer Aspire Switch 10E SW3-013-100N: Intel Atom Z3735F, 10.10", 1.2 kg
Recensioni esterne » Acer Aspire Switch 10E SW3-013-100N
HP Chromebook 14 G4: Intel Celeron N2940, 14.00", 1.7 kg
Recensioni esterne » HP Chromebook 14 G4
Lenovo IdeaPad 100S-11IBY: Intel Atom Z3735F, 11.60", 1 kg
Recensioni esterne » Lenovo IdeaPad 100S-11IBY
Lenovo B50-10: Intel Celeron N2840, 15.60", 1.9 kg
Recensioni esterne » Lenovo B50-10
Lenovo IdeaPad Miix 300-10IBY: Intel Atom Z3735F, 10.10", 1.2 kg
Recensioni esterne » Lenovo IdeaPad Miix 300-10IBY
Lenovo IdeaPad 100s 11IBY 80R2002VFR: Intel Atom Z3735F, 11.60", 1 kg
Recensioni esterne » Lenovo IdeaPad 100s 11IBY 80R2002VFR
Lenovo IdeaPad 100-15IBY: Intel Pentium N3540, 15.60", 2.3 kg
Recensioni esterne » Lenovo IdeaPad 100-15IBY
Acer Iconia Tab 8 A1-850-13FQ: Intel Atom Z3745, 8.00", 0.4 kg
Recensioni esterne » Acer Iconia Tab 8 A1-850-13FQ
Lenovo Flex 3 11-80LX000DUS: Intel Celeron N2840, 11.60", 1.4 kg
Recensioni esterne » Lenovo Flex 3 11-80LX000DUS
HP Pavilion 11-n032tu x360: Intel Pentium N3540, 11.60", 1.5 kg
Recensioni esterne » HP Pavilion 11-n032tu x360
Lenovo Yoga 300-11IBY-80M0007QGE: Intel Celeron N2840, 11.60", 1.4 kg
Recensioni esterne » Lenovo Yoga 300-11IBY-80M0007QGE
Lenovo B40-30: Intel Celeron N2840, 14.00", 0.3 kg
Recensioni esterne » Lenovo B40-30
Acer Aspire Switch 10E SW5-012-11E6: Intel Atom Z3735F, 10.10", 1.2 kg
Recensioni esterne » Acer Aspire Switch 10E SW5-012-11E6
Lenovo IdeaPad 100-14IBY: Intel Celeron N2940, 15.60", 2 kg
Recensioni esterne » Lenovo IdeaPad 100-14IBY
HP Pavilion x2 10-n011nl: Intel Atom Z3736F, 10.10", 1.7 kg
Recensioni esterne » HP Pavilion x2 10-n011nl
Lenovo IdeaPad 100-14IBY-80MH005TGE: Intel Celeron N2840, 14.00", 1.9 kg
Recensioni esterne » Lenovo IdeaPad 100-14IBY-80MH005TGE
Lenovo IdeaPad 100S-80QN0000US Chromebook: Intel Celeron N2840, 11.60", 1.1 kg
Recensioni esterne » Lenovo 100S-80QN0000US Chromebook
HP ProSlate 10 EE G1: Intel Atom Z3735F, 7.00", 0.9 kg
Recensioni esterne » HP ProSlate 10 EE G1
Lenovo Ideapad 100S 80R2: Intel Atom Z3735F, 11.60", 1 kg
Recensioni esterne » Lenovo Ideapad 100S 80R2
Asus X553MA-XX366H: Intel Pentium N3540, 15.60", 2.2 kg
Recensioni esterne » Asus X553MA-XX366H
Acer Aspire Switch 10 Special Edition SW5-015-16Y3: Intel Atom Z3735F, 10.10", 1.2 kg
Recensioni esterne » Acer Aspire Switch 10 Special Edition SW5-015-16Y3
Acer Iconia Tab 10 A3-A30: Intel Atom Z3735F, 10.10", 0.5 kg
Recensioni esterne » Acer Iconia Tab 10 A3-A30
HP Pavilion x2 10-n000N: Intel Atom Z3736F, 10.10", 1.1 kg
Recensioni esterne » HP Pavilion x2 10-n000N
Acer Aspire V3-112P-P5B3: Intel Pentium N3540, 11.60", 1.4 kg
Recensioni esterne » Acer Aspire V3-112P-P5B3
Acer Aspire Switch 10E SW3-013-11N8: Intel Atom Z3735F, 10.10", 1.2 kg
Recensioni esterne » Acer Aspire Switch 10E SW3-013-11N8
Lenovo IdeaPad 100-15-80MJ001CGE: Intel Celeron N2840, 15.60", 2.3 kg
Recensioni esterne » Lenovo IdeaPad 100-15-80MJ001CGE
Medion Akoya E4214-MD99570: Intel Pentium N3540, 14.00", 1.7 kg
Recensioni esterne » Medion Akoya E4214-MD99570
HP Pavilion x2 10-n054sa: Intel Atom Z3736F, 10.10", 1.2 kg
Recensioni esterne » HP Pavilion x2 10-n054sa
Lenovo ThinkPad 11e: Intel Celeron N2940, 11.30", 1.5 kg
Recensioni esterne » Lenovo ThinkPad 11e
Lenovo S21e-20-80M40015US: Intel Celeron N2840, 11.60", 1.2 kg
Recensioni esterne » Lenovo S21e-20-80M40015US
HP ElitePad 1000 G2-J6T84AW: Intel Atom Z3795, 10.10", 0.7 kg
Recensioni esterne » HP ElitePad 1000 G2-J6T84AW
Acer Switch 10 SW5-015: Intel Atom Z3735F, 10.10", 1.2 kg
Recensioni esterne » Acer Switch 10 SW5-015
HP Pavilion x2 10-n001nf: Intel Atom Z3736F, 10.10", 1.2 kg
Recensioni esterne » HP Pavilion x2 10-n001nf
Lenovo Ideapad 100-14-80MH000YUS: Intel Celeron N2940, 14.10", 1.9 kg
Recensioni esterne » Lenovo Ideapad 100-14-80MH000YUS
Acer Extensa 2508-C3QZ: Intel Celeron N2840, 15.60", 2.5 kg
Recensioni esterne » Acer Extensa 2508-C3QZ
HP Pro Tablet 408 G1 L3S97AA: Intel Atom Z3736F, 8.00", 0.4 kg
Recensioni esterne » HP Pro Tablet 408 G1
Acer Aspire E15 ES1-512-C3YS: Intel Celeron N2840, 15.60", 2.4 kg
Recensioni esterne » Acer Aspire E15 ES1-512-C3YS
Dell Inspiron 15-5551: Intel Pentium N3540, 15.60", 1.2 kg
Recensioni esterne » Dell Inspiron 15-5551
Lenovo Flex 3 11 inch: Intel Pentium N3540, 11.60", 1.4 kg
Recensioni esterne » Lenovo Flex 3 11 inch
Lenovo S21e-20-80M40003GE: Intel Celeron N2840, 11.60", 1.2 kg
Recensioni esterne » Lenovo S21e-20-80M40003GE
Acer Iconia One 8 B1-820: Intel Atom Z3735G, 8.00", 0.4 kg
Recensioni esterne » Acer Iconia One 8 B1-820
Lenovo Idepad G4030: Intel Pentium N3540, 14.00", 2 kg
Recensioni esterne » Lenovo Idepad G4030
Acer Aspire Switch 10 SW3-013-12U1: Intel Atom Z3735F, 10.10", 1.2 kg
Recensioni esterne » Acer Aspire Switch 10 SW3-013-12U1
Acer Aspire ES1-512-C8JU: Intel Celeron N2840, 15.60", 2.4 kg
Recensioni esterne » Acer Aspire ES1-512-C8JU
Lenovo S20-30-59422752: Intel Celeron N2930, 11.60", 1.3 kg
Recensioni esterne » Lenovo S20-30-59422752
Lenovo N20 Chromebook: Intel Celeron N2830, 11.60", 1.2 kg
Recensioni esterne » Lenovo N20 Chromebook
Toshiba Satellite Radius 11 L10W-B-102 : Intel Pentium N3540, 11.60", 1.3 kg
Recensioni esterne » Toshiba Satellite Radius 11 L10W-B-102
Medion Akoya P2213T: Intel Pentium N3540, 11.60", 0.9 kg
Recensioni esterne » Medion Akoya P2213T
Asus X453MA: Intel Celeron N2840, 14.00", 2 kg
Recensioni esterne » Asus X453MA
Toshiba Satellite Click Mini L9W-B-102: Intel Atom Z3735F, 8.90", 0.5 kg
Recensioni esterne » Toshiba Satellite Click Mini L9W-B-102
Acer Aspire Switch 10 SW5-012-14HK: Intel Atom Z3735F, 10.10", 1.2 kg
Recensioni esterne » Acer Aspire Switch 10 SW5-012-14HK
Acer Aspire ES1-411-P5BD: Intel Pentium N3540, 14.00", 2.1 kg
Recensioni esterne » Acer Aspire ES1-411-P5BD
Dell Chromebook 11-3120: Intel Celeron N2840, 11.60", 1.2 kg
Recensioni esterne » Dell Chromebook 11-3120
Acer Chromebook 15 CB3-531: Intel Celeron N2830, 15.60", 2 kg
Recensioni esterne » Acer Chromebook 15 CB3-531
Dell Venue 10 Pro 5055: Intel Atom Z3735F, 10.10", 0.7 kg
Recensioni esterne » Dell Venue 10 Pro 5055
HP Chromebook 11 G3: Intel Celeron N2840, 11.60", 1.3 kg
Recensioni esterne » HP Chromebook 11 G3
Kogan Atlas X1510: Intel Pentium N3540, 15.60", 2.1 kg
Recensioni esterne » Kogan Atlas X1510
Acer Aspire Switch 10E SW3-013: Intel Atom Z3735F, 10.10", 1.2 kg
Recensioni esterne » Acer Aspire Switch 10E SW3-013
HP Stream 13-C080no: Intel Celeron N2840, 13.30", 1.6 kg
Recensioni esterne » HP Stream 13-C080no
Asus Transformer Book T100CHI-FG003B: Intel Atom Z3775, 10.10", 0.6 kg
Recensioni esterne » Asus Transformer Book T100CHI-FG003B
HP Stream 11-p085ng x360: Intel Celeron N2840, 11.60", 1.6 kg
Recensioni esterne » HP Stream 11-p085ng x360
Toshiba Chromebook CB30-B-103: Intel Celeron N2840, 13.30", 1.4 kg
Recensioni esterne » Toshiba Chromebook CB30-B-103
HP Stream 11-d023tu: Intel Celeron N2840, 11.60", 1.3 kg
Recensioni esterne » HP Stream 11-d023tu
HP Stream 11 X360: Intel Celeron N2840, 11.60", 1.6 kg
Recensioni esterne » HP Stream 11 X360
Dell Inspiron 15-3551: Intel Pentium N3540, 15.60", 2.1 kg
Recensioni esterne » Dell Inspiron 15-3551
Acer Iconia Tab W1-810: Intel Atom Z3735G, 7.90", 0.4 kg
Recensioni esterne » Acer Iconia Tab W1-810
Toshiba Satellite Radius 11 CL10W-B-100: Intel Celeron N2840, 11.60", 1.1 kg
Recensioni esterne » Toshiba Satellite Radius 11 CL10W-B-100
Acer Aspire ES1-111-C138: Intel Celeron N2840, 11.60", 1.1 kg
Recensioni esterne » Acer Aspire ES1-111-C138
HP Stream 7 5700ng: Intel Atom Z3735G, 7.00", 0.4 kg
Recensioni esterne » HP Stream 7 5700ng
Toshiba Encore 2 WT10-A-106: Intel Atom Z3735F, 10.10", 0.6 kg
Recensioni esterne » Toshiba Encore 2 WT10-A-106
Prestigio MultiPad Visconte Quad: Intel Atom Z3735G, 8.00", 0.4 kg
Recensioni esterne » Prestigio MultiPad Visconte Quad
Lenovo Miix 3 10: Intel Atom Z3735F, 10.10", 0.6 kg
Recensioni esterne » Lenovo Miix 3 10
Acer Aspire Switch 11 SW5-111-1991: Intel Atom Z3745, 11.60", 1.6 kg
Recensioni esterne » Acer Aspire Switch 11 SW5-111-1991
Lenovo Yoga 2-1051F: Intel Atom Z3745, 10.10", 0.9 kg
Recensioni esterne » Lenovo Yoga 2-1051F
Acer Aspire ES1-111-C56A: Intel Celeron N2840, 11.60", 1.3 kg
Recensioni esterne » Acer Aspire ES1-111-C56A
HP Stream 13-c001ng: Intel Celeron N2840, 13.30", 1.6 kg
Recensioni esterne » HP Stream 13-c001ng
Asus X200MA-CT339H: Intel Pentium N3530, 11.60", 1.2 kg
Recensioni esterne » Asus X200MA-CT339H
Dell Venue 8 Pro 3845: Intel Atom Z3735G, 8.00", 0.4 kg
Recensioni esterne » Dell Venue 8 Pro 3845
Acer Iconia Tab 8: Intel Atom Z3745, 8.00", 0.4 kg
Recensioni esterne » Acer Iconia Tab 8
Asus Transformer Pad TF103C-1A008A: Intel Atom Z3745, 10.10", 1.1 kg
Recensioni esterne » Asus Transformer Pad TF103C-1A008A
Toshiba Chromebook CB30-B-104: Intel Celeron N2840, 13.30", 1.4 kg
Recensioni esterne » Toshiba Chromebook CB30-B-104
Medion Lifetab P8912: Intel Atom Z3735F, 8.90", 0.5 kg
Recensioni esterne » Medion Lifetab P8912
Asus X200MA-KX130D: Intel Celeron N2815, 11.60", 1.2 kg
Recensioni esterne » Asus X200MA-KX130D
Lenovo IdeaPad G50-30: Intel Celeron N2830, 15.60", 2.5 kg
Recensioni esterne » Lenovo IdeaPad G50-30
Acer Iconia One 8 B1-810: Intel Atom Z3735G, 8.00", 0.3 kg
Recensioni esterne » Acer Iconia One 8 B1-810
Asus Transformer Book T90 Chi: Intel Atom Z3775, 8.90", 0.8 kg
Recensioni esterne » Asus Transformer Book T90 Chi
HP Stream 8 5900ng: Intel Atom Z3735G, 8.00", 0.4 kg
Recensioni esterne » HP Stream 8 5900ng
Toshiba Satellite Radius 11 L10W-B-101: Intel Celeron N2840, 11.60", 1.3 kg
Recensioni esterne » Toshiba Satellite Radius 11 L10W-B-101
Archos 80 Cesium: Intel Atom Z3735G, 8.00", 0.4 kg
Recensioni esterne » Archos 80 Cesium
Toshiba Satellite Radius 11 L10-B-101 : Intel Celeron N2840, 11.60", 1.3 kg
Recensioni esterne » Toshiba Satellite Radius 11 L10-B-101
Toshiba Encore mini WT7-C-100: Intel Atom Z3735G, 7.00", 0.4 kg
Recensioni esterne » Toshiba Encore mini WT7-C-100
HP Pro Tablet 610 G1: Intel Atom Z3795, 10.10", 0.7 kg
Recensioni esterne » HP Pro Tablet 610 G1
Medion Lifetab S10345-MD99042: Intel Atom Z3735F, 10.10", 0.6 kg
Recensioni esterne » Medion Lifetab S10345-MD99042
Medion Lifetab S10346-MD98992: Intel Atom Z3735F, 10.10", 0.6 kg
Recensioni esterne » Medion Lifetab S10346-MD98992
Lenovo Tab S8-50LC: Intel Atom Z3745, 8.00", 0.3 kg
Recensioni esterne » Lenovo Tab S8-50LC
Acer Travelmate B115-MP-C2TQ: Intel Celeron N2930, 11.60", 1.4 kg
Recensioni esterne » Acer Travelmate B115-MP-C2TQ
Trekstor SurfTab Xintron i 7.0: Intel Atom Z3735G, 7.00", 0.3 kg
Recensioni esterne » Trekstor SurfTab Xintron i 7.0
Acer Iconia One 7 B1-750: Intel Atom Z3735G, 7.00", 0.3 kg
Recensioni esterne » Acer Iconia One 7 B1-750
Acer Aspire Switch 11 SW5-111-187P: Intel Atom Z3745, 11.60", 1.5 kg
Recensioni esterne » Acer Aspire Switch 11 SW5-111-187P
Asus EeeBook F205TA-FD018BS: Intel Atom Z3735F, 11.60", 1 kg
Recensioni esterne » Asus EeeBook F205TA-FD018BS
HP Pavilion 11-n071eg x360: Intel Celeron N2820, 11.60", 1.4 kg
Recensioni esterne » HP Pavilion 11-n071eg x360
Asus Chromebook C200MA-KX002: Intel Celeron N2830, 11.60", 1.2 kg
Recensioni esterne » Asus Chromebook C200MA-KX002
Acer Aspire E3-112-C2KP: Intel Celeron N2840, 11.60", 1.3 kg
Recensioni esterne » Acer Aspire E3-112-C2KP
HP 250 G3: Intel Celeron N2830, 15.60", 2.1 kg
Recensioni esterne » HP 250 G3
Acer Extensa 2509-C052: Intel Celeron N2930, 15.60", 2.3 kg
Recensioni esterne » Acer Extensa 2509-C052
Toshiba Satellite CL10-B-100: Intel Celeron N2840, 11.60", 1.1 kg
Recensioni esterne » Toshiba Satellite CL10-B-100
Toshiba Satellite Radius 11 L15W-B1302: Intel Celeron N2840, 11.60", 1.3 kg
Recensioni esterne » Toshiba Satellite Radius 11 L15W-B1302
HP Stream 11-d020nr: Intel Celeron N2840, 11.60", 1.2 kg
Recensioni esterne » HP Stream 11-d020nr
HP Stream 13-c020nr: Intel Celeron N2840, 13.30", 1.5 kg
Recensioni esterne » HP Stream 13-c020nr
Asus C300MA-DB01: Intel Celeron N2830, 13.30", 1.4 kg
Recensioni esterne » Asus C300MA-DB01
Lenovo S20-30: Intel Celeron N2830, 11.60", 1.3 kg
Recensioni esterne » Lenovo S20-30
Asus C200MA-KX003: Intel Celeron N2830, 11.60", 1.2 kg
Recensioni esterne » Asus C200MA-KX003
Asus F200MA-CT067H: Intel Celeron N2815, 11.60", 1.2 kg
Recensioni esterne » Asus F200MA-CT067H
HP Pavilion 11-n070eg x360: Intel Celeron N2820, 11.60", 1.5 kg
Recensioni esterne » HP Pavilion 11-n070eg x360
Acer Extensa 2509-P3ZG: Intel Pentium N3530, 15.60", 2.5 kg
Recensioni esterne » Acer Extensa 2509-P3ZG
Prestigio Multipad Visconte 3 3G: Intel Atom Z3735F, 10.10", 0.7 kg
Recensioni esterne » Prestigio Multipad Visconte 3 3G
Asus EeeBook X205TA-FD005BS: Intel Atom Z3735F, 11.60", 1 kg
Recensioni esterne » Asus EeeBook X205TA-FD005BS
Lenovo Yoga Tablet 2 8: Intel Atom Z3745, 8.00", 0.4 kg
Recensioni esterne » Lenovo Yoga Tablet 2 8 inch
Acer Chromebook CB3-111-C61U: Intel Celeron N2830, 11.60", 1.3 kg
Recensioni esterne » Acer Chromebook CB3-111-C61U
Toshiba Satellite Pro NB10-A-10P: Intel Pentium N3510, 11.60", 1.3 kg
Recensioni esterne » Toshiba Satellite Pro NB10-A-10P
Acer Aspire E3-111-C37U: Intel Celeron N2840, 11.60", 1.3 kg
Recensioni esterne » Acer Aspire E3-111-C37U
Acer CB3-111: Intel Celeron N2840, 11.60", 1.3 kg
Recensioni esterne » Acer CB3-111
Toshiba Satellite Radius 11 L15W-B1310: Intel Celeron N2840, 11.60", 1.3 kg
Recensioni esterne » Toshiba Satellite Radius 11 L15W-B1310
Lenovo Yoga 2 8-59426324: Intel Atom Z3745, 8.00", 0.4 kg
Recensioni esterne » Lenovo Yoga 2 8-59426324
Lenovo G40-80FY005BUS: Intel Celeron N2830, 14.00", 2.1 kg
Recensioni esterne » Lenovo G40-80FY005BUS
HP Stream 11-d001dx: Intel Celeron N2840, 11.60", 1.2 kg
Recensioni esterne » HP Stream 11-d001dx
Dell Inspiron 15-3531: Intel Celeron N2830, 15.60", 2.1 kg
Recensioni esterne » Dell Inspiron 15-3531
Asus Transformer Book T200TA-CP003H: Intel Atom Z3775, 11.60", 1.6 kg
Recensioni esterne » Asus Transformer Book T200TA-CP003H
Acer Aspire Switch 10 SW5-012-13DP: Intel Atom Z3735F, 10.10", 1.1 kg
Recensioni esterne » Acer Aspire Switch 10 SW5-012-13DP
Lenovo Yoga Tablet 2 Pro: Intel Atom Z3745, 13.30", 1 kg
Recensioni esterne » Lenovo Yoga Tablet 2 Pro
Acer Aspire E5-511: Intel Pentium N3530, 15.60", 2.5 kg
Recensioni esterne » Acer Aspire E5-511
Lenovo Yoga Tablet 2 1050F: Intel Atom Z3745, 10.10", 0.6 kg
Recensioni esterne » Lenovo Yoga Tablet 2 1050F
Asus Transformer Book T200TA-C1-BL: Intel Atom Z3795, 11.60", 0.2 kg
Recensioni esterne » Asus Transformer Book T200TA-C1-BL
Acer Iconia W4-821: Intel Atom Z3740, 8.10", 0.4 kg
Recensioni esterne » Acer Iconia W4-821
HP Pavilion 11-n016tu x360: Intel Pentium N3520, 11.60", 1.4 kg
Recensioni esterne » HP Pavilion 11-n016tu x360
Toshiba CB35-B3340: Intel Celeron N2840, 13.30", 1.3 kg
Recensioni esterne » Toshiba CB35-B3340
Samsung Chromebook XE500C12-K01US: Intel Celeron N2840, 11.60", 1.2 kg
Recensioni esterne » Samsung Chromebook XE500C12-K01US
Acer Aspire Switch 10 SW5-012-17XE: Intel Atom Z3735F, 10.10", 1.1 kg
Recensioni esterne » Acer Aspire Switch 10 SW5-012-17XE
Acer Iconia One 8: Intel Atom Z3735G, 8.00", 0.3 kg
Recensioni esterne » Acer Iconia One 8
Acer Aspire E3-111-C1BW: Intel Celeron N2930, 11.60", 1.3 kg
Recensioni esterne » Acer Aspire E3-111-C1BW
Toshiba Encore 2 WT8-B264: Intel Atom Z3735F, 8.00", 0.4 kg
Recensioni esterne » Toshiba Encore 2 WT8-B264
Medion Akoya P2214T MD 99430: Intel Celeron N2940, 11.60", 1.6 kg
Recensioni esterne » Medion Akoya P2214T MD 99430
Toshiba WT8-B-102: Intel Atom Z3735G, 8.00", 0.4 kg
Recensioni esterne » Toshiba WT8-B-102
Asus X553MA-XX044H: Intel Celeron N2830, 15.60", 2.2 kg
Recensioni esterne » Asus X553MA-XX044H
Acer Aspire V3-111P-P6VM: Intel Pentium N3530, 11.60", 1.4 kg
Recensioni esterne » Acer Aspire V3-111P-P6VM
Medion Akoya S6213T MD98716: Intel Pentium N3530, 15.60", 3.3 kg
Recensioni esterne » Medion Akoya S6213T MD98716
Lenovo Tab S8: Intel Atom Z3745, 8.00", 0.3 kg
Recensioni esterne » Lenovo Tab S8
Acer Iconia Tab 8 W: Intel Atom Z3735G, 8.00", 0.4 kg
Recensioni esterne » Acer Iconia Tab 8 W
Asus EeeBook X205: Intel Atom Z3735D, 11.60", 1 kg
Recensioni esterne » Asus EeeBook X205
Toshiba Satellite Click 2 L35W-B3204: Intel Pentium N3530, 13.30", 2.2 kg
Recensioni esterne » Toshiba Satellite Click 2 L35W-B3204
Toshiba Encore Mini WT7-C16: Intel Atom Z3735G, 7.00", 0.4 kg
Recensioni esterne » Toshiba Encore Mini WT7-C16
Acer Iconia Tab 8 A1-840FHD: Intel Atom Z3745, 8.00", 0.4 kg
Recensioni esterne » Acer Iconia Tab 8 A1-840FHD
Toshiba Satellite C50-B-14D: Intel Celeron N2830, 15.60", 2.2 kg
Recensioni esterne » Toshiba Satellite C50-B-14D
Toshiba Satellite L50-B-1M6: Intel Pentium N3530, 15.60", 2.2 kg
Recensioni esterne » Toshiba Satellite L50-B-1M6
Asus Memo Pad 8 ME181CX: Intel Atom Z3745, 8.00", 0.3 kg
Recensioni esterne » Asus Memo Pad 8 ME181CX
Acer Aspire V3-111P-27AC: Intel Celeron N2830, 11.60", 1.3 kg
Recensioni esterne » Acer Aspire V3-111P-27AC
Lenovo IdeaPad Yoga 2 11: Intel Pentium N3520, 11.60", 1.3 kg
Recensioni esterne » Lenovo IdeaPad Yoga 2 11
Asus C300: Intel Celeron N2830, 13.30", 1.4 kg
Recensioni esterne » Asus C300
Lenovo ThinkPad Yoga 11e: Intel Celeron N2930, 11.60", 1.7 kg
Recensioni esterne » Lenovo ThinkPad Yoga 11e
Toshiba Satellite L30W-B-10D: Intel Pentium N3530, 13.30", 2.1 kg
Recensioni esterne » Toshiba Satellite L30W-B-10D
Toshiba Satellite L30W-BST2N23: Intel Pentium N3530, 13.30", 2.2 kg
Recensioni esterne » Toshiba Satellite L30W-BST2N23
Lenovo N20p-59426642 Chromebook: Intel Celeron N2830, 11.60", 1.3 kg
Recensioni esterne » Lenovo N20p-59426642 Chromebook
Asus Transformer Book T100TA-DK025H: Intel Atom Z3775, 10.10", 1.1 kg
Recensioni esterne » Asus Transformer Book T100TA-DK025H
Toshiba Satellite NB10t-A-10F: Intel Celeron N2820, 11.60", 1.3 kg
Recensioni esterne » Toshiba Satellite NB10t-A-10F
Lenovo B50-30: Intel Celeron N2815, 15.60", 2.2 kg
Recensioni esterne » Lenovo B50-30
Asus X200MA-KX366B: Intel Celeron N2830, 11.60", 1.2 kg
Recensioni esterne » Asus X200MA-KX366B
Asus Transformer Book T200TA: Intel Atom Z3775, 11.60", 1.6 kg
Recensioni esterne » Asus Transformer Book T200TA
Asus Transformer Book T100TAM: Intel Atom Z3775, 10.10", 0.6 kg
Recensioni esterne » Asus Transformer Book T100TAM
Packard Bell Easynote TF71BM-C8R1: Intel Celeron N2830, 15.60", 2.4 kg
Recensioni esterne » Packard Bell Easynote TF71BM
Lenovo G50-30: Intel Celeron N2830, 15.60", 2.1 kg
Recensioni esterne » Lenovo G50
Asus Transformer Book T100TA-DK047H: Intel Atom Z3745, 10.10", 1.1 kg
Recensioni esterne » Asus Transformer Book T100TA-DK047H
Toshiba Satellite Click 2: Intel Pentium N3530, 13.30", 2.1 kg
Recensioni esterne » Toshiba Satellite Click 2
Asus Transformer Pad TF303CL-1D050A: Intel Atom Z3745, 10.10", 0.6 kg
Recensioni esterne » Asus Transformer Pad TF303CL-1D050A
Medion Akoya E1232T-MD99410: Intel Celeron N2807, 10.10", 1.1 kg
Recensioni esterne » Medion Akoya E1232T-MD99410
Toshiba Encore 2 10.1 inch: Intel Atom Z3735G, 10.10", 0.6 kg
Recensioni esterne » Toshiba Encore 2 10.1 inch
Dell Inspiron 11-3147: Intel Pentium N3530, 11.60", 1.4 kg
Recensioni esterne » Dell Inspiron 11-3147
Acer Aspire Switch 10-SW5-011-17WL: Intel Atom Z3745, 10.10", 1.1 kg
Recensioni esterne » Acer Aspire Switch 10-SW5-011-17WL
Asus Memo Pad 8 ME181C: Intel Atom Z3745, 8.00", 0.3 kg
Recensioni esterne » Asus Memo Pad 8 ME181C
Acer Aspire V3-111P-P06A: Intel Pentium N3530, 11.60", 1.4 kg
Recensioni esterne » Acer Aspire V3-111P-43BC
Acer Aspire E3-111-C45G: Intel Celeron N2930, 11.60", 1.3 kg
Recensioni esterne » Acer Aspire E3-111-C45G
Acer Aspire E1-510: Intel Celeron N2920, 15.60", 2.4 kg
Recensioni esterne » Acer Aspire E1-510
Asus MeMo Pad 7 ME176CX: Intel Atom Z3745, 7.00", 0.3 kg
Recensioni esterne » Asus MeMo Pad 7 ME176CX
Acer Aspire Switch 10-SW5-011-18MX: Intel Atom Z3745, 10.10", 1.1 kg
Recensioni esterne » Acer Aspire Switch 10-SW5-011-18MX
Toshiba Satellite C55-A5140: Intel Celeron N2820, 15.60", 2.3 kg
Recensioni esterne » Toshiba Satellite C55-A5140
Acer Aspire Switch 10: Intel Atom Z3740, 10.10", 1.1 kg
Recensioni esterne » Acer Aspire Switch 10
Asus Transformer Book T100TA 64Gb Keyboard Dock: Intel Atom Z3740, 10.10", 1.1 kg
Recensioni esterne » Asus Transformer Book T100TA 64Gb Keyboard Dock
Asus C200MA-DS01: Intel Celeron N2830, 11.60", 1.2 kg
Recensioni esterne » Asus C200MA-DS01
Fujitsu Stylistic Q584: Intel Atom Z3770, 10.10", 0.7 kg
Recensioni esterne » Fujitsu Stylistic Q584
Asus Transformer Pad TF103C-1B072A: Intel Atom Z3745, 10.10", 0.6 kg
Recensioni esterne » Asus Transformer Pad TF103C
Medion Akoya E6240T-MD99290: Intel Celeron N2920, 15.60", 2.4 kg
Recensioni esterne » Medion Akoya E6240T-MD99290
Asus Memo Pad 7 ME176C: Intel Atom Z3745, 7.00", 0.3 kg
Recensioni esterne » Asus Memo Pad 7 ME176C
Schenker Element 3G: Intel Atom Z3740D, 10.10", 0.6 kg
Recensioni esterne » Schenker Element 3G
Toshiba Encore WT8-A-103: Intel Atom Z3740, 8.00", 0.5 kg
Recensioni esterne » Toshiba Encore WT8-A-103
Toshiba Satellite C50-A-1M0: Intel Pentium N3520, 15.60", 2.4 kg
Recensioni esterne » Toshiba Satellite C50-A-1M0
Medion Akoya S6214T-MD99380: Intel Pentium N3520, 15.60", 3.3 kg
Recensioni esterne » Medion Akoya S6214T-MD99380
HP Pavilion 11-n000ed: Intel Pentium N3520, 11.60", 1.4 kg
Recensioni esterne » HP Pavilion 11-n000ed
Lenovo Miix 2 10: Intel Atom Z3740D, 10.00", 1.1 kg
Recensioni esterne » Lenovo Miix 2 10
Lenovo ThinkPad 10: Intel Atom Z3795, 10.10", 0.6 kg
Recensioni esterne » Lenovo ThinkPad 10
Toshiba Satellite Pro NB10-A-109: Intel Celeron N2810, 11.60", 1.5 kg
Recensioni esterne » Toshiba Satellite Pro NB10-A-109
Asus Transformer Book T100TA-DK007H: Intel Atom Z3740, 10.10", 1 kg
Recensioni esterne » Asus Transformer Book T100TA-DK007H
Acer Aspire Switch 10 SW5-011-12VU: Intel Atom Z3745D, 10.10", 1.1 kg
Recensioni esterne » Acer Aspire Switch 10
Lenovo IdeaPad Flex 10: Intel Celeron N2806, 10.10", 1.2 kg
Recensioni esterne » Lenovo IdeaPad Flex 10
HP Pavilion 11t-n000 x360: Intel Pentium N3520, 11.60", 1.4 kg
Recensioni esterne » HP Pavilion 11t-n000 x360
Acer C720P-29552G03aii Chromebook: Intel Celeron 2955U, 11.60", 1.3 kg
Recensioni esterne » Acer C720P-29552G03aii Chromebook
Asus K200MA-DS01T: Intel Celeron N2815, 11.60", 1.4 kg
Recensioni esterne » Asus K200MA-DS01T
Sony Vaio Fit 11A SVF11N1S2E/B: Intel Pentium N3520, 11.60", 1.2 kg
Recensioni esterne » Sony Vaio Fit 11A SVF11N1S2E/B
Lenovo ThinkPad 8: Intel Atom Z3770, 8.30", 0.4 kg
Recensioni esterne » Lenovo ThinkPad 8
HP Pavilion 11-N000NF x360: Intel Pentium N3520, 11.60", 1.4 kg
Recensioni esterne » HP Pavilion 11-N000NF x360
Lenovo IdeaPad Yoga 2 11-9416656: Intel Pentium N3520, 11.60", 1.4 kg
Recensioni esterne » Lenovo IdeaPad Yoga 2 11-9416656
Acer Aspire E1-510P-2671: Intel Celeron N2920, 15.60", 2.3 kg
Recensioni esterne » Acer Aspire E1-510P-2671
Medion Akoya P2212T-MD99360: Intel Celeron N2920, 11.60", 0.9 kg
Recensioni esterne » Medion Akoya P2212T-MD99360
Toshiba Satellite NB10t-A-101: Intel Celeron N2810, 11.60", 1.5 kg
Recensioni esterne » Toshiba Satellite NB10t-A-101
Medion Akoya E7226T-MD99310: Intel Pentium N3520, 17.30", 3.2 kg
Recensioni esterne » Medion Akoya E7226T-MD99310
HP Pavilion x360: Intel Pentium N3520, 11.60", 1.4 kg
Recensioni esterne » HP Pavilion x360
Asus VivoTab Note 8: Intel Atom Z3740, 8.00", 0.4 kg
Recensioni esterne » Asus VivoTab Note 8
Sony Vaio Flip 11 SV-F11N1C5E2: unknown, 11.60", 1.2 kg
Recensioni esterne » Sony Vaio Flip 11 SV-F11N1C5E2
HP Omni 10 5600eg (F4W59EA): Intel Atom Z3770, 10.00", 0.7 kg
Recensioni esterne » HP Omni 10 5600eg (F4W59EA)
Medion Akoya P2211T MD98602: Intel Celeron N2910, 11.60", 1.7 kg
Recensioni esterne » Medion Akoya P2211T MD98602
HP ElitePad 1000 G2: Intel Atom Z3795, 10.10", 0.7 kg
Recensioni esterne » HP ElitePad 1000 G2
HP ProPad 600: , 10.10", 0.7 kg
Recensioni esterne » HP ProPad 600
Toshiba Satellite NB15t-A1304: Intel Celeron N2810, 11.60", 1.5 kg
Recensioni esterne » Toshiba Satellite NB15t-A1304
Lenovo ThinkPad Tablet 8: Intel Atom Z3770, 8.00", 0.4 kg
Recensioni esterne » Lenovo ThinkPad Tablet 8
Toshiba Satellite NB15T-A1302: Intel Celeron N2810, 11.60", 1.5 kg
Recensioni esterne » Toshiba Satellite NB15T-A1302
Sony Vaio Flip 11: Intel Pentium N3520, 11.60", 1.3 kg
Recensioni esterne » Sony Vaio Flip 11
Medion Akoya E6239T: Intel Pentium N3510, 15.40", 2.6 kg
Recensioni esterne » Medion E6239T
Toshiba Encore WT8-A-102: Intel Atom Z3740, 8.00", 0.5 kg
Recensioni esterne » Toshiba Encore WT8-A-102
Acer Aspire Z3-600-UR31: Intel Pentium J2850, 21.50", 6.6 kg
Recensioni esterne » Acer Aspire Z3-600-UR31
Packard Bell EasyNote ME69BMP: Intel Celeron N2805, 10.00", 1.1 kg
Recensioni esterne » Packard Bell EasyNote ME69BMP
Acer Iconia W4-820-2466: Intel Atom Z3740, 8.10", 0.4 kg
Recensioni esterne » Acer Iconia W4-820-2466
Lenovo Miix 2 8: Intel Atom Z3740, 8.00", 0.3 kg
Recensioni esterne » Lenovo Miix 2 8
Dell Venue 8 Pro: Intel Atom Z3740D, 8.00", 0.4 kg
Recensioni esterne » Dell Venue 8 Pro
Asus Transformer Book T100TA-C1-GR: Intel Atom Z3740, 10.10", 1.1 kg
Recensioni esterne » Asus Transformer Book T100TA-C1-GR
Toshiba Encore: Intel Atom Z3770, 8.00", 0.5 kg
Recensioni esterne » Toshiba Encore