Recensione del mini PC BMAX B5 Pro G7H8: Debutto dell'Intel Core i5-8260U
Come Chuwi, BMax è specializzata in computer portatili, monitor e mini PC economici che generalmente costano centinaia di dollari in meno rispetto alle SKU più semplici di produttori più grandi e conosciuti. Il loro segreto è l'utilizzo di CPU di vecchia generazione, che permettono di abbassare notevolmente il costo dei dispositivi
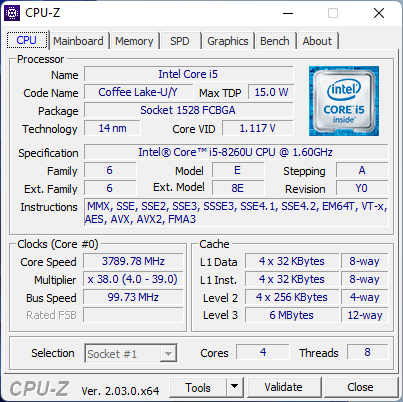
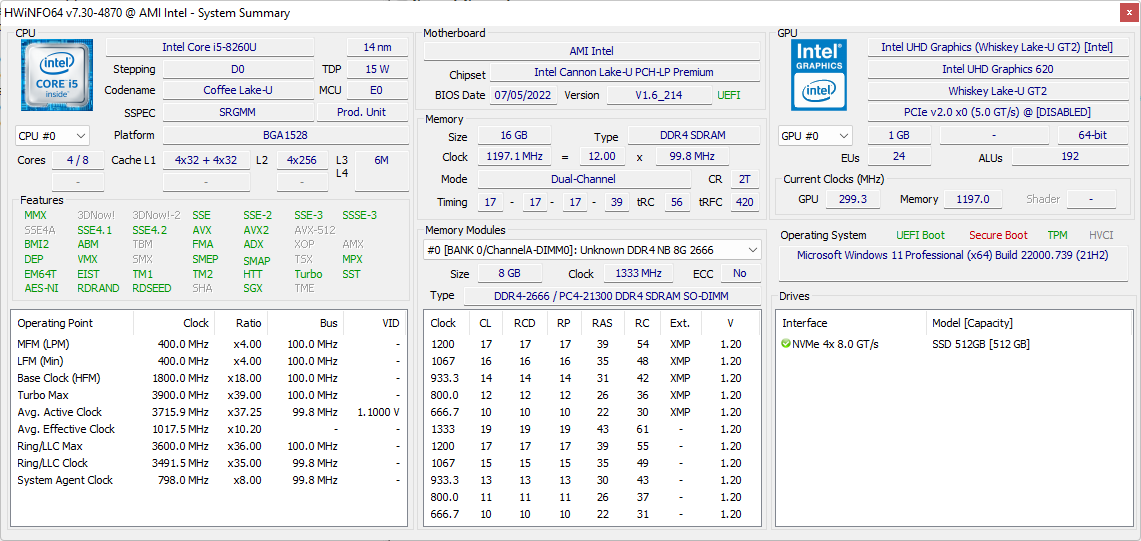
Il BMax B5 Pro è l'ultimo mini PC del produttore destinato agli utenti di HTPC con un budget limitato. Si distingue per l'utilizzo di una vecchia CPU Intel Core serie U di ottava generazione, mentre i mini PC più recenti utilizzano opzioni di dodicesima generazione. La nostra configurazione specifica è dotata della non comune CPU Coffee Lake Core i5-8260U con 16 GB di RAM, 512 GB di SSD NVMe e Windows 11 precaricato per soli 280 dollari al momento della stesura di questo articolo. Il B5 Pro compete direttamente con altri mini PC economici come il Beelink SEi8 o il GMK NucBox 2.
Altre recensioni di BMax:
Potenziali concorrenti a confronto
Punteggio | Data | Modello | Peso | Altezza | Dimensione | Risoluzione | Prezzo |
|---|---|---|---|---|---|---|---|
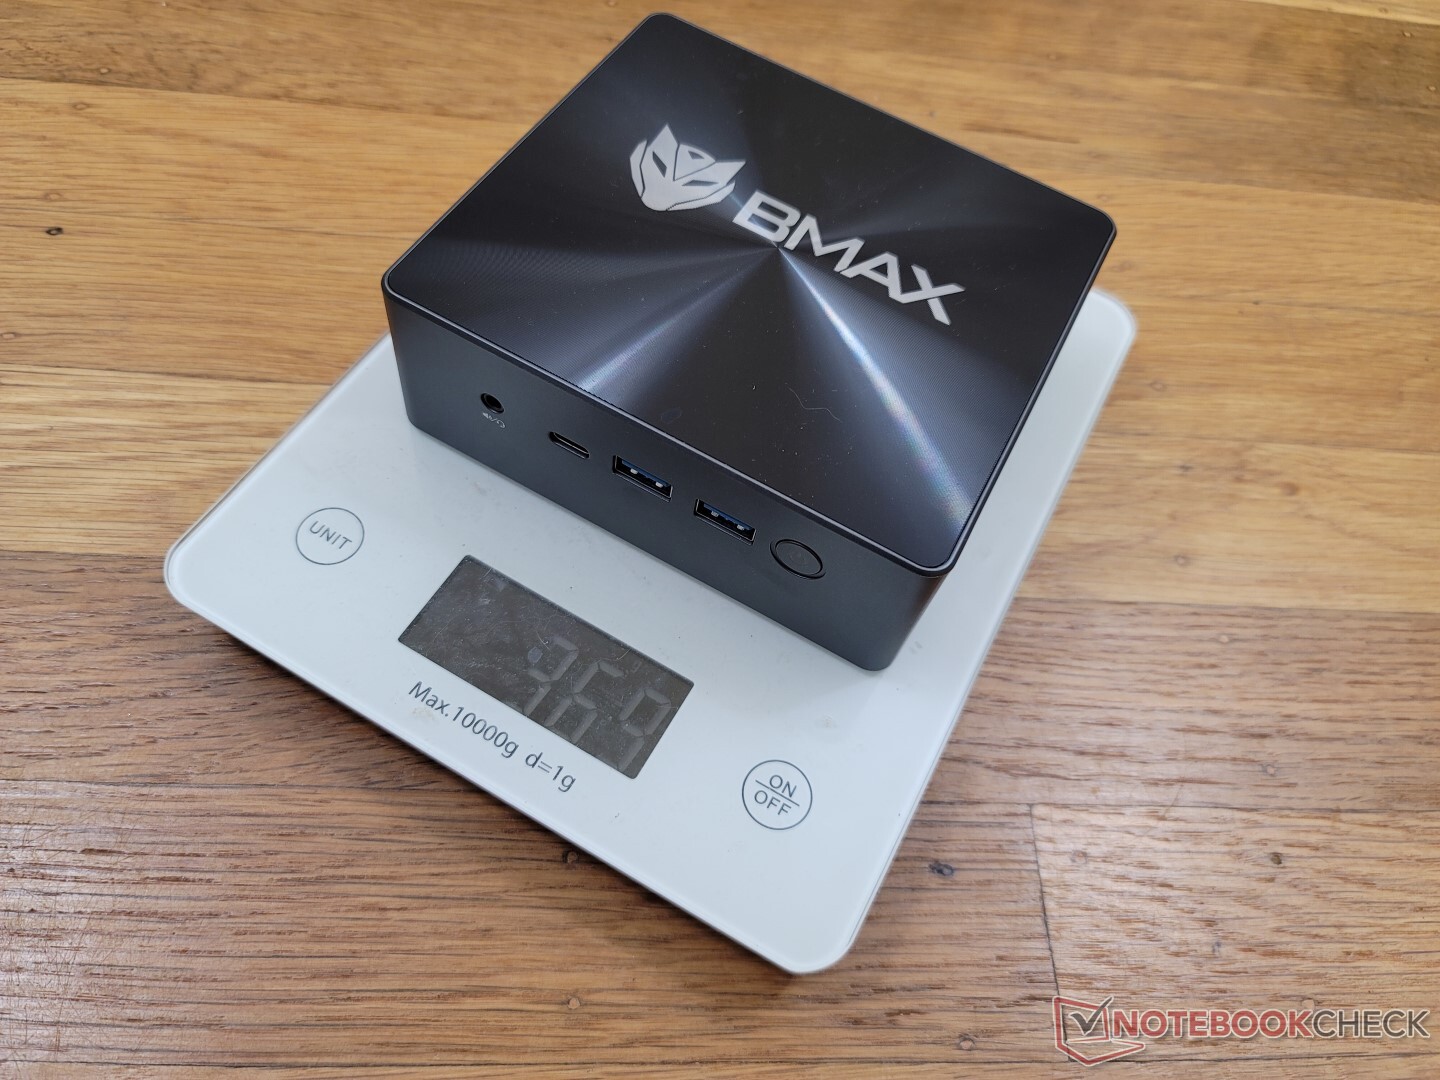
v (old) | 11/2022 | BMAX B5 Pro G7H8 i5-8260U, UHD Graphics 620 | 369 gr | 43.2 mm | x | ||
v (old) | 09/2022 | Beelink SEi11 Pro i5-11320H, Iris Xe G7 96EUs | 440 gr | 40 mm | x | ||
v (old) | 09/2022 | Beelink U59 N5105 Celeron N5105, UHD Graphics (Jasper Lake 24 EU) | 320 gr | 42 mm | x | ||
v (old) | 04/2022 | Beelink SEi8 i3-8109U, Iris Plus Graphics 655 | 346 gr | 41 mm | x | ||
v (old) | 10/2022 | Beelink SER Pro Ryzen 5 5600H R5 5600H, Vega 7 | 498 gr | 42 mm | x | ||
v (old) | 04/2021 | Intel NUC11TNKi5 i5-1135G7, Iris Xe G7 80EUs | 504 gr | 37 mm | x |
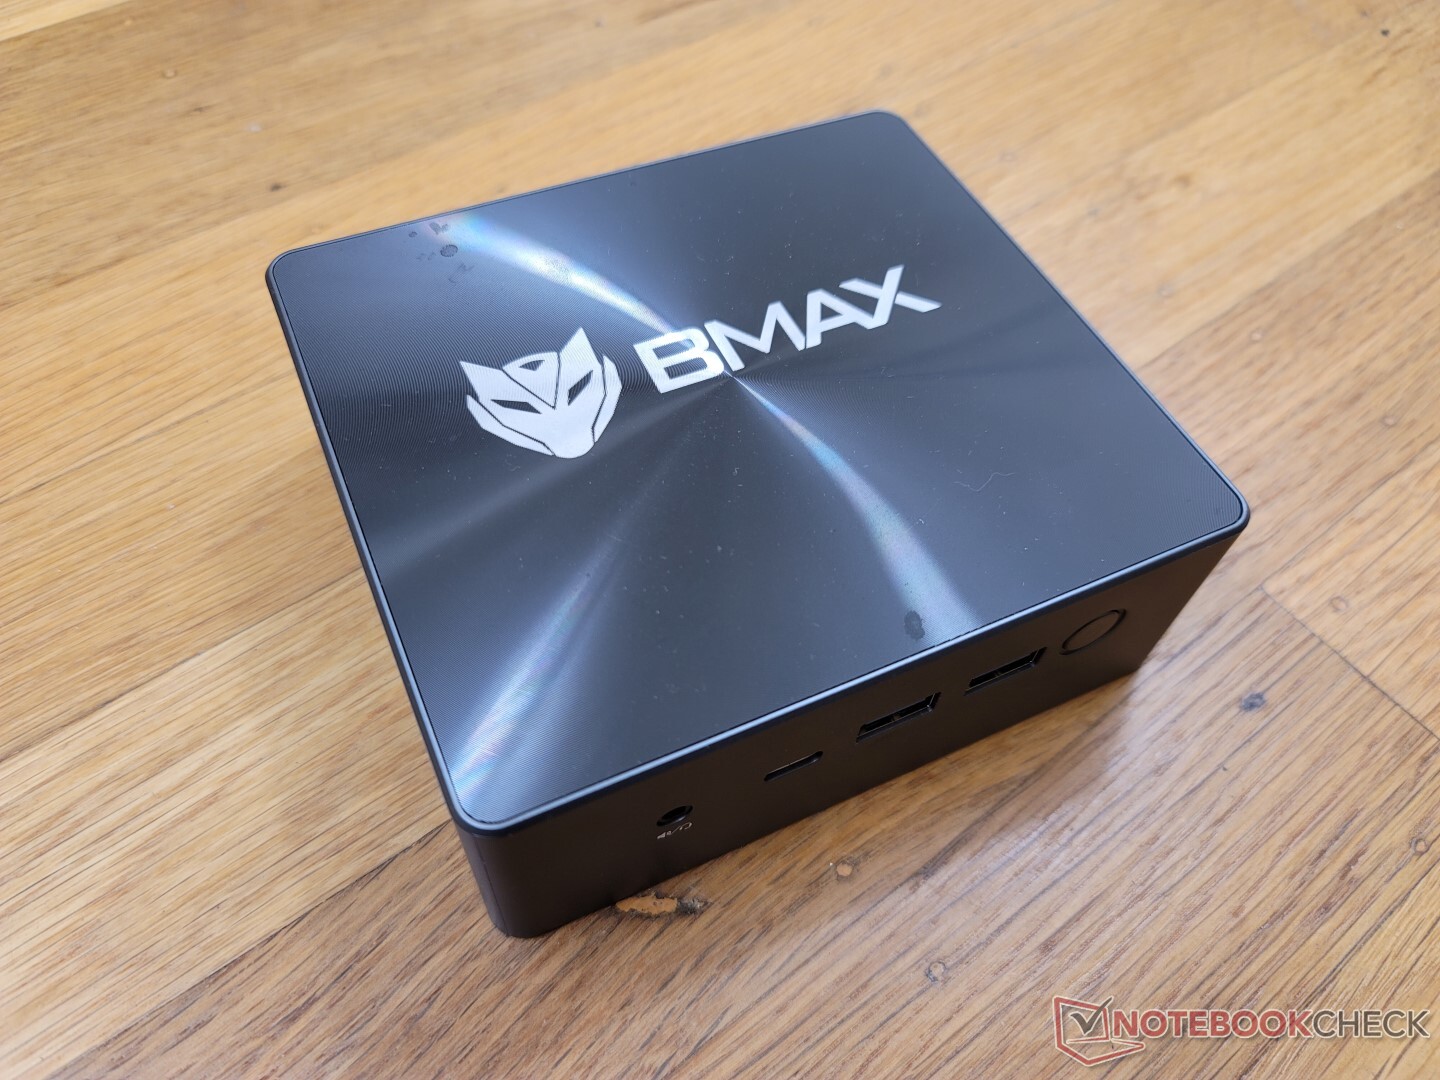
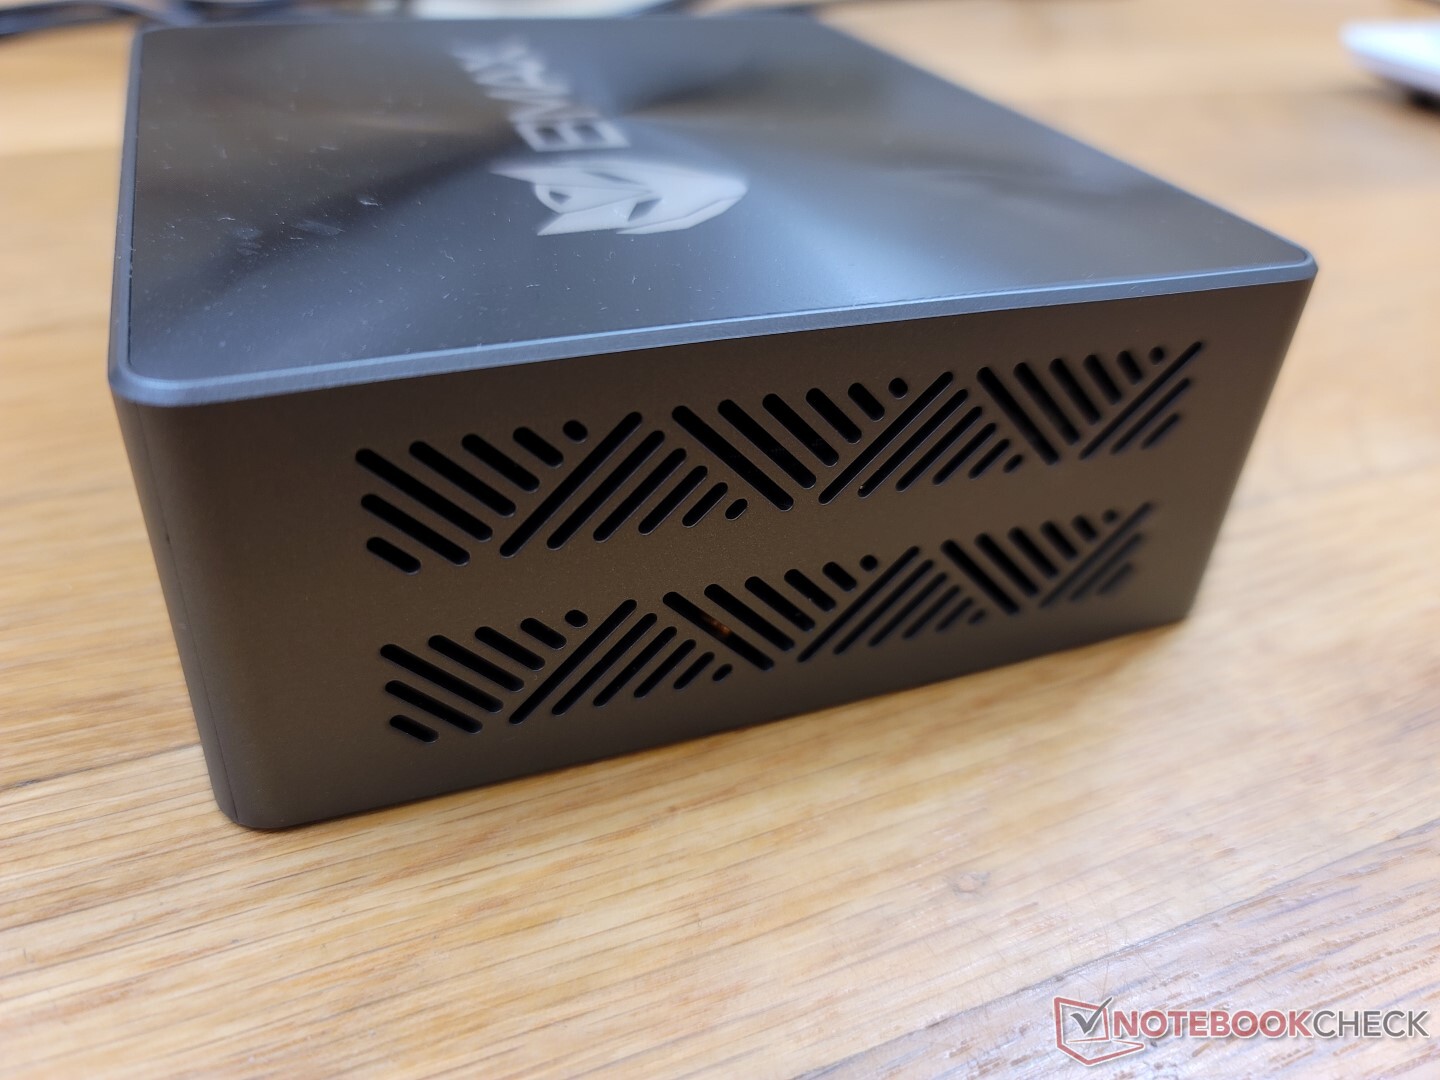
Caso - Niente di eccezionale
Il case è leggermente più spesso del Intel NUC11TNKi5 per essere quasi identico al Beelink SEi8. La rigidità è notevole sui bordi e sul fondo, poiché queste aree sono in metallo, mentre la parte superiore è in plastica più economica e più soggetta a deformazioni. Si tratta comunque di un design robusto senza difetti evidenti, anche se non è pesante come un NUC Intel.
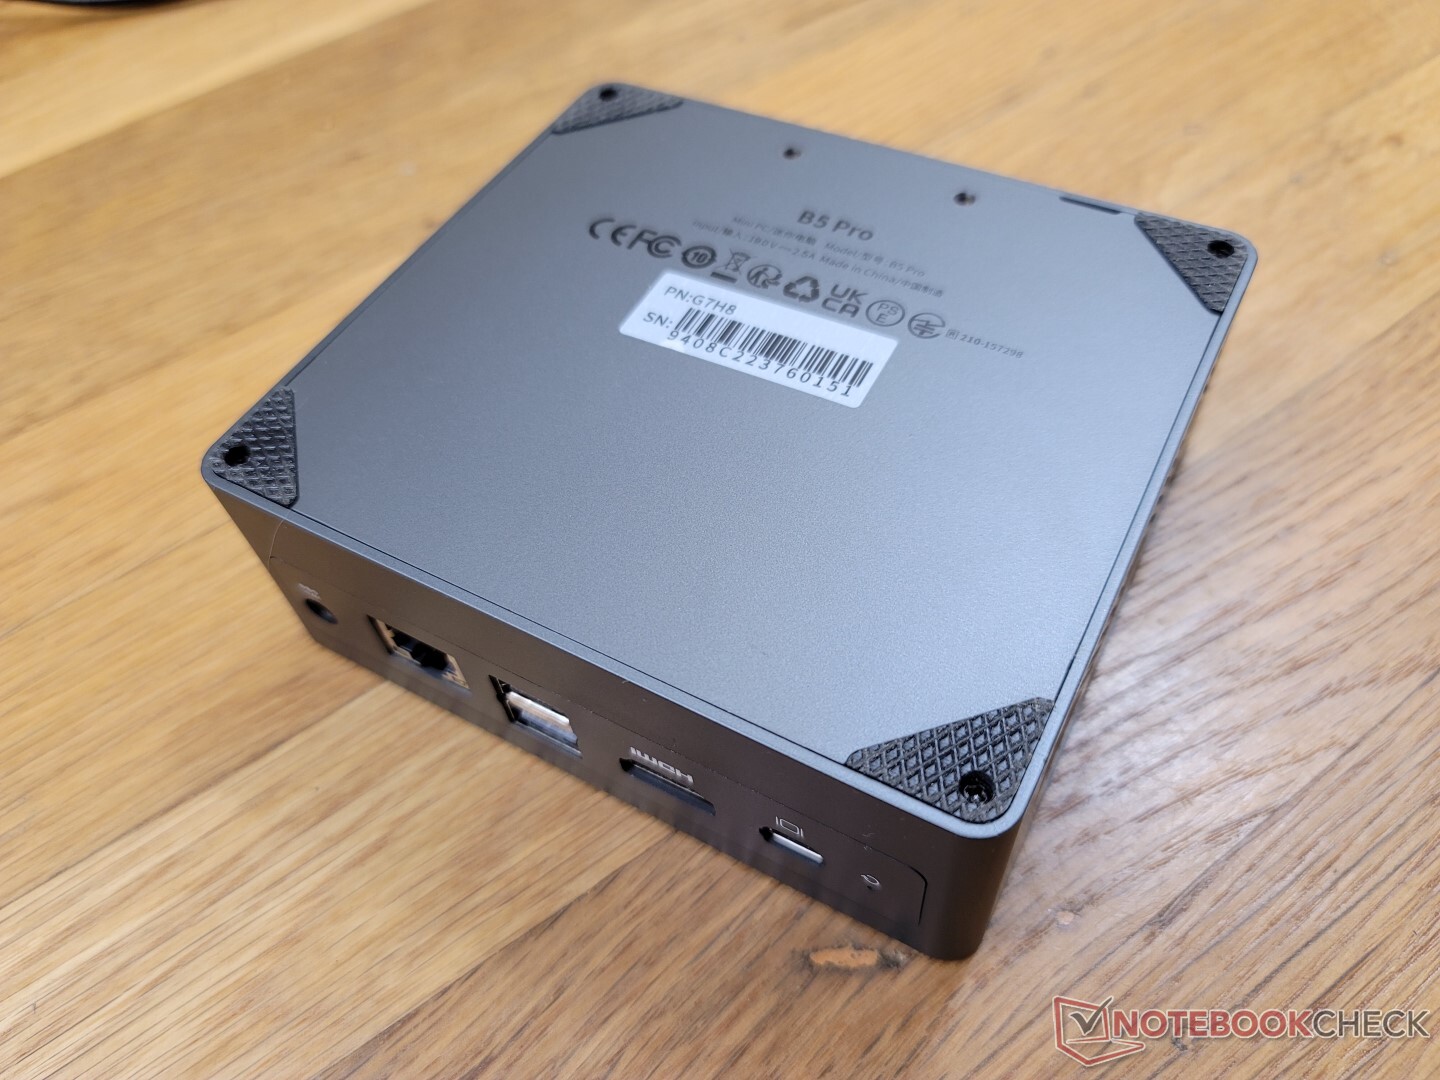
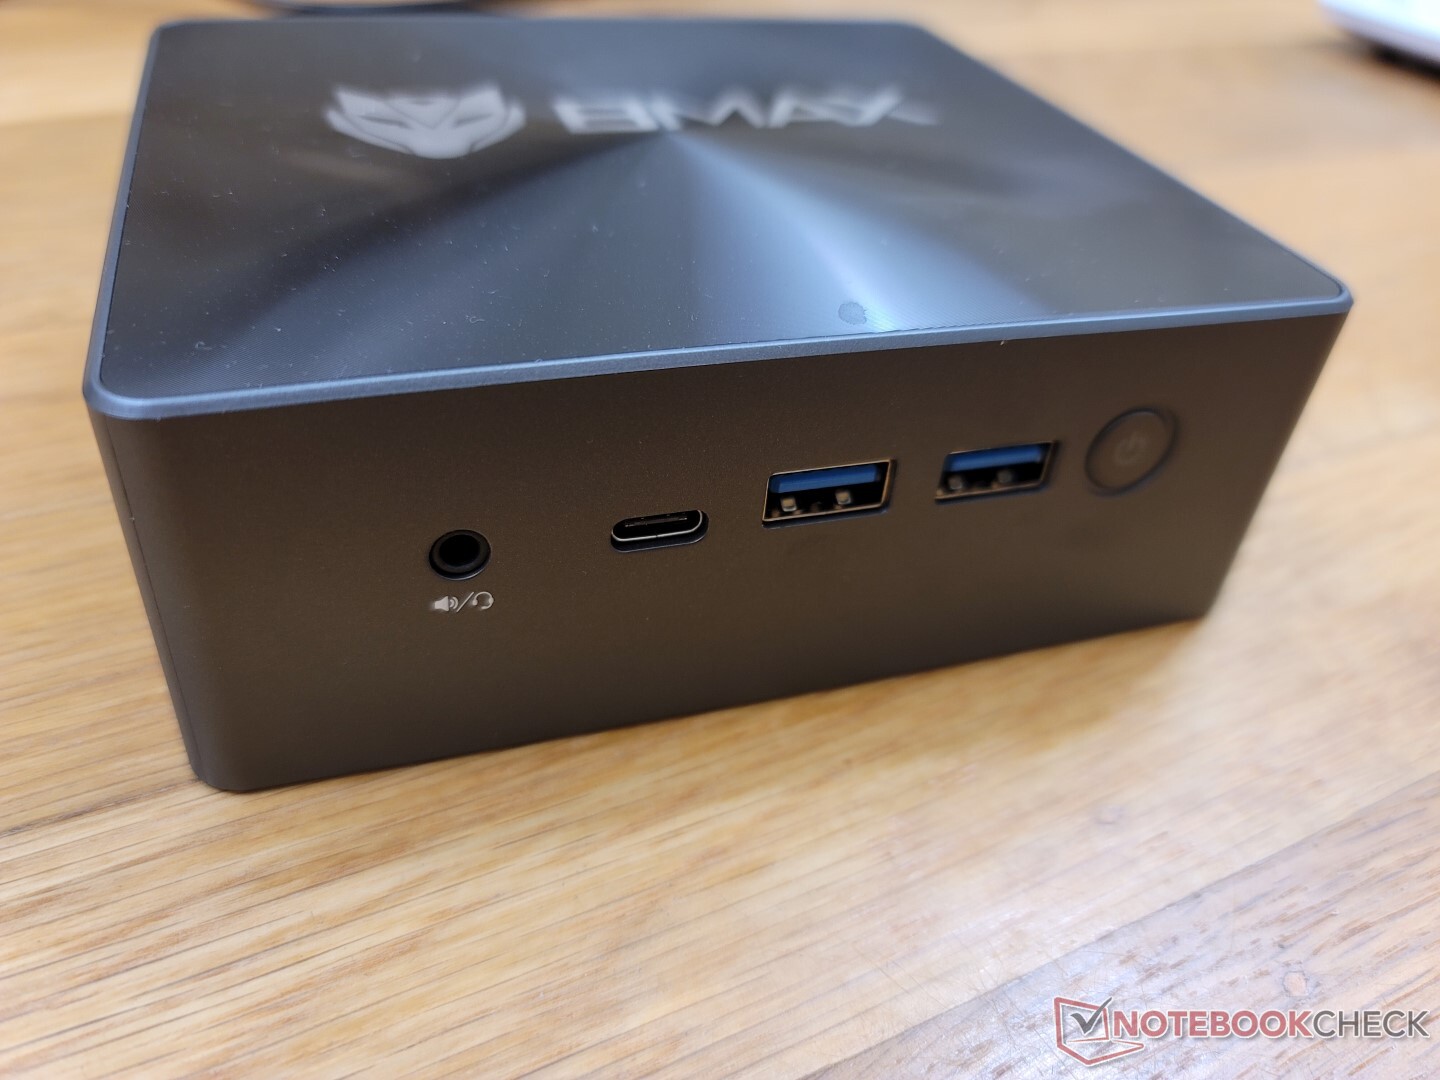
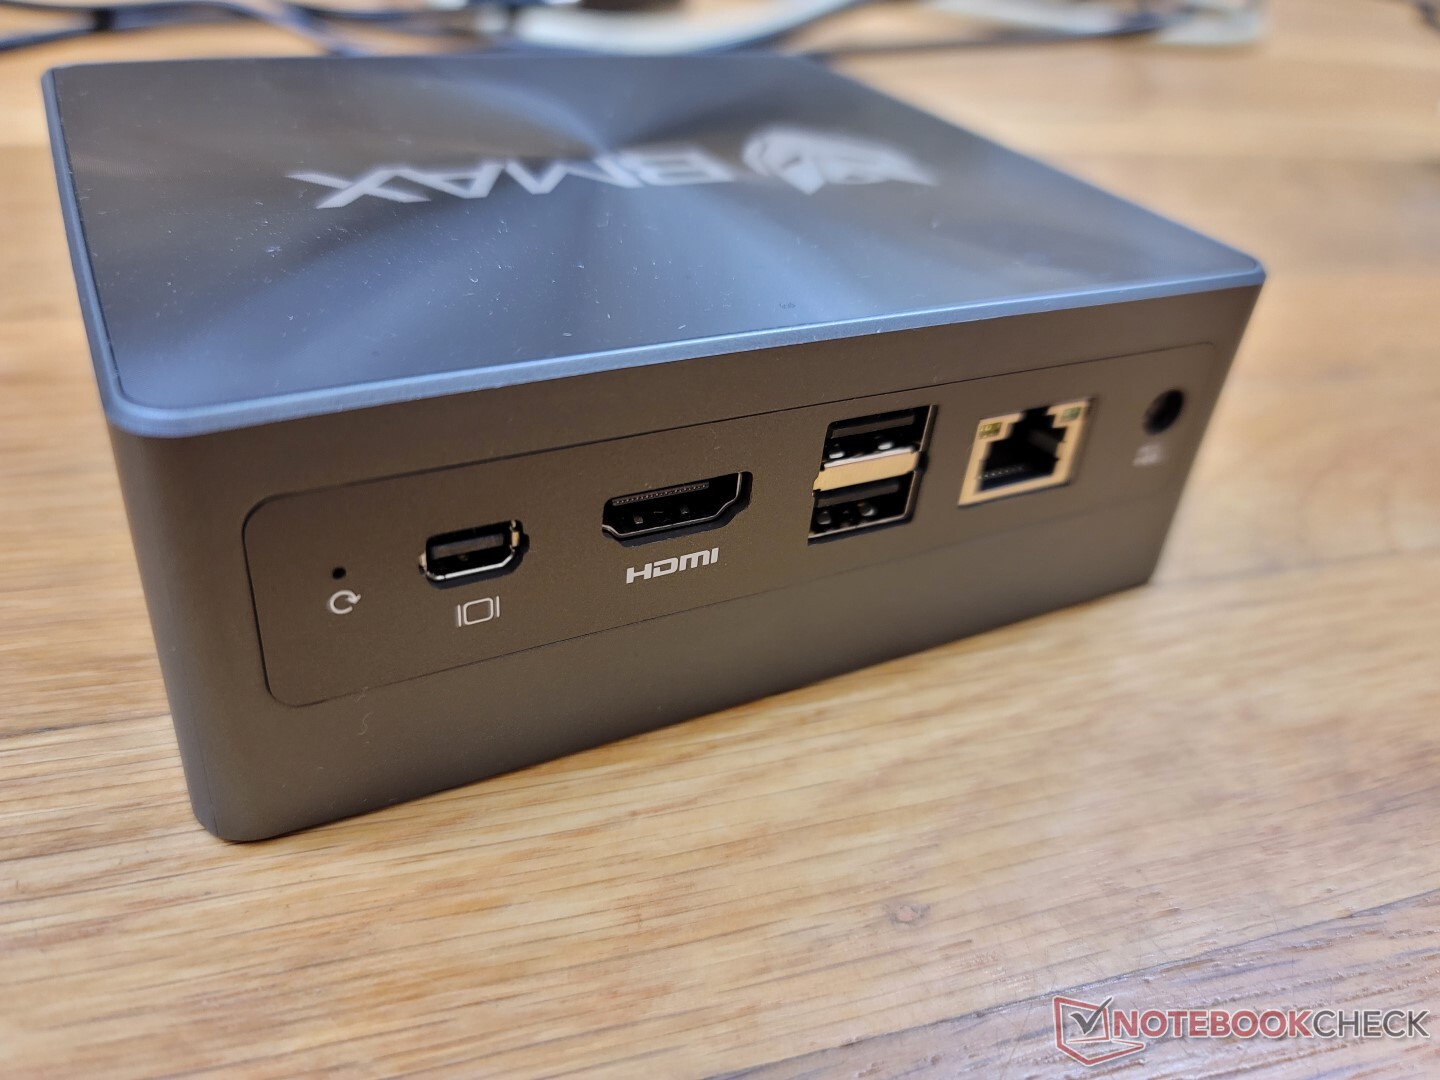
Connettività - Nessun supporto Thunderbolt
La porta più importante del B5 Pro è la mini DisplayPort, dato che la maggior parte dei mini PC di questa fascia di prezzo non dispone di una mini DisplayPort. i monitor 4K a 60 Hz non sono supportati dall'HDMI.
La porta USB-C frontale supporta monitor esterni, ma non supporta Power-in o Thunderbolt.
Comunicazione
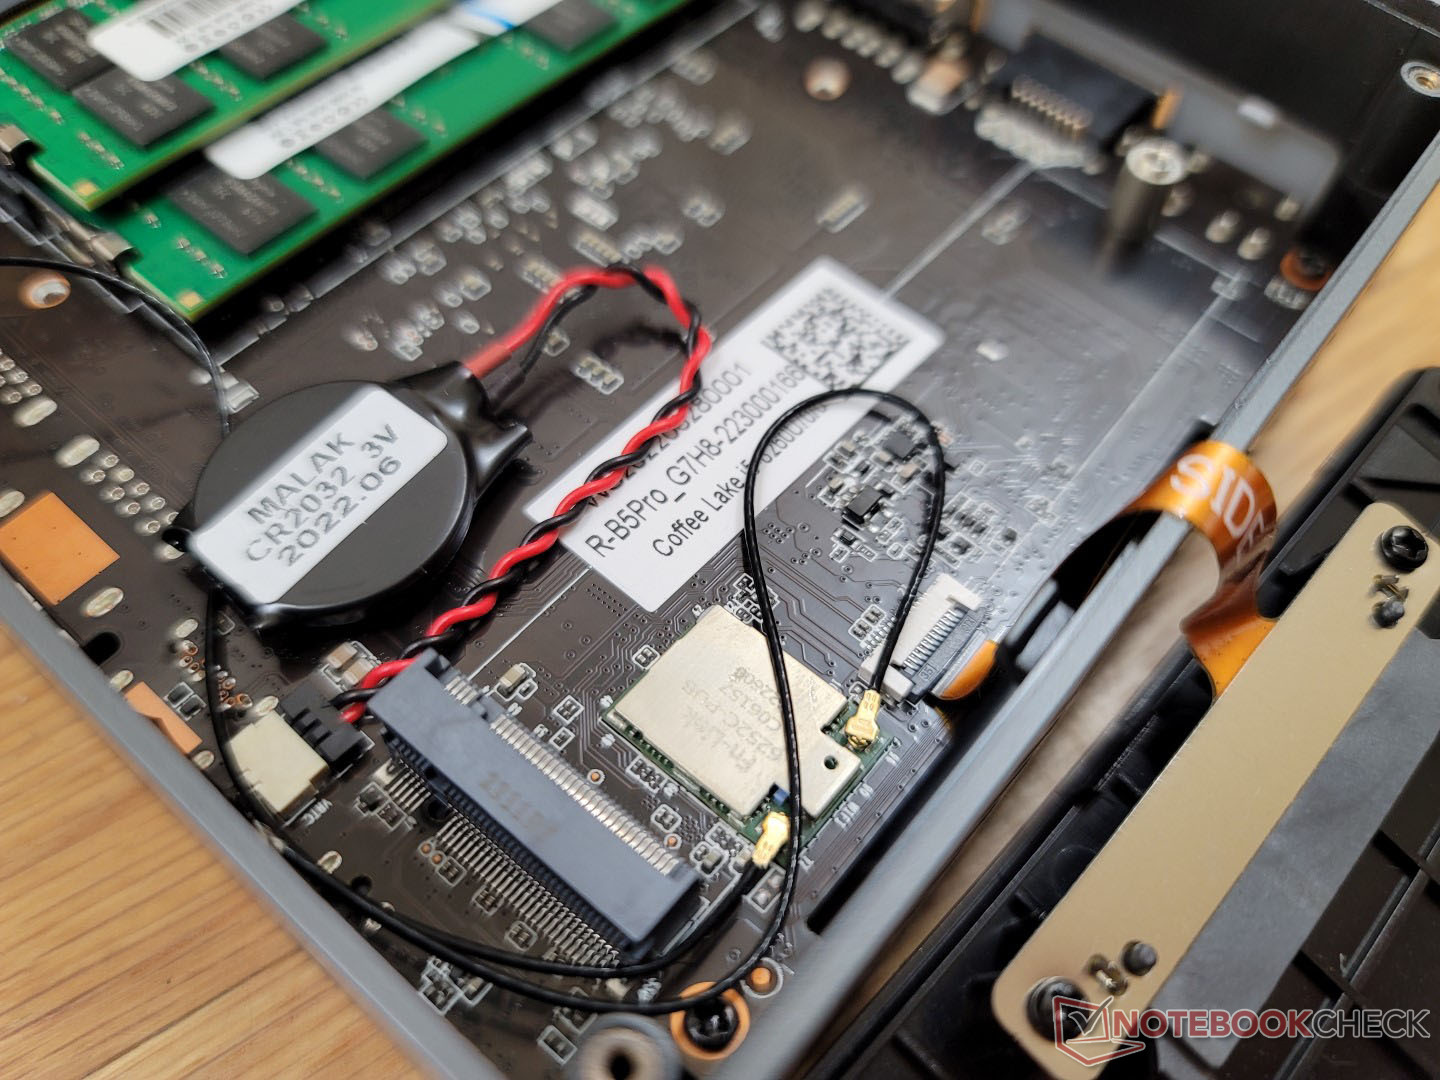
La connettività Wi-Fi 6 e Bluetooth 5.2 è affidata al RealTek RTL8852BE. Non è presente il supporto Wi-Fi 6E, probabilmente per risparmiare sui costi. La velocità di trasferimento è costante e senza problemi, anche se non è paragonabile a quella della più comune serie AX200/201 di Intel.
| Networking | |
| iperf3 transmit AX12 | |
| Intel NUC11TNKi5 | |
| Beelink SEi8 | |
| iperf3 receive AX12 | |
| Intel NUC11TNKi5 | |
| Beelink SEi8 | |
| iperf3 receive AXE11000 6GHz | |
| Beelink SER Pro Ryzen 5 5600H | |
| Beelink SEi11 Pro | |
| iperf3 receive AXE11000 | |
| BMAX B5 Pro G7H8 | |
| Beelink U59 N5105 | |
| iperf3 transmit AXE11000 6GHz | |
| Beelink SER Pro Ryzen 5 5600H | |
| Beelink SEi11 Pro | |
| iperf3 transmit AXE11000 | |
| BMAX B5 Pro G7H8 | |
| Beelink U59 N5105 | |
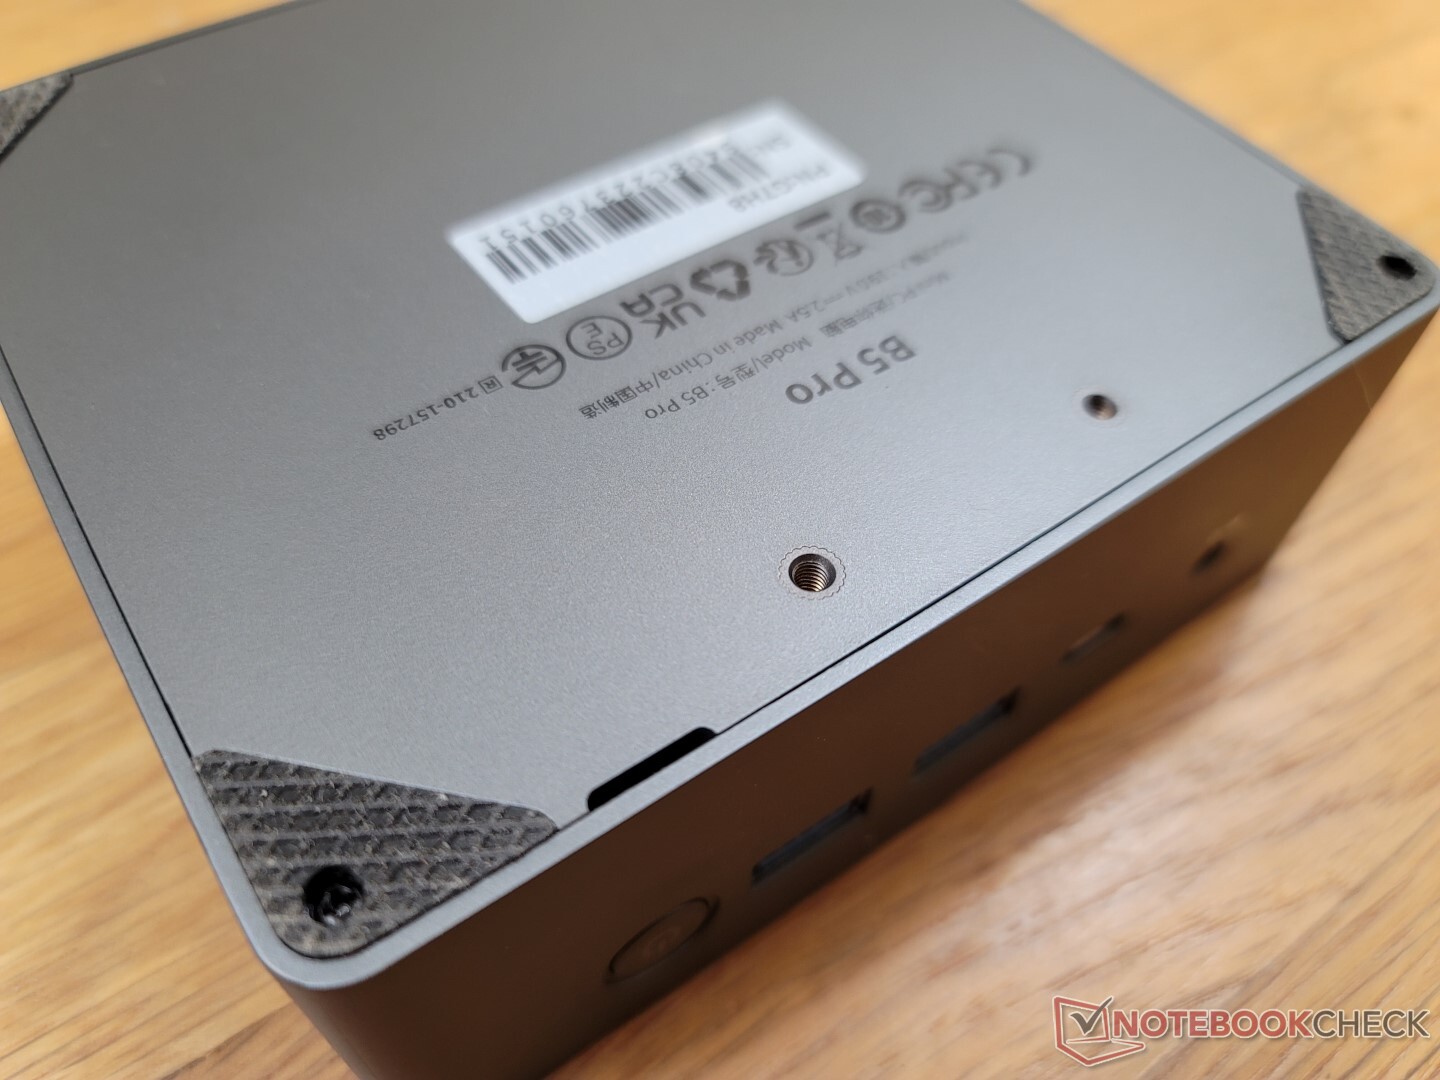
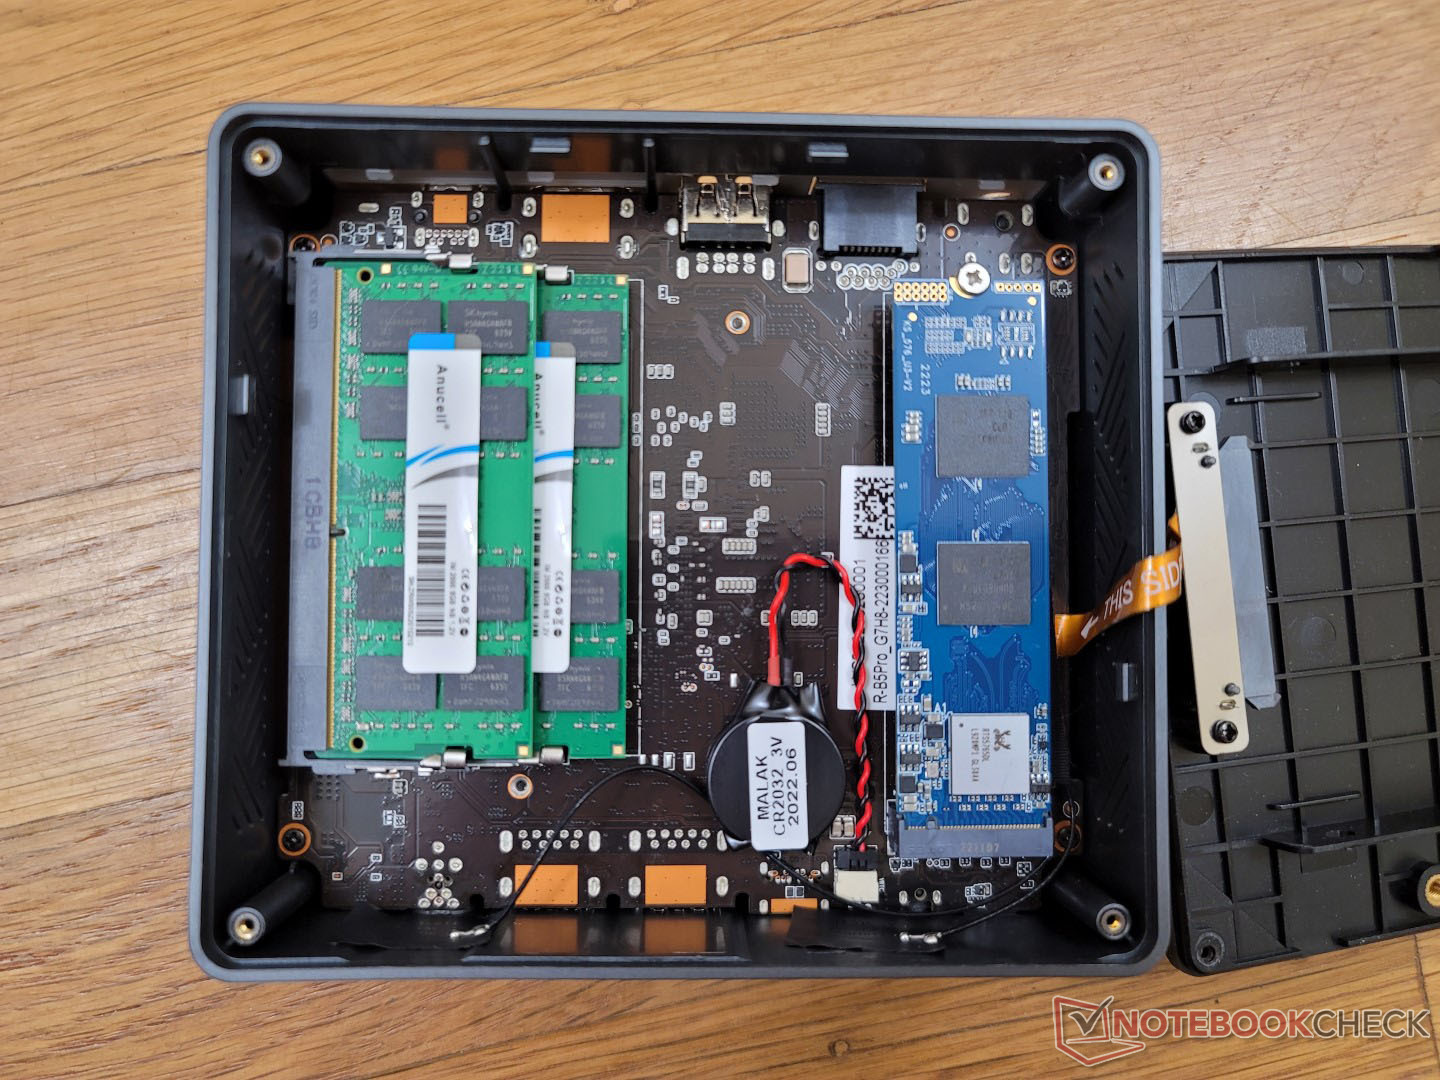
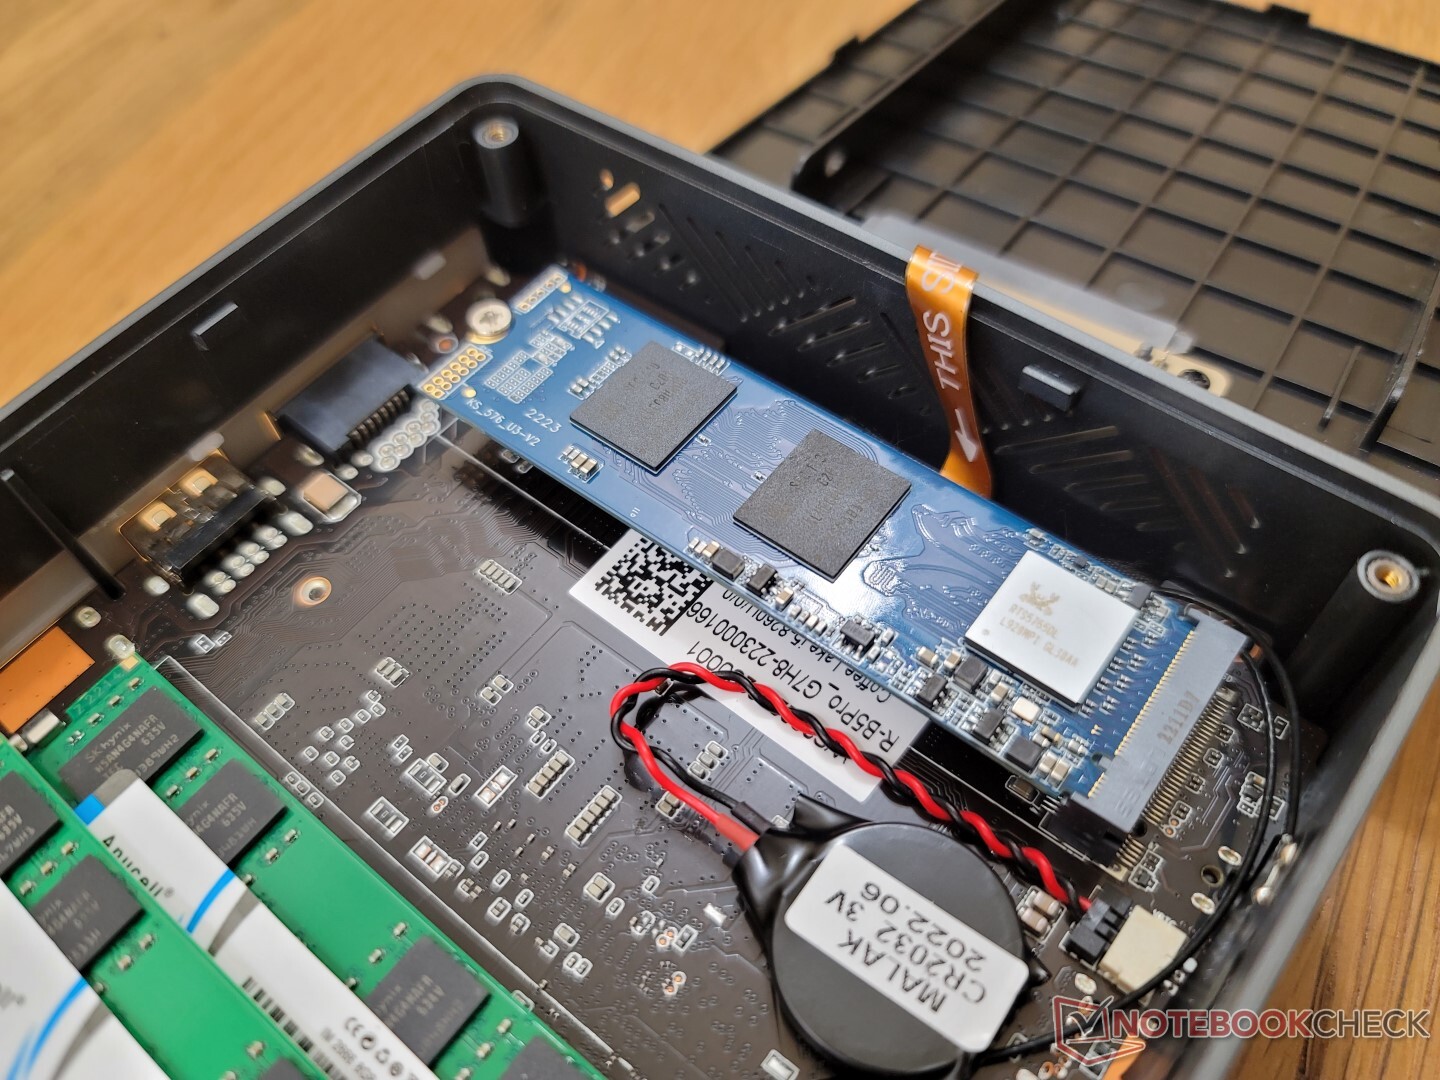
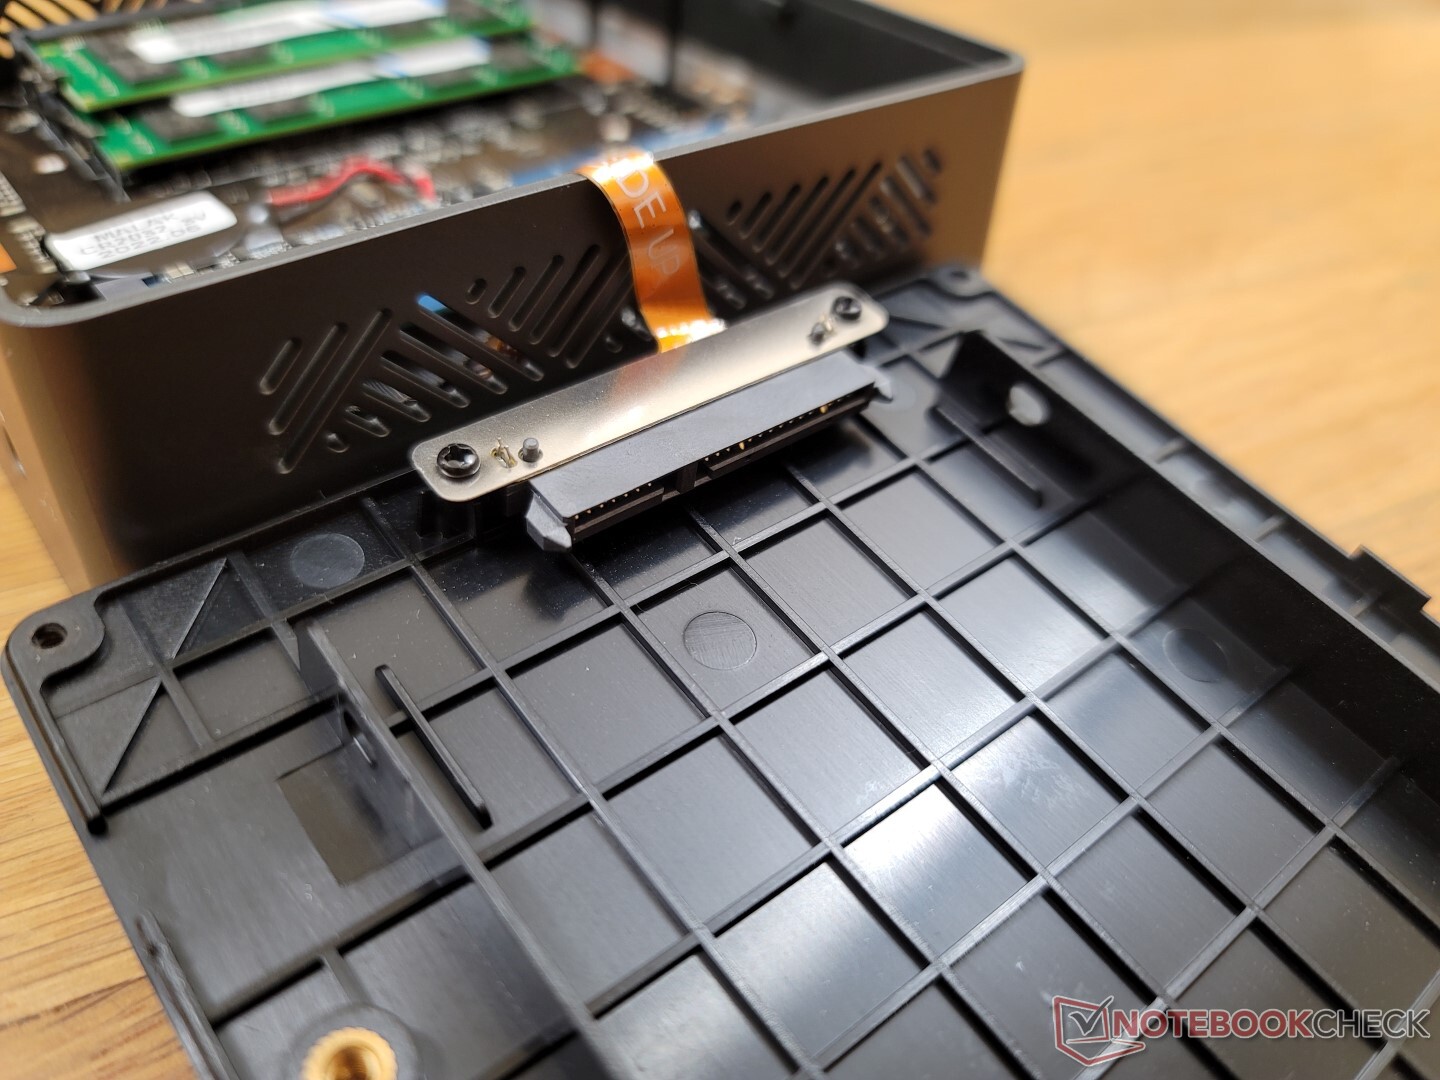
Manutenzione
Il pannello inferiore è fissato da quattro viti Philips per facilitare la manutenzione. A differenza del Beelink SEi8, tuttavia, il pannello inferiore del BMax presenta una piccola fessura lungo un bordo per facilitare la presa e la rimozione
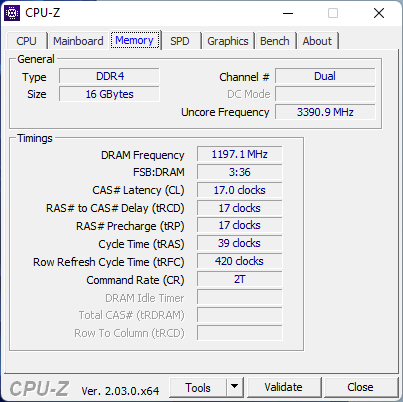
All'interno è possibile installare fino a due moduli SODIMM DDR4 e fino a due unità di archiviazione.
Accessori e garanzia
La confezione include un cavo HDMI e una staffa di montaggio VESA rimovibile con viti, oltre all'adattatore CA. La garanzia standard limitata di un anno è valida se acquistata negli Stati Uniti.
Prestazioni - 8a generazione vs. 12 generazione
Condizioni di test
Abbiamo impostato la nostra unità in modalità Performance tramite Windows prima di eseguire i benchmark qui sotto per ottenere i punteggi più alti possibili. Non ci sono applicazioni preinstallate dal produttore per un'esperienza d'uso pulita di Windows.
Processore
Le prestazioni della CPU sono generalmente paragonabili a quelle del Core i7-1065G7 di 10a generazione Core i7-1065G7 oCore i5-8259U. Anche se molto più lento del Core i5-1135G7 di 11a generazione Core i5-1135G7 fino al 50%, è comunque abbastanza veloce per scopi multimediali comuni come la navigazione web, lo streaming video e un moderato multi-tasking.
Il Core i5-1235U di 12a generazione Core i5-1235Uche è di diverse generazioni superiore al nostro Core i5-8260U, offre prestazioni single-thread e multi-thread più veloci rispettivamente del 60% e dell'80%.
La sostenibilità delle prestazioni è discreta. Quando si esegue CineBench R15 xT in loop, le prestazioni si riducono di circa l'11% nel tempo.
Cinebench R15 Multi Loop
Cinebench R23: Multi Core | Single Core
Cinebench R15: CPU Multi 64Bit | CPU Single 64Bit
Blender: v2.79 BMW27 CPU
7-Zip 18.03: 7z b 4 | 7z b 4 -mmt1
Geekbench 5.5: Multi-Core | Single-Core
HWBOT x265 Benchmark v2.2: 4k Preset
LibreOffice : 20 Documents To PDF
R Benchmark 2.5: Overall mean
| Cinebench R23 / Multi Core | |
| Beelink SER Pro Ryzen 5 5600H | |
| Beelink SEi11 Pro | |
| Asus Vivobook 15 K513EQ | |
| Intel NUC11TNKi5 | |
| Geekom Mini IT8-GM08i5T | |
| Infinix INBook X2 | |
| BMAX B5 Pro G7H8 | |
| Beelink U59 N5105 | |
| Beelink SEi8 | |
| Cinebench R23 / Single Core | |
| Asus Vivobook 15 K513EQ | |
| Beelink SEi11 Pro | |
| Intel NUC11TNKi5 | |
| Beelink SER Pro Ryzen 5 5600H | |
| Infinix INBook X2 | |
| Beelink SEi8 | |
| BMAX B5 Pro G7H8 | |
| Beelink U59 N5105 | |
| Geekbench 5.5 / Multi-Core | |
| Beelink SER Pro Ryzen 5 5600H | |
| Beelink SEi11 Pro | |
| Intel NUC11TNKi5 | |
| Geekom Mini IT8-GM08i5T | |
| Fujitsu Lifebook U939 i5 | |
| Infinix INBook X2 | |
| Beelink U59 N5105 | |
| Beelink SEi8 | |
| BMAX B5 Pro G7H8 | |
| Geekbench 5.5 / Single-Core | |
| Beelink SEi11 Pro | |
| Beelink SER Pro Ryzen 5 5600H | |
| Intel NUC11TNKi5 | |
| Infinix INBook X2 | |
| Fujitsu Lifebook U939 i5 | |
| Geekom Mini IT8-GM08i5T | |
| Beelink SEi8 | |
| Beelink U59 N5105 | |
| BMAX B5 Pro G7H8 | |
* ... Meglio usare valori piccoli
AIDA64: FP32 Ray-Trace | FPU Julia | CPU SHA3 | CPU Queen | FPU SinJulia | FPU Mandel | CPU AES | CPU ZLib | FP64 Ray-Trace | CPU PhotoWorxx
| Performance rating | |
| Beelink SER Pro Ryzen 5 5600H | |
| Beelink SEi11 Pro | |
| Intel NUC11TNKi5 | |
| BMAX B5 Pro G7H8 | |
| Beelink SEi8 | |
| Beelink U59 N5105 | |
| AIDA64 / FP32 Ray-Trace | |
| Beelink SER Pro Ryzen 5 5600H | |
| Beelink SEi11 Pro | |
| Intel NUC11TNKi5 | |
| BMAX B5 Pro G7H8 | |
| Beelink SEi8 | |
| Beelink U59 N5105 | |
| AIDA64 / FPU Julia | |
| Beelink SER Pro Ryzen 5 5600H | |
| Beelink SEi11 Pro | |
| Intel NUC11TNKi5 | |
| BMAX B5 Pro G7H8 | |
| Beelink SEi8 | |
| Beelink U59 N5105 | |
| AIDA64 / CPU SHA3 | |
| Beelink SER Pro Ryzen 5 5600H | |
| Beelink SEi11 Pro | |
| Intel NUC11TNKi5 | |
| BMAX B5 Pro G7H8 | |
| Beelink SEi8 | |
| Beelink U59 N5105 | |
| AIDA64 / CPU Queen | |
| Beelink SER Pro Ryzen 5 5600H | |
| Beelink SEi11 Pro | |
| Intel NUC11TNKi5 | |
| BMAX B5 Pro G7H8 | |
| Beelink SEi8 | |
| Beelink U59 N5105 | |
| AIDA64 / FPU SinJulia | |
| Beelink SER Pro Ryzen 5 5600H | |
| Beelink SEi11 Pro | |
| Intel NUC11TNKi5 | |
| BMAX B5 Pro G7H8 | |
| Beelink SEi8 | |
| Beelink U59 N5105 | |
| AIDA64 / FPU Mandel | |
| Beelink SER Pro Ryzen 5 5600H | |
| Beelink SEi11 Pro | |
| Intel NUC11TNKi5 | |
| BMAX B5 Pro G7H8 | |
| Beelink SEi8 | |
| Beelink U59 N5105 | |
| AIDA64 / CPU AES | |
| Beelink SER Pro Ryzen 5 5600H | |
| Beelink SEi11 Pro | |
| Intel NUC11TNKi5 | |
| Beelink U59 N5105 | |
| BMAX B5 Pro G7H8 | |
| Beelink SEi8 | |
| AIDA64 / CPU ZLib | |
| Beelink SER Pro Ryzen 5 5600H | |
| Intel NUC11TNKi5 | |
| Beelink SEi11 Pro | |
| BMAX B5 Pro G7H8 | |
| Beelink U59 N5105 | |
| Beelink SEi8 | |
| AIDA64 / FP64 Ray-Trace | |
| Beelink SER Pro Ryzen 5 5600H | |
| Beelink SEi11 Pro | |
| Intel NUC11TNKi5 | |
| BMAX B5 Pro G7H8 | |
| Beelink SEi8 | |
| Beelink U59 N5105 | |
| AIDA64 / CPU PhotoWorxx | |
| Beelink SEi11 Pro | |
| Beelink SER Pro Ryzen 5 5600H | |
| BMAX B5 Pro G7H8 | |
| Intel NUC11TNKi5 | |
| Beelink SEi8 | |
| Beelink U59 N5105 | |
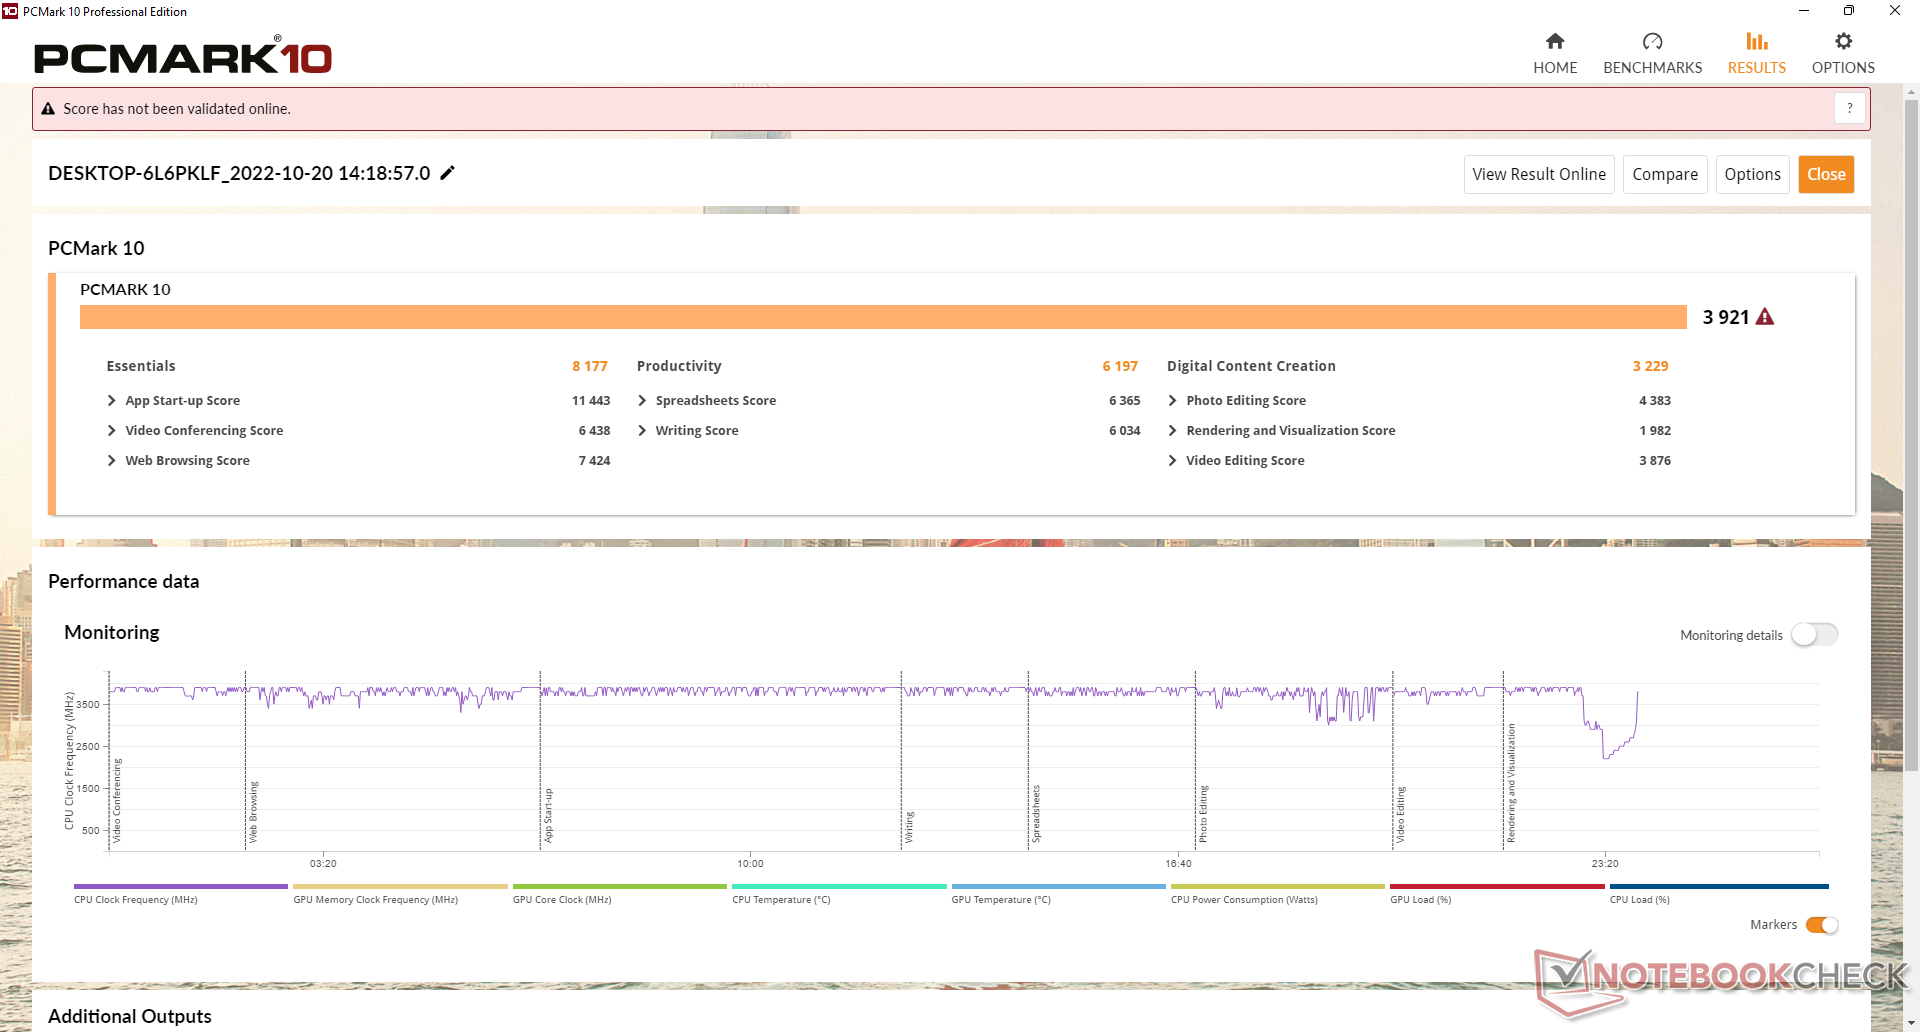
Prestazioni del sistema
I risultati di PCMark 10 sono paragonabili a quelli del Beelink SEi8, che utilizza una vecchia CPU Core di 8a generazione. I mini PC con le più recenti CPU di 11a generazione, come l'Intel NUC11TNKi5, sono in grado di offrire punteggi significativamente più alti nella creazione di contenuti digitali grazie alle loro GPU integrate più veloci.
CrossMark: Overall | Productivity | Creativity | Responsiveness
| PCMark 10 / Score | |
| Beelink SER Pro Ryzen 5 5600H | |
| Beelink SEi11 Pro | |
| Intel NUC11TNKi5 | |
| BMAX B5 Pro G7H8 | |
| Beelink SEi8 | |
| Beelink U59 N5105 | |
| PCMark 10 / Essentials | |
| Beelink SER Pro Ryzen 5 5600H | |
| Beelink SEi11 Pro | |
| Intel NUC11TNKi5 | |
| BMAX B5 Pro G7H8 | |
| Beelink SEi8 | |
| Beelink U59 N5105 | |
| PCMark 10 / Productivity | |
| Beelink SER Pro Ryzen 5 5600H | |
| Beelink SEi11 Pro | |
| BMAX B5 Pro G7H8 | |
| Intel NUC11TNKi5 | |
| Beelink SEi8 | |
| Beelink U59 N5105 | |
| PCMark 10 / Digital Content Creation | |
| Beelink SER Pro Ryzen 5 5600H | |
| Beelink SEi11 Pro | |
| Intel NUC11TNKi5 | |
| BMAX B5 Pro G7H8 | |
| Beelink SEi8 | |
| Beelink U59 N5105 | |
| CrossMark / Overall | |
| Beelink SEi11 Pro | |
| Beelink SER Pro Ryzen 5 5600H | |
| BMAX B5 Pro G7H8 | |
| Beelink U59 N5105 | |
| CrossMark / Productivity | |
| Beelink SEi11 Pro | |
| Beelink SER Pro Ryzen 5 5600H | |
| BMAX B5 Pro G7H8 | |
| Beelink U59 N5105 | |
| CrossMark / Creativity | |
| Beelink SER Pro Ryzen 5 5600H | |
| Beelink SEi11 Pro | |
| BMAX B5 Pro G7H8 | |
| Beelink U59 N5105 | |
| CrossMark / Responsiveness | |
| Beelink SEi11 Pro | |
| Beelink SER Pro Ryzen 5 5600H | |
| BMAX B5 Pro G7H8 | |
| Beelink U59 N5105 | |
| PCMark 10 Score | 3921 punti | |
Aiuto | ||
| AIDA64 / Memory Copy | |
| Beelink SER Pro Ryzen 5 5600H | |
| Beelink SEi11 Pro | |
| Beelink SEi8 | |
| BMAX B5 Pro G7H8 | |
| Beelink U59 N5105 | |
| Intel NUC11TNKi5 | |
| AIDA64 / Memory Read | |
| Beelink SER Pro Ryzen 5 5600H | |
| Beelink SEi11 Pro | |
| BMAX B5 Pro G7H8 | |
| Beelink SEi8 | |
| Intel NUC11TNKi5 | |
| Beelink U59 N5105 | |
| AIDA64 / Memory Write | |
| Beelink SEi11 Pro | |
| Beelink SER Pro Ryzen 5 5600H | |
| BMAX B5 Pro G7H8 | |
| Beelink U59 N5105 | |
| Intel NUC11TNKi5 | |
| Beelink SEi8 | |
| AIDA64 / Memory Latency | |
| BMAX B5 Pro G7H8 | |
| Intel NUC11TNKi5 | |
| Beelink SEi11 Pro | |
| Beelink SER Pro Ryzen 5 5600H | |
| Beelink U59 N5105 | |
| Beelink SEi8 | |
* ... Meglio usare valori piccoli
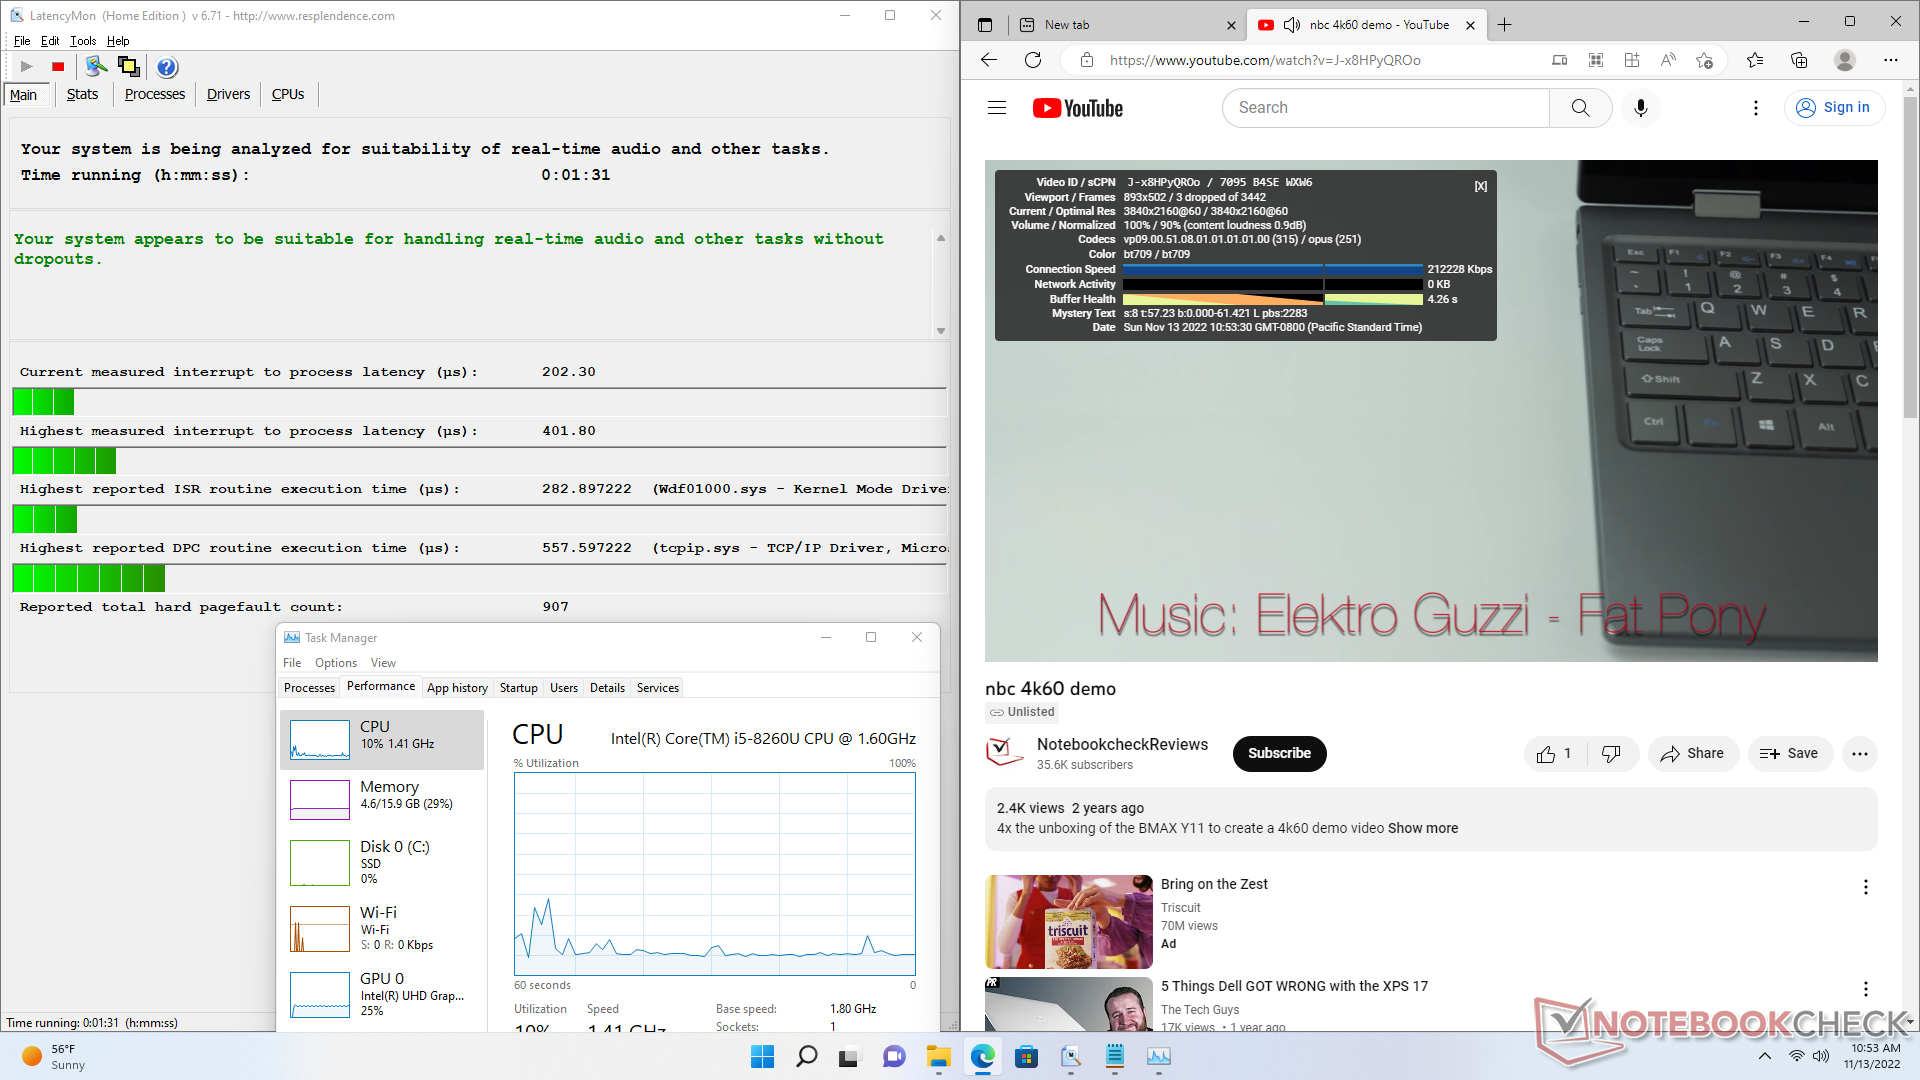
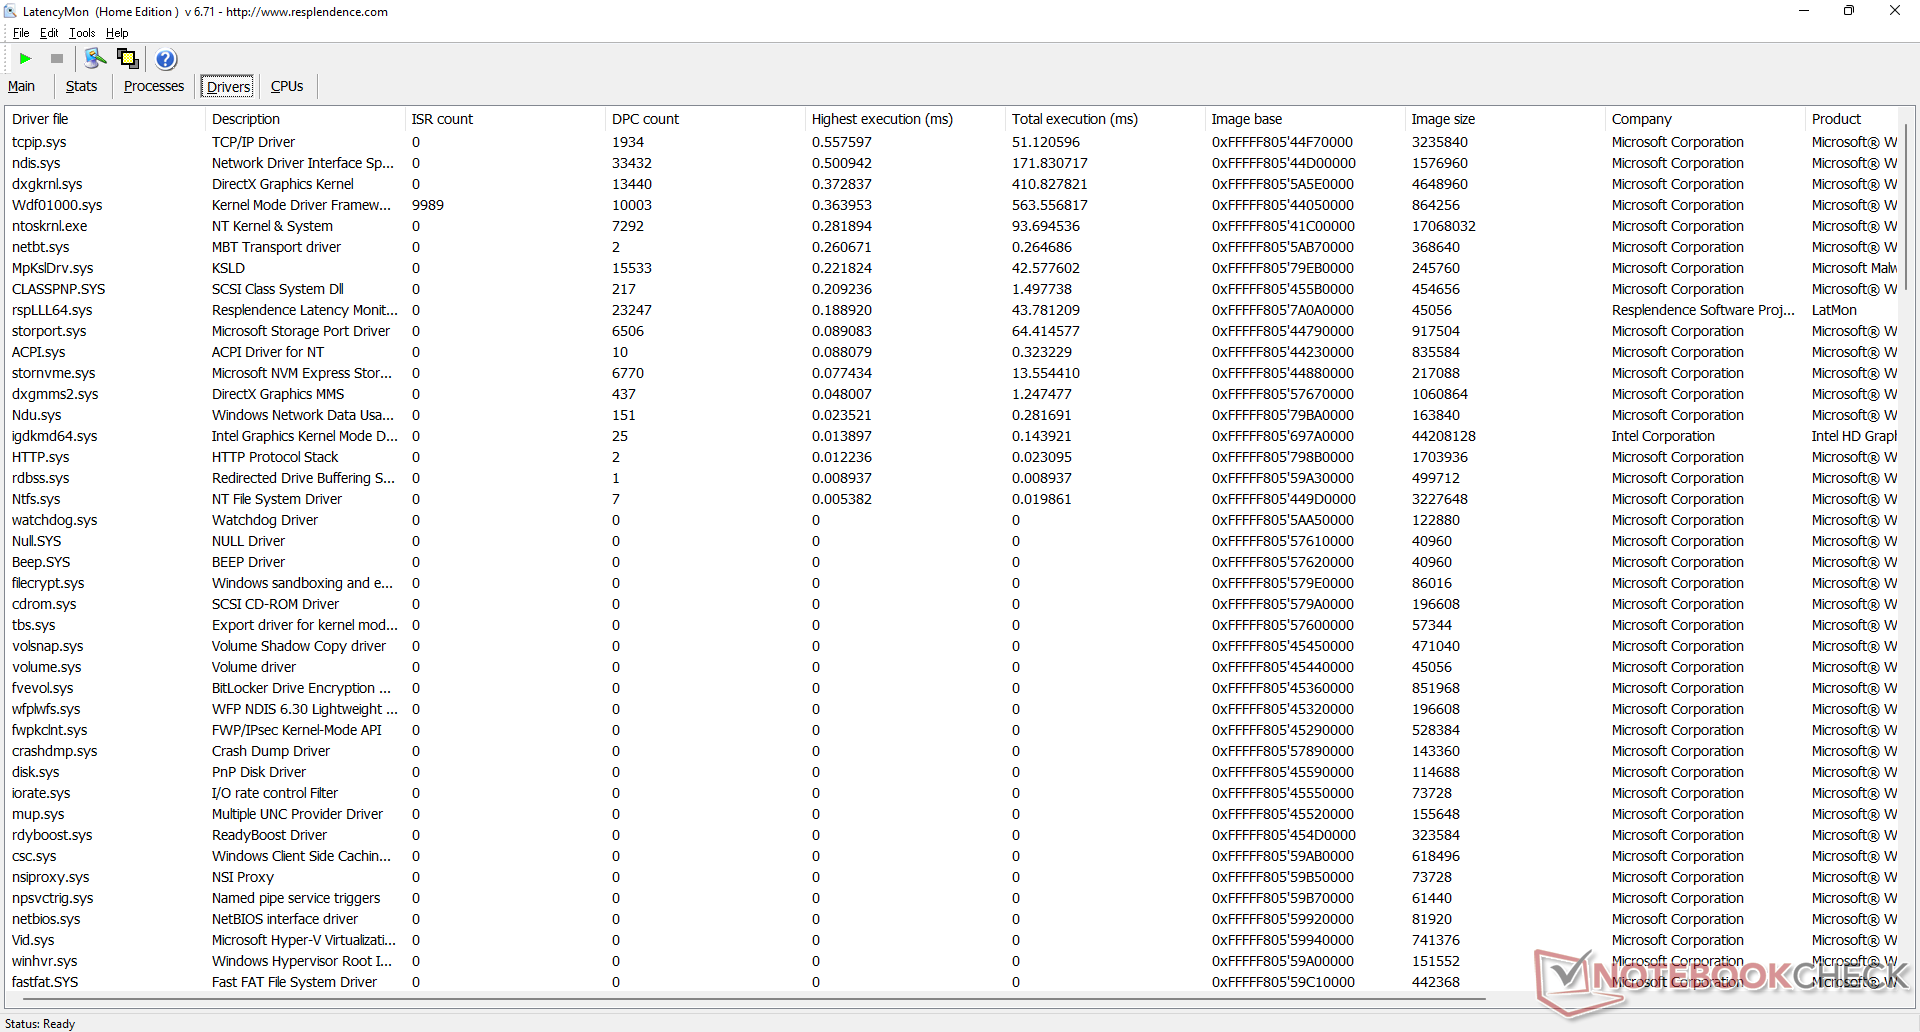
Latenza DPC
LatencyMon non rivela alcun problema di DPC durante la navigazione sul web. anche la riproduzione di video 4K a 60 FPS è eccellente, con solo 3 fotogrammi caduti durante il nostro test di riproduzione di un minuto.
| DPC Latencies / LatencyMon - interrupt to process latency (max), Web, Youtube, Prime95 | |
| Beelink SEi8 | |
| Beelink U59 N5105 | |
| Beelink SER Pro Ryzen 5 5600H | |
| Intel NUC11TNKi5 | |
| BMAX B5 Pro G7H8 | |
| Beelink SEi11 Pro | |
* ... Meglio usare valori piccoli
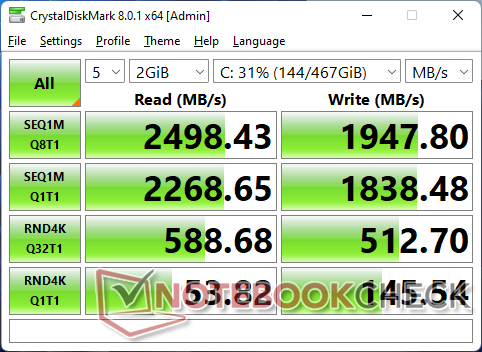
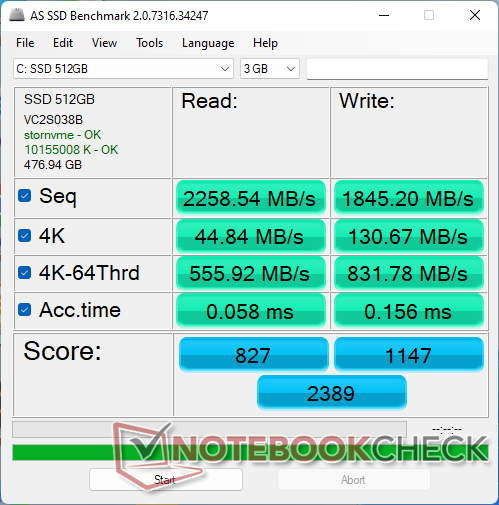
Dispositivi di archiviazione - Fino a due unità
Il modello B5 Pro utilizza un'unità SSD M.2 PCIe3 x4 generica con controller Controller RealTek RTS5763DL per risparmiare sui costi. Tuttavia, le prestazioni non sono ottimali, in quanto le velocità di lettura scendono dal valore iniziale di ~2400 MB/s a soli ~1700 MB/s quando l'unità viene sollecitata.

| Drive Performance rating - Percent | |
| Beelink SER Pro Ryzen 5 5600H -11! | |
| BMAX B5 Pro G7H8 | |
| Beelink SEi11 Pro | |
| Beelink SEi8 | |
| Beelink U59 N5105 | |
| Intel NUC11TNKi5 | |
* ... Meglio usare valori piccoli
Disk Throttling: DiskSpd Read Loop, Queue Depth 8
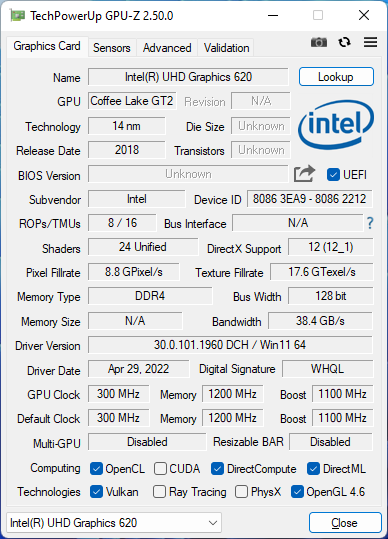
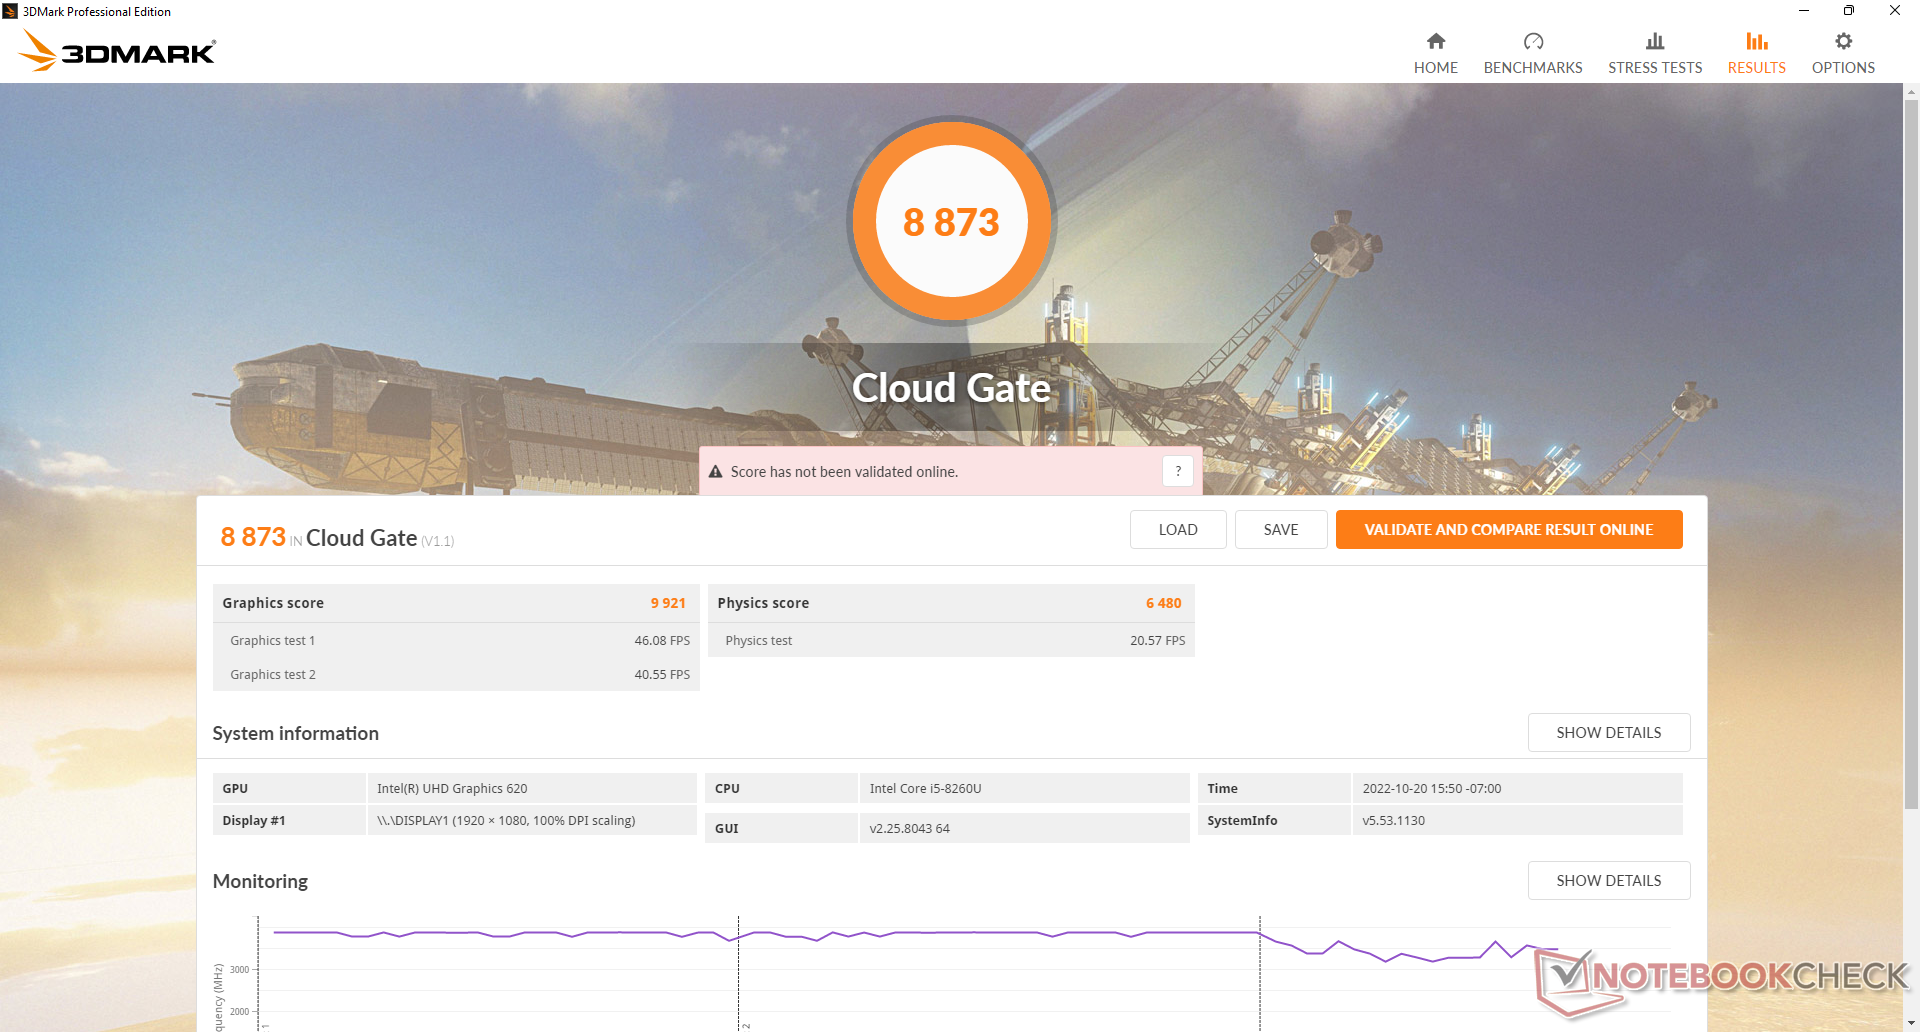
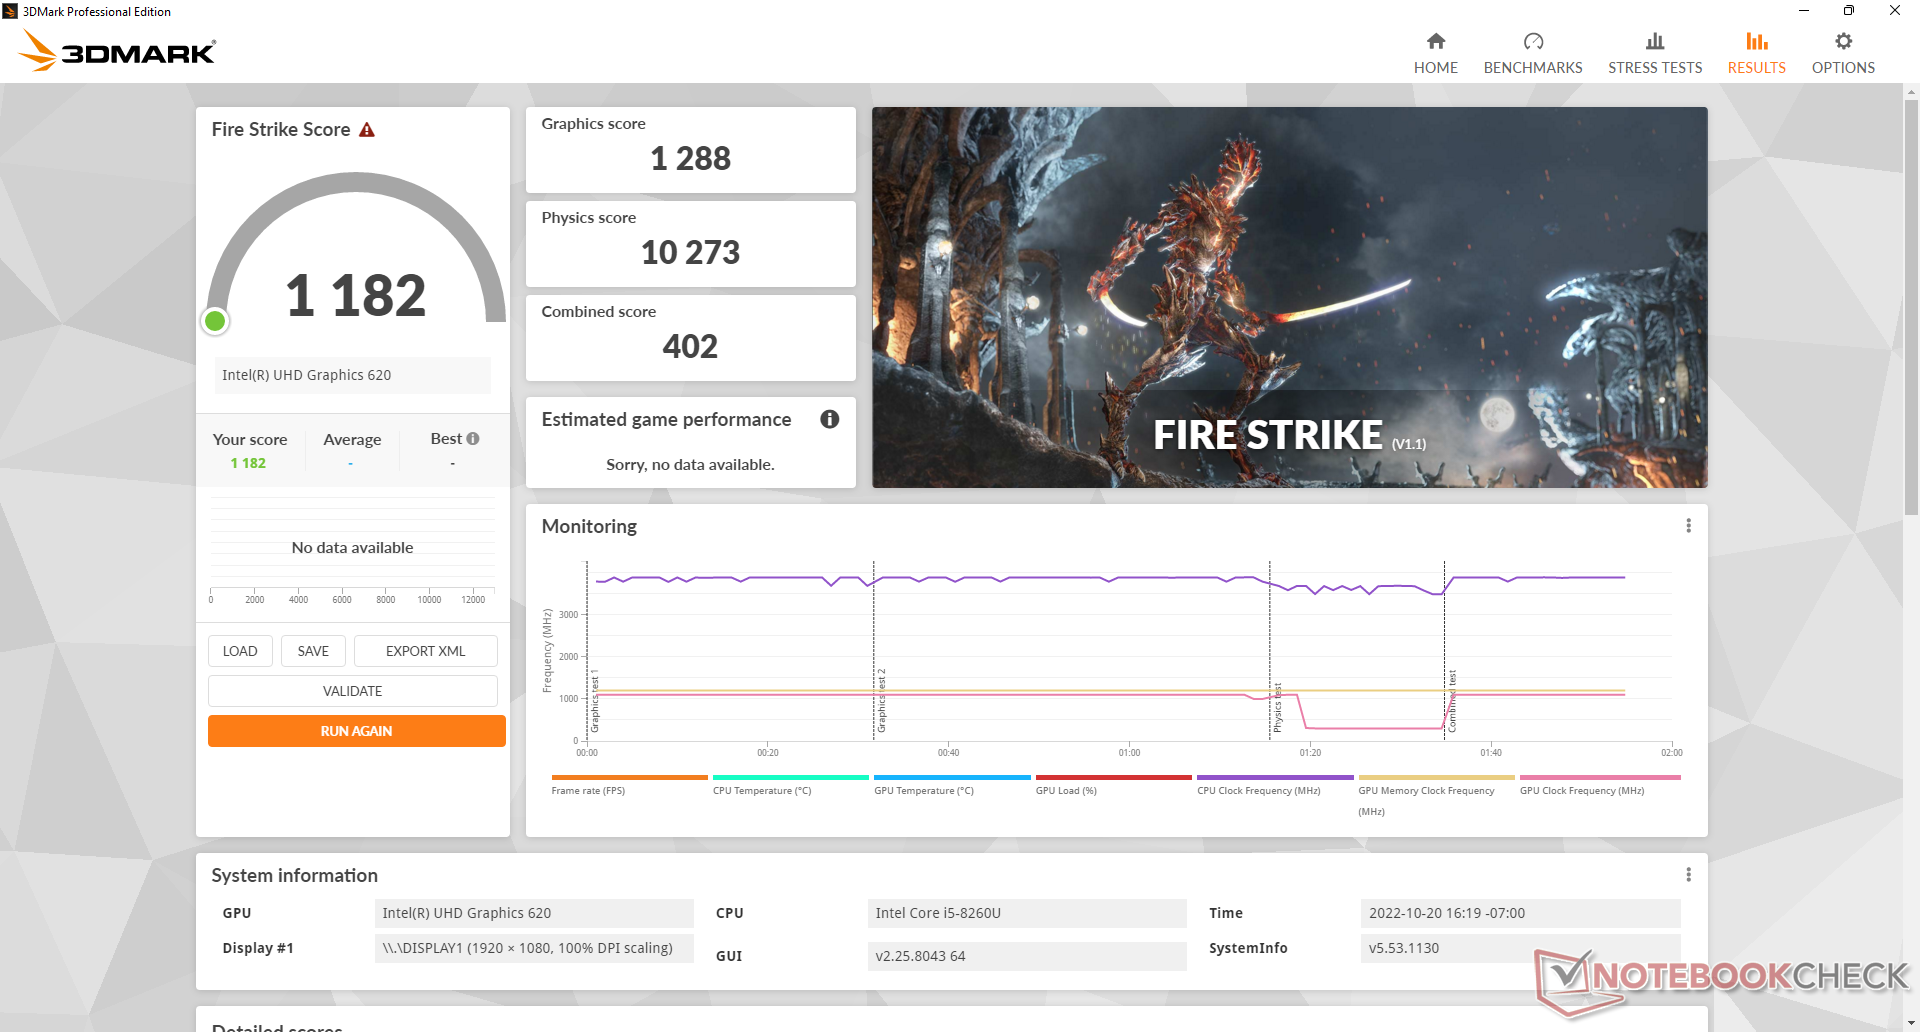
Prestazioni della GPU
Le prestazioni grafiche sono scarse rispetto agli standard odierni. Le Iris Xe 80 EU in molte moderne CPU Core i5 serie U, ad esempio, offrono prestazioni da 2 a 2,5 volte superiori rispetto alle nostre obsolete schede grafiche UHD Graphics 620. La maggior parte dei giochi è ingiocabile e alcuni non si avviano affatto, compreso X-Plane.
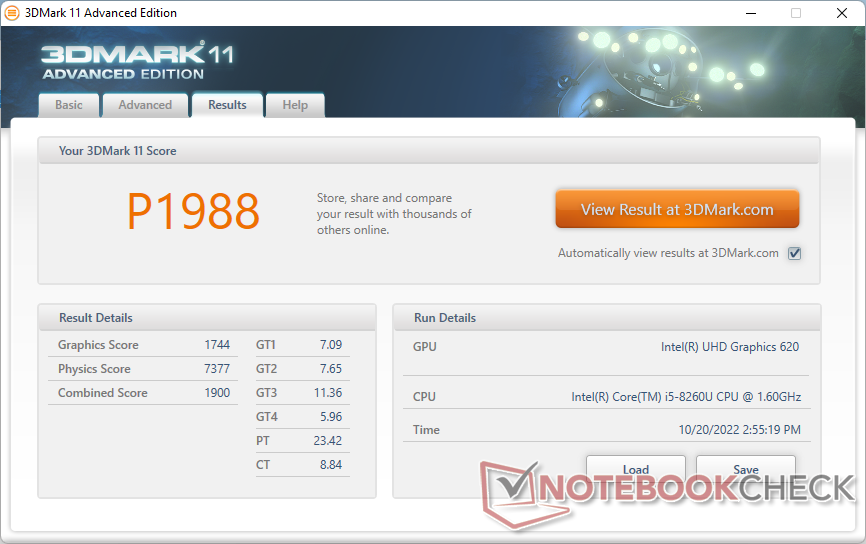
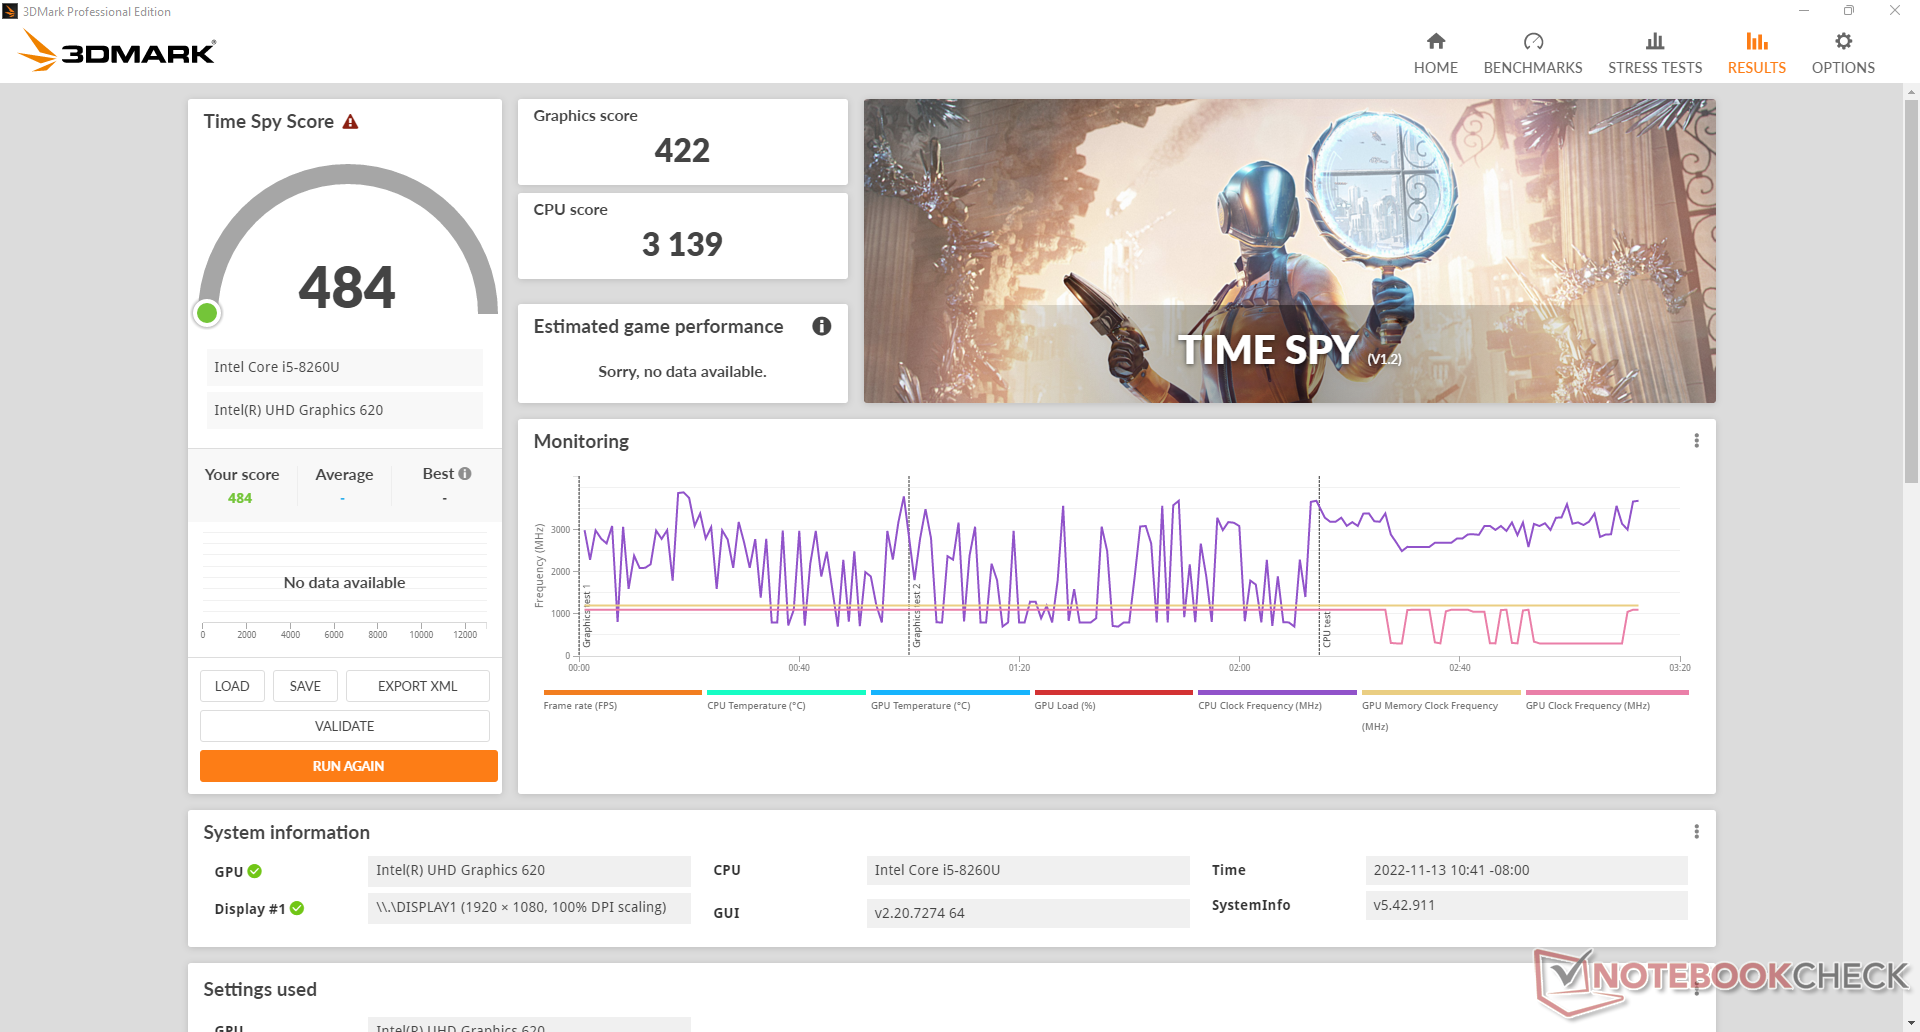
| 3DMark 11 Performance | 1988 punti | |
| 3DMark Cloud Gate Standard Score | 8873 punti | |
| 3DMark Fire Strike Score | 1182 punti | |
| 3DMark Time Spy Score | 484 punti | |
Aiuto | ||
| Blender - v3.3 Classroom CPU (ordina per valore) | |
| BMAX B5 Pro G7H8 | |
| Beelink SEi11 Pro | |
| Beelink U59 N5105 | |
| Beelink SER Pro Ryzen 5 5600H | |
* ... Meglio usare valori piccoli
| Performance rating - Percent | |
| Asus Vivobook 15 K513EQ | |
| Beelink SER Pro Ryzen 5 5600H | |
| Beelink SEi11 Pro -1! | |
| Intel NUC11TNKi5 -3! | |
| Infinix INBook X2 -2! | |
| Beelink SEi8 -3! | |
| Fujitsu Lifebook U939 i5 -4! | |
| Beelink U59 N5105 -3! | |
| BMAX B5 Pro G7H8 -5! | |
| The Witcher 3 - 1920x1080 Ultra Graphics & Postprocessing (HBAO+) | |
| Asus Vivobook 15 K513EQ | |
| Beelink SER Pro Ryzen 5 5600H | |
| Beelink SEi11 Pro | |
| Infinix INBook X2 | |
| Beelink U59 N5105 | |
| GTA V - 1920x1080 Highest AA:4xMSAA + FX AF:16x | |
| Asus Vivobook 15 K513EQ | |
| Beelink SER Pro Ryzen 5 5600H | |
| Final Fantasy XV Benchmark - 1920x1080 High Quality | |
| Beelink SEi11 Pro | |
| Asus Vivobook 15 K513EQ | |
| Beelink SER Pro Ryzen 5 5600H | |
| Intel NUC11TNKi5 | |
| Infinix INBook X2 | |
| Beelink SEi8 | |
| Strange Brigade - 1920x1080 ultra AA:ultra AF:16 | |
| Beelink SER Pro Ryzen 5 5600H | |
| Beelink SEi11 Pro | |
| Asus Vivobook 15 K513EQ | |
| Dota 2 Reborn - 1920x1080 ultra (3/3) best looking | |
| Asus Vivobook 15 K513EQ | |
| Beelink SER Pro Ryzen 5 5600H | |
| Beelink SEi11 Pro | |
| Intel NUC11TNKi5 | |
| Infinix INBook X2 | |
| Beelink SEi8 | |
| Fujitsu Lifebook U939 i5 | |
| Beelink U59 N5105 | |
| BMAX B5 Pro G7H8 | |
| X-Plane 11.11 - 1920x1080 high (fps_test=3) | |
| Asus Vivobook 15 K513EQ | |
| Beelink SEi11 Pro | |
| Beelink SER Pro Ryzen 5 5600H | |
| Intel NUC11TNKi5 | |
| Infinix INBook X2 | |
| Fujitsu Lifebook U939 i5 | |
| Beelink SEi8 | |
| Beelink U59 N5105 | |
| The Witcher 3 | |
| 1024x768 Low Graphics & Postprocessing | |
| Beelink SEi11 Pro | |
| Asus Vivobook 15 K513EQ | |
| Beelink SER Pro Ryzen 5 5600H | |
| Intel NUC11TNKi5 | |
| Infinix INBook X2 | |
| BMAX B5 Pro G7H8 | |
| Beelink U59 N5105 | |
| Fujitsu Lifebook U939 i5 | |
| 1366x768 Medium Graphics & Postprocessing | |
| Beelink SEi11 Pro | |
| Beelink SER Pro Ryzen 5 5600H | |
| Asus Vivobook 15 K513EQ | |
| Infinix INBook X2 | |
| Beelink U59 N5105 | |
| BMAX B5 Pro G7H8 | |
| 1920x1080 High Graphics & Postprocessing (Nvidia HairWorks Off) | |
| Asus Vivobook 15 K513EQ | |
| Beelink SEi11 Pro | |
| Beelink SER Pro Ryzen 5 5600H | |
| Infinix INBook X2 | |
| Beelink U59 N5105 | |
| BMAX B5 Pro G7H8 | |
| Final Fantasy XV Benchmark - 1280x720 Lite Quality | |
| Asus Vivobook 15 K513EQ | |
| Beelink SER Pro Ryzen 5 5600H | |
| Beelink SEi11 Pro | |
| Intel NUC11TNKi5 | |
| Infinix INBook X2 | |
| Geekom Mini IT8-GM08i5T | |
| Beelink SEi8 | |
| Beelink U59 N5105 | |
| BMAX B5 Pro G7H8 | |
Witcher 3 FPS Chart
| basso | medio | alto | ultra | |
|---|---|---|---|---|
| The Witcher 3 (2015) | 23.8 | 13.5 | 7.3 | |
| Dota 2 Reborn (2015) | 42.4 | 8.6 | 5.6 | 5.6 |
| Final Fantasy XV Benchmark (2018) | 5.61 |
Emissioni
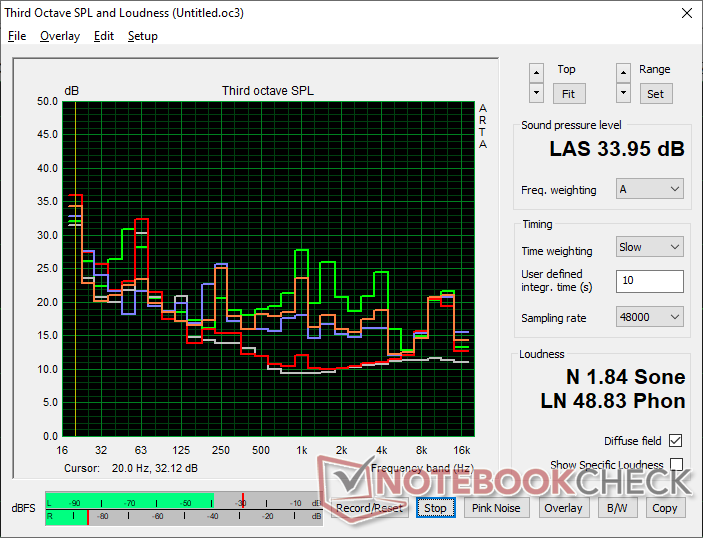
Rumore del sistema - Non è affatto forte
La ventola interna è quasi sempre attiva a circa 25 dB(A) contro uno sfondo silenzioso di 23 dB(A) anche quando non si eseguono applicazioni. Fortunatamente, questo valore così basso è abbastanza silenzioso da non essere percepito nella maggior parte degli scenari. L'esecuzione di carichi più elevati, come i giochi, induce un rumore della ventola compreso tra 30 e 34 dB(A), che è comunque molto silenzioso, soprattutto in ambienti HTPC.
Rumorosità
| Idle |
| 25.1 / 25.1 / 25.1 dB(A) |
| Sotto carico |
| 28.6 / 34 dB(A) |
 | ||
30 dB silenzioso 40 dB(A) udibile 50 dB(A) rumoroso |
||
min: | ||
| BMAX B5 Pro G7H8 UHD Graphics 620, i5-8260U | Beelink SEi11 Pro Iris Xe G7 96EUs, i5-11320H, Kingston NV1 SNVS/500GCN | Beelink U59 N5105 UHD Graphics (Jasper Lake 24 EU), Celeron N5105, Silicon Motion AZW 512G NV428 | Beelink SEi8 Iris Plus Graphics 655, i3-8109U, Intel SSD 660p SSDPEKNW512G8 | Beelink SER Pro Ryzen 5 5600H Vega 7, R5 5600H, Kingston NV1 SNVS/500GCN | Intel NUC11TNKi5 Iris Xe G7 80EUs, i5-1135G7, Transcend M.2 SSD 430S TS512GMTS430S | |
|---|---|---|---|---|---|---|
| Noise | -5% | 14% | -14% | -7% | -32% | |
| off /ambiente * (dB) | 23 | 22.8 1% | 21.5 7% | 24.5 -7% | 22.8 1% | 24.8 -8% |
| Idle Minimum * (dB) | 25.1 | 24.7 2% | 22.1 12% | 26.5 -6% | 26.1 -4% | 35.6 -42% |
| Idle Average * (dB) | 25.1 | 24.7 2% | 22.1 12% | 26.5 -6% | 26.1 -4% | 35.6 -42% |
| Idle Maximum * (dB) | 25.1 | 25.3 -1% | 22.1 12% | 31.1 -24% | 28.7 -14% | 35.6 -42% |
| Load Average * (dB) | 28.6 | 33.2 -16% | 23.9 16% | 37.7 -32% | 32.3 -13% | 36.2 -27% |
| Witcher 3 ultra * (dB) | 30.1 | 34.5 -15% | 24.4 19% | 32.8 -9% | 38 -26% | |
| Load Maximum * (dB) | 34 | 37.8 -11% | 26.8 21% | 37.5 -10% | 36.4 -7% | 47.6 -40% |
* ... Meglio usare valori piccoli
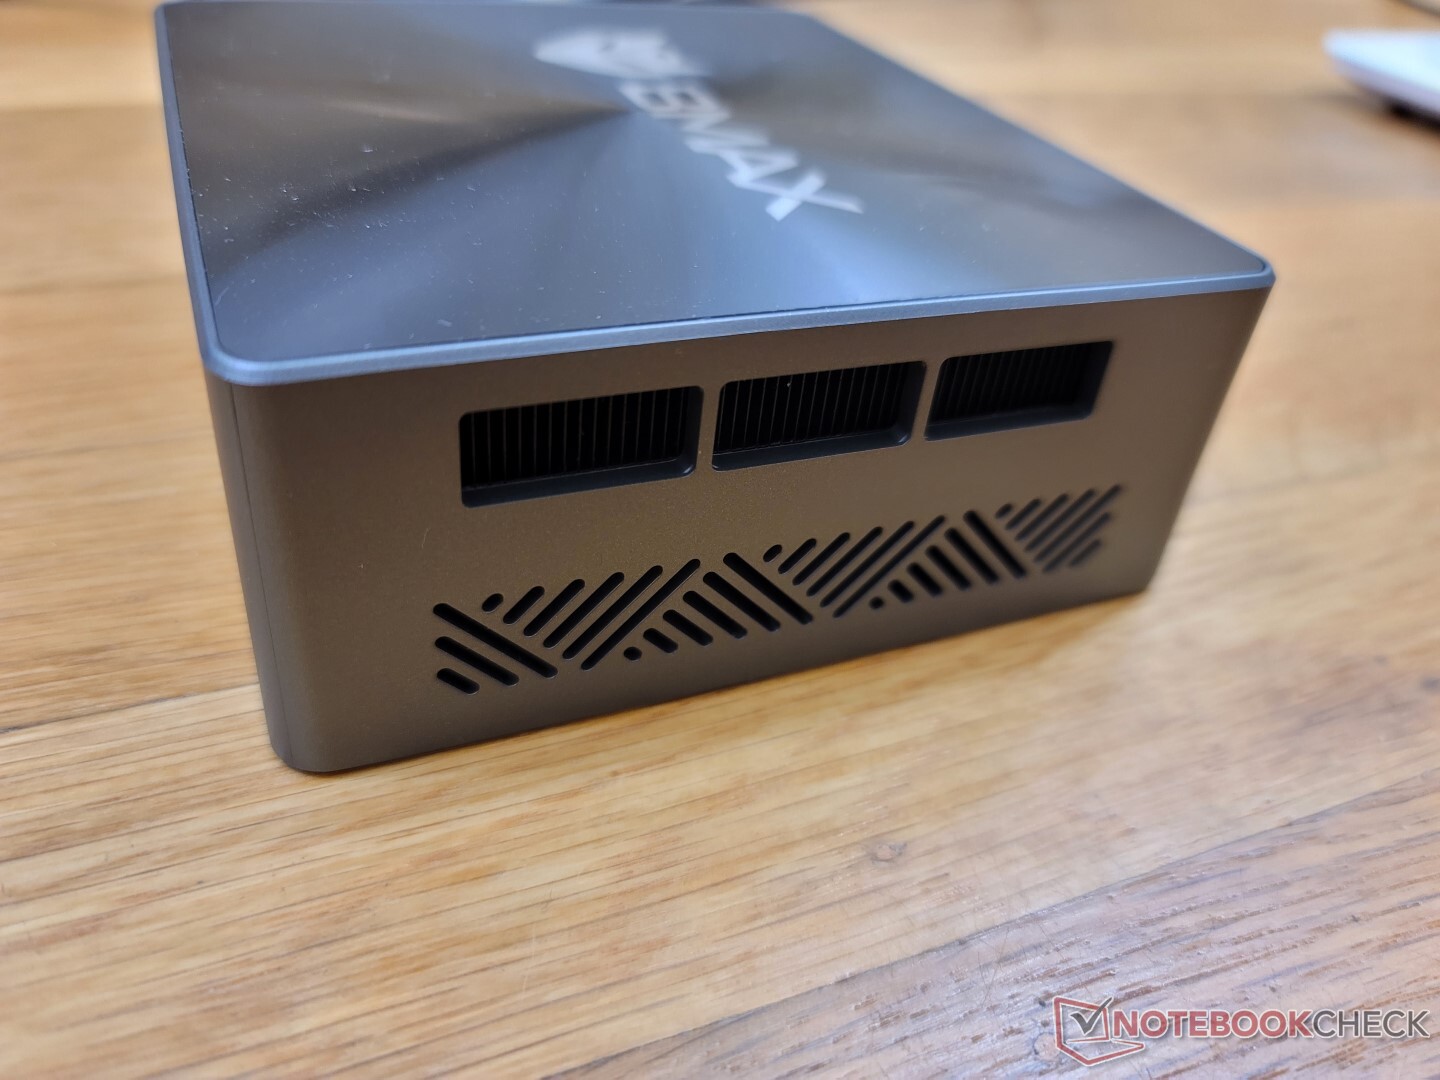
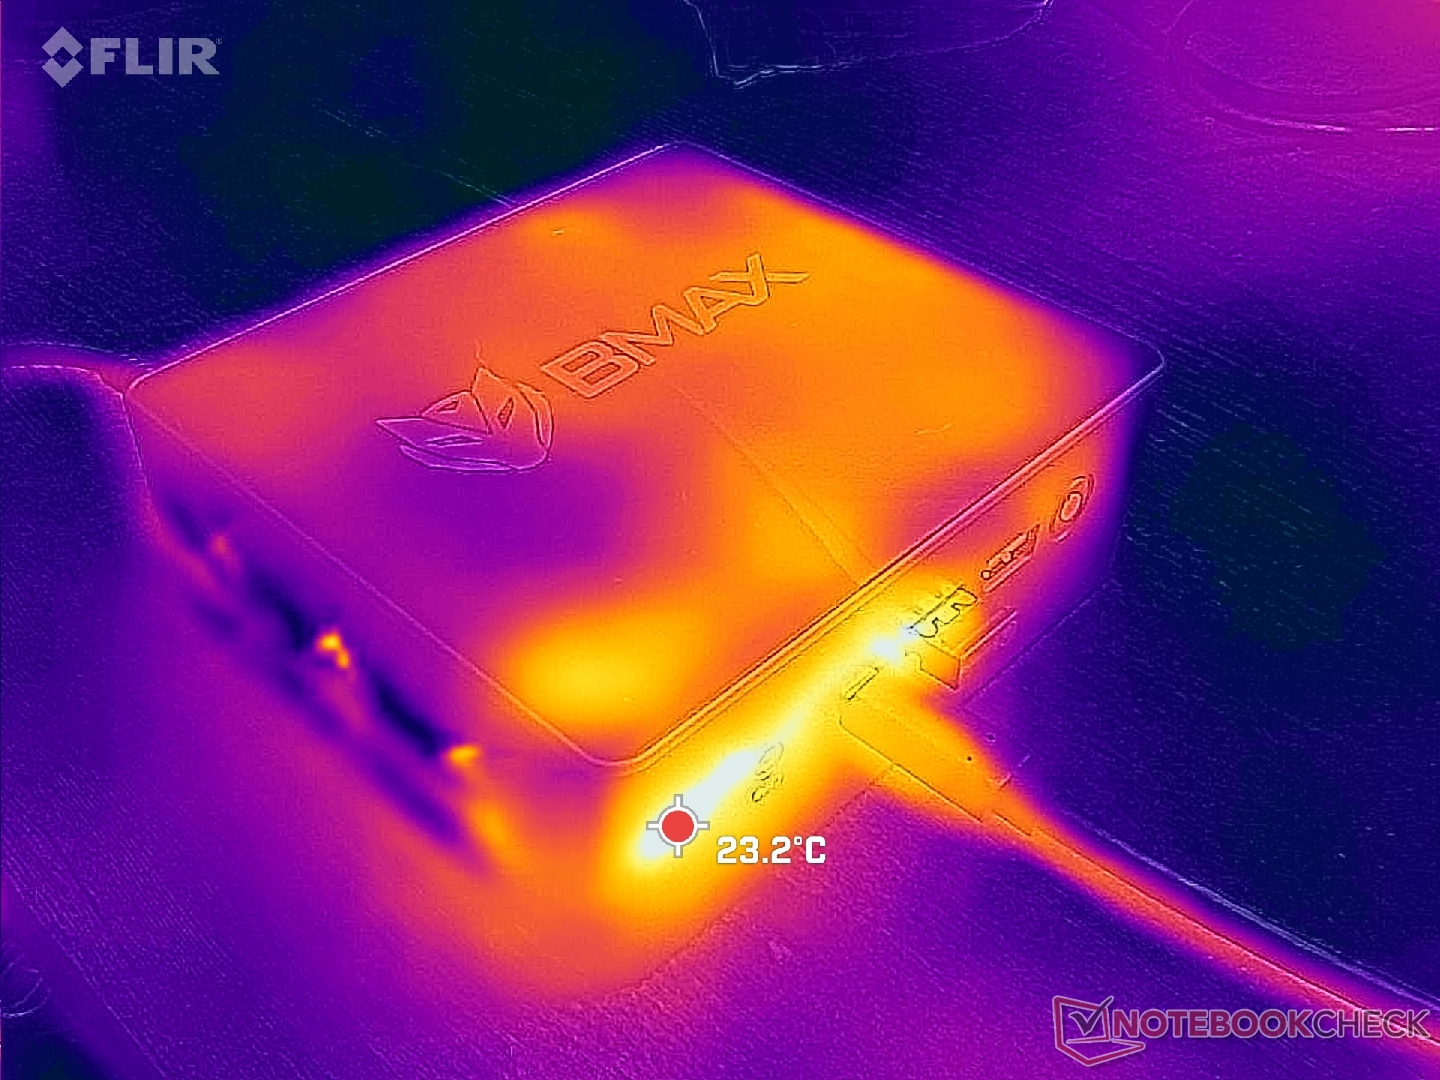
Temperatura
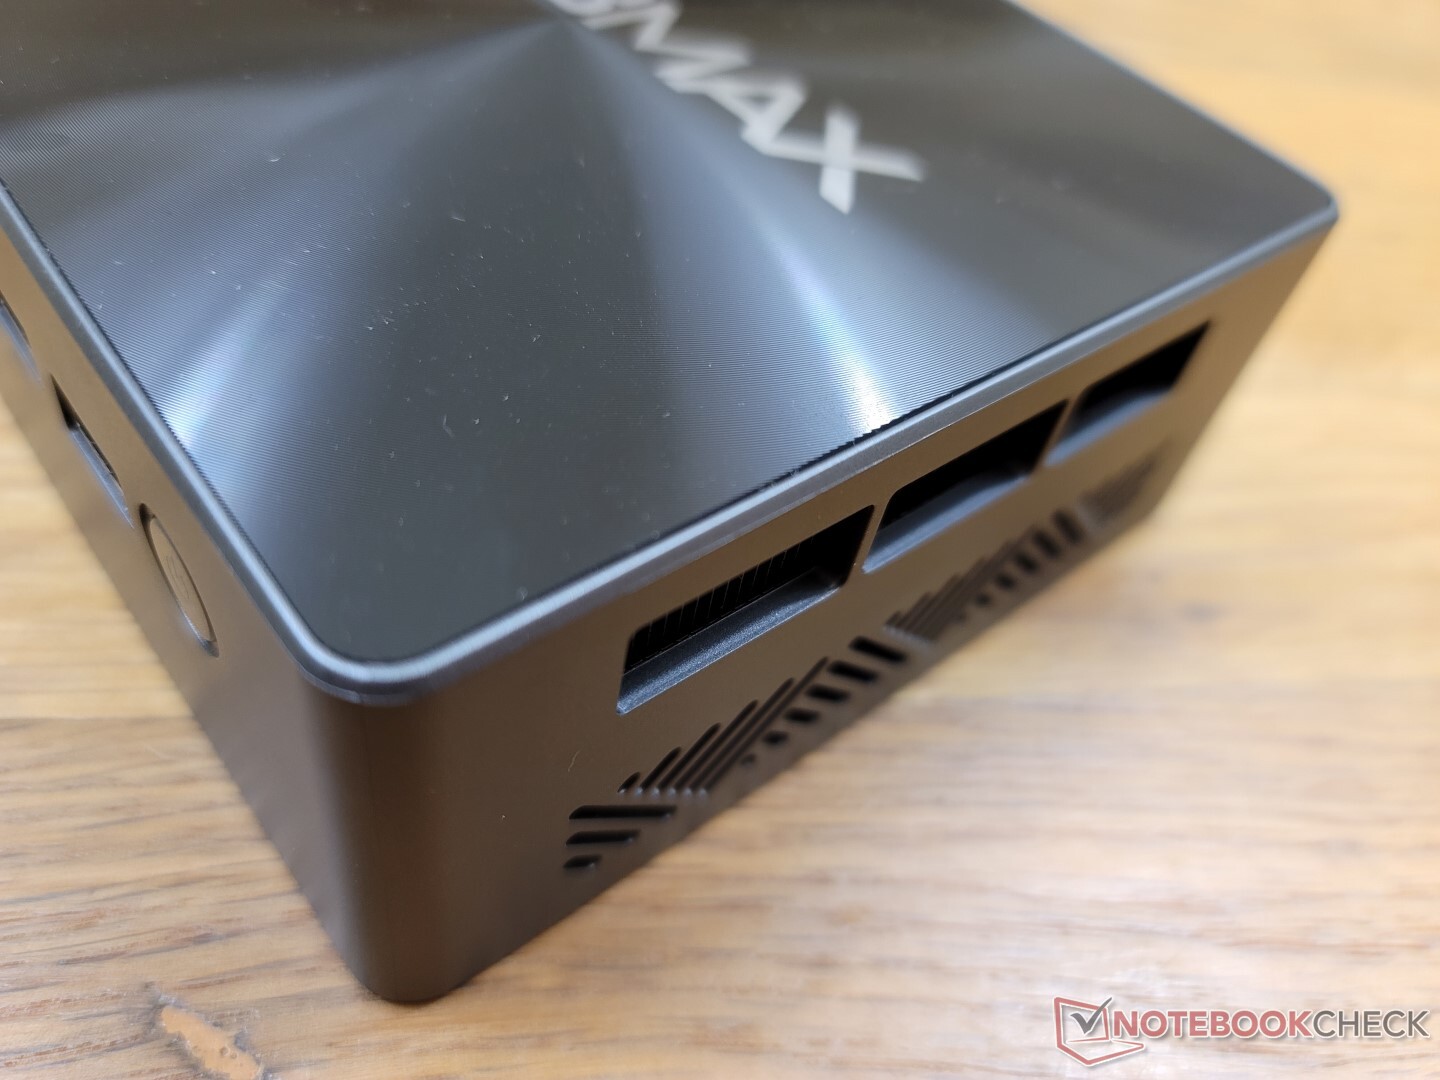
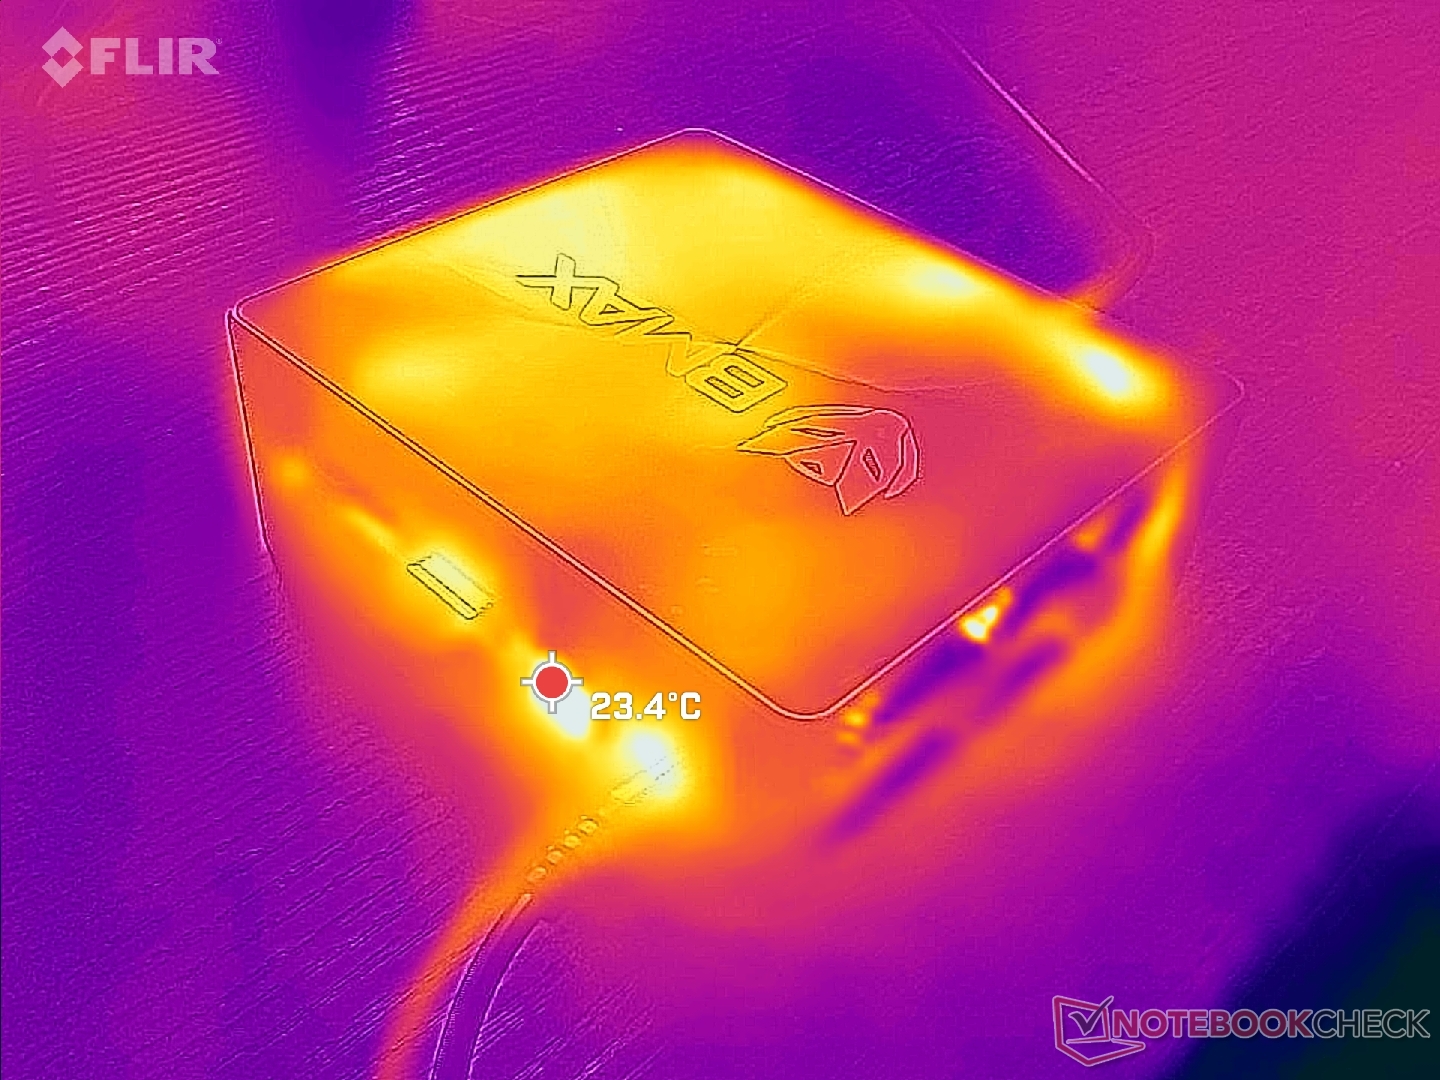
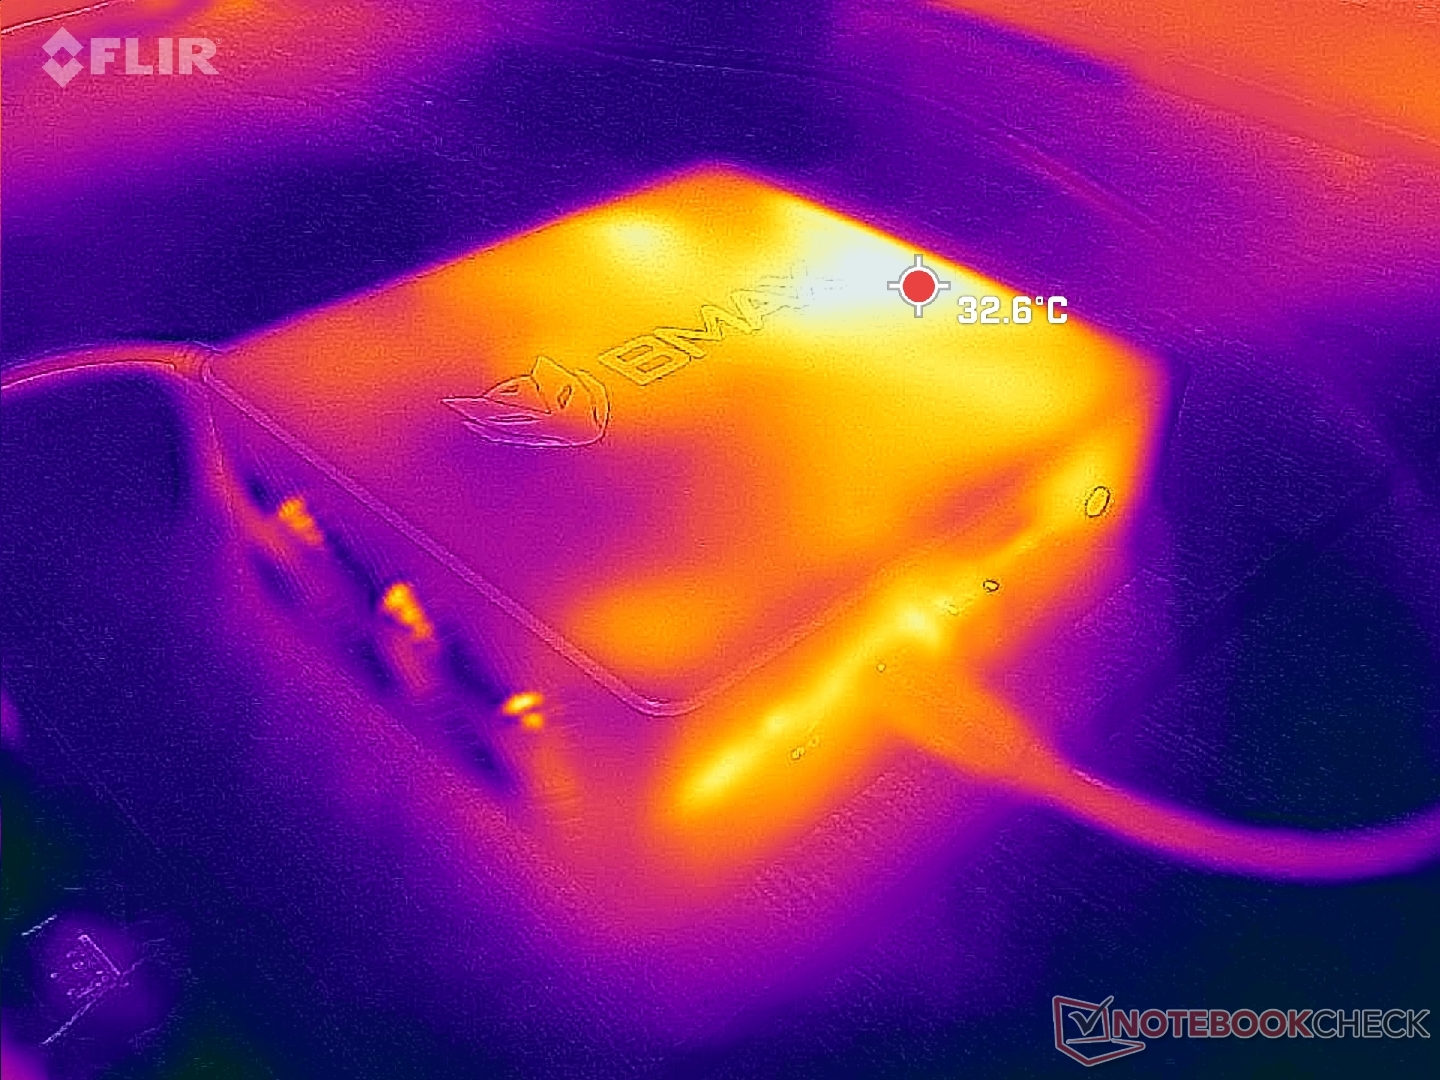
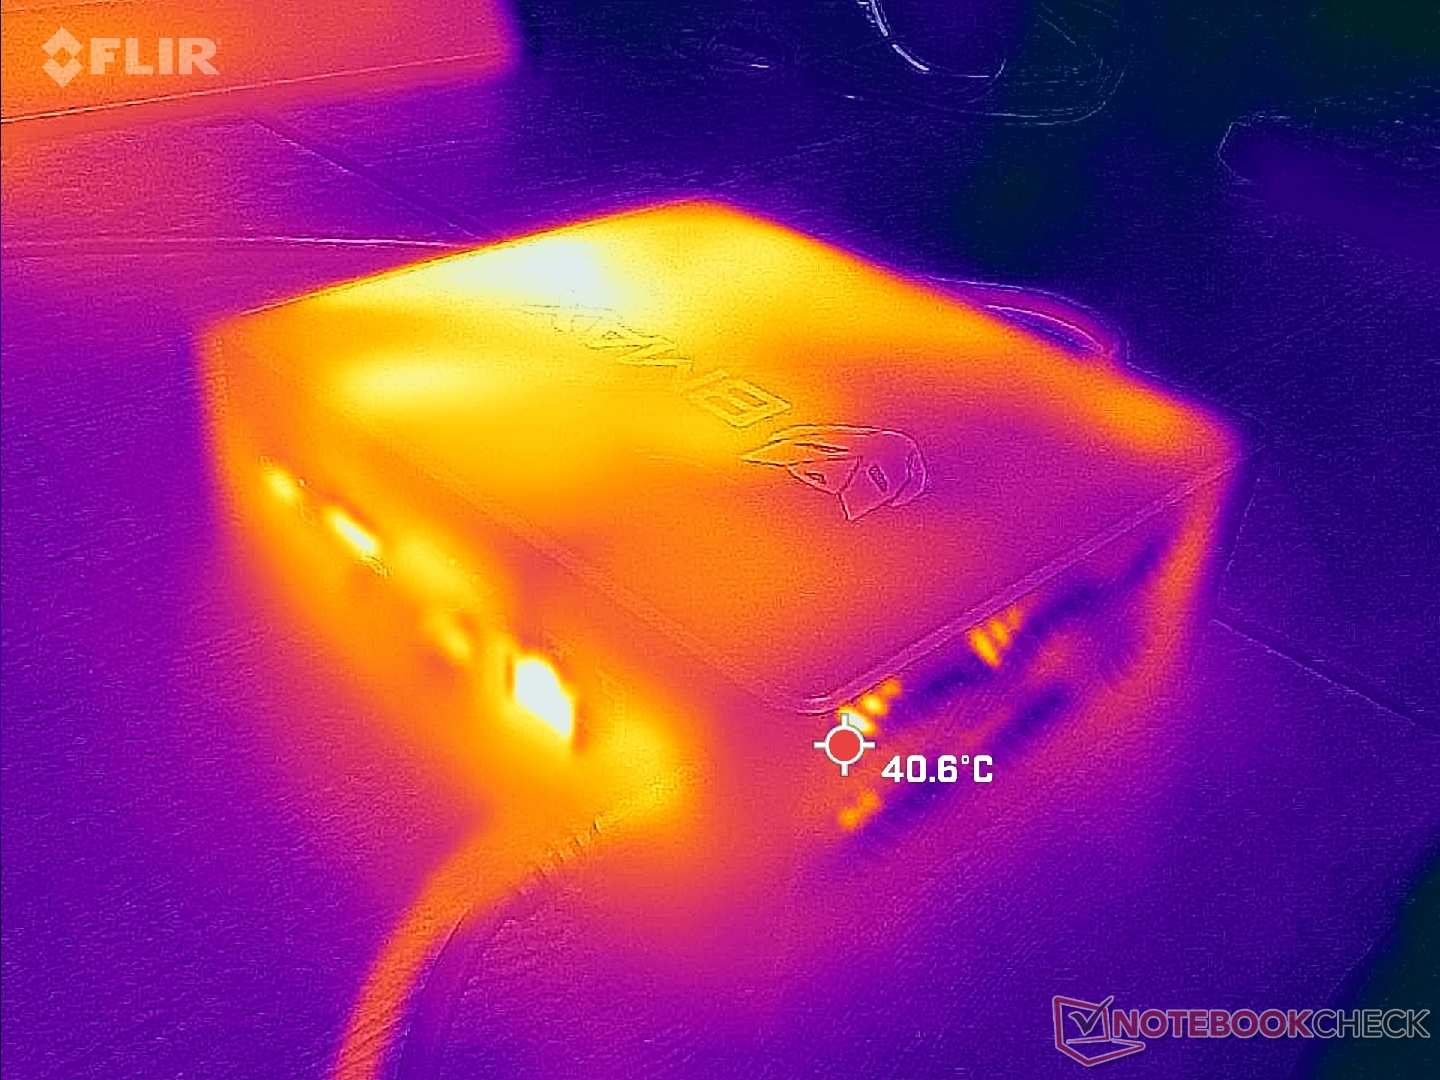
Le temperature superficiali non sono mai eccessivamente calde. Il punto caldo sulla parte superiore, ad esempio, raggiunge solo circa 33 C quando è sottoposto a un elevato stress di elaborazione. Il calore fuoriesce dal lato destro dello chassis, a differenza del NUC di Intel, dove il calore fuoriesce dal retro
Gli oggetti possono essere posizionati in modo sicuro sulla parte superiore dell'unità, poiché non ci sono griglie di ventilazione.
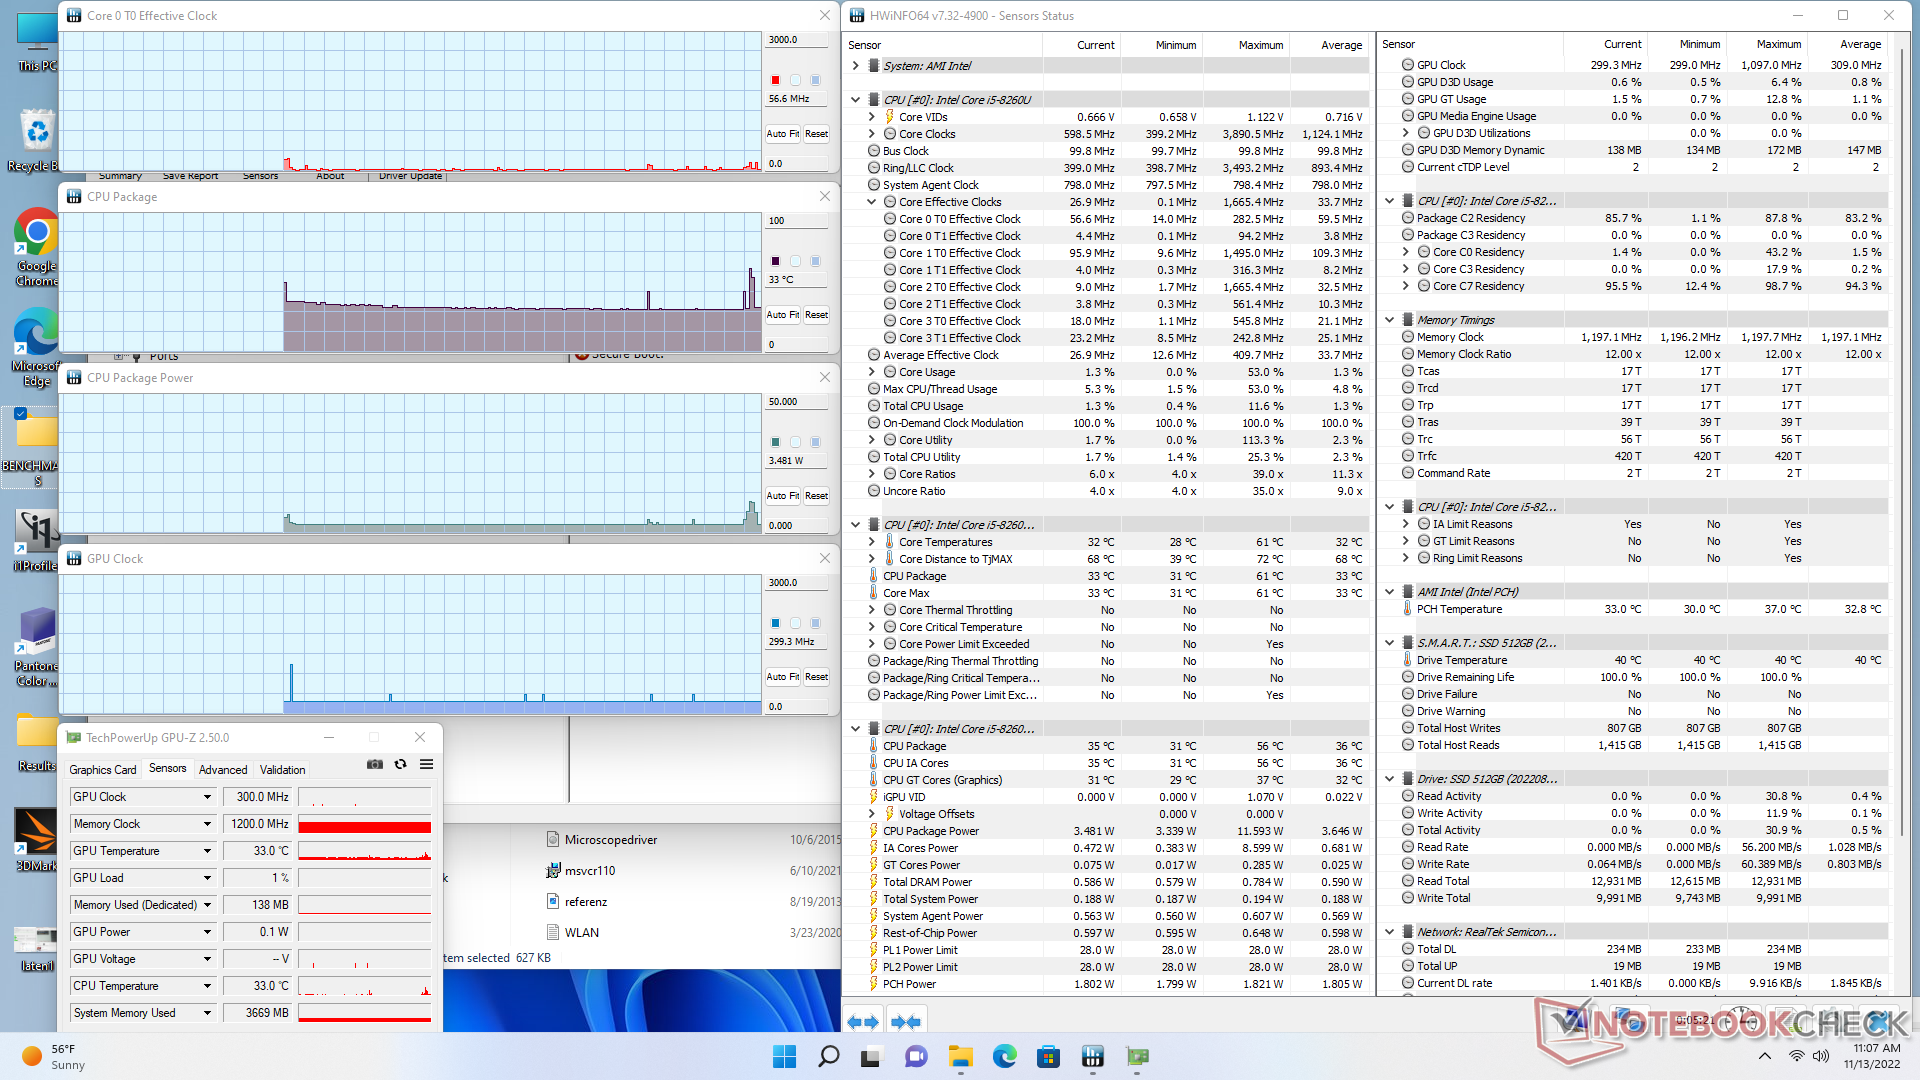
Stress test
Quando è stata sottoposta a Prime95, la CPU ha raggiunto i 2,8 GHz e i 28 W per circa 20 secondi o fino a quando la temperatura del core ha raggiunto i 76 C. La frequenza di clock e l'assorbimento di potenza della scheda si sono poi stabilizzati rispettivamente a 1,5 GHz e 12 W, per mantenere una temperatura del core più bassa di 60 C. Ripetendo lo stesso test su Beelink SEi8 si otterrebbe un clock del core più veloce e temperature più calde, rispettivamente di 2,8 GHz e di 80 C. Il potenziale Turbo Boost del B5 Pro è quindi limitato, come abbiamo osservato durante lo stress test di CineBench.
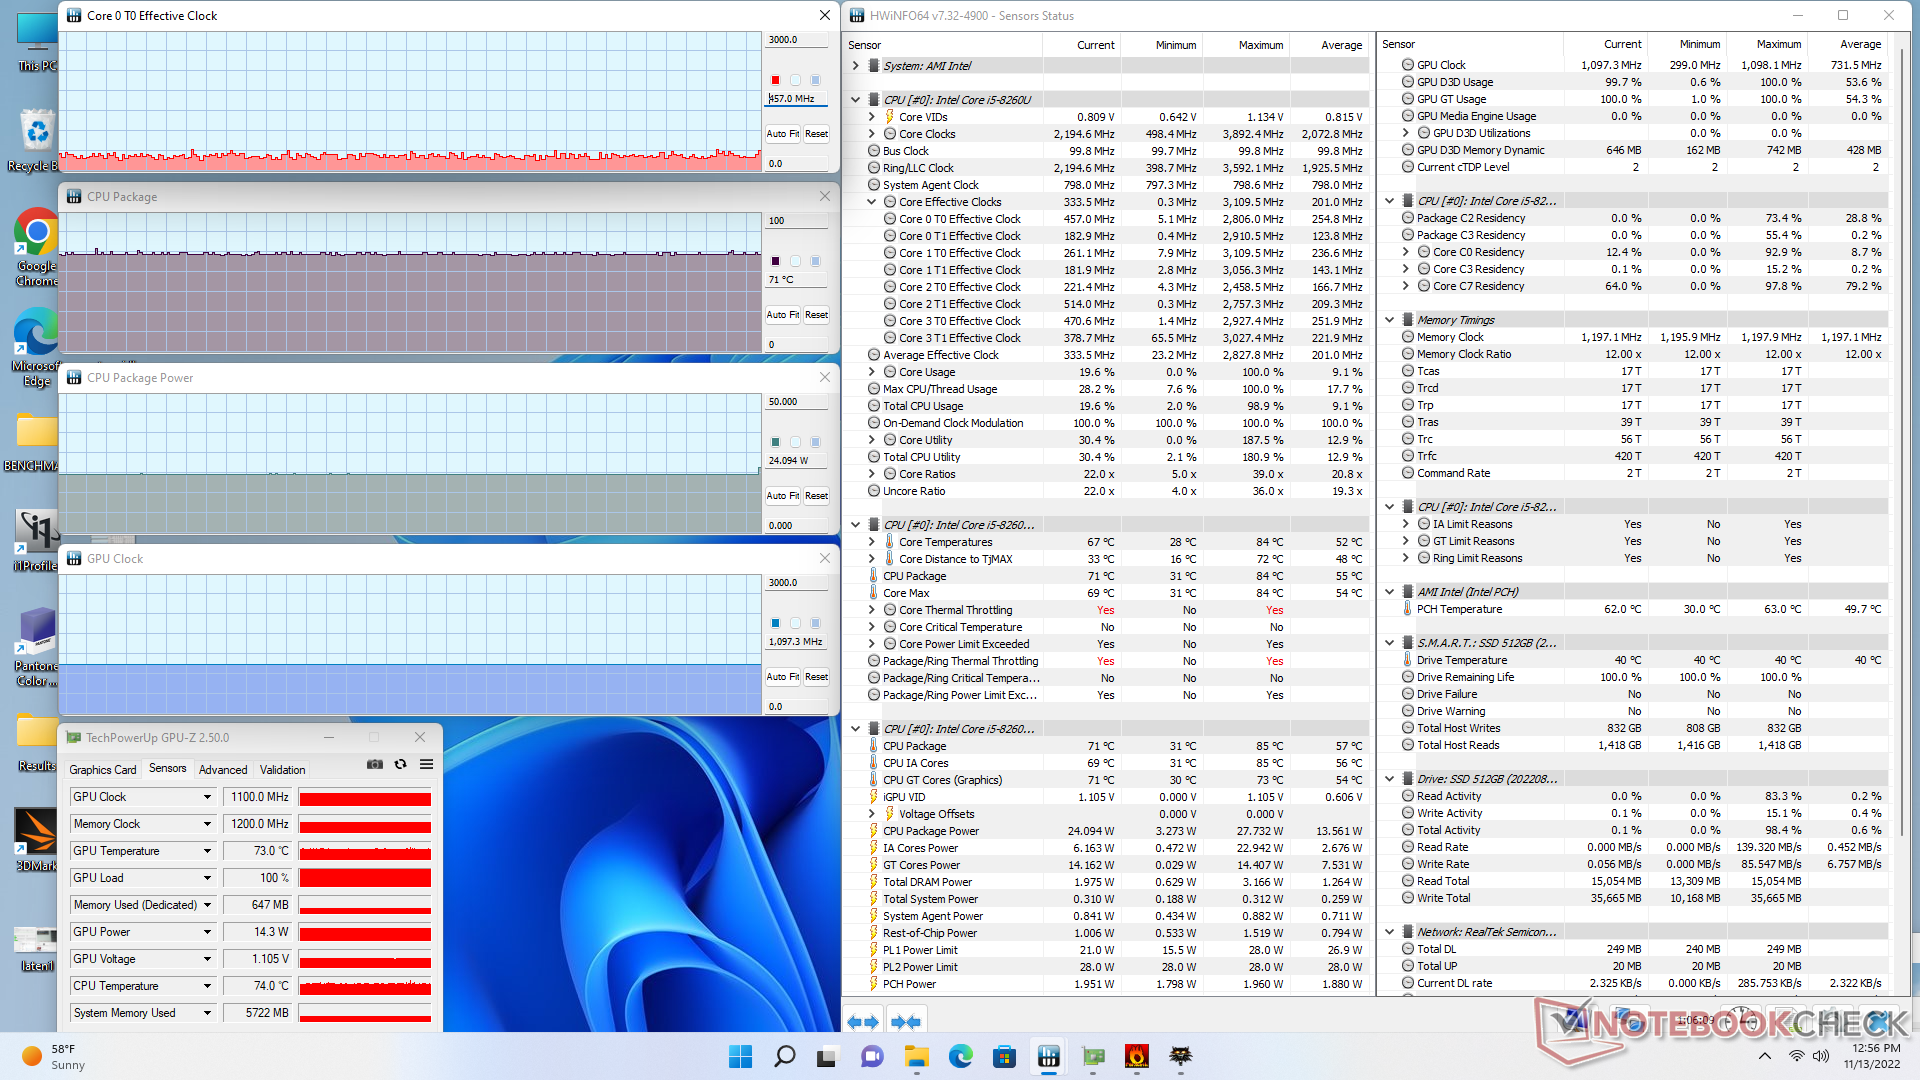
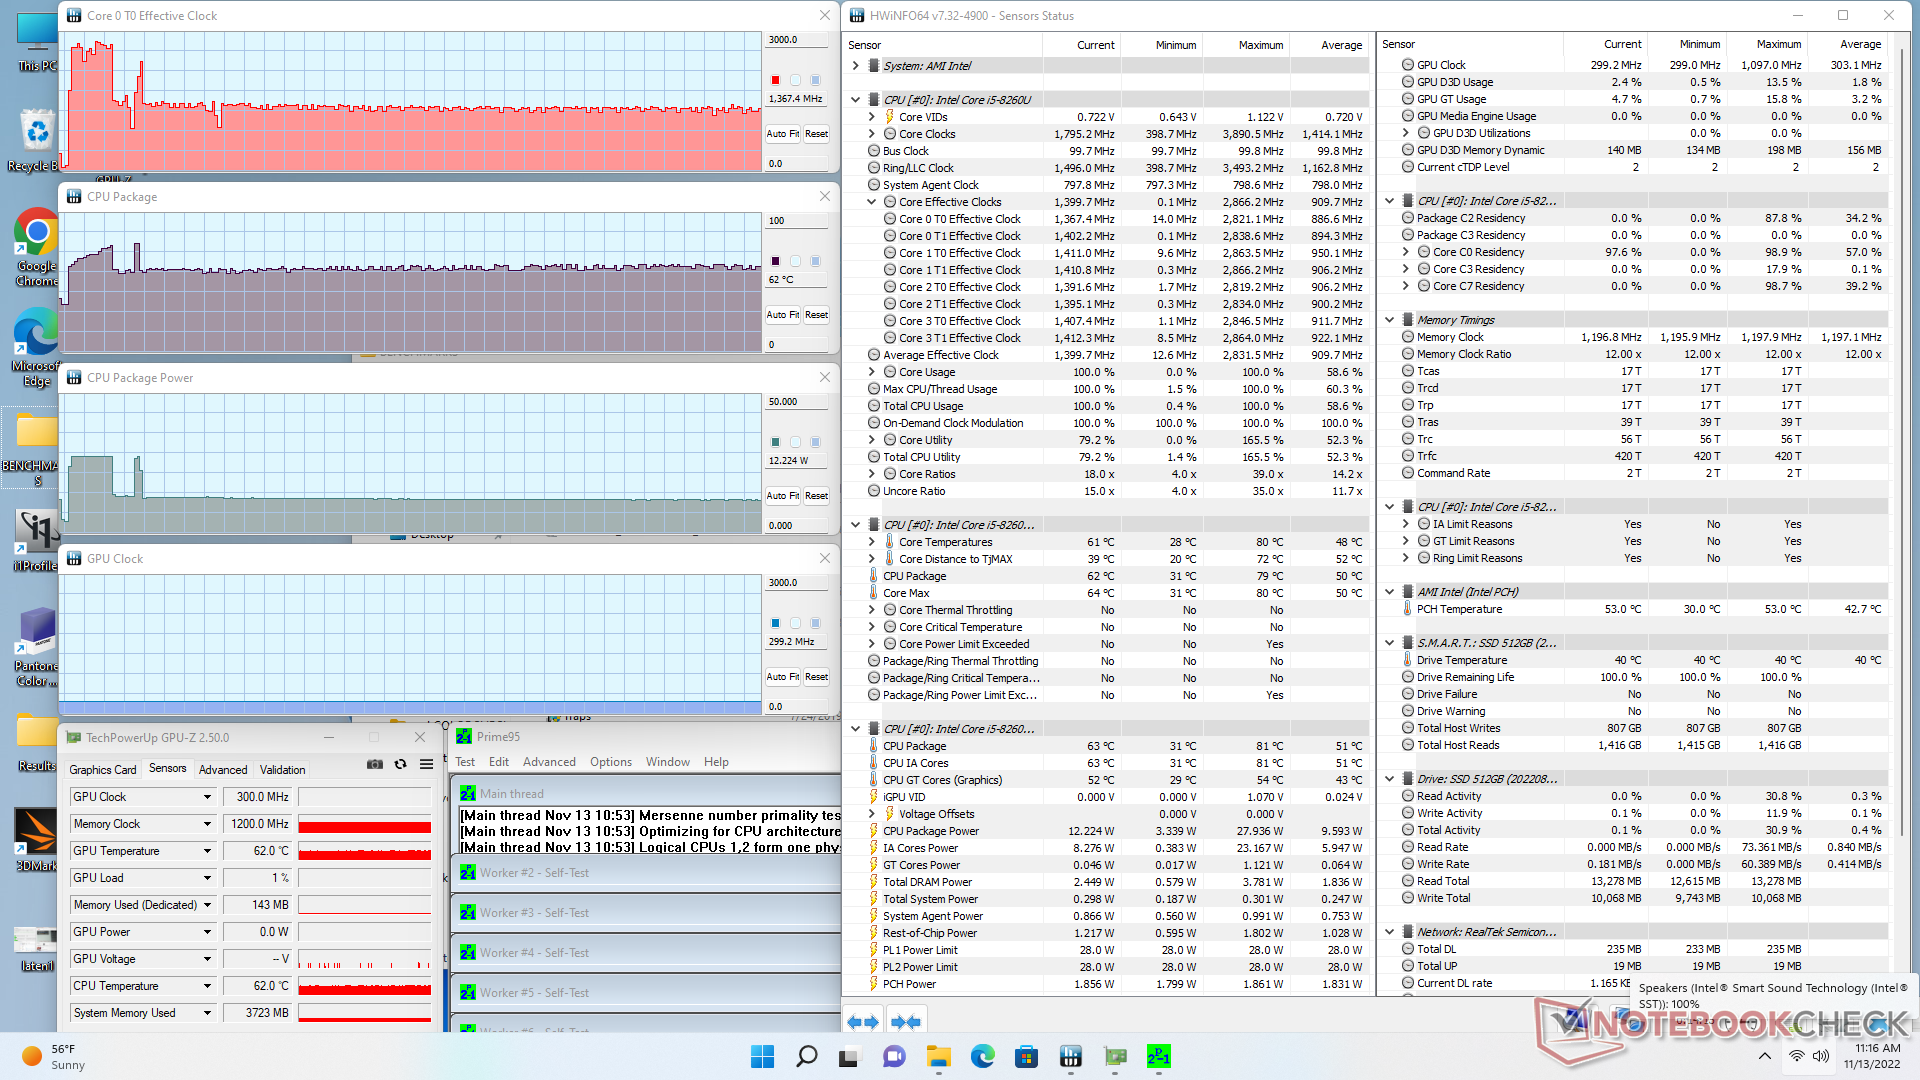
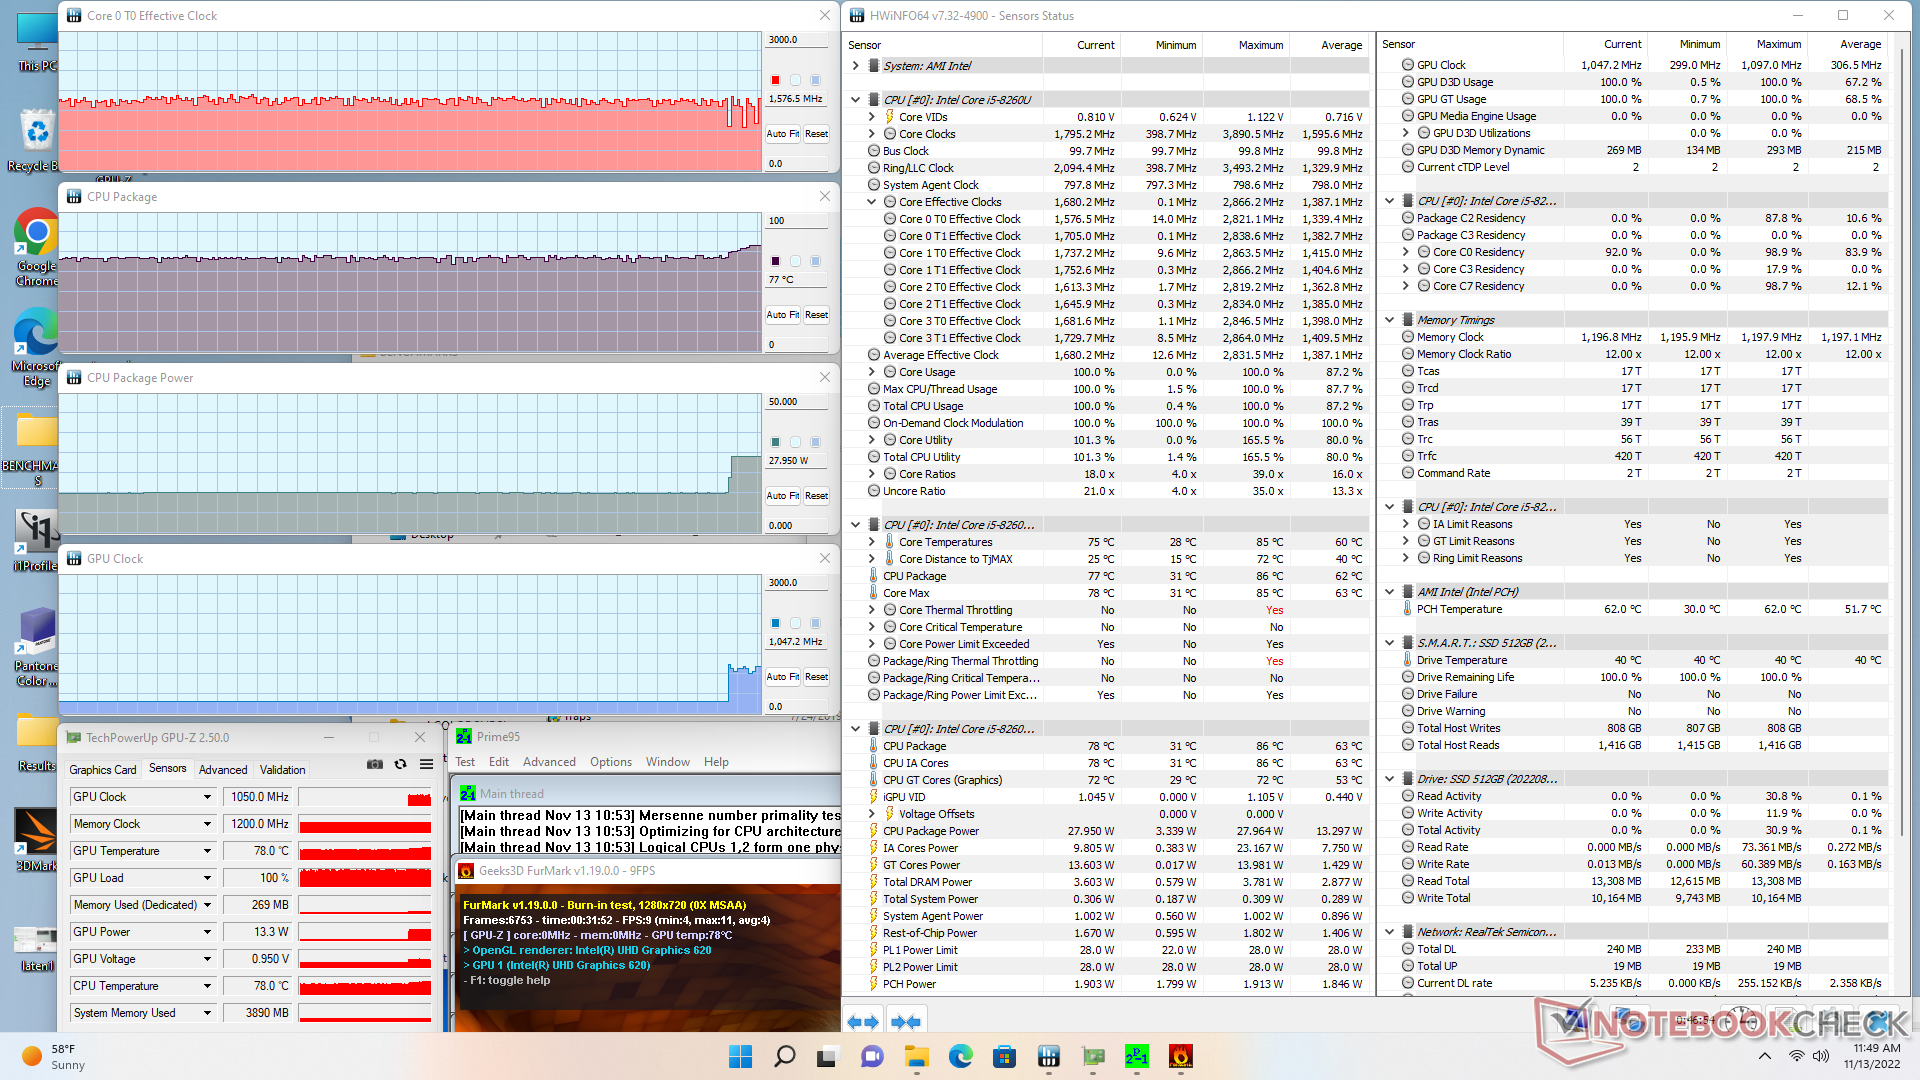
| Clock della CPU (GHz) | Clock della GPU (MHz) | Temperatura media della CPU (°C) | |
| Sistema inattivo | -- | -- | 33 |
| Stress Prime95 | 1,3 | -- | 62 |
| Prime95 + FurMark Stress | 1,6 | 300 | 67 |
| Witcher 3 Stress | ~400 | 1100 | 71 |
Gestione dell'energia
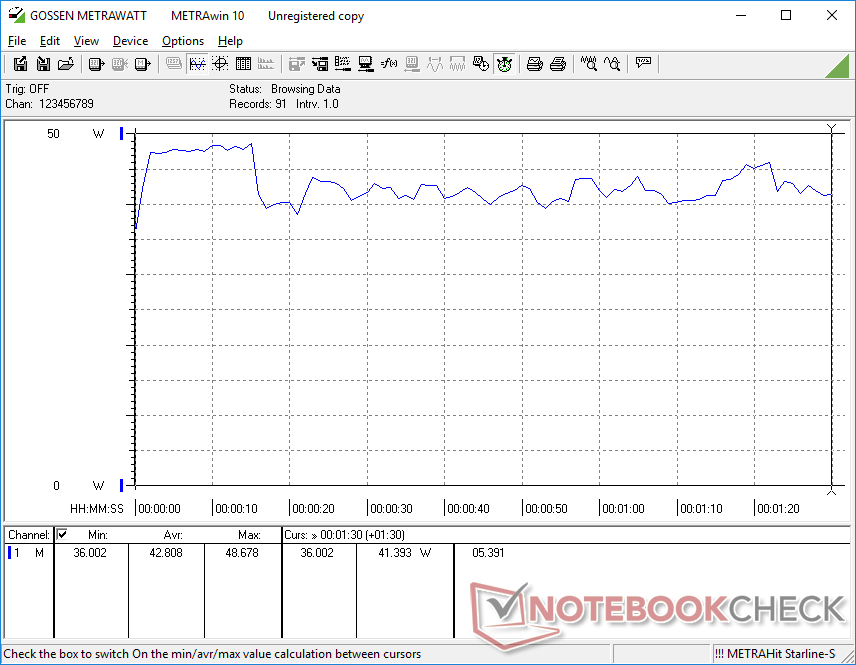
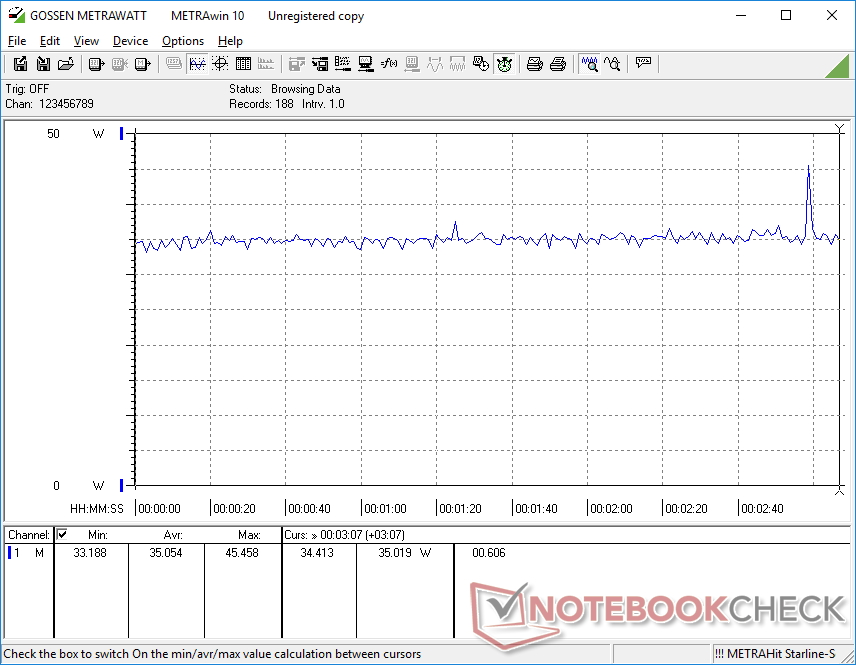
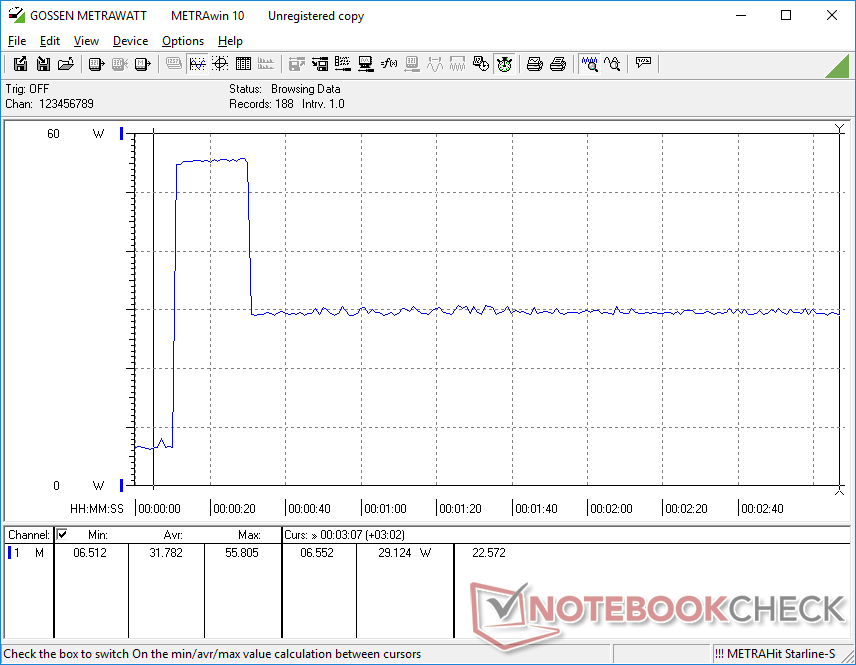
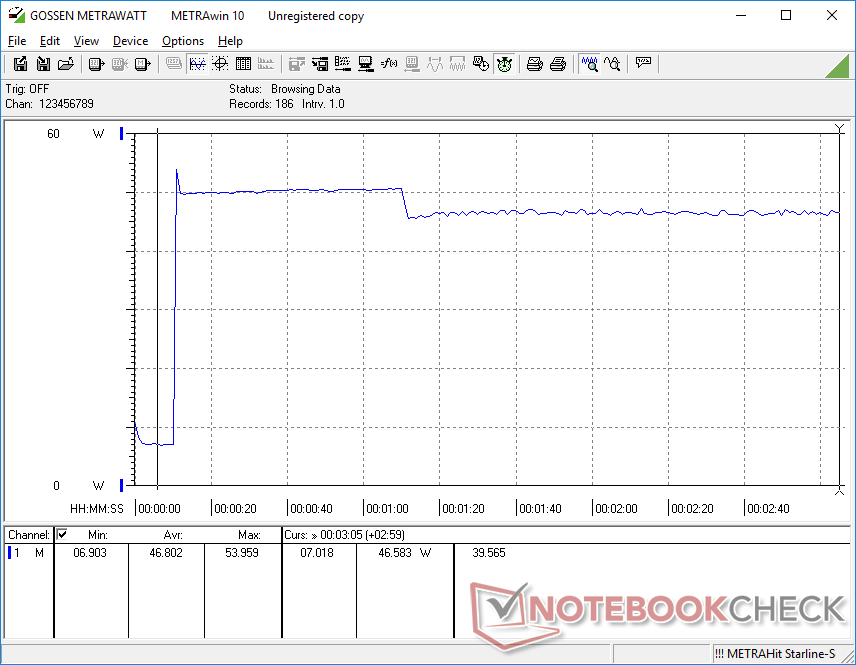
Consumo di energia - Molto poco impegnativo
Il consumo complessivo è inferiore a quello di molti mini PC con CPU più recenti, come l'Intel NUC11TNKi5 e il suo Core i5-1135G7 di 11a generazione. Le prestazioni per watt, tuttavia, favoriscono in modo significativo il secondo. Sebbene gli utenti possano risparmiare qualche watt con il BMax, i mini PC con CPU di nuova generazione, come il già citato NUC, possono offrire prestazioni grafiche più che doppie o prestazioni della CPU superiori del 50%
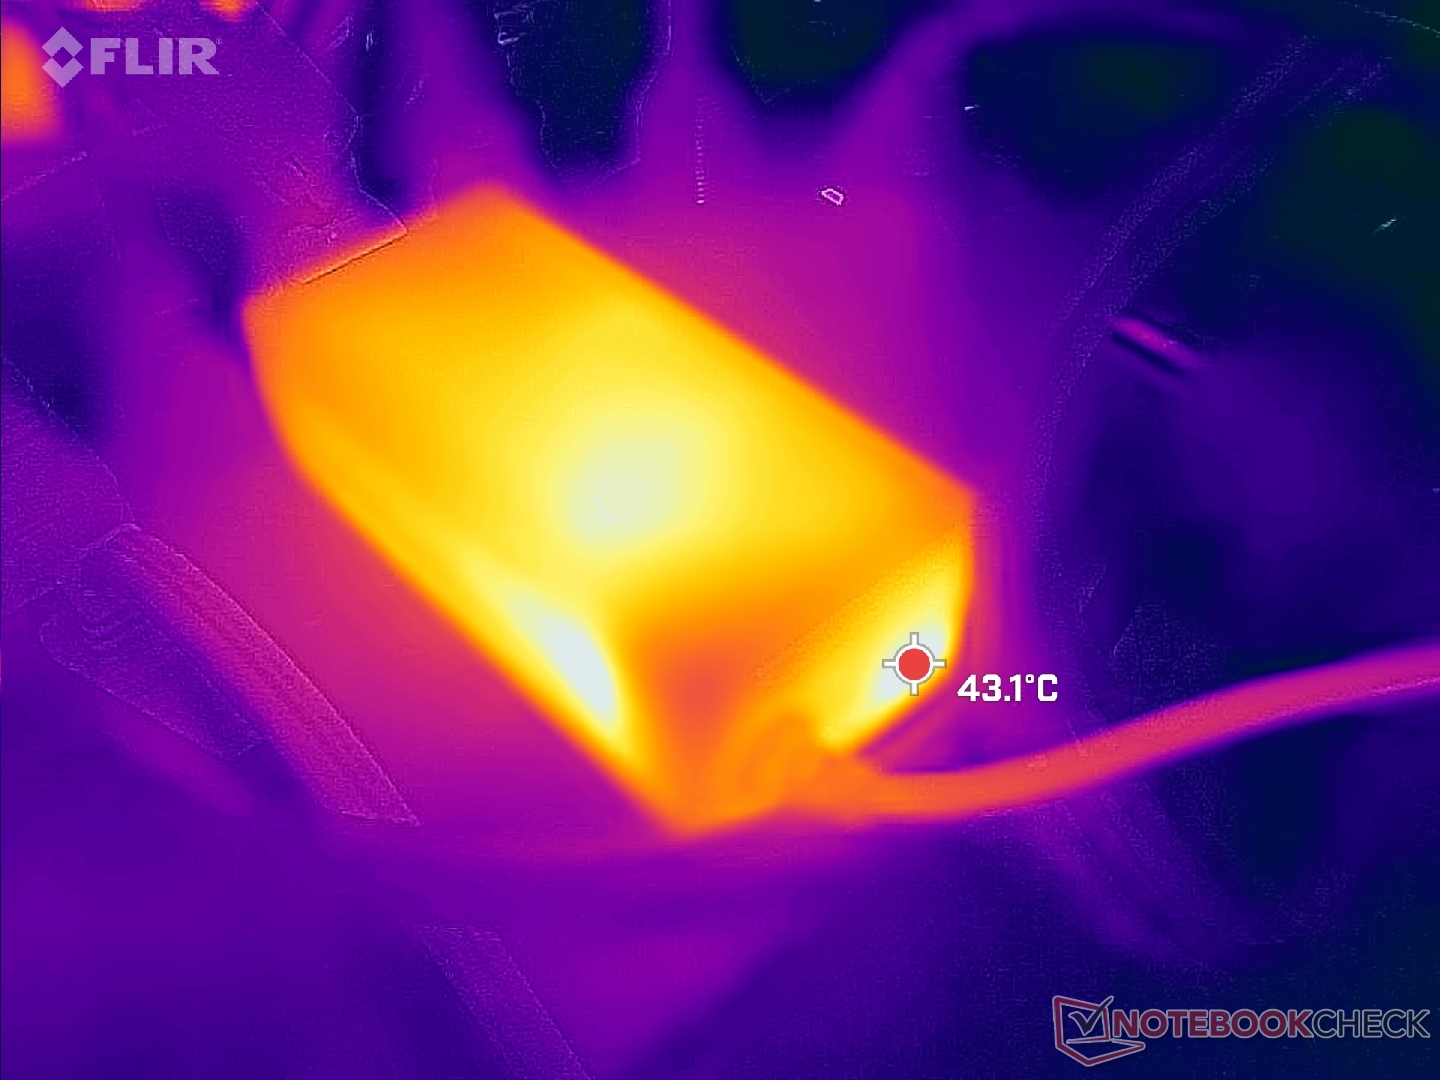
Siamo riusciti a registrare un consumo massimo di 55,9 W dal piccolo adattatore CA da 48 W (~9,8 x 4,3 x 3,7 cm) quando la CPU è al 100%. Questa percentuale è solo temporanea, come mostrano i grafici qui sotto.
| Off / Standby | |
| Idle | |
| Sotto carico |
|
Leggenda:
min: | |
| BMAX B5 Pro G7H8 i5-8260U, UHD Graphics 620, , , x, | Beelink SEi11 Pro i5-11320H, Iris Xe G7 96EUs, Kingston NV1 SNVS/500GCN, , x, | Beelink U59 N5105 Celeron N5105, UHD Graphics (Jasper Lake 24 EU), Silicon Motion AZW 512G NV428, , x, | Beelink SEi8 i3-8109U, Iris Plus Graphics 655, Intel SSD 660p SSDPEKNW512G8, , x, | Beelink SER Pro Ryzen 5 5600H R5 5600H, Vega 7, Kingston NV1 SNVS/500GCN, , x, | Intel NUC11TNKi5 i5-1135G7, Iris Xe G7 80EUs, Transcend M.2 SSD 430S TS512GMTS430S, , x, | |
|---|---|---|---|---|---|---|
| Power Consumption | -47% | 2% | -13% | -15% | -58% | |
| Idle Minimum * (Watt) | 6 | 9.8 -63% | 6.7 -12% | 7.5 -25% | 5.4 10% | 11.5 -92% |
| Idle Average * (Watt) | 6.2 | 10.3 -66% | 8.1 -31% | 7.6 -23% | 8.2 -32% | 12.4 -100% |
| Idle Maximum * (Watt) | 6.3 | 10.5 -67% | 11.6 -84% | 9.2 -46% | 8.3 -32% | 12.9 -105% |
| Load Average * (Watt) | 42.8 | 54.2 -27% | 23.9 44% | 41.1 4% | 49.3 -15% | 40.7 5% |
| Witcher 3 ultra * (Watt) | 35 | 53.1 -52% | 19.1 45% | 46.1 -32% | 43.9 -25% | |
| Load Maximum * (Watt) | 55.8 | 59 -6% | 28.8 48% | 41.4 26% | 50.2 10% | 73.5 -32% |
* ... Meglio usare valori piccoli
Power Consumption Witcher 3 / Stresstest
Power Consumption external Monitor
Pro
Contro
Verdetto - Opzione economica per scopi HTPC di base
Se state cercando di massimizzare il rapporto qualità/prezzo, il BMax B5 Pro dovrebbe essere in cima alla vostra lista. Offre un'ampia unità SSD NVMe da 512 GB, spazio per una seconda unità SSD, 16 GB di RAM rimovibile, Windows 11 Pro già installato con licenza, una ventola silenziosa e un processore paragonabile al Core i7-1065G7 di 10a generazione Core i7-1065G7 il tutto a meno di 300 dollari. Il Core i5-8260U supera qualsiasi Core i3, Celeron, Atom o Ryzen 3, alternative fin troppo comuni in questa fascia di prezzo.
Il BMax B5 Pro è un pacchetto completo a quasi la metà del prezzo di un NUC Intel barebone, senza doversi accontentare di processori Celeron o Atom di basso livello.
Il principale svantaggio di questo modello è la debolezza delle prestazioni grafiche, che non dovrebbe essere un problema in quanto nessuno dovrebbe acquistare il B5 Pro per giocare. Le prestazioni grafiche sono comunque sufficienti per un comodo streaming 4K60.
Ci piacerebbe vedere un maggior numero di porte USB-C, il supporto per USB-C Power Delivery e una porta HDMI 2.0 o migliore nelle future revisioni.
Prezzo e disponibilità
Amazon attualmente la nostra esatta configurazione del BMax B5 Pro è in vendita a 380 dollari USA o a 280 dollari USA dopo aver applicato il codice coupon al momento della pubblicazione.
Price comparison

