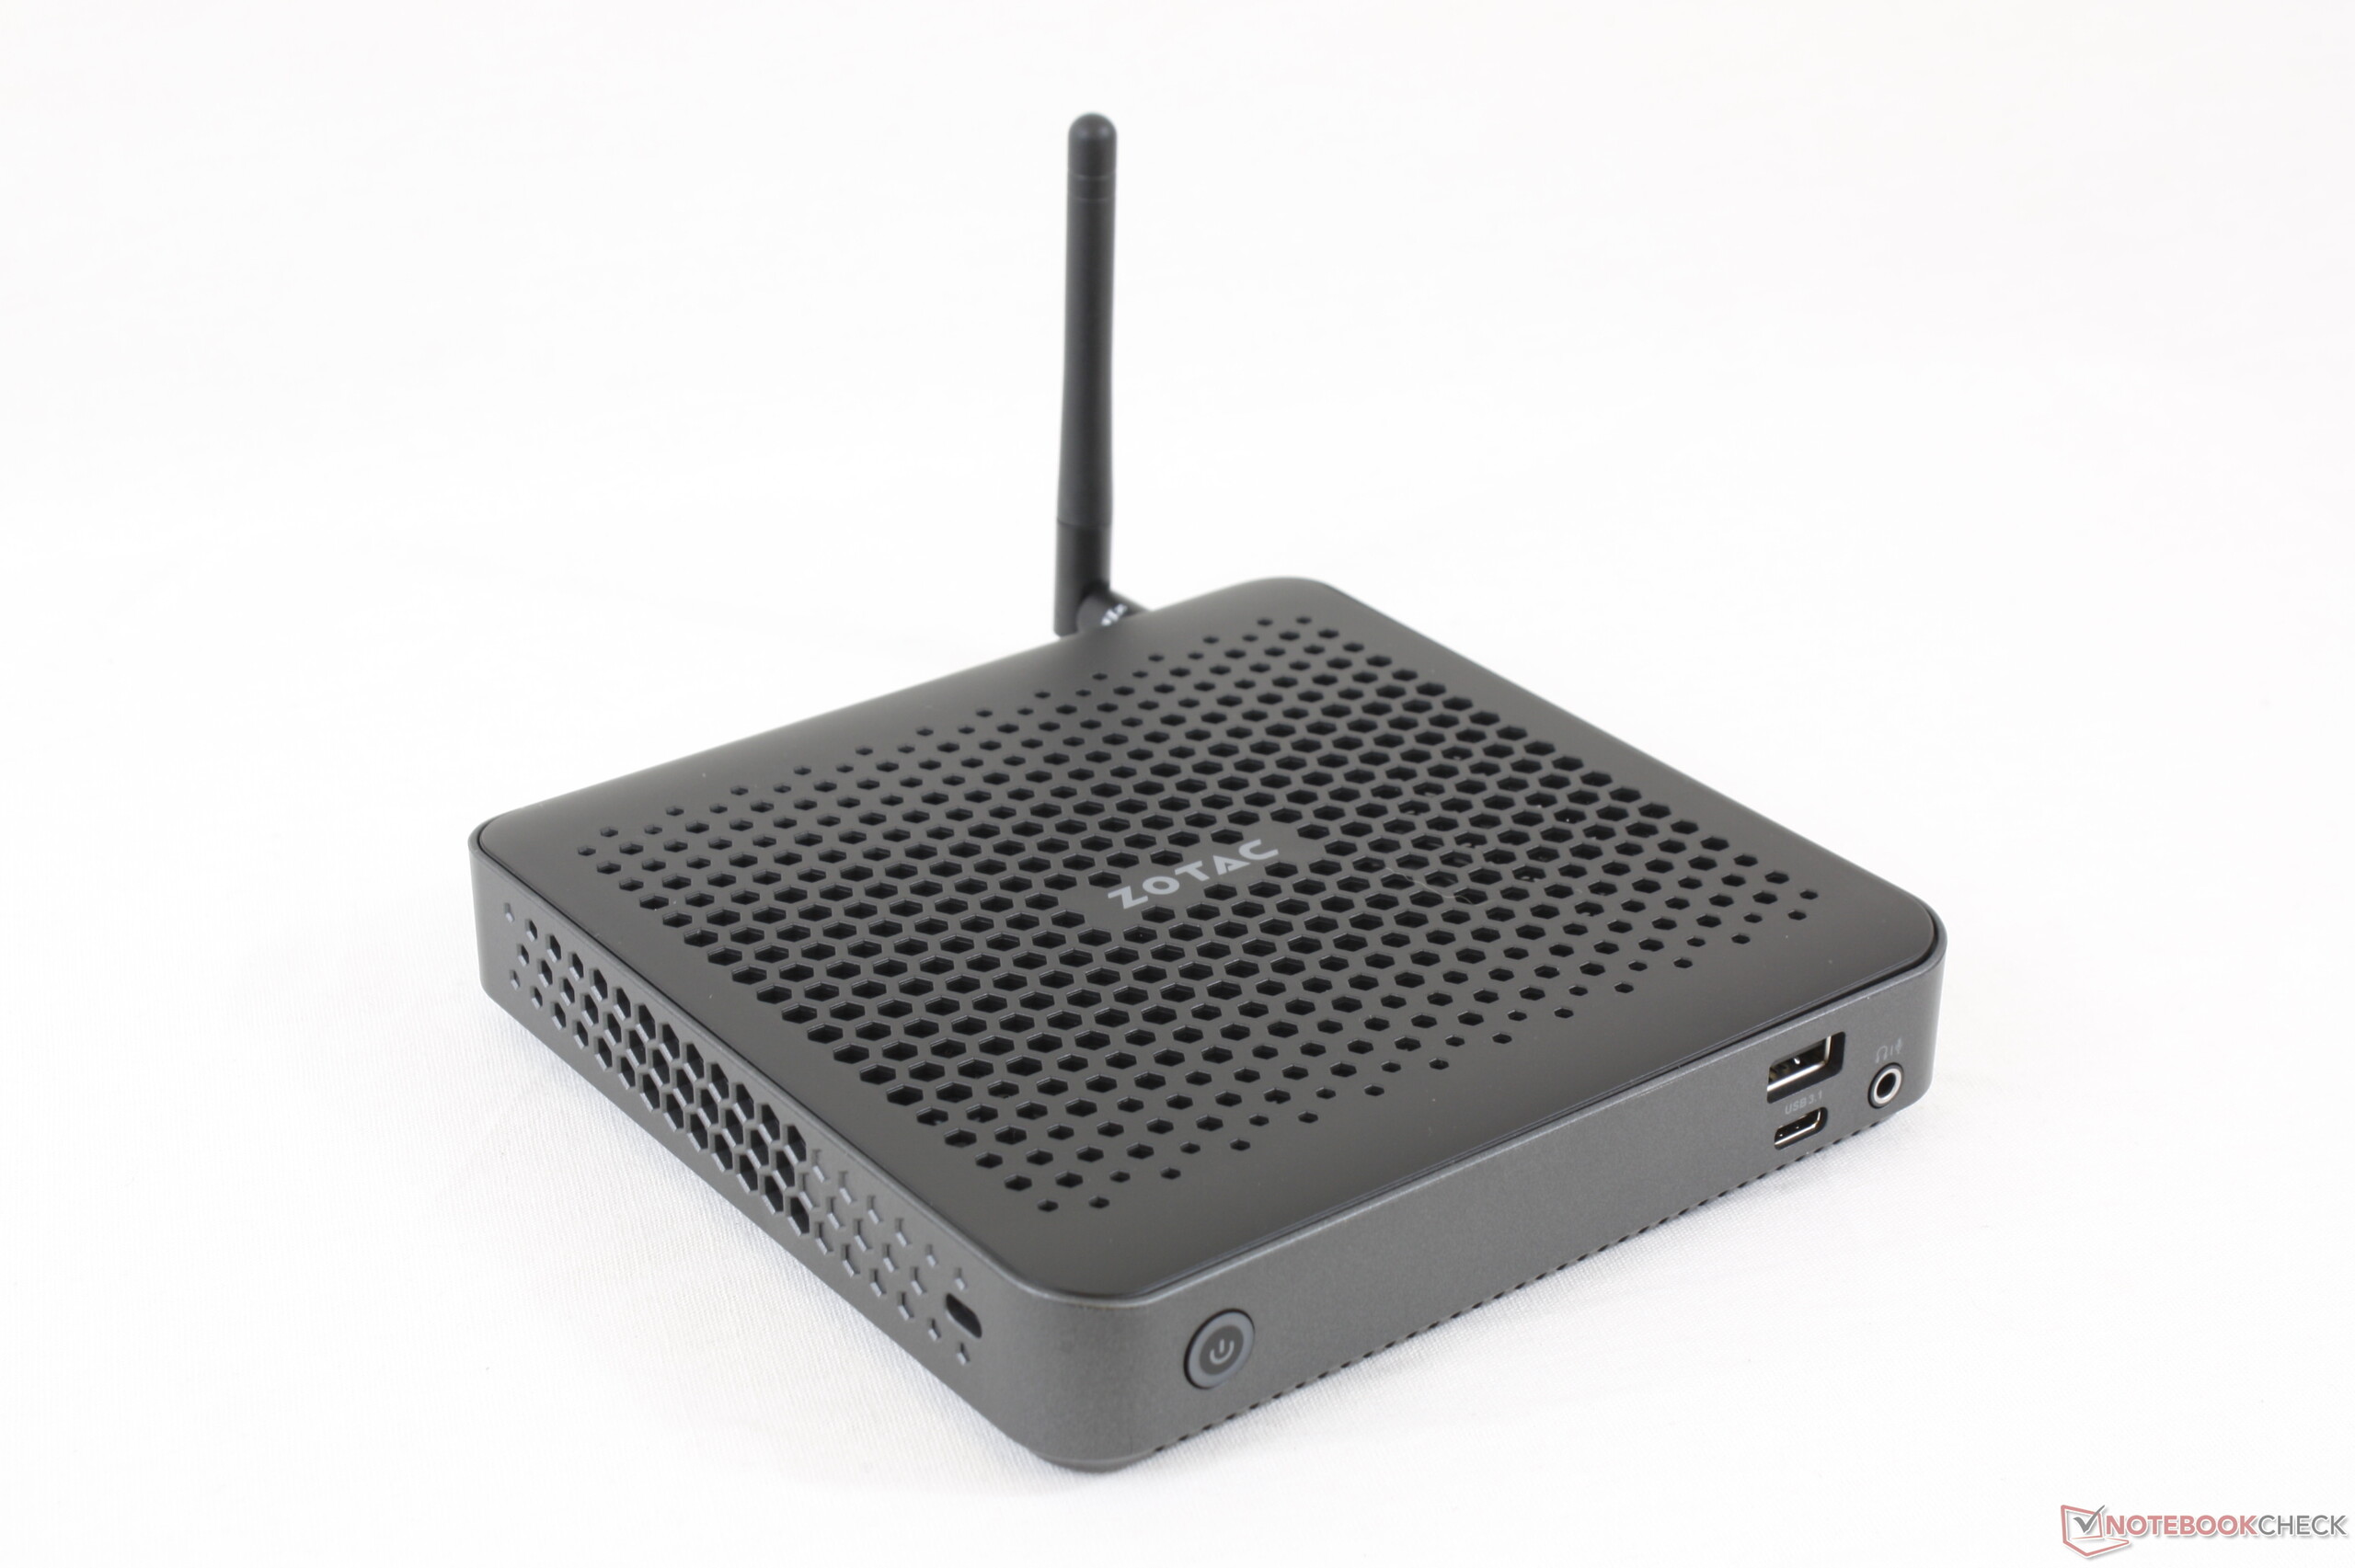
Recensione dello Zotac ZBox Edge MI643: Mini PC sottile e di basso profilo
Punteggio | Data | Modello | Peso | Altezza | Dimensione | Risoluzione | Prezzo |
|---|---|---|---|---|---|---|---|
v (old) | 07/2020 | Zotac ZBox MI643 i5-10210U, UHD Graphics 620 | 550 gr | 28.5 mm | x | ||
v (old) | 02/2020 | Intel NUC10i5FNK i5-10210U, UHD Graphics 620 | 493 gr | 36 mm | 0.00" | 0x0 | |
v (old) | 12/2019 | Lenovo ThinkCentre M90n-1 Nano i5-8265U, UHD Graphics 620 | 499 gr | 22 mm | 0.00" | x | |
v (old) | 05/2019 | Intel NUC8i3CYSM i3-8121U, Radeon RX 540 | 660 gr | 52 mm | x | ||
v (old) | 10/2018 | Chuwi GBox CWI560 Celeron N4100, UHD Graphics 600 | 558 gr | 37.3 mm | x | ||
v (old) | 04/2018 | Intel Hades Canyon NUC8i7HVK i7-8809G, Vega M GH | 1.3 kg | 39 mm | x |

| SD Card Reader | |
| average JPG Copy Test (av. of 3 runs) | |
| Intel Hades Canyon NUC8i7HVK (Toshiba Exceria Pro SDXC 64 GB UHS-II) | |
| Zotac ZBOX-CI660 Nano (Toshiba Exceria Pro SDXC 64 GB UHS-II) | |
| Zotac ZBox MI643 (Toshiba Exceria Pro M501 UHS-II) | |
| Chuwi GBox CWI560 (Toshiba Exceria Pro M501 UHS-II) | |
| maximum AS SSD Seq Read Test (1GB) | |
| Intel Hades Canyon NUC8i7HVK (Toshiba Exceria Pro SDXC 64 GB UHS-II) | |
| Zotac ZBox MI643 (Toshiba Exceria Pro M501 UHS-II) | |
| Zotac ZBOX-CI660 Nano (Toshiba Exceria Pro SDXC 64 GB UHS-II) | |
| Chuwi GBox CWI560 (Toshiba Exceria Pro M501 UHS-II) | |
Cinebench R20: CPU (Multi Core) | CPU (Single Core)
Blender: v2.79 BMW27 CPU
7-Zip 18.03: 7z b 4 -mmt1 | 7z b 4
Geekbench 5.5: Single-Core | Multi-Core
HWBOT x265 Benchmark v2.2: 4k Preset
LibreOffice : 20 Documents To PDF
R Benchmark 2.5: Overall mean
| Cinebench R20 / CPU (Multi Core) | |
| Intel Hades Canyon NUC8i7HVK | |
| Intel NUC10i5FNK | |
| Lenovo ThinkPad X1 Carbon 2020-20UAS04T00 | |
| Media Intel Core i5-10210U (722 - 1820, n=30) | |
| Zotac ZBox MI643 | |
| Chuwi LarkBox 4K Mini PC | |
| Chuwi LapBook Plus | |
| Cinebench R20 / CPU (Single Core) | |
| Lenovo ThinkPad X1 Carbon 2020-20UAS04T00 | |
| Intel NUC10i5FNK | |
| Zotac ZBox MI643 | |
| Media Intel Core i5-10210U (322 - 428, n=30) | |
| Intel Hades Canyon NUC8i7HVK | |
| Chuwi LarkBox 4K Mini PC | |
| Chuwi LapBook Plus | |
| Blender / v2.79 BMW27 CPU | |
| Chuwi LapBook Plus | |
| Chuwi GBox CWI560 | |
| Chuwi LarkBox 4K Mini PC | |
| Zotac ZBox MI643 | |
| Media Intel Core i5-10210U (585 - 1339, n=24) | |
| Lenovo ThinkPad X1 Carbon 2020-20UAS04T00 | |
| Intel NUC10i5FNK | |
| Intel Hades Canyon NUC8i7HVK | |
| 7-Zip 18.03 / 7z b 4 -mmt1 | |
| Lenovo ThinkPad X1 Carbon 2020-20UAS04T00 | |
| Zotac ZBox MI643 | |
| Intel NUC10i5FNK | |
| Media Intel Core i5-10210U (3504 - 4467, n=24) | |
| Intel Hades Canyon NUC8i7HVK | |
| Chuwi GBox CWI560 | |
| Chuwi LarkBox 4K Mini PC | |
| Chuwi LapBook Plus | |
| 7-Zip 18.03 / 7z b 4 | |
| Intel NUC10i5FNK | |
| Intel Hades Canyon NUC8i7HVK | |
| Lenovo ThinkPad X1 Carbon 2020-20UAS04T00 | |
| Media Intel Core i5-10210U (10920 - 21679, n=24) | |
| Zotac ZBox MI643 | |
| Chuwi LarkBox 4K Mini PC | |
| Chuwi GBox CWI560 | |
| Chuwi LapBook Plus | |
| Geekbench 5.5 / Single-Core | |
| Lenovo ThinkPad X1 Carbon 2020-20UAS04T00 | |
| Zotac ZBox MI643 | |
| Intel NUC10i5FNK | |
| Media Intel Core i5-10210U (949 - 1133, n=27) | |
| Chuwi LarkBox 4K Mini PC | |
| Geekbench 5.5 / Multi-Core | |
| Lenovo ThinkPad X1 Carbon 2020-20UAS04T00 | |
| Zotac ZBox MI643 | |
| Intel NUC10i5FNK | |
| Media Intel Core i5-10210U (2079 - 4256, n=27) | |
| Chuwi LarkBox 4K Mini PC | |
| HWBOT x265 Benchmark v2.2 / 4k Preset | |
| Intel Hades Canyon NUC8i7HVK | |
| Intel NUC10i5FNK | |
| Lenovo ThinkPad X1 Carbon 2020-20UAS04T00 | |
| Media Intel Core i5-10210U (2.36 - 6.28, n=24) | |
| Zotac ZBox MI643 | |
| Chuwi LarkBox 4K Mini PC | |
| Chuwi LapBook Plus | |
| Chuwi GBox CWI560 | |
| LibreOffice / 20 Documents To PDF | |
| Chuwi LarkBox 4K Mini PC | |
| Media Intel Core i5-10210U (49.6 - 80.3, n=18) | |
| Zotac ZBox MI643 | |
| Lenovo ThinkPad X1 Carbon 2020-20UAS04T00 | |
| R Benchmark 2.5 / Overall mean | |
| Media Intel Core i5-10210U (0.658 - 0.901, n=24) | |
| Intel NUC10i5FNK | |
| Lenovo ThinkPad X1 Carbon 2020-20UAS04T00 | |
| Zotac ZBox MI643 | |
Cinebench R20: CPU (Multi Core) | CPU (Single Core)
Blender: v2.79 BMW27 CPU
7-Zip 18.03: 7z b 4 -mmt1 | 7z b 4
Geekbench 5.5: Single-Core | Multi-Core
HWBOT x265 Benchmark v2.2: 4k Preset
LibreOffice : 20 Documents To PDF
R Benchmark 2.5: Overall mean
* ... Meglio usare valori piccoli
| PCMark 8 Home Score Accelerated v2 | 3567 punti | |
| PCMark 8 Work Score Accelerated v2 | 4816 punti | |
| PCMark 10 Score | 4244 punti | |
Aiuto | ||
| DPC Latencies / LatencyMon - interrupt to process latency (max), Web, Youtube, Prime95 | |
| Dell Latitude 9510 2-in-1 | |
| HP Envy x360 13-ay0010nr | |
| HP ProBook 455 G7-175W8EA | |
| Lenovo ThinkPad X1 Carbon 2020-20UAS04T00 | |
| Dell Latitude 7310 | |
| Zotac ZBox MI643 | |
* ... Meglio usare valori piccoli
| Zotac ZBox MI643 Lexar NM610 1TB | Intel NUC10i5FNK Kingston RBUSNS8154P3256GJ1 | Lenovo ThinkCentre M90n-1 Nano Samsung SSD PM981 MZVLB512HAJQ | Chuwi GBox CWI560 SanDisk DA4064 | Intel Hades Canyon NUC8i7HVK Intel Optane 120 GB SSDPEK1W120GA | |
|---|---|---|---|---|---|
| CrystalDiskMark 5.2 / 6 | -27% | 65% | -83% | -2% | |
| Write 4K (MB/s) | 214.1 | 58.4 -73% | 130 -39% | 38 -82% | 133.7 -38% |
| Read 4K (MB/s) | 62.1 | 30.24 -51% | 45.61 -27% | 23.84 -62% | 178.6 188% |
| Write Seq (MB/s) | 1664 | 773 -54% | 226.7 -86% | 608 -63% | |
| Read Seq (MB/s) | 1797 | 712 -60% | 271.8 -85% | 1428 -21% | |
| Write 4K Q32T1 (MB/s) | 421.8 | 448.5 6% | 365.3 -13% | 44.74 -89% | 323.6 -23% |
| Read 4K Q32T1 (MB/s) | 512 | 391.4 -24% | 350.2 -32% | 53.2 -90% | 282.3 -45% |
| Write Seq Q32T1 (MB/s) | 564 | 914 62% | 2986 429% | 129.4 -77% | 627 11% |
| Read Seq Q32T1 (MB/s) | 2073 | 1583 -24% | 3565 72% | 189.4 -91% | 1521 -27% |
| Write 4K Q8T8 (MB/s) | 402.3 | 368.7 | |||
| Read 4K Q8T8 (MB/s) | 680 | 790 |

Disk Throttling: DiskSpd Read Loop, Queue Depth 8
| 3DMark 11 Performance | 2082 punti | |
| 3DMark Cloud Gate Standard Score | 8687 punti | |
| 3DMark Fire Strike Score | 1169 punti | |
| 3DMark Time Spy Score | 462 punti | |
Aiuto | ||
| basso | medio | alto | ultra | |
|---|---|---|---|---|
| Dota 2 Reborn (2015) | 73.8 | 46 | 21.5 | 19.2 |
| X-Plane 11.11 (2018) | 22.3 | 14.8 | 13.2 |
| Zotac ZBox MI643 UHD Graphics 620, i5-10210U, Lexar NM610 1TB | Intel Hades Canyon NUC8i7HVK Vega M GH, i7-8809G, Intel Optane 120 GB SSDPEK1W120GA | HP EliteBook x360 1030 G4 7YL44EA UHD Graphics 620, i7-8565U, WDC PC SN520 SDAPNUW-512G | Chuwi LarkBox 4K Mini PC UHD Graphics 600, Celeron J4115, 128 GB eMMC Flash | Intel Skull Canyon NUC6i7KYK Iris Pro Graphics 580, 6770HQ, Samsung SSD 850 EVO m.2 120GB | |
|---|---|---|---|---|---|
| Noise | -11% | -5% | -17% | -19% | |
| off /ambiente * (dB) | 26.1 | 28.7 -10% | 30.3 -16% | 26 -0% | 29.5 -13% |
| Idle Minimum * (dB) | 27.5 | 29 -5% | 30.3 -10% | 26 5% | 31.6 -15% |
| Idle Average * (dB) | 27.5 | 29 -5% | 30.3 -10% | 26 5% | 32.2 -17% |
| Idle Maximum * (dB) | 27.5 | 29 -5% | 30.3 -10% | 43.3 -57% | 32.3 -17% |
| Load Average * (dB) | 28.9 | 36 -25% | 31.2 -8% | 43.3 -50% | 43 -49% |
| Load Maximum * (dB) | 42 | 49.4 -18% | 32.8 22% | 43.5 -4% | 43.2 -3% |
| Witcher 3 ultra * (dB) | 42 |
* ... Meglio usare valori piccoli
Rumorosità
| Idle |
| 27.5 / 27.5 / 27.5 dB(A) |
| Sotto carico |
| 28.9 / 42 dB(A) |
 | ||
30 dB silenzioso 40 dB(A) udibile 50 dB(A) rumoroso |
||
min: | ||
| Off / Standby | |
| Idle | |
| Sotto carico |
|
Leggenda:
min: | |
| Zotac ZBox MI643 i5-10210U, UHD Graphics 620, Lexar NM610 1TB, , x, | Intel NUC10i5FNK i5-10210U, UHD Graphics 620, Kingston RBUSNS8154P3256GJ1, , 0x0, 0" | Lenovo ThinkCentre M90n-1 Nano i5-8265U, UHD Graphics 620, Samsung SSD PM981 MZVLB512HAJQ, , x, 0" | Chuwi GBox CWI560 Celeron N4100, UHD Graphics 600, SanDisk DA4064, , x, | Intel Skull Canyon NUC6i7KYK 6770HQ, Iris Pro Graphics 580, Samsung SSD 850 EVO m.2 120GB, , x, 0" | |
|---|---|---|---|---|---|
| Power Consumption | -34% | 36% | 76% | -59% | |
| Idle Minimum * (Watt) | 7.5 | 4.4 41% | 1.9 75% | 14.8 -97% | |
| Idle Average * (Watt) | 9.2 | 15.7 -71% | 4.4 52% | 2 78% | 15.7 -71% |
| Idle Maximum * (Watt) | 9.6 | 4.7 51% | 2.9 70% | 15.8 -65% | |
| Load Average * (Watt) | 34.4 | 27.7 19% | 8.6 75% | 62.7 -82% | |
| Load Maximum * (Watt) | 60.6 | 58.6 3% | 49.9 18% | 9.5 84% | 48.5 20% |
* ... Meglio usare valori piccoli
Pro
Contro
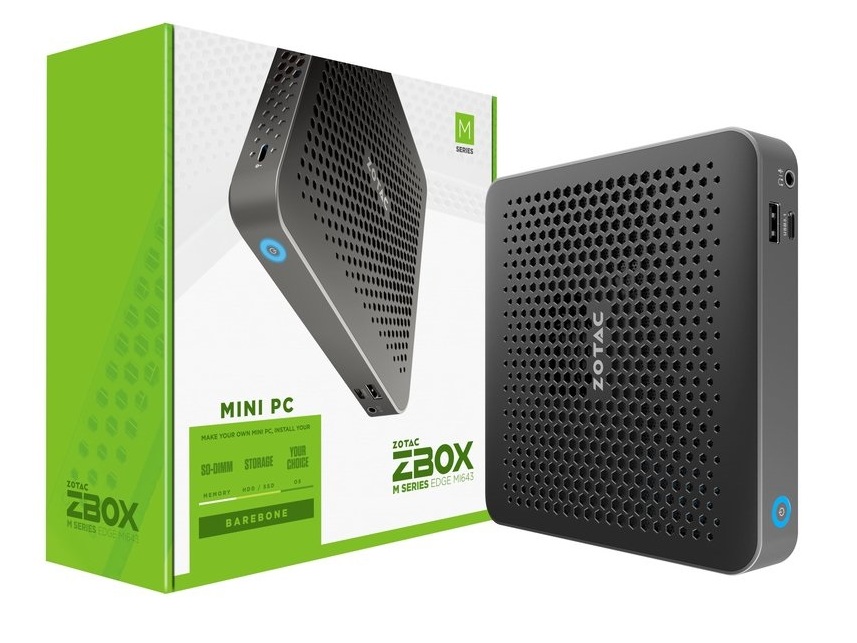
Le ragioni principali per possedere uno ZBox Edge MI643 sono il suo design sottile, le ventole silenziose e la RAM e lo storage facilmente aggiornabili. Il ThinkCentre M90n-1 Nano Lenovo concorrente è ancora più piccolo del nostro Zotac, ma è privo di RAM aggiornabile che alcuni utenti potrebbero trovare preziosa.
Gli utenti non dovrebbero guardare verso l'Edge MI643 se cercano prestazioni grezze o velocità wireless elevate. Il processore qui funziona più lentamente del previsto e il wireless è limitato al solo Wi-Fi 5 1x1. Per il resto, si tratta di un affidabile mini PC "imposta e dimentica" che è abbastanza sottile e leggero da poter essere appeso alle pareti o nascosto dietro spazi ristretti.
Price comparison
