Recensione della GPU Desktop Zotac GeForce RTX 2070 AMP Extreme
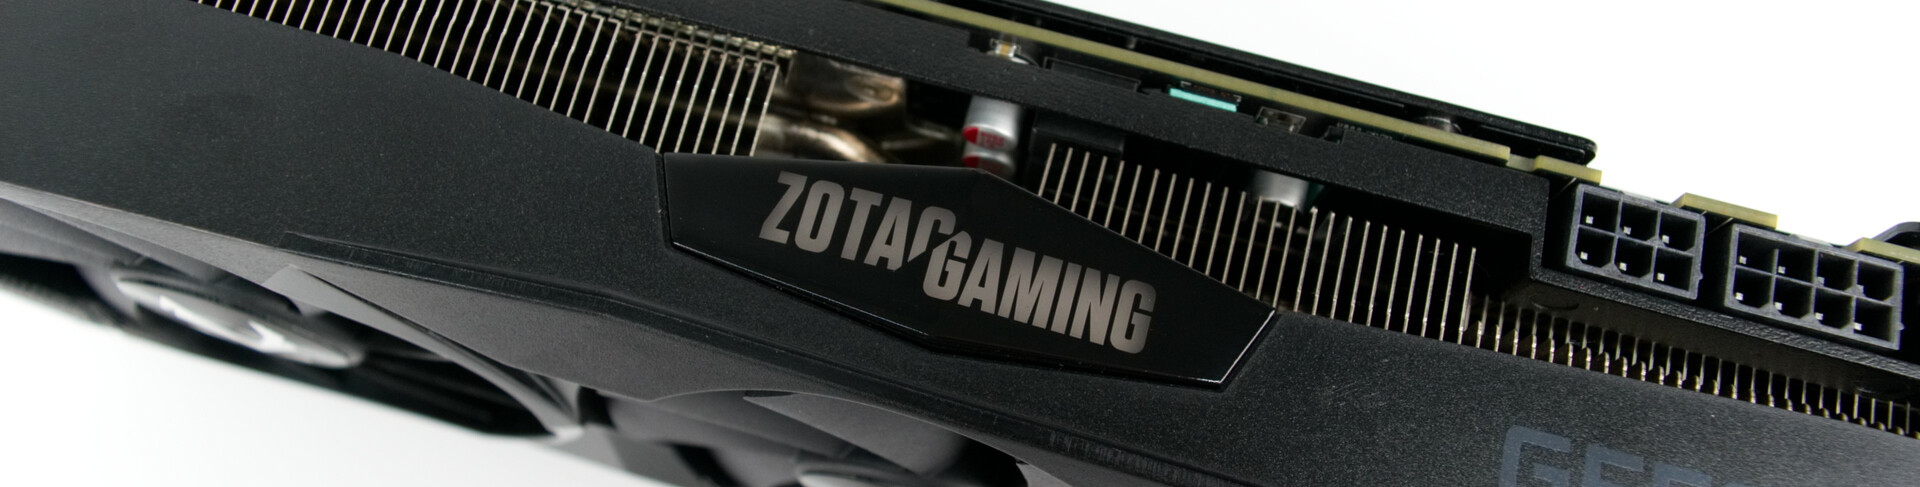
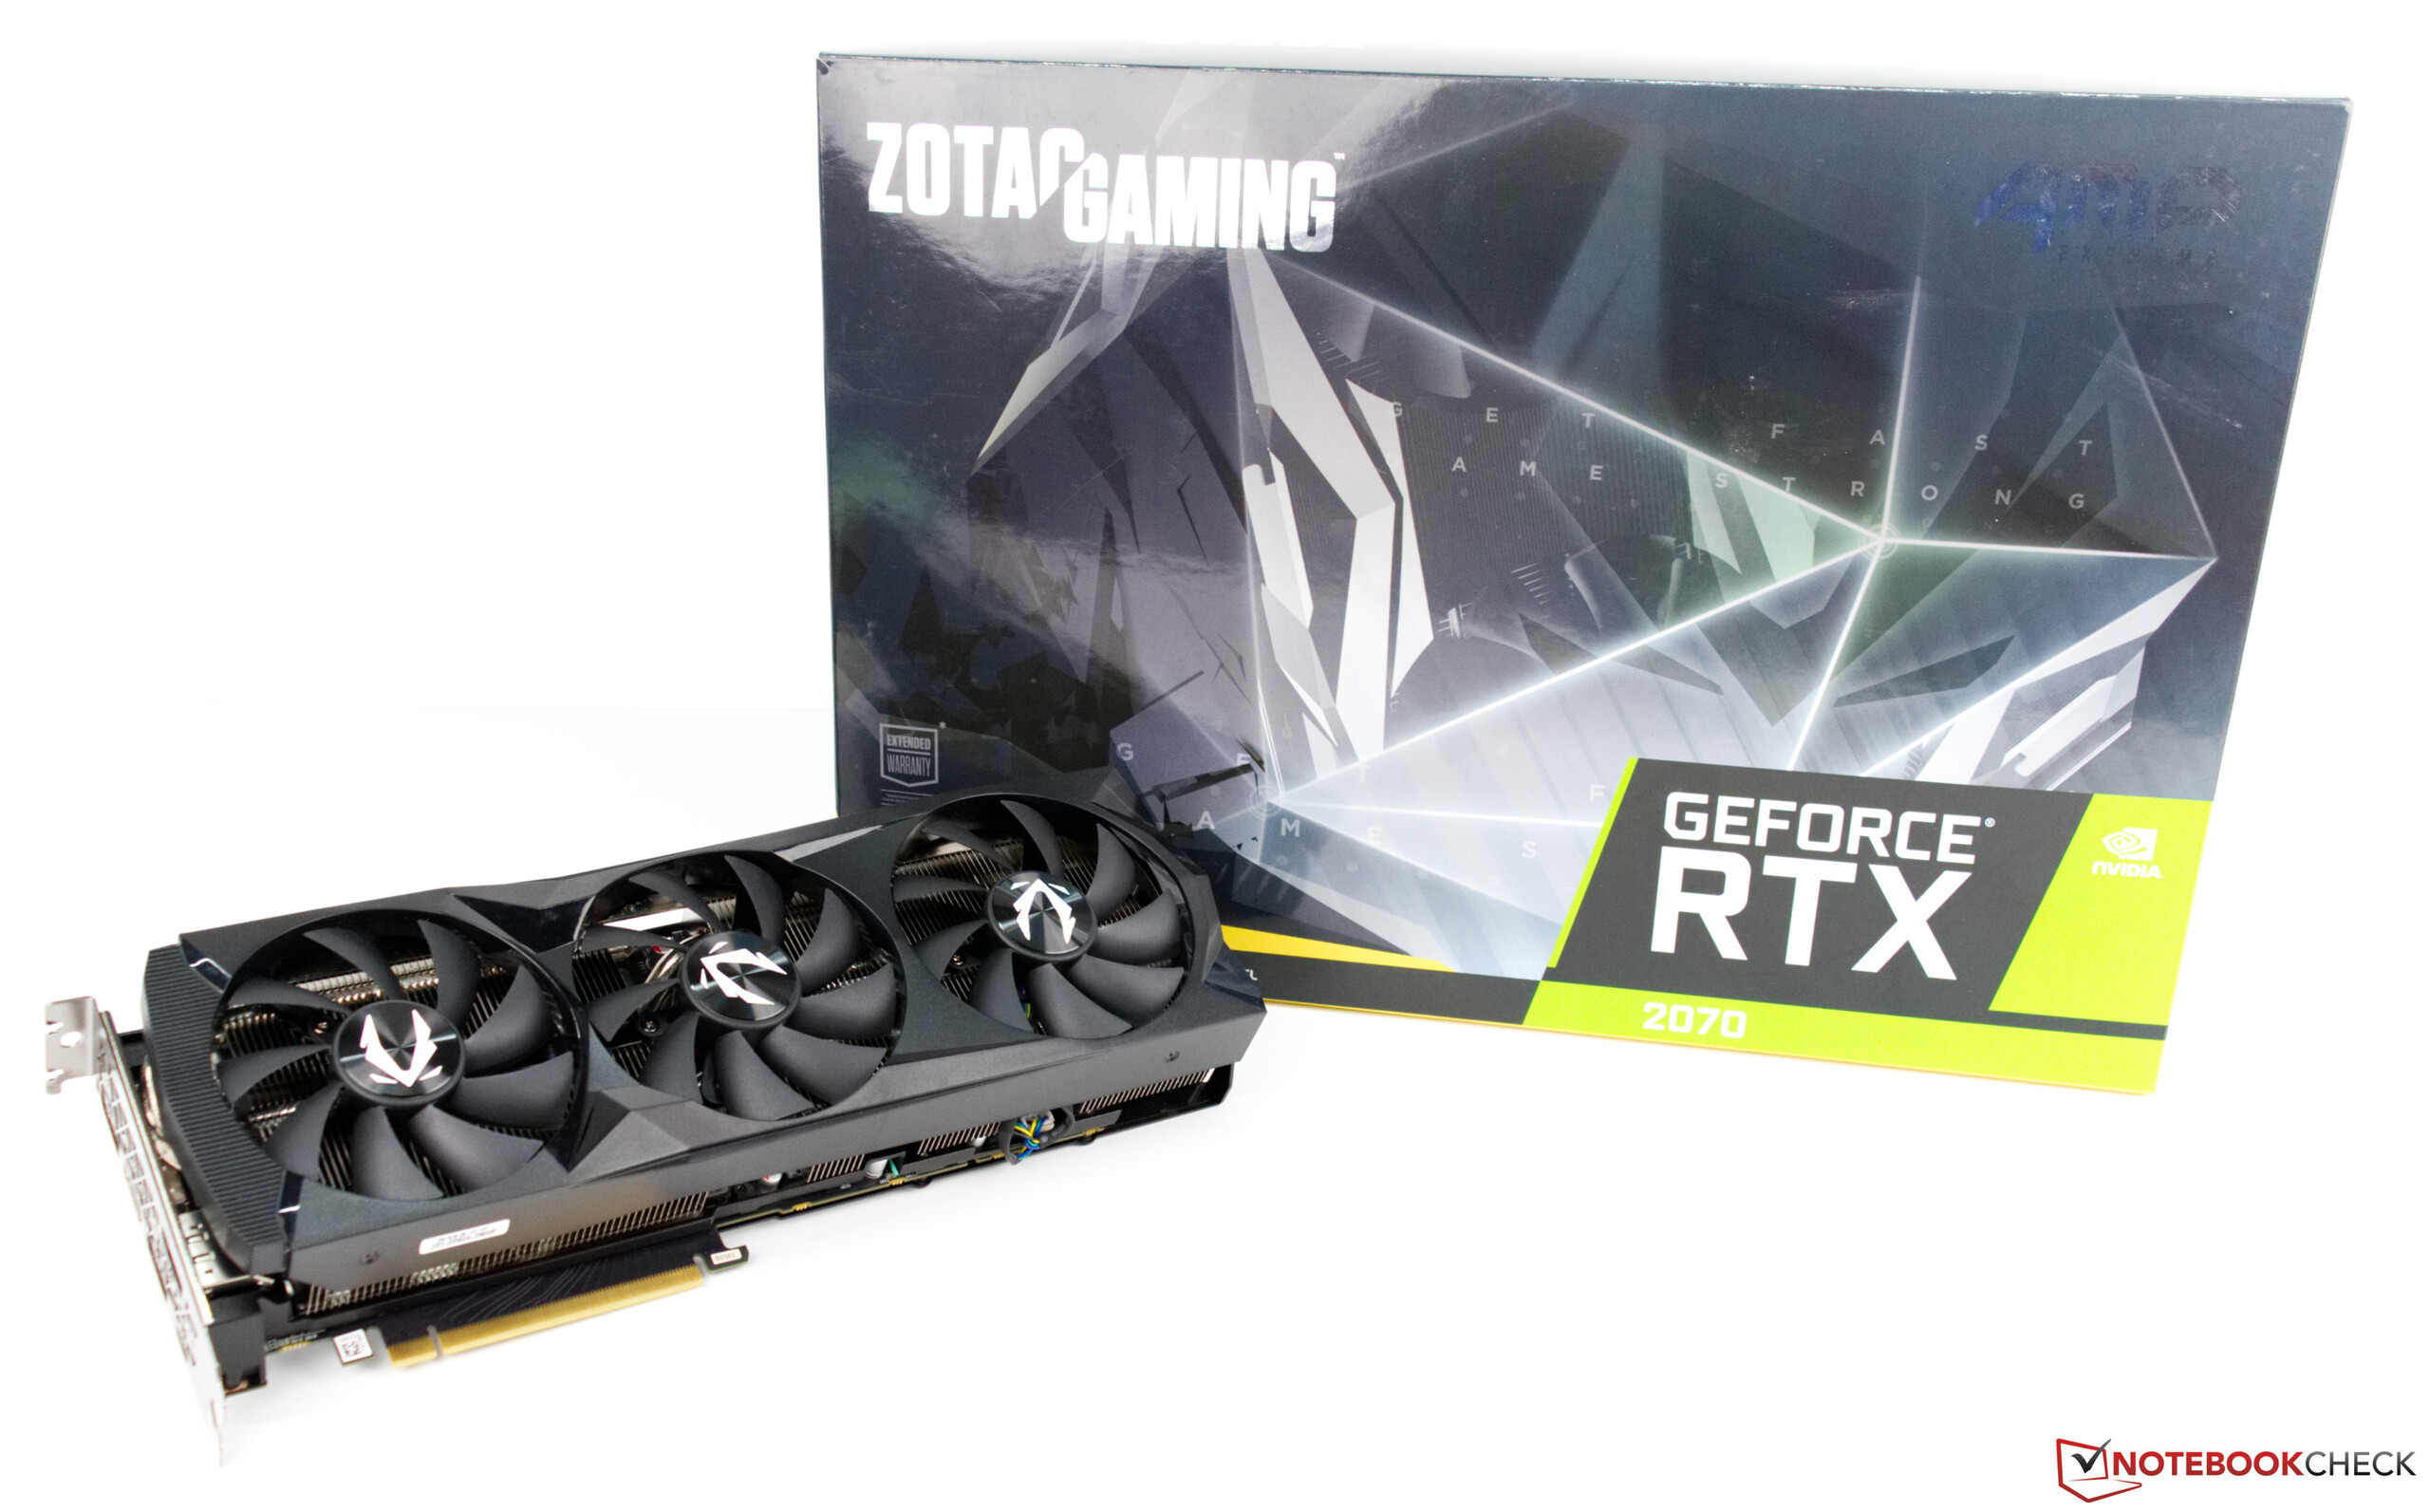
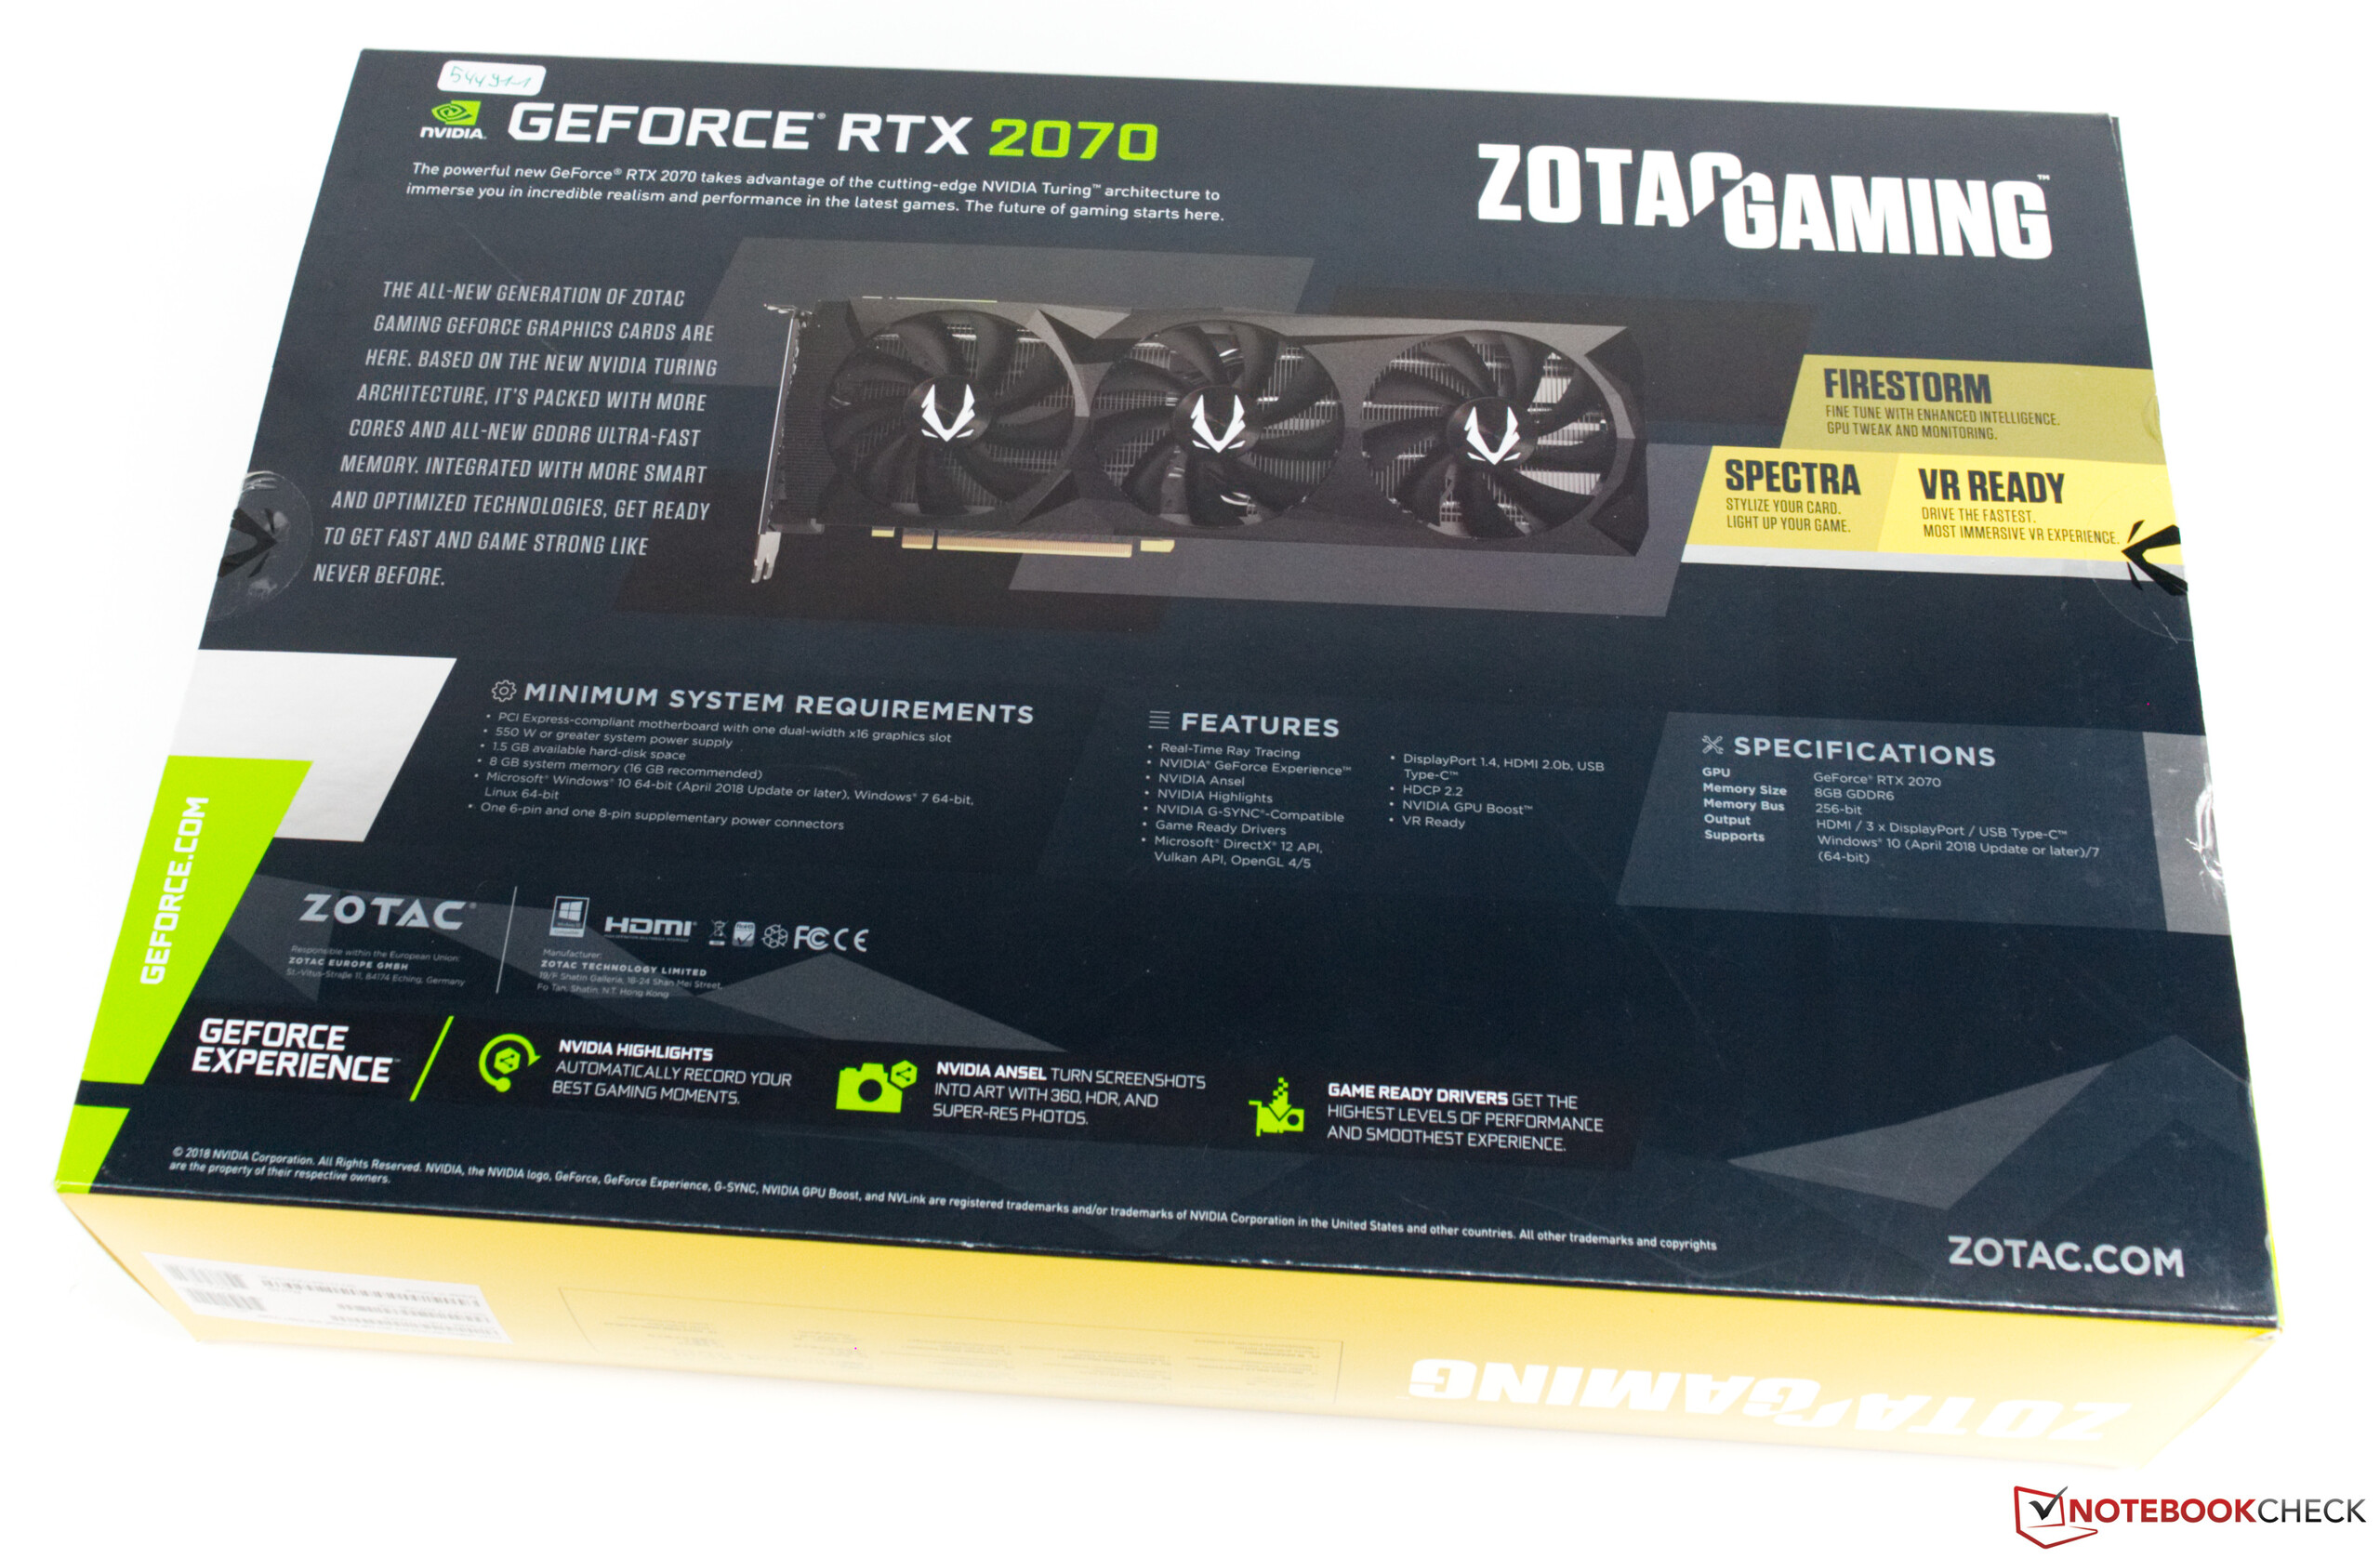
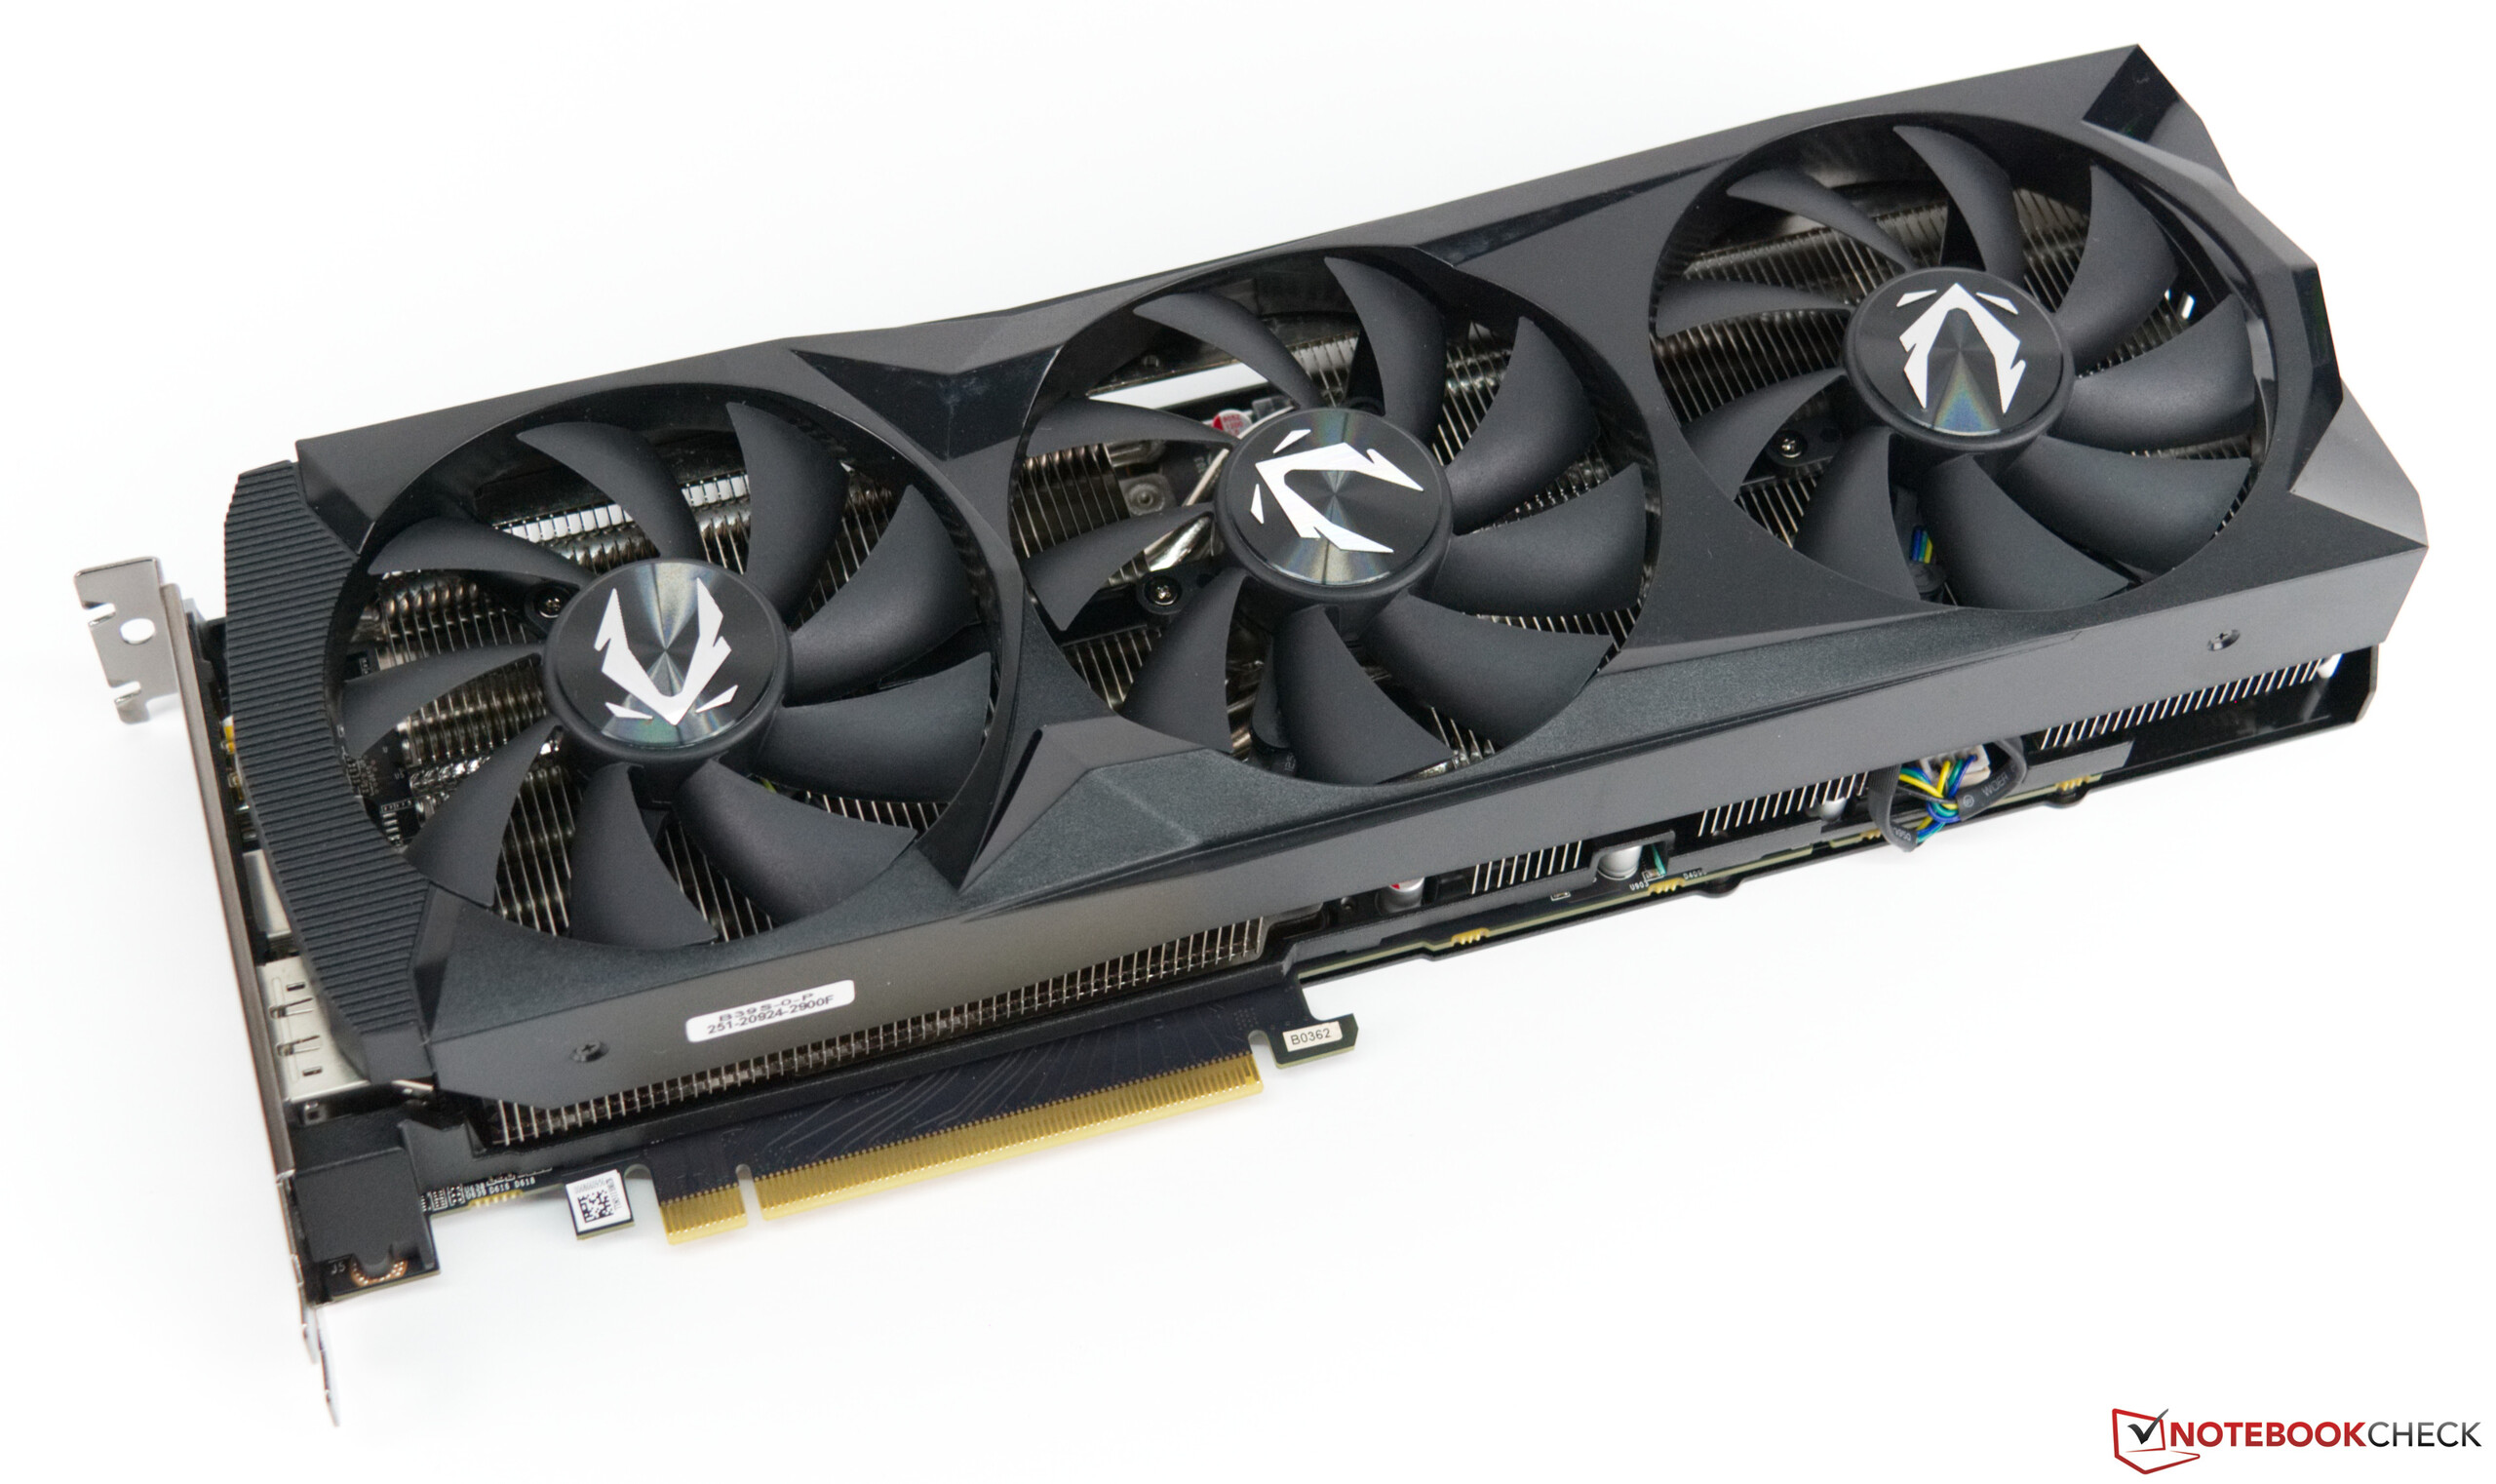
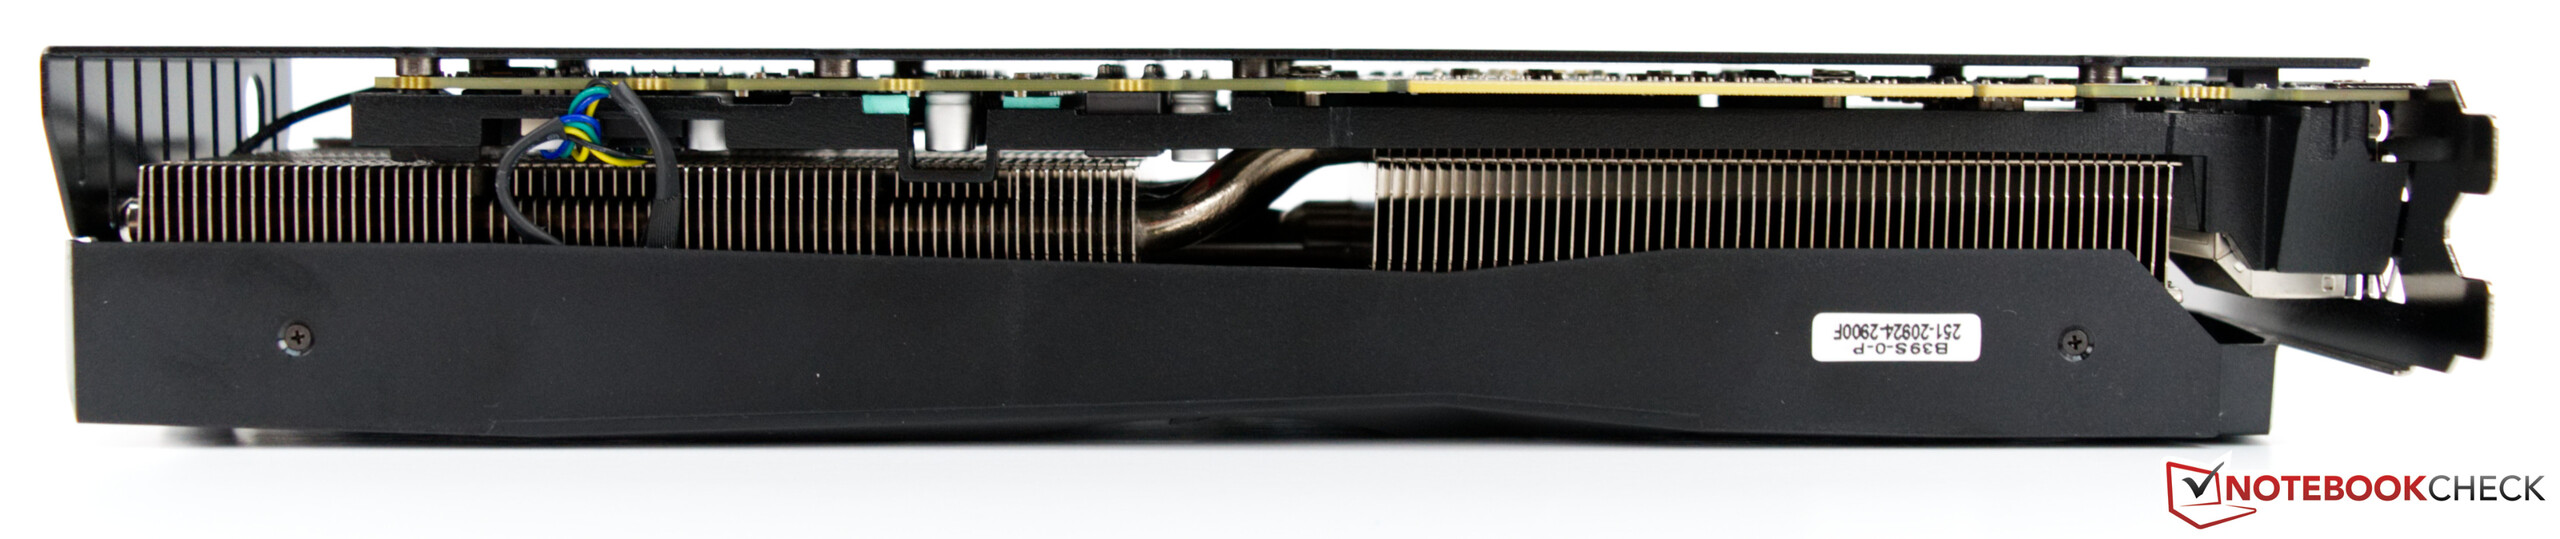
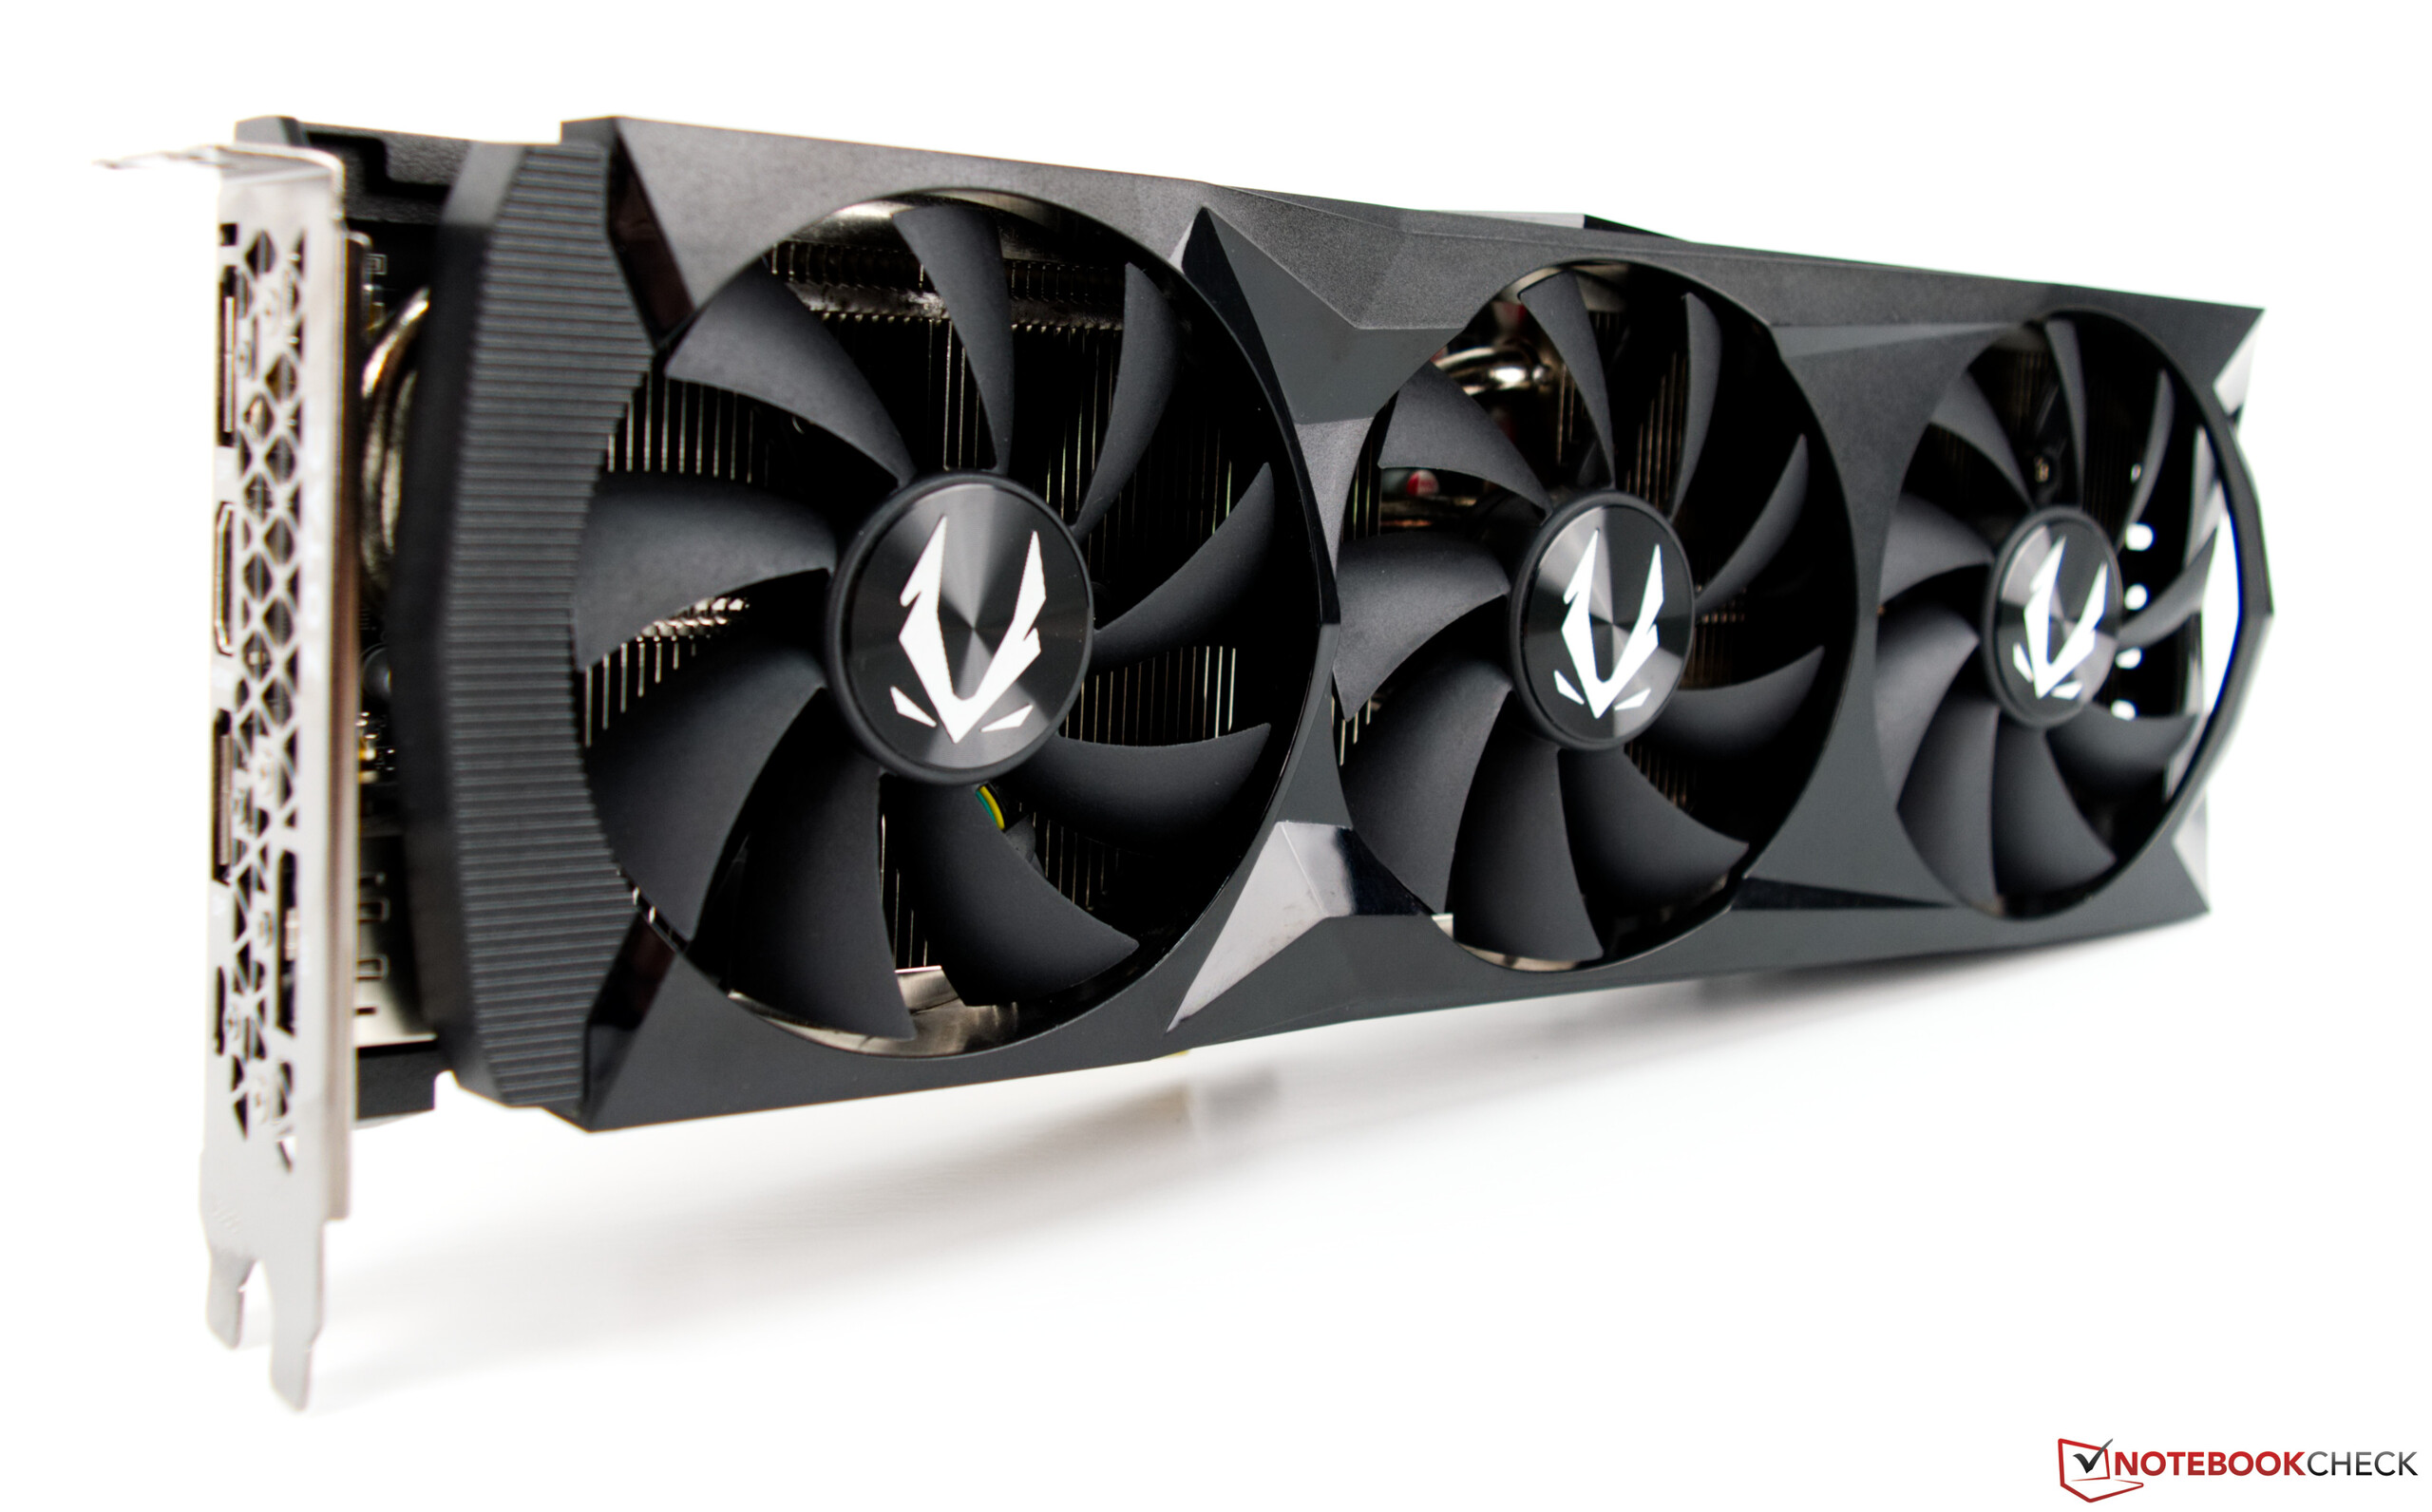
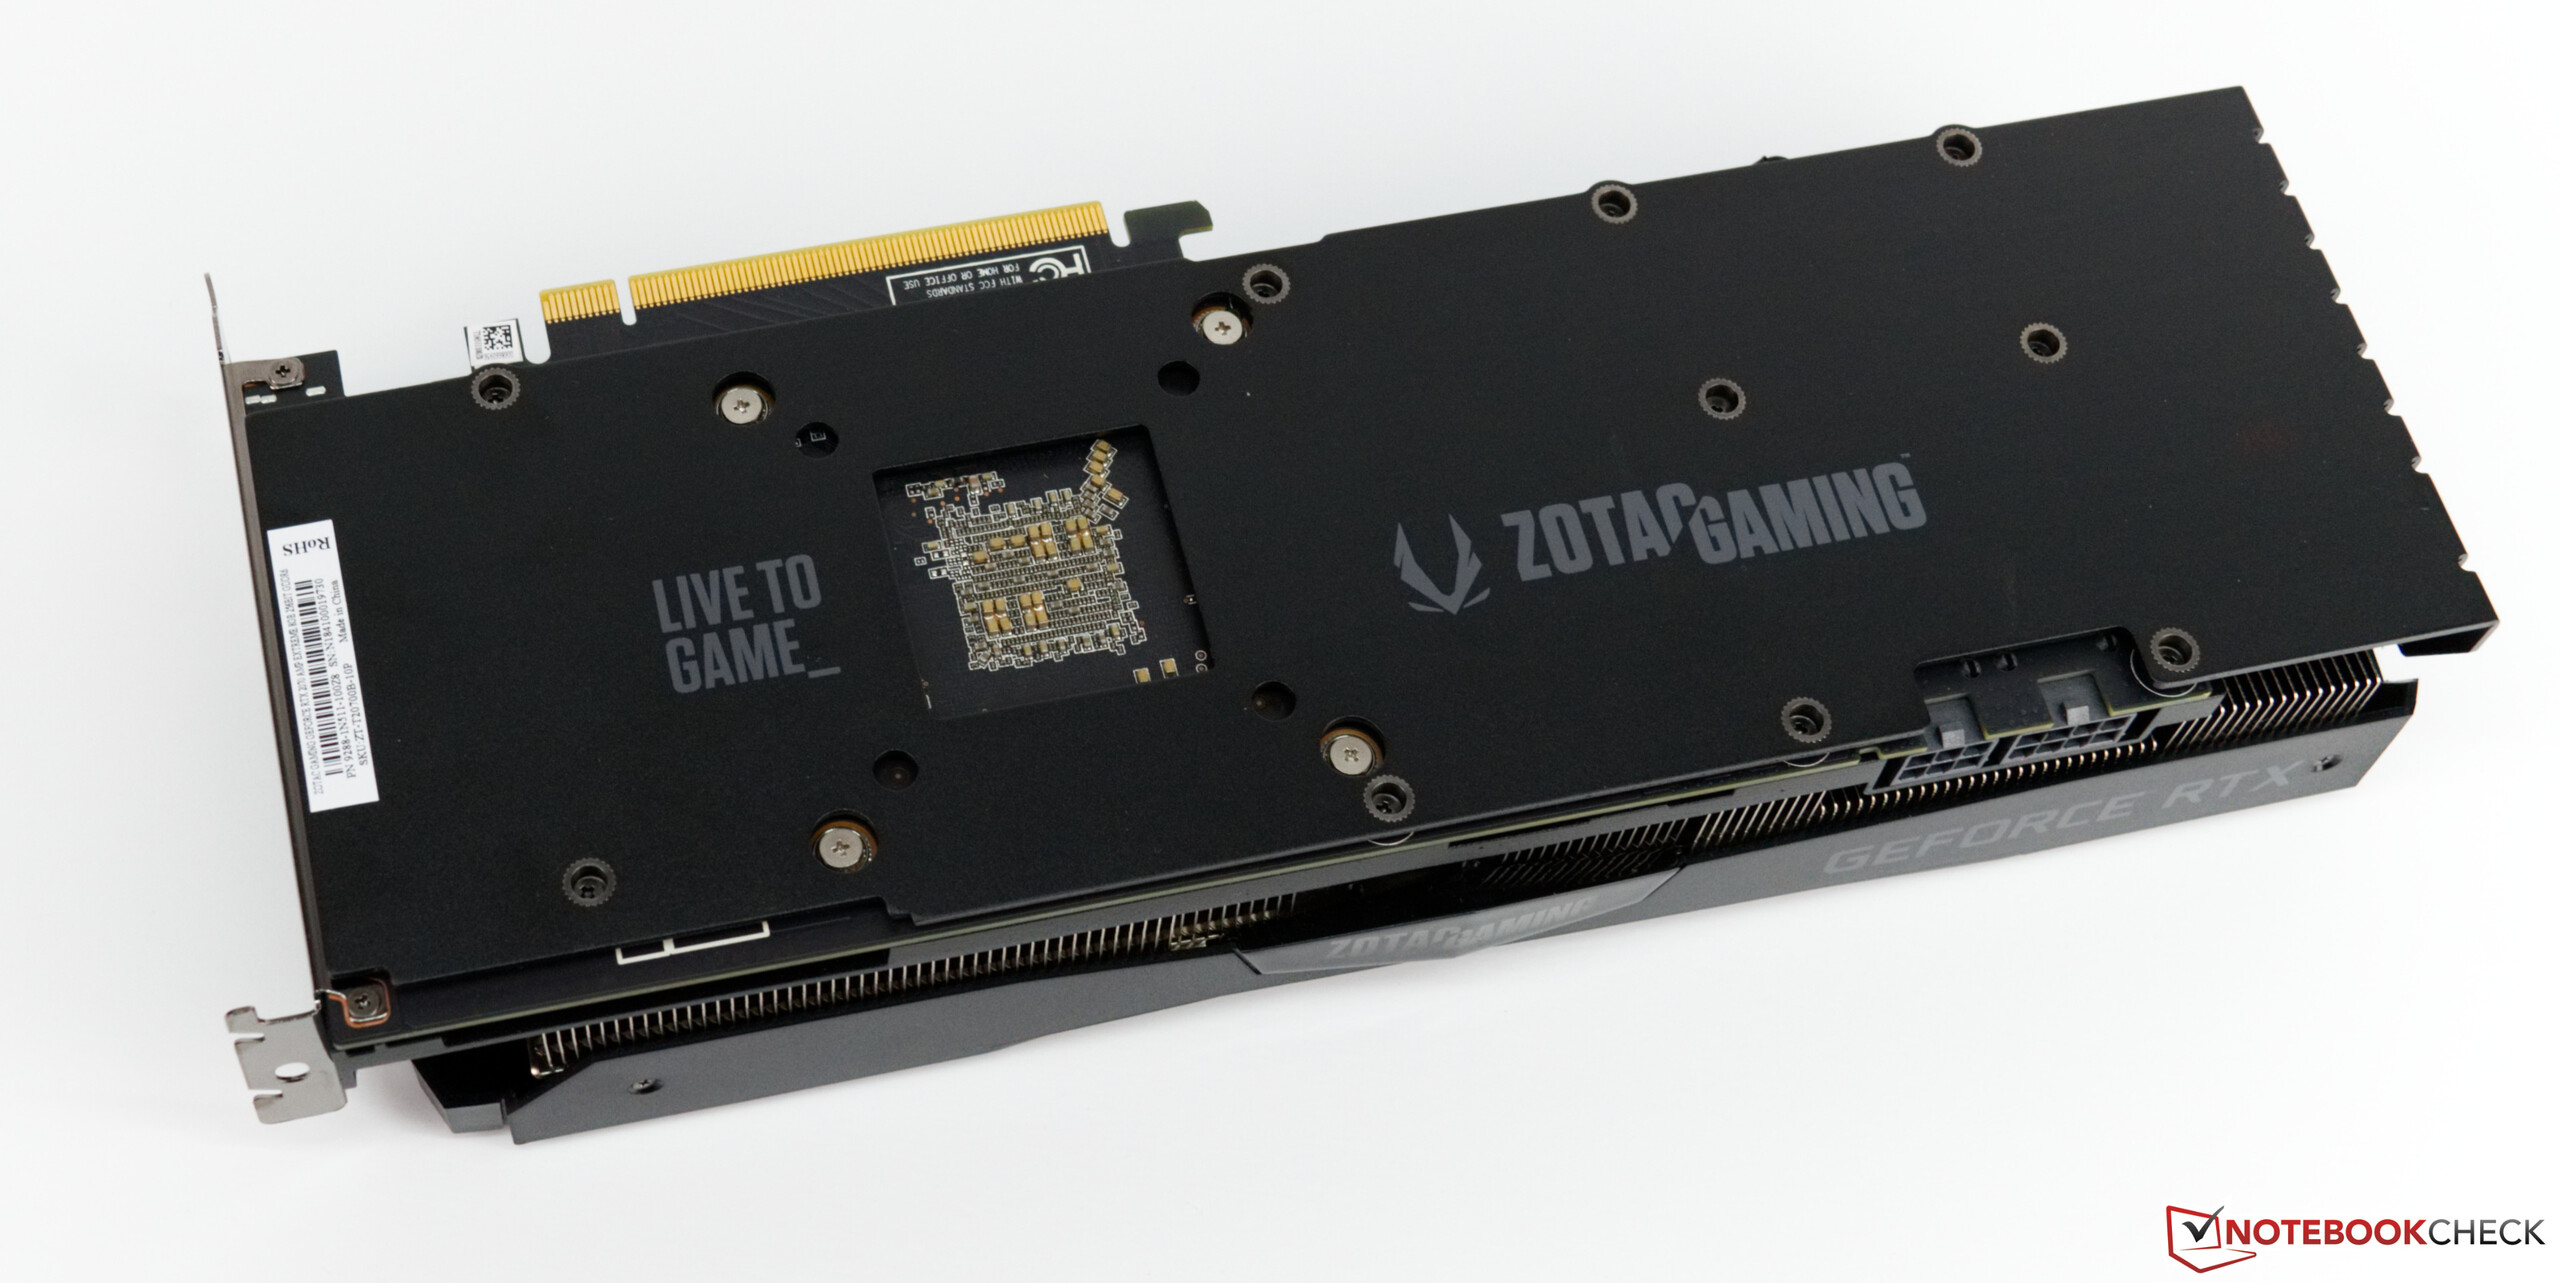
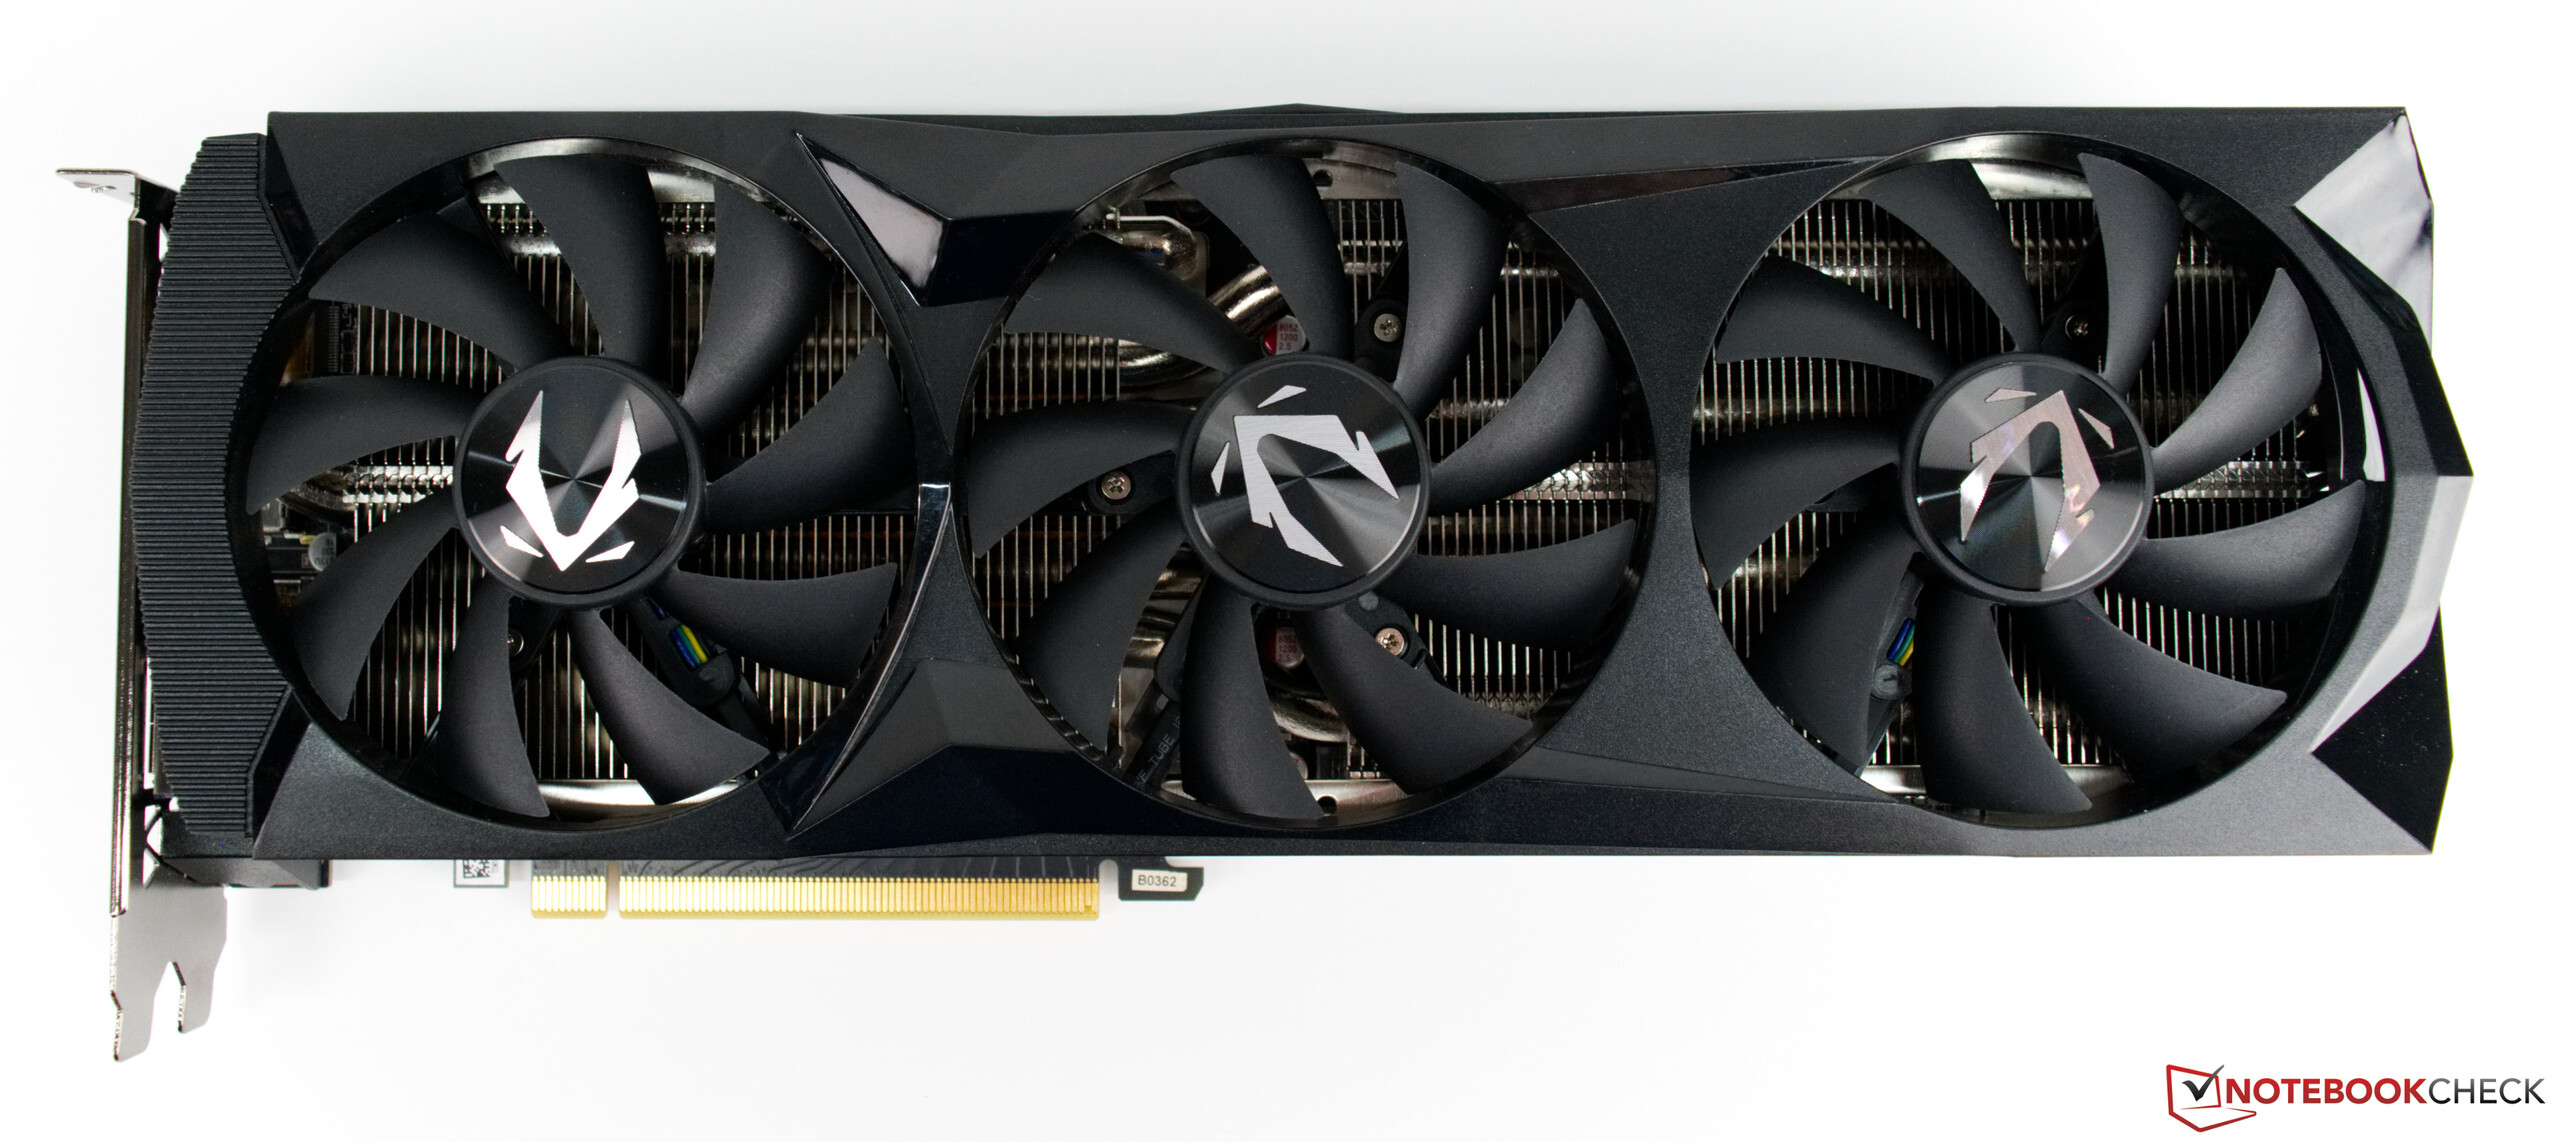
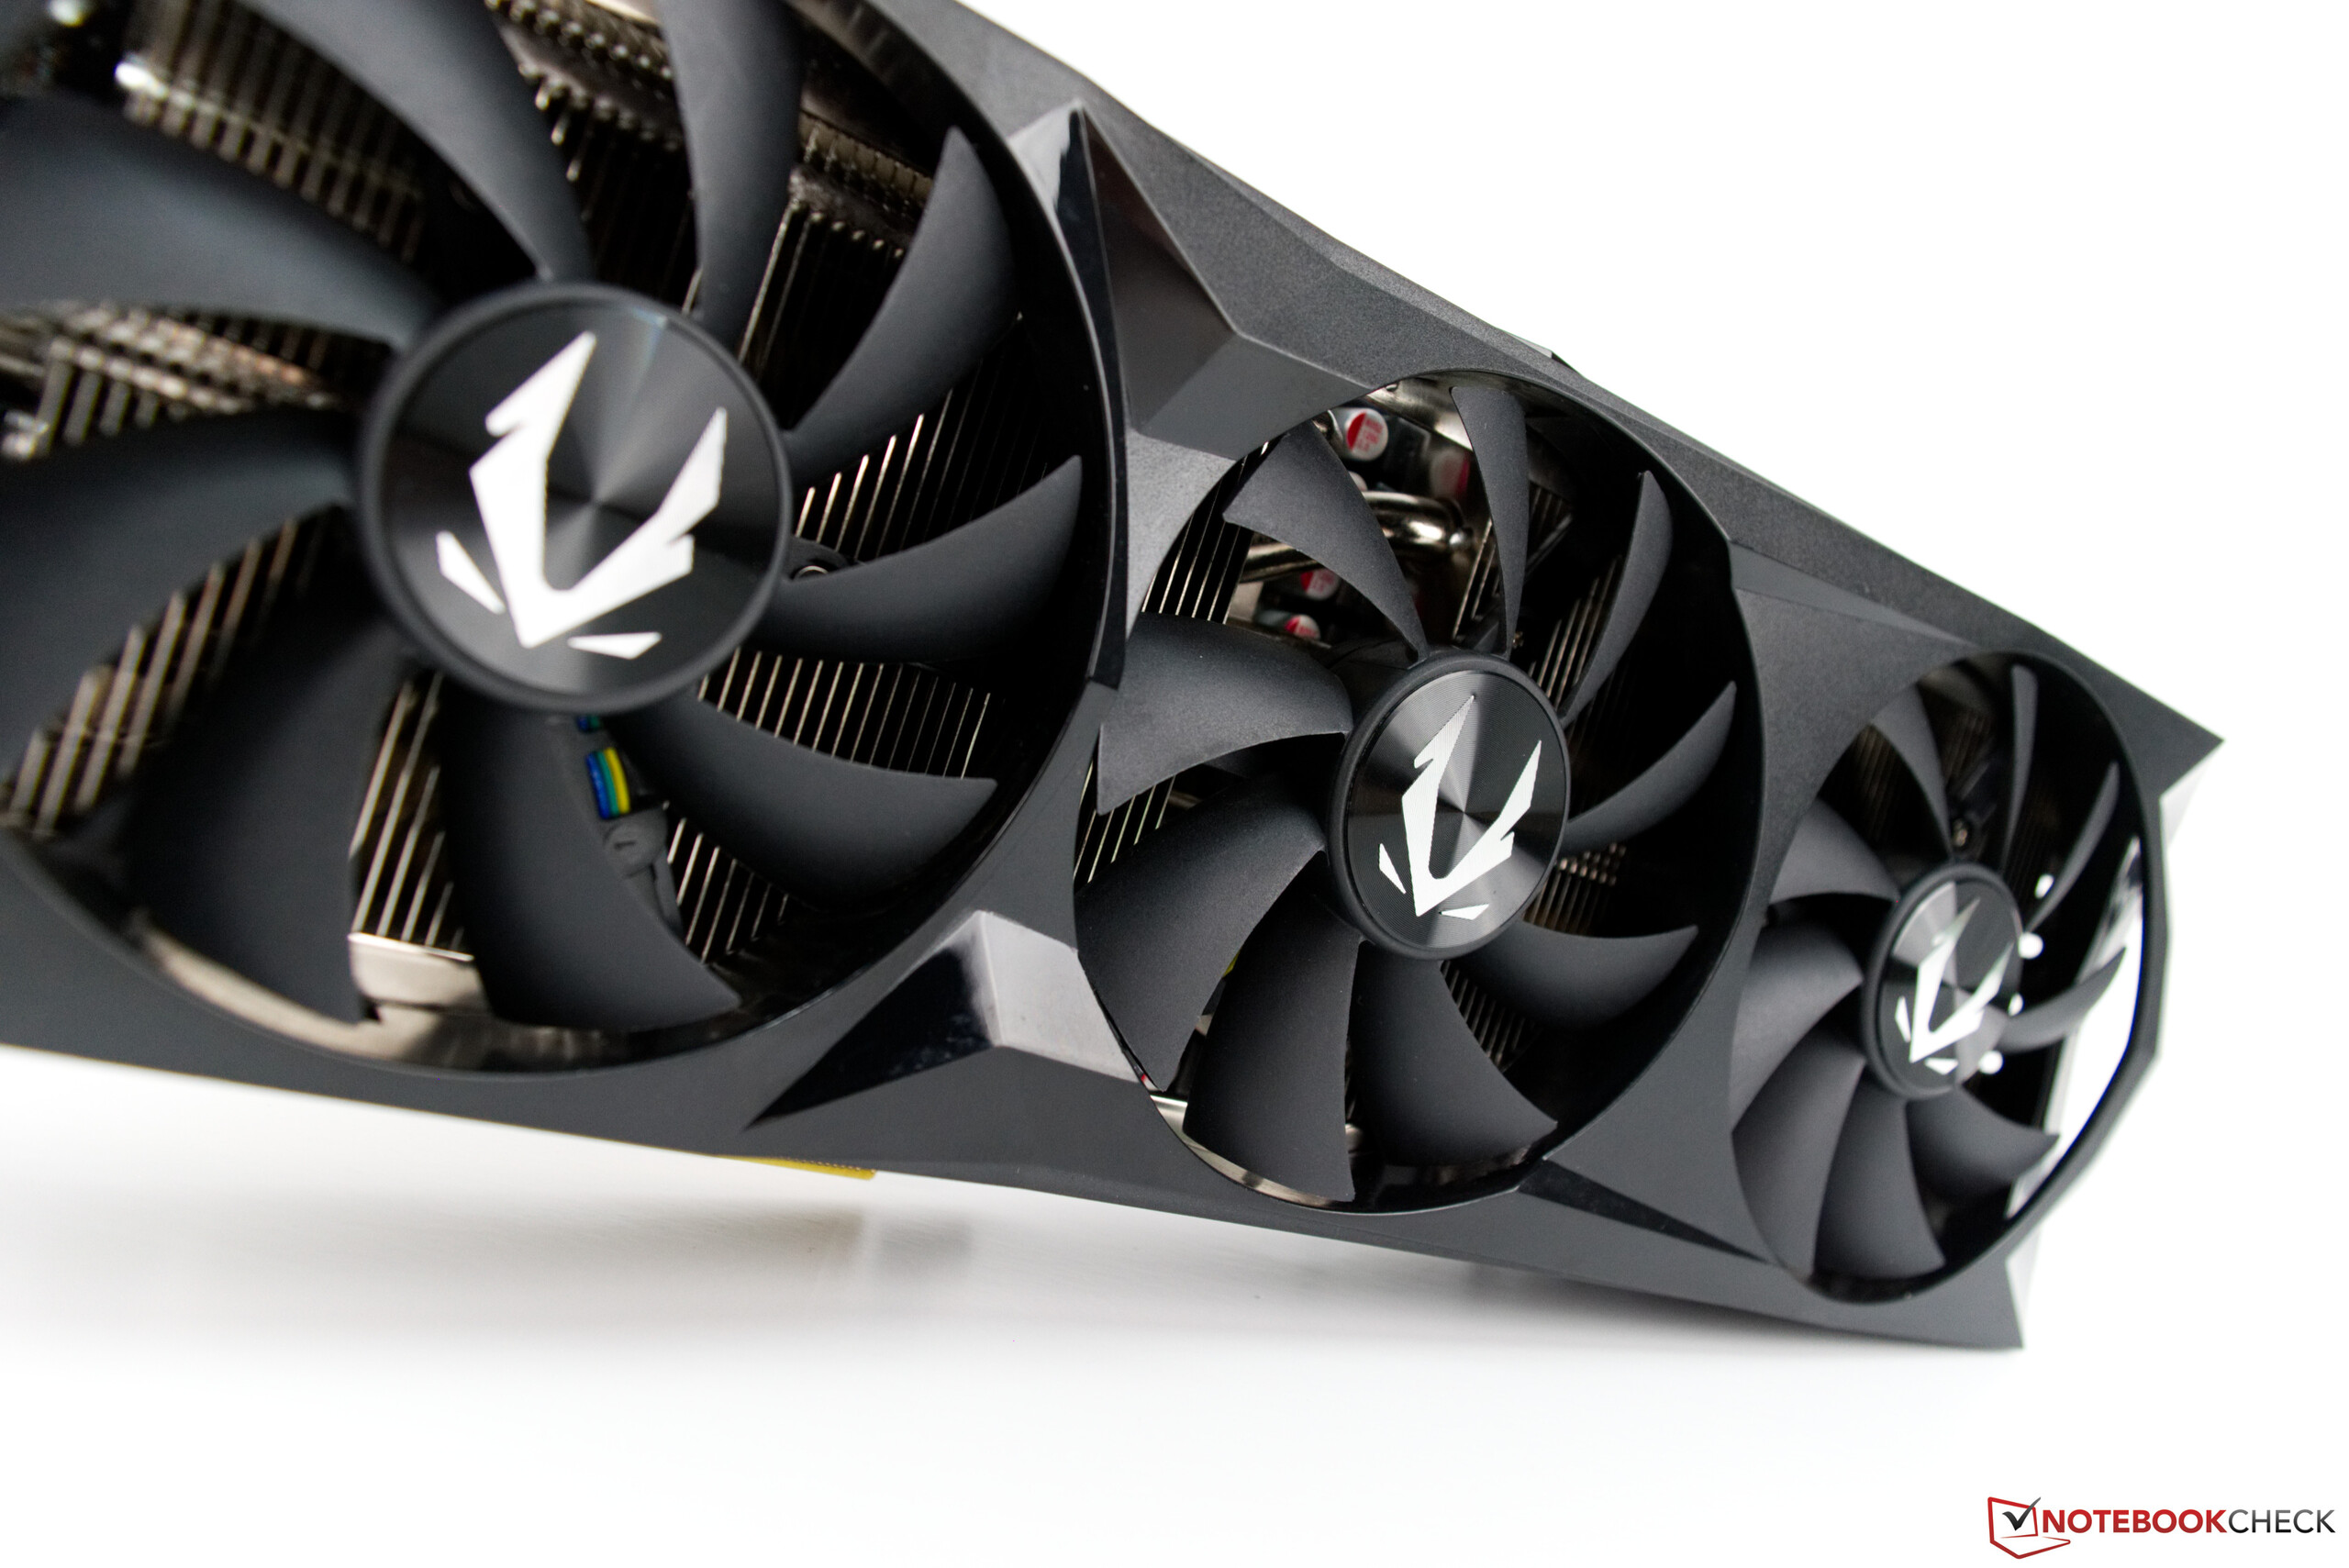
L'RTX 2070 AMP Extreme non è solo un'altra scheda grafica RTX di Zotac. È la più potente RTX 2070 che il produttore commercializza attualmente. La scheda con overclock di fabbrica ha una potenza di progettazione termica (TDP) di 225 W, superiore all'equivalente NVIDIA Founders Edition. Inoltre, Zotac ha progettato un layout della scheda in-house e ha dotato l'RTX 2070 AMP Extreme di tre grandi ventole. L'azienda utilizza lo stesso dissipatore anche sulla RTX 2070 AMP Extreme Core, ma tutte le altre schede della serie Zotac RTX 2070 hanno dissipatori più semplici. La ragione di ciò è che hanno un consumo energetico inferiore rispetto alla RTX 2070 AMP Extreme.
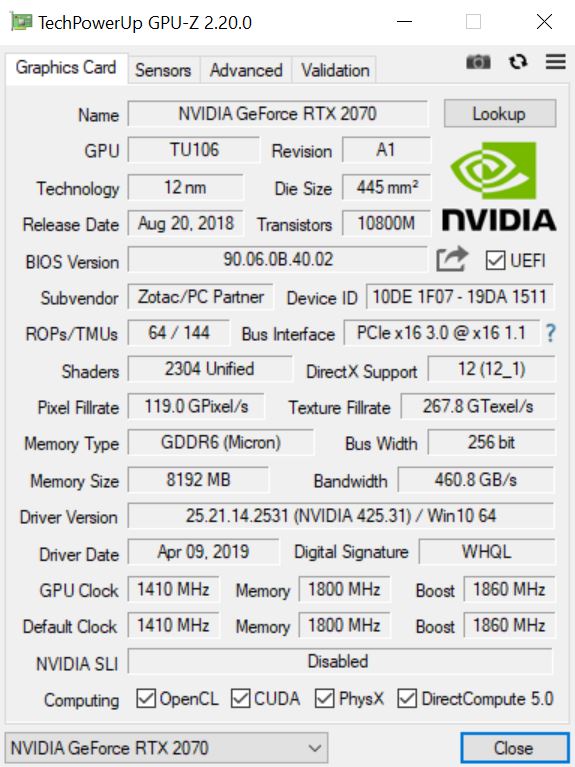
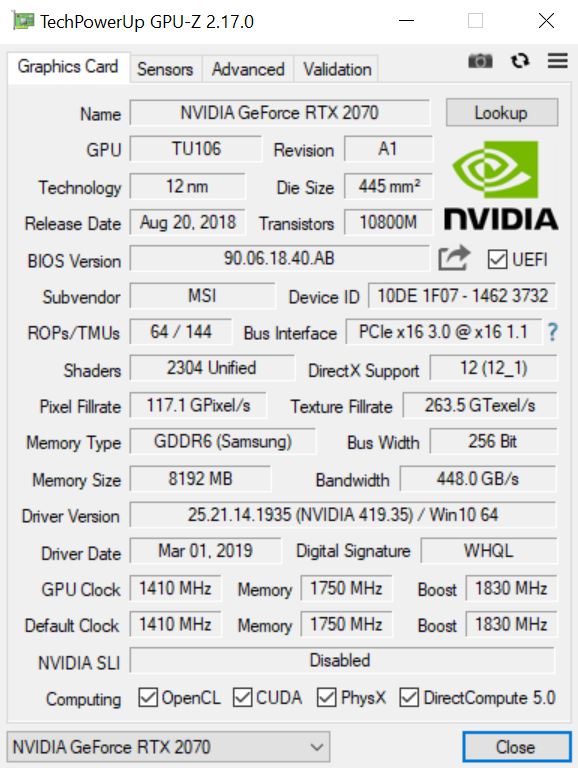
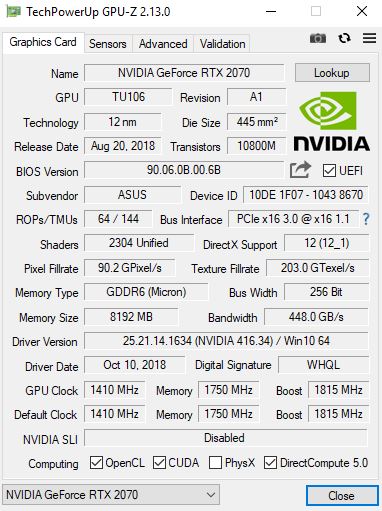
Come tutte le schede RTX 2070, l'AMP Extreme ha 2.304 unità shader e 8 GB di VRAM GDDR6. Micron ha fornito la VRAM per la nostra unità di prova, che abbiamo visto altrove in GPU come l'ASUS ROG Strix RTX 2070 OC.
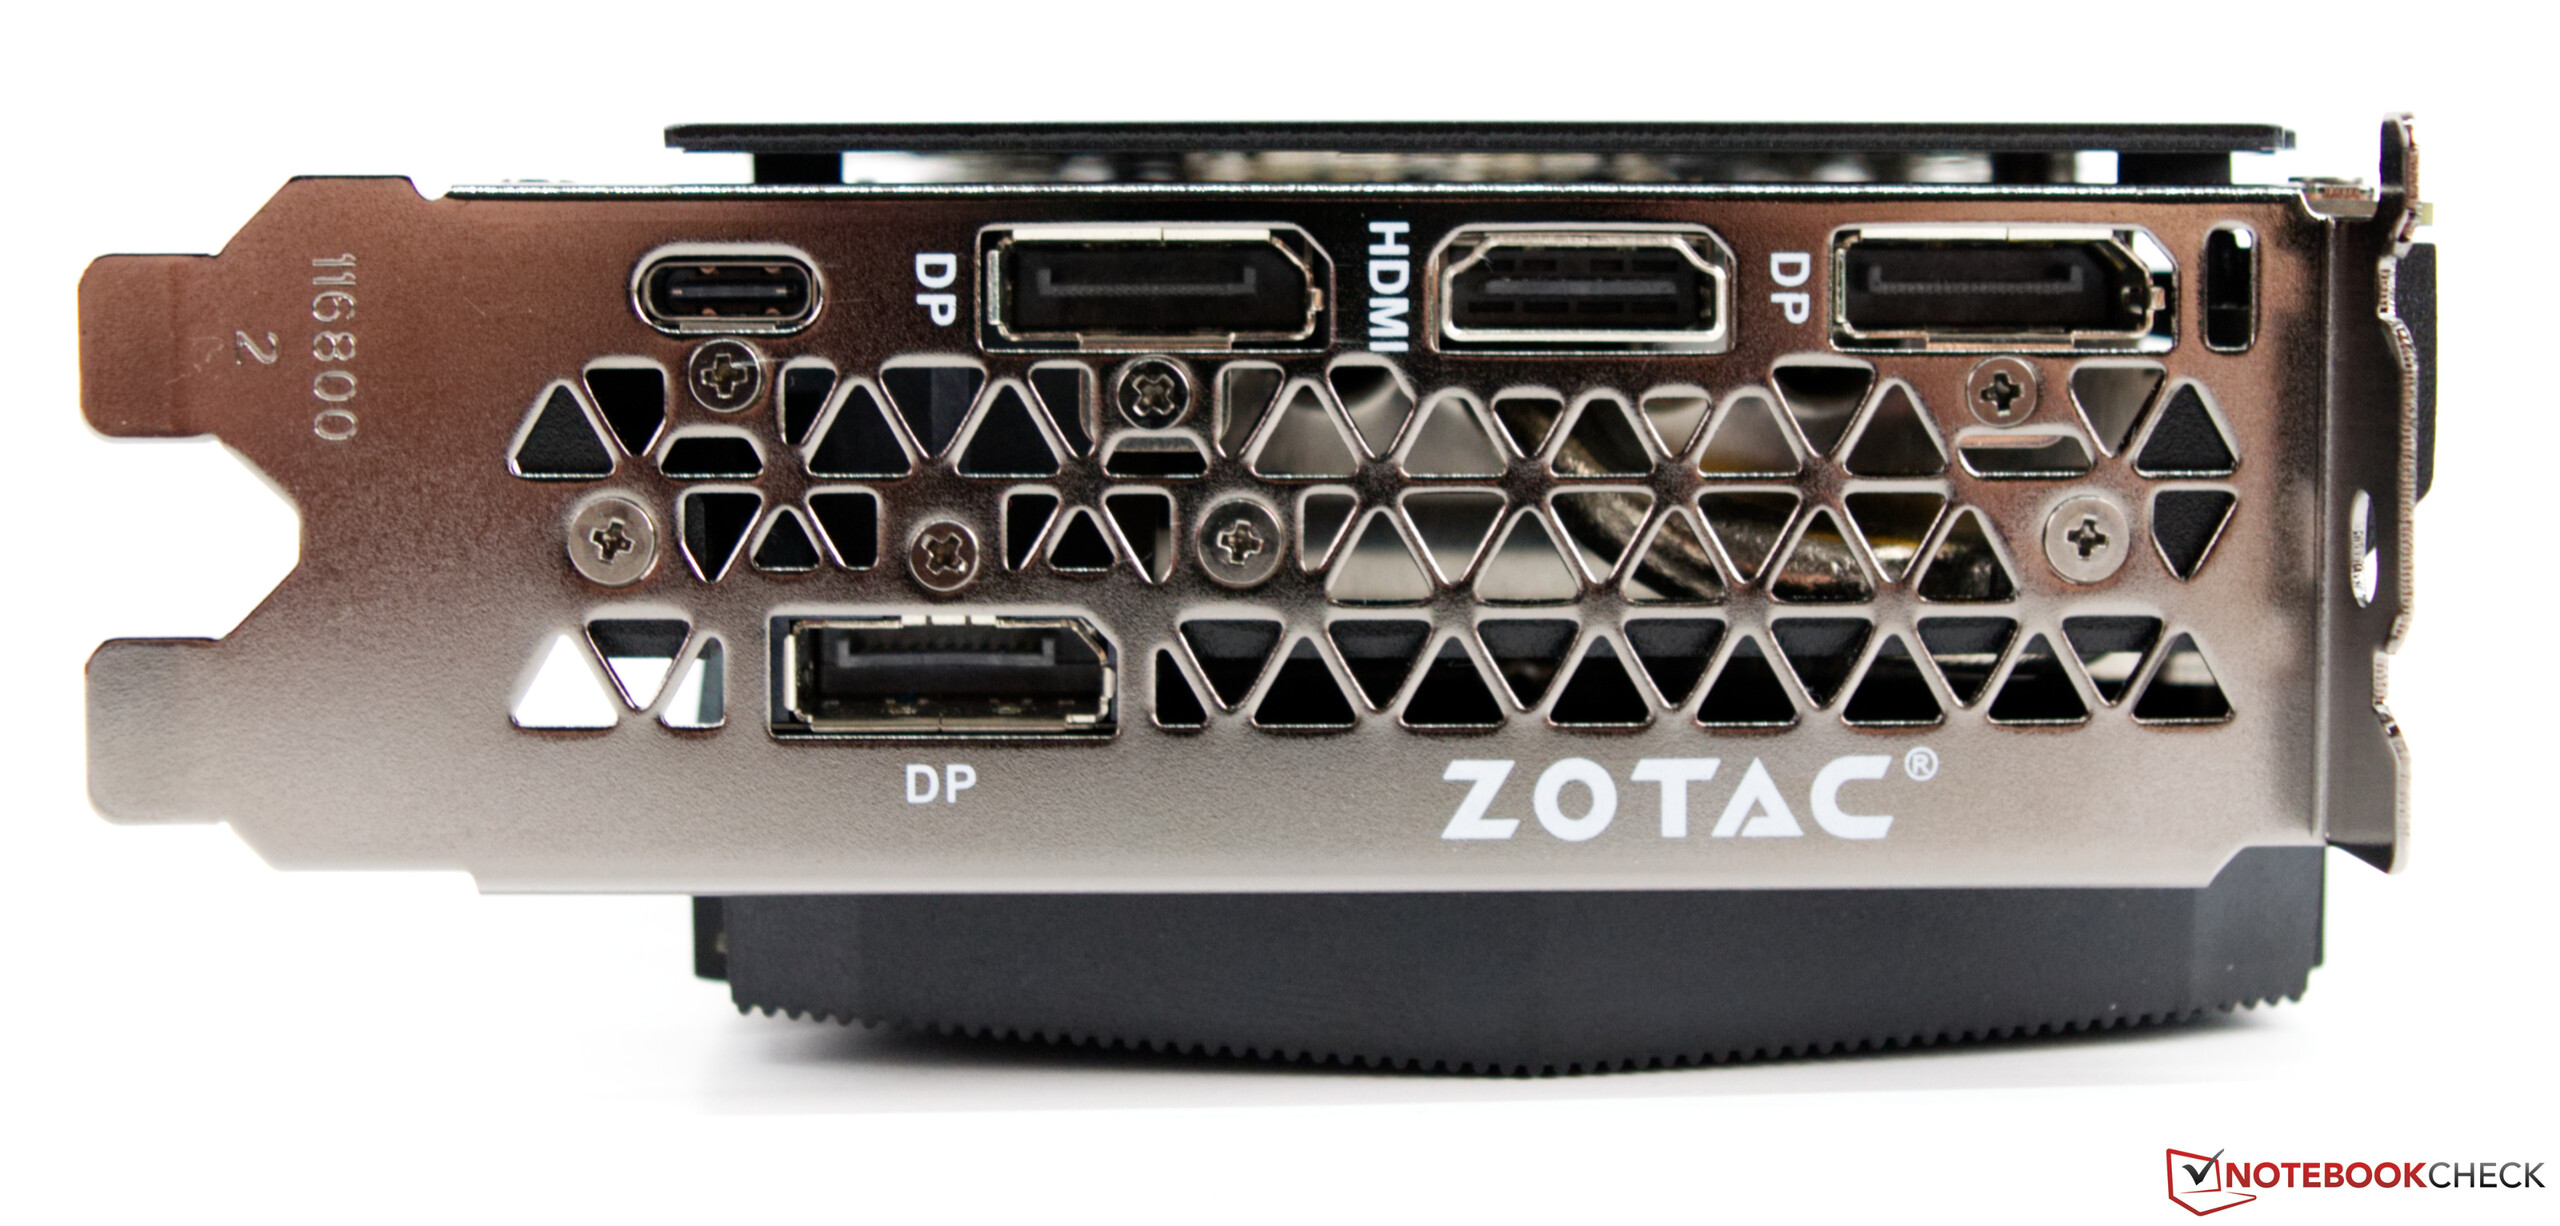
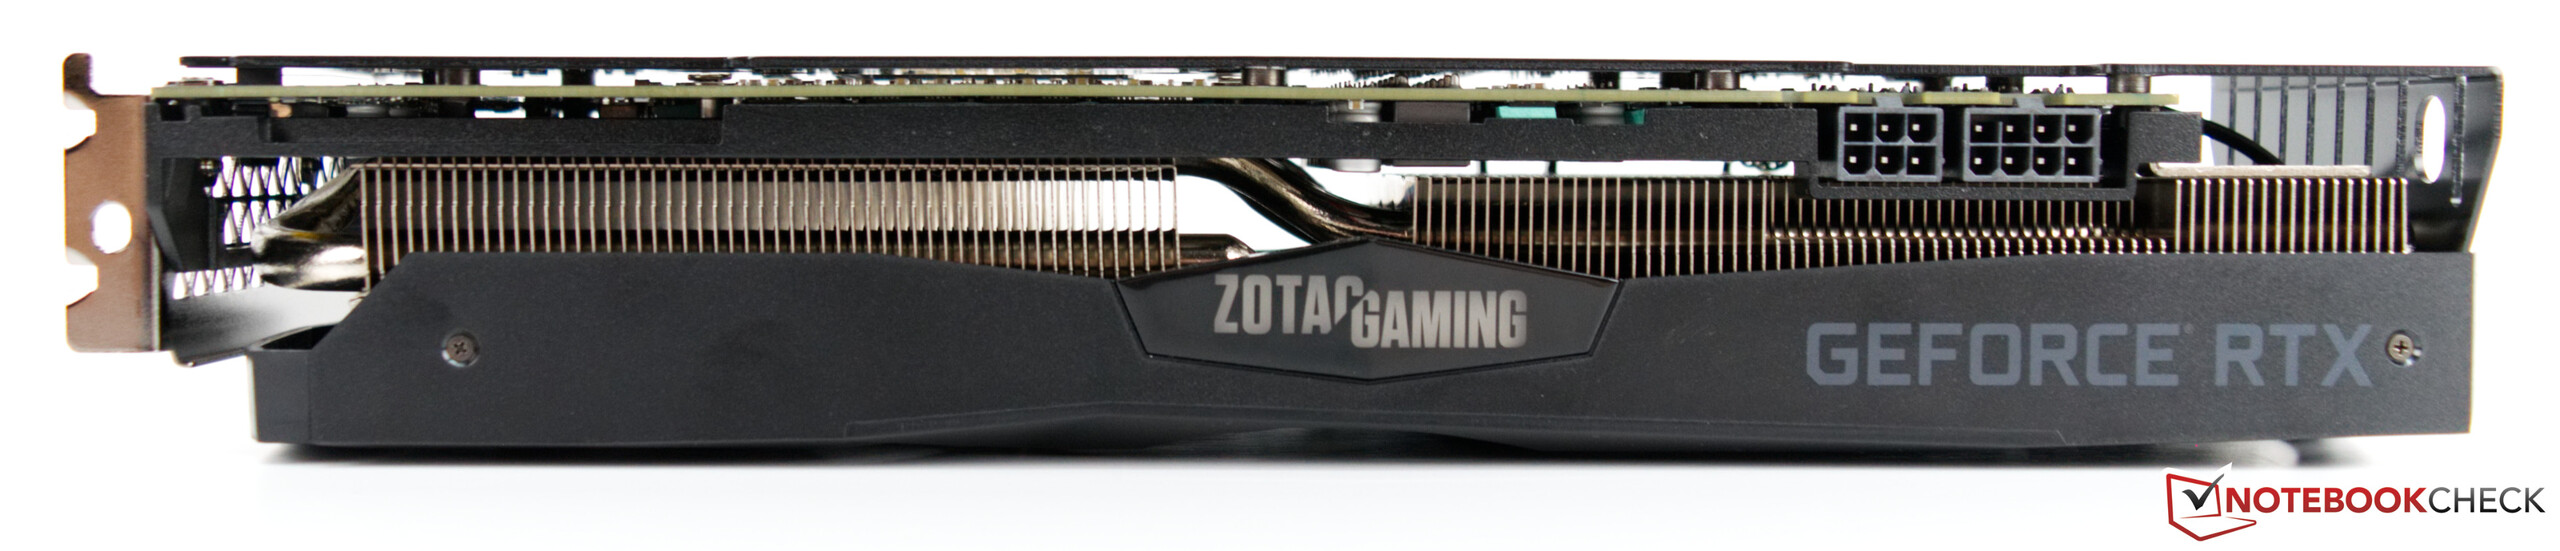
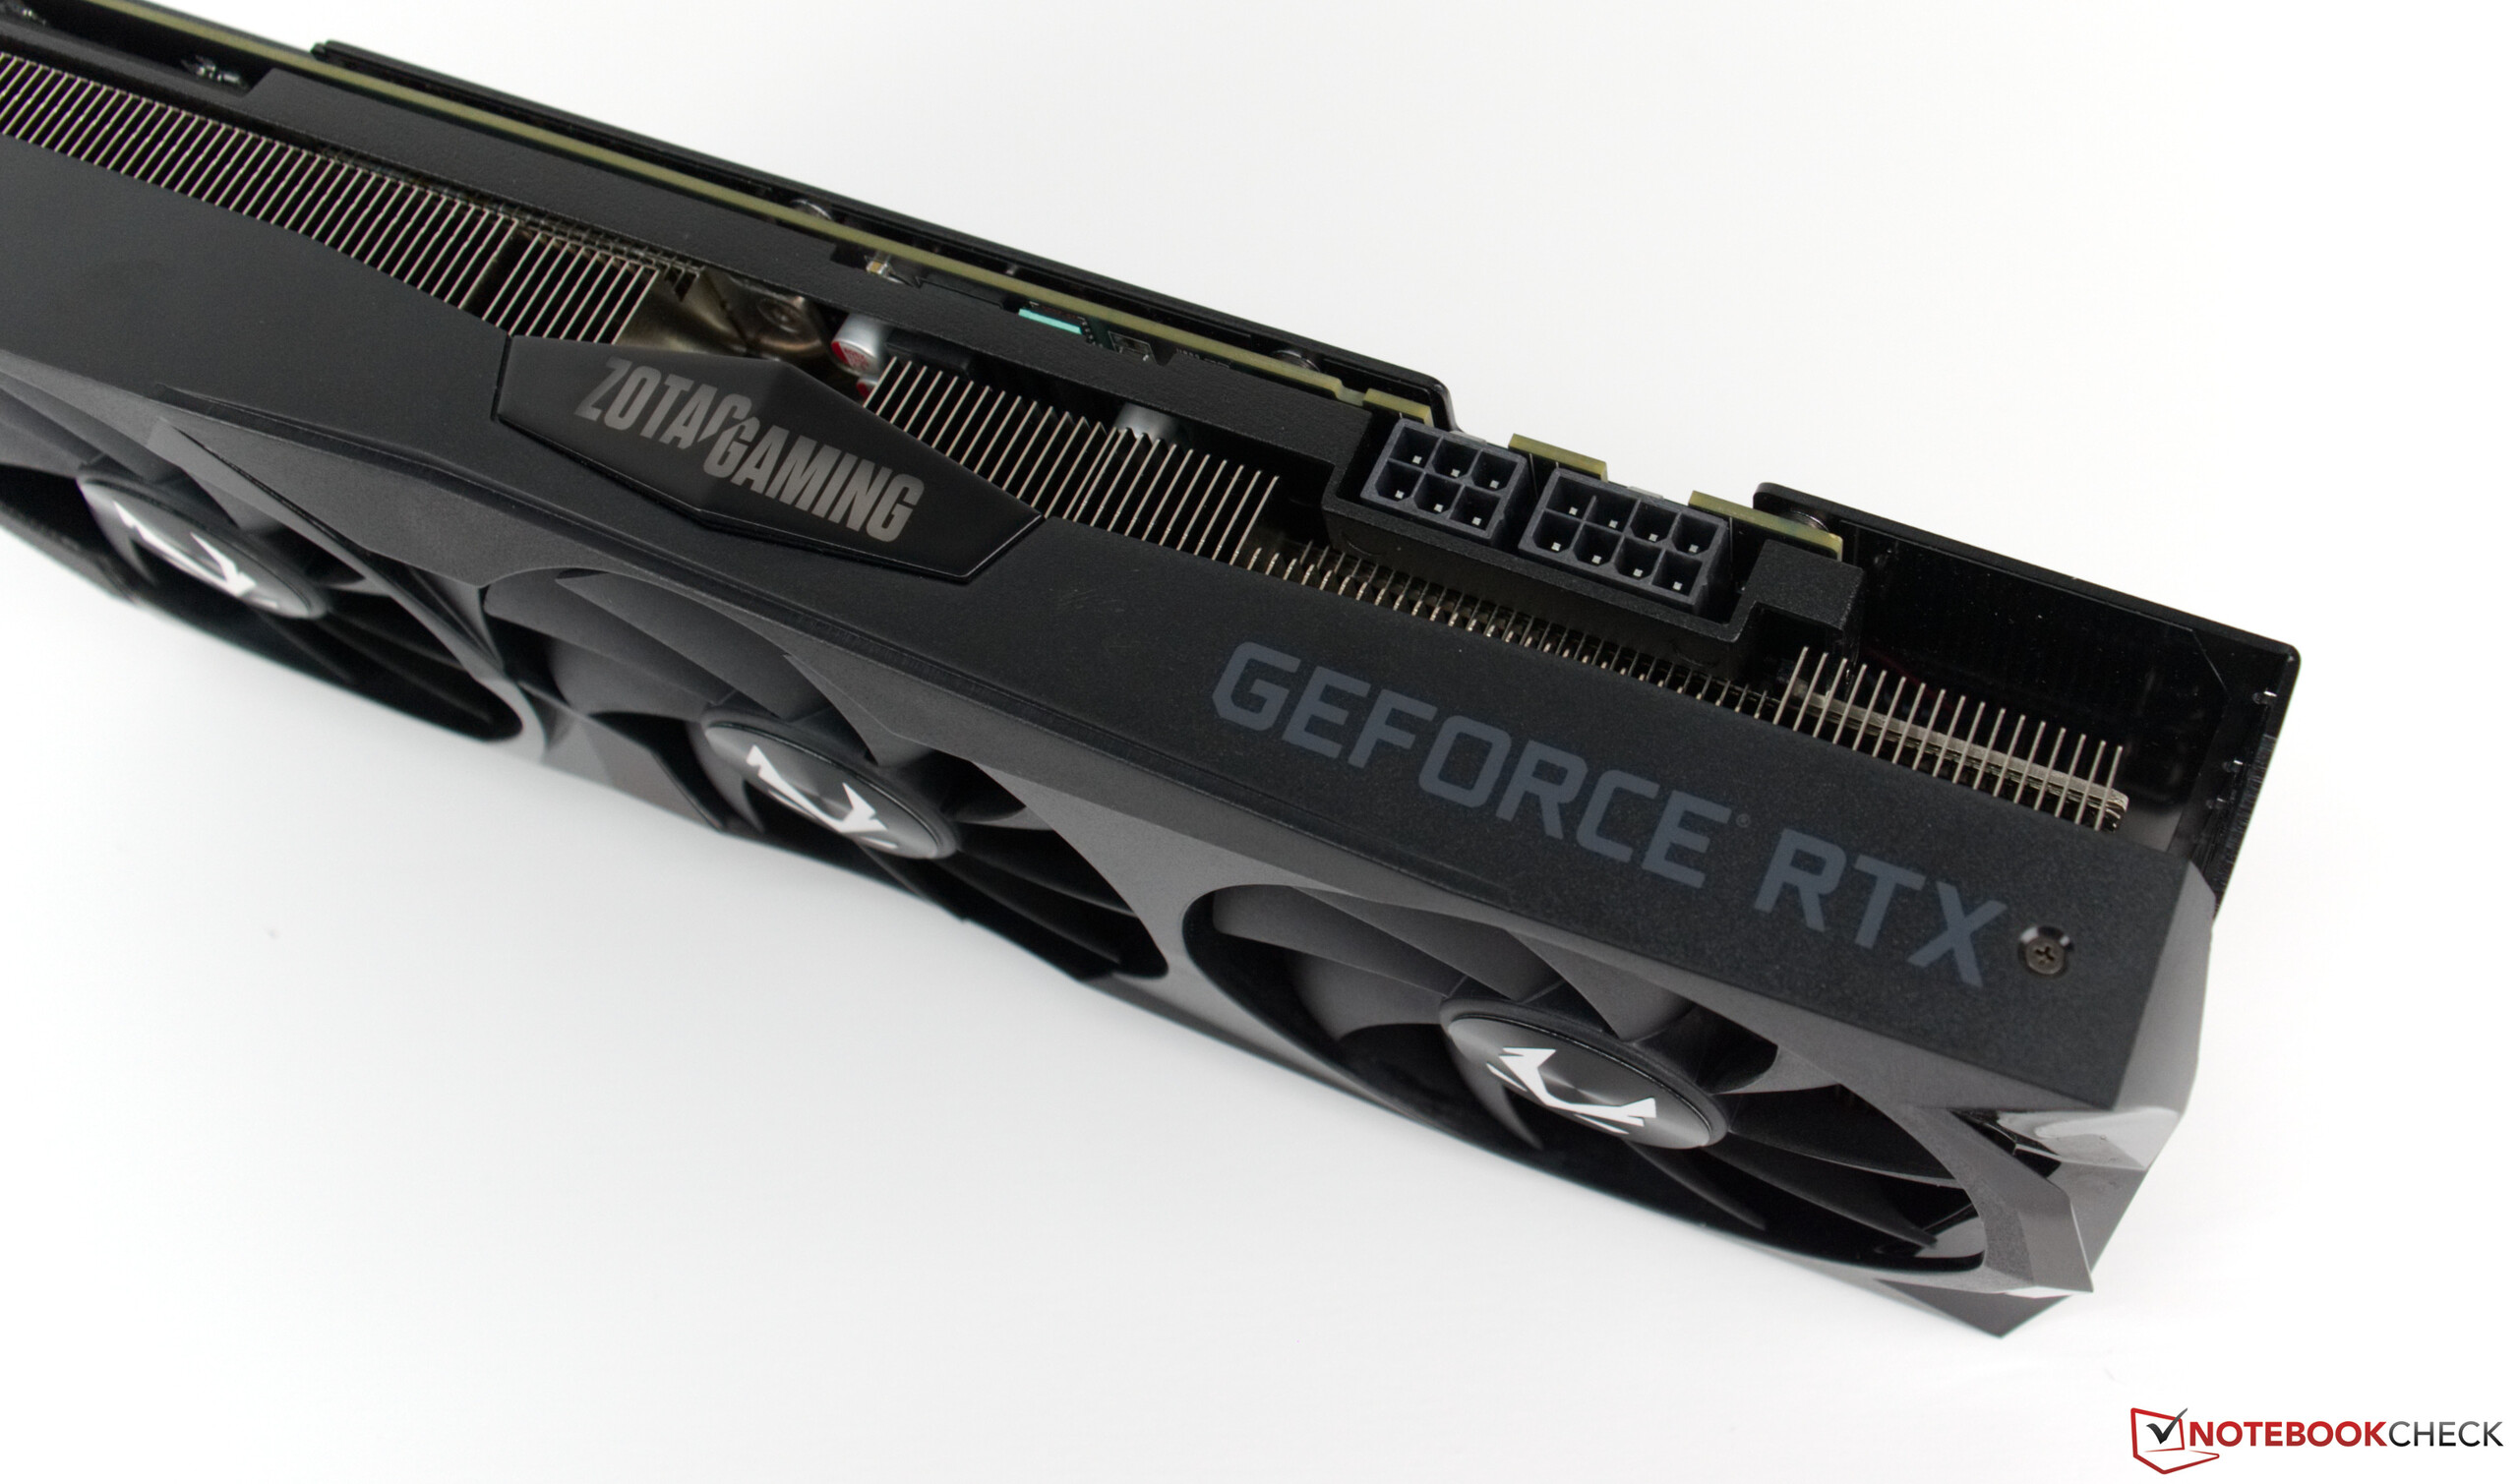
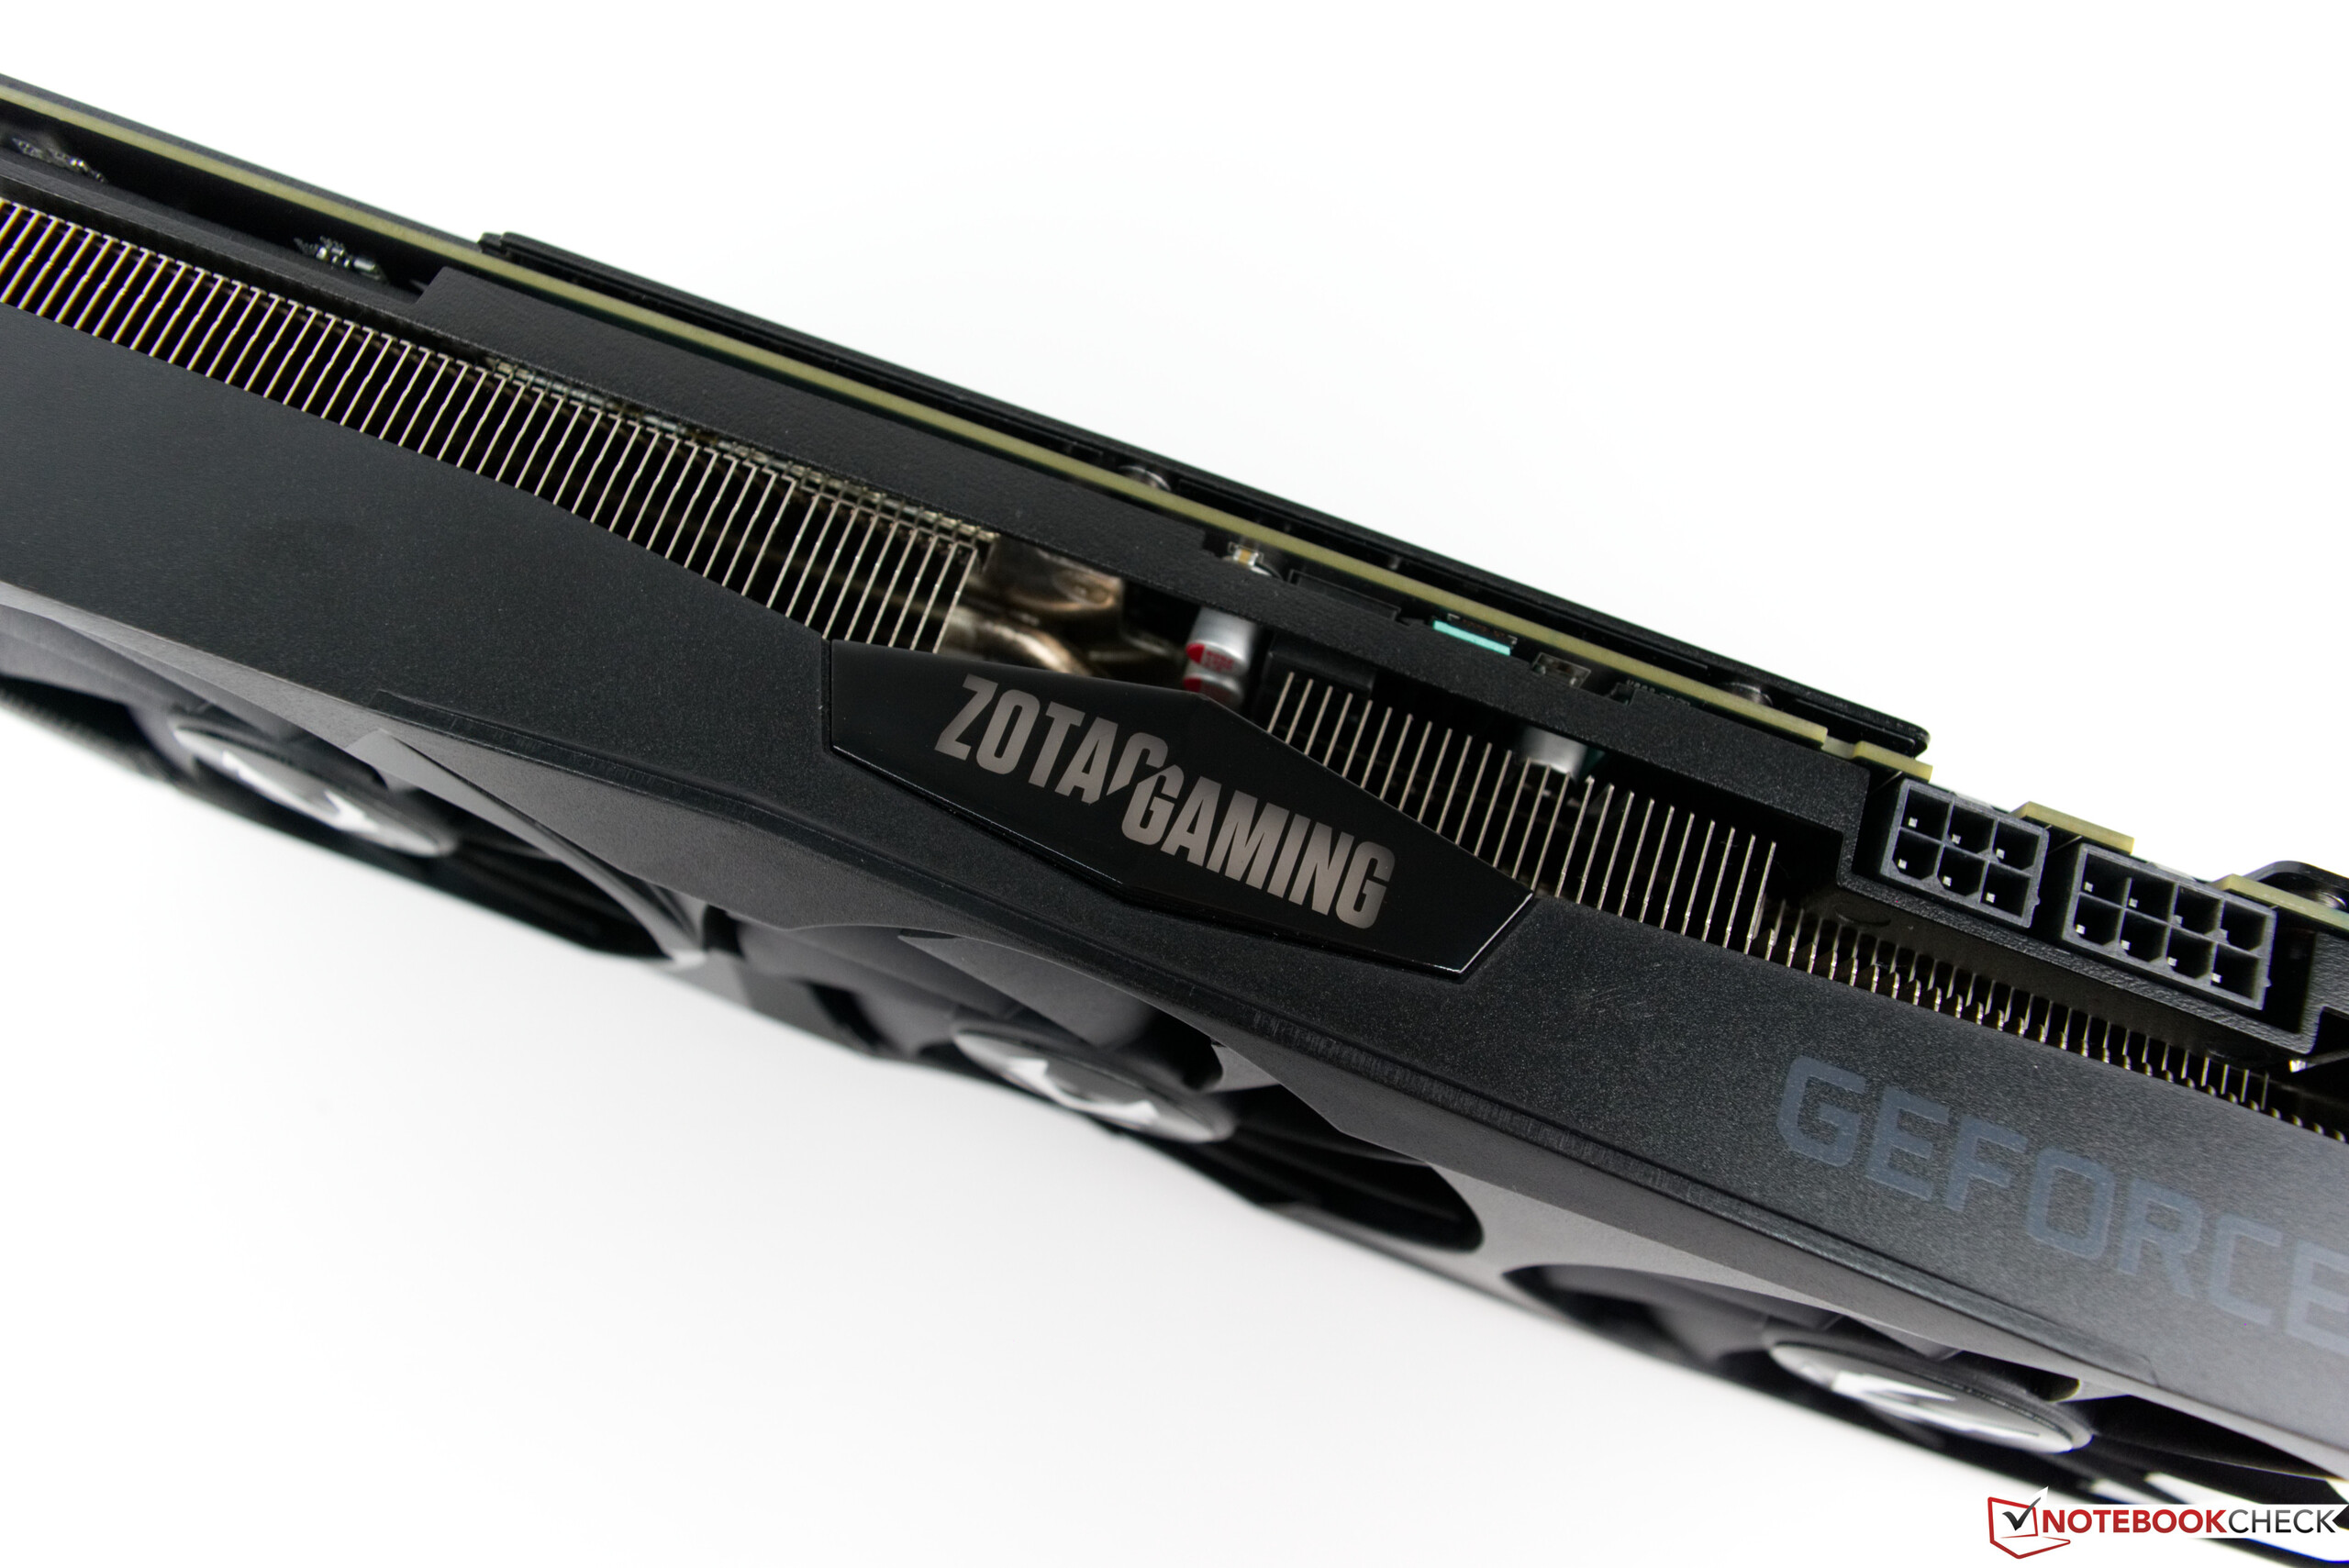
L'AMP Extreme ha una serie di porte per il collegamento della scheda a monitor esterni. Ci sono tre DisplayPort 1.4, una porta HDMI 2.0b e una porta USB Type-C per il collegamento di dispositivi VR. La GPU richiede alimentazione da uno slot PCI-E insieme a connettori di alimentazione a 6 e 8 pin.
Panoramica delle specifiche della GPU
| Specificifiche | RTX 2060 | Zotac RTX 2070 | RTX 2070 | RTX 2080 | RTX 2080 Ti | GTX 1070 |
| Chip | TU106 | TU106 | TU106 | TU104 | TU102 | GP104 |
| Processo FinFET | 12 nm | 12 nm | 12 nm | 12 nm | 12 nm | 16 nm |
| Unità Shader | 1,920 | 2,304 | 2,304 | 2,944 | 4,352 | 1,920 |
| Unità Texture | 120 | 144 | 144 | 184 | 272 | 120 |
| Tensor cores | 240 | 288 | 288 | 368 | 544 | - |
| RT cores | 30 | 36 | 36 | 46 | 68 | - |
| GPU base clock | 1,365 MHz | 1,410 MHz | 1,410 MHz | 1,515 MHz | 1,350 MHz | 1,506 MHz |
| GPU boost clock | 1,680 MHz | 1,860 MHz | 1,620 MHz | 1,710 MHz | 1,545 MHz | 1,683 MHz |
| Memory bus | 192 Bit | 256 Bit | 256 Bit | 256 Bit | 352 Bit | 256 Bit |
| Memory bandwidth | 336 GB/s | 460.8 GB/s | 448 GB/s | 448 GB/s | 616 GB/s | 256,3 GB/s |
| VRAM | 6 GB GDDR6 | 8 GB GDDR6 | 8 GB GDDR6 | 8 GB GDDR6 | 11 GB GDDR6 | 8 GB GDDR5 |
| Power | 160 W | 225 W | 175 W | 215 W | 250 W | 150 W |
Il sistema di Test
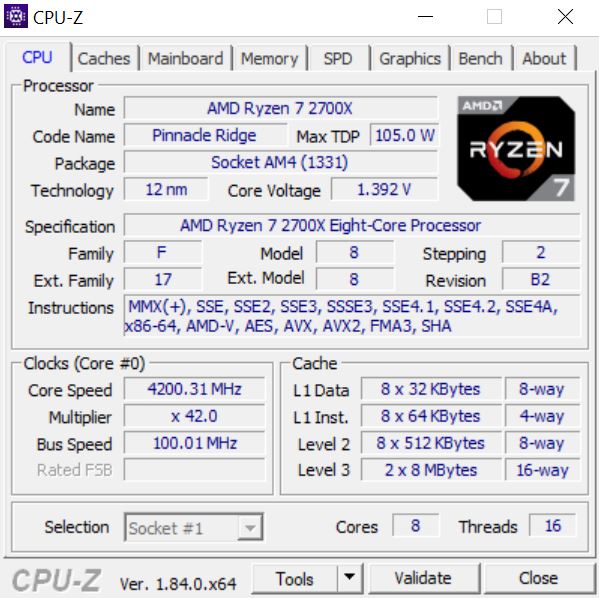
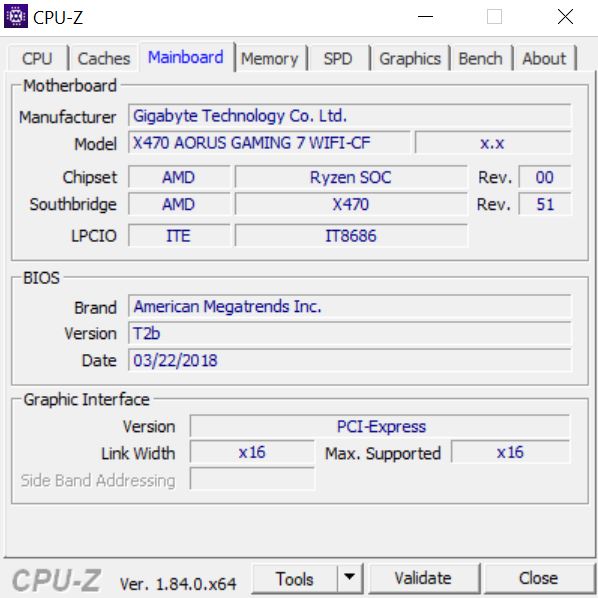
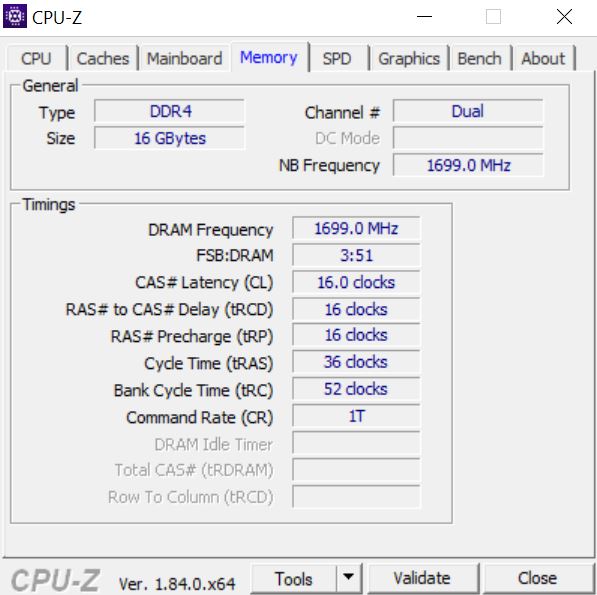
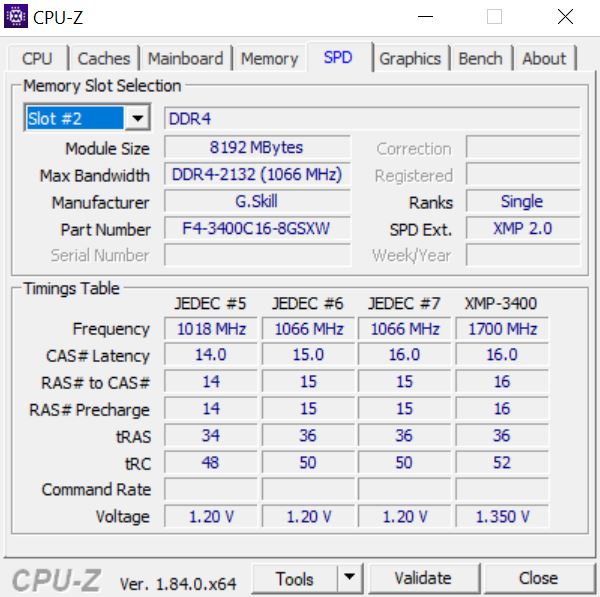
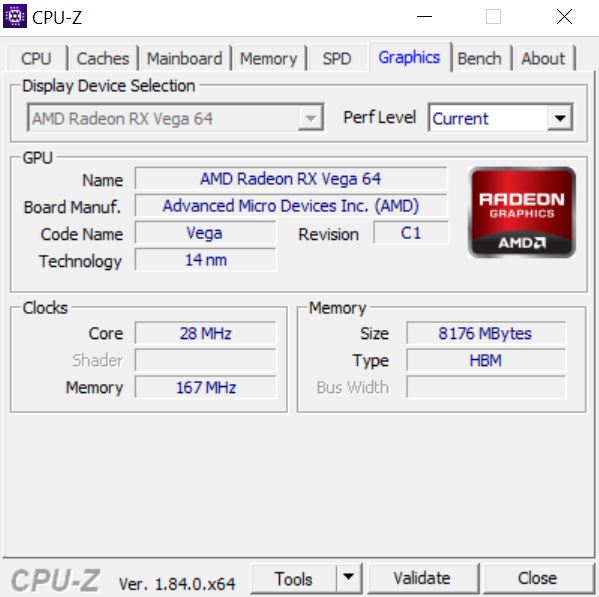
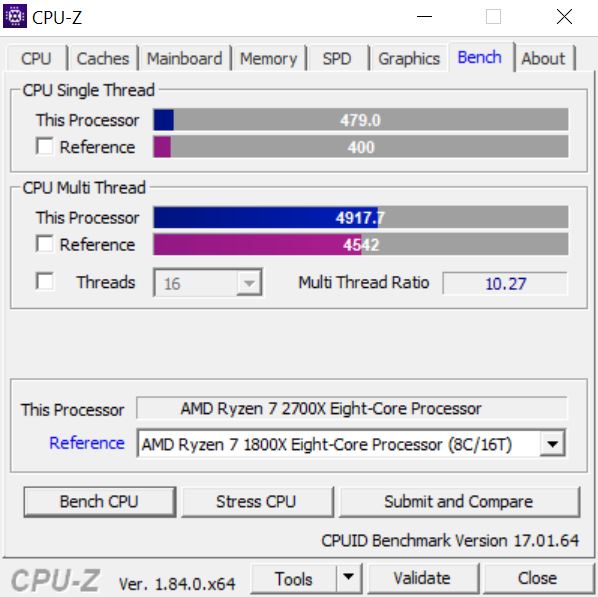
Il nostro sistema di test è basato sulla scheda madre WiFi Gigabyte X470 Aorus Gaming 7 WiFi. Abbiamo accoppiato la scheda con l'APU AMD Ryzen 7 2700X, che offre buone prestazioni con un budget limitato, e un Be Quiet Silent Loop 280 mm AIO. Abbiamo anche equipaggiato il sistema con 16 GB di RAM G-Skill che gira a 3.400 MHz, il tutto alloggiato in un case Corsair Carbide Air 540 ATX Cube. Inoltre, abbiamo eseguito tutti i nostri test sull'Acer Predator XB321HK, un monitor 4K che ci permette anche di condurre dei benchmarks di gioco UHD.
Un grande ringraziamento ad AMD per averci gentilmente fornito questa piattaforma di test per provare la RTX 2070 AMP Extreme.
| Case | Corsair Carbide Air 540 ATX Cube |
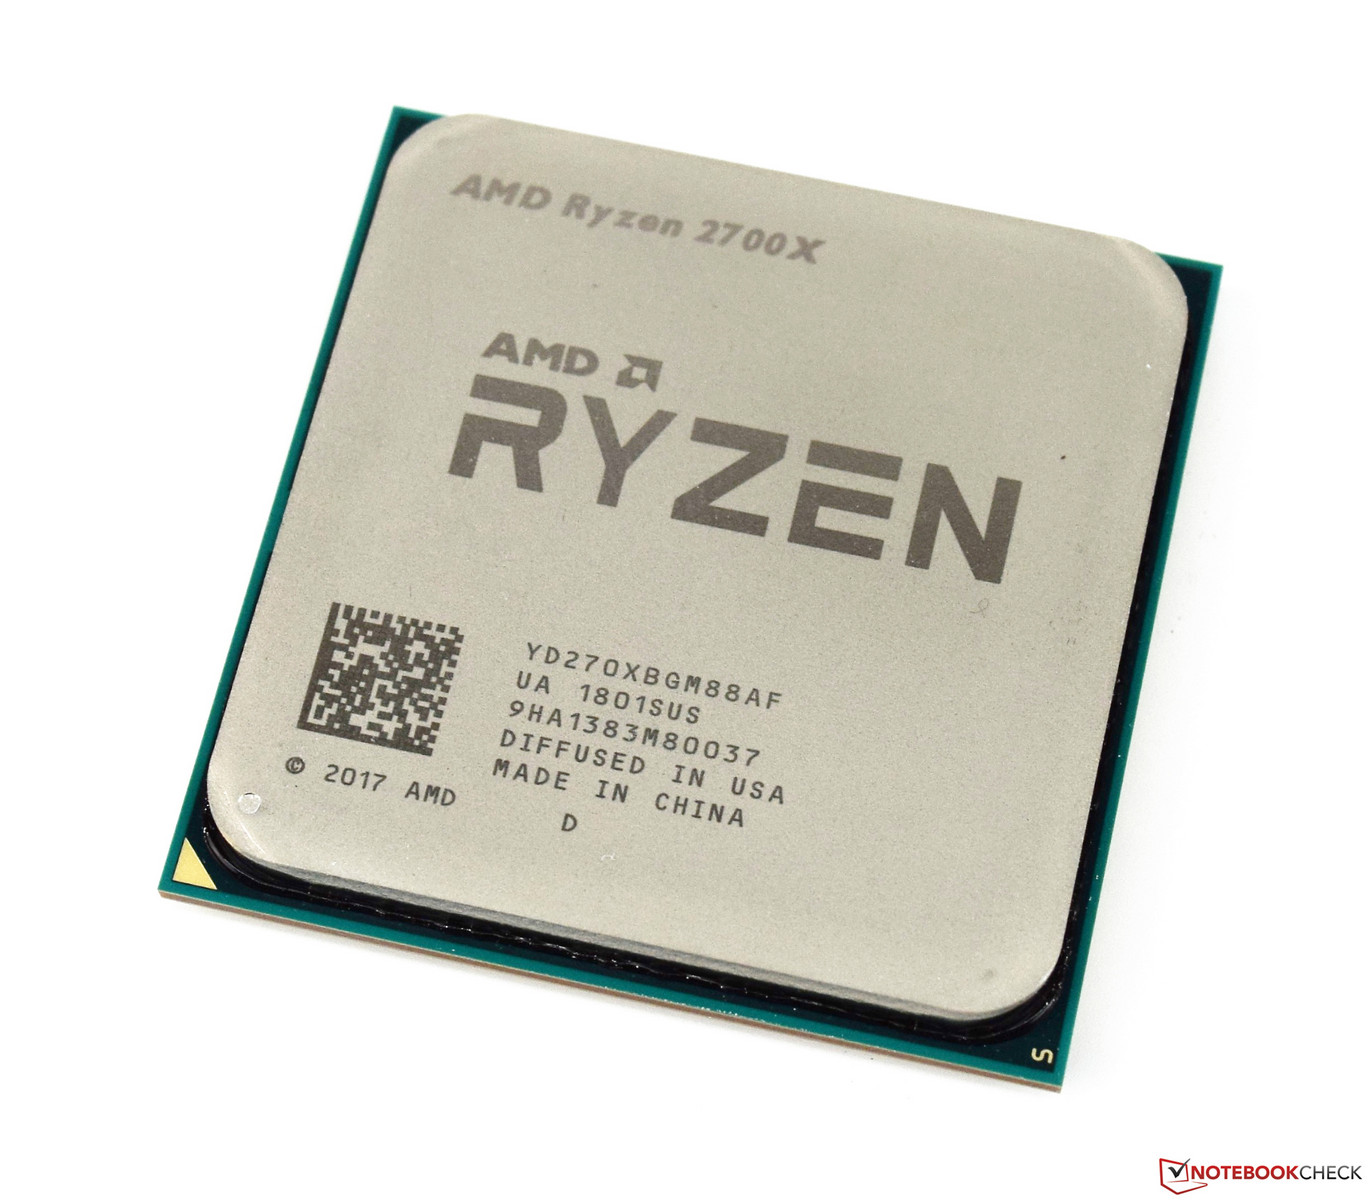
| CPU | AMD Ryzen 7 2700X |
| CPU cooler | Be Quiet Silent Loop 280 mm |
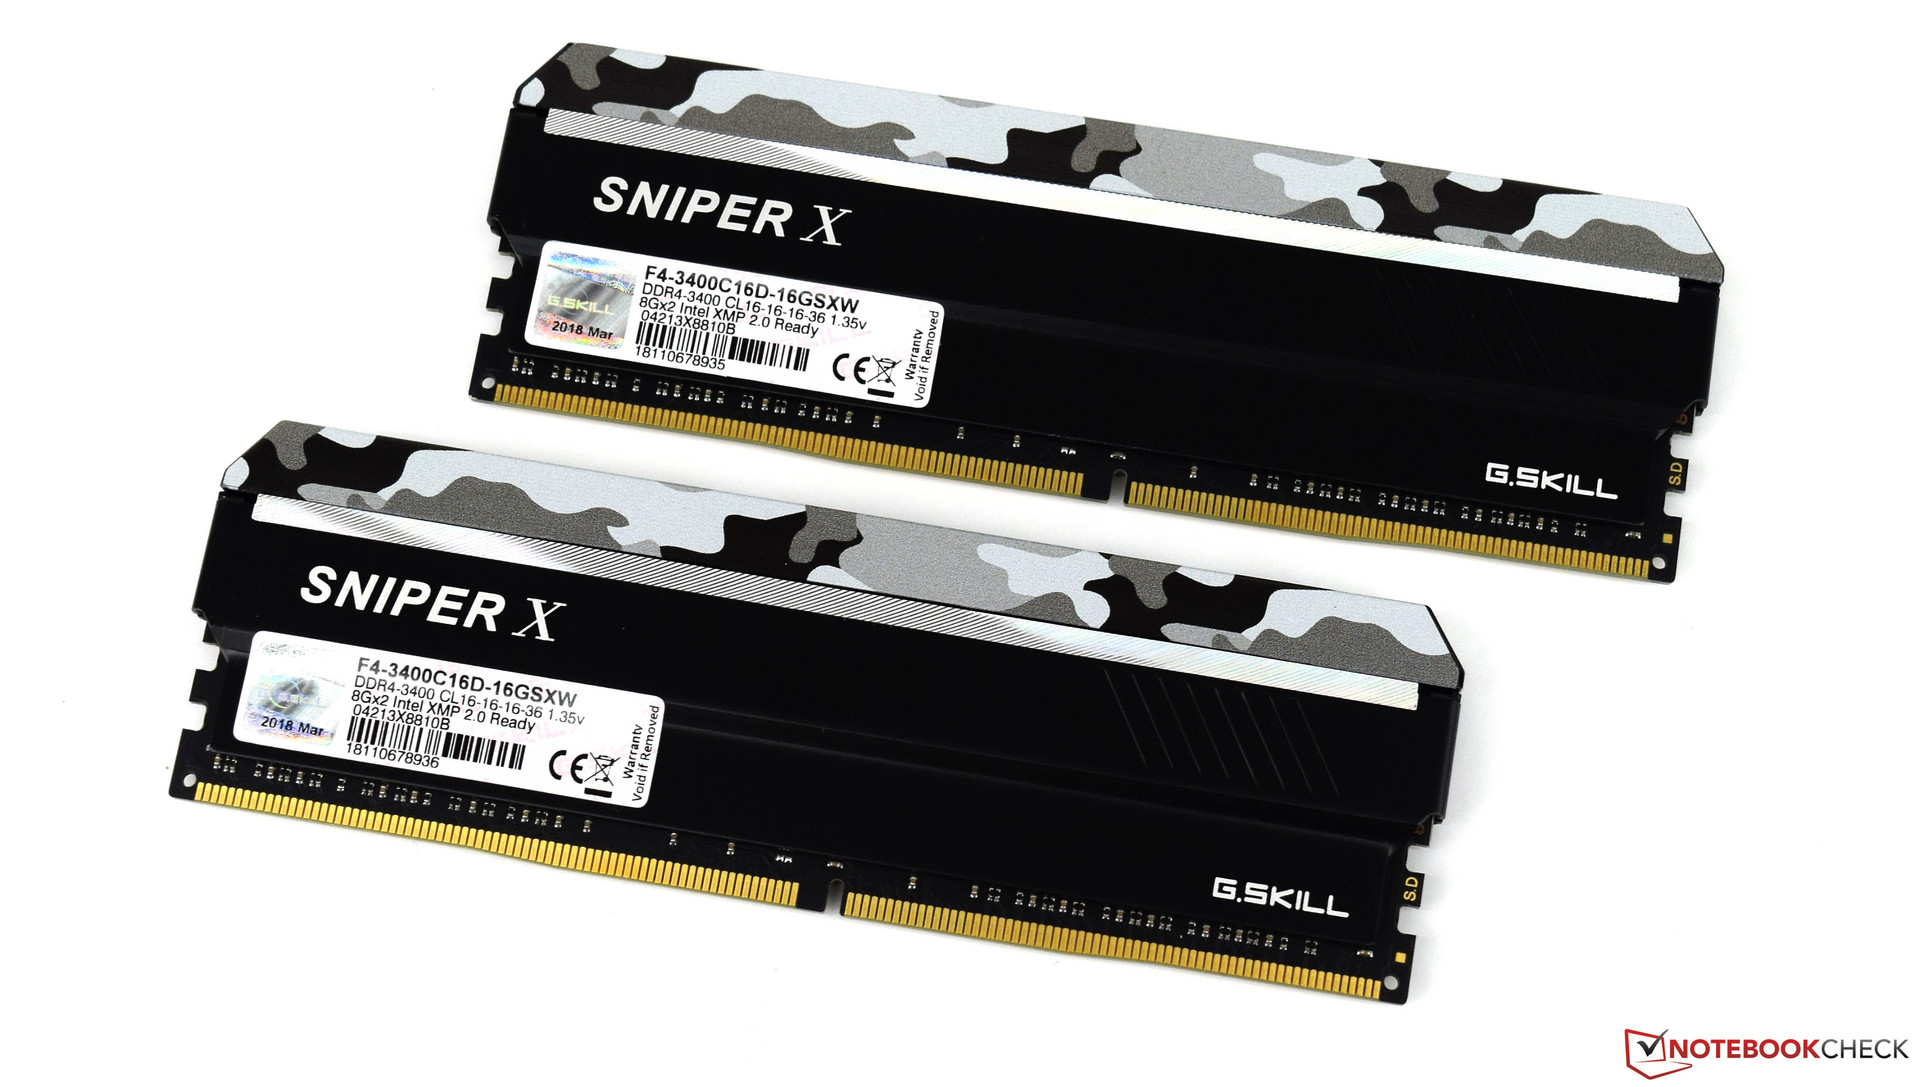
| RAM | G-Skill Sniper X 16 GB DDR4 3,400 MHz |
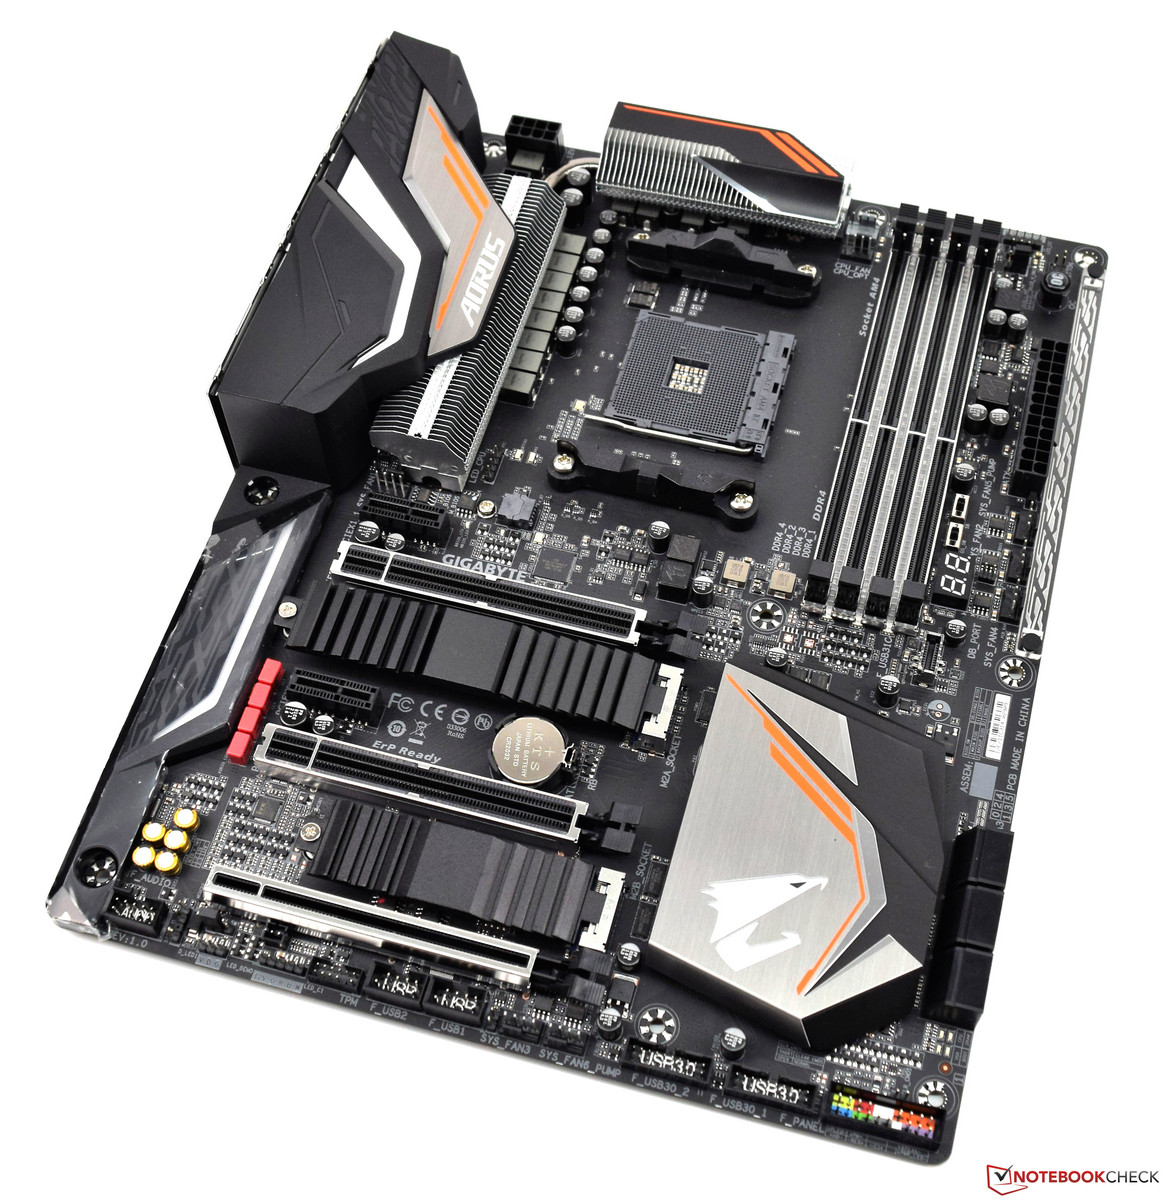
| Scheda madre | Gigabyte X470 Aorus Gaming 7 WiFi |
| Monitor | Acer Predator XB321HK 4K |
| SSD | ADATA SP900 M.2 SSD |
| HDD | 2 TB Western Digital – for games |
| OS | Microsoft Windows 10 Professional 64-Bit (Version 1809) |
| Drivers | NVIDIA 425.31 |
Prestazioni
L'AMP Extreme ha un clock di base da 1.410 MHz proprio come l'MSI RTX 2070 Gaming Z 8G e l'ASUS ROG Strix RTX 2070 OC che abbiamo già testato. Tuttavia, l'AMP Extreme ha un boost clock di 1.860 MHz, che è 30 MHz più alto dell'MSI e 45 MHz più alto dell'ASUS.
Zotac ha anche fissato il clock della VRAM dell'AMP Extreme a 1.800 MHz, che è 50 MHz più alto di quello che MSI e ASUS hanno previso per le loro schede. Vedremo quale differenza, se c'è, queste velocità di clock hanno sulle prestazioni nella nostra sezione dedicata ai benchmarks di gioco qui sotto.
Come accennato in precedenza in questa recensione, l'AMP Extreme ha un TDP da 225 W quando impostato su un target di potenza del 100% (PT), che è superiore di 50 W rispetto alla NVIDIA GeForce RTX 2070 Founders Edition. Per inciso, l'AMP Extreme ha lo stesso TDP dell'MSI, ma è leggermente più alto dell'ASUS.
Per ulteriori informazioni sull'RTX 2070 e su come si confronta con le altre GPU, consultare la nostra pagina GPU benchmarks.
Synthetic Benchmarks
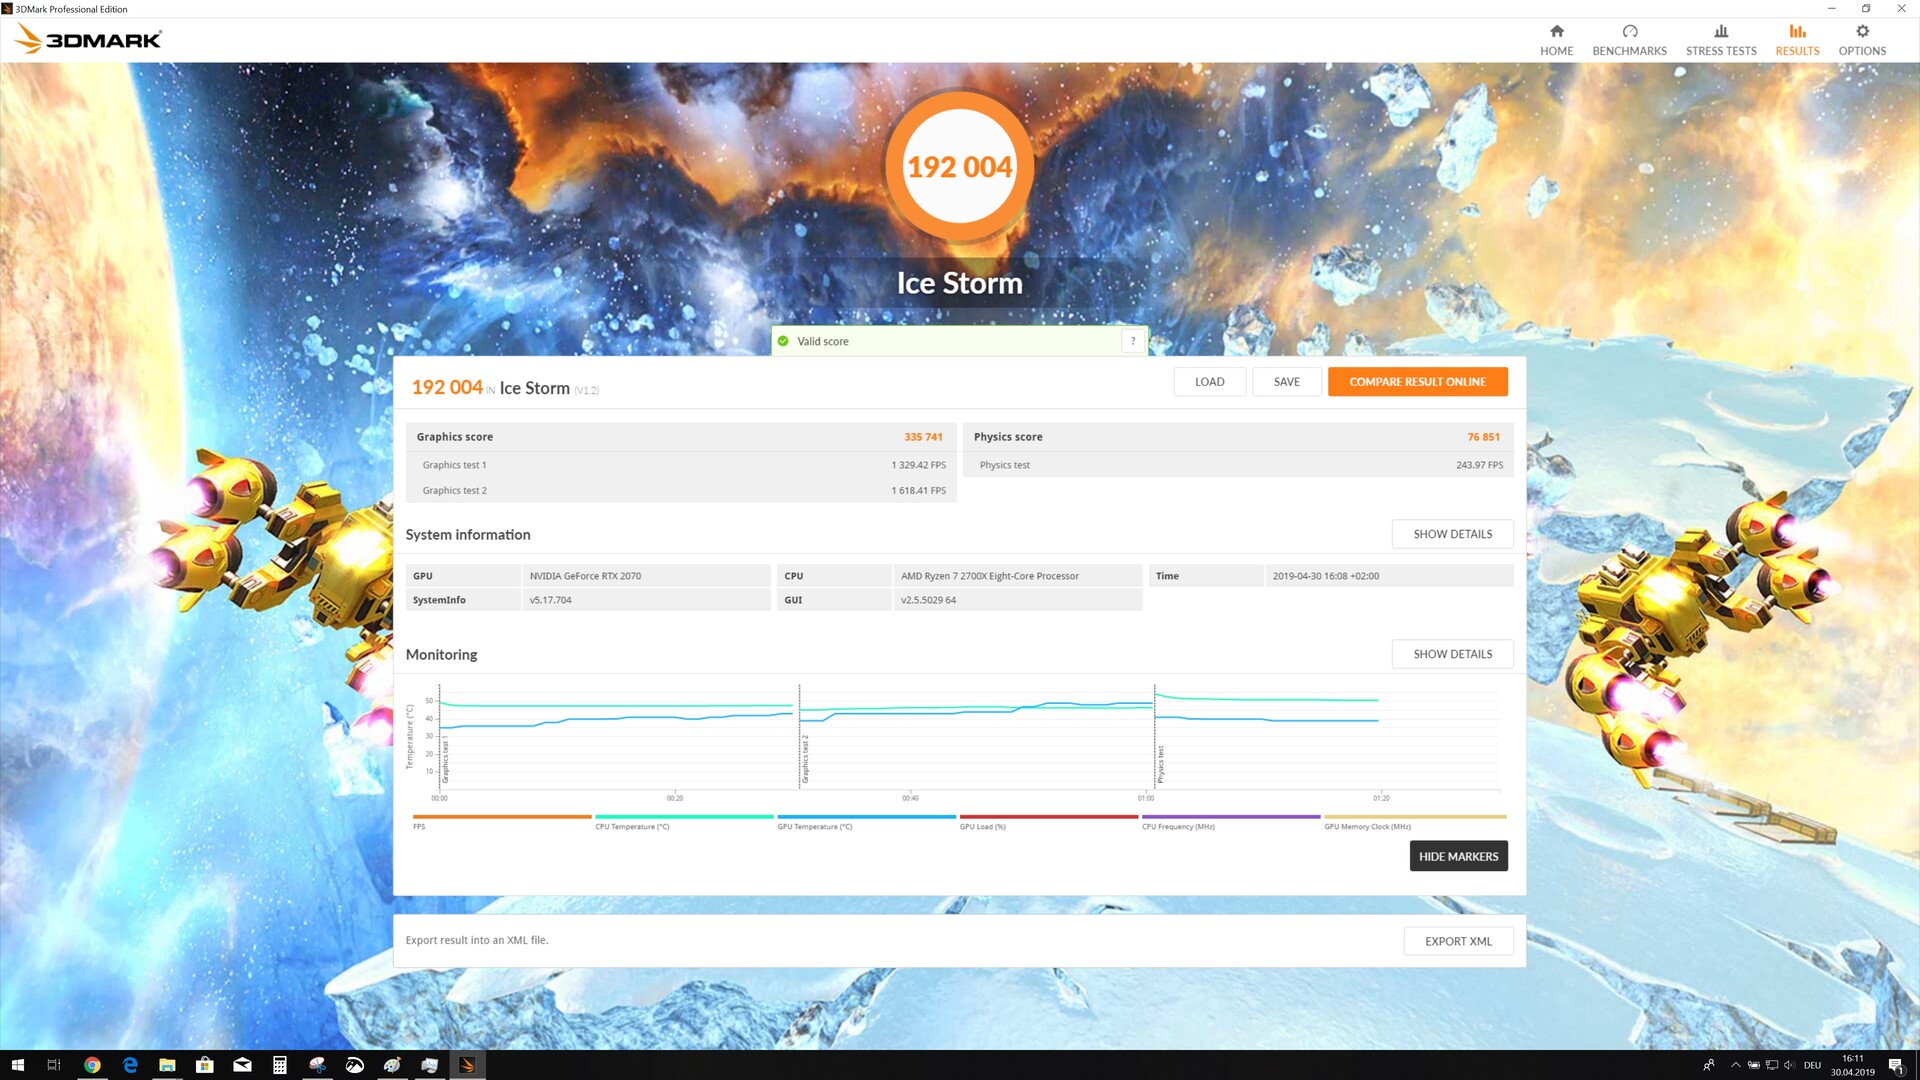
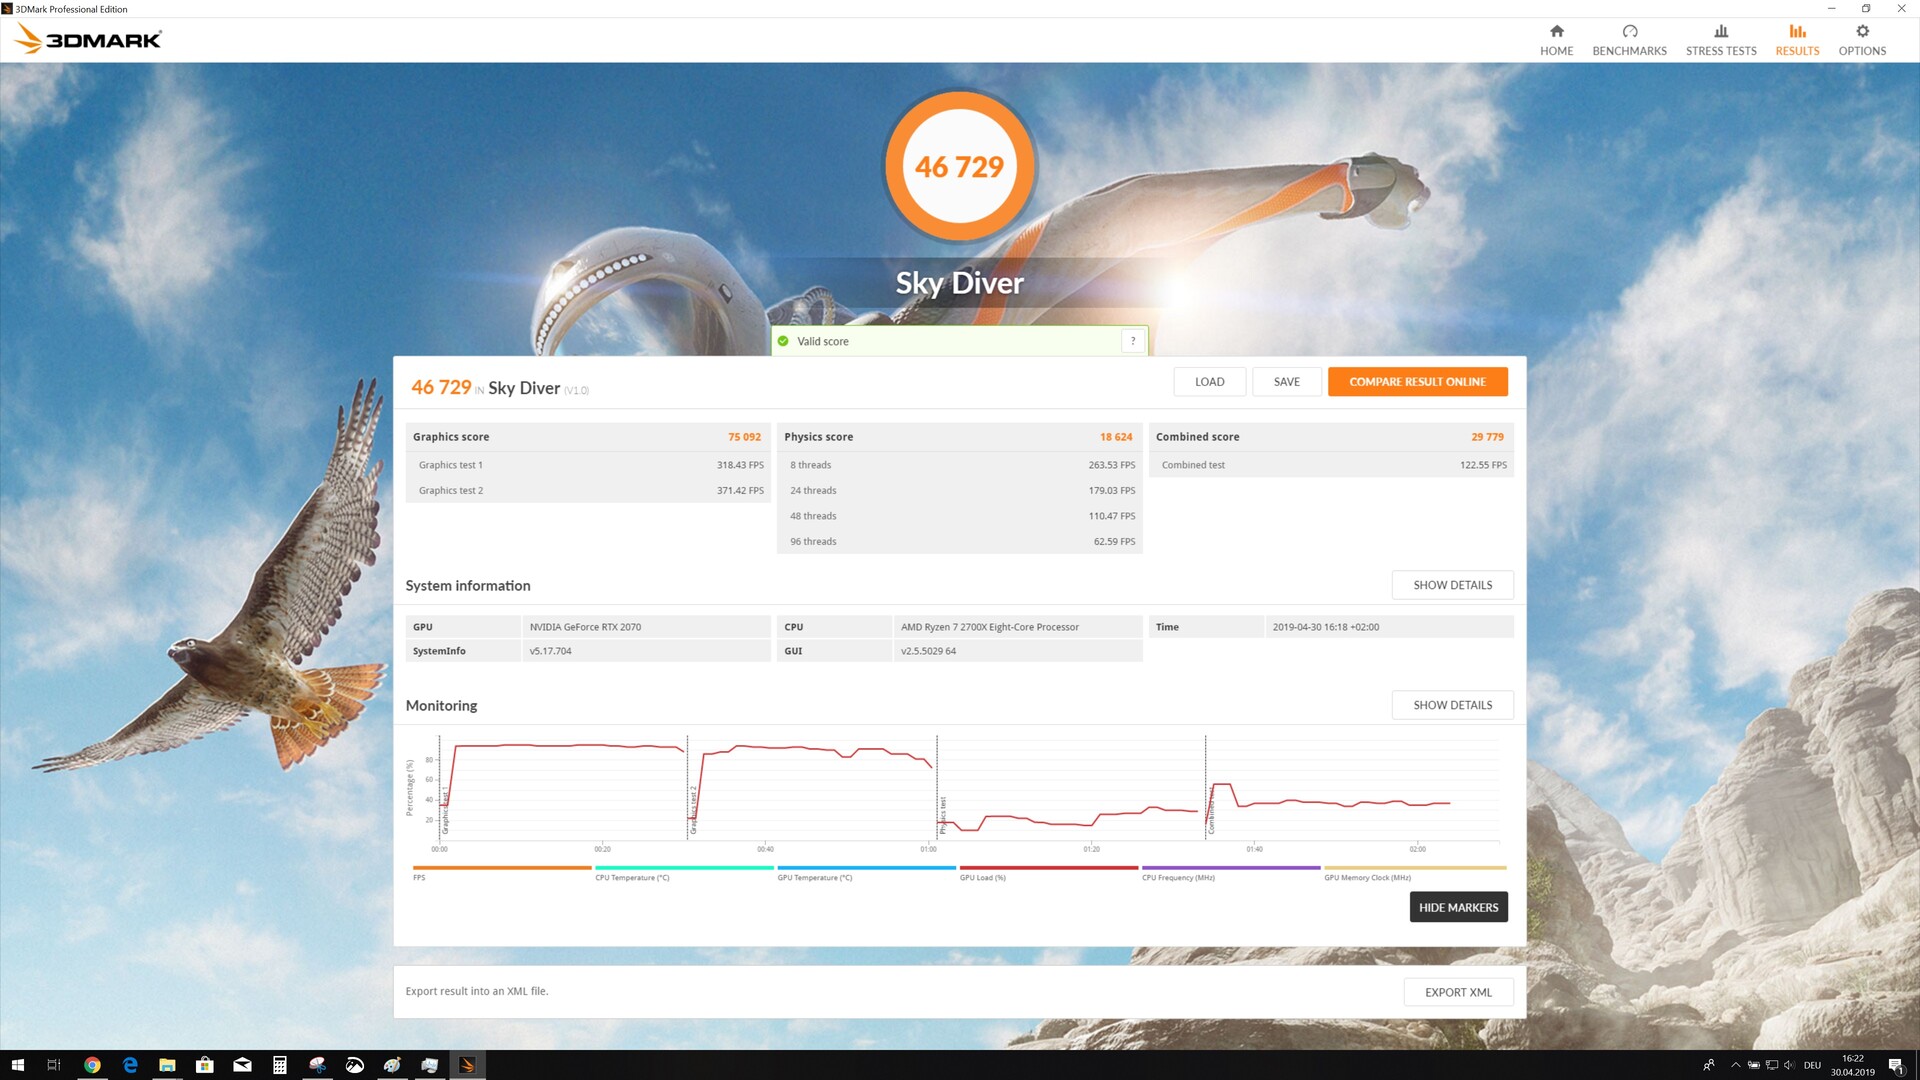
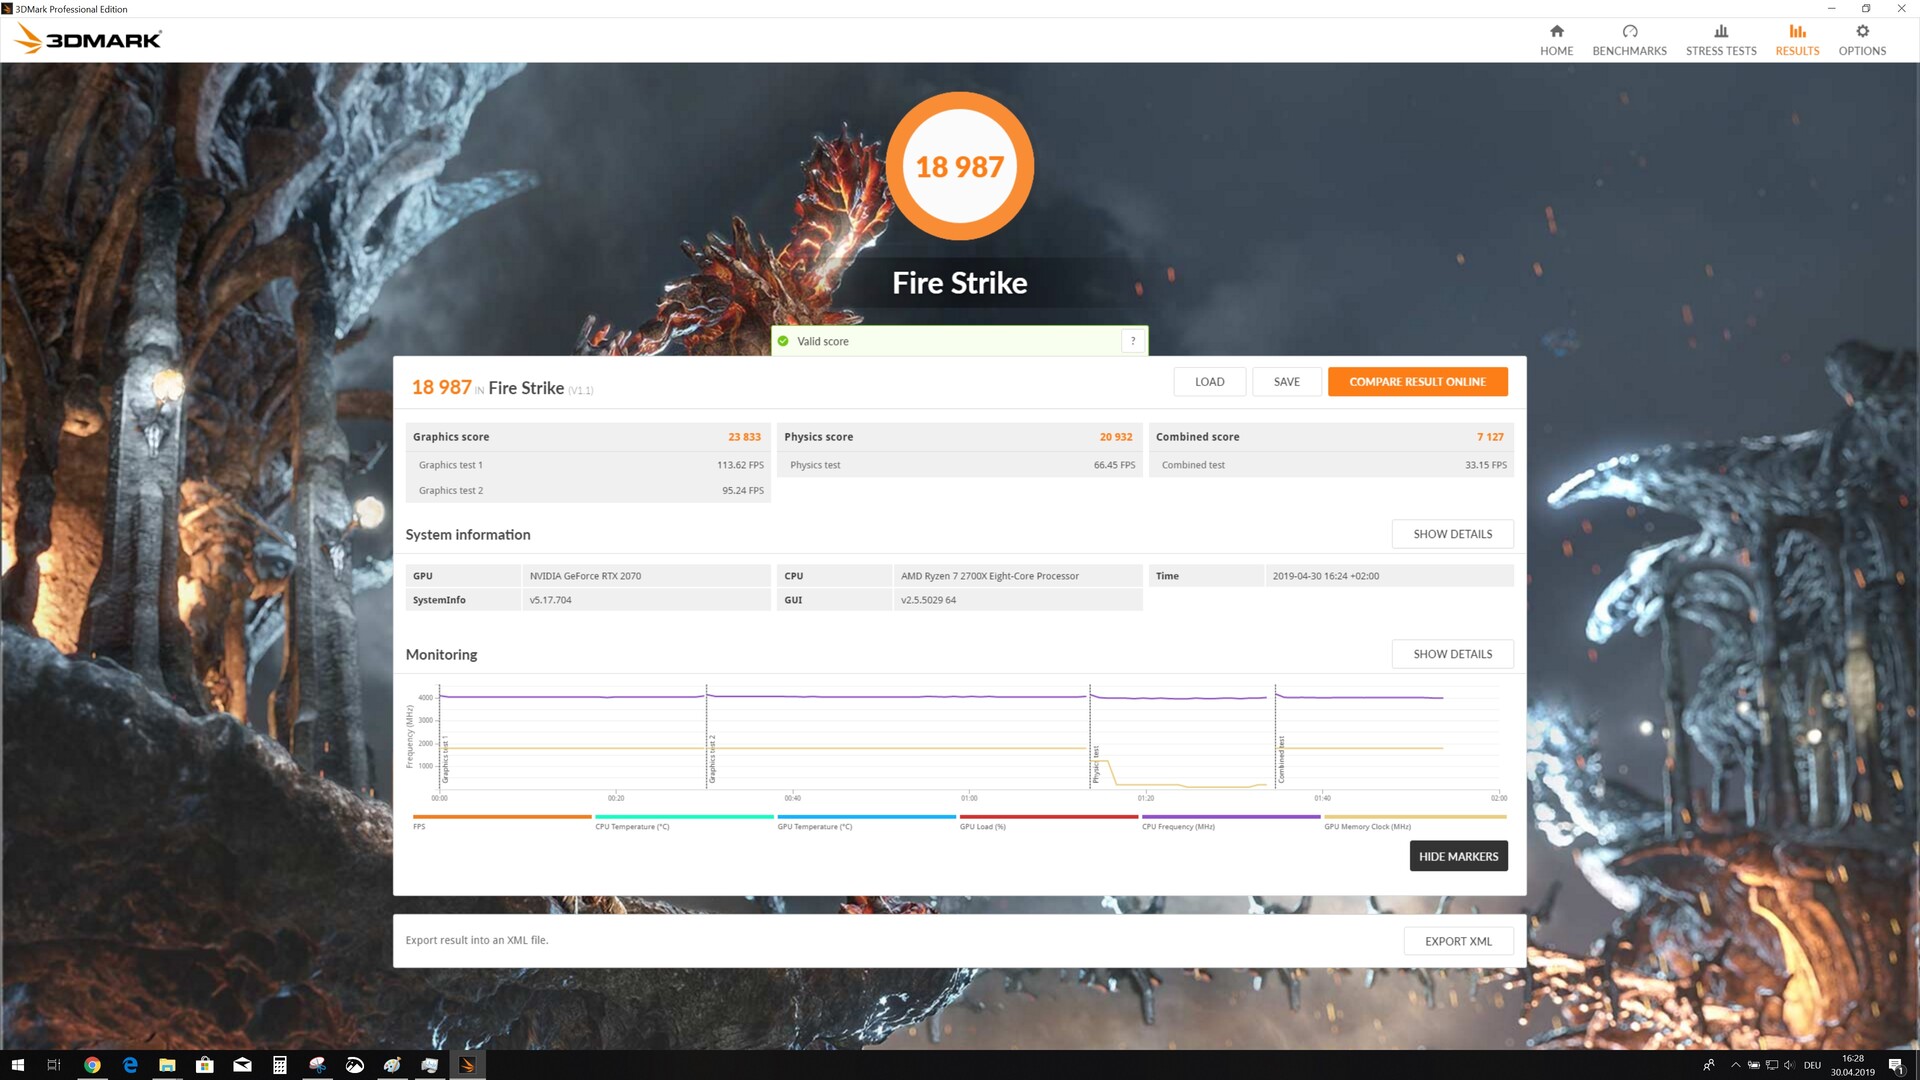
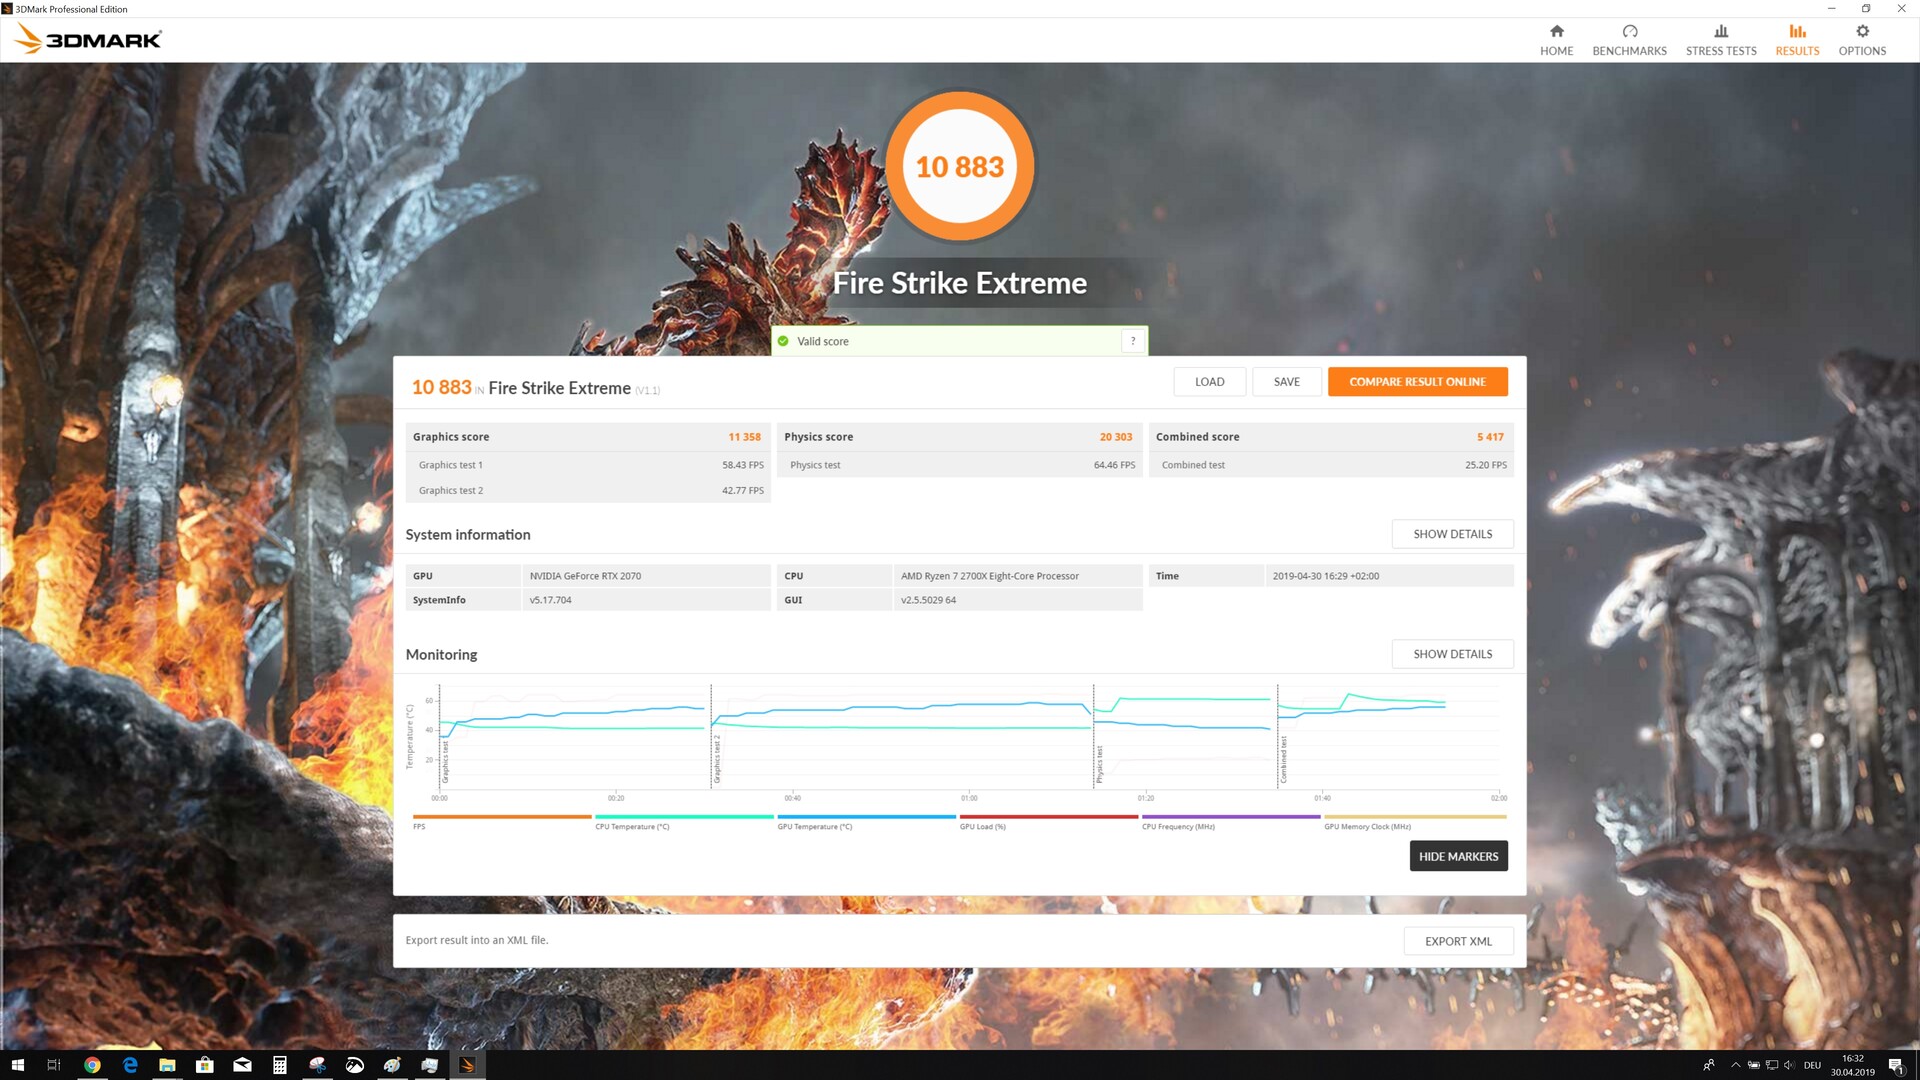
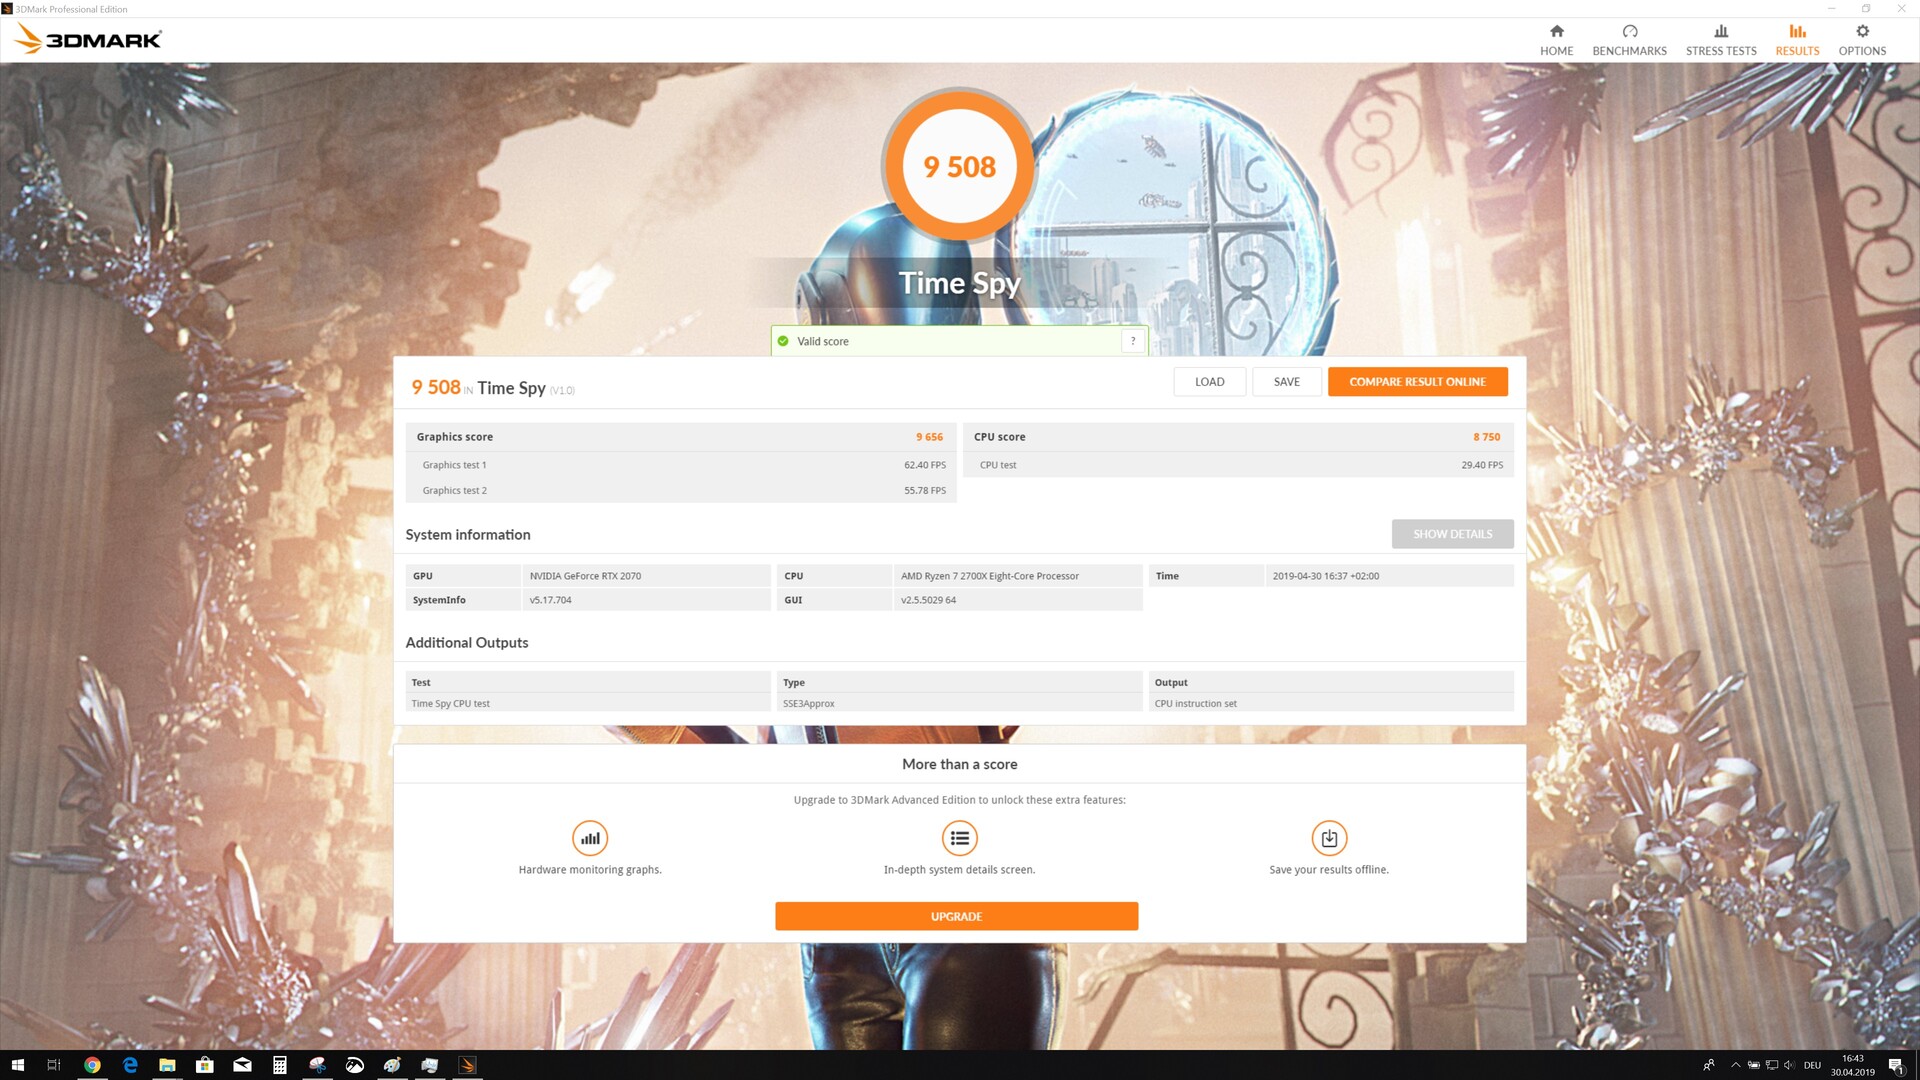
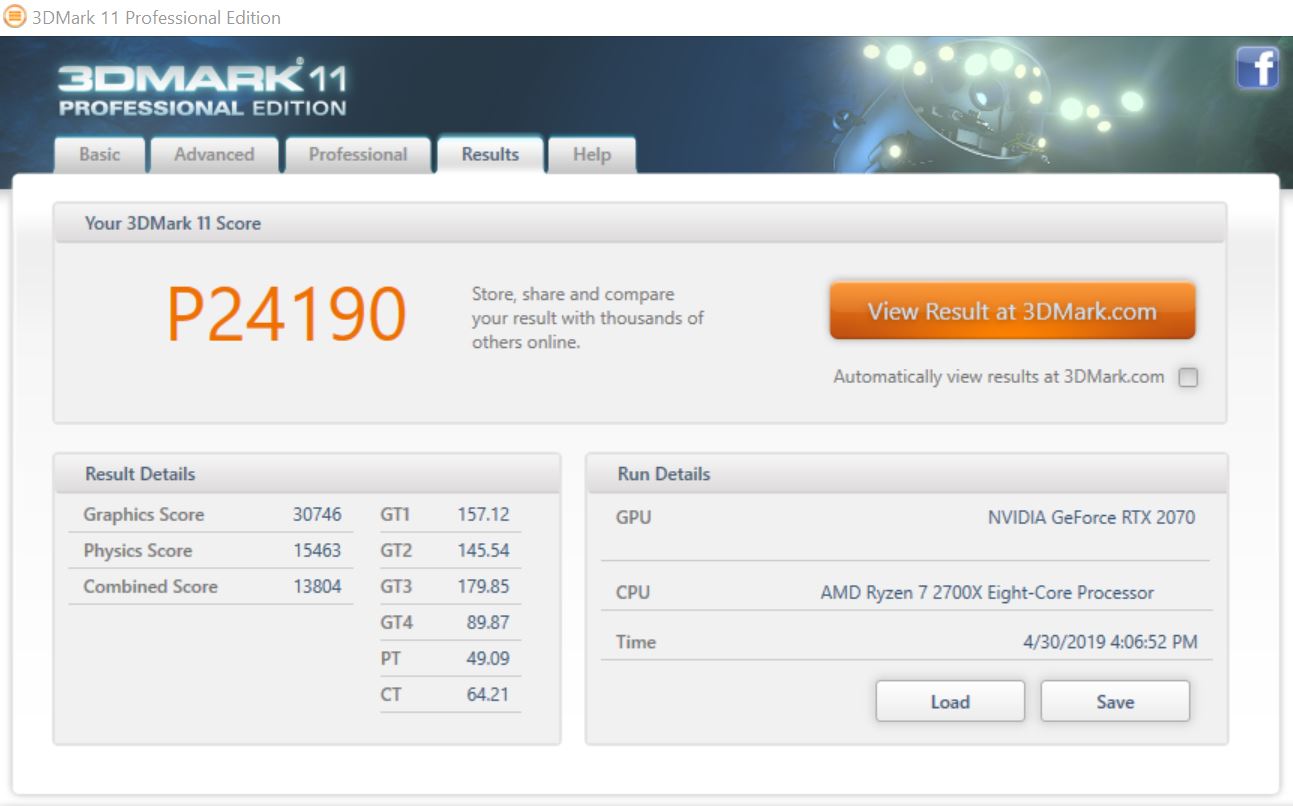
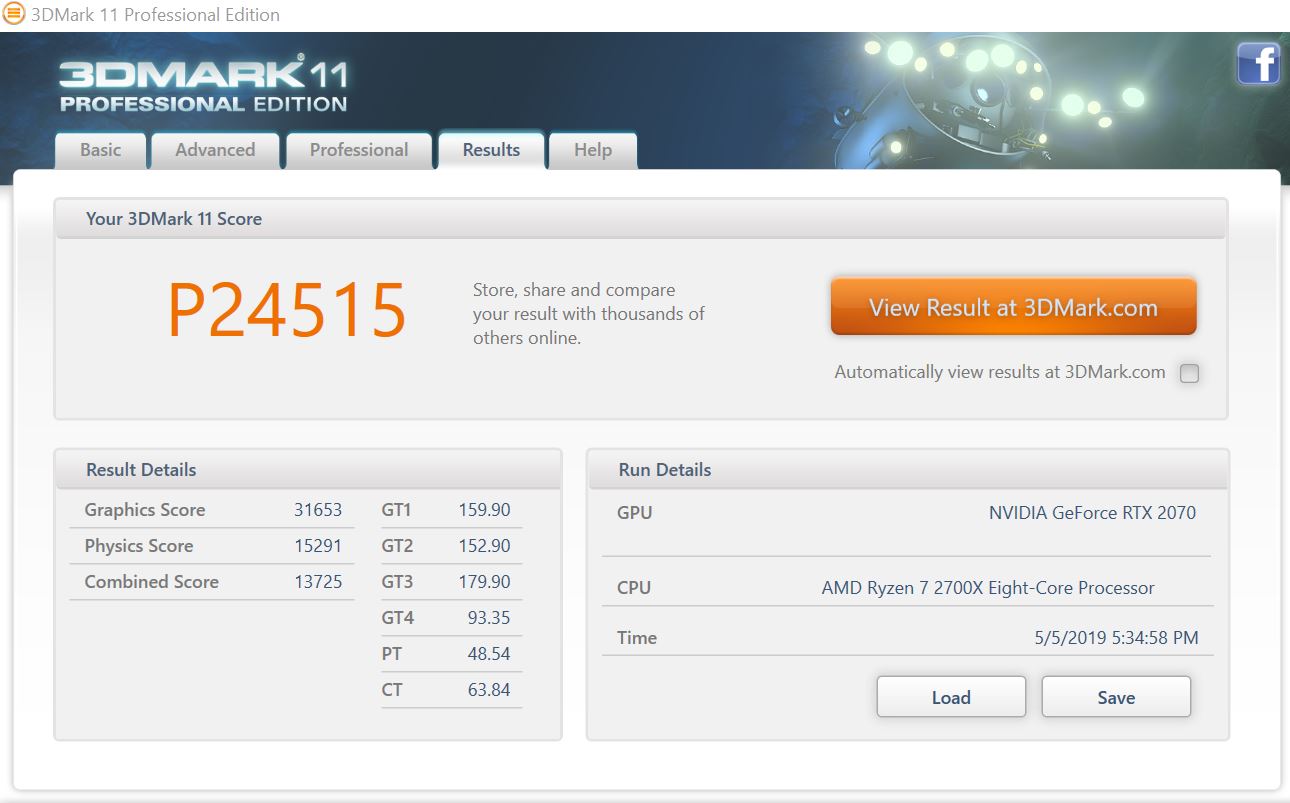
I benchmarks sintetici rivelano il potenziale dell'AMP Extreme. La nostra unità di prova supera di qualche punto percentuale le schede MSI e ASUS RTX 2070 nei benchmarks come Unigine Heaven 4.0 e 3DMark. L'AMP Extreme ha ottenuto tuttavia punteggi leggermente peggiori rispetto ai suoi concorrenti dell'RTX 2070 nel vecchio benchmark 3DMark 11,. Nel complesso, tutte e tre le carte RTX 2070 sono più o meno allo stesso livello. Qualsiasi differenza di prestazioni evidenziata nei benchmarks sintetici non è evidente nell'uso quotidiano.
L'AMP Extreme supera anche la GeForce GTX 1080 Founders Edition, ma non può eguagliare le prestazioni della GeForce GTX 1080 Ti Founders Edition. Le prestazioni dell'AMD Radeon VII non sono a portata di mano anche per l'AMP Extreme, la prima si trova generalmente tra la GeForce GTX 1080 Ti e la Titan X Pascal nei benchmarks sintetici. La nostra unità di prova ha ottenuto punteggi costantemente tra il 15 e il 30% superiori alla GeForce RTX 2060.
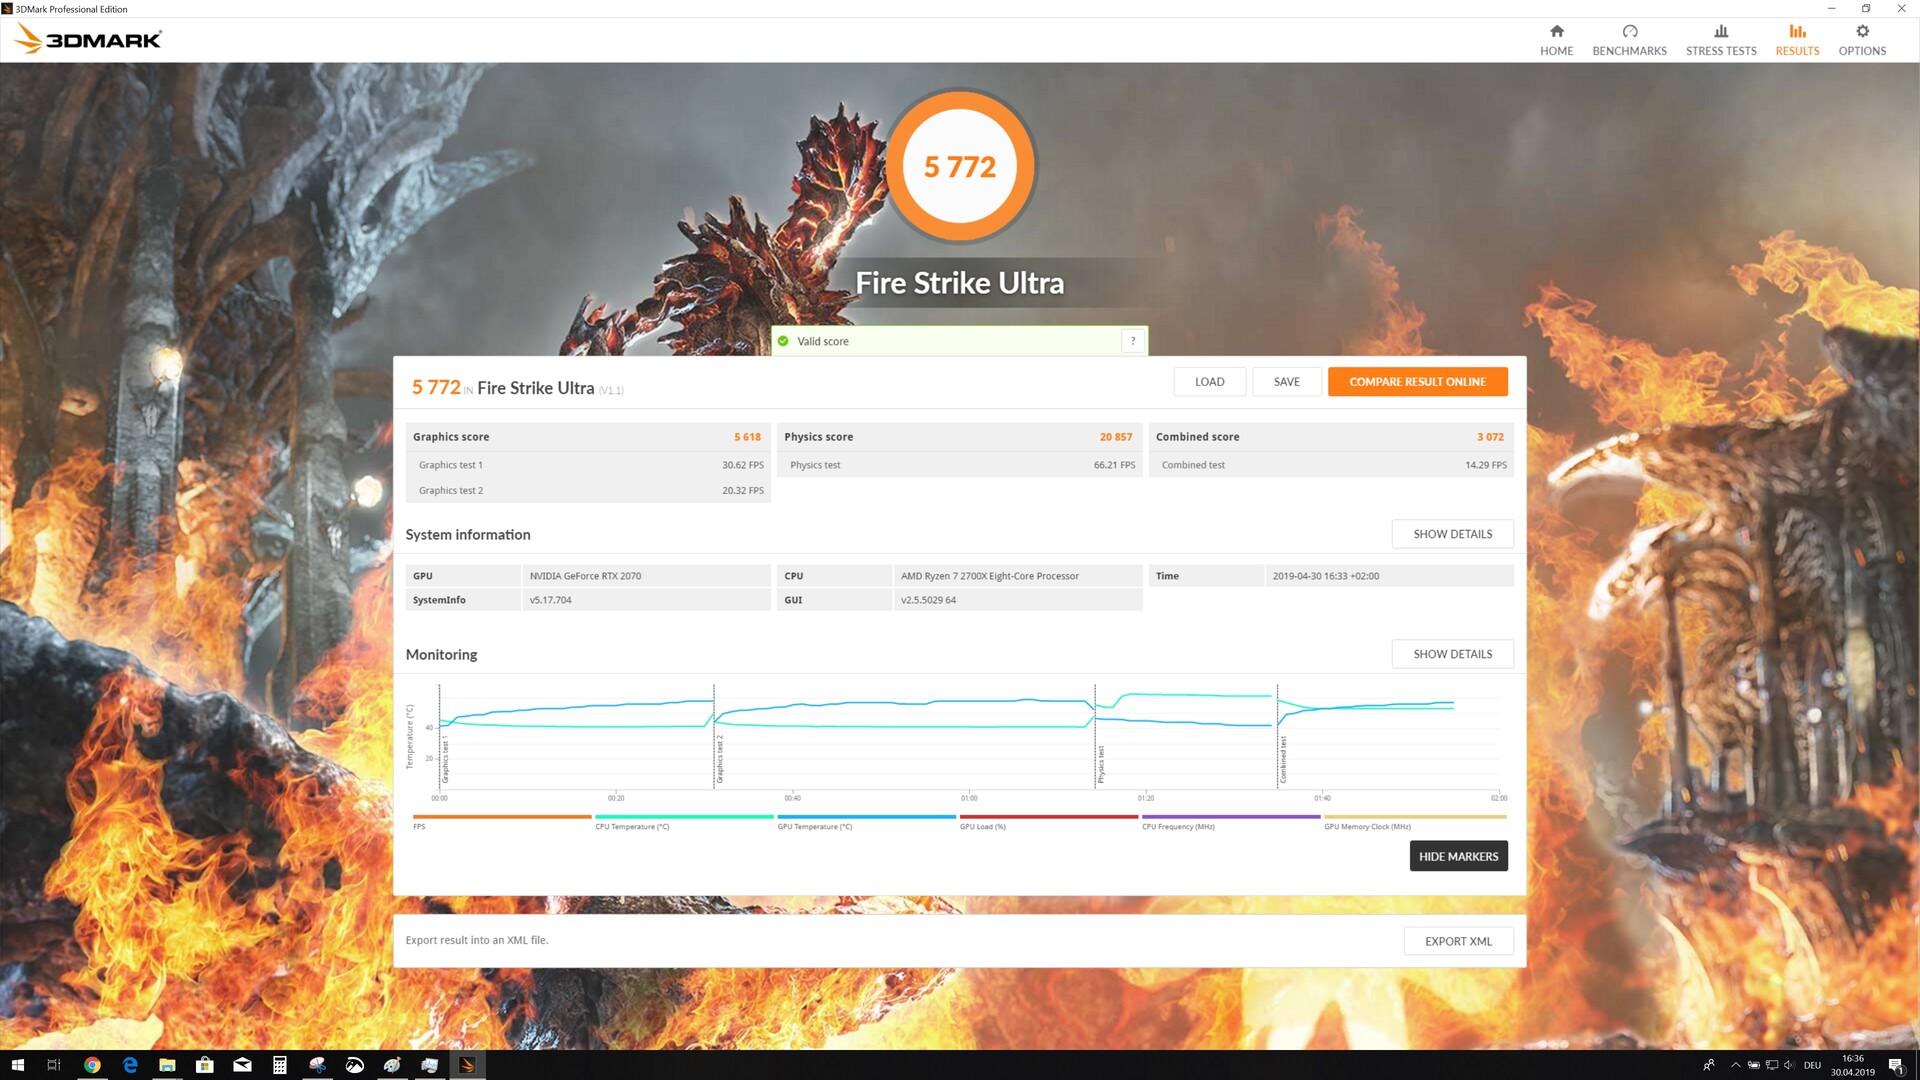
| 3DMark - 3840x2160 Fire Strike Ultra Graphics | |
| Nvidia Titan RTX | |
| NVIDIA Titan X Pascal | |
| AMD Radeon VII | |
| Nvidia GeForce GTX 1080 Ti Founders Edition | |
| MSI RTX 2080 Gaming X Trio | |
| Zotac GeForce RTX 2070 AMP Extreme | |
| Asus ROG Strix RTX 2070 OC | |
| MSI RTX 2070 Gaming Z 8G | |
| AMD Radeon RX Vega 64 | |
| Nvidia GeForce GTX 1080 Founders Edition | |
| MSI RTX 2060 Gaming Z 6G | |
| Nvidia GeForce GTX 1070 Founders Edition | |
| XFX AMD Radeon RX 590 OC+ 8 GB | |
| Asus ROG Strix RX 580 8 GB | |
| 3DMark 11 - 1280x720 Performance GPU | |
| Nvidia Titan RTX | |
| Nvidia GeForce GTX 1080 Ti Founders Edition | |
| MSI RTX 2080 Gaming X Trio | |
| AMD Radeon VII | |
| MSI Gaming X GeForce GTX 1080 Desktop PC | |
| Asus ROG Strix RTX 2070 OC | |
| MSI RTX 2070 Gaming Z 8G | |
| Zotac GeForce RTX 2070 AMP Extreme | |
| Nvidia GeForce GTX 1080 Founders Edition | |
| AMD Radeon RX Vega 64 | |
| NVIDIA Titan X Pascal | |
| MSI RTX 2060 Gaming Z 6G | |
| Nvidia GeForce GTX 1070 Founders Edition | |
| XFX AMD Radeon RX 590 OC+ 8 GB | |
| Asus ROG Strix RX 580 8 GB | |
| Unigine Heaven 4.0 - Extreme Preset DX11 | |
| Nvidia Titan RTX | |
| Nvidia GeForce GTX 1080 Ti Founders Edition | |
| MSI RTX 2080 Gaming X Trio | |
| Zotac GeForce RTX 2070 AMP Extreme | |
| MSI RTX 2070 Gaming Z 8G | |
| Asus ROG Strix RTX 2070 OC | |
| MSI Gaming X GeForce GTX 1080 Desktop PC | |
| AMD Radeon VII | |
| Nvidia GeForce GTX 1080 Founders Edition | |
| MSI RTX 2060 Gaming Z 6G | |
| Nvidia GeForce GTX 1070 Founders Edition | |
| Desktop PC | |
| XFX AMD Radeon RX 590 OC+ 8 GB | |
| Asus ROG Strix RX 580 8 GB | |
| Unigine Valley 1.0 - 1920x1080 Extreme HD DirectX AA:x8 | |
| Nvidia GeForce GTX 1080 Ti Founders Edition | |
| Nvidia Titan RTX | |
| MSI RTX 2080 Gaming X Trio | |
| Zotac GeForce RTX 2070 AMP Extreme | |
| Asus ROG Strix RTX 2070 OC | |
| MSI RTX 2070 Gaming Z 8G | |
| MSI Gaming X GeForce GTX 1080 Desktop PC | |
| AMD Radeon VII | |
| Nvidia GeForce GTX 1080 Founders Edition | |
| Nvidia GeForce GTX 1070 Founders Edition | |
| MSI RTX 2060 Gaming Z 6G | |
| XFX AMD Radeon RX 590 OC+ 8 GB | |
| Asus ROG Strix RX 580 8 GB | |
| 3DMark 03 Standard | 136483 punti | |
| 3DMark 05 Standard | 34535 punti | |
| 3DMark 06 Standard Score | 35659 punti | |
| 3DMark Vantage P Result | 62128 punti | |
| 3DMark 11 Performance | 26565 punti | |
| 3DMark Ice Storm Standard Score | 197964 punti | |
| 3DMark Cloud Gate Standard Score | 48366 punti | |
| 3DMark Fire Strike Score | 20451 punti | |
| 3DMark Fire Strike Extreme Score | 12092 punti | |
| 3DMark Time Spy Score | 8797 punti | |
Aiuto | ||
Gaming Benchmarks
L'AMP Extreme continua a sfruttare il suo potenziale nei test gaming. La nostra unità di prova ha avuto una media di framerate superiore a quella dei suoi concorrenti MSI e ASUS RTX 2070, anche se ci sono state alcune eccezioni. Nel complesso, tutte le schede RTX 2070 hanno dato buoni risultati nei nostri test di gioco, di cui l'AMP Extreme è il migliore. La differenza è però minima, con tutte e tre le carte separate da circa 10 FPS in giochi come "Call of Duty Black Ops 4". Sorprendentemente, l'MSI e l'ASUS sono ottimizzati meglio dell'AMP Extreme per alcuni giochi come "Battlefield V" e "GTA V", ma nel complesso la nostra unità di prova ha un vantaggio di prestazioni rispetto ai suoi contemporanei RTX 2070 con overclock. Il divario tra AMP Extreme e Radeon VII è inferiore nei test di gioco rispetto ai benchmarks sintetici, ma la GPU AMD da 7 nm raggiunge ancora migliori framerate rispetto alla nostra unità di prova.
Lo Zotac può facilmente riprodurre tutti i giochi che abbiamo testato a 1440p al massimo della grafica. Tuttavia la scheda inizia a mostrare i suoi limiti a 2160p al massimo della grafica in alcuni titoli a tripla A come "Anno 1800". La nostra unità di prova ha una media di 39,5 FPS in "Anno 1800" a queste impostazioni, che è giocabile, ma raccomandiamo di ridurre i livelli grafici per una migliore esperienza di gioco. Come sempre, resta da vedere se le future ottimizzazioni dei drivers o le patches di gioco miglioreranno le prestazioni al di là di quanto abbiamo visto in questi benchmarks di gioco.
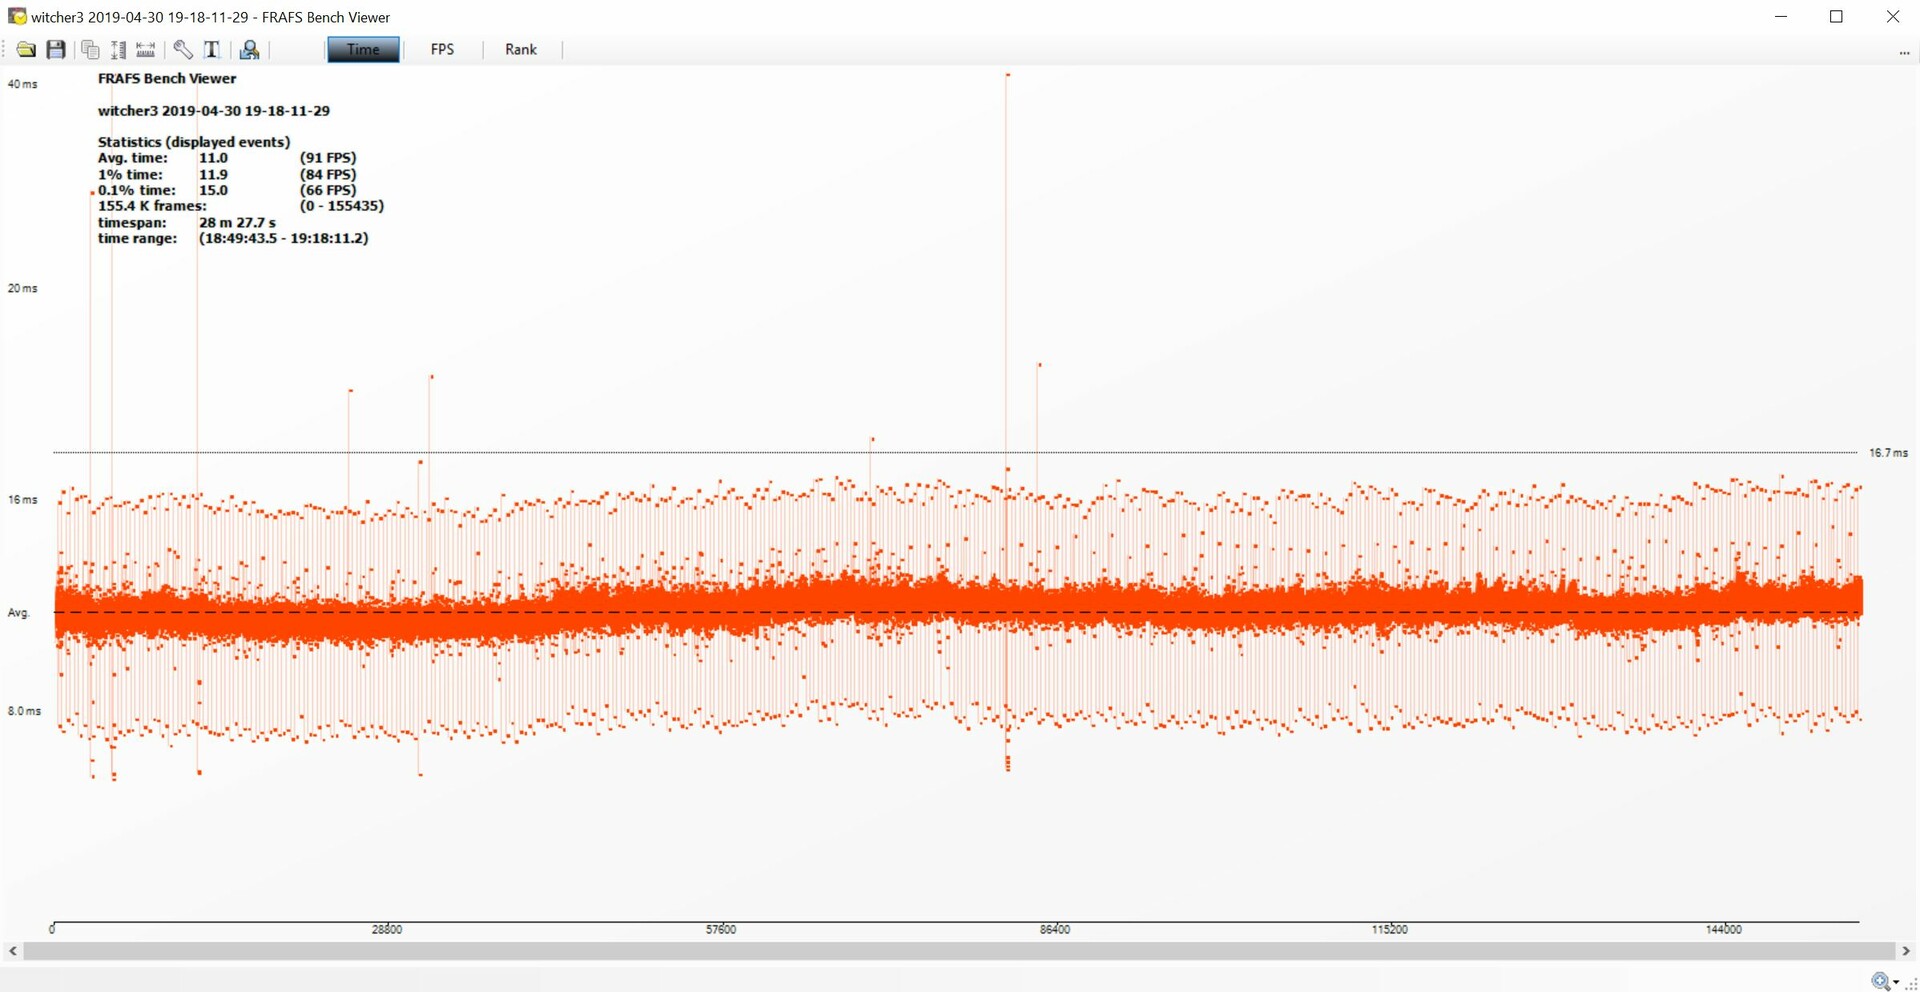
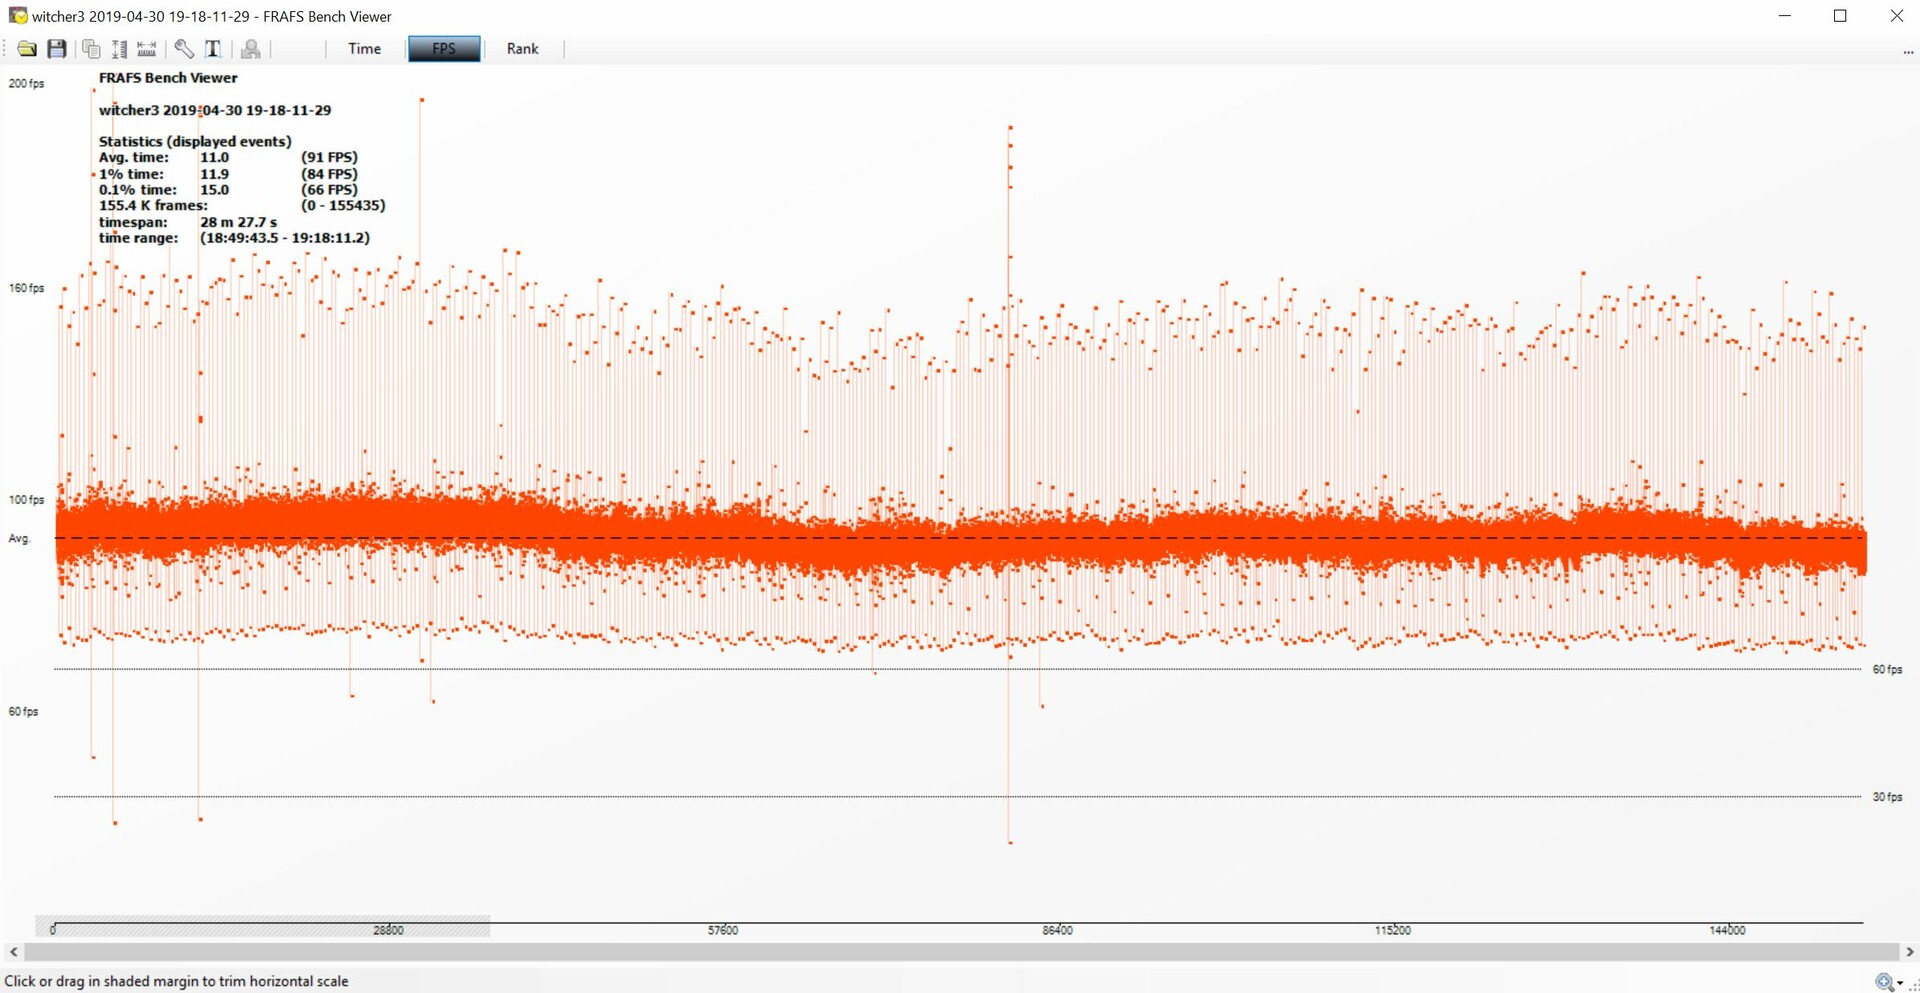
Guardando i framerate su una prolungata sessione "The Witcher 3" a ultra-grafica, diventa chiaro che l'AMP Extreme può mantenere le sue prestazioni di picco senza strozzature termiche. Il nostro dispositivo di test ha avuto una media di 91 FPS durante questo test e ha oscillato solo tra gli 86 e i 96 FPS, quindi non dovreste avere problemi a giocare ai moderni titoli a tripla A per ore e ore.
The Witcher 3: Framerates – Ultra Preset
| Call of Duty Black Ops 4 | |
| 1920x1080 Very High / On | |
| Nvidia Titan RTX | |
| MSI RTX 2080 Gaming X Trio | |
| AMD Radeon RX Vega 64 | |
| Zotac GeForce RTX 2070 AMP Extreme | |
| NVIDIA Titan X Pascal | |
| MSI RTX 2070 Gaming Z 8G | |
| Asus ROG Strix RTX 2070 OC | |
| AMD Radeon VII | |
| MSI RTX 2060 Gaming Z 6G | |
| XFX AMD Radeon RX 590 OC+ 8 GB | |
| Desktop PC | |
| 3840x2160 Very High / On | |
| Nvidia Titan RTX | |
| MSI RTX 2080 Gaming X Trio | |
| NVIDIA Titan X Pascal | |
| AMD Radeon RX Vega 64 | |
| AMD Radeon VII | |
| Zotac GeForce RTX 2070 AMP Extreme | |
| Asus ROG Strix RTX 2070 OC | |
| MSI RTX 2070 Gaming Z 8G | |
| MSI RTX 2060 Gaming Z 6G | |
| XFX AMD Radeon RX 590 OC+ 8 GB | |
| Desktop PC | |
| Assassin´s Creed Odyssey | |
| 1920x1080 Ultra High Preset | |
| Nvidia Titan RTX | |
| MSI RTX 2080 Gaming X Trio | |
| NVIDIA Titan X Pascal | |
| Zotac GeForce RTX 2070 AMP Extreme | |
| MSI RTX 2070 Gaming Z 8G | |
| AMD Radeon VII | |
| Asus ROG Strix RTX 2070 OC | |
| MSI RTX 2060 Gaming Z 6G | |
| AMD Radeon RX Vega 64 | |
| XFX AMD Radeon RX 590 OC+ 8 GB | |
| Desktop PC | |
| Asus ROG Strix RX 580 8 GB | |
| 3840x2160 Ultra High Preset | |
| Nvidia Titan RTX | |
| AMD Radeon VII | |
| MSI RTX 2080 Gaming X Trio | |
| NVIDIA Titan X Pascal | |
| Asus ROG Strix RTX 2070 OC | |
| MSI RTX 2070 Gaming Z 8G | |
| Zotac GeForce RTX 2070 AMP Extreme | |
| AMD Radeon RX Vega 64 | |
| MSI RTX 2060 Gaming Z 6G | |
| XFX AMD Radeon RX 590 OC+ 8 GB | |
| Desktop PC | |
| Asus ROG Strix RX 580 8 GB | |
| FIFA 19 | |
| 1920x1080 Ultra Preset AA:4x MS | |
| AMD Radeon RX Vega 64 | |
| Asus ROG Strix RX 580 8 GB | |
| Desktop PC | |
| Nvidia Titan RTX | |
| XFX AMD Radeon RX 590 OC+ 8 GB | |
| MSI RTX 2080 Gaming X Trio | |
| AMD Radeon VII | |
| Zotac GeForce RTX 2070 AMP Extreme | |
| NVIDIA Titan X Pascal | |
| Asus ROG Strix RTX 2070 OC | |
| MSI RTX 2070 Gaming Z 8G | |
| MSI RTX 2060 Gaming Z 6G | |
| 3840x2160 Ultra Preset AA:4x MS | |
| Nvidia Titan RTX | |
| AMD Radeon VII | |
| NVIDIA Titan X Pascal | |
| Asus ROG Strix RTX 2070 OC | |
| MSI RTX 2080 Gaming X Trio | |
| Zotac GeForce RTX 2070 AMP Extreme | |
| MSI RTX 2070 Gaming Z 8G | |
| AMD Radeon RX Vega 64 | |
| MSI RTX 2060 Gaming Z 6G | |
| Desktop PC | |
| Asus ROG Strix RX 580 8 GB | |
| XFX AMD Radeon RX 590 OC+ 8 GB | |
| Forza Horizon 4 | |
| 1920x1080 Ultra Preset AA:2xMS | |
| MSI RTX 2080 Gaming X Trio | |
| Nvidia Titan RTX | |
| AMD Radeon VII | |
| AMD Radeon RX Vega 64 | |
| Zotac GeForce RTX 2070 AMP Extreme | |
| MSI RTX 2070 Gaming Z 8G | |
| NVIDIA Titan X Pascal | |
| Asus ROG Strix RTX 2070 OC | |
| MSI RTX 2060 Gaming Z 6G | |
| XFX AMD Radeon RX 590 OC+ 8 GB | |
| Asus ROG Strix RX 580 8 GB | |
| Desktop PC | |
| 3840x2160 Ultra Preset AA:2xMS | |
| Nvidia Titan RTX | |
| MSI RTX 2080 Gaming X Trio | |
| AMD Radeon VII | |
| NVIDIA Titan X Pascal | |
| Zotac GeForce RTX 2070 AMP Extreme | |
| MSI RTX 2070 Gaming Z 8G | |
| AMD Radeon RX Vega 64 | |
| Asus ROG Strix RTX 2070 OC | |
| MSI RTX 2060 Gaming Z 6G | |
| XFX AMD Radeon RX 590 OC+ 8 GB | |
| Asus ROG Strix RX 580 8 GB | |
| Desktop PC | |
| F1 2018 | |
| 1920x1080 Ultra High Preset AA:T AF:16x | |
| Nvidia Titan RTX | |
| MSI RTX 2080 Gaming X Trio | |
| AMD Radeon VII | |
| Zotac GeForce RTX 2070 AMP Extreme | |
| MSI RTX 2070 Gaming Z 8G | |
| Asus ROG Strix RTX 2070 OC | |
| NVIDIA Titan X Pascal | |
| MSI RTX 2060 Gaming Z 6G | |
| AMD Radeon RX Vega 64 | |
| XFX AMD Radeon RX 590 OC+ 8 GB | |
| Asus ROG Strix RX 580 8 GB | |
| Desktop PC | |
| 3840x2160 Ultra High Preset AA:T AF:16x | |
| Nvidia Titan RTX | |
| MSI RTX 2080 Gaming X Trio | |
| NVIDIA Titan X Pascal | |
| AMD Radeon VII | |
| Zotac GeForce RTX 2070 AMP Extreme | |
| MSI RTX 2070 Gaming Z 8G | |
| Asus ROG Strix RTX 2070 OC | |
| MSI RTX 2060 Gaming Z 6G | |
| AMD Radeon RX Vega 64 | |
| XFX AMD Radeon RX 590 OC+ 8 GB | |
| Desktop PC | |
| Monster Hunter World | |
| 1920x1080 Highest Preset (Image Quality High) | |
| Nvidia Titan RTX | |
| MSI RTX 2080 Gaming X Trio | |
| NVIDIA Titan X Pascal | |
| Zotac GeForce RTX 2070 AMP Extreme | |
| MSI RTX 2070 Gaming Z 8G | |
| Asus ROG Strix RTX 2070 OC | |
| AMD Radeon VII | |
| MSI RTX 2060 Gaming Z 6G | |
| AMD Radeon RX Vega 64 | |
| XFX AMD Radeon RX 590 OC+ 8 GB | |
| Asus ROG Strix RX 580 8 GB | |
| Desktop PC | |
| 3840x2160 Highest Preset (Image Quality High) | |
| Nvidia Titan RTX | |
| MSI RTX 2080 Gaming X Trio | |
| NVIDIA Titan X Pascal | |
| AMD Radeon VII | |
| MSI RTX 2070 Gaming Z 8G | |
| Zotac GeForce RTX 2070 AMP Extreme | |
| Asus ROG Strix RTX 2070 OC | |
| AMD Radeon RX Vega 64 | |
| MSI RTX 2060 Gaming Z 6G | |
| XFX AMD Radeon RX 590 OC+ 8 GB | |
| Asus ROG Strix RX 580 8 GB | |
| Desktop PC | |
| Far Cry 5 | |
| 1920x1080 Ultra Preset AA:T | |
| MSI RTX 2080 Gaming X Trio | |
| Asus ROG Strix RTX 2070 OC | |
| Zotac GeForce RTX 2070 AMP Extreme | |
| Nvidia Titan RTX | |
| MSI RTX 2070 Gaming Z 8G | |
| AMD Radeon RX Vega 64 | |
| MSI RTX 2060 Gaming Z 6G | |
| AMD Radeon VII | |
| NVIDIA Titan X Pascal | |
| XFX AMD Radeon RX 590 OC+ 8 GB | |
| Desktop PC | |
| Asus ROG Strix RX 580 8 GB | |
| 3840x2160 Ultra Preset AA:T | |
| Nvidia Titan RTX | |
| MSI RTX 2080 Gaming X Trio | |
| AMD Radeon VII | |
| NVIDIA Titan X Pascal | |
| Zotac GeForce RTX 2070 AMP Extreme | |
| Asus ROG Strix RTX 2070 OC | |
| MSI RTX 2070 Gaming Z 8G | |
| AMD Radeon RX Vega 64 | |
| MSI RTX 2060 Gaming Z 6G | |
| Asus ROG Strix RX 580 8 GB | |
| XFX AMD Radeon RX 590 OC+ 8 GB | |
| Desktop PC | |
| The Crew 2 | |
| 1920x1080 Ultra Preset | |
| Desktop PC | |
| NVIDIA Titan X Pascal | |
| Asus ROG Strix RX 580 8 GB | |
| Asus ROG Strix RTX 2070 OC | |
| XFX AMD Radeon RX 590 OC+ 8 GB | |
| Nvidia Titan RTX | |
| MSI RTX 2060 Gaming Z 6G | |
| MSI RTX 2070 Gaming Z 8G | |
| MSI RTX 2080 Gaming X Trio | |
| AMD Radeon VII | |
| Zotac GeForce RTX 2070 AMP Extreme | |
| 3840x2160 Ultra Preset | |
| Nvidia Titan RTX | |
| MSI RTX 2080 Gaming X Trio | |
| Asus ROG Strix RTX 2070 OC | |
| NVIDIA Titan X Pascal | |
| Zotac GeForce RTX 2070 AMP Extreme | |
| MSI RTX 2070 Gaming Z 8G | |
| AMD Radeon VII | |
| MSI RTX 2060 Gaming Z 6G | |
| Asus ROG Strix RX 580 8 GB | |
| XFX AMD Radeon RX 590 OC+ 8 GB | |
| Desktop PC | |
| Assassin´s Creed Origins | |
| 1920x1080 Ultra High Preset | |
| Nvidia Titan RTX | |
| MSI RTX 2080 Gaming X Trio | |
| Zotac GeForce RTX 2070 AMP Extreme | |
| Asus ROG Strix RTX 2070 OC | |
| MSI RTX 2070 Gaming Z 8G | |
| Nvidia GeForce GTX 1080 Ti Founders Edition | |
| MSI RTX 2060 Gaming Z 6G | |
| AMD Radeon RX Vega 64 | |
| AMD Radeon VII | |
| Desktop PC | |
| XFX AMD Radeon RX 590 OC+ 8 GB | |
| Asus ROG Strix RX 580 8 GB | |
| 3840x2160 Ultra High Preset | |
| Nvidia Titan RTX | |
| MSI RTX 2080 Gaming X Trio | |
| Nvidia GeForce GTX 1080 Ti Founders Edition | |
| AMD Radeon VII | |
| Zotac GeForce RTX 2070 AMP Extreme | |
| Asus ROG Strix RTX 2070 OC | |
| MSI RTX 2070 Gaming Z 8G | |
| MSI RTX 2060 Gaming Z 6G | |
| AMD Radeon RX Vega 64 | |
| XFX AMD Radeon RX 590 OC+ 8 GB | |
| Desktop PC | |
| Asus ROG Strix RX 580 8 GB | |
| Kingdom Come: Deliverance | |
| 1920x1080 Ultra High Preset | |
| Asus ROG Strix RTX 2070 OC | |
| Nvidia Titan RTX | |
| Zotac GeForce RTX 2070 AMP Extreme | |
| MSI RTX 2080 Gaming X Trio | |
| MSI RTX 2070 Gaming Z 8G | |
| Nvidia GeForce GTX 1080 Ti Founders Edition | |
| AMD Radeon RX Vega 64 | |
| AMD Radeon VII | |
| MSI RTX 2060 Gaming Z 6G | |
| XFX AMD Radeon RX 590 OC+ 8 GB | |
| Desktop PC | |
| Asus ROG Strix RX 580 8 GB | |
| 3840x2160 Ultra High Preset | |
| Nvidia Titan RTX | |
| MSI RTX 2080 Gaming X Trio | |
| AMD Radeon RX Vega 64 | |
| Zotac GeForce RTX 2070 AMP Extreme | |
| Nvidia GeForce GTX 1080 Ti Founders Edition | |
| Asus ROG Strix RTX 2070 OC | |
| AMD Radeon VII | |
| MSI RTX 2070 Gaming Z 8G | |
| MSI RTX 2060 Gaming Z 6G | |
| XFX AMD Radeon RX 590 OC+ 8 GB | |
| Asus ROG Strix RX 580 8 GB | |
| Desktop PC | |
| Fortnite | |
| 1920x1080 Epic Preset | |
| Nvidia GeForce GTX 1080 Ti Founders Edition | |
| Zotac GeForce RTX 2070 AMP Extreme | |
| Asus ROG Strix RTX 2070 OC | |
| MSI RTX 2080 Gaming X Trio | |
| MSI RTX 2060 Gaming Z 6G | |
| MSI RTX 2070 Gaming Z 8G | |
| Nvidia Titan RTX | |
| AMD Radeon VII | |
| XFX AMD Radeon RX 590 OC+ 8 GB | |
| Desktop PC | |
| Asus ROG Strix RX 580 8 GB | |
| 3840x2160 Epic Preset | |
| Nvidia Titan RTX | |
| MSI RTX 2080 Gaming X Trio | |
| Asus ROG Strix RTX 2070 OC | |
| MSI RTX 2070 Gaming Z 8G | |
| Zotac GeForce RTX 2070 AMP Extreme | |
| Nvidia GeForce GTX 1080 Ti Founders Edition | |
| AMD Radeon VII | |
| MSI RTX 2060 Gaming Z 6G | |
| XFX AMD Radeon RX 590 OC+ 8 GB | |
| Desktop PC | |
| Asus ROG Strix RX 580 8 GB | |
| Final Fantasy XV Benchmark | |
| 1920x1080 High Quality | |
| Nvidia Titan RTX | |
| MSI RTX 2080 Gaming X Trio | |
| Nvidia GeForce GTX 1080 Ti Founders Edition | |
| Zotac GeForce RTX 2070 AMP Extreme | |
| Asus ROG Strix RTX 2070 OC | |
| MSI RTX 2070 Gaming Z 8G | |
| MSI RTX 2060 Gaming Z 6G | |
| Nvidia GeForce GTX 1080 Founders Edition | |
| AMD Radeon RX Vega 64 | |
| AMD Radeon RX Vega 64 | |
| Desktop PC | |
| XFX AMD Radeon RX 590 OC+ 8 GB | |
| Asus ROG Strix RX 580 8 GB | |
| 3840x2160 High Quality | |
| Nvidia Titan RTX | |
| MSI RTX 2080 Gaming X Trio | |
| Nvidia GeForce GTX 1080 Ti Founders Edition | |
| Zotac GeForce RTX 2070 AMP Extreme | |
| Asus ROG Strix RTX 2070 OC | |
| MSI RTX 2070 Gaming Z 8G | |
| MSI RTX 2060 Gaming Z 6G | |
| Nvidia GeForce GTX 1080 Founders Edition | |
| AMD Radeon RX Vega 64 | |
| AMD Radeon RX Vega 64 | |
| XFX AMD Radeon RX 590 OC+ 8 GB | |
| Desktop PC | |
| Asus ROG Strix RX 580 8 GB | |
| Destiny 2 | |
| 1920x1080 Highest Preset AA:SM AF:16x | |
| Nvidia GeForce GTX 1080 Ti Founders Edition | |
| Asus ROG Strix RTX 2070 OC | |
| Nvidia Titan RTX | |
| Zotac GeForce RTX 2070 AMP Extreme | |
| MSI RTX 2070 Gaming Z 8G | |
| MSI RTX 2080 Gaming X Trio | |
| AMD Radeon VII | |
| MSI RTX 2060 Gaming Z 6G | |
| Desktop PC | |
| 3840x2160 Highest Preset AA:SM AF:16x | |
| Nvidia Titan RTX | |
| MSI RTX 2080 Gaming X Trio | |
| Zotac GeForce RTX 2070 AMP Extreme | |
| Asus ROG Strix RTX 2070 OC | |
| MSI RTX 2070 Gaming Z 8G | |
| Nvidia GeForce GTX 1080 Ti Founders Edition | |
| AMD Radeon VII | |
| MSI RTX 2060 Gaming Z 6G | |
| Desktop PC | |
| Far Cry Primal | |
| 1920x1080 Ultra Preset AA:SM | |
| Nvidia GeForce GTX 1080 Ti Founders Edition | |
| MSI Gaming X GeForce GTX 1080 Desktop PC | |
| Nvidia GeForce GTX 1080 Founders Edition | |
| AMD Radeon RX Vega 64 | |
| Zotac GeForce RTX 2070 AMP Extreme | |
| Asus ROG Strix RTX 2070 OC | |
| MSI RTX 2070 Gaming Z 8G | |
| AMD Radeon VII | |
| MSI RTX 2060 Gaming Z 6G | |
| Nvidia GeForce GTX 1070 Founders Edition | |
| MSI RTX 2080 Gaming X Trio | |
| Nvidia Titan RTX | |
| XFX AMD Radeon RX 590 OC+ 8 GB | |
| Asus ROG Strix RX 580 8 GB | |
| 3840x2160 High Preset AA:SM | |
| Nvidia Titan RTX | |
| MSI RTX 2080 Gaming X Trio | |
| AMD Radeon VII | |
| Nvidia GeForce GTX 1080 Ti Founders Edition | |
| Zotac GeForce RTX 2070 AMP Extreme | |
| Asus ROG Strix RTX 2070 OC | |
| MSI RTX 2070 Gaming Z 8G | |
| MSI Gaming X GeForce GTX 1080 Desktop PC | |
| MSI RTX 2060 Gaming Z 6G | |
| Nvidia GeForce GTX 1080 Founders Edition | |
| AMD Radeon RX Vega 64 | |
| Nvidia GeForce GTX 1070 Founders Edition | |
| XFX AMD Radeon RX 590 OC+ 8 GB | |
| Asus ROG Strix RX 580 8 GB | |
| The Witcher 3 | |
| 1920x1080 Ultra Graphics & Postprocessing (HBAO+) | |
| Nvidia Titan RTX | |
| MSI RTX 2080 Gaming X Trio | |
| Nvidia GeForce GTX 1080 Ti Founders Edition | |
| Zotac GeForce RTX 2070 AMP Extreme | |
| MSI RTX 2070 Gaming Z 8G | |
| Asus ROG Strix RTX 2070 OC | |
| MSI Gaming X GeForce GTX 1080 Desktop PC | |
| AMD Radeon RX Vega 64 | |
| Nvidia GeForce GTX 1080 Founders Edition | |
| AMD Radeon VII | |
| MSI RTX 2060 Gaming Z 6G | |
| Nvidia GeForce GTX 1070 Founders Edition | |
| XFX AMD Radeon RX 590 OC+ 8 GB | |
| Asus ROG Strix RX 580 8 GB | |
| 3840x2160 High Graphics & Postprocessing (Nvidia HairWorks Off) | |
| Nvidia Titan RTX | |
| MSI RTX 2080 Gaming X Trio | |
| Nvidia GeForce GTX 1080 Ti Founders Edition | |
| Zotac GeForce RTX 2070 AMP Extreme | |
| MSI RTX 2070 Gaming Z 8G | |
| Asus ROG Strix RTX 2070 OC | |
| MSI Gaming X GeForce GTX 1080 Desktop PC | |
| Nvidia GeForce GTX 1080 Founders Edition | |
| AMD Radeon VII | |
| MSI RTX 2060 Gaming Z 6G | |
| AMD Radeon RX Vega 64 | |
| Nvidia GeForce GTX 1070 Founders Edition | |
| XFX AMD Radeon RX 590 OC+ 8 GB | |
| Asus ROG Strix RX 580 8 GB | |
| Watch Dogs 2 | |
| 1920x1080 Ultra Preset | |
| Nvidia Titan RTX | |
| Nvidia GeForce GTX 1080 Ti Founders Edition | |
| MSI RTX 2080 Gaming X Trio | |
| Asus ROG Strix RTX 2070 OC | |
| Zotac GeForce RTX 2070 AMP Extreme | |
| MSI RTX 2070 Gaming Z 8G | |
| MSI Gaming X GeForce GTX 1080 Desktop PC | |
| AMD Radeon RX Vega 64 | |
| MSI RTX 2060 Gaming Z 6G | |
| AMD Radeon VII | |
| XFX AMD Radeon RX 590 OC+ 8 GB | |
| Desktop PC | |
| Asus ROG Strix RX 580 8 GB | |
| 3840x2160 High Preset | |
| Nvidia Titan RTX | |
| Nvidia GeForce GTX 1080 Ti Founders Edition | |
| MSI RTX 2080 Gaming X Trio | |
| Asus ROG Strix RTX 2070 OC | |
| Zotac GeForce RTX 2070 AMP Extreme | |
| MSI Gaming X GeForce GTX 1080 Desktop PC | |
| MSI RTX 2070 Gaming Z 8G | |
| AMD Radeon VII | |
| MSI RTX 2060 Gaming Z 6G | |
| AMD Radeon RX Vega 64 | |
| Desktop PC | |
| XFX AMD Radeon RX 590 OC+ 8 GB | |
| Asus ROG Strix RX 580 8 GB | |
| Battlefield 1 | |
| 1920x1080 Ultra Preset AA:T | |
| Nvidia GeForce GTX 1080 Ti Founders Edition | |
| Nvidia Titan RTX | |
| Zotac GeForce RTX 2070 AMP Extreme | |
| MSI Gaming X GeForce GTX 1080 Desktop PC | |
| Nvidia GeForce GTX 1080 Founders Edition | |
| MSI RTX 2080 Gaming X Trio | |
| AMD Radeon RX Vega 64 | |
| MSI RTX 2070 Gaming Z 8G | |
| AMD Radeon VII | |
| Asus ROG Strix RTX 2070 OC | |
| MSI RTX 2060 Gaming Z 6G | |
| XFX AMD Radeon RX 590 OC+ 8 GB | |
| Desktop PC | |
| 3840x2160 High Preset AA:T | |
| Nvidia Titan RTX | |
| MSI RTX 2080 Gaming X Trio | |
| AMD Radeon VII | |
| Zotac GeForce RTX 2070 AMP Extreme | |
| Nvidia GeForce GTX 1080 Ti Founders Edition | |
| Asus ROG Strix RTX 2070 OC | |
| MSI RTX 2070 Gaming Z 8G | |
| MSI Gaming X GeForce GTX 1080 Desktop PC | |
| Nvidia GeForce GTX 1080 Founders Edition | |
| AMD Radeon RX Vega 64 | |
| MSI RTX 2060 Gaming Z 6G | |
| XFX AMD Radeon RX 590 OC+ 8 GB | |
| Desktop PC | |
| The Division | |
| 1920x1080 Ultra Preset AF:16x | |
| Nvidia Titan RTX | |
| MSI RTX 2080 Gaming X Trio | |
| Nvidia GeForce GTX 1080 Ti Founders Edition | |
| Zotac GeForce RTX 2070 AMP Extreme | |
| MSI RTX 2070 Gaming Z 8G | |
| Asus ROG Strix RTX 2070 OC | |
| AMD Radeon RX Vega 64 | |
| MSI Gaming X GeForce GTX 1080 Desktop PC | |
| Nvidia GeForce GTX 1080 Founders Edition | |
| MSI RTX 2060 Gaming Z 6G | |
| AMD Radeon VII | |
| Nvidia GeForce GTX 1070 Founders Edition | |
| XFX AMD Radeon RX 590 OC+ 8 GB | |
| Asus ROG Strix RX 580 8 GB | |
| 3840x2160 High Preset AF:8x | |
| Nvidia Titan RTX | |
| MSI RTX 2080 Gaming X Trio | |
| Nvidia GeForce GTX 1080 Ti Founders Edition | |
| AMD Radeon VII | |
| MSI RTX 2070 Gaming Z 8G | |
| Asus ROG Strix RTX 2070 OC | |
| Zotac GeForce RTX 2070 AMP Extreme | |
| MSI Gaming X GeForce GTX 1080 Desktop PC | |
| AMD Radeon RX Vega 64 | |
| MSI RTX 2060 Gaming Z 6G | |
| Nvidia GeForce GTX 1080 Founders Edition | |
| Nvidia GeForce GTX 1070 Founders Edition | |
| XFX AMD Radeon RX 590 OC+ 8 GB | |
| Asus ROG Strix RX 580 8 GB | |
| For Honor | |
| 1920x1080 Extreme Preset AA:T AF:16x | |
| Nvidia Titan RTX | |
| Nvidia GeForce GTX 1080 Ti Founders Edition | |
| MSI RTX 2080 Gaming X Trio | |
| Asus ROG Strix RTX 2070 OC | |
| Zotac GeForce RTX 2070 AMP Extreme | |
| MSI RTX 2070 Gaming Z 8G | |
| Nvidia GeForce GTX 1080 Founders Edition | |
| AMD Radeon RX Vega 64 | |
| MSI RTX 2060 Gaming Z 6G | |
| AMD Radeon VII | |
| Nvidia GeForce GTX 1070 Founders Edition | |
| XFX AMD Radeon RX 590 OC+ 8 GB | |
| Asus ROG Strix RX 580 8 GB | |
| Desktop PC | |
| 3840x2160 High Preset AA:T AF:8x | |
| Nvidia Titan RTX | |
| Nvidia GeForce GTX 1080 Ti Founders Edition | |
| MSI RTX 2080 Gaming X Trio | |
| Zotac GeForce RTX 2070 AMP Extreme | |
| AMD Radeon VII | |
| MSI RTX 2070 Gaming Z 8G | |
| Nvidia GeForce GTX 1080 Founders Edition | |
| Asus ROG Strix RTX 2070 OC | |
| MSI RTX 2060 Gaming Z 6G | |
| AMD Radeon RX Vega 64 | |
| Nvidia GeForce GTX 1070 Founders Edition | |
| XFX AMD Radeon RX 590 OC+ 8 GB | |
| Desktop PC | |
| Asus ROG Strix RX 580 8 GB | |
| Ghost Recon Wildlands | |
| 1920x1080 Ultra Preset AA:T AF:16x | |
| Nvidia Titan RTX | |
| MSI RTX 2080 Gaming X Trio | |
| Nvidia GeForce GTX 1080 Ti Founders Edition | |
| Zotac GeForce RTX 2070 AMP Extreme | |
| Asus ROG Strix RTX 2070 OC | |
| MSI RTX 2070 Gaming Z 8G | |
| MSI RTX 2060 Gaming Z 6G | |
| AMD Radeon RX Vega 64 | |
| Nvidia GeForce GTX 1070 Founders Edition | |
| AMD Radeon VII | |
| XFX AMD Radeon RX 590 OC+ 8 GB | |
| Desktop PC | |
| Asus ROG Strix RX 580 8 GB | |
| 3840x2160 Ultra Preset AA:T AF:16x | |
| Nvidia Titan RTX | |
| MSI RTX 2080 Gaming X Trio | |
| Nvidia GeForce GTX 1080 Ti Founders Edition | |
| Zotac GeForce RTX 2070 AMP Extreme | |
| MSI RTX 2070 Gaming Z 8G | |
| Doom | |
| 1920x1080 Ultra Preset AA:SM | |
| Nvidia GeForce GTX 1080 Ti Founders Edition | |
| Nvidia GeForce GTX 1080 Ti Founders Edition | |
| MSI Gaming X GeForce GTX 1080 Desktop PC | |
| Asus ROG Strix RTX 2070 OC | |
| Nvidia Titan RTX | |
| Zotac GeForce RTX 2070 AMP Extreme | |
| MSI RTX 2080 Gaming X Trio | |
| MSI RTX 2070 Gaming Z 8G | |
| MSI RTX 2060 Gaming Z 6G | |
| Nvidia GeForce GTX 1080 Founders Edition | |
| Nvidia GeForce GTX 1070 Founders Edition | |
| XFX AMD Radeon RX 590 OC+ 8 GB | |
| 3840x2160 High Preset AA:FX | |
| Nvidia Titan RTX | |
| MSI RTX 2080 Gaming X Trio | |
| Nvidia GeForce GTX 1080 Ti Founders Edition | |
| Nvidia GeForce GTX 1080 Ti Founders Edition | |
| Zotac GeForce RTX 2070 AMP Extreme | |
| Asus ROG Strix RTX 2070 OC | |
| MSI RTX 2070 Gaming Z 8G | |
| MSI RTX 2060 Gaming Z 6G | |
| MSI Gaming X GeForce GTX 1080 Desktop PC | |
| Nvidia GeForce GTX 1080 Founders Edition | |
| Nvidia GeForce GTX 1070 Founders Edition | |
| XFX AMD Radeon RX 590 OC+ 8 GB | |
| GTA V | |
| 1920x1080 Highest AA:4xMSAA + FX AF:16x | |
| Nvidia Titan RTX | |
| MSI RTX 2080 Gaming X Trio | |
| AMD Radeon VII | |
| Asus ROG Strix RTX 2070 OC | |
| MSI RTX 2070 Gaming Z 8G | |
| MSI RTX 2060 Gaming Z 6G | |
| Zotac GeForce RTX 2070 AMP Extreme | |
| MSI Gaming X GeForce GTX 1080 Desktop PC | |
| Nvidia GeForce GTX 1080 Ti Founders Edition | |
| Nvidia GeForce GTX 1080 Founders Edition | |
| Nvidia GeForce GTX 1070 Founders Edition | |
| XFX AMD Radeon RX 590 OC+ 8 GB | |
| 3840x2160 High/On (Advanced Graphics Off) AA:FX AF:8x | |
| Nvidia Titan RTX | |
| Asus ROG Strix RTX 2070 OC | |
| Nvidia GeForce GTX 1080 Ti Founders Edition | |
| MSI RTX 2080 Gaming X Trio | |
| Zotac GeForce RTX 2070 AMP Extreme | |
| AMD Radeon VII | |
| MSI RTX 2070 Gaming Z 8G | |
| MSI Gaming X GeForce GTX 1080 Desktop PC | |
| Nvidia GeForce GTX 1080 Founders Edition | |
| MSI RTX 2060 Gaming Z 6G | |
| Nvidia GeForce GTX 1070 Founders Edition | |
| XFX AMD Radeon RX 590 OC+ 8 GB | |
| Battlefield 4 - 3840x2160 High Preset | |
| Nvidia Titan RTX | |
| MSI RTX 2080 Gaming X Trio | |
| Nvidia GeForce GTX 1080 Ti Founders Edition | |
| MSI RTX 2070 Gaming Z 8G | |
| Asus ROG Strix RTX 2070 OC | |
| Zotac GeForce RTX 2070 AMP Extreme | |
| Nvidia GeForce GTX 1080 Founders Edition | |
| AMD Radeon RX Vega 64 | |
| AMD Radeon VII | |
| Nvidia GeForce GTX 1070 Founders Edition | |
| MSI RTX 2060 Gaming Z 6G | |
| XFX AMD Radeon RX 590 OC+ 8 GB | |
| Hitman 2 | |
| 1920x1080 Ultra AF:16x | |
| AMD Radeon VII | |
| Zotac GeForce RTX 2070 AMP Extreme | |
| MSI RTX 2060 Gaming Z 6G | |
| MSI RTX 2080 Gaming X Trio | |
| AMD Radeon RX Vega 64 | |
| MSI RTX 2070 Gaming Z 8G | |
| Nvidia Titan RTX | |
| XFX AMD Radeon RX 590 OC+ 8 GB | |
| Desktop PC | |
| NVIDIA Titan X Pascal | |
| 3840x2160 Ultra AF:16x | |
| Nvidia Titan RTX | |
| MSI RTX 2080 Gaming X Trio | |
| AMD Radeon VII | |
| NVIDIA Titan X Pascal | |
| Zotac GeForce RTX 2070 AMP Extreme | |
| AMD Radeon RX Vega 64 | |
| MSI RTX 2070 Gaming Z 8G | |
| MSI RTX 2060 Gaming Z 6G | |
| XFX AMD Radeon RX 590 OC+ 8 GB | |
| Desktop PC | |
| Battlefield V | |
| 1920x1080 Ultra Preset | |
| Nvidia Titan RTX | |
| MSI RTX 2080 Gaming X Trio | |
| AMD Radeon RX Vega 64 | |
| NVIDIA Titan X Pascal | |
| AMD Radeon VII | |
| MSI RTX 2070 Gaming Z 8G | |
| MSI RTX 2060 Gaming Z 6G | |
| XFX AMD Radeon RX 590 OC+ 8 GB | |
| Zotac GeForce RTX 2070 AMP Extreme | |
| 3840x2160 Ultra Preset | |
| Nvidia Titan RTX | |
| MSI RTX 2080 Gaming X Trio | |
| AMD Radeon VII | |
| NVIDIA Titan X Pascal | |
| MSI RTX 2070 Gaming Z 8G | |
| AMD Radeon RX Vega 64 | |
| MSI RTX 2060 Gaming Z 6G | |
| Zotac GeForce RTX 2070 AMP Extreme | |
| XFX AMD Radeon RX 590 OC+ 8 GB | |
| Farming Simulator 19 | |
| 1920x1080 Very High Preset | |
| Zotac GeForce RTX 2070 AMP Extreme | |
| Nvidia Titan RTX | |
| MSI RTX 2080 Gaming X Trio | |
| MSI RTX 2060 Gaming Z 6G | |
| MSI RTX 2070 Gaming Z 8G | |
| AMD Radeon VII | |
| AMD Radeon RX Vega 64 | |
| NVIDIA Titan X Pascal | |
| XFX AMD Radeon RX 590 OC+ 8 GB | |
| 3840x2160 Very High Preset | |
| Nvidia Titan RTX | |
| NVIDIA Titan X Pascal | |
| MSI RTX 2080 Gaming X Trio | |
| MSI RTX 2070 Gaming Z 8G | |
| Zotac GeForce RTX 2070 AMP Extreme | |
| MSI RTX 2060 Gaming Z 6G | |
| AMD Radeon VII | |
| AMD Radeon RX Vega 64 | |
| XFX AMD Radeon RX 590 OC+ 8 GB | |
| Darksiders III | |
| 1920x1080 Epic | |
| Nvidia Titan RTX | |
| MSI RTX 2080 Gaming X Trio | |
| Zotac GeForce RTX 2070 AMP Extreme | |
| MSI RTX 2070 Gaming Z 8G | |
| AMD Radeon VII | |
| MSI RTX 2060 Gaming Z 6G | |
| NVIDIA Titan X Pascal | |
| AMD Radeon RX Vega 64 | |
| XFX AMD Radeon RX 590 OC+ 8 GB | |
| 3840x2160 Epic | |
| Nvidia Titan RTX | |
| MSI RTX 2080 Gaming X Trio | |
| NVIDIA Titan X Pascal | |
| Zotac GeForce RTX 2070 AMP Extreme | |
| MSI RTX 2070 Gaming Z 8G | |
| AMD Radeon VII | |
| AMD Radeon RX Vega 64 | |
| MSI RTX 2060 Gaming Z 6G | |
| XFX AMD Radeon RX 590 OC+ 8 GB | |
| Just Cause 4 | |
| 1920x1080 Very High / On AA:SM AF:16x | |
| Nvidia Titan RTX | |
| MSI RTX 2080 Gaming X Trio | |
| NVIDIA Titan X Pascal | |
| MSI RTX 2070 Gaming Z 8G | |
| Zotac GeForce RTX 2070 AMP Extreme | |
| AMD Radeon VII | |
| MSI RTX 2060 Gaming Z 6G | |
| AMD Radeon RX Vega 64 | |
| XFX AMD Radeon RX 590 OC+ 8 GB | |
| 3840x2160 Very High / On AA:SM AF:16x | |
| Nvidia Titan RTX | |
| MSI RTX 2080 Gaming X Trio | |
| NVIDIA Titan X Pascal | |
| AMD Radeon VII | |
| Zotac GeForce RTX 2070 AMP Extreme | |
| MSI RTX 2070 Gaming Z 8G | |
| MSI RTX 2060 Gaming Z 6G | |
| AMD Radeon RX Vega 64 | |
| XFX AMD Radeon RX 590 OC+ 8 GB | |
| Apex Legends | |
| 1920x1080 Maximum Settings AA:TS AF:16x | |
| MSI RTX 2070 Gaming Z 8G | |
| MSI RTX 2080 Gaming X Trio | |
| Zotac GeForce RTX 2070 AMP Extreme | |
| MSI RTX 2060 Gaming Z 6G | |
| AMD Radeon RX Vega 64 | |
| XFX AMD Radeon RX 590 OC+ 8 GB | |
| 3840x2160 Maximum Settings AA:TS AF:16x | |
| MSI RTX 2080 Gaming X Trio | |
| MSI RTX 2070 Gaming Z 8G | |
| Zotac GeForce RTX 2070 AMP Extreme | |
| AMD Radeon RX Vega 64 | |
| MSI RTX 2060 Gaming Z 6G | |
| XFX AMD Radeon RX 590 OC+ 8 GB | |
| Far Cry New Dawn | |
| 1920x1080 Ultra Preset | |
| Zotac GeForce RTX 2070 AMP Extreme | |
| MSI RTX 2080 Gaming X Trio | |
| MSI RTX 2070 Gaming Z 8G | |
| MSI RTX 2060 Gaming Z 6G | |
| AMD Radeon RX Vega 64 | |
| AMD Radeon VII | |
| XFX AMD Radeon RX 590 OC+ 8 GB | |
| 3840x2160 Ultra Preset | |
| MSI RTX 2080 Gaming X Trio | |
| AMD Radeon VII | |
| Zotac GeForce RTX 2070 AMP Extreme | |
| MSI RTX 2070 Gaming Z 8G | |
| AMD Radeon RX Vega 64 | |
| MSI RTX 2060 Gaming Z 6G | |
| XFX AMD Radeon RX 590 OC+ 8 GB | |
| Metro Exodus | |
| 1920x1080 Ultra Quality AF:16x | |
| MSI RTX 2080 Gaming X Trio | |
| AMD Radeon VII | |
| Zotac GeForce RTX 2070 AMP Extreme | |
| MSI RTX 2070 Gaming Z 8G | |
| AMD Radeon RX Vega 64 | |
| MSI RTX 2060 Gaming Z 6G | |
| XFX AMD Radeon RX 590 OC+ 8 GB | |
| 3840x2160 Ultra Quality AF:16x | |
| AMD Radeon RX Vega 64 | |
| MSI RTX 2080 Gaming X Trio | |
| AMD Radeon VII | |
| Zotac GeForce RTX 2070 AMP Extreme | |
| MSI RTX 2070 Gaming Z 8G | |
| MSI RTX 2060 Gaming Z 6G | |
| XFX AMD Radeon RX 590 OC+ 8 GB | |
| Anthem - 1920x1080 Ultra Preset | |
| MSI RTX 2080 Gaming X Trio | |
| Zotac GeForce RTX 2070 AMP Extreme | |
| AMD Radeon RX Vega 64 | |
| MSI RTX 2070 Gaming Z 8G | |
| AMD Radeon VII | |
| MSI RTX 2060 Gaming Z 6G | |
| XFX AMD Radeon RX 590 OC+ 8 GB | |
| Dirt Rally 2.0 | |
| 1920x1080 Ultra Preset AA:T AF:16x | |
| MSI RTX 2080 Gaming X Trio | |
| AMD Radeon VII | |
| Zotac GeForce RTX 2070 AMP Extreme | |
| MSI RTX 2070 Gaming Z 8G | |
| AMD Radeon RX Vega 64 | |
| MSI RTX 2060 Gaming Z 6G | |
| XFX AMD Radeon RX 590 OC+ 8 GB | |
| 3840x2160 Ultra Preset AA:T AF:16x | |
| MSI RTX 2080 Gaming X Trio | |
| AMD Radeon VII | |
| Zotac GeForce RTX 2070 AMP Extreme | |
| MSI RTX 2070 Gaming Z 8G | |
| AMD Radeon RX Vega 64 | |
| MSI RTX 2060 Gaming Z 6G | |
| XFX AMD Radeon RX 590 OC+ 8 GB | |
| Anno 1800 | |
| 1920x1080 Ultra Graphics Quality (DX11) | |
| Zotac GeForce RTX 2070 AMP Extreme | |
| MSI RTX 2080 Gaming X Trio | |
| MSI RTX 2070 Gaming Z 8G | |
| MSI RTX 2060 Gaming Z 6G | |
| AMD Radeon RX Vega 64 | |
| XFX AMD Radeon RX 590 OC+ 8 GB | |
| 3840x2160 Ultra Graphics Quality (DX11) | |
| MSI RTX 2080 Gaming X Trio | |
| Zotac GeForce RTX 2070 AMP Extreme | |
| MSI RTX 2070 Gaming Z 8G | |
| MSI RTX 2060 Gaming Z 6G | |
| AMD Radeon RX Vega 64 | |
| XFX AMD Radeon RX 590 OC+ 8 GB | |
| basso | medio | alto | ultra | QHD | 4K | |
|---|---|---|---|---|---|---|
| Battlefield 4 (2013) | 200 | 200 | 200 | 197.2 | 98.6 | |
| GTA V (2015) | 175 | 168 | 153 | 88 | 86 | |
| The Witcher 3 (2015) | 306 | 251 | 171 | 95 | 67 | |
| Rainbow Six Siege (2015) | 328.1 | 275 | 256.1 | 243.6 | 126.8 | |
| Rise of the Tomb Raider (2016) | 268 | 191 | 158 | 131 | 62 | |
| Far Cry Primal (2016) | 125 | 113 | 103 | 96 | 62 | |
| The Division (2016) | 232.2 | 212.2 | 144.3 | 115.4 | 57.9 | |
| Doom (2016) | 159 | 152 | 142 | 141 | 94 | |
| Overwatch (2016) | 300 | 300 | 228 | 141 | 129 | |
| Deus Ex Mankind Divided (2016) | 151.5 | 142.1 | 119.7 | 90.9 | 46.4 | |
| Battlefield 1 (2016) | 195 | 176 | 159 | 150 | 78 | |
| Dishonored 2 (2016) | 118.8 | 118.6 | 118.9 | 114.8 | 67.4 | |
| Watch Dogs 2 (2016) | 142 | 127 | 108 | 78 | 46.9 | |
| For Honor (2017) | 275.4 | 194.2 | 186 | 146.1 | 65.6 | |
| Ghost Recon Wildlands (2017) | 163 | 121.2 | 114.1 | 66.2 | 47.3 | |
| Rocket League (2017) | 248.9 | 249.6 | 240.5 | 128.1 | ||
| Dirt 4 (2017) | 303 | 241 | 209 | 135 | 81 | |
| Playerunknown's Battlegrounds (PUBG) (2017) | 260 | 224 | 198 | 160 | 61 | |
| Destiny 2 (2017) | 145 | 142 | 141 | 151 | 113 | 61 |
| Assassin´s Creed Origins (2017) | 113 | 103 | 99 | 84 | 73 | 47 |
| Call of Duty WWII (2017) | 243 | 240 | 166 | 143 | 115 | 75 |
| Fortnite (2018) | 215 | 174 | 161 | 157 | 117 | 53.1 |
| Final Fantasy XV Benchmark (2018) | 161 | 120 | 89 | 39.3 | ||
| Kingdom Come: Deliverance (2018) | 144 | 121 | 102 | 79 | 61 | 32.3 |
| Far Cry 5 (2018) | 130 | 116 | 111 | 105 | 91 | 51 |
| The Crew 2 (2018) | 60 | 60 | 60 | 60 | 60 | 48.4 |
| Monster Hunter World (2018) | 144 | 133 | 128 | 102 | 68 | 32.2 |
| F1 2018 (2018) | 244 | 211 | 163 | 131 | 107 | 67 |
| Shadow of the Tomb Raider (2018) | 127 | 110 | 108 | 102 | 77 | 41 |
| FIFA 19 (2018) | 276 | 254 | 236 | 223 | 219 | 181 |
| Forza Horizon 4 (2018) | 182 | 149 | 144 | 118 | 97 | 68 |
| Assassin´s Creed Odyssey (2018) | 110 | 102 | 88 | 66 | 51 | 36 |
| Call of Duty Black Ops 4 (2018) | 229 | 179 | 169 | 161 | 108 | 55.6 |
| Hitman 2 (2018) | 95 | 91 | 83 | 81 | 77 | 49 |
| Fallout 76 (2018) | 60 | 60 | 60 | 60 | 60 | 60 |
| Battlefield V (2018) | 143 | 109 | 96 | 90 | 72 | 48.3 |
| Farming Simulator 19 (2018) | 202 | 157 | 136 | 126 | 122 | 71 |
| Darksiders III (2018) | 211 | 149 | 139 | 128 | 93 | 47.7 |
| Just Cause 4 (2018) | 198 | 150 | 112 | 104 | 75 | 44 |
| Apex Legends (2019) | 144 | 144 | 144 | 144 | 122 | 71.8 |
| Far Cry New Dawn (2019) | 120 | 107 | 103 | 94 | 86 | 53 |
| Metro Exodus (2019) | 130.1 | 100.4 | 76.6 | 62.8 | 50.1 | 32.7 |
| Anthem (2019) | 109 | 99 | 94 | 96 | 79 | 46.5 |
| Dirt Rally 2.0 (2019) | 245 | 193 | 179 | 106 | 81 | 49.5 |
| The Division 2 (2019) | 190 | 145 | 120 | 98 | 70 | 41 |
| Anno 1800 (2019) | 89 | 88 | 77 | 43.8 | 39.5 | 27.3 |
Prestazioni Compute
L'AMP Extreme si comporta bene anche nei benchmarks di calcolo, grazie alle elevate velocità di clock di GPU e VRAM. La nostra unità di prova ottiene punteggi fino al 5% in più rispetto all'MSI RTX 2070 Gaming Z 8G, ma in genere il divario di prestazioni è compreso tra il 2% e il 3%.
Non sorprende che l'AMP Extreme non possa eguagliare le prestazioni dell'MSI RTX 2080 Gaming X Trio overclocked di fabbrica. Un confronto diretto con la GeForce RTX 2080 Founders Edition sarebbe comunque interessante.
Inoltre l'AMP Extreme beneficia di LuxMark rispetto alla GeForce GTX 1080 Ti, grazie alla sua più recente architettura Turing. Si tratta di qualcosa di misto per la Radeon VII, con un punteggio inferiore del 9% rispetto all'AMP Extreme nella sola porzione di LuxMark riservata alle GPU Sala. Al contrario, la scheda AMD fa saltare il nostro dispositivo di prova in altri benchmarks dove può utilizzare appieno le prestazioni della GPU, come in SiSoft Sandra 2016.
| LuxMark v2.0 64Bit | |
| Room GPUs-only | |
| Nvidia Titan RTX | |
| AMD Radeon VII | |
| MSI RTX 2080 Gaming X Trio | |
| Zotac GeForce RTX 2070 AMP Extreme | |
| Asus ROG Strix RTX 2070 OC | |
| MSI RTX 2070 Gaming Z 8G | |
| Nvidia GeForce GTX 1080 Ti Founders Edition | |
| MSI RTX 2060 Gaming Z 6G | |
| Nvidia GeForce GTX 1070 Founders Edition | |
| Nvidia GeForce GTX 1080 Founders Edition | |
| MSI Gaming X GeForce GTX 1080 Desktop PC | |
| XFX AMD Radeon RX 590 OC+ 8 GB | |
| Sala GPUs-only | |
| Nvidia Titan RTX | |
| MSI RTX 2080 Gaming X Trio | |
| Zotac GeForce RTX 2070 AMP Extreme | |
| Asus ROG Strix RTX 2070 OC | |
| MSI RTX 2070 Gaming Z 8G | |
| AMD Radeon VII | |
| Nvidia GeForce GTX 1080 Ti Founders Edition | |
| MSI RTX 2060 Gaming Z 6G | |
| Nvidia GeForce GTX 1070 Founders Edition | |
| MSI Gaming X GeForce GTX 1080 Desktop PC | |
| Nvidia GeForce GTX 1080 Founders Edition | |
| XFX AMD Radeon RX 590 OC+ 8 GB | |
| SiSoft Sandra 2016 | |
| Image Processing | |
| AMD Radeon VII | |
| MSI RTX 2080 Gaming X Trio | |
| Zotac GeForce RTX 2070 AMP Extreme | |
| MSI RTX 2070 Gaming Z 8G | |
| MSI RTX 2060 Gaming Z 6G | |
| GP Cryptography (Higher Security AES256+SHA2-512) | |
| MSI RTX 2080 Gaming X Trio | |
| AMD Radeon VII | |
| Zotac GeForce RTX 2070 AMP Extreme | |
| MSI RTX 2070 Gaming Z 8G | |
| MSI RTX 2060 Gaming Z 6G | |
| GP Financial Analysis (FP High/Double Precision) | |
| AMD Radeon VII | |
| MSI RTX 2080 Gaming X Trio | |
| MSI RTX 2070 Gaming Z 8G | |
| Zotac GeForce RTX 2070 AMP Extreme | |
| MSI RTX 2060 Gaming Z 6G | |
Emissioni
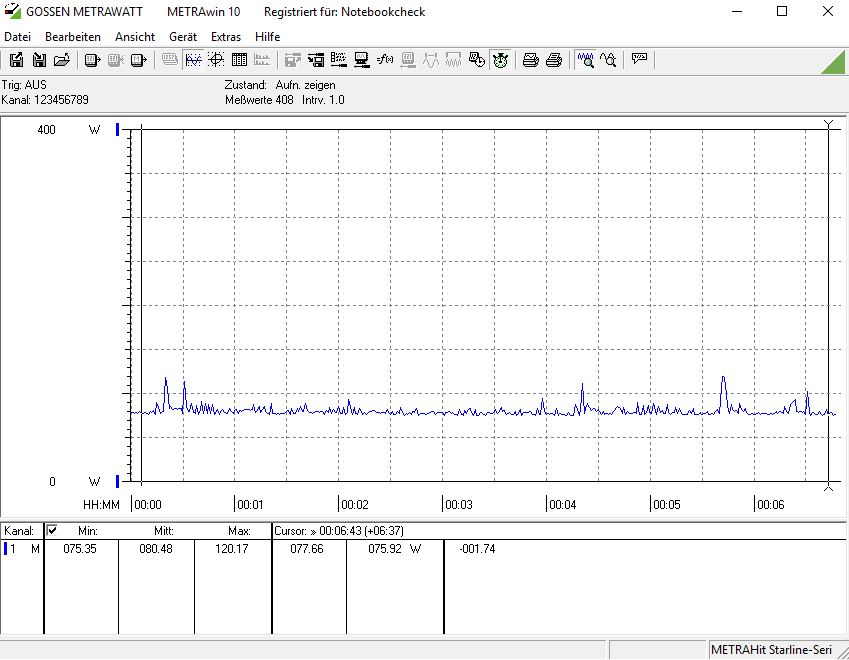
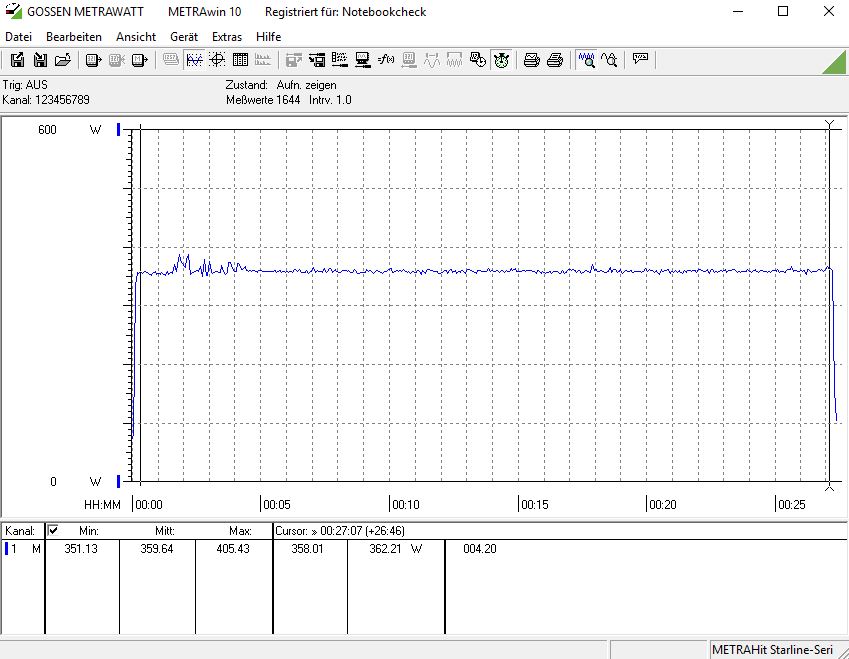
L'AMP Extreme funziona in modo relativamente freddo e silenzioso. C'è poca differenza tra la nostra unità di prova e l'MSI RTX 2070 Gaming Z 8G. Il nostro sistema di prova ha consumato in media solo 80,5 W a riposo, che è di 7 W in più di quanto consumato con la GPU MSI installata. Il consumo energetico è salito a una media di 360 W durante i nostri stress test con l'AMP Extreme, anche se occasionalmente ha raggiunto il picco di 405 W. Anche in questo caso, la Zotac è un po' più affamata di potenza rispetto all'MSI RTX 2070 Gaming Z 8G.
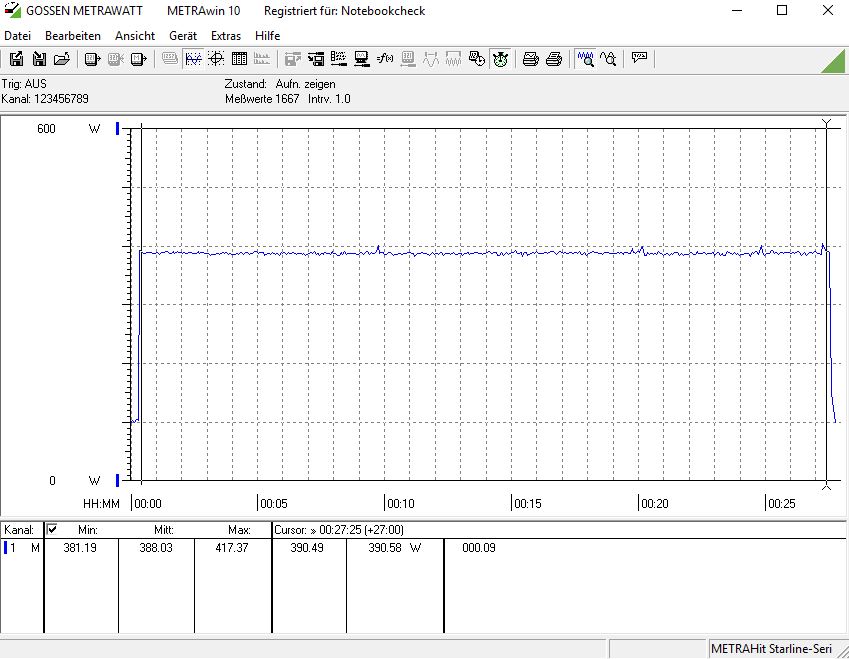
Abbiamo anche dato un'occhiata più da vicino il consumo energetico dell'AMP Extreme con l'impostazione di un PT superiore, durante il quale ha una media di 388 W. Zotac permette al PT di essere aumentato del 10%, con il che dà l'AMP Extreme 247,5 W di potenza a sua disposizione.
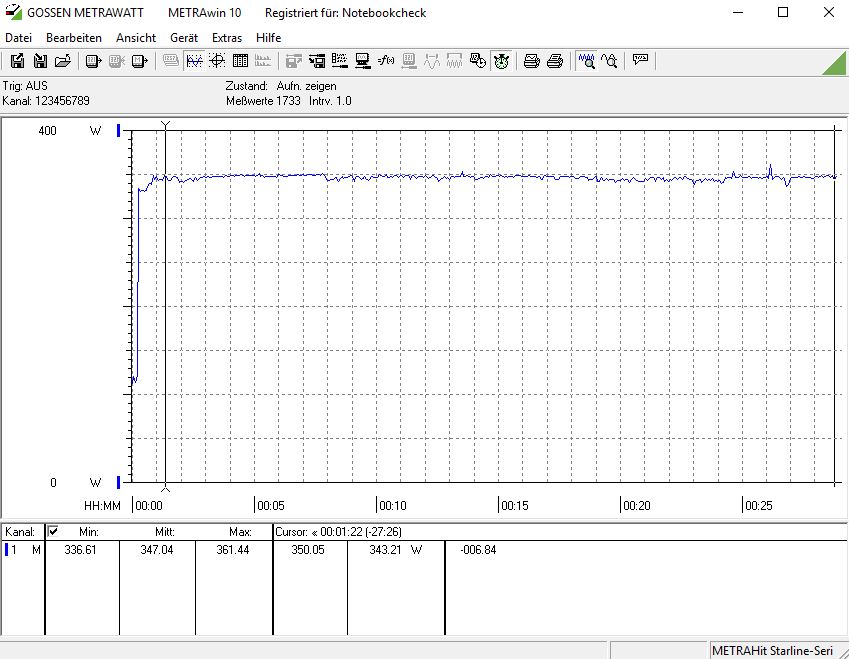
L'AMP Extreme ha avuto una media di soli 347 W durante la riproduzione di "The Witcher 3" con ultra-grafica, anche se questo è ancora un po' più di quanto consumato dai nostri dispositivi di confronto RTX 2070. La nostra unità di prova era in media di 11 W in meno rispetto alla GeForce 1080 Ti Founders Edition.
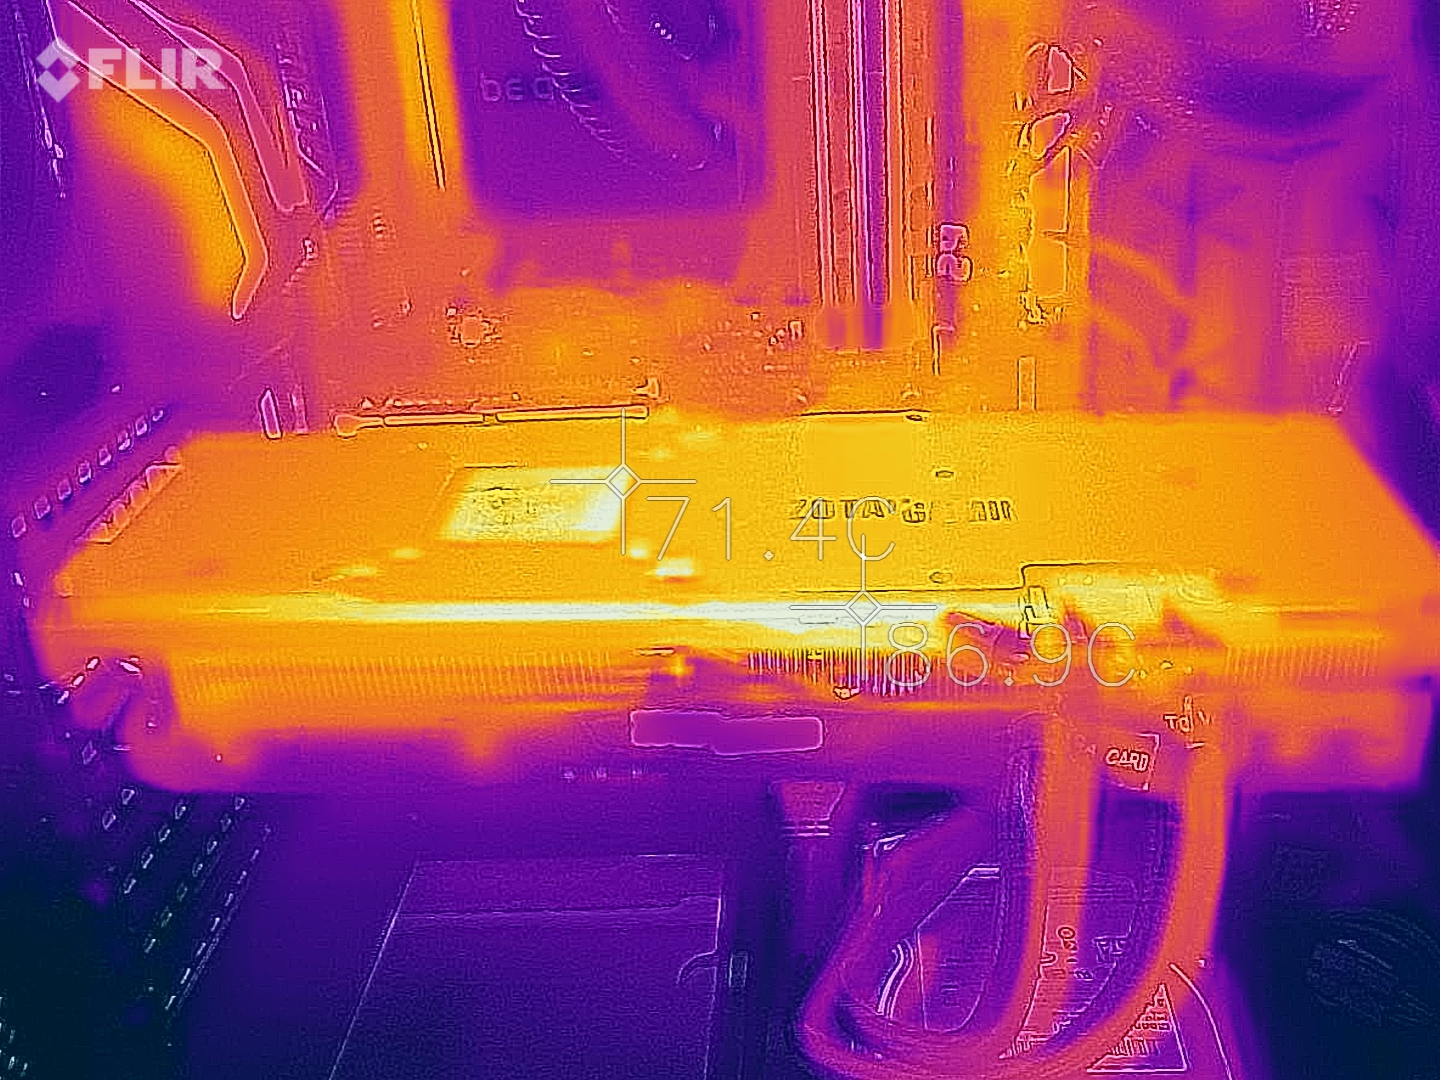
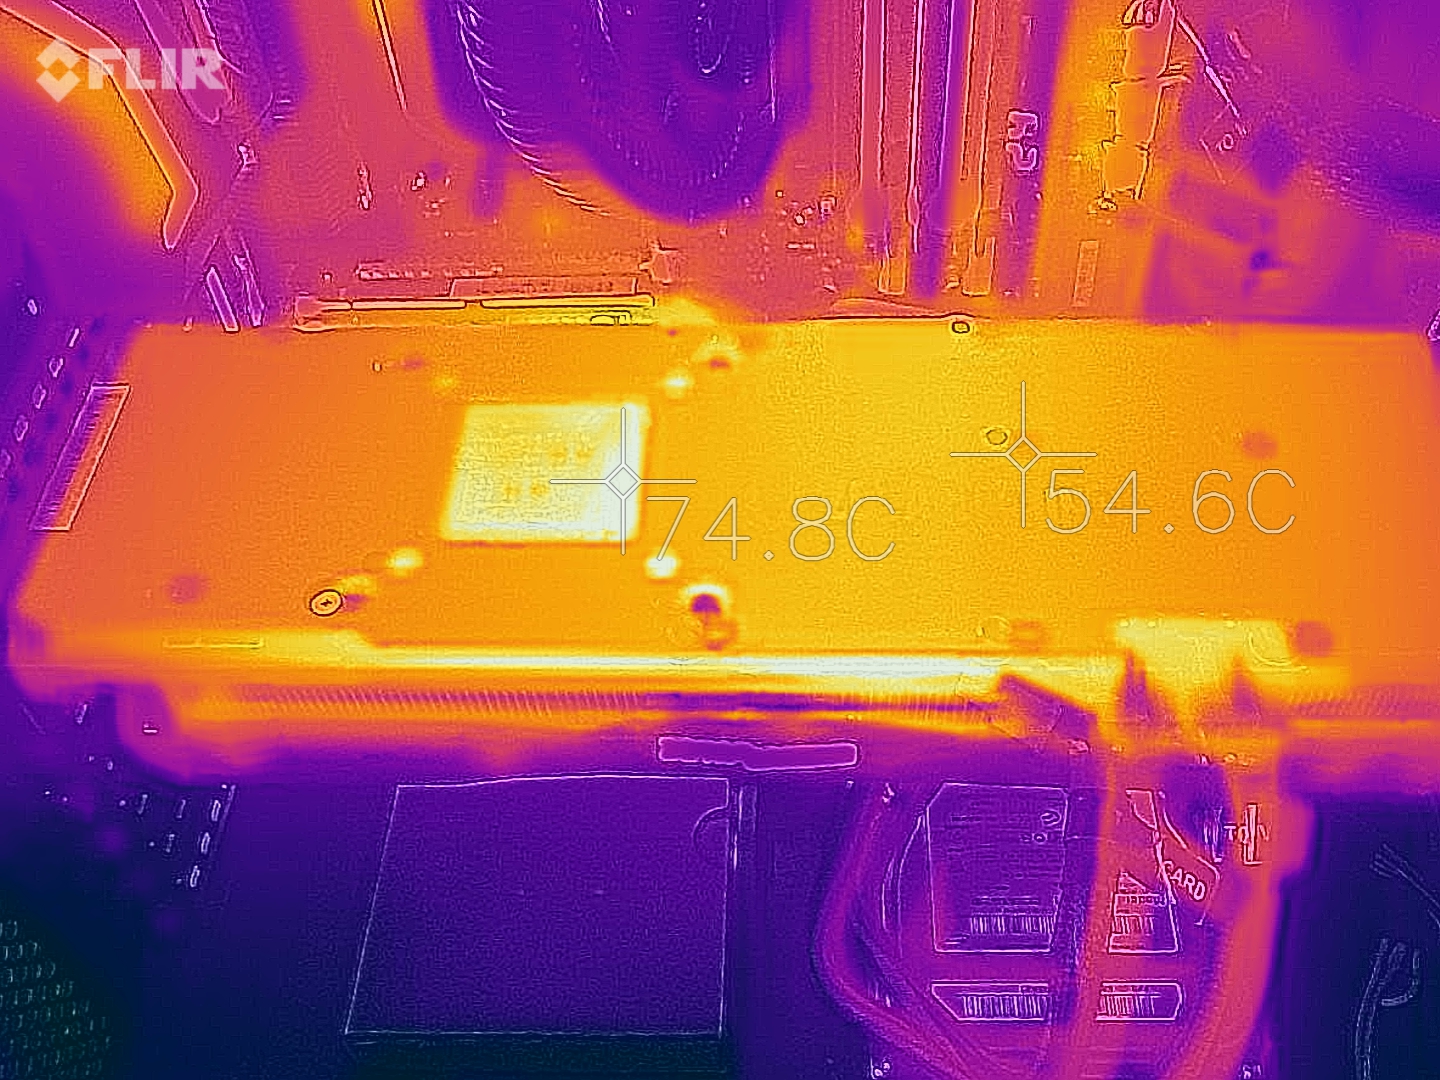
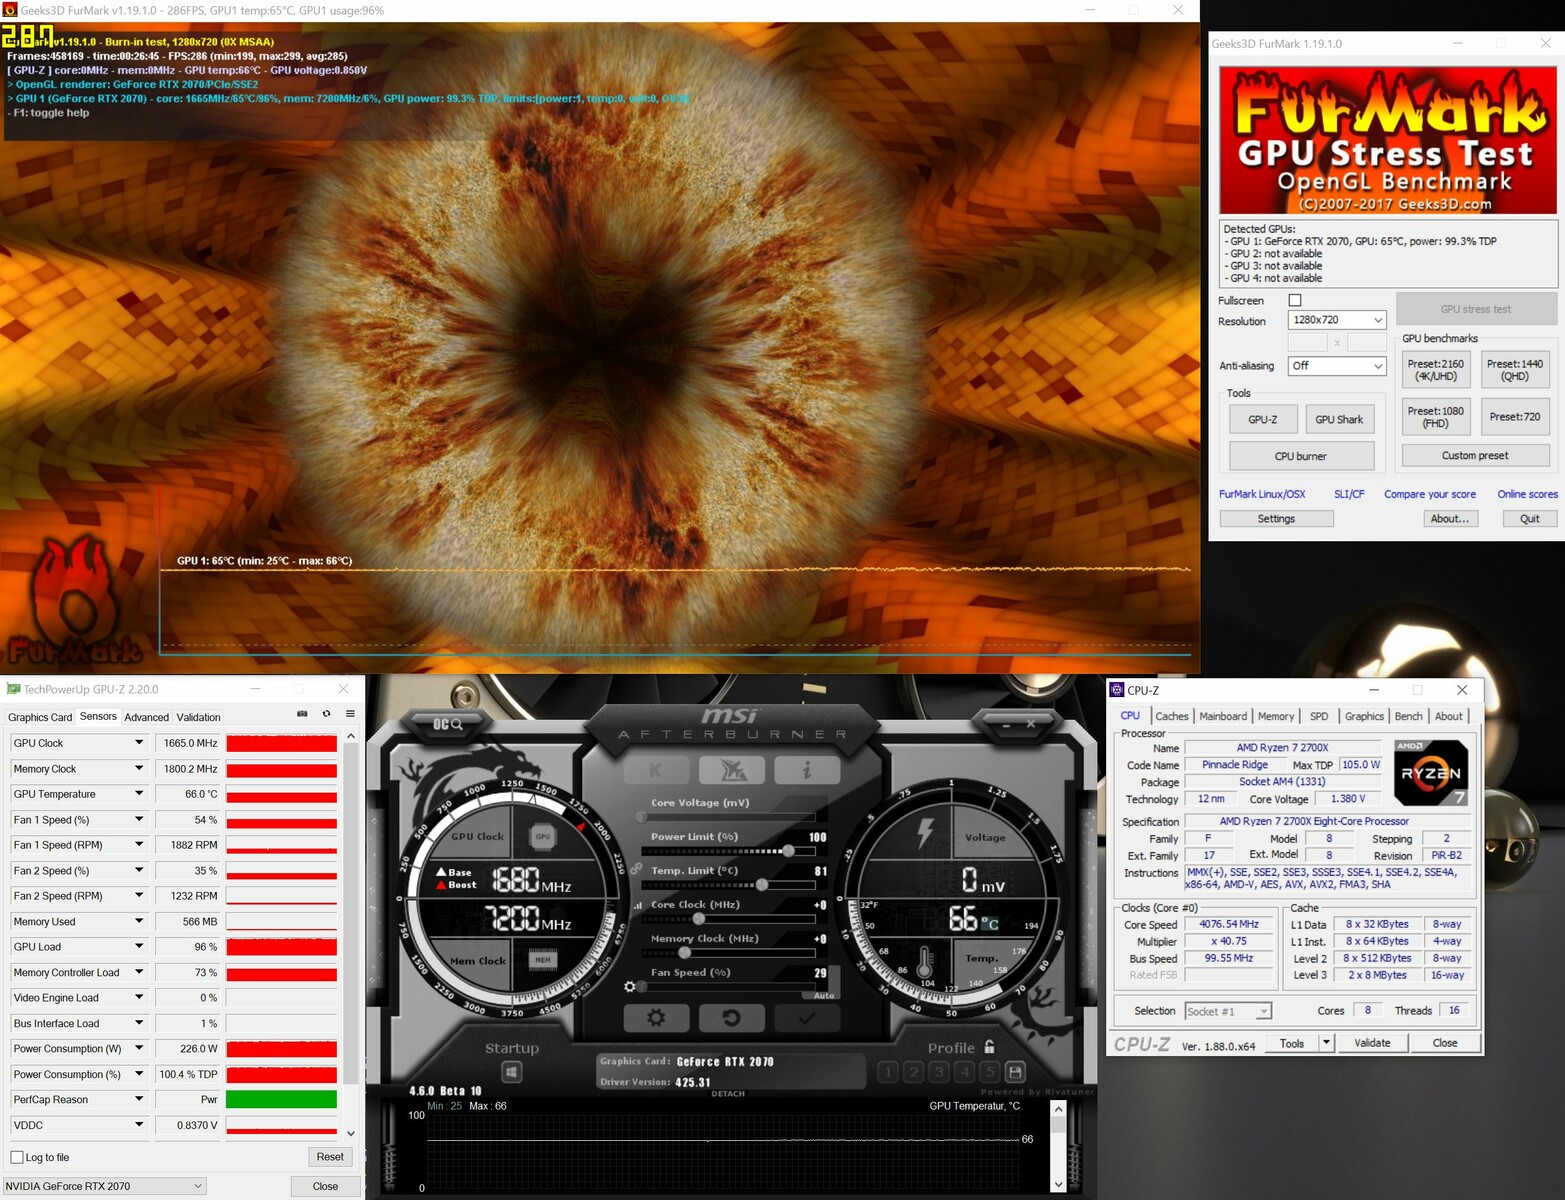
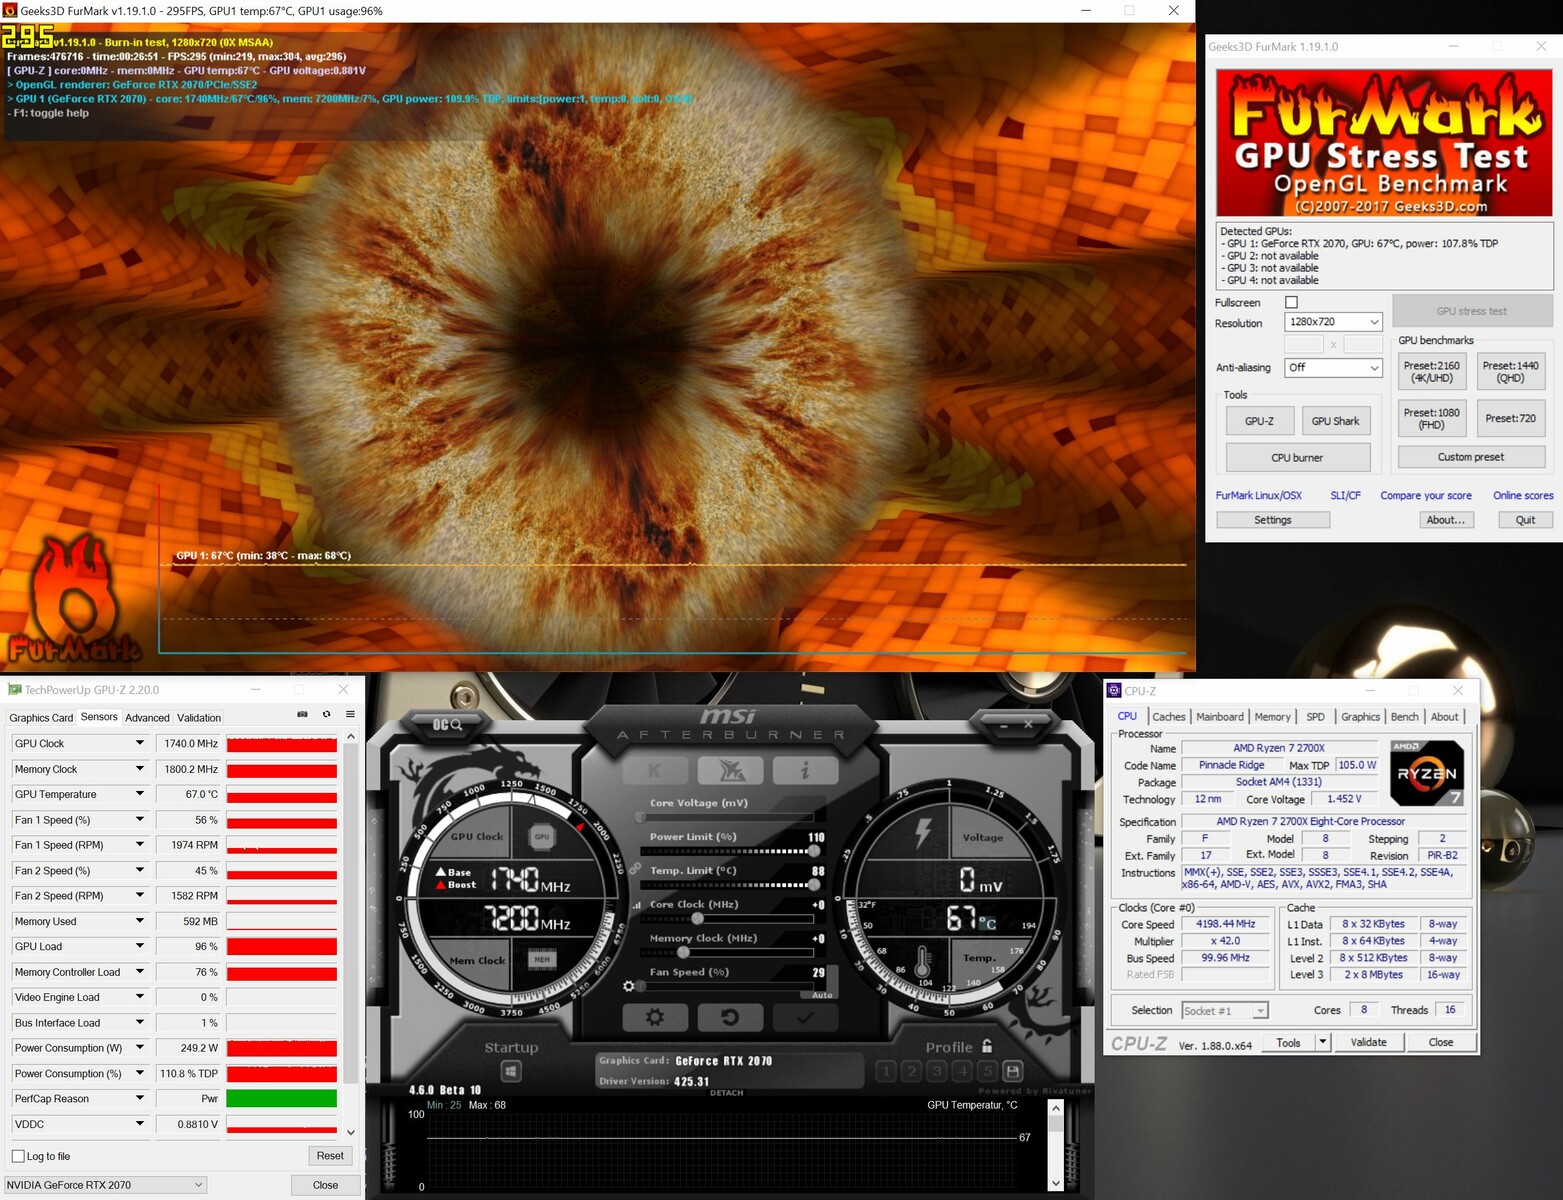
Zotac ha ottimizzato bene le temperature dell'AMP Extreme. Anche con il suo PT aumentato al 110%, le temperature del core della GPU rimangono al di sotto dei 70 °C (~158 °F). Vale la pena sottolineare che la MSI RTX 2070 Gaming Z 8G diventa leggermente più calda a un massimo di 71 °C (~160 °F), ma funziona in modo più silenzioso. Lo Zotac ha tre ventole da 90 mm alle due ventole da 100 mm dell'MSI, come riferimento.
Il fatto è che la scheda Zotac diventa leggermente più rumorosa sotto carico rispetto all'MSI. Tuttavia, lo Zotac non diventa fastidiosa.
| Power Consumption - 1920x1080 The Witcher 3 ultra (external Monitor) | |
| Nvidia Titan RTX | |
| AMD Radeon RX Vega 64 (Idle: 74.3 W) | |
| MSI RTX 2080 Gaming X Trio (Idle: 87.78 W) | |
| Nvidia GeForce GTX 1080 Ti Founders Edition (88 fps, Idle: 70.3 W) | |
| Zotac GeForce RTX 2070 AMP Extreme (Idle: 80.48 W) | |
| XFX AMD Radeon RX 590 OC+ 8 GB | |
| MSI RTX 2070 Gaming Z 8G (Idle: 73.3 W) | |
| AMD Radeon VII (Idle: 81.39 W) | |
| Asus ROG Strix RTX 2070 OC | |
| Nvidia GeForce GTX 1080 Founders Edition (Idle: 68.3 W) | |
| MSI RTX 2060 Gaming Z 6G (Idle: 74.66 W) | |
| Nvidia GeForce GTX 1070 Founders Edition (Idle: 68 W) | |
* ... Meglio usare valori piccoli
Overclocking
Nonostante l'AMP Extreme abbia dato risultati impressionanti nei benchmarks sintetici e nei test di gioco, abbiamo comunque cercato di spremere ancora un po' di potenza dalla scheda di Zotac. Aumentare il PT al 110% permette all'AMP Extreme di consumare fino a 247,5 W, che è corrispondentemente 22,5 W in più rispetto alla scheda impostata per un PT del 100%. Si consiglia di impostare la GPU su PT 110% se si desidera eseguire l'overclock.
Anche dopo aver aumentato il PT del 10%, il nostro dispositivo di prova ha potuto gestire solo un overclock a 80 MHz sulla velocità della GPU e un overclock a 800 MHz sulla sua VRAM. Entrambi sono overclocks piuttosto deludenti, soprattutto perché la VRAM Samsung utilizzata nell'MSI RTX 2070 Gaming Z 8G può raggiungere velocità di clock superiori a quelle della VRAM Micron nel nostro dispositivo di test.
Questo overclock ha prodotto un guadagno di prestazioni tra il 2 e il 5%, ma non si può nemmeno notare la differenza nei giochi. Il grande dissipatore di calore e tre ventole da 90 mm non hanno avuto problemi a mantenere la scheda fresca anche se overclockato.
L'overclocking manuale è e rimane una lotteria. La qualità dei chip grafici è sempre diversa, quindi i produttori hanno impostato tutti i chip ad un determinato livello di sicurezza che tutti dovrebbero essere in grado di raggiungere in modo stabile. Alcuni possono funzionare a velocità e tensioni di clock più elevate rispetto ad altri, quindi non c'è alcuna garanzia che le nostre esperienze con l'overclocking di AMP Extreme siano le stesse delle vostre. Potremmo aver ricevuto un chip eccellente o in grado di gestire pochissimo l'overclocking, ma non c'è modo di scoprirlo senza aver provato più chip. Lo stesso vale per la VRAM. Dato che Zotac effettua l'overclock dell'AMP Extreme in fabbrica, non sorprende che abbiamo ottenuto solo piccoli guadagni con l'overclocking manuale aggiuntivo.
Pro
Contro
Giudizio Complessivo

Zotac attualmente richiede circa €570 (~$640) per la GeForce RTX 2070 AMP Extreme. Anche se è costosa, avrete l'RTX 2070 più potente sul mercato. Ci sono compromessi associati a queste prestazioni aggiuntive, come un consumo energetico significativamente maggiore e ventole che diventano più rumorose di quelle delle altre schede RTX 2070 overclockate di fabbrica, ma la Zotac offre un'esperienza di gioco costantemente migliore rispetto ai suoi concorrenti.
Come tutte le schede RTX 2070, l'AMP Extreme ha 8 GB di VRAM GDDR6, che dovrebbe essere sufficiente per giocare ai moderni titoli a tripla A nel 2019. Tuttavia, rivali come la Radeon VII sembrano più pronte al futuro con 16 GB di VRAM. Questo è puramente speculativo in questa fase, però, e 8 GB potrebbero ancora essere un sacco di VRAM in pochi anni a seconda di come sono ottimizzati i giochi.
Tuttavia, l'AMP Extreme offre prestazioni di gioco eccezionali per una RTX 2070 e può giocare tutti i giochi a 1440p comodamente al massimo della grafica. La scheda gestisce bene anche i giochi a 2160p, ma sarà necessario ridurre la grafica di giochi come "Anno 1800" per ottenere framerate giocabili.
La Zotac GeForce RTX 2070 AMP Extreme è la più veloce RTX 2070 che il denaro può attualmente acquistare. La scheda può essere più costosa dei suoi concorrenti, ma fornisce le prestazioni per giustificare l'aumento di prezzo.
Il gruppo target per Zotac qui sono chiaramente i giocatori a cui piace giocare a 1440p e oltre. Una scheda RTX 2070 per il gioco a 1080p sarebbe però esagerato. Se si rientra in quest'ultima categoria, si consiglia di acquistare una RTX 2060 o una GTX 1660 Ti.
Gli unici svantaggi dell'AMP Extreme sono il peggior equilibrio tra prestazioni e requisiti di potenza. La scheda Zotac overclocked di fabbrica offre prestazioni migliori rispetto alla scheda Founder Edition, ma non necessariamente a sufficienza per giustificare l'aumento del consumo energetico. Anche i fan dell'AMP Extreme non sono fastidiosamente rumorosi, ma sono notevolmente più impazienti di quelli della MSI RTX 2070 Gaming Z 8G.
Nel complesso, la Zotac GeForce RTX 2070 AMP Extreme è l'apice della RTX 2070 gaming. Tuttavia, se le prestazioni aggiuntive valgano il suo prezzo più alto, l'aumento del consumo energetico e le ventole più rumorose saranno discutibili.
