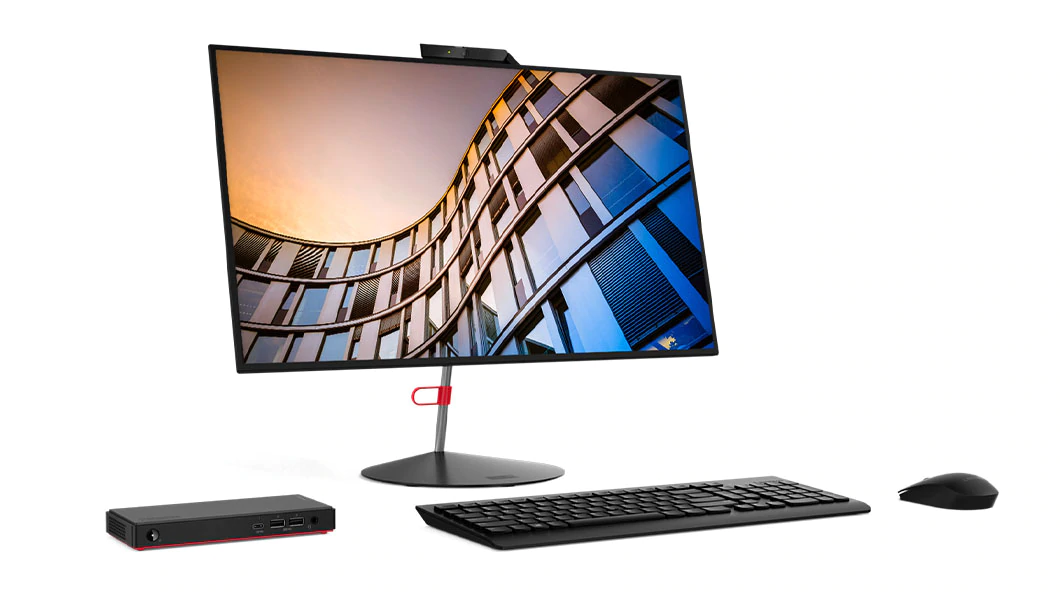
Recensione del Lenovo ThinkCentre M90n Nano Desktop
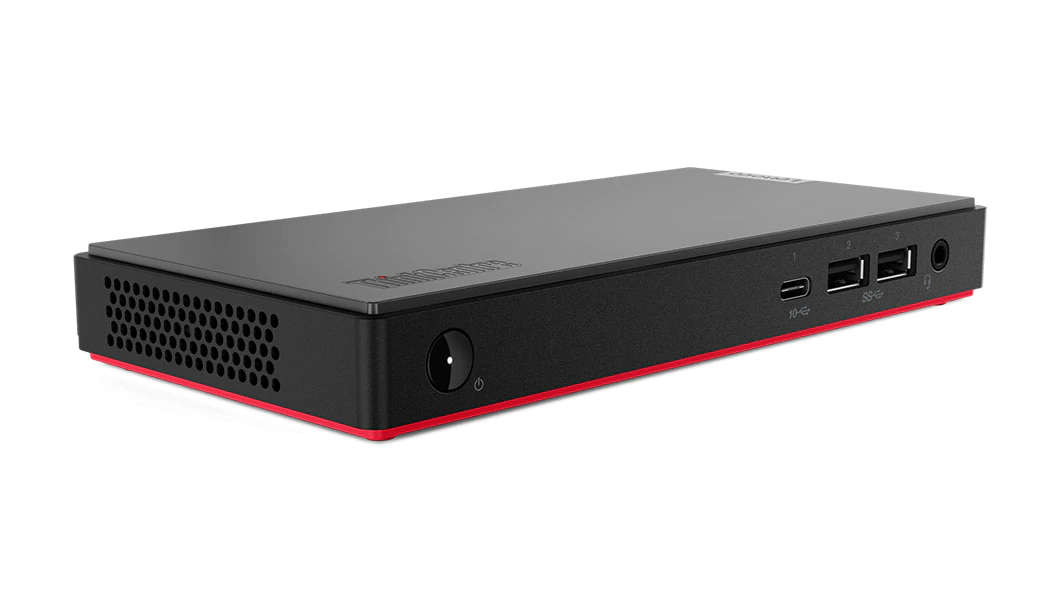
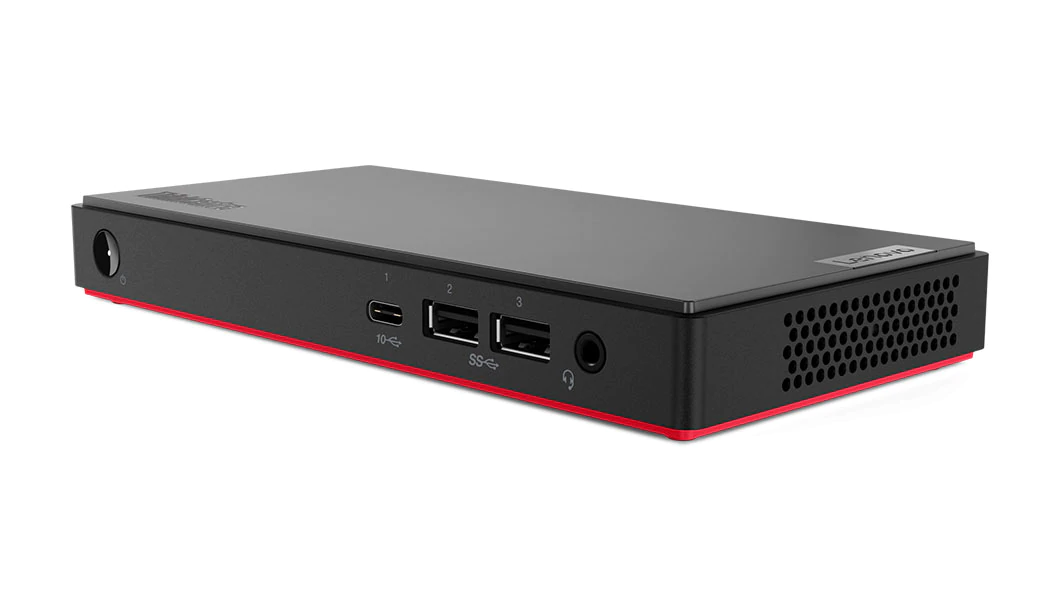
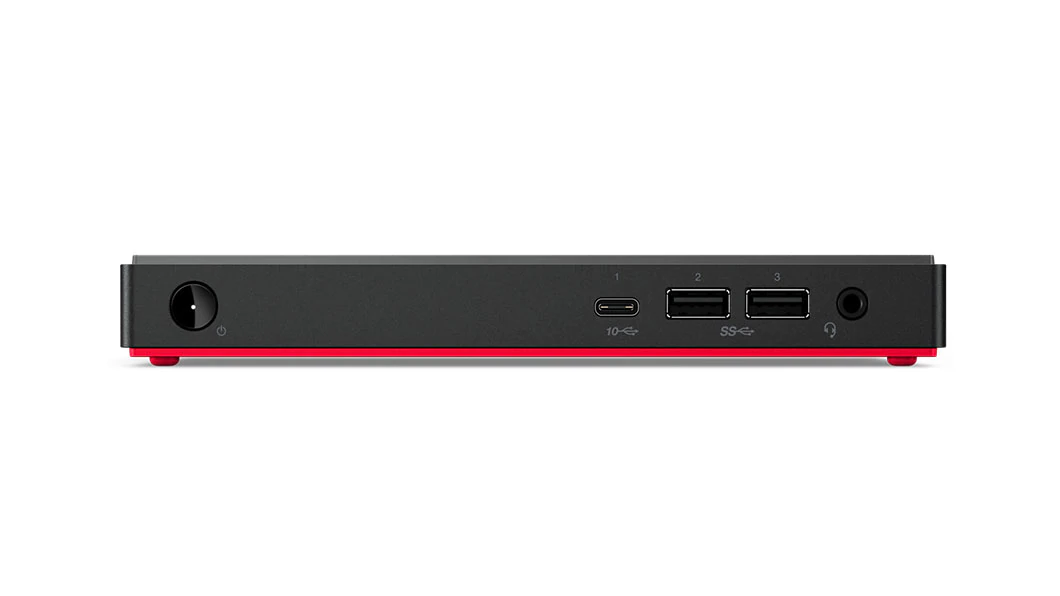
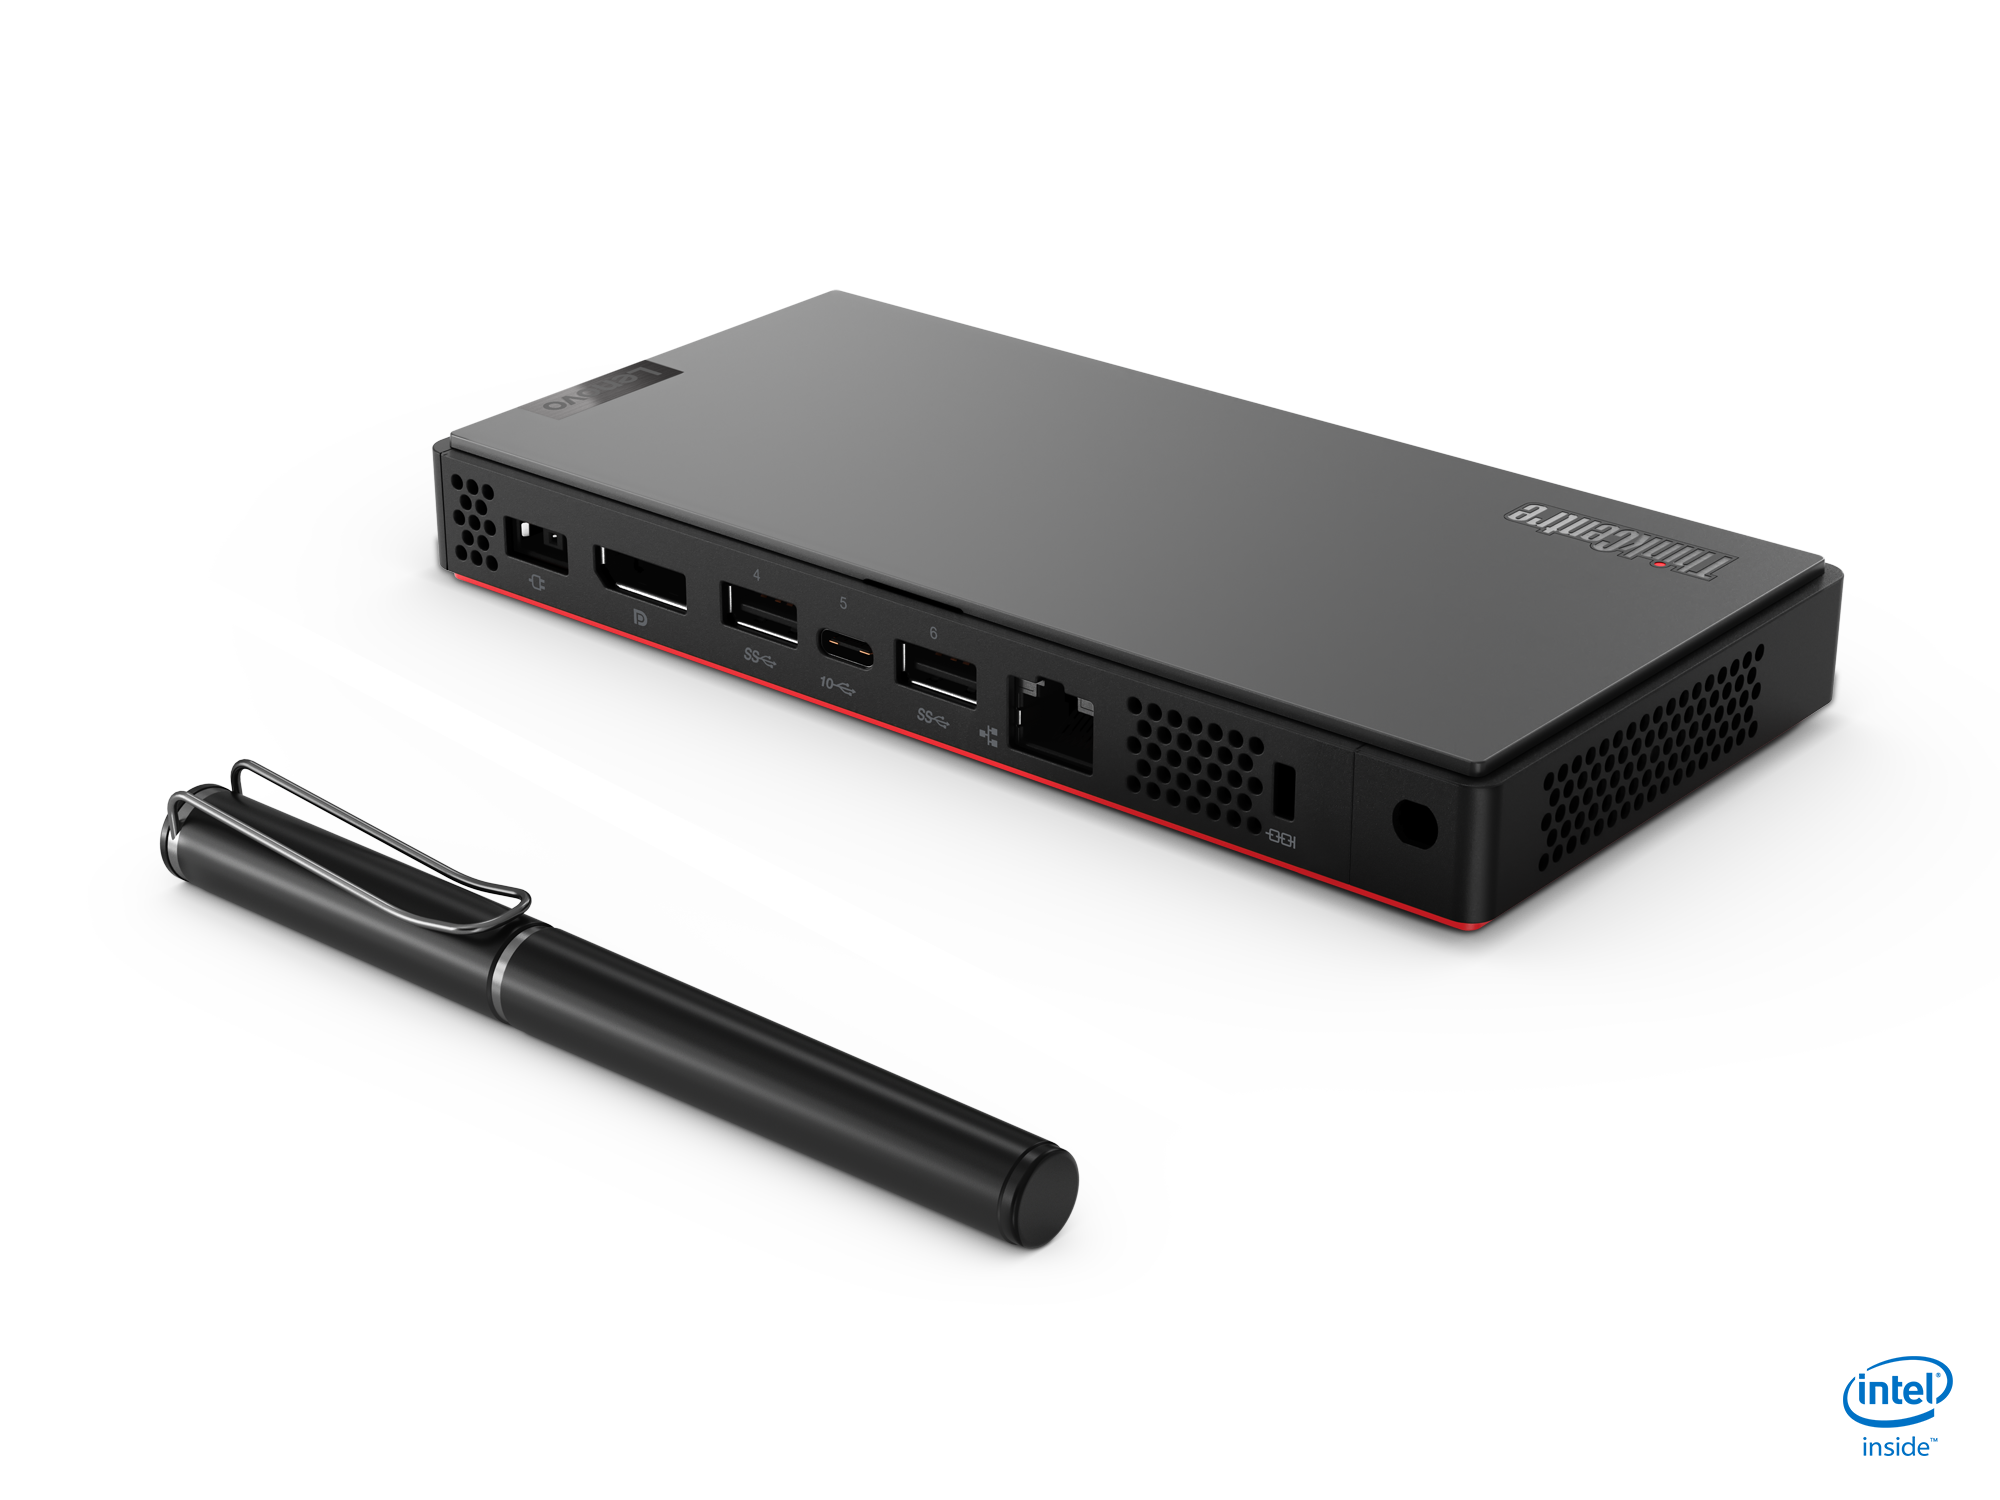
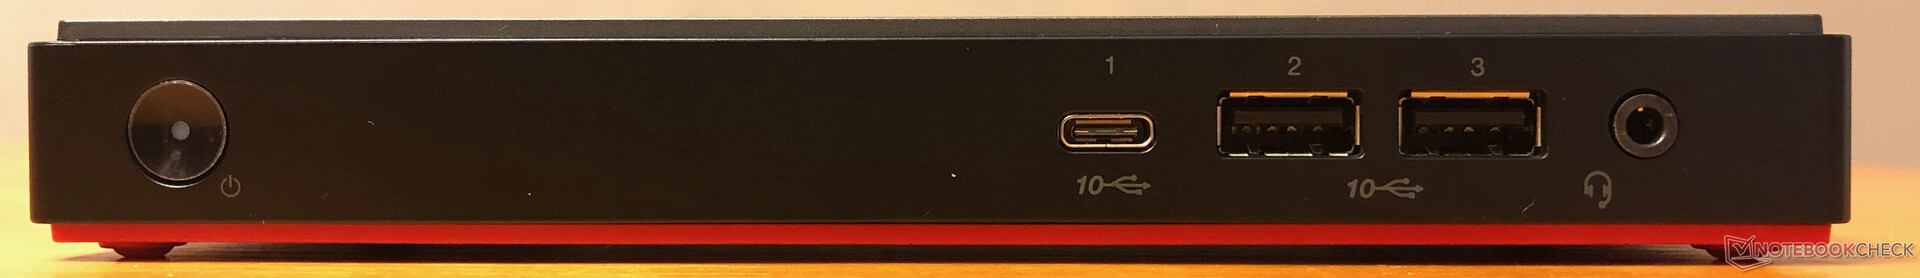
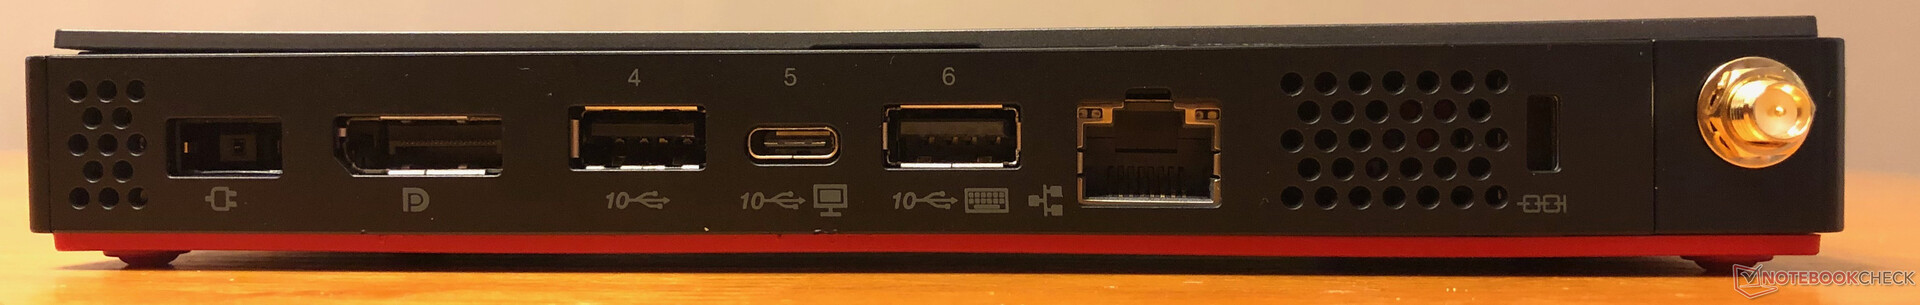
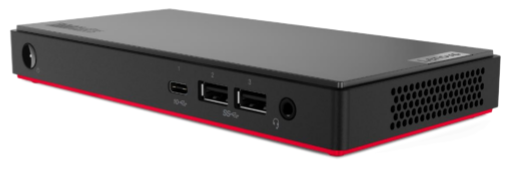
Connessioni
| PCMark 10 Score | 3876 punti | |
Aiuto | ||
| Lenovo ThinkCentre M90n-1 Nano Samsung SSD PM981 MZVLB512HAJQ | Dell Vostro 15-5581 SK hynix BC501 HFM128GDJTNG-831 | HP Pavilion 15-cs2019ng Toshiba KBG30ZMV256G | Lenovo ThinkPad L490 20Q6S08600 Intel SSD Pro 7600p SSDPEKKF512G8L | Media Samsung SSD PM981 MZVLB512HAJQ | Media della classe Desktop | |
|---|---|---|---|---|---|---|
| CrystalDiskMark 5.2 / 6 | -34% | -12% | -3% | 35% | 201% | |
| Write 4K (MB/s) | 130 | 129.3 -1% | 149.3 15% | 128.3 -1% | 126.7 ? -3% | 258 ? 98% |
| Read 4K (MB/s) | 45.61 | 41.02 -10% | 52.7 16% | 61.6 35% | 44 ? -4% | 80.3 ? 76% |
| Write Seq (MB/s) | 203.4 | 667 | 846 | 1617 ? | 5728 ? | |
| Read Seq (MB/s) | 271.2 | 818 | 1425 | 1716 ? | 3904 ? | |
| Write 4K Q32T1 (MB/s) | 365.3 | 252.3 -31% | 332.1 -9% | 503 38% | 413 ? 13% | 714 ? 95% |
| Read 4K Q32T1 (MB/s) | 350.2 | 281.4 -20% | 467.1 33% | 418.7 20% | 420 ? 20% | 877 ? 150% |
| Write Seq Q32T1 (MB/s) | 2986 | 319.8 -89% | 985 -67% | 1391 -53% | 2076 ? -30% | 6596 ? 121% |
| Read Seq Q32T1 (MB/s) | 3565 | 1589 -55% | 1454 -59% | 1570 -56% | 3130 ? -12% | 7176 ? 101% |
| Write 4K Q8T8 (MB/s) | 368.7 | 1264 ? 243% | 3048 ? 727% | |||
| Read 4K Q8T8 (MB/s) | 790 | 1193 ? 51% | 2667 ? 238% | |||
| AS SSD | -54% | -168% | -4% | 10% | 205% | |
| Seq Read (MB/s) | 1668 | 1195 -28% | 1153 -31% | 1262 -24% | 1976 ? 18% | 6014 ? 261% |
| Seq Write (MB/s) | 1150 | 370.2 -68% | 736 -36% | 735 -36% | 1637 ? 42% | 5617 ? 388% |
| 4K Read (MB/s) | 48.46 | 39.14 -19% | 46.51 -4% | 46.44 -4% | 50.5 ? 4% | 91.4 ? 89% |
| 4K Write (MB/s) | 116.5 | 115.5 -1% | 114.1 -2% | 137.5 18% | 112 ? -4% | 229 ? 97% |
| 4K-64 Read (MB/s) | 726 | 257.9 -64% | 618 -15% | 685 -6% | 1203 ? 66% | 3107 ? 328% |
| 4K-64 Write (MB/s) | 1074 | 166.2 -85% | 461.4 -57% | 905 -16% | 1504 ? 40% | 3664 ? 241% |
| Access Time Read * (ms) | 0.039 | 0.073 -87% | 0.421 -979% | 0.025 36% | 0.05092 ? -31% | 0.044 ? -13% |
| Access Time Write * (ms) | 0.032 | 0.045 -41% | 0.233 -628% | 0.025 22% | 0.08337 ? -161% | 0.01913 ? 40% |
| Score Read (Points) | 942 | 417 -56% | 780 -17% | 858 -9% | 1451 ? 54% | 3800 ? 303% |
| Score Write (Points) | 1305 | 319 -76% | 649 -50% | 1116 -14% | 1780 ? 36% | 4455 ? 241% |
| Score Total (Points) | 2716 | 922 -66% | 1822 -33% | 2400 -12% | 3966 ? 46% | 10181 ? 275% |
| Copy ISO MB/s (MB/s) | 1164 | 1755 ? | 3705 ? | |||
| Copy Program MB/s (MB/s) | 445.1 | 454 ? | 1127 ? | |||
| Copy Game MB/s (MB/s) | 646 | 1057 ? | 2420 ? | |||
| Media totale (Programma / Settaggio) | -44% /
-47% | -90% /
-113% | -4% /
-4% | 23% /
20% | 203% /
203% |
* ... Meglio usare valori piccoli

| 3DMark Cloud Gate Standard Score | 8337 punti | |
| 3DMark Fire Strike Score | 1089 punti | |
Aiuto | ||
| basso | medio | alto | ultra | |
|---|---|---|---|---|
| BioShock Infinite (2013) | 53 | 32 | 29 | 10 |
| Off / Standby | |
| Idle | |
| Sotto carico |
|
Leggenda:
min: | |
Pro
Contro
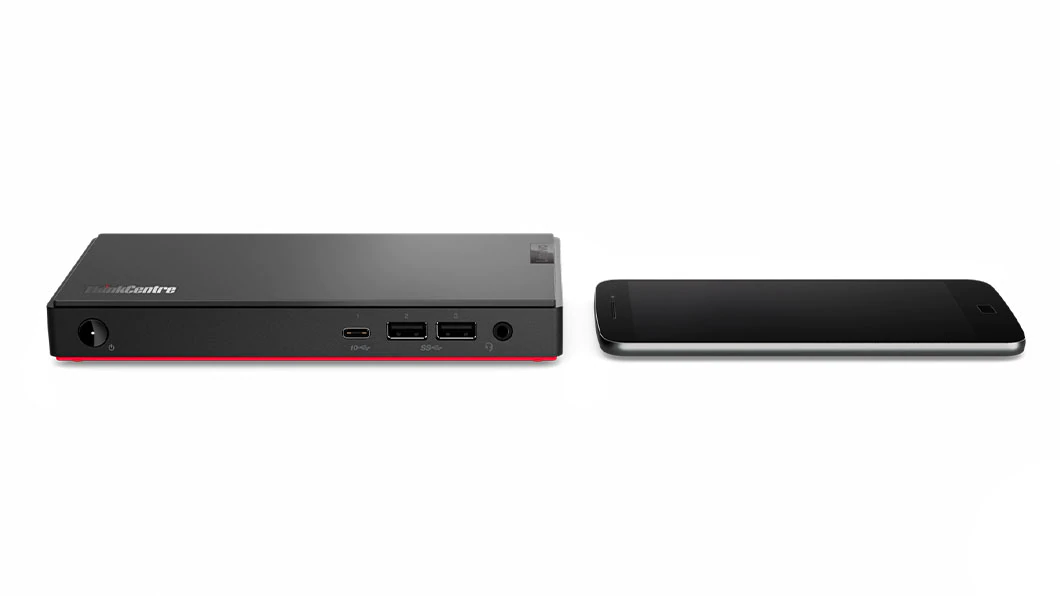
Il ThinkCentre M90n Nano è una buona opzione per gli acquirenti in cerca di un PC desktop compatto per uso generale. Il Nano potrebbe anche essere un PC home theatre decente (HTPC) grazie alle sue piccole dimensioni; il dispositivo potrebbe essere montato sul retro di un televisore in soggiorno o facilmente riposto in un luogo discreto.
Gli interni del Nano sono abbastanza potenti per la maggior parte degli utenti. La navigazione sul web è un gioco da ragazzi, lo streaming dei media è fluido e la macchina mastica il lavoro d'ufficio in generale.
Tuttavia, il Nano ha un prezzo relativamente alto considerando la scheda tecnica. Lenovo propone spesso vendite e offerte speciali, ma al suo prezzo pieno al dettaglio, la nostra opinione è che il Nano è troppo costoso per quello che offre. Allo stesso prezzo, è probabile che gli acquirenti potrebbero trovare un Ultrabook con caratteristiche simili. Oltre al display integrato, alla tastiera e al trackpad, l'Ultrabook potrebbe essere portato in giro e comunque collegato a un monitor esterno o a un televisore quando si è a casa.
Per coloro che sono alla ricerca di un PC desktop incredibilmente compatto e sono disposti a pagare un piccolo premio, il Lenovo ThinkCentre M90n Nano è una buona opzione. I consumatori attenti ai costi dovrebbero guardare altrove.
Price comparison
