Recensione dell'Asus Zenbook S 13 OLED 2023 - L'ultrabook OLED più sottile al mondo è alle prese con ventole più fastidiose
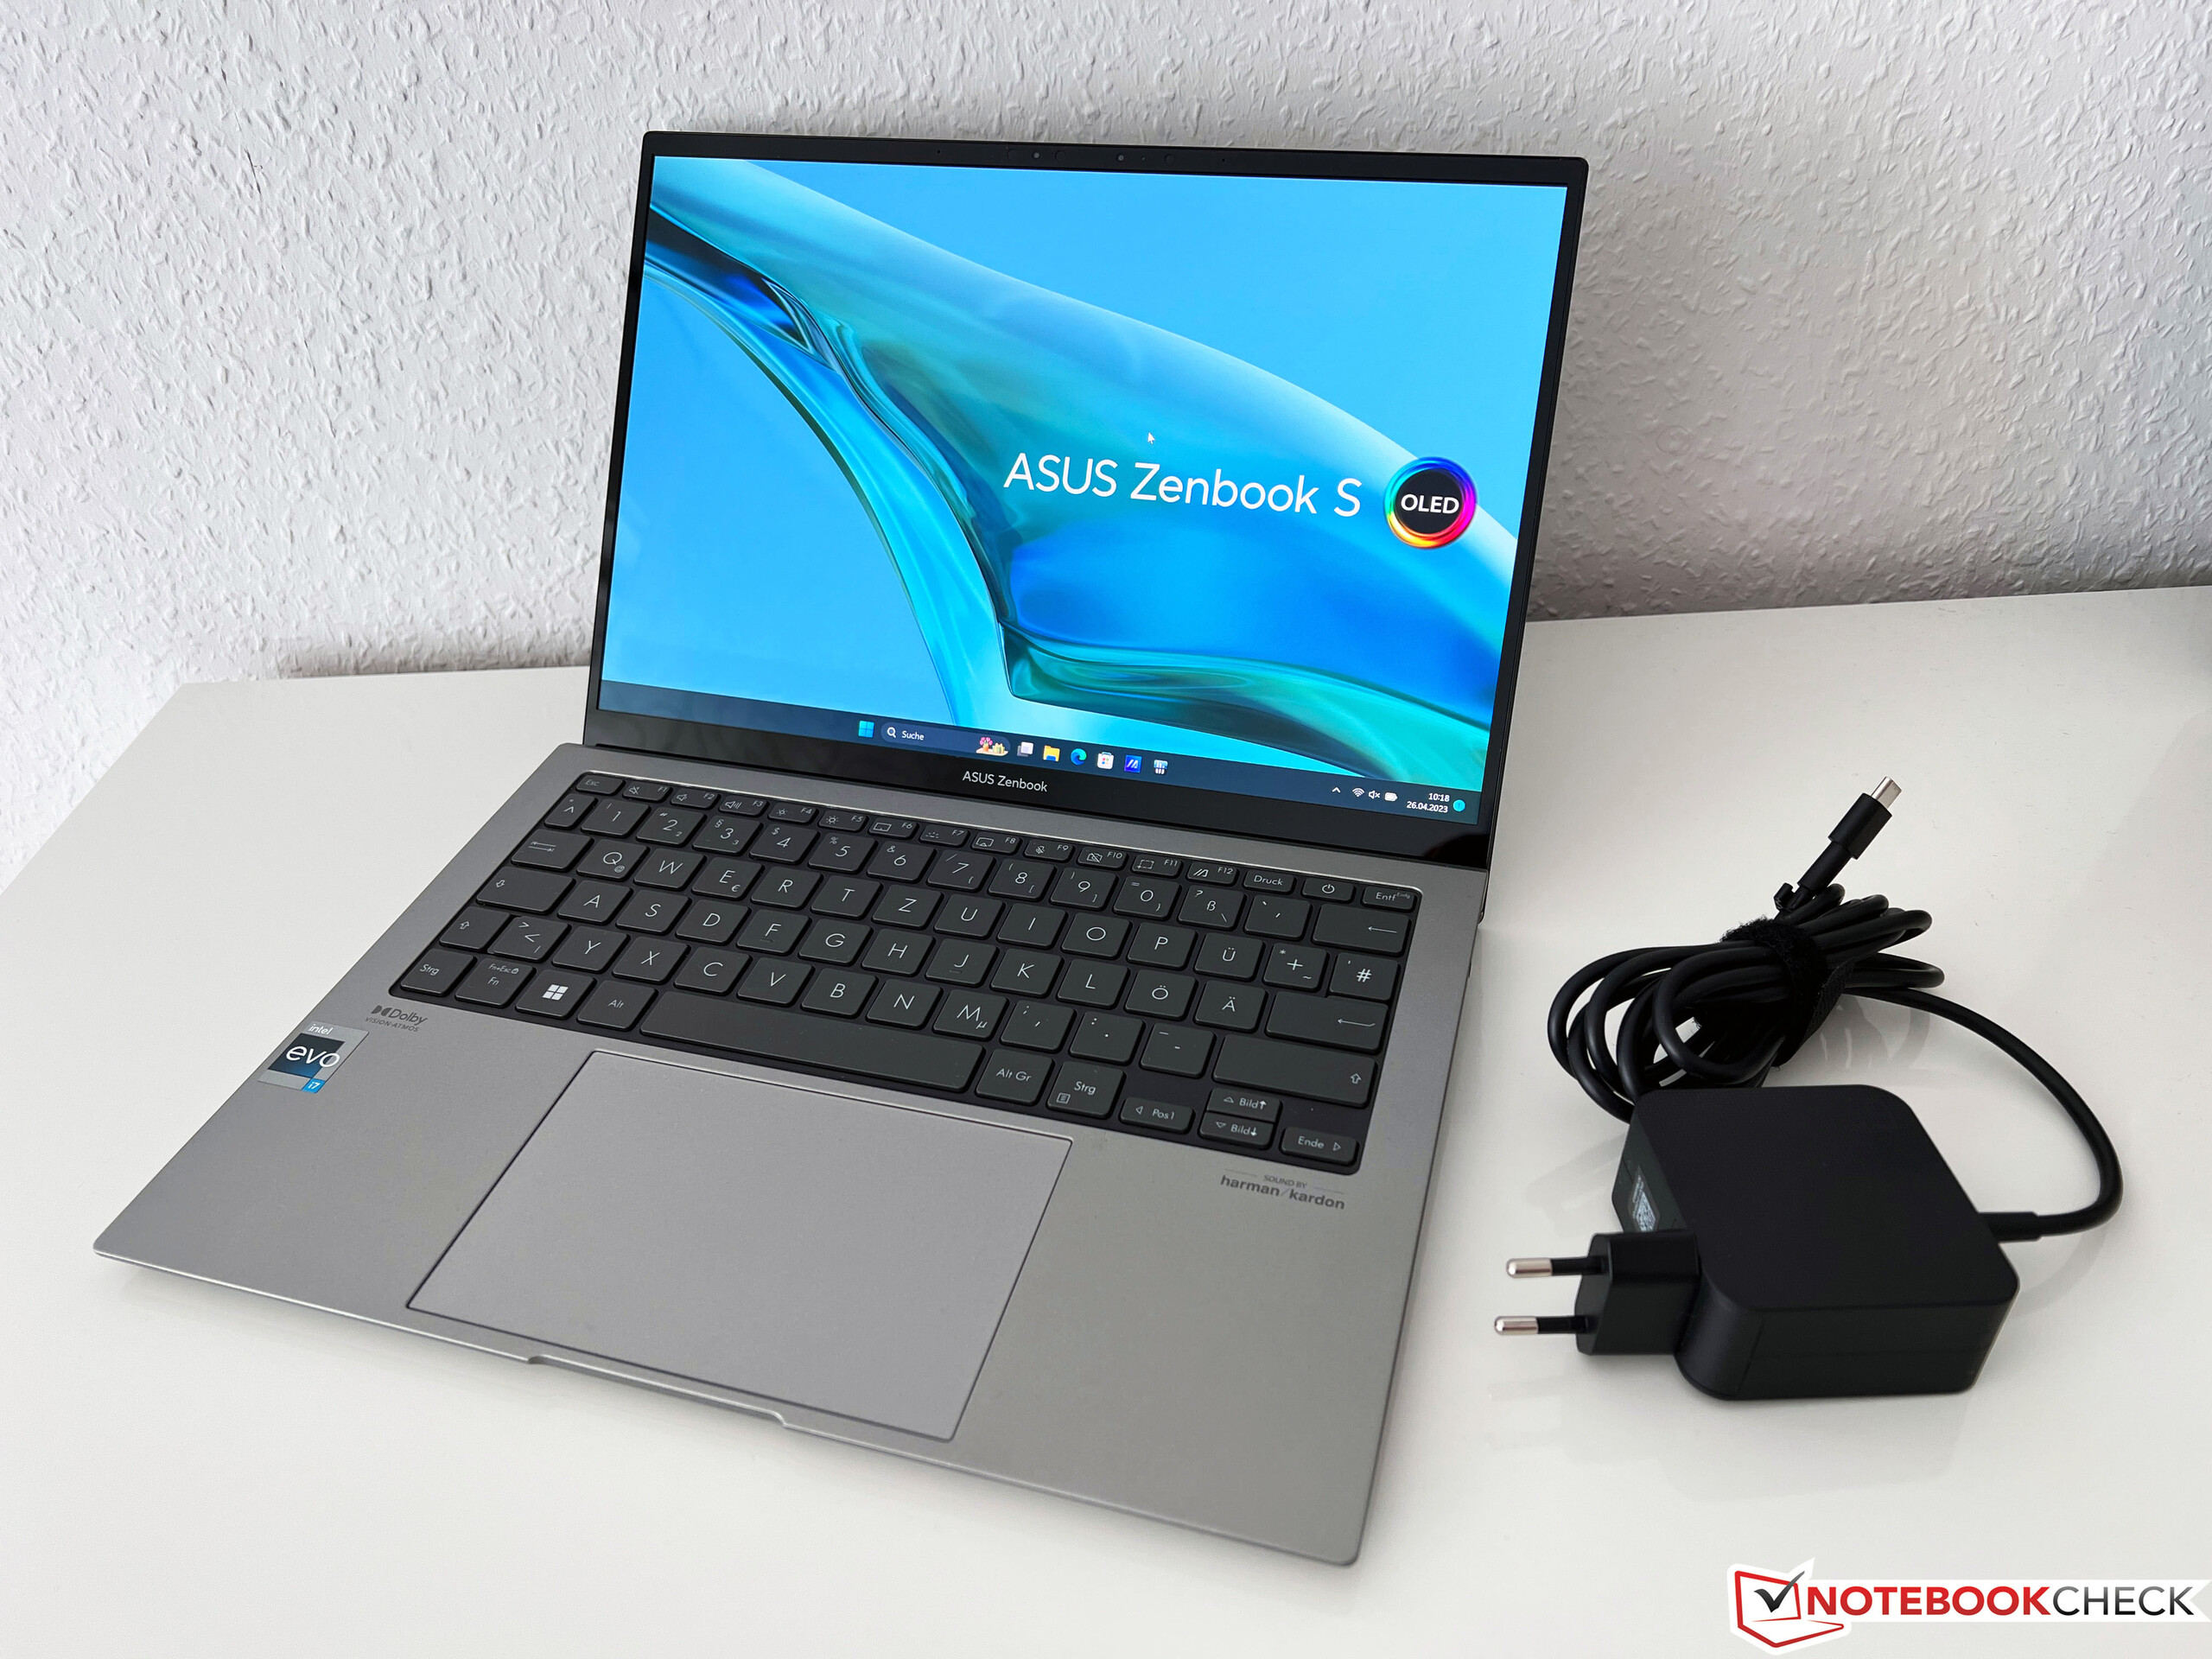
Asus ha completamente rielaborato il suo ultrabook compatto ZenBook S 13 da 13 pollici, concentrandosi principalmente sull'introduzione sul mercato di un dispositivo ancora più leggero e sottile. Secondo il materiale di marketing, questo è addirittura l'ultrabook OLED da 13,3 pollici più sottile al mondo. In questa riprogettazione, il produttore ha anche deciso di sostituire l'ottimo processore AMD del modello dello scorso anno con un chip Raptor Lake di Intel. Naturalmente, valuteremo se questa decisione è stata giusta.
La nostra unità di prova dello Zenbook S 13 OLED è ancora una volta dotata di un pannello OLED da 13,3 pollici nel formato 16:10. Inoltre, è presente unIntel Core i7-1355U16 GB di RAM e un'ampia unità SSD PCIe 4.0 da 1 TB al prezzo MSRP di 1.499 euro (~$1.657). Ma abbiamo anche buone notizie per i fan dello zenbook S 13 dello scorso annopoiché ci sarà anche un aggiornamento con le CPU Zen4 di AMD.
Potenziali concorrenti a confronto
Punteggio | Data | Modello | Peso | Altezza | Dimensione | Risoluzione | Prezzo |
|---|---|---|---|---|---|---|---|
| 85.4 % v7 (old) | 05/2023 | Asus ZenBook S13 OLED UX5304 i7-1355U, Iris Xe G7 96EUs | 1 kg | 11.8 mm | 13.30" | 2880x1800 | |
| 90.1 % v7 (old) | 07/2022 | Asus Zenbook S 13 OLED R7 6800U, Radeon 680M | 1.1 kg | 14.9 mm | 13.30" | 2880x1800 | |
| 92 % v7 (old) | 08/2022 | Apple MacBook Air M2 10C GPU M2, M2 10-Core GPU | 1.2 kg | 11.3 mm | 13.60" | 2560x1664 | |
| 86.4 % v7 (old) | 10/2022 | Lenovo Yoga Slim 7 Carbon 13IAP7-82U9005FGE i7-1260P, Iris Xe G7 96EUs | 986 gr | 14.8 mm | 13.30" | 2560x1600 | |
| 87.3 % v7 (old) | 09/2022 | Dell XPS 13 Plus 9320 i7-1280P OLED i7-1280P, Iris Xe G7 96EUs | 1.3 kg | 15.28 mm | 13.40" | 3456x2160 | |
| 86.7 % v7 (old) | 05/2022 | Samsung Galaxy Book2 Pro 13 NP930XED-KA1DE i5-1240P, Iris Xe G7 80EUs | 885 gr | 11 mm | 13.30" | 1920x1080 |
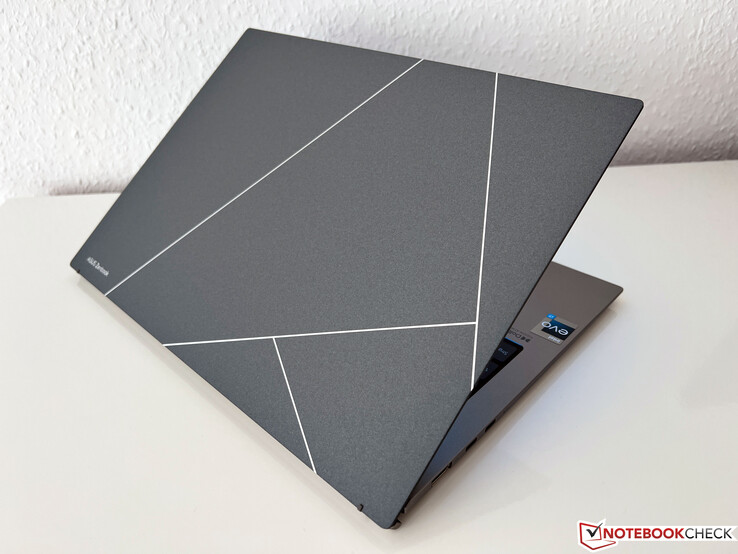
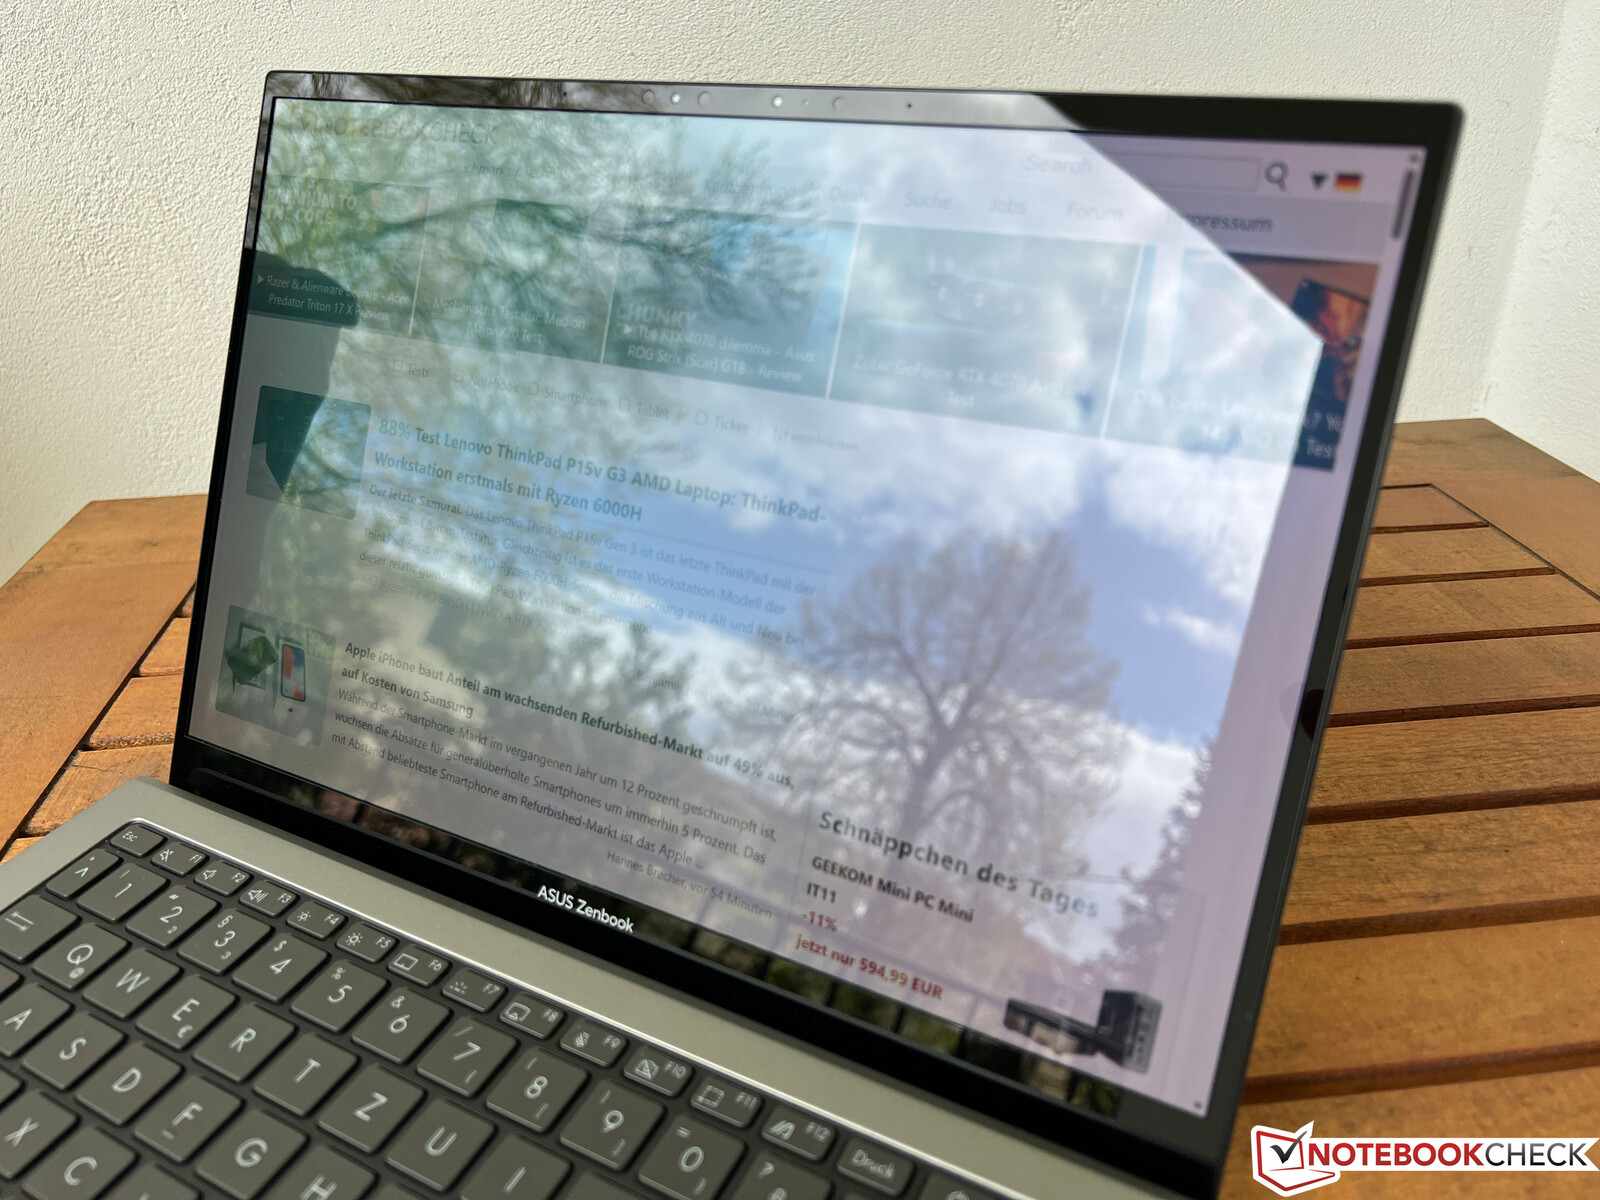
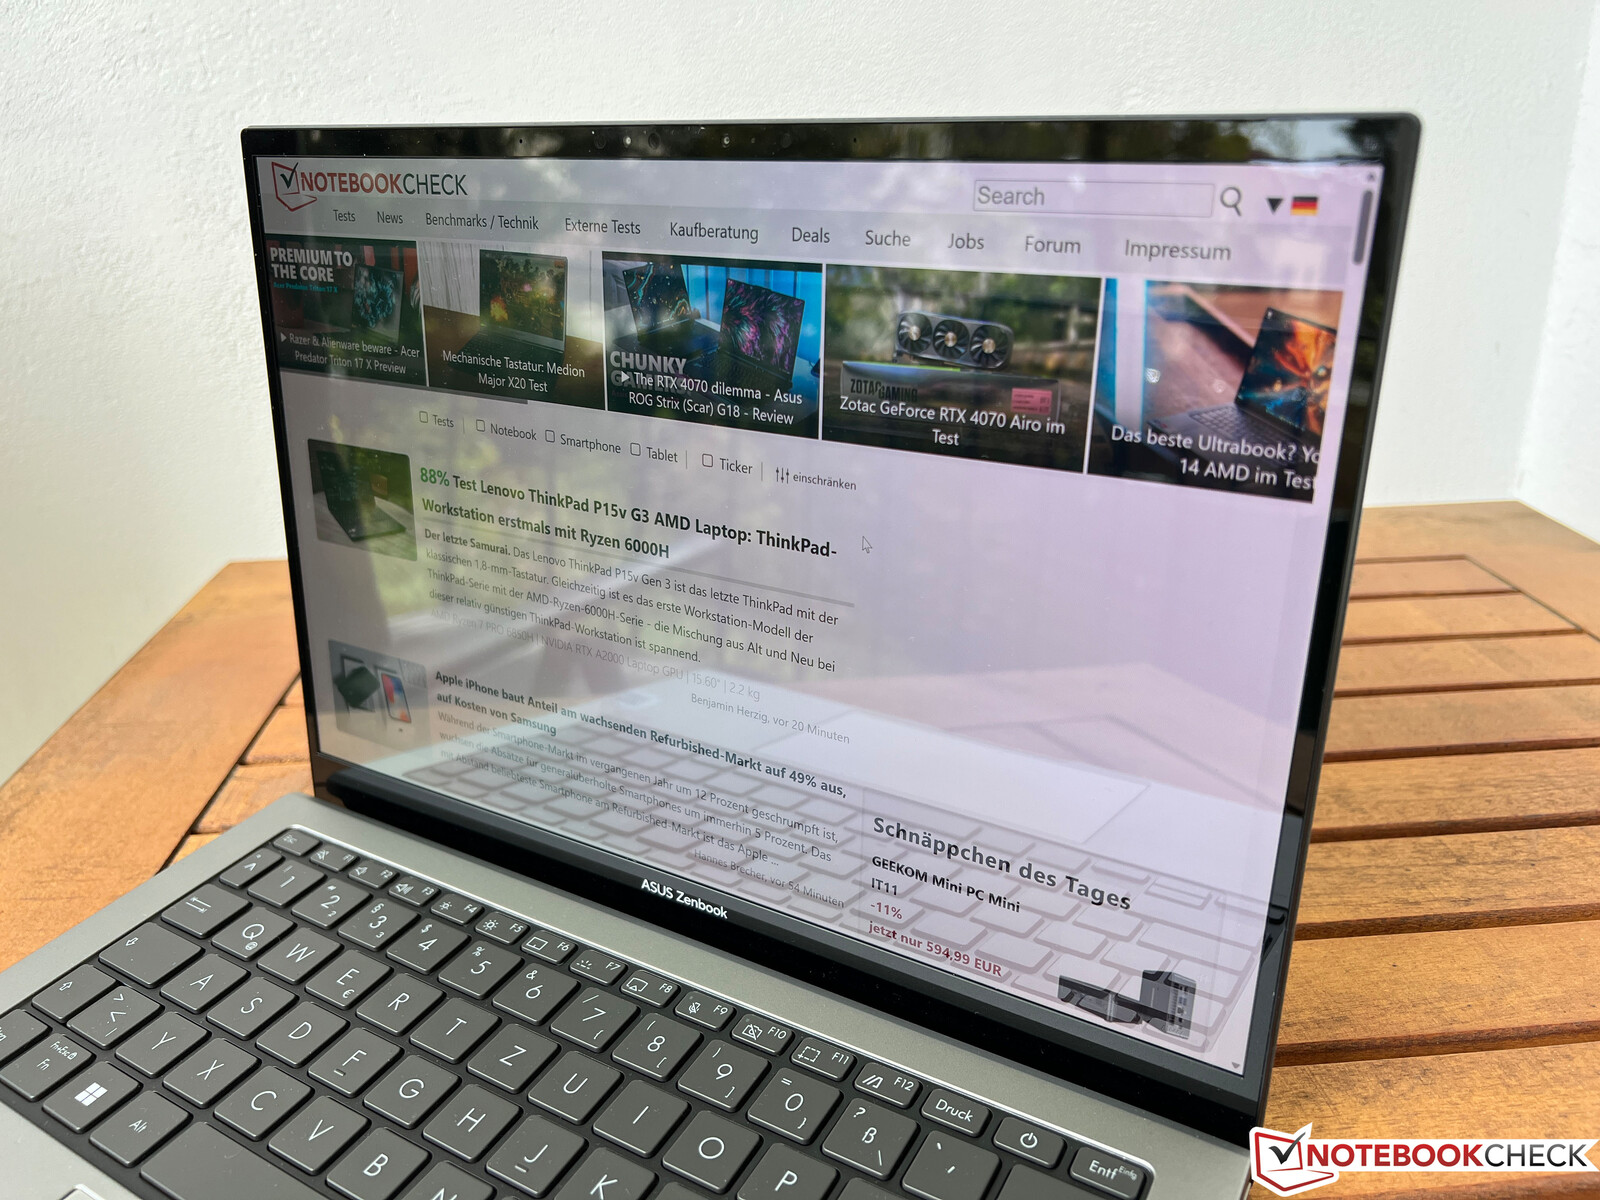
Custodia - Asus utilizza un rivestimento ceramico al plasma
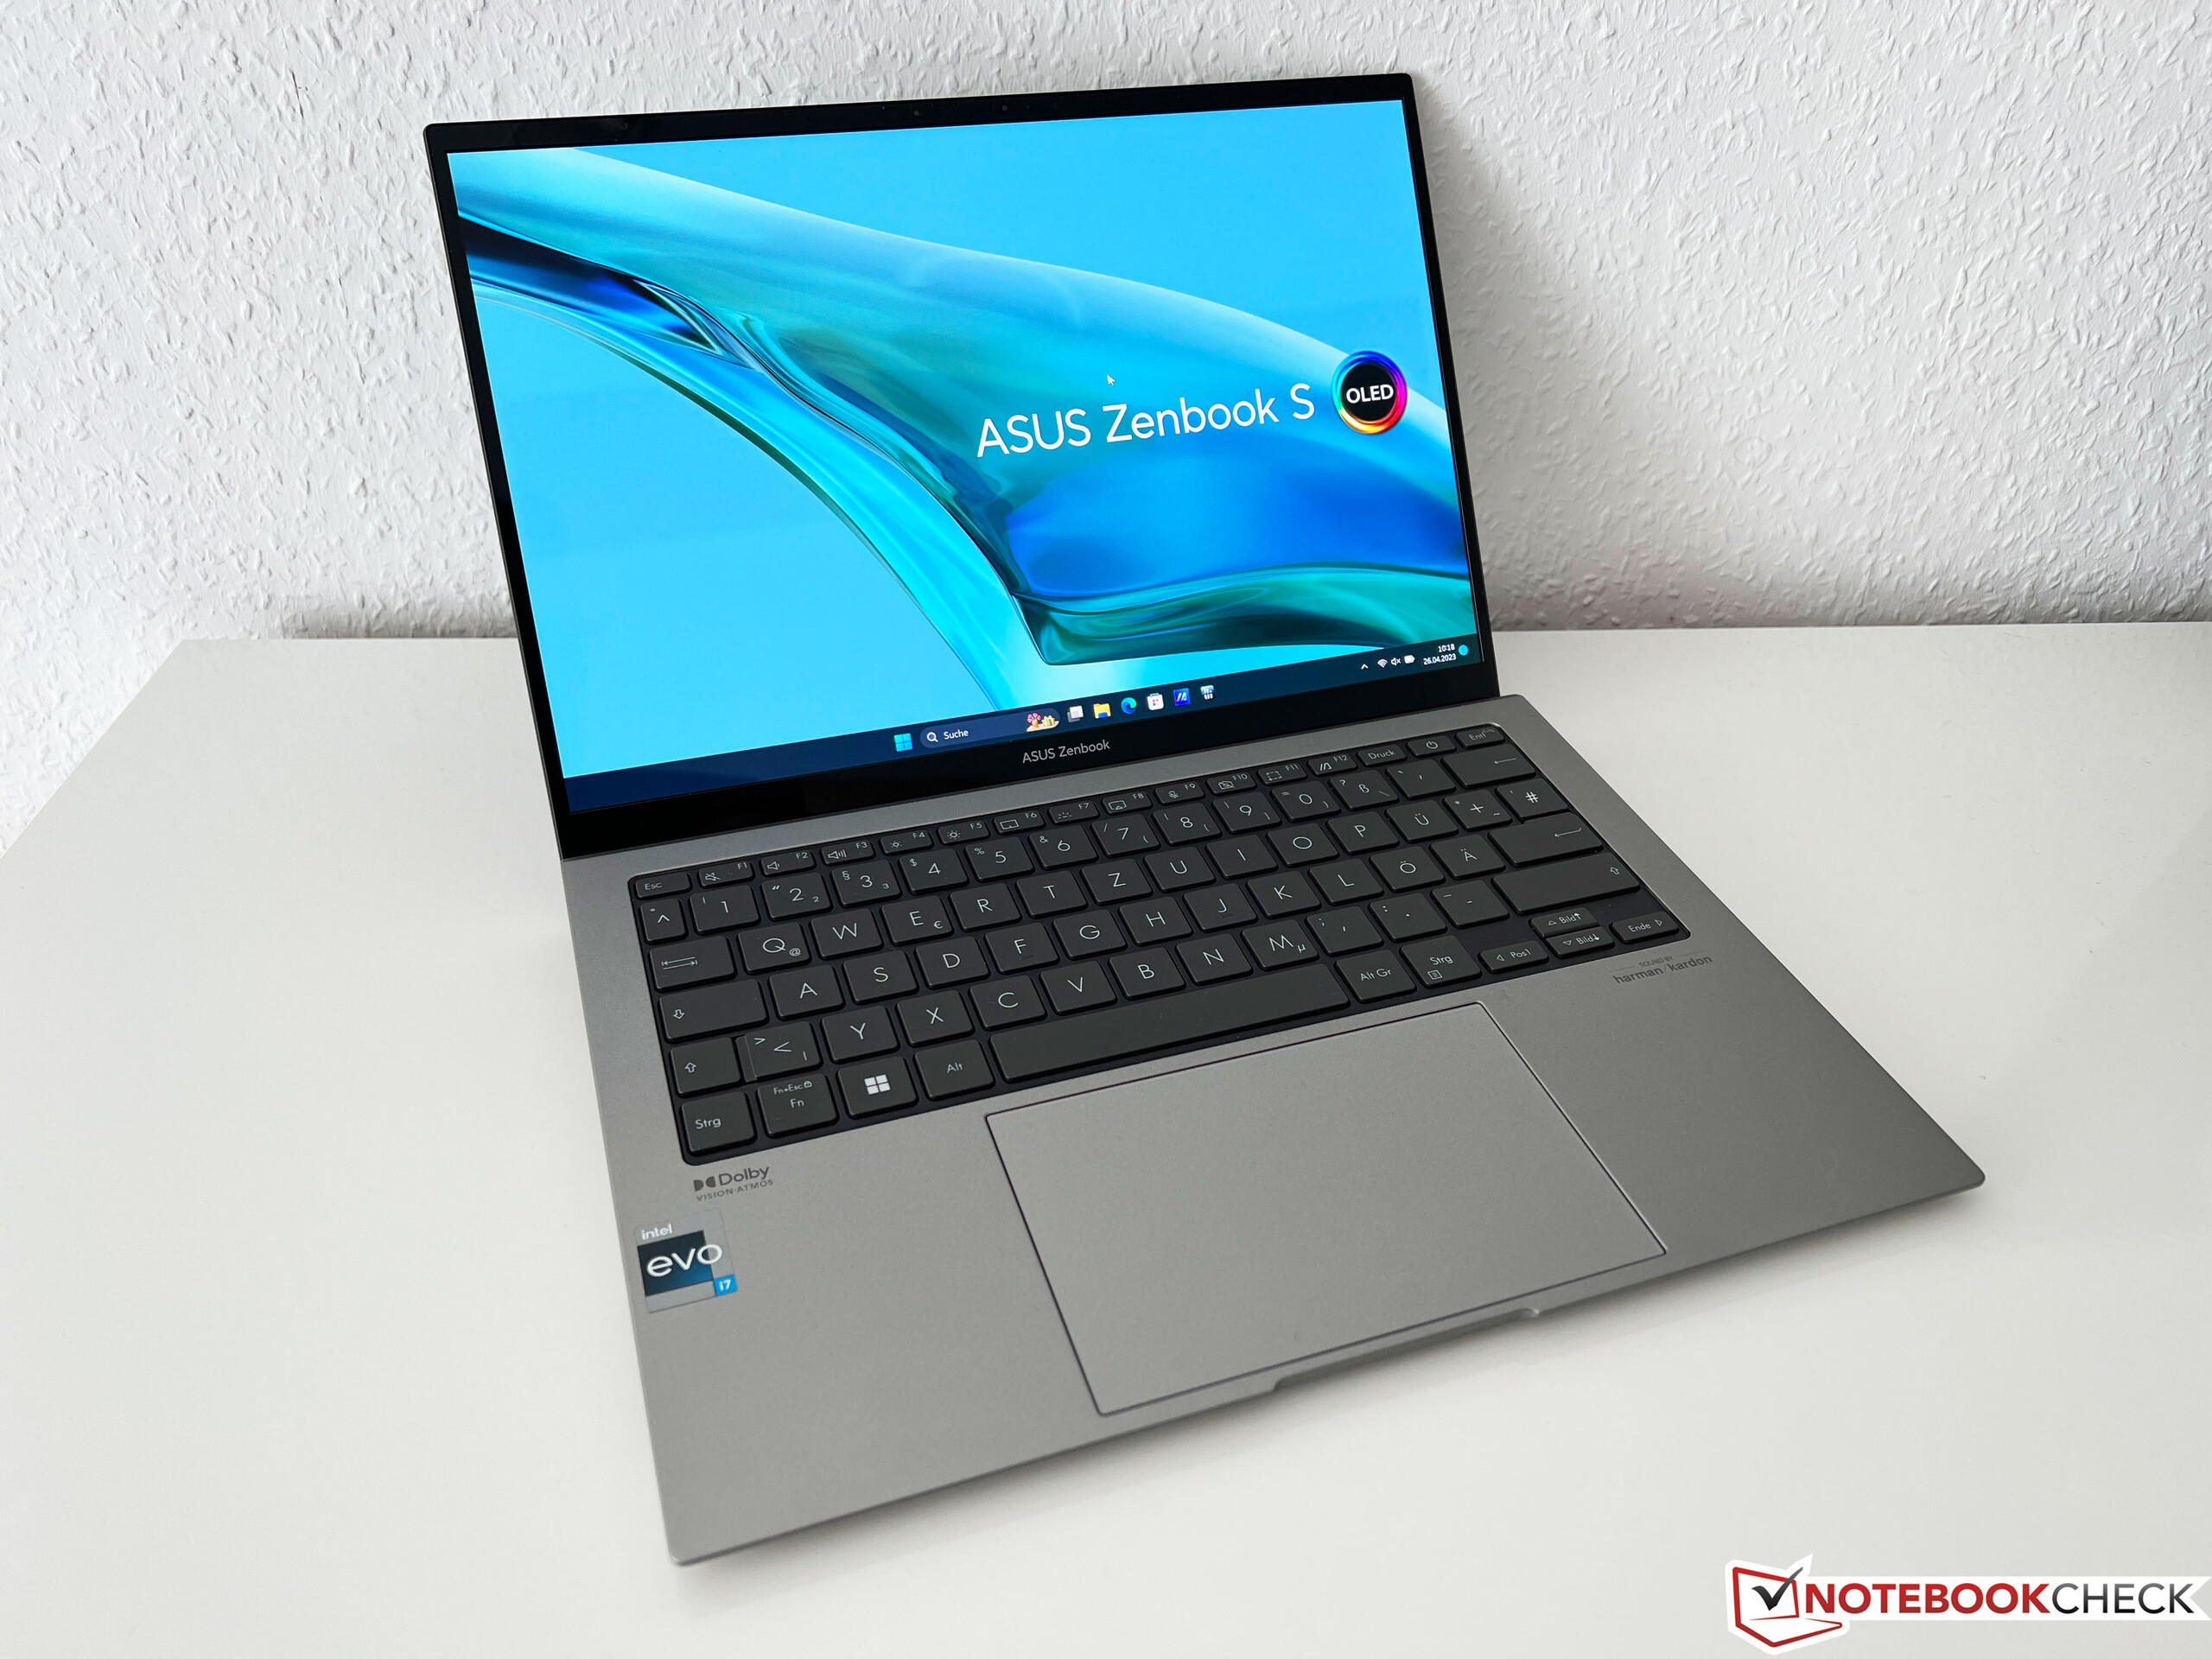
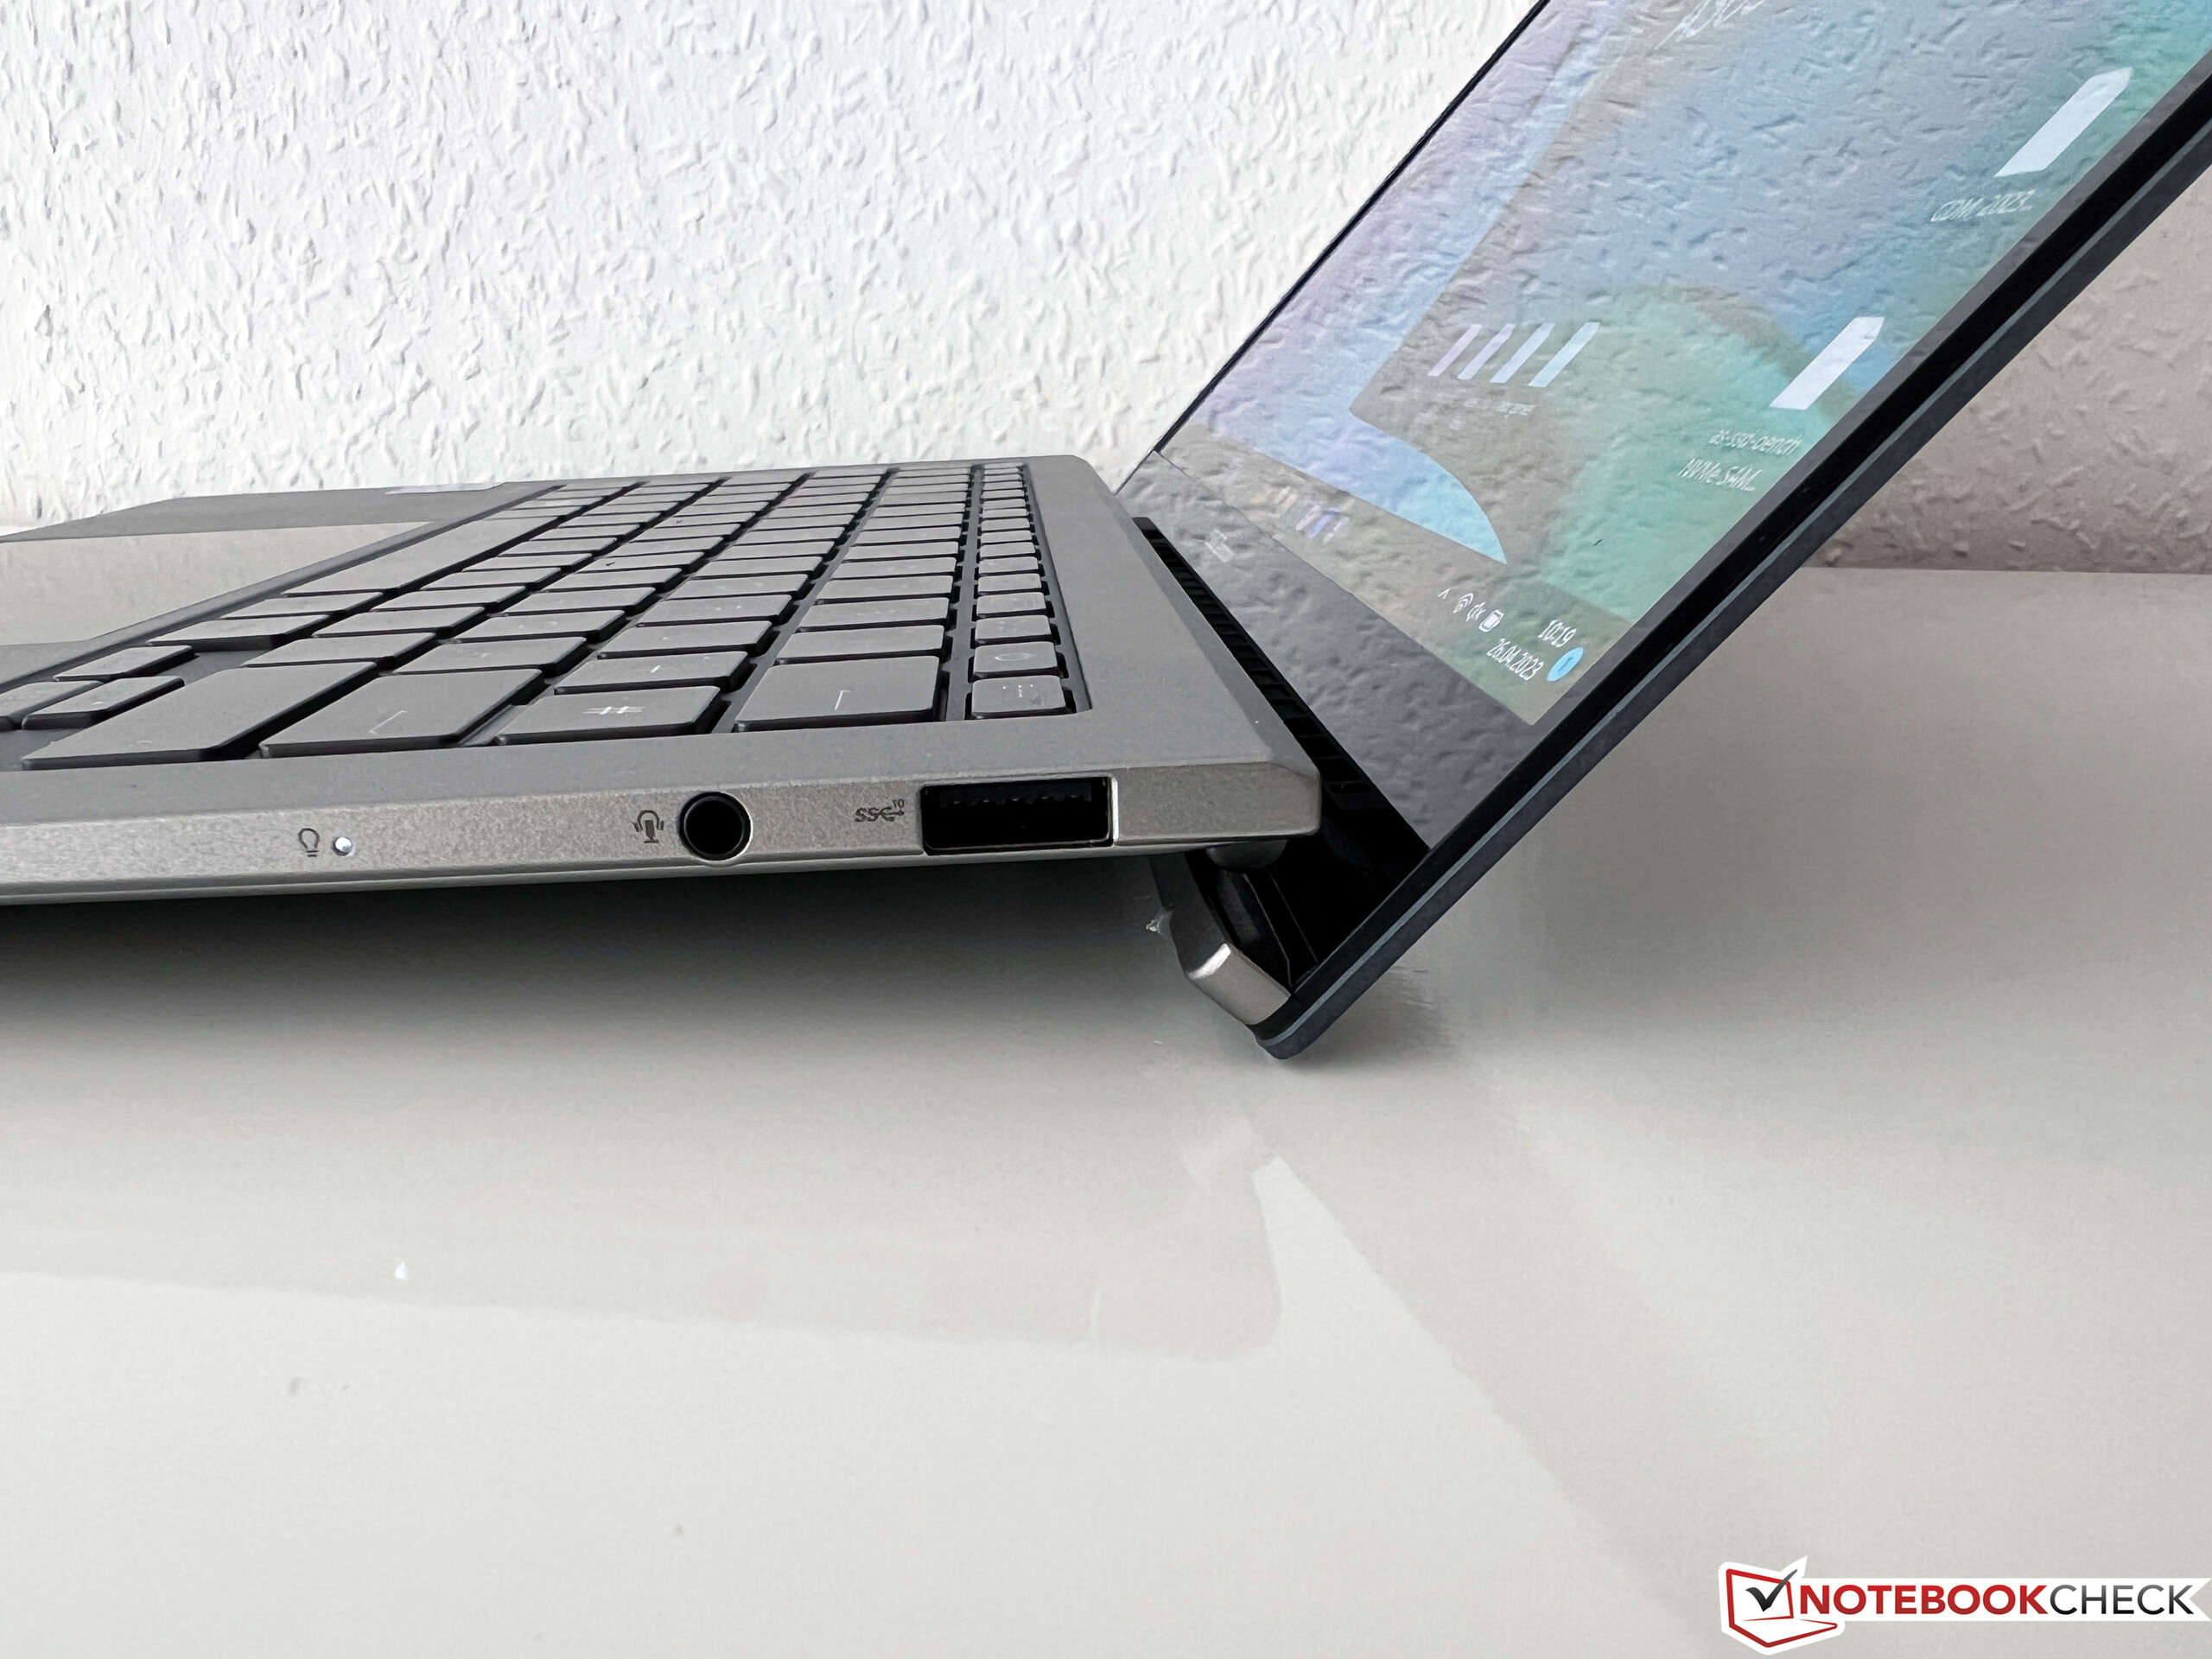
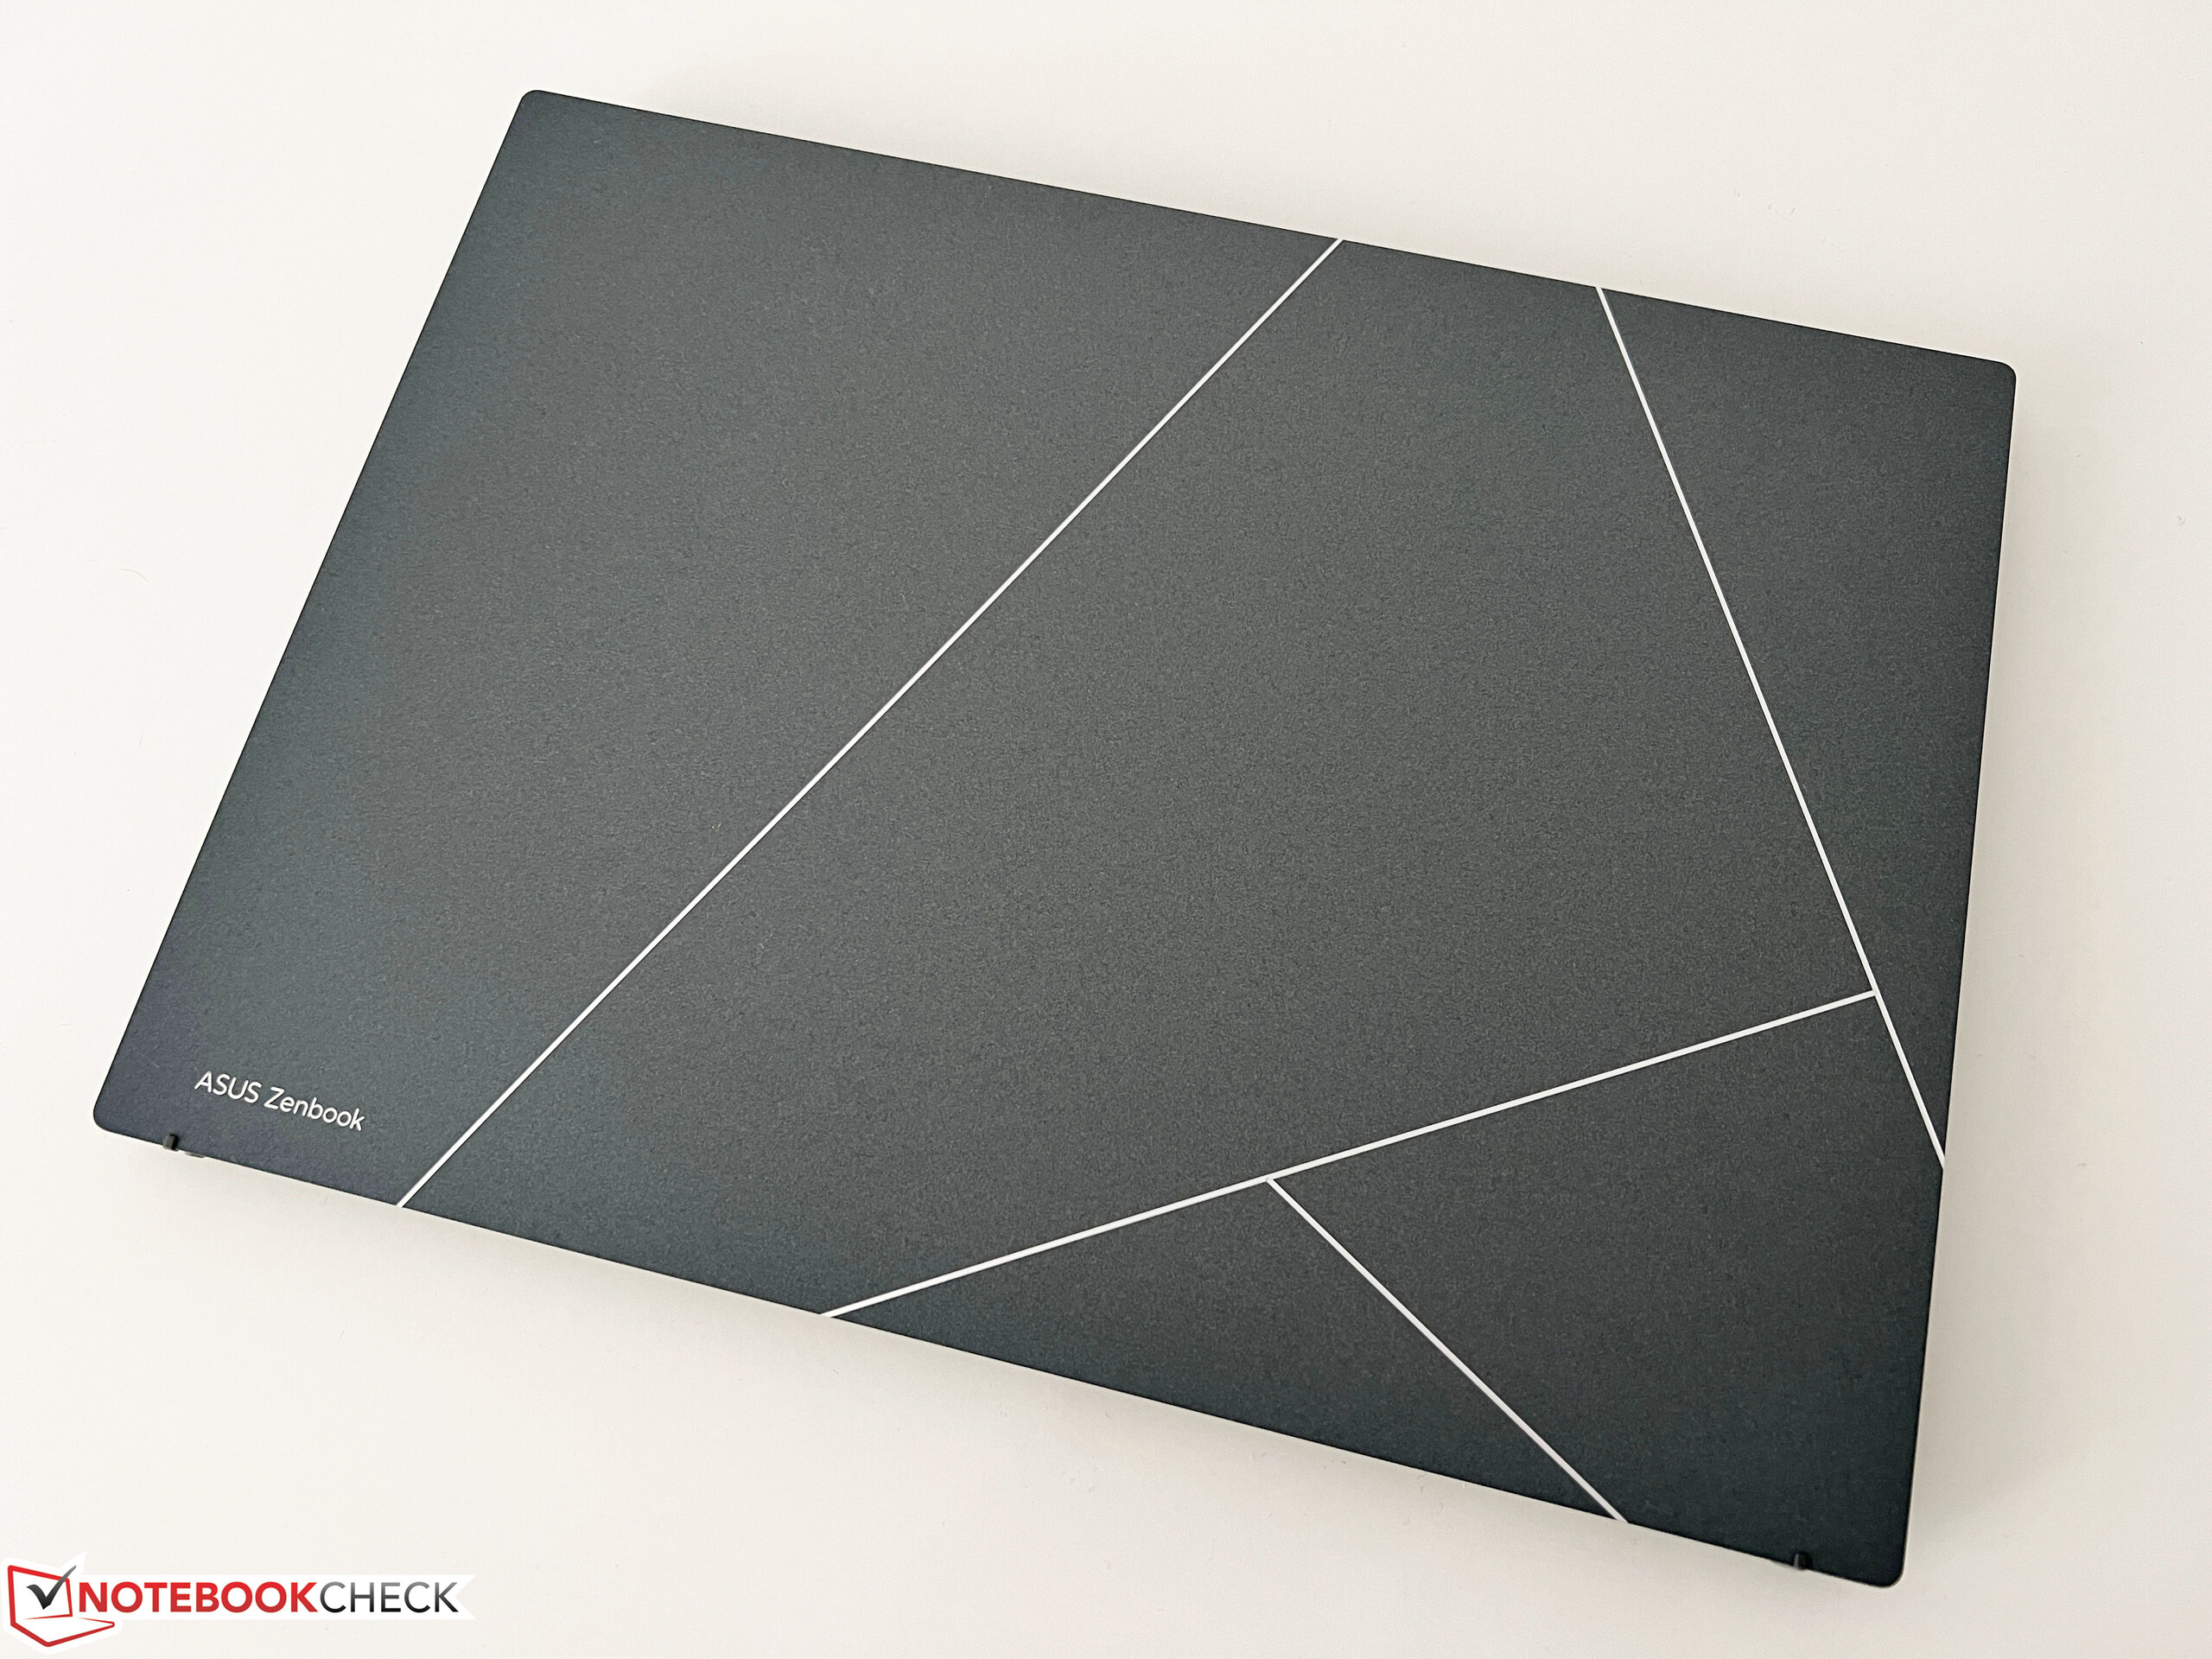
Il case dello Zenbook S 13 2023 segue un nuovo design, che include una nuova cerniera per il display. Si tratta di un meccanismo ErgoLift in cui l'unità di base è angolata quando si solleva il coperchio. Questo ha sia vantaggi che svantaggi, e se da un lato l'unità di base angolata rende la digitazione più comoda, dall'altro c'è un bordo duro quando si appoggia il dispositivo sulle cosce. Il nuovo Zenbook è disponibile nei colori Ponder Blue o Basalt Grey, e la nostra unità di prova grigia sembra molto bella ed elegante con le varie tonalità di grigio. Inoltre, ci piace molto il grande logo ProArt sulla parte superiore della cover del display.
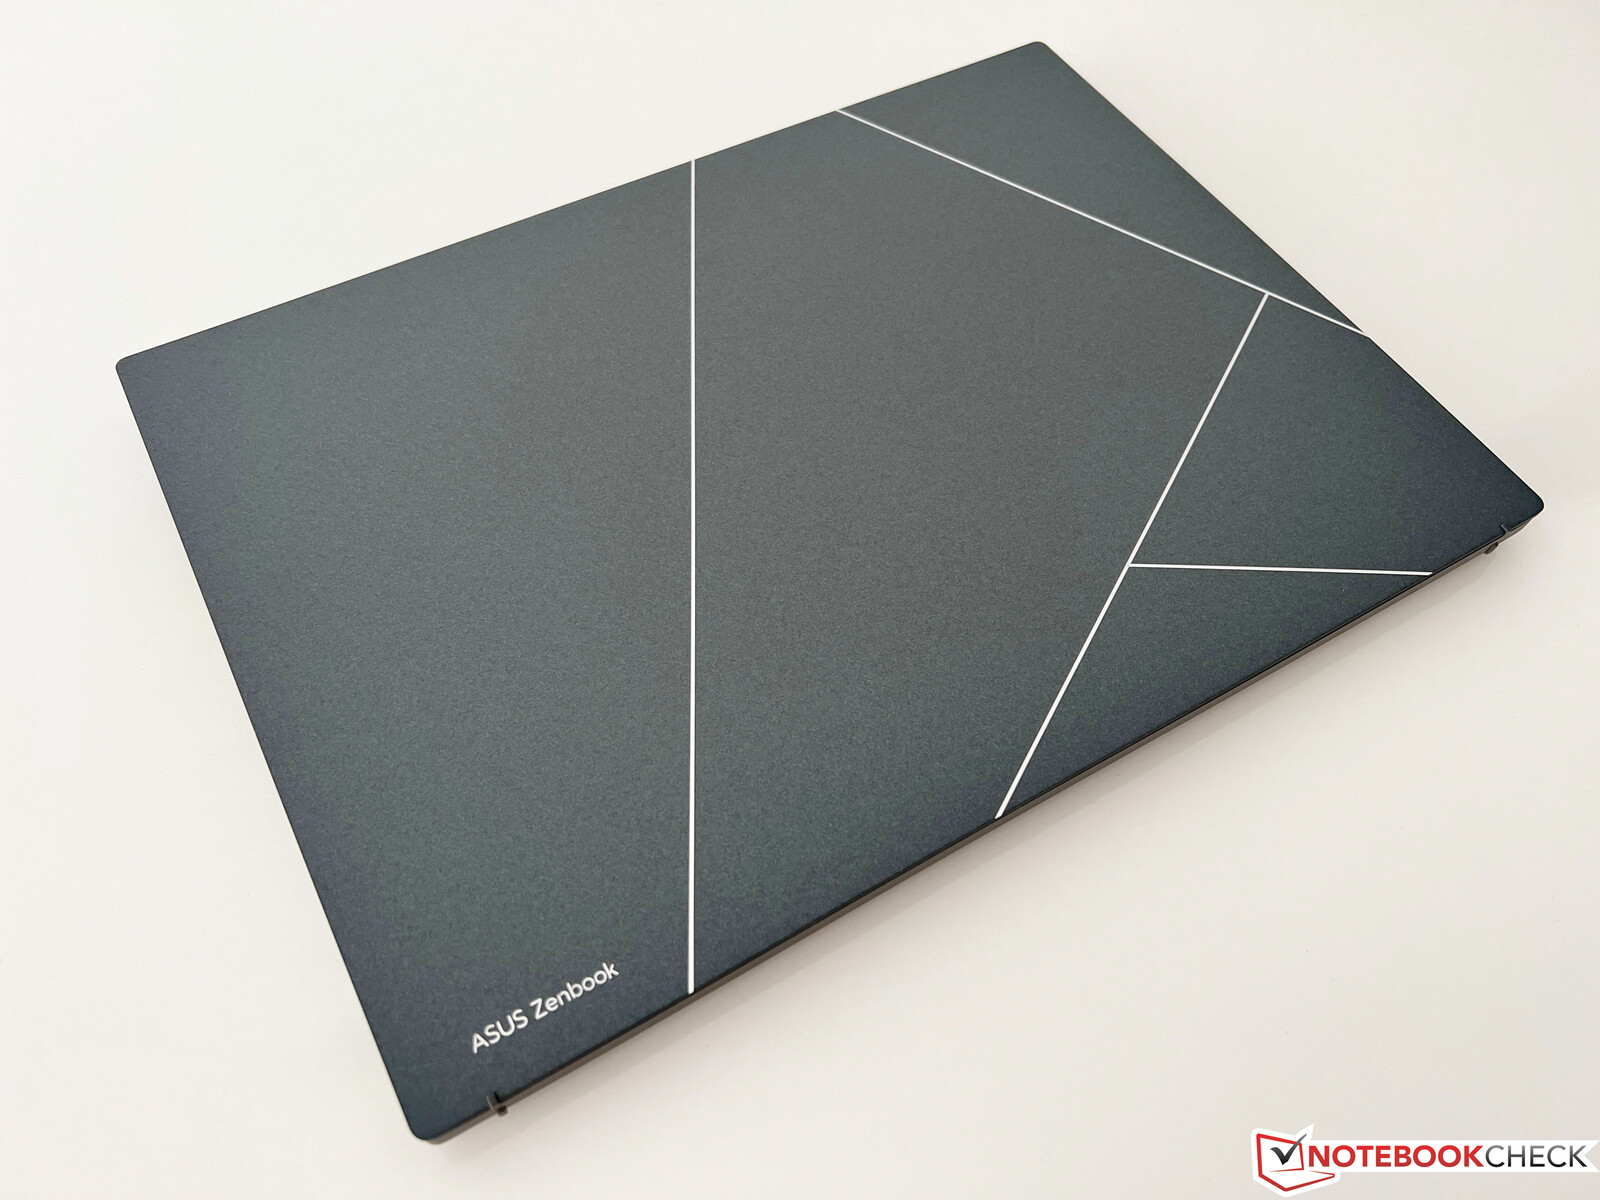
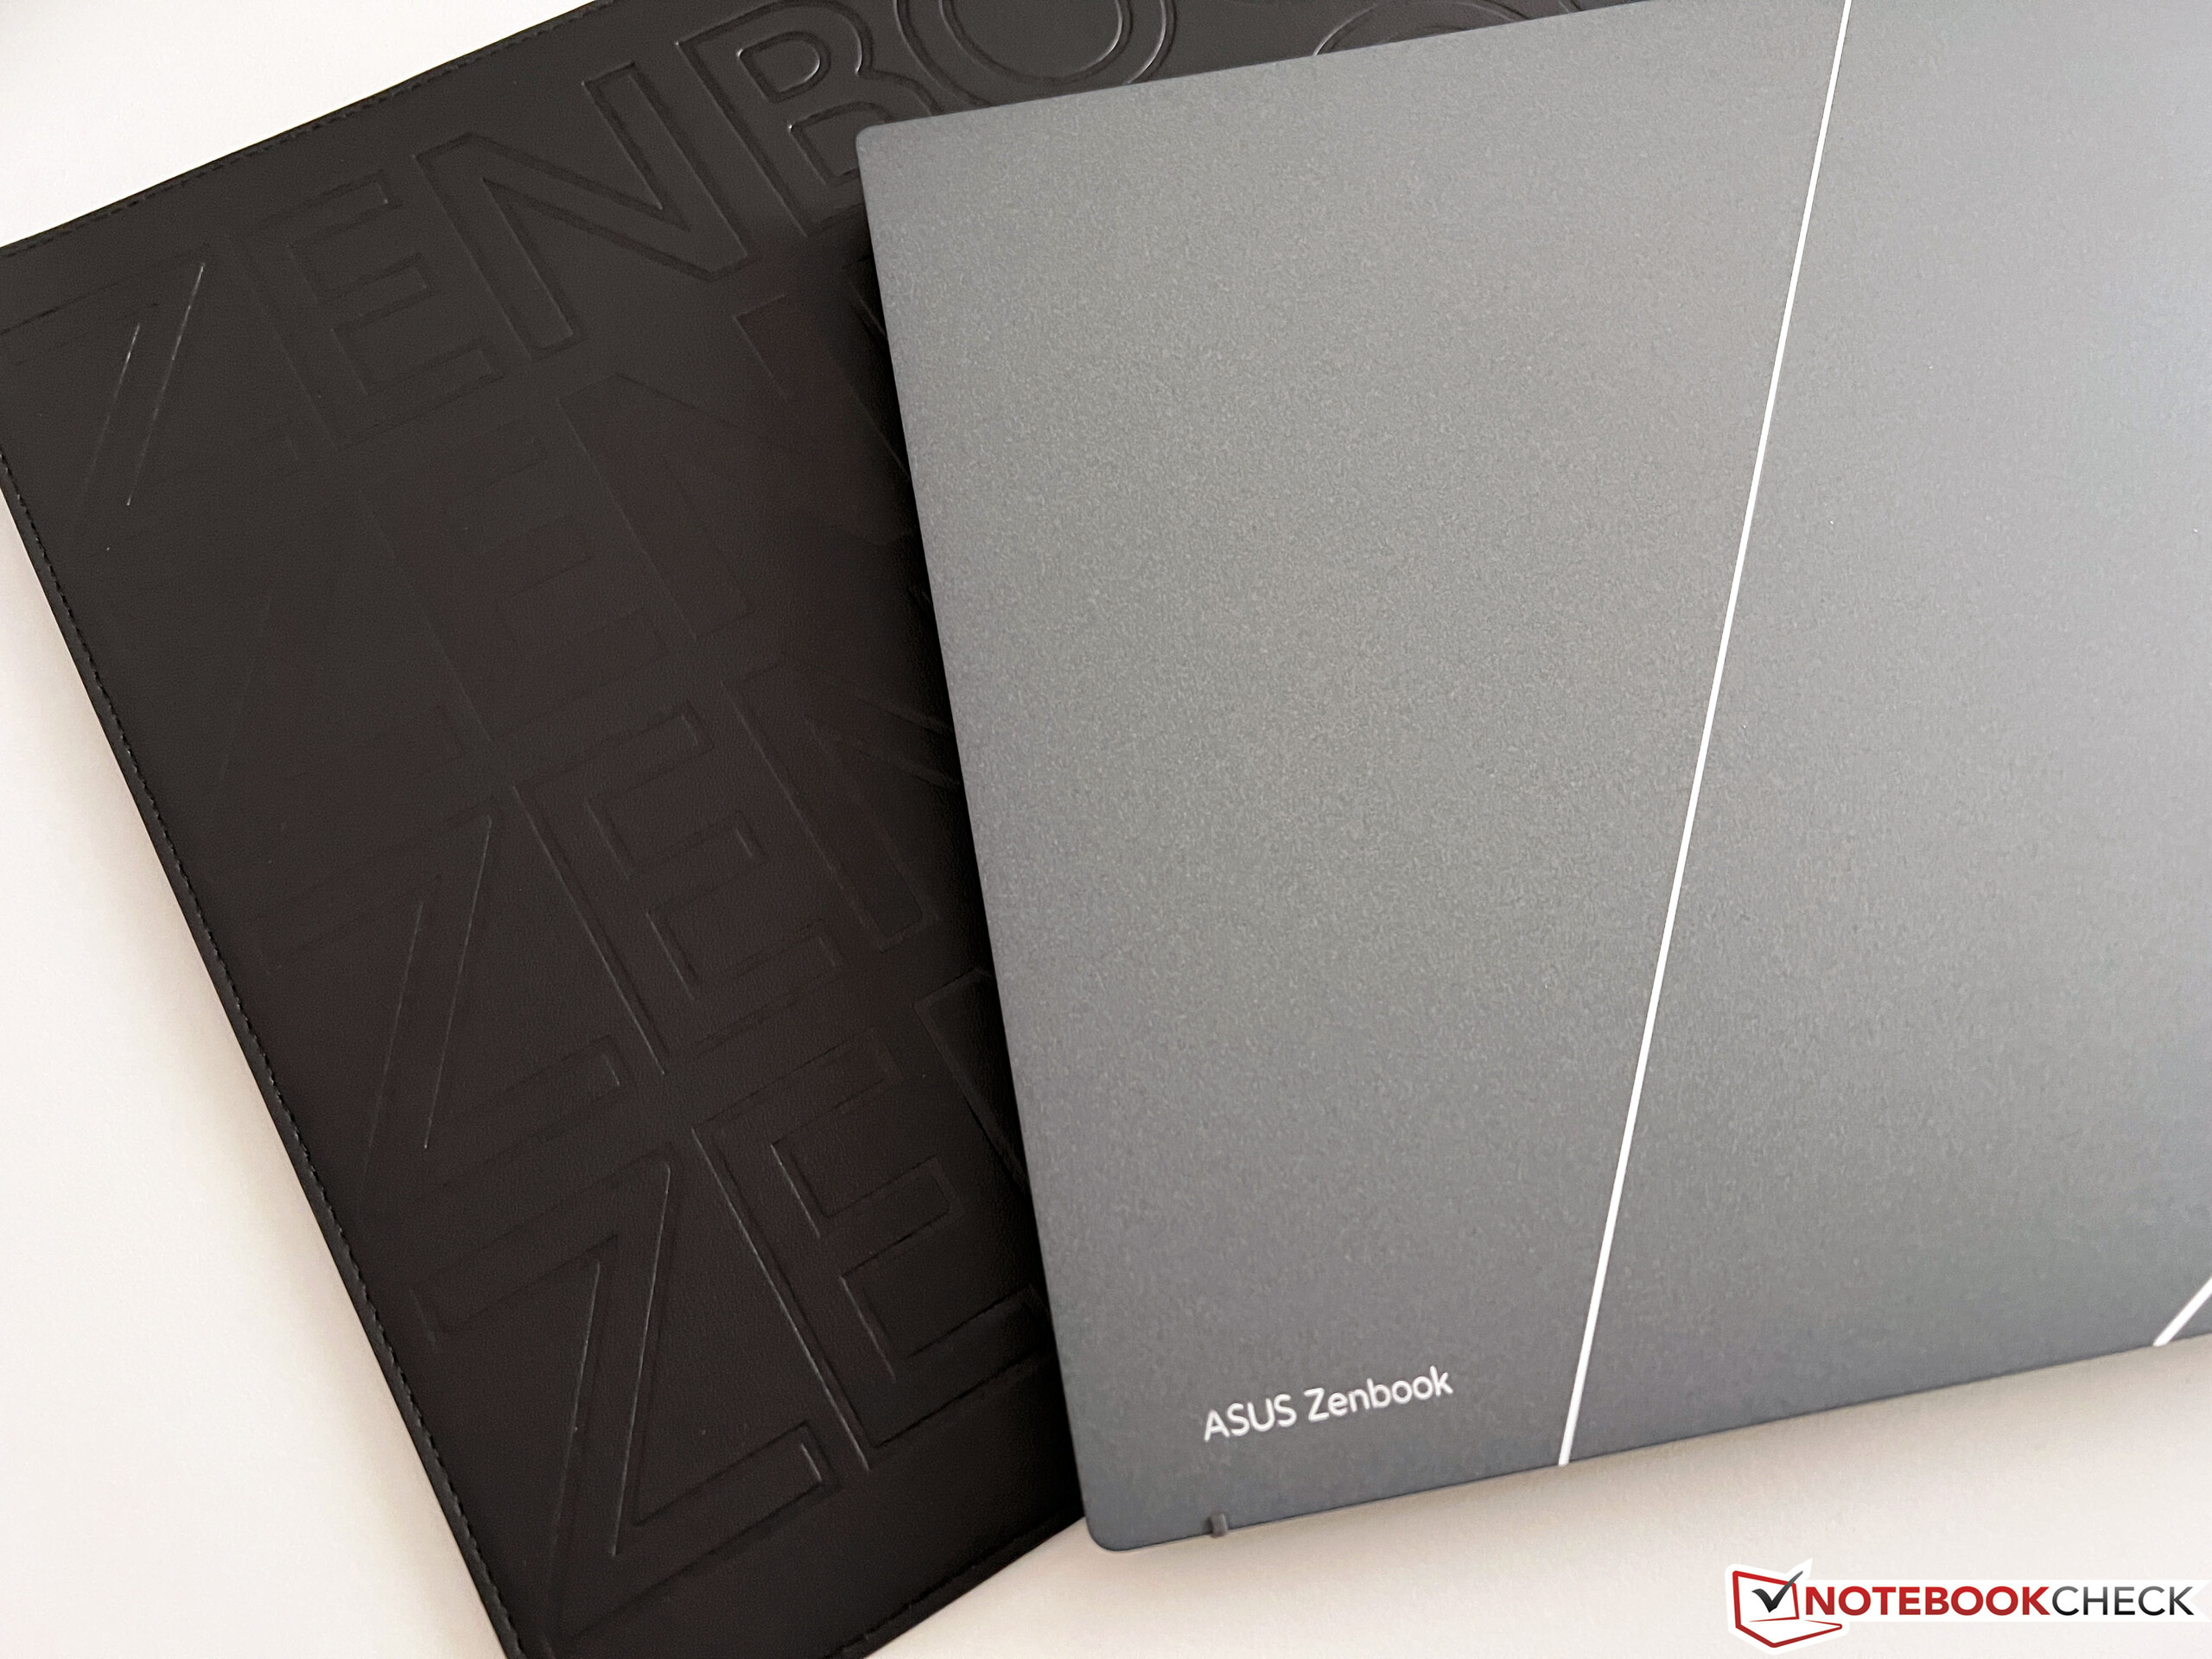
Oltre al nuovo design, è stato utilizzato un nuovo materiale per il coperchio. In pratica, la cassa è realizzata in alluminio, che è stato poi ricoperto da uno strato di rivestimento ceramico al plasma. Questa nuova tecnologia di superficie offre diversi vantaggi, come una maggiore resistenza all'usura e alla corrosione. Nell'uso quotidiano, la superficie leggermente ruvida ha anche il vantaggio di non lasciare impronte digitali. Dopo più di una settimana, non abbiamo avuto bisogno nemmeno di un panno per la pulizia. Secondo il produttore, il processo di produzione è anche più rispettoso dell'ambiente.
Anche la superficie dell'unità base è leggermente ruvida e le impronte digitali non sono un problema. La stabilità dell'intero portatile ci lascia un'ottima impressione e, nonostante la struttura sottile, né l'unità base né il coperchio possono essere deformati o piegati eccessivamente. Anche la cerniera è regolata bene, anche se questo non può evitare qualche leggera oscillazione dopo aver cambiato l'angolo di apertura. L'angolo di apertura massimo è di 180 gradi.
Il confronto delle dimensioni mostra che il nuovo Zenbook S 13 è diventato particolarmente sottile. È anche meno spesso rispetto ai concorrenti Windows, l'attuale MacBook Air M2 di Apple è addirittura minimamente più sottile. D'altra parte, la scheda tecnica è un po' ottimistica per quanto riguarda il peso, dato che la nostra unità di prova porta sulla bilancia 1.048 grammi (~3,263 lb), posizionandosi solo a metà del campo. Rispetto al predecessore, si tratta di un risparmio di peso di soli 47 grammi (~1,7 oz). Per quanto riguarda lo spessore, il risparmio è di almeno 3 mm (~0,12 in), decisamente notevole. Secondo Asus, si tratta del portatile OLED da 13,3 pollici più leggero, ma alcuni dei concorrenti con pannelli IPS sono ancora più leggeri. Ma nel complesso, la mobilità dello Zenbook S 13 è ovviamente eccellente. Il caricabatterie compatto aggiunge altri 228 grammi (~8 oz) al peso.
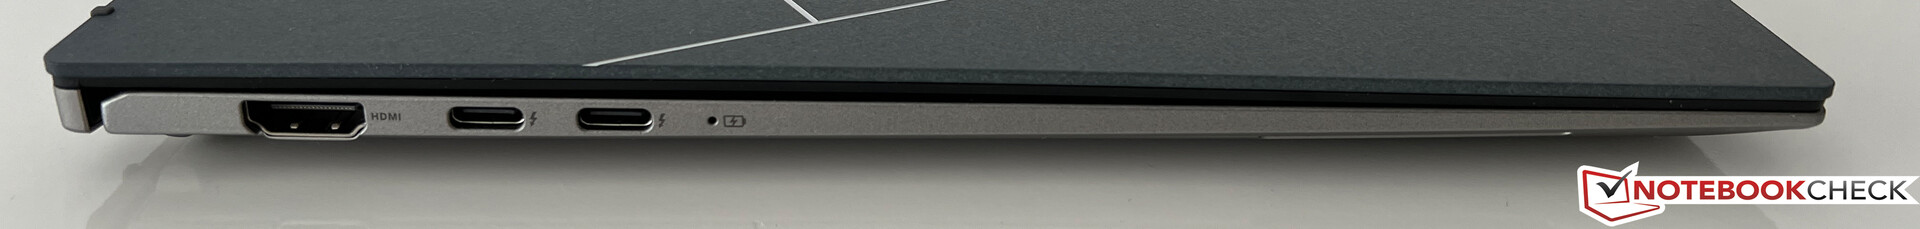
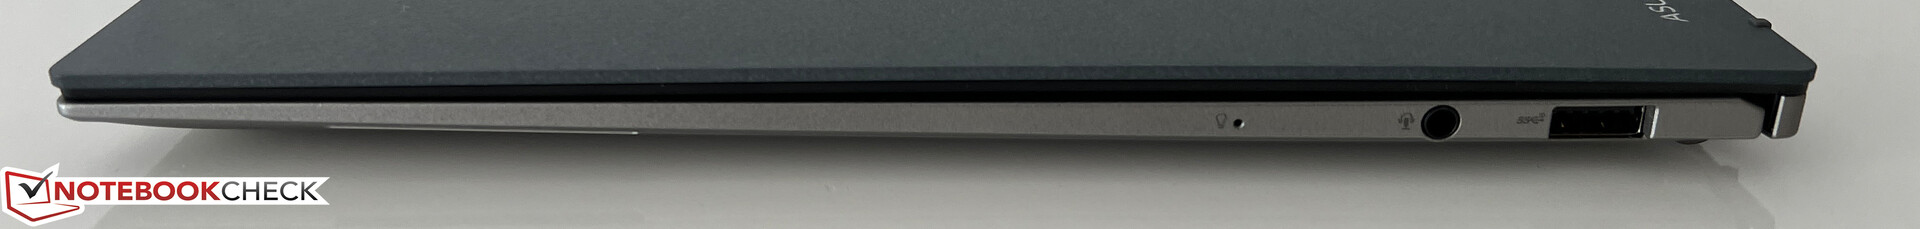
Apparecchiatura - Zenbook con Thunderbolt 4
Dopo lo Zenbook S 13 dello scorso annoutilizzava esclusivamente tre porte USB-C, Asus offre ora due porte USB-C, aggiungendo anche una porta USB-A (nonostante il case sottile) e una porta HDMI full-size. Questo è semplicemente molto più pratico nell'utilizzo quotidiano e, trattandosi di un portatile Intel, le due porte USB-C supportano ovviamente anche Thunderbolt 4.
Comunicazione
Asus utilizza il moderno modulo WLAN AZ211 di Intel, che supporta già il più recente standard WLAN Wi-Fi 6E e il Bluetooth 5.2. Tuttavia, nel nostro test non siamo riusciti a connetterci alla corrispondente rete a 6-GHz del nostro router di riferimento Asus e abbiamo quindi utilizzato la rete a 5-GHz. Le velocità di trasferimento sono complessivamente molto elevate e in gran parte stabili. Inoltre, non abbiamo riscontrato alcun problema di connessione nella pratica.
| Networking | |
| Asus ZenBook S13 OLED UX5304 | |
| iperf3 transmit AXE11000 | |
| iperf3 receive AXE11000 | |
| Asus Zenbook S 13 OLED | |
| iperf3 transmit AXE11000 | |
| iperf3 receive AXE11000 | |
| Apple MacBook Air M2 Entry | |
| iperf3 transmit AXE11000 | |
| iperf3 receive AXE11000 | |
| Lenovo Yoga Slim 7 Carbon 13IAP7-82U9005FGE | |
| iperf3 transmit AXE11000 6GHz | |
| iperf3 receive AXE11000 6GHz | |
| Samsung Galaxy Book2 Pro 13 NP930XED-KA1DE | |
| iperf3 transmit AXE11000 6GHz | |
| iperf3 receive AXE11000 6GHz | |
Webcam
Asus ha aggiornato la webcam e ora utilizza una webcam Full-HD insieme a un sensore IR per il riconoscimento del volto in combinazione con Windows Hello. La qualità è leggermente migliore di quella dello scorso anno e decente in buone condizioni di luce.


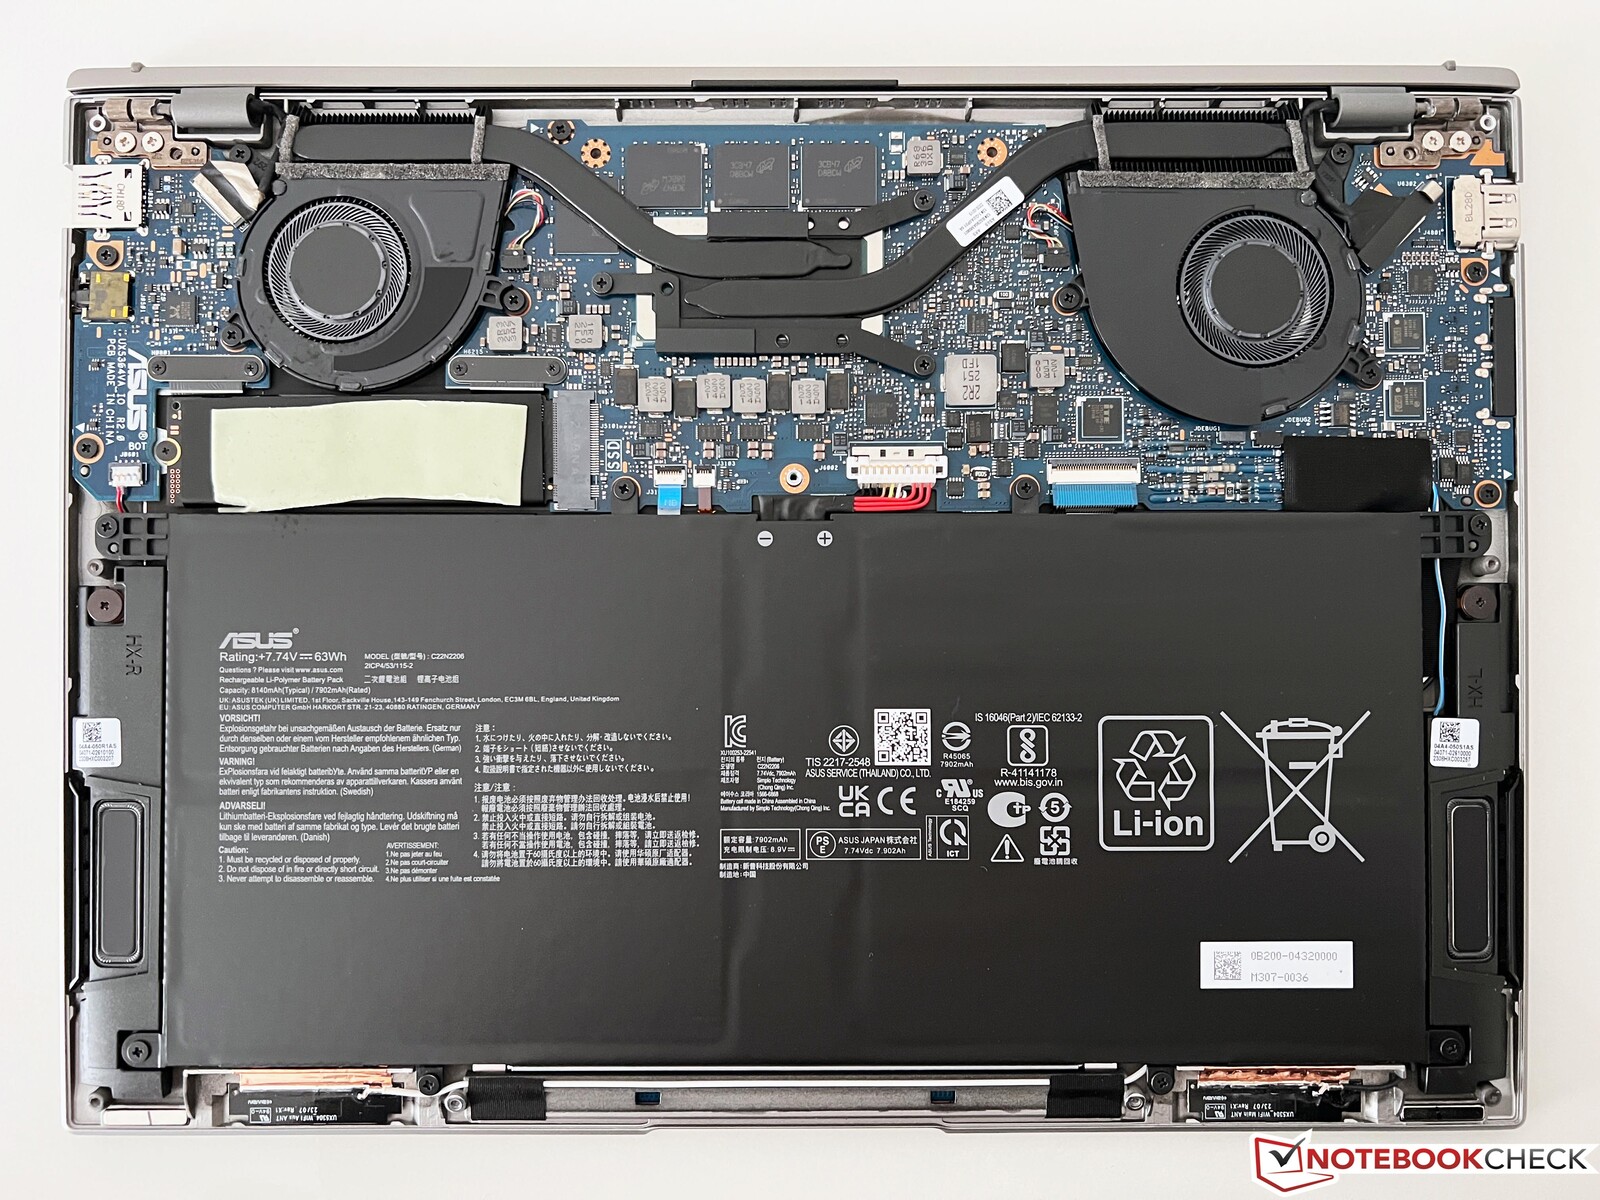
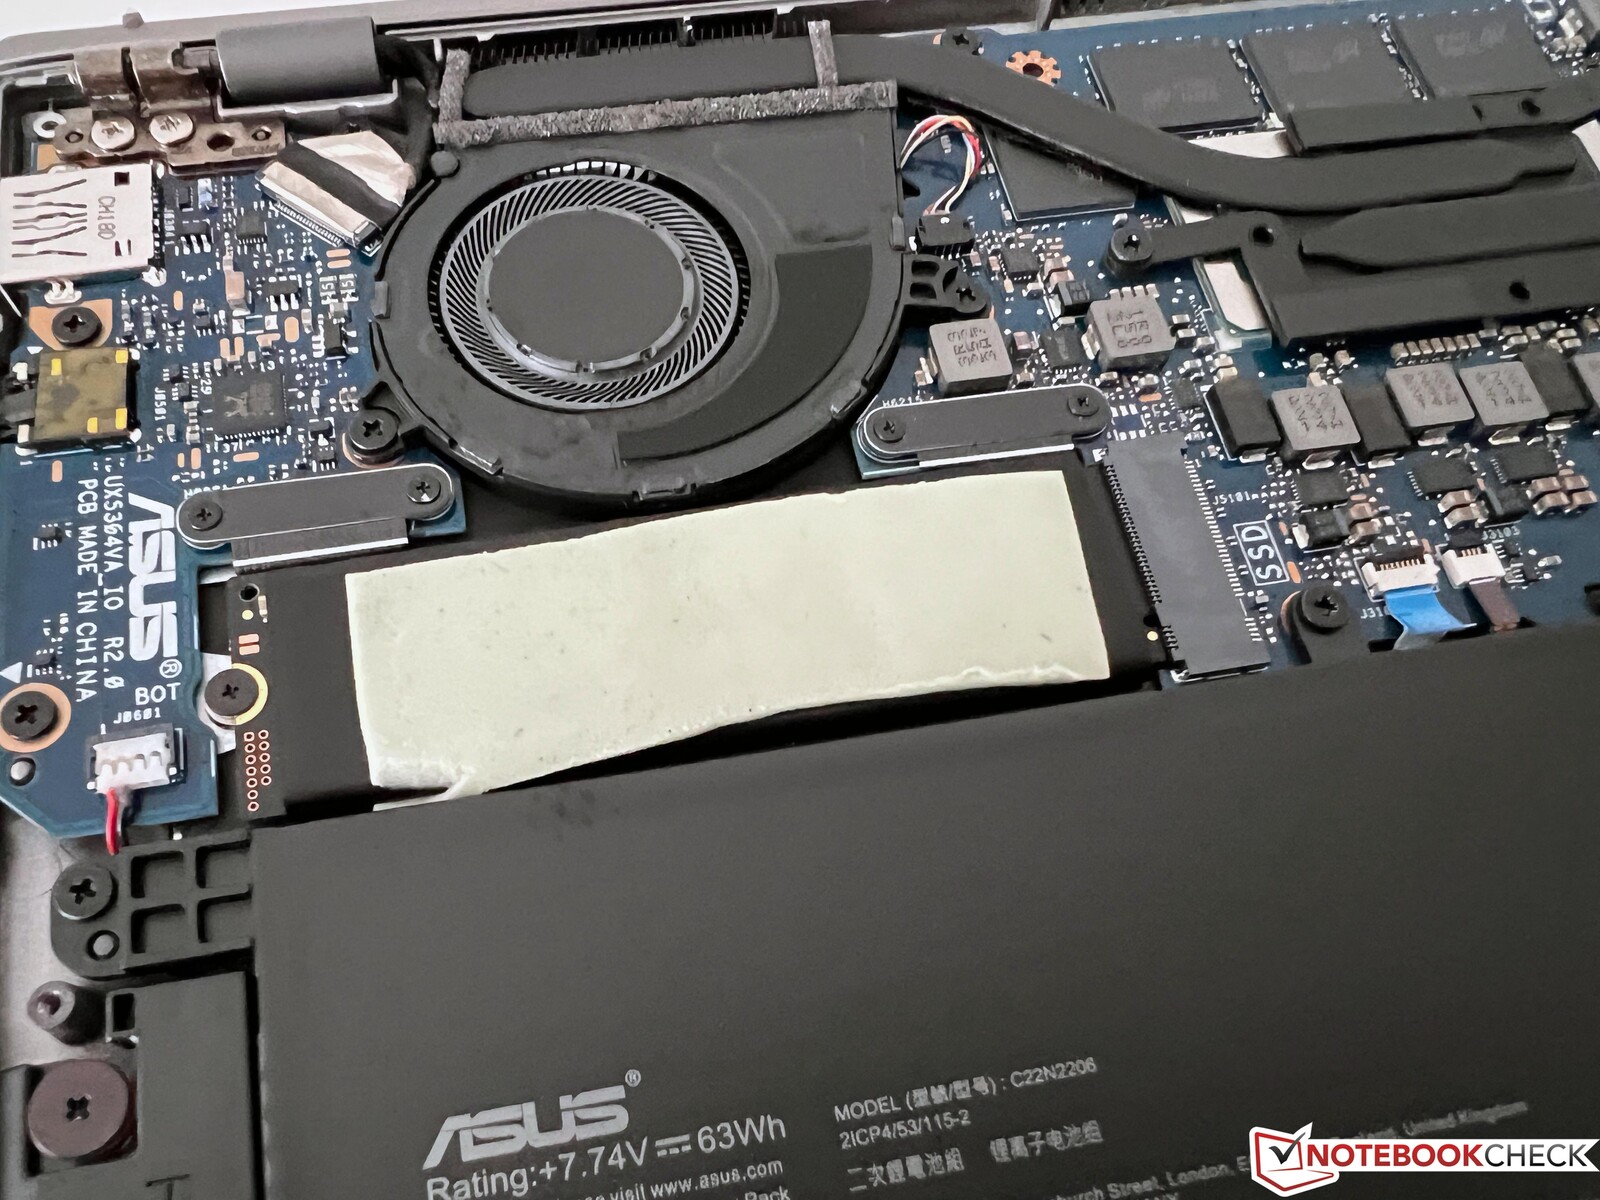
Manutenzione
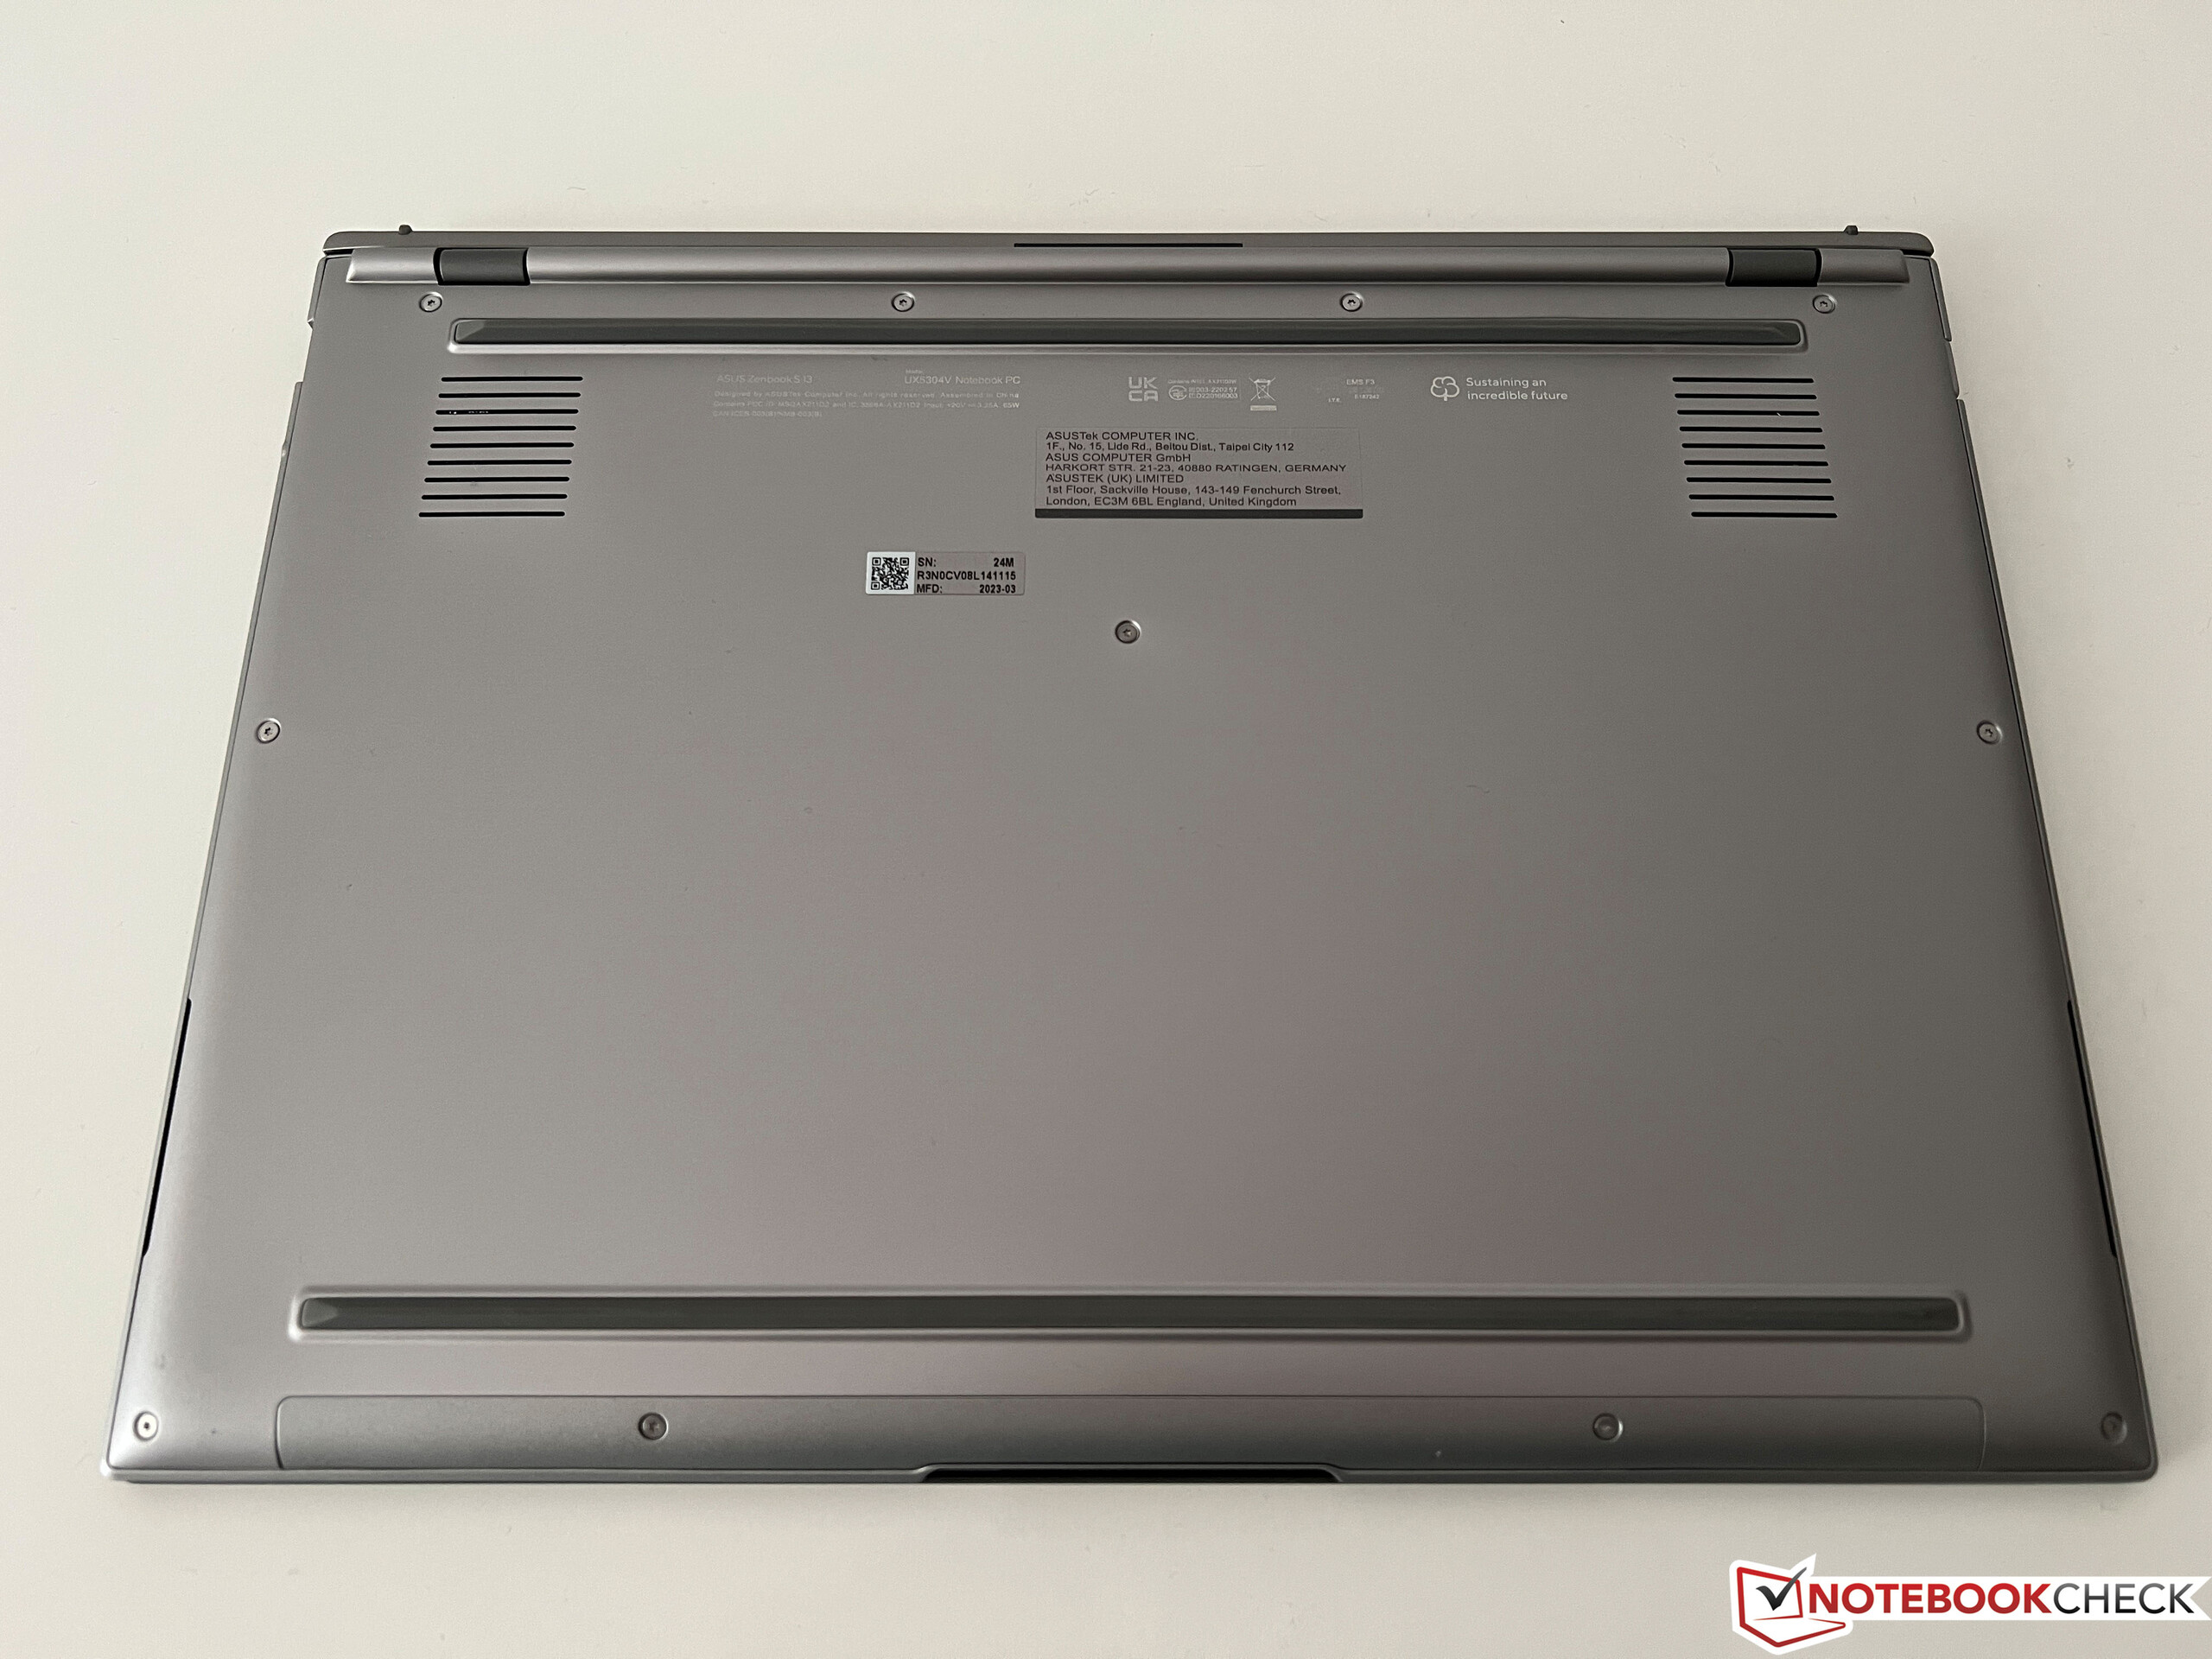
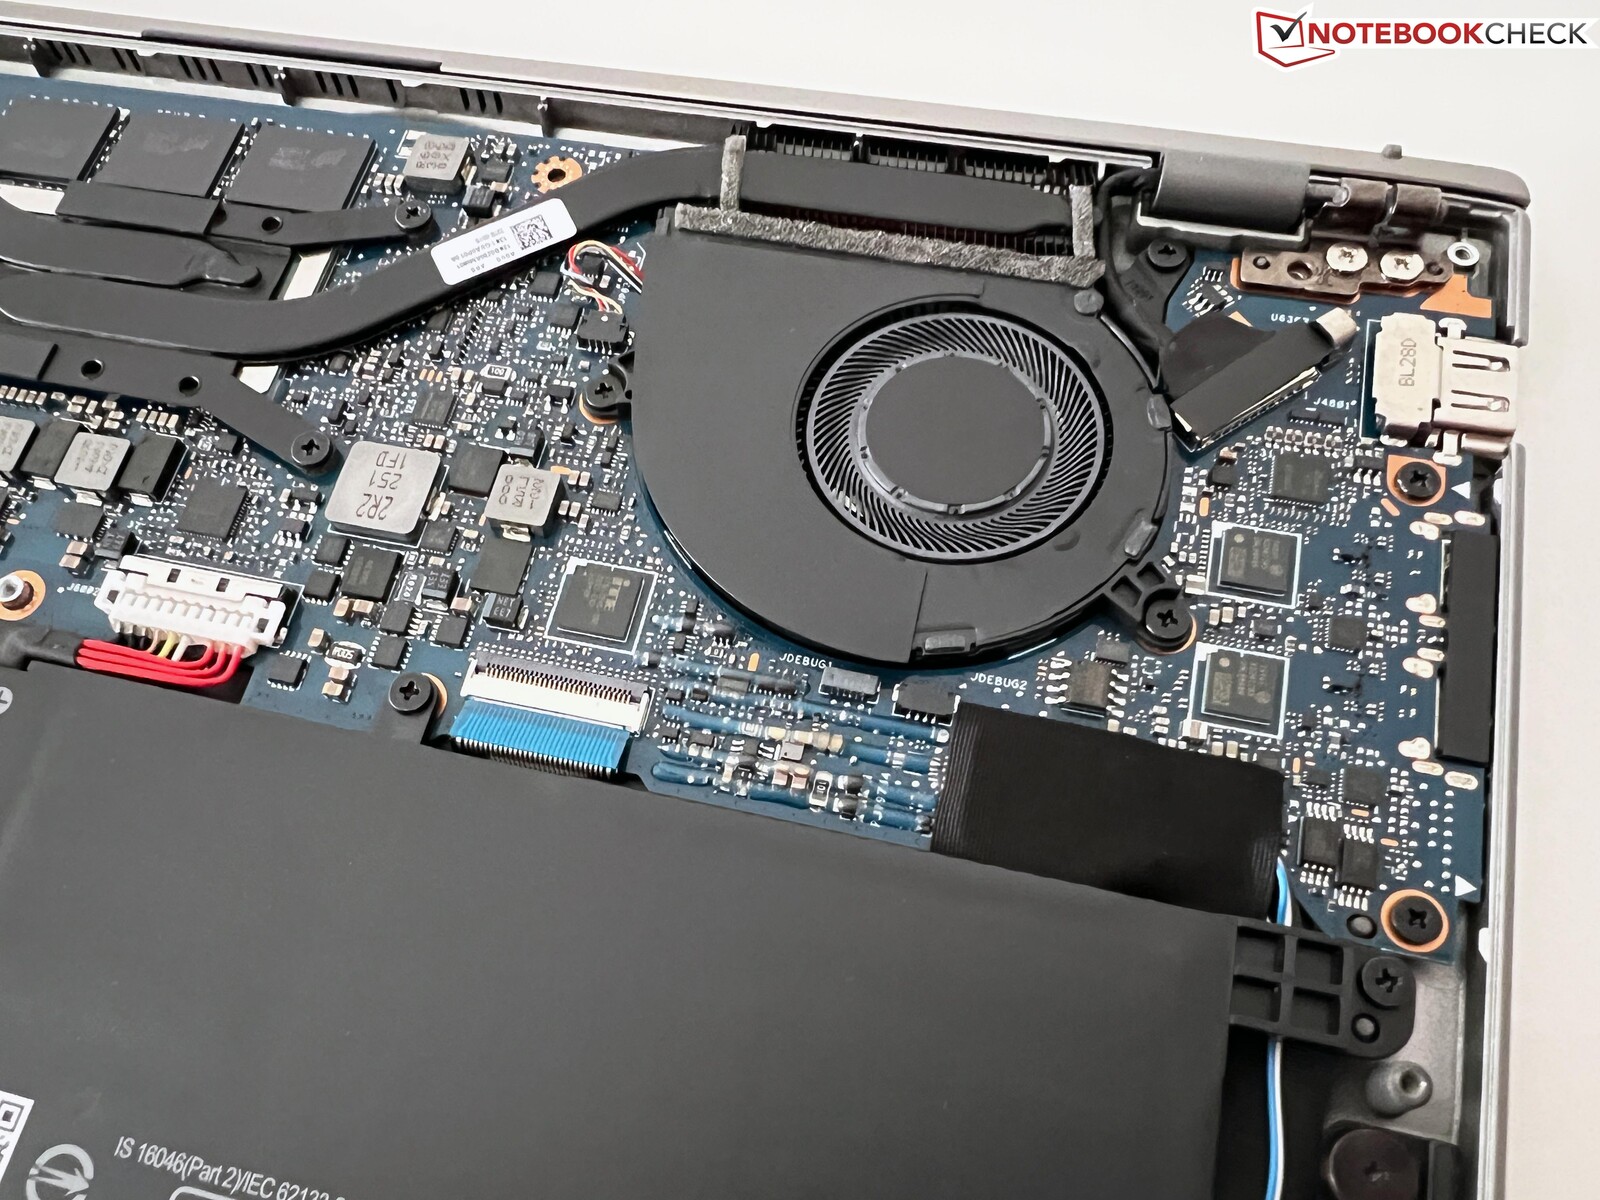
Il coperchio inferiore è fissato con viti Torx (T5) e può essere rimosso facilmente. La struttura interna è dominata dalla grande batteria e si possono vedere anche le due ventole che possono essere pulite. Mentre l'unità SSD M.2 2280 può essere sostituita, tutti gli altri componenti sono saldati.
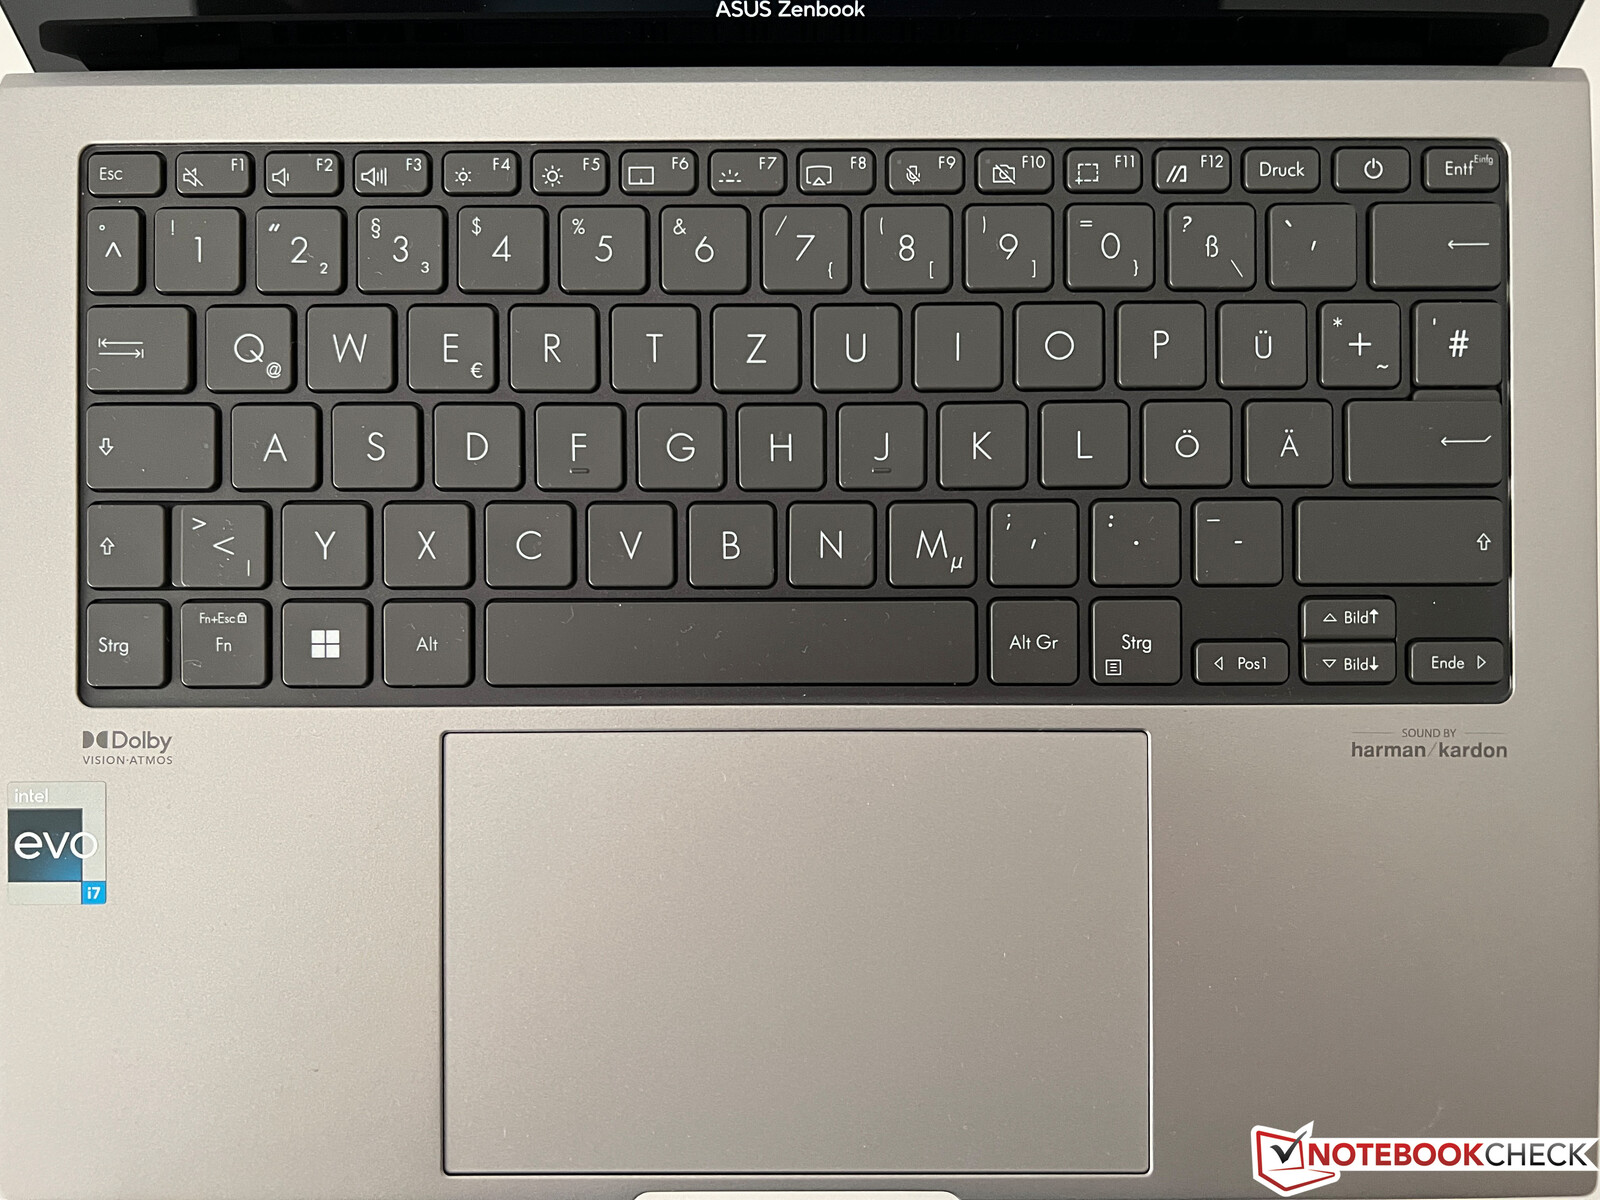
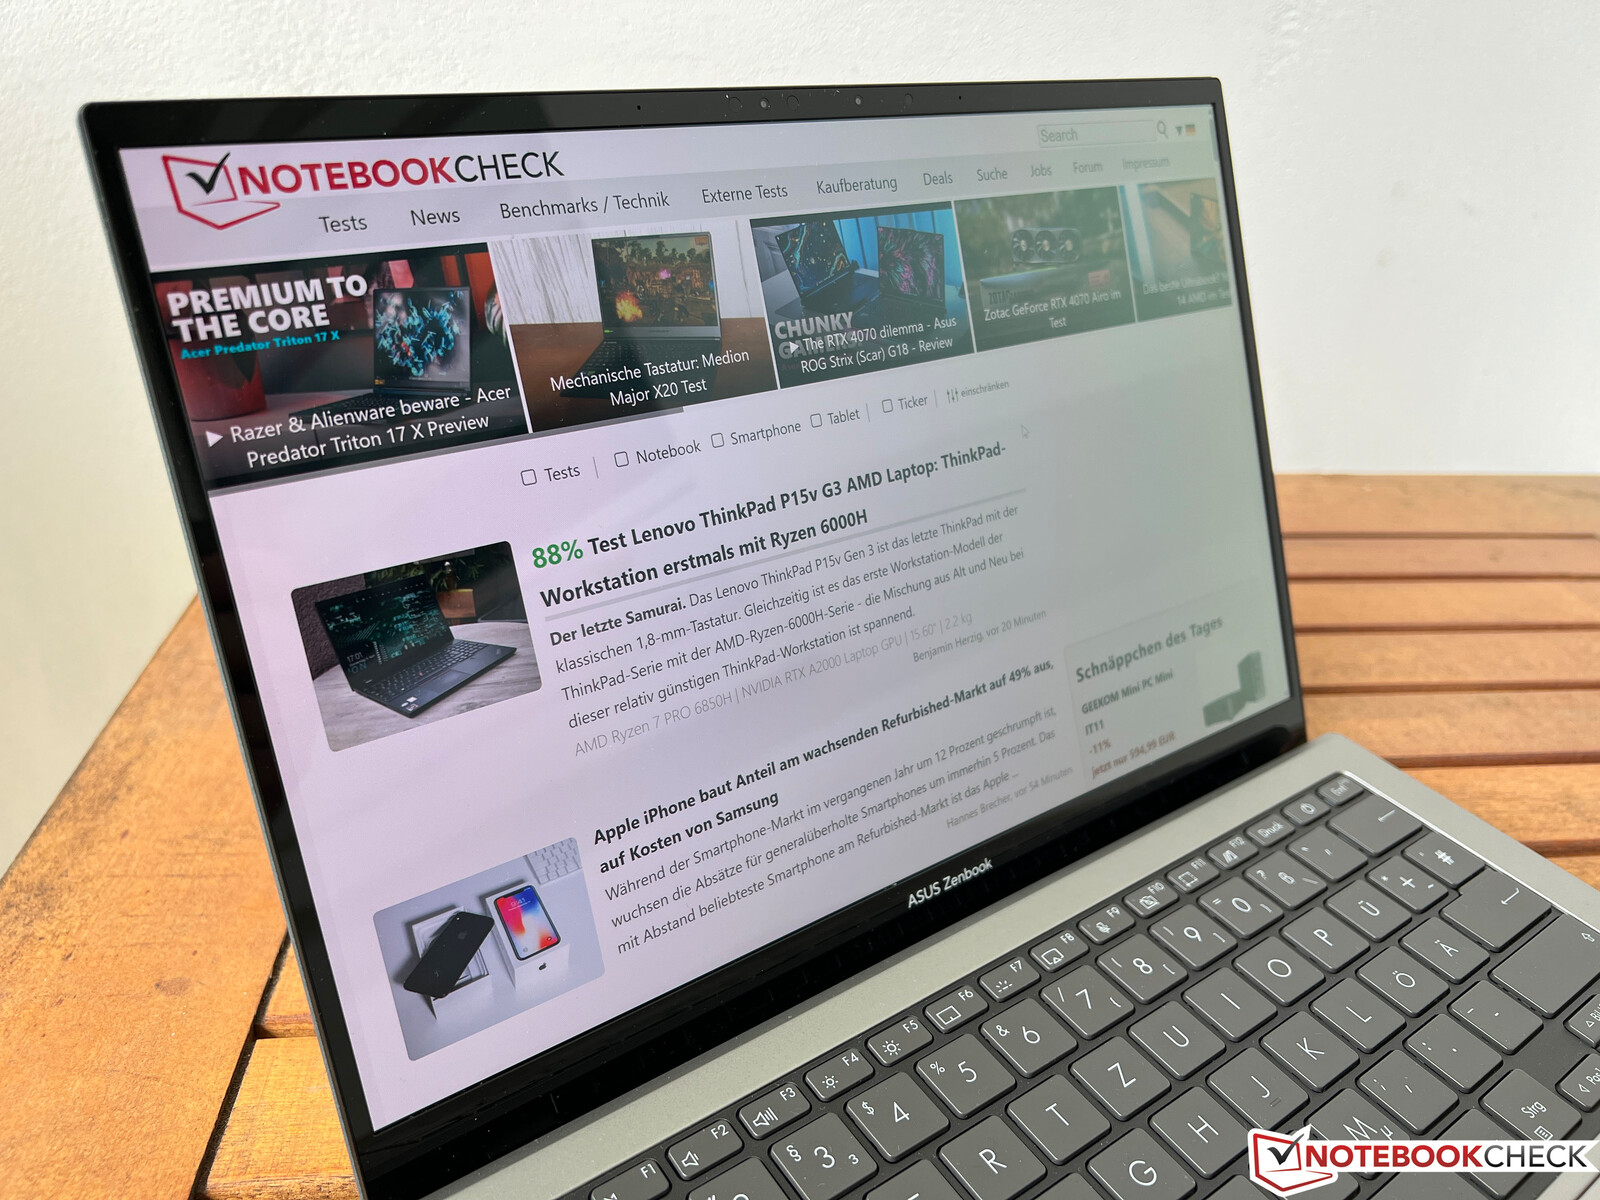
Dispositivo di input - Zenbook ora con una digitazione più breve
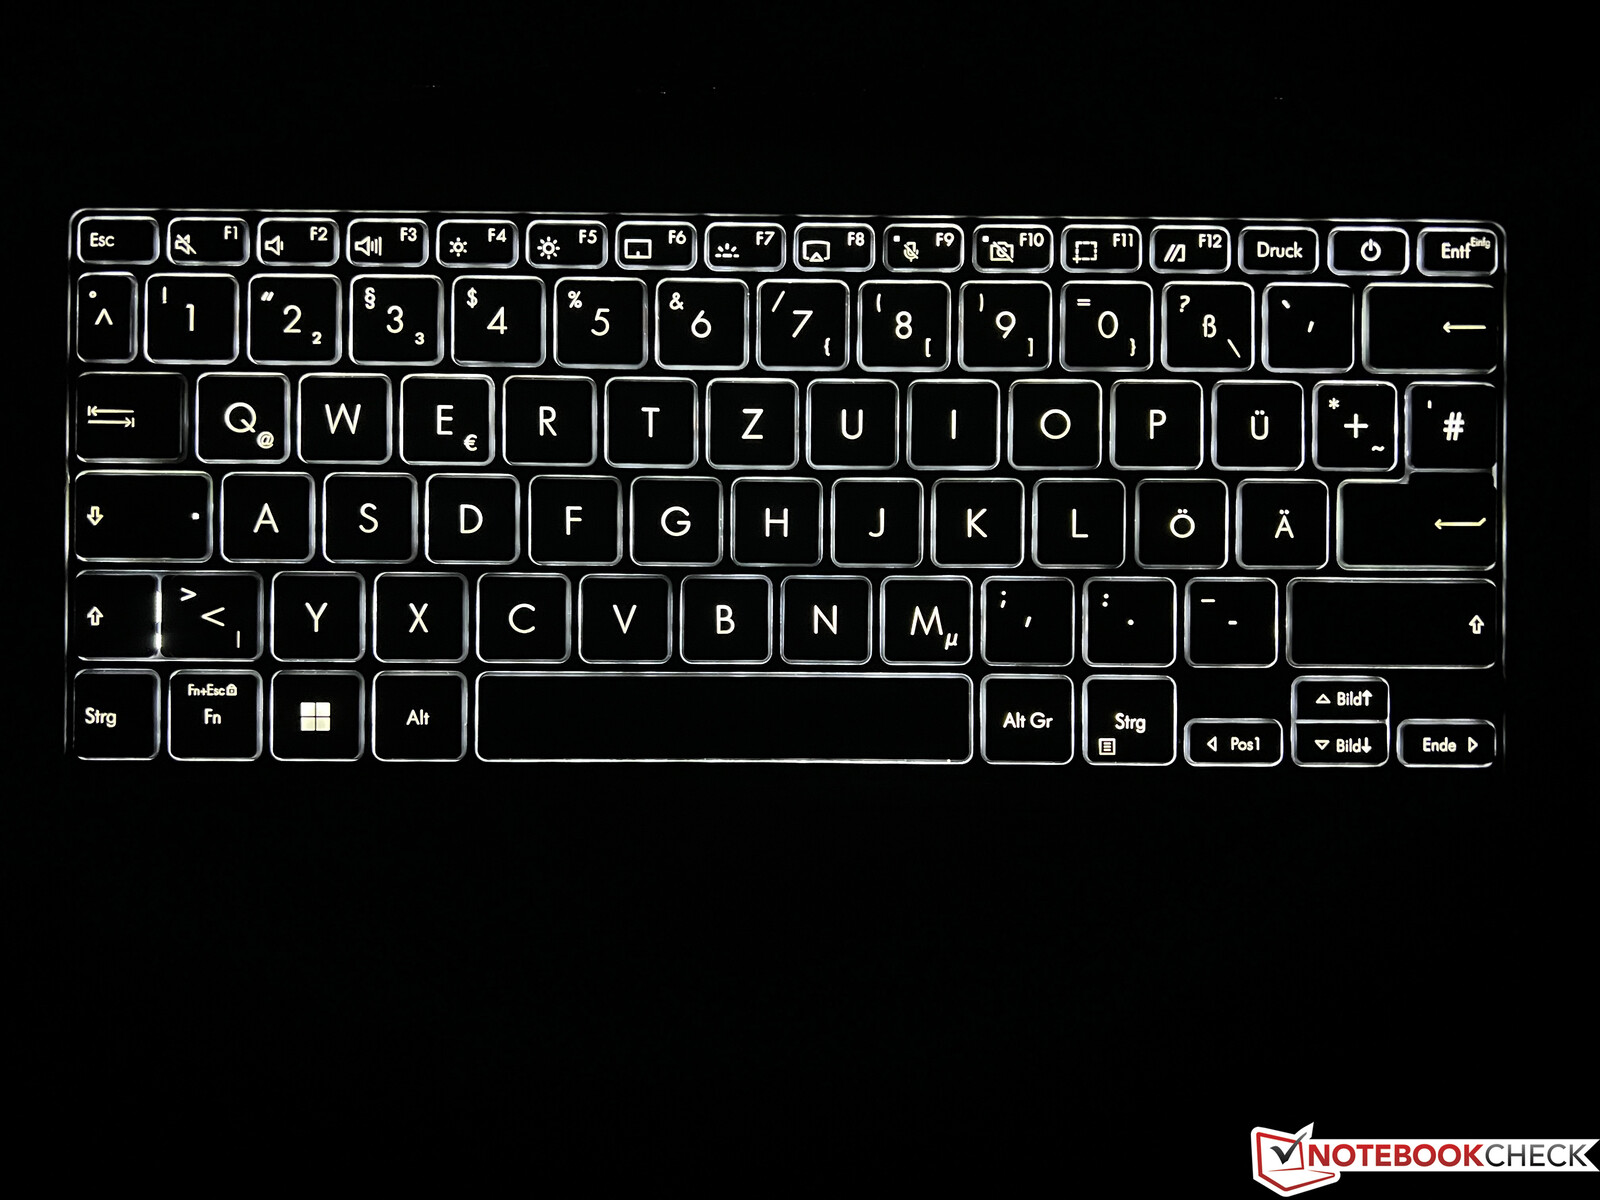
Per un case più sottile, la corsa dei tasti di solito deve essere ridotta, ed è proprio questo il caso dello Zenbook S 13. Mentre era ancora di 1,4 mm (~0,055 in) nel predecessore, ora è solo di 1,1 mm (~0,043), il che si nota. Il feedback continua a essere molto nitido e la tastiera non è affatto male, ma l'esperienza di digitazione è semplicemente più confortevole rispetto al predecessore. Il sensore di impronte digitali nel pulsante di accensione è stato rimosso senza alcuna sostituzione. L'illuminazione bianca a tre livelli della tastiera non può essere attivata automaticamente tramite il sensore di luminosità.
L'ampio ClickPad (13 x 8,1 cm, ~5,1 x 3,2 pollici) offre spazio sufficiente per i movimenti del cursore e i gesti fino a quattro dita. Le caratteristiche di scorrimento sono molto buone e il normale controllo del cursore funziona senza problemi. L'area inferiore del ClickPad può essere premuta, il che è accompagnato da un forte rumore di clic. Nel modello precedente, il touchpad poteva essere utilizzato anche come blocco numerico, ma questa funzione è stata rimossa dalla versione attuale.
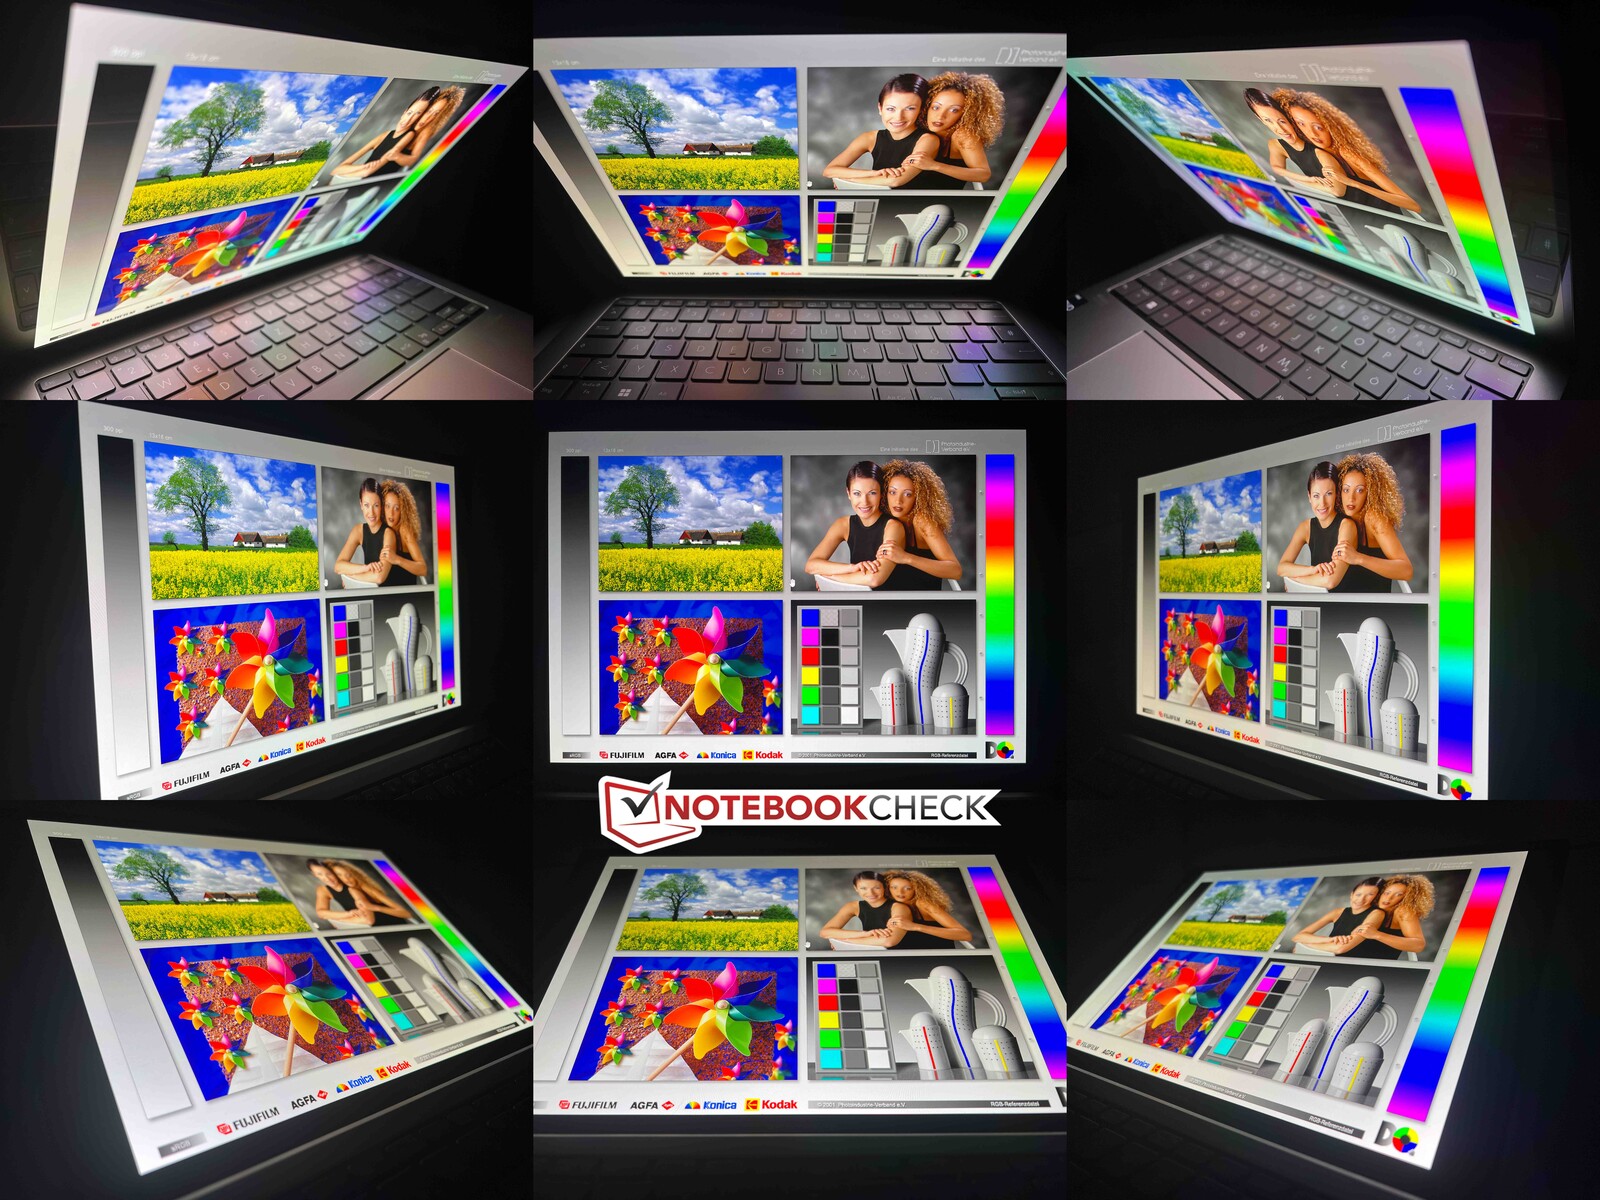
Display - OLED con oscuramento CC
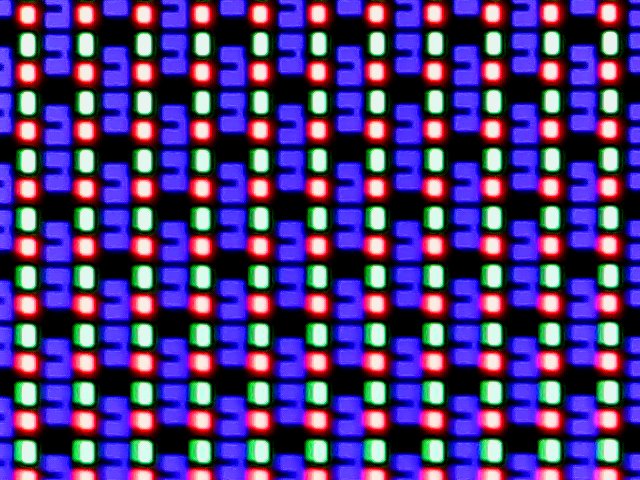
Asus mantiene le specifiche del display dello Zenbook S 13 senza alcuna modifica, poiché continua a utilizzare un touchscreen OLED da 13,3 pollici con una frequenza di aggiornamento di 60 Hz. La risoluzione è di 2.880 x 1.800 pixel e la qualità dell'immagine soggettiva continua a essere eccellente. Inoltre, non c'è l'effetto glitter (effetto Moiré) come nei pannelli OLED 2,8K di alcuni modelli Lenovo. L'ID del pannello è nuovo e, secondo Asus, si tratta di un pannello leggermente più sottile.
Per quanto riguarda la luminosità, continuiamo a dover distinguere tra i normali contenuti SDR e HDR. Nel funzionamento SDR, la luminosità massima è di ~360 cd/m² con l'eccellente distribuzione della luminosità tipica degli OLED. Allo stesso tempo, il valore del nero è pari a 0, con un rapporto di contrasto estremamente elevato. Nel funzionamento HDR, misuriamo un massimo di 589 cd/m², leggermente superiore alle specifiche di 550 cd/m². Dall'anno scorso non è cambiato nulla nella pessima implementazione dell'HDR di Windows. L'HDR deve essere attivato manualmente e non sarà più disponibile alcun profilo colore. Nei display OLED non c'è screen bleeding e un'immagine nera è semplicemente completamente nera.
| |||||||||||||||||||||||||
Distribuzione della luminosità: 98 %
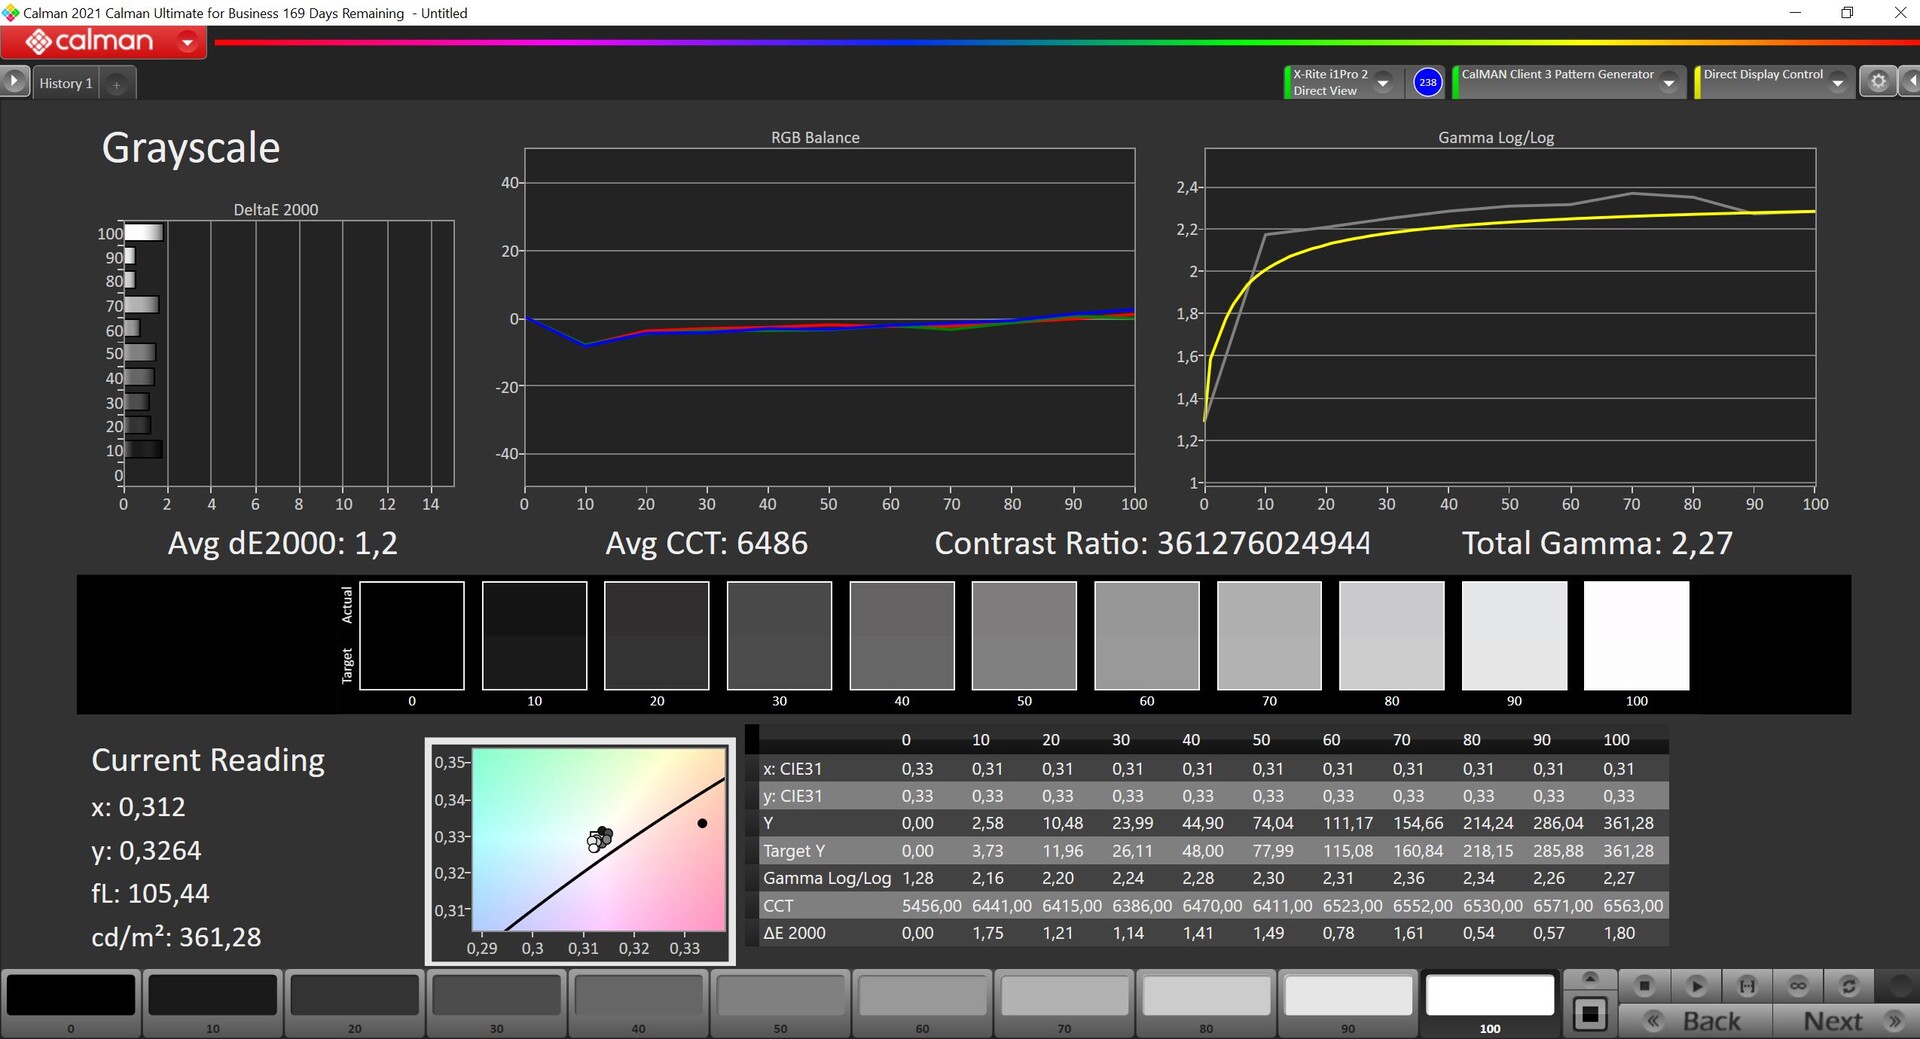
Al centro con la batteria: 361 cd/m²
Contrasto: ∞:1 (Nero: 0 cd/m²)
ΔE ColorChecker Calman: 1.2 | ∀{0.5-29.43 Ø4.72}
ΔE Greyscale Calman: 1.2 | ∀{0.09-98 Ø4.97}
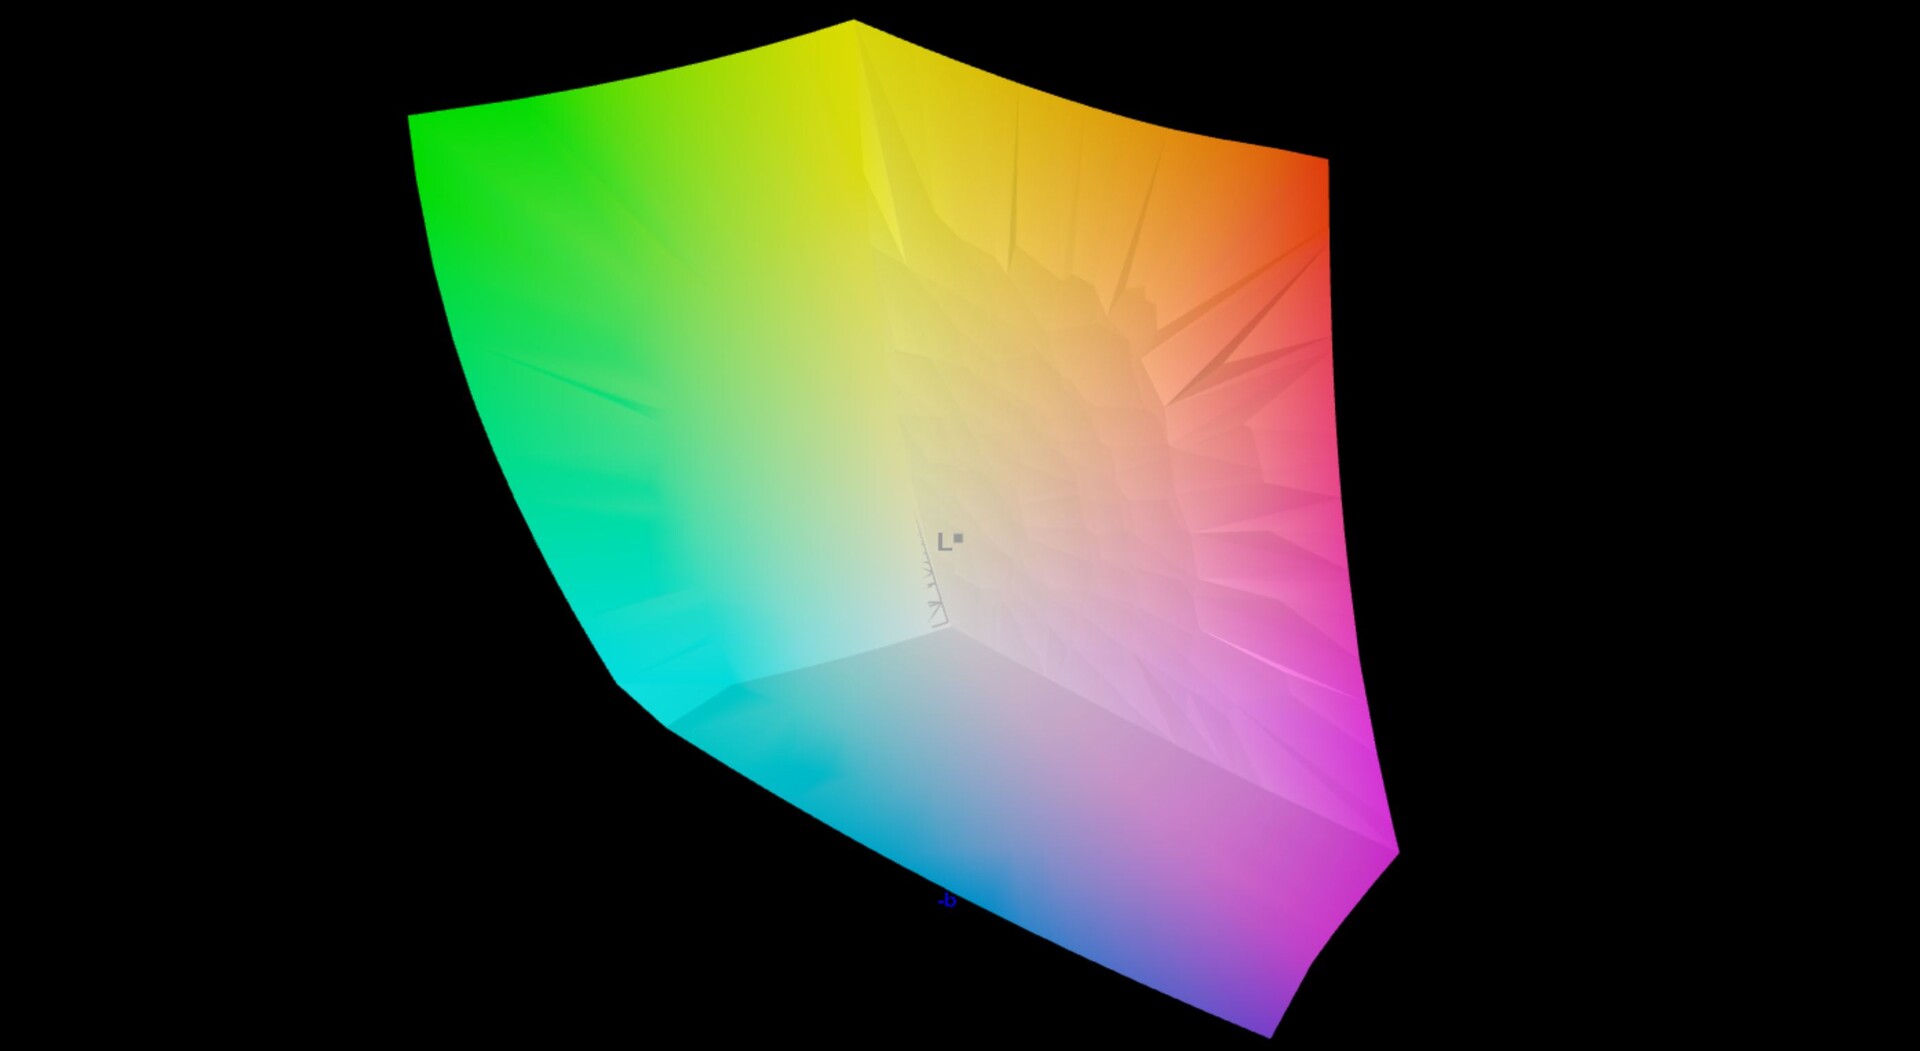
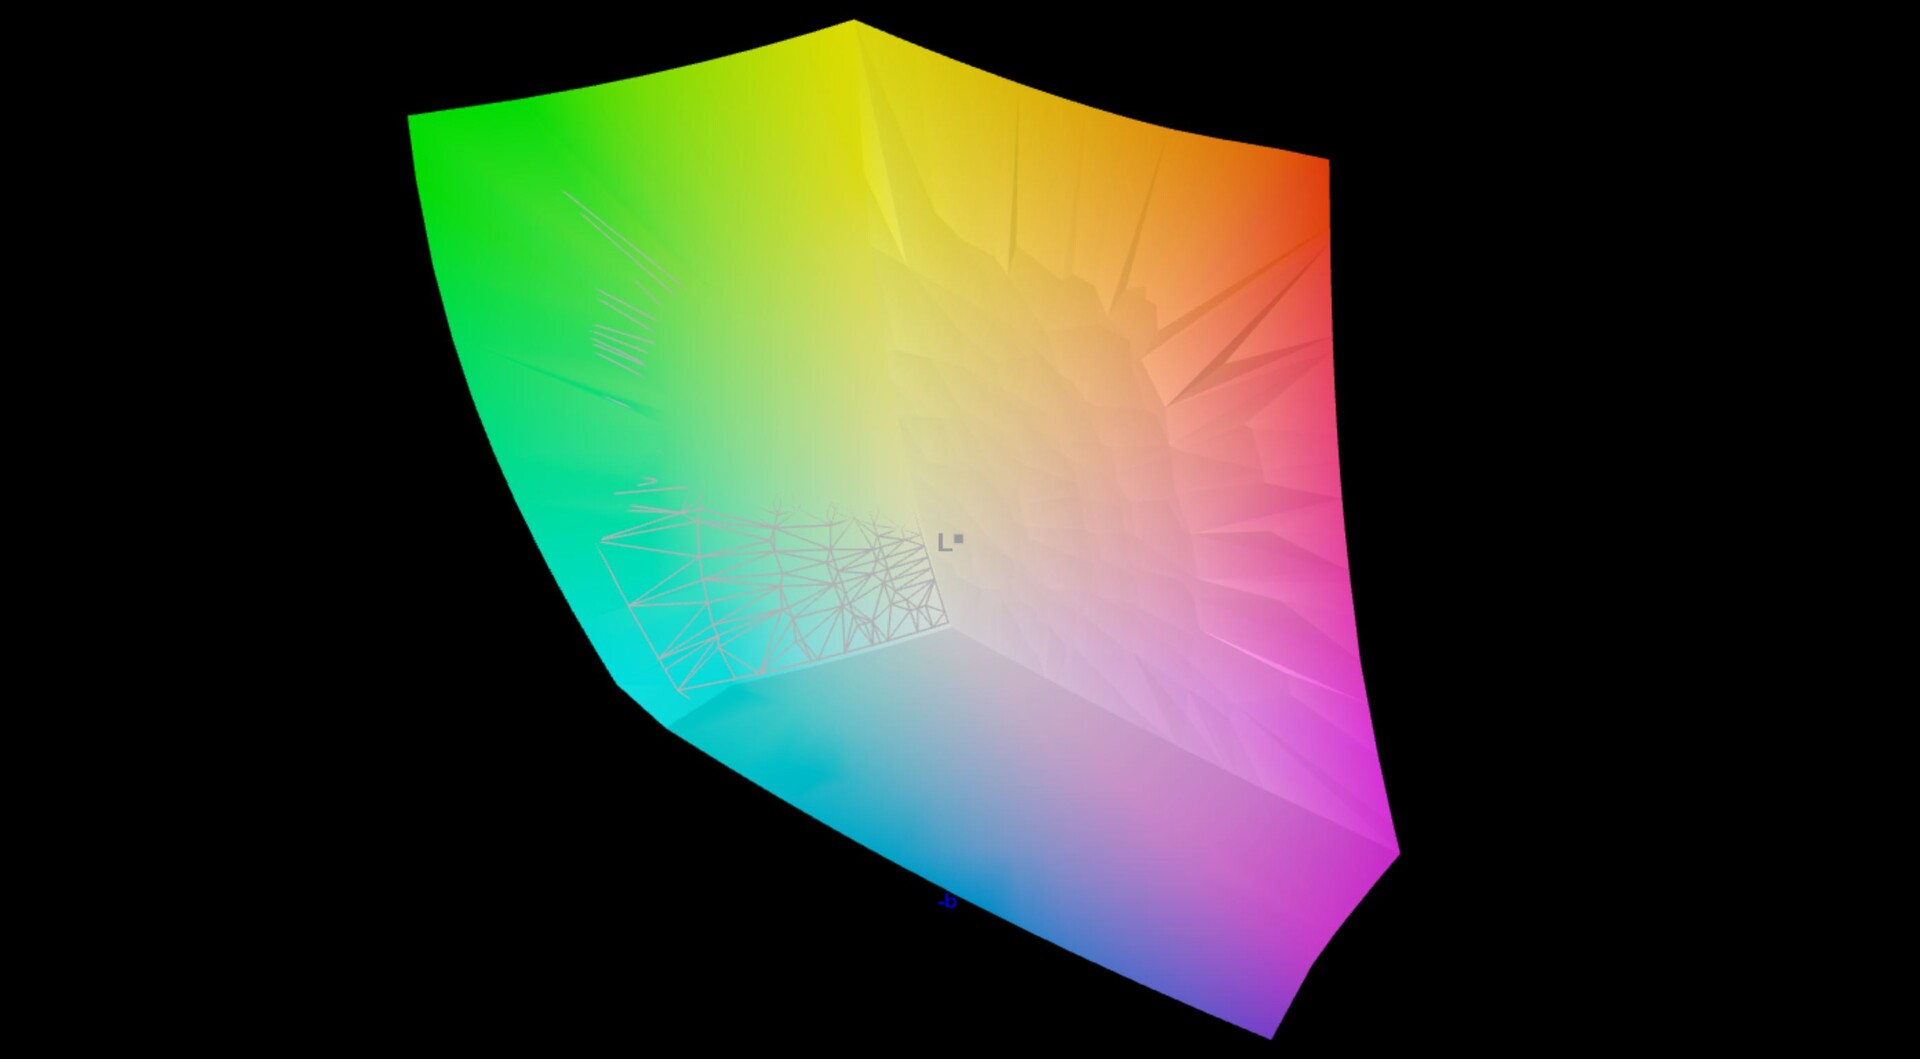
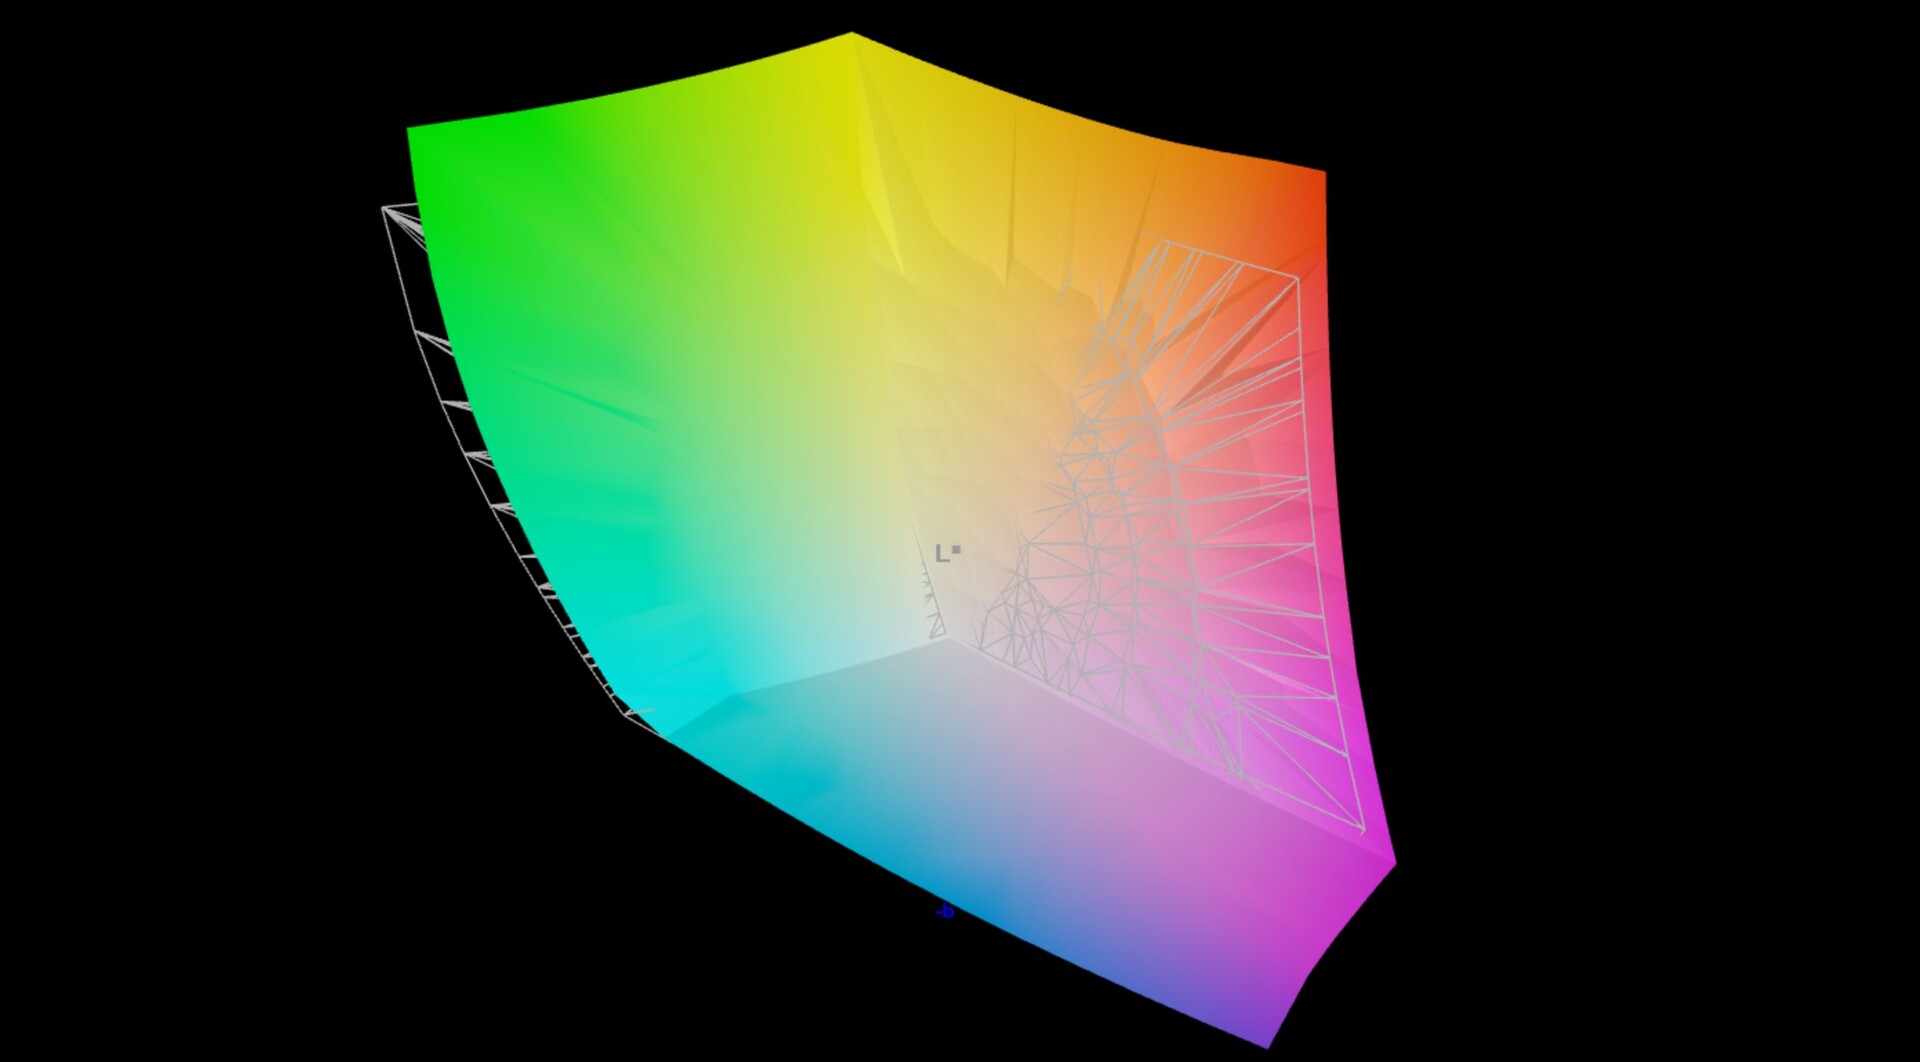
96.9% AdobeRGB 1998 (Argyll 3D)
100% sRGB (Argyll 3D)
99.7% Display P3 (Argyll 3D)
Gamma: 2.27
CCT: 6486 K
| Asus ZenBook S13 OLED UX5304 SDC417B, OLED, 2880x1800, 13.3" | Asus Zenbook S 13 OLED SDC4172, OLED, 2880x1800, 13.3" | Apple MacBook Air M2 Entry IPS, 2560x1664, 13.6" | Lenovo Yoga Slim 7 Carbon 13IAP7-82U9005FGE MND307DA1-9, IPS, 2560x1600, 13.3" | Dell XPS 13 Plus 9320 i7-1280P OLED Samsung 134XK04, OLED, 3456x2160, 13.4" | Samsung Galaxy Book2 Pro 13 NP930XED-KA1DE ATNA33XC10-0, OLED, 1920x1080, 13.3" | |
|---|---|---|---|---|---|---|
| Display | 0% | -4% | -21% | 1% | -0% | |
| Display P3 Coverage (%) | 99.7 | 99.8 0% | 98.4 -1% | 67.3 -32% | 99.5 0% | 99.81 0% |
| sRGB Coverage (%) | 100 | 100 0% | 99.9 0% | 98.9 -1% | 100 0% | 100 0% |
| AdobeRGB 1998 Coverage (%) | 96.9 | 97.8 1% | 87.6 -10% | 69.1 -29% | 98.4 2% | 95.55 -1% |
| Response Times | -5% | -1501% | -1310% | -31% | -63% | |
| Response Time Grey 50% / Grey 80% * (ms) | 2 ? | 2.1 ? -5% | 32.9 ? -1545% | 34 ? -1600% | 2.6 ? -30% | 4 ? -100% |
| Response Time Black / White * (ms) | 1.6 ? | 1.68 ? -5% | 24.9 ? -1456% | 17.9 ? -1019% | 2.1 ? -31% | 2 ? -25% |
| PWM Frequency (Hz) | 240 ? | 240.4 ? | 59.5 | 61 ? | ||
| Screen | -23% | -8% | -9% | -64% | -22% | |
| Brightness middle (cd/m²) | 361 | 336 -7% | 526 46% | 391 8% | 371.8 3% | 399 11% |
| Brightness (cd/m²) | 365 | 338 -7% | 486 33% | 362 -1% | 374 2% | 403 10% |
| Brightness Distribution (%) | 98 | 99 1% | 87 -11% | 87 -11% | 98 0% | 98 0% |
| Black Level * (cd/m²) | 0.02 | 0.38 | 0.26 | 0.07 | ||
| Colorchecker dE 2000 * | 1.2 | 1.8 -50% | 1.3 -8% | 1 17% | 2.37 -98% | 1.35 -13% |
| Colorchecker dE 2000 max. * | 1.9 | 3.8 -100% | 2.7 -42% | 2.4 -26% | 6.1 -221% | 2.77 -46% |
| Greyscale dE 2000 * | 1.2 | 0.9 25% | 2 -67% | 1.7 -42% | 2 -67% | 2.35 -96% |
| Gamma | 2.27 97% | 2.22 99% | 2.25 98% | 2.22 99% | 2.29 96% | 2.21 100% |
| CCT | 6486 100% | 6580 99% | 6858 95% | 6808 95% | 6261 104% | 6824 95% |
| Contrast (:1) | 16800 | 1384 | 1504 | 5700 | ||
| Colorchecker dE 2000 calibrated * | 1.8 | 0.7 | 1.35 | |||
| Media totale (Programma / Settaggio) | -9% /
-13% | -504% /
-278% | -447% /
-249% | -31% /
-40% | -28% /
-24% |
* ... Meglio usare valori piccoli

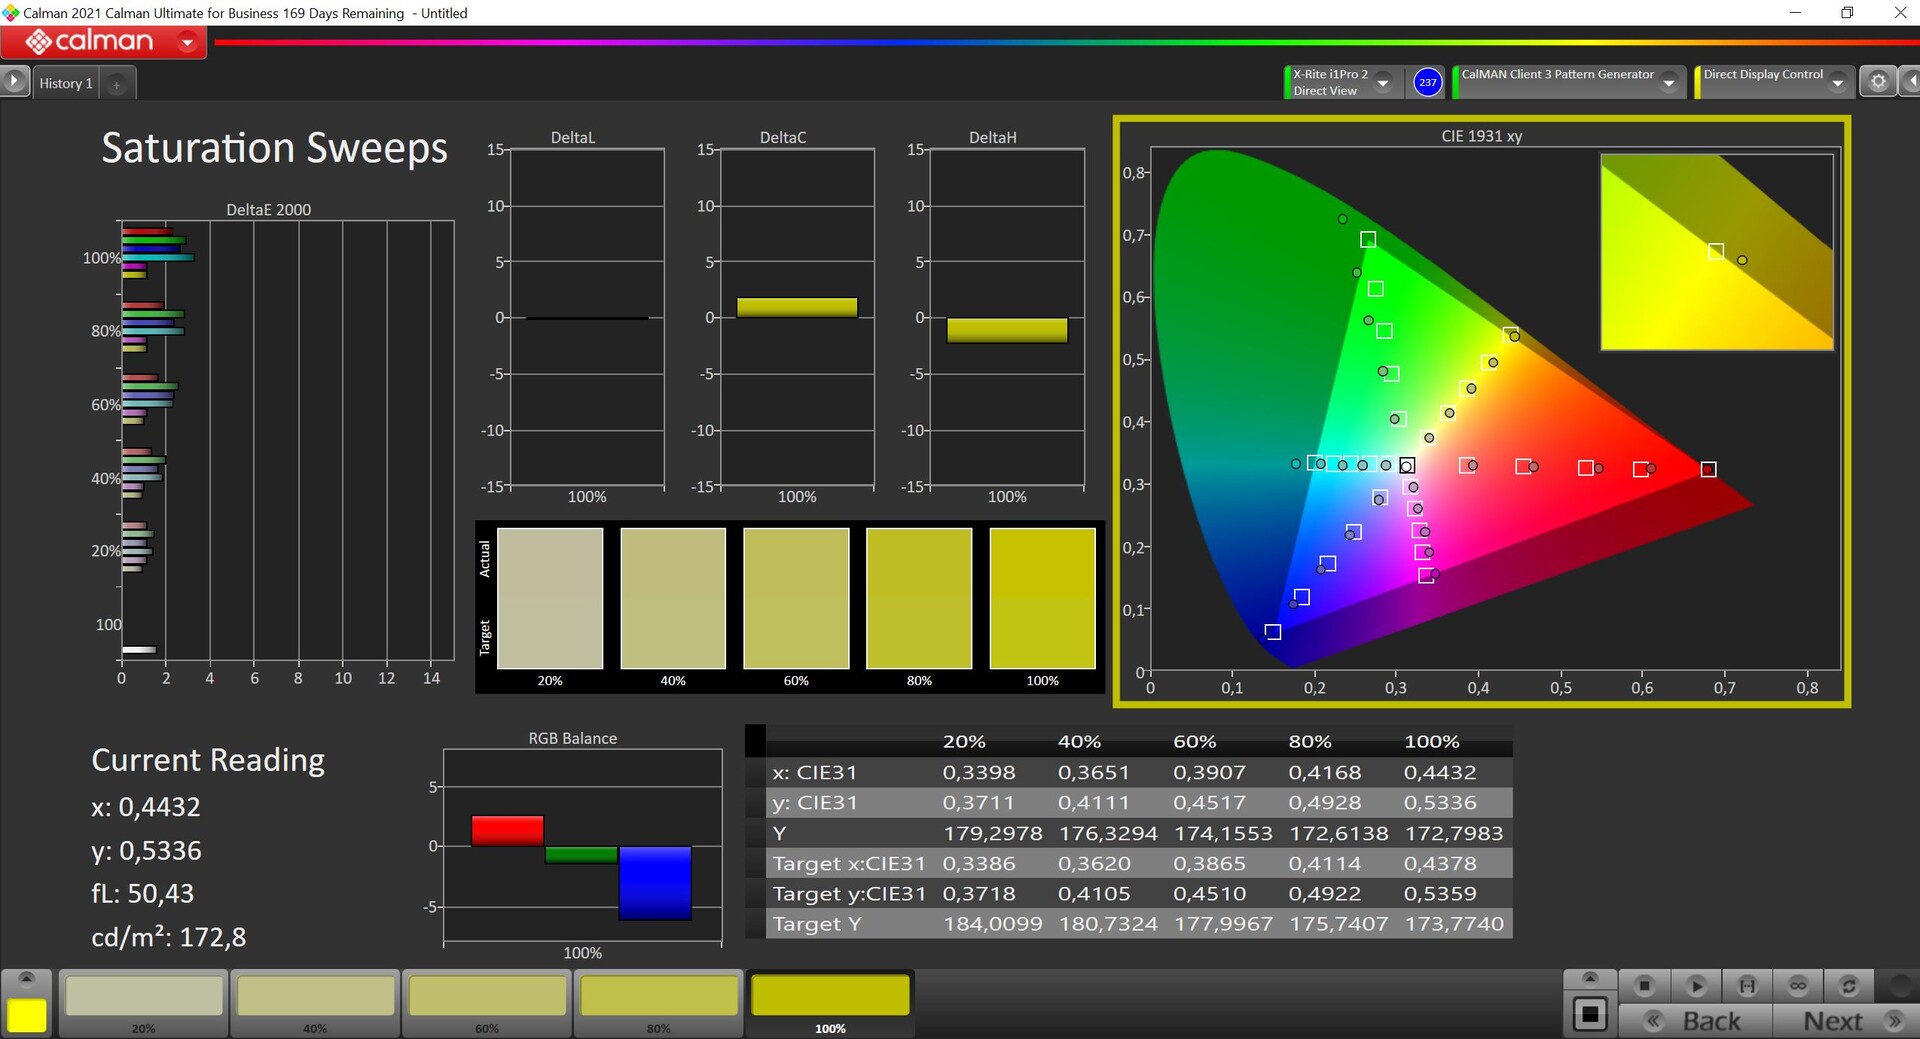
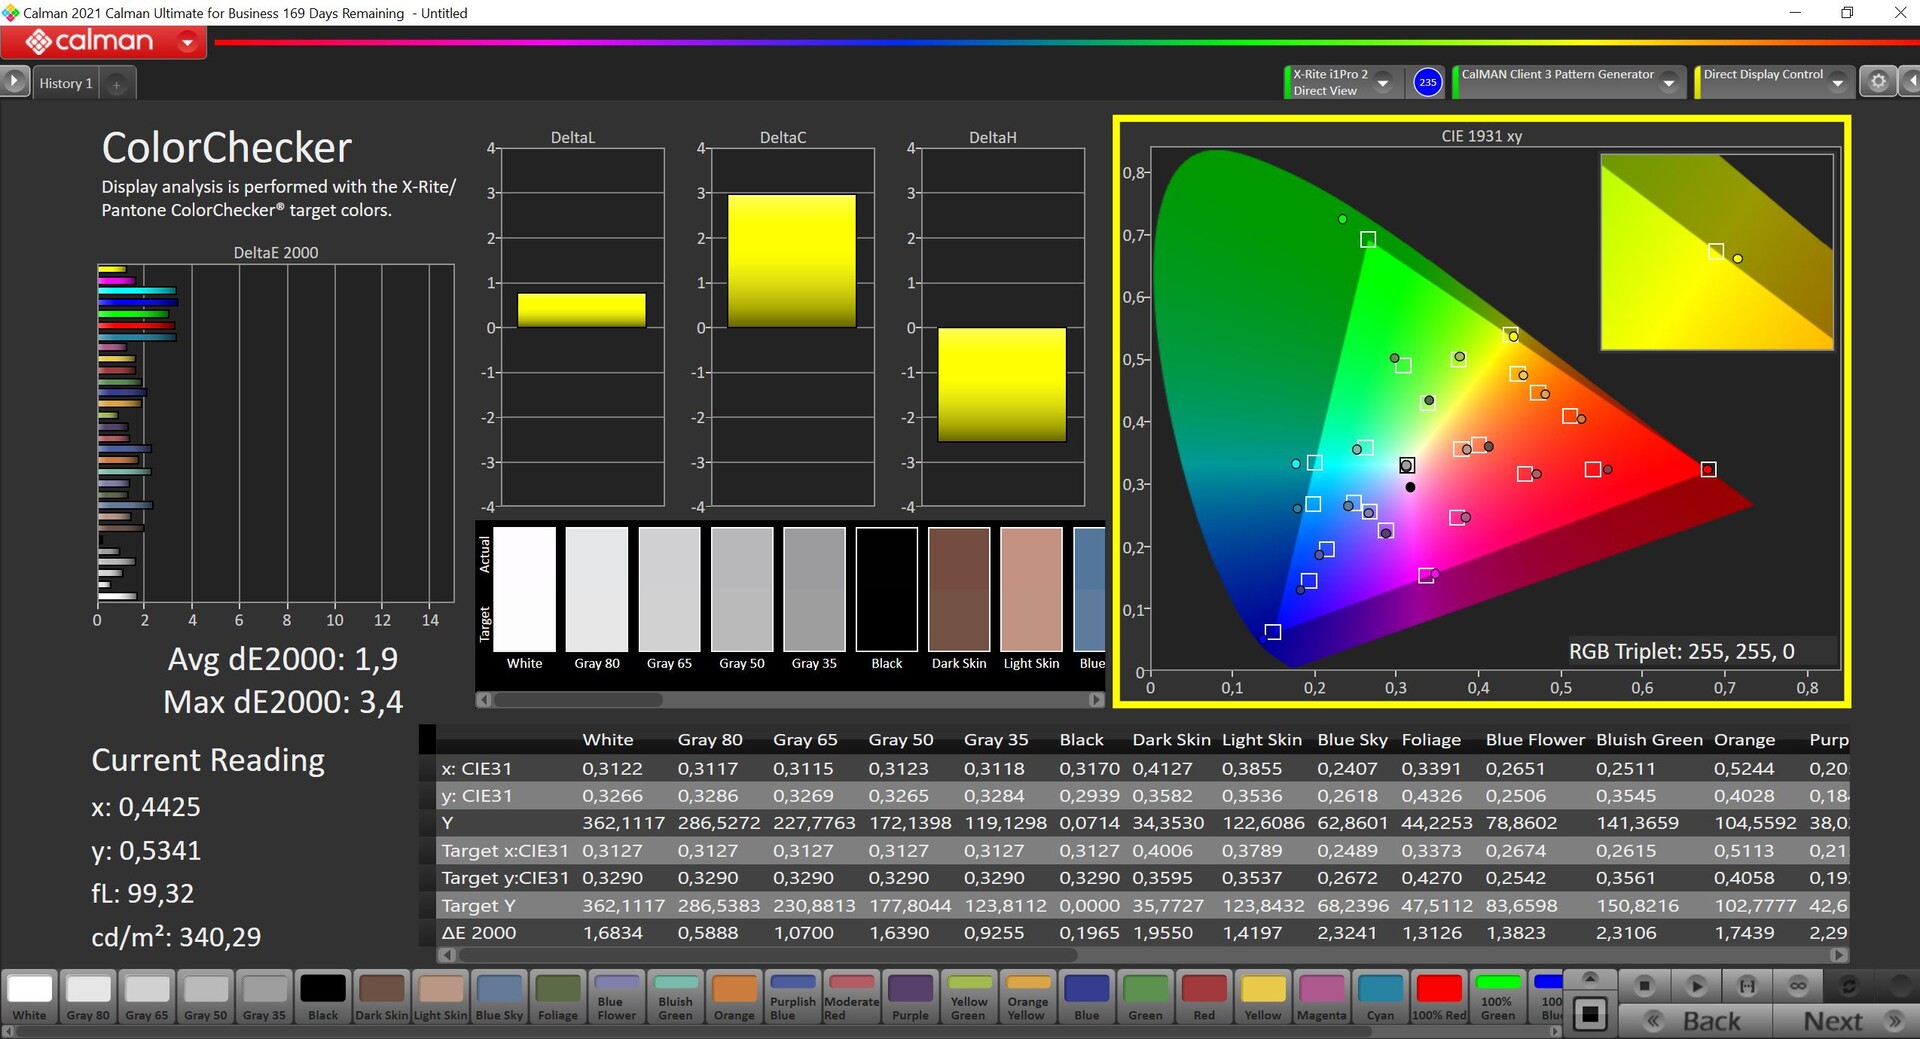
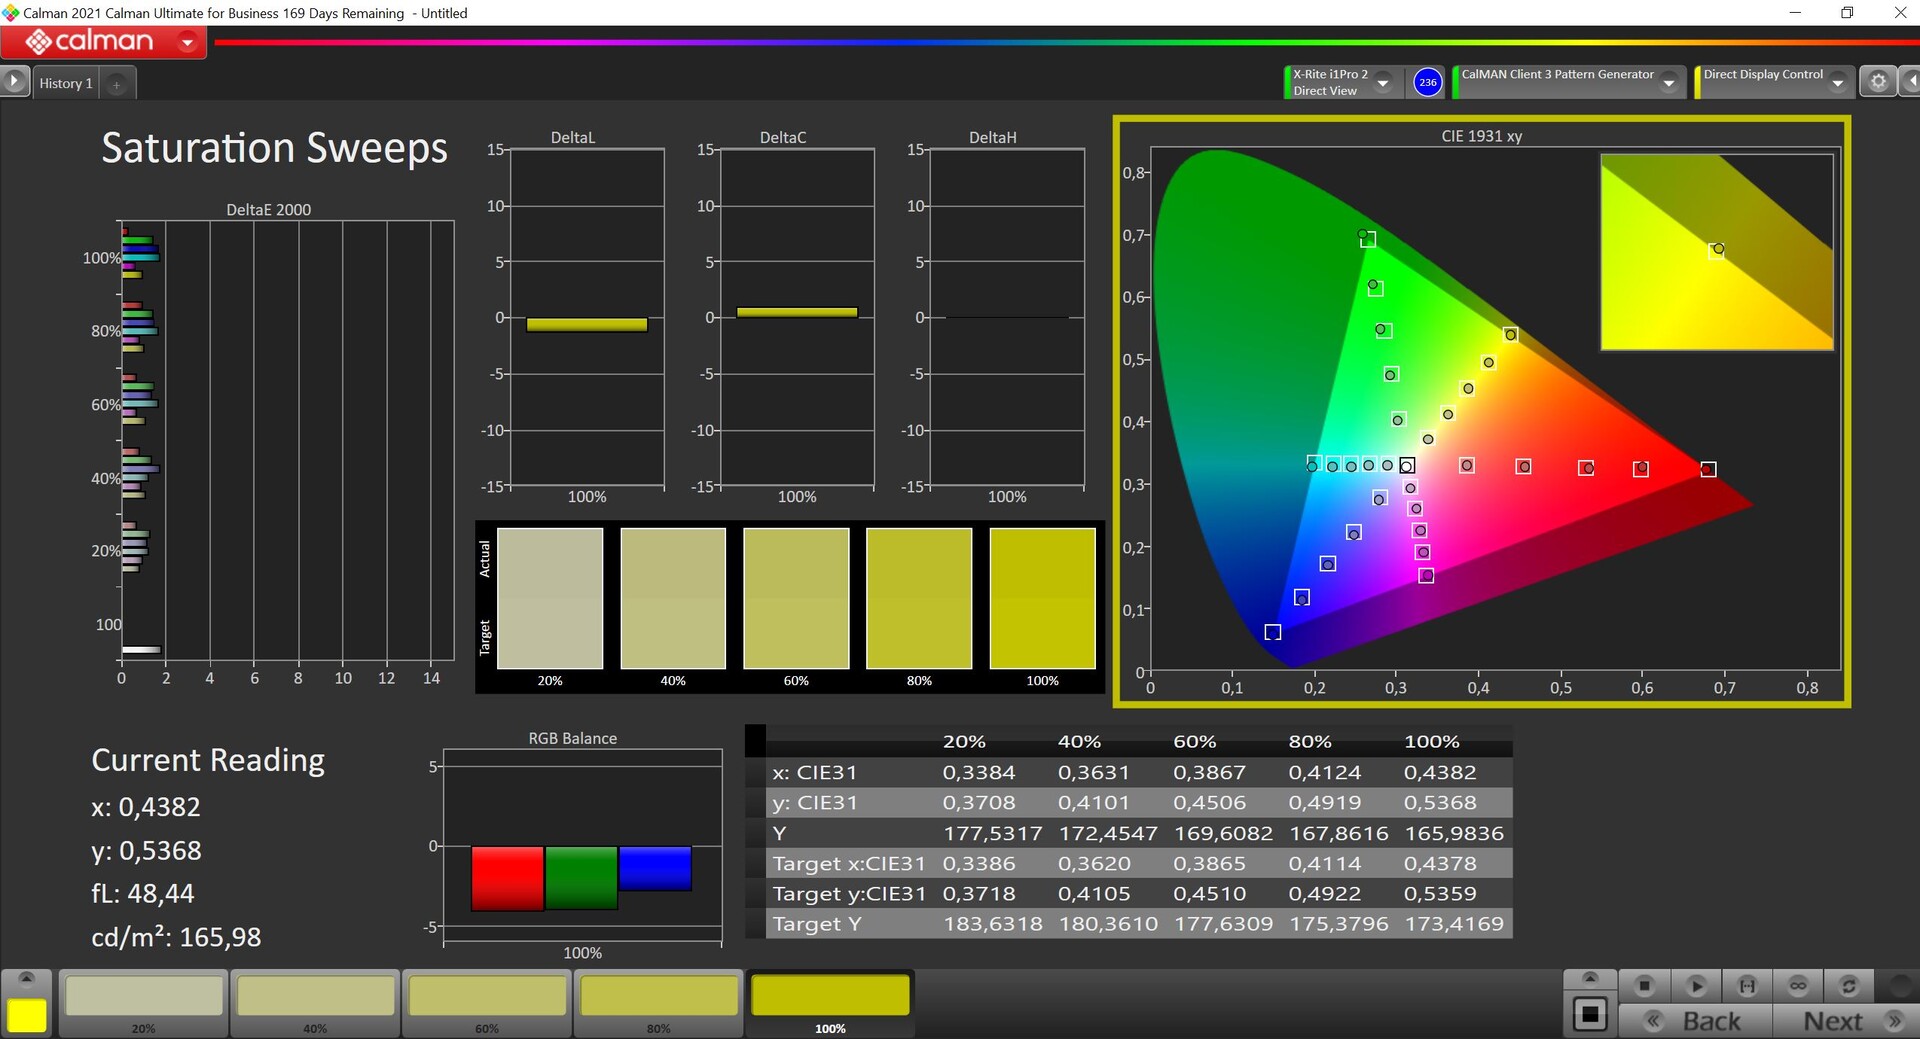
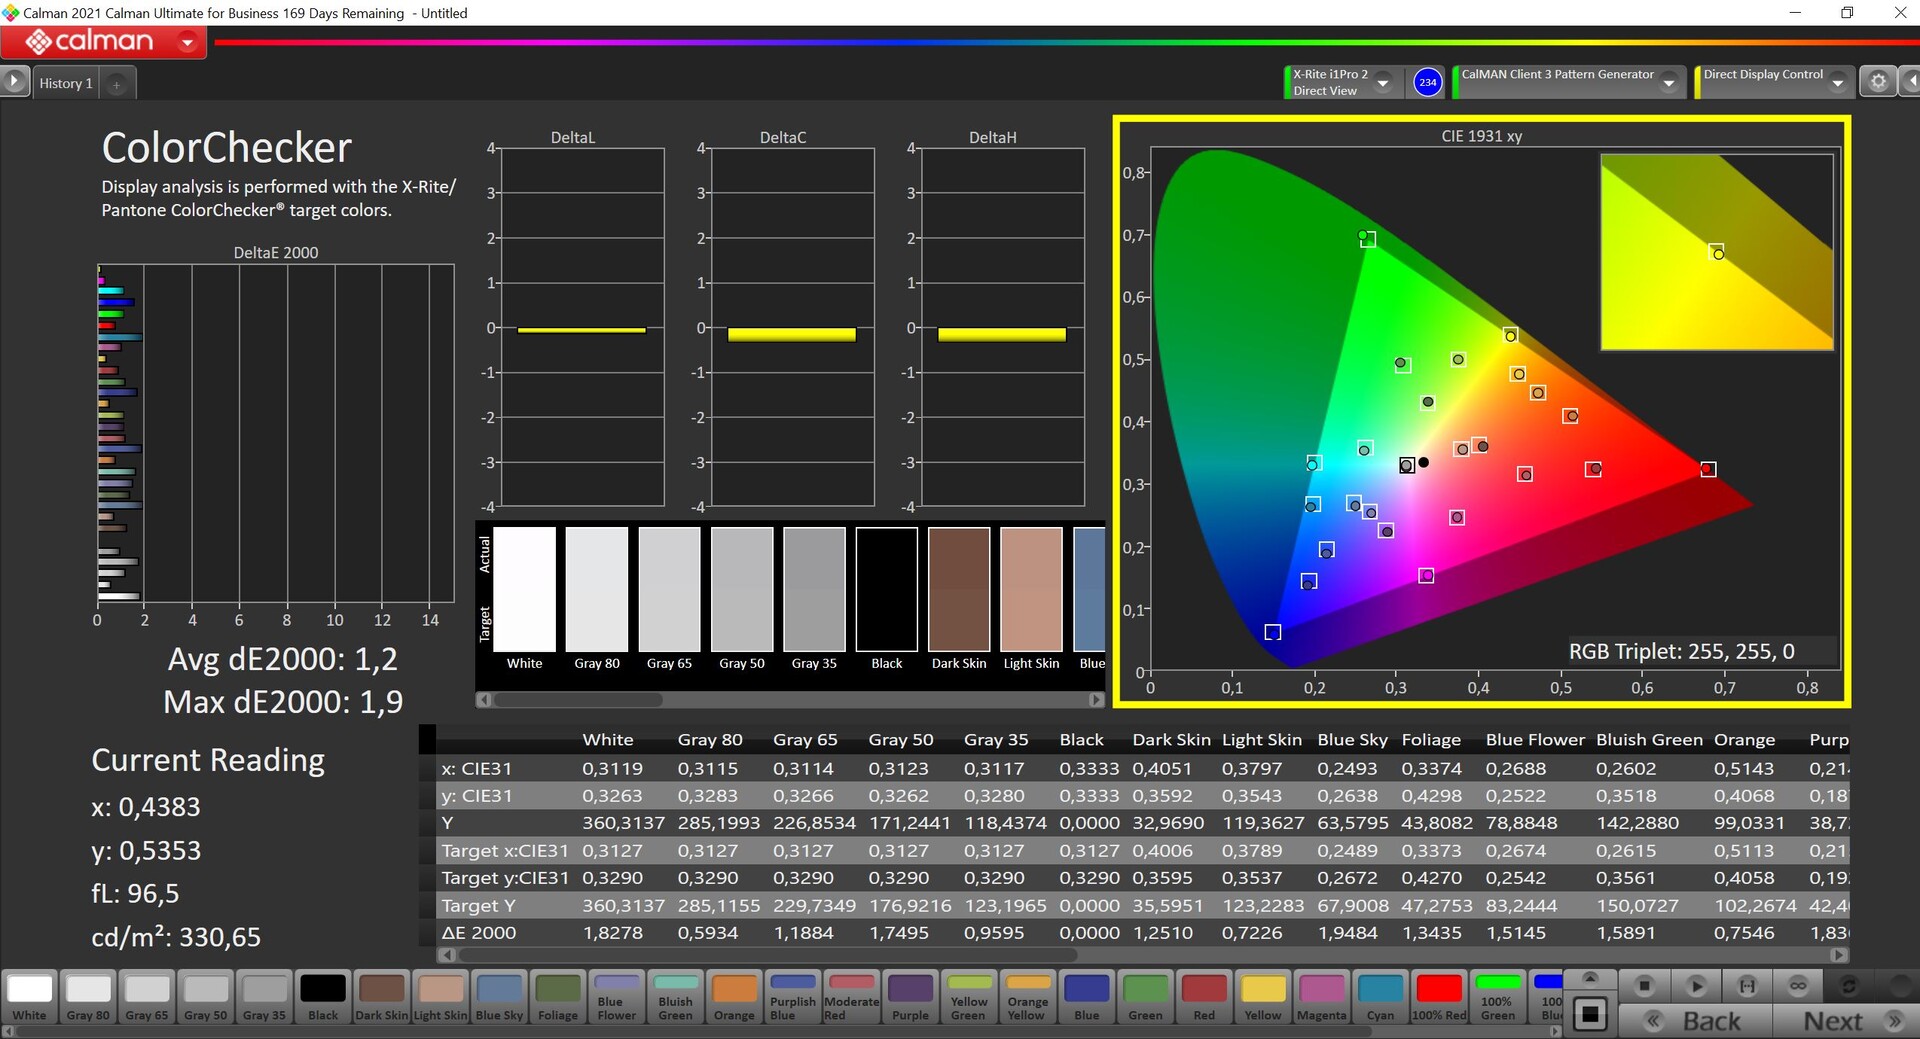

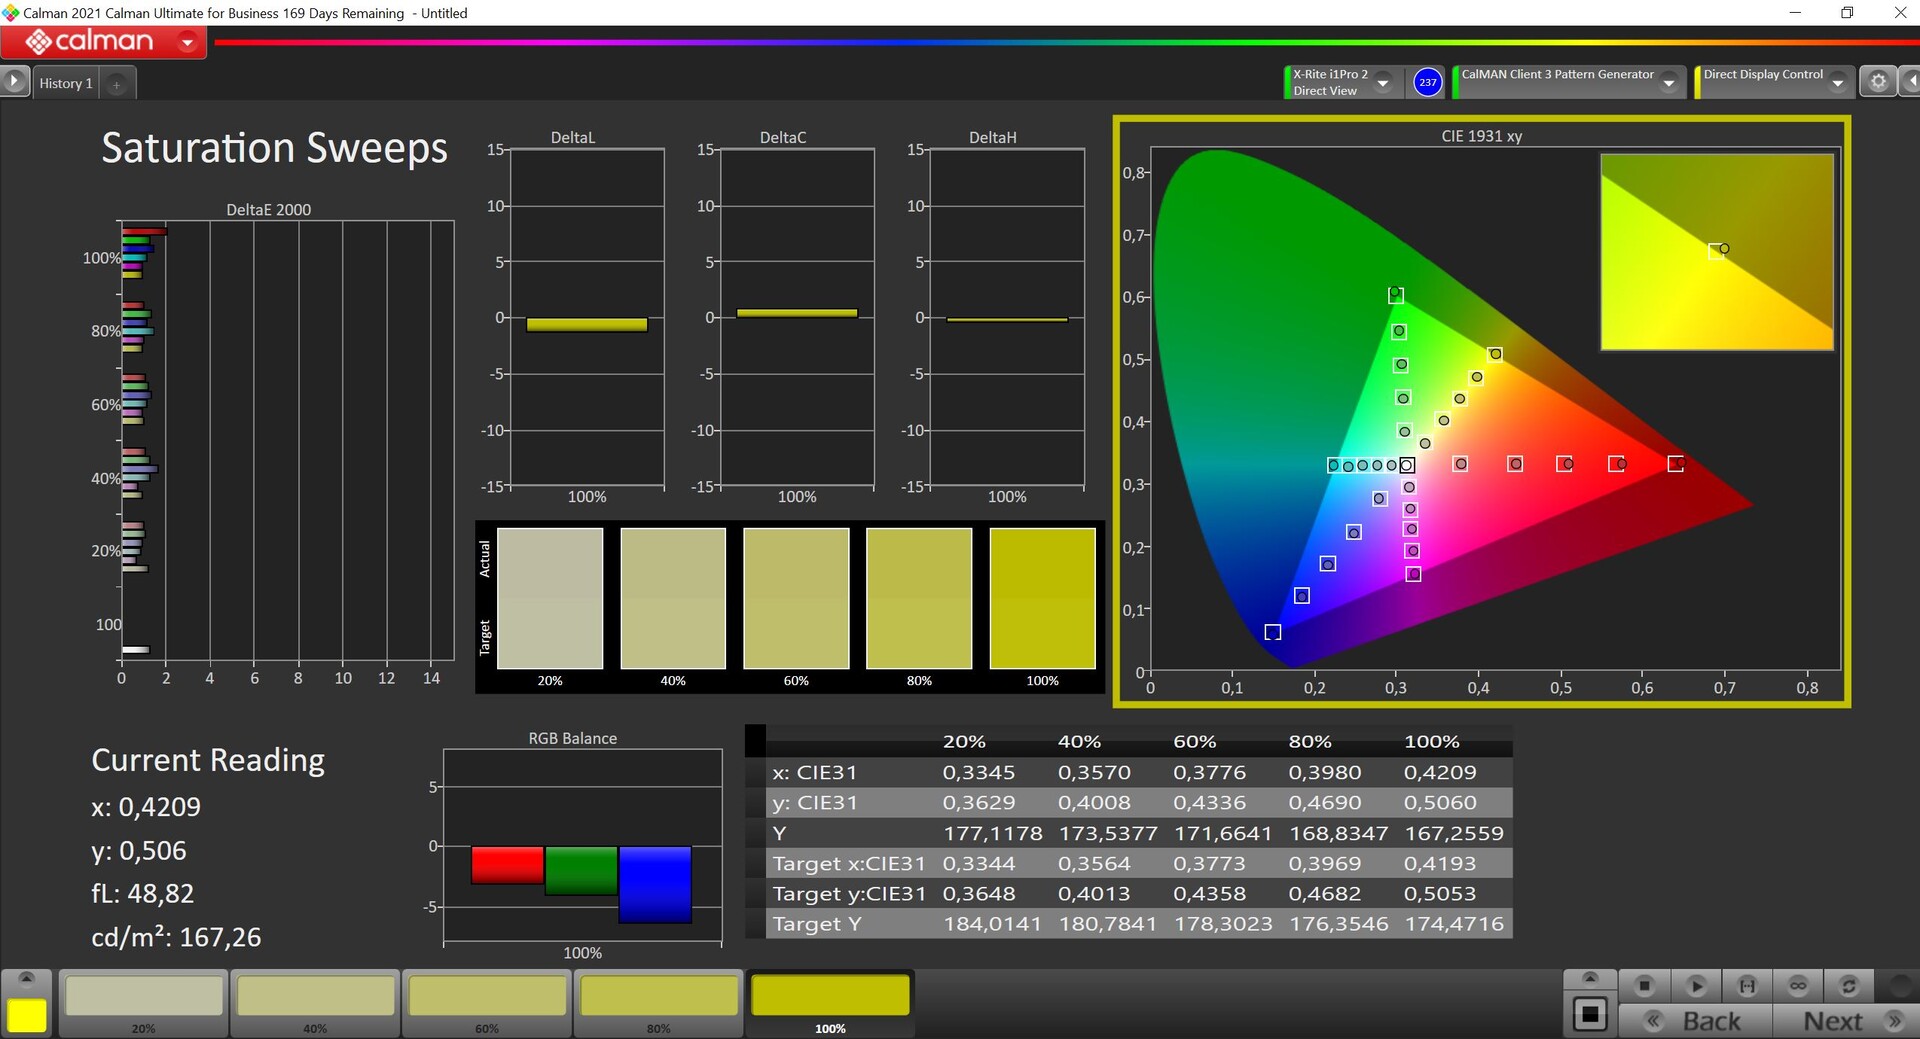

L'applicazione MyAsus preinstallata offre diversi profili di colore, che abbiamo misurato con il software professionale CalMAN. Per impostazione predefinita, è attivato il profilo "Nativo", che riproduce i colori leggermente troppo saturi, facendo apparire l'immagine soggettivamente un po' più vibrante. Inoltre, con Display-P3 e sRGB sono disponibili anche due profili estremamente accurati se si desidera lavorare su immagini negli spazi colore corrispondenti. Questi due profili sono già estremamente ben calibrati al momento della consegna, per cui non siamo riusciti a migliorare ulteriormente il display con la nostra calibrazione. Insieme alla copertura quasi completa dello spazio colore P3, si tratta di una prestazione complessivamente eccellente.
Tempi di risposta del Display
| ↔ Tempi di risposta dal Nero al Bianco | ||
|---|---|---|
| 1.6 ms ... aumenta ↗ e diminuisce ↘ combinato | ↗ 0.8 ms Incremento | 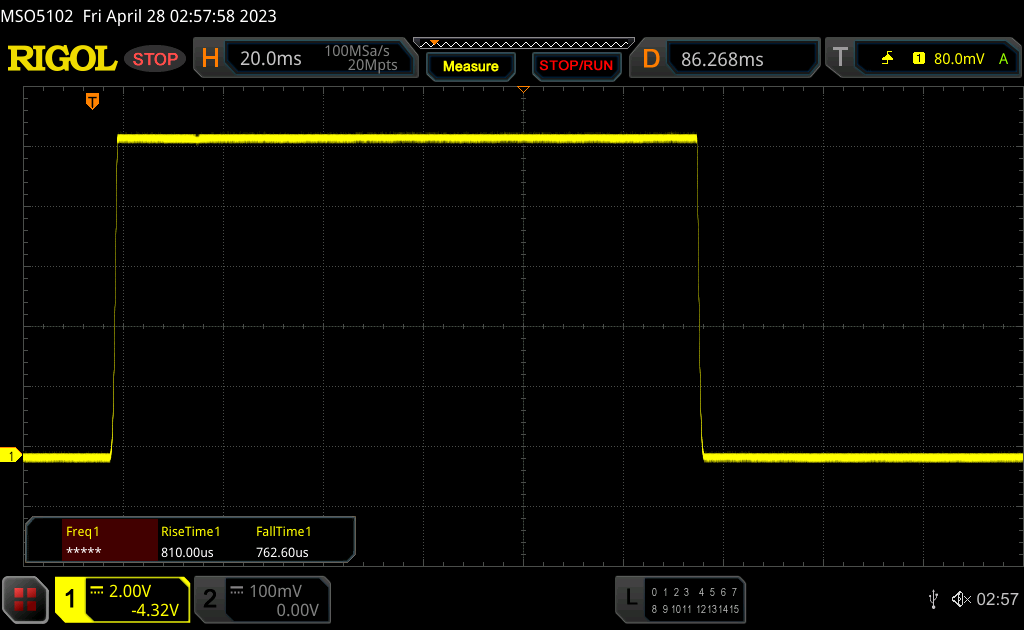 |
| ↘ 0.8 ms Calo | ||
| Lo schermo ha mostrato valori di risposta molto veloci nei nostri tests ed è molto adatto per i gaming veloce. In confronto, tutti i dispositivi di test variano da 0.1 (minimo) a 240 (massimo) ms. » 9 % di tutti i dispositivi è migliore. Questo significa che i tempi di risposta rilevati sono migliori rispettto alla media di tutti i dispositivi testati (19.8 ms). | ||
| ↔ Tempo di risposta dal 50% Grigio all'80% Grigio | ||
| 2 ms ... aumenta ↗ e diminuisce ↘ combinato | ↗ 1.1 ms Incremento | 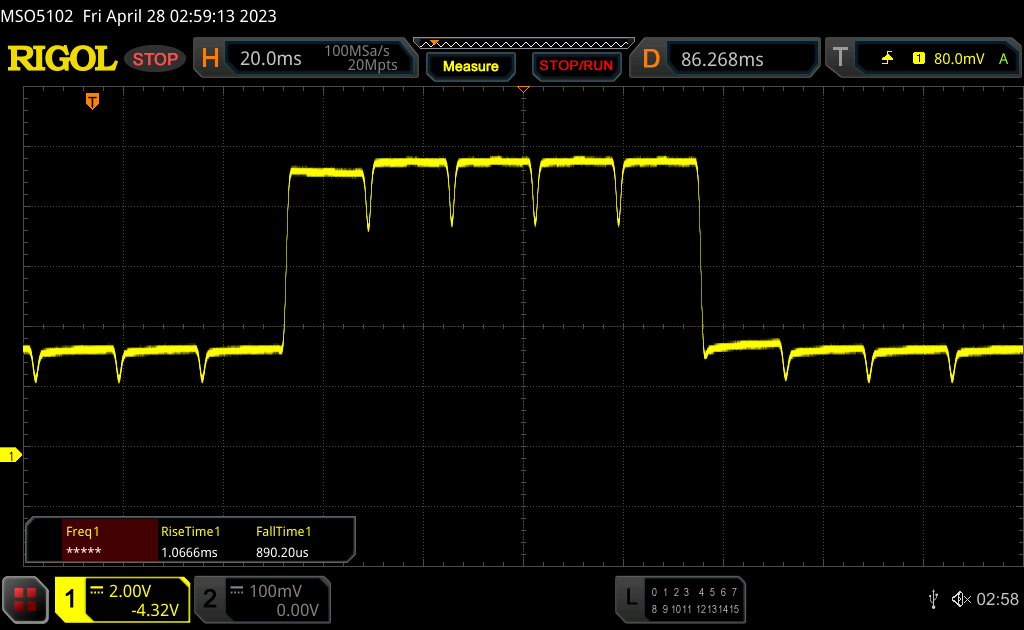 |
| ↘ 0.9 ms Calo | ||
| Lo schermo ha mostrato valori di risposta molto veloci nei nostri tests ed è molto adatto per i gaming veloce. In confronto, tutti i dispositivi di test variano da 0.165 (minimo) a 636 (massimo) ms. » 10 % di tutti i dispositivi è migliore. Questo significa che i tempi di risposta rilevati sono migliori rispettto alla media di tutti i dispositivi testati (31 ms). | ||
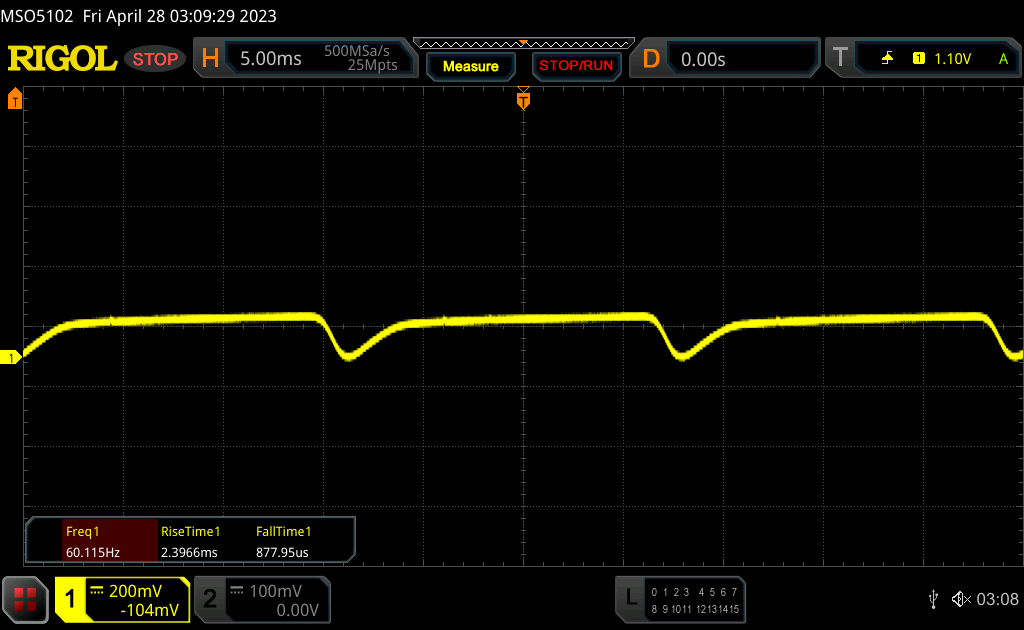
Sfarfallio dello schermo / PWM (Pulse-Width Modulation)
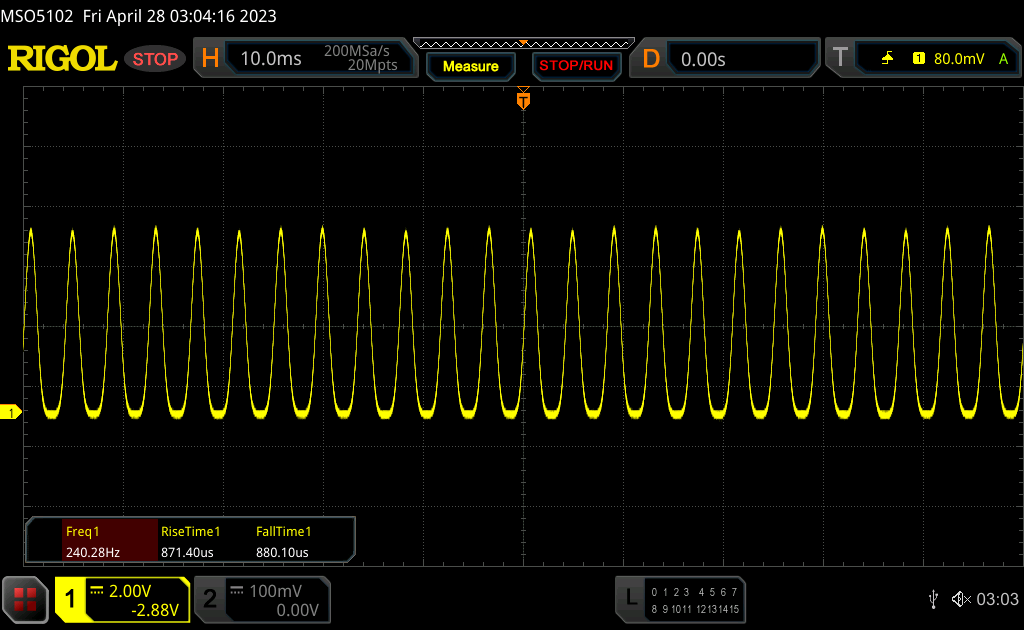
| flickering dello schermo / PWM rilevato | 240 Hz | ≤ 57 % settaggio luminosita' | 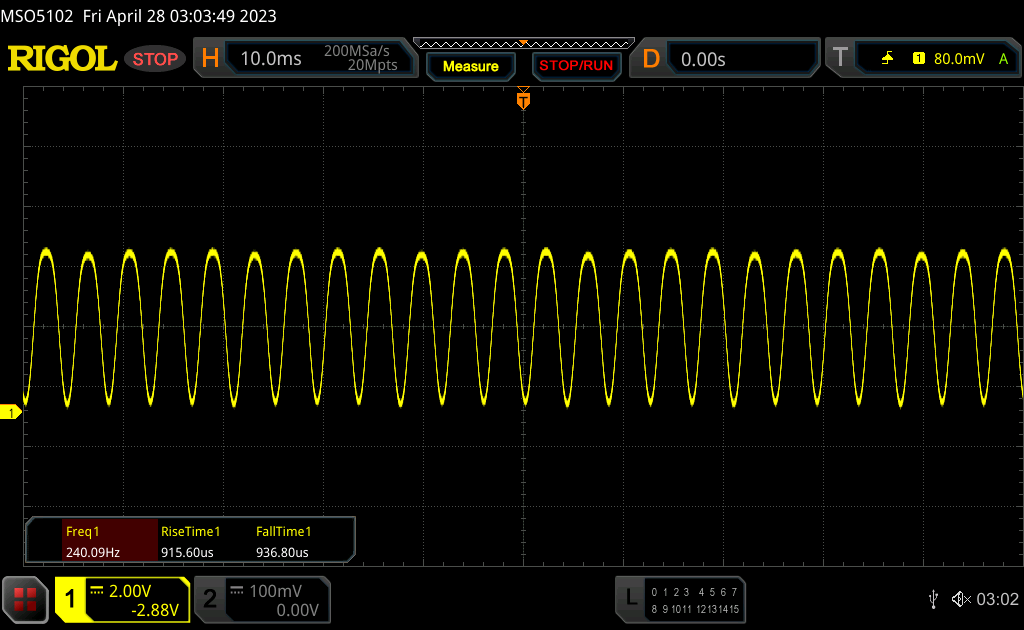 |
| ≤ 88 luminosita' cd/m² | |||
Il display sfarfalla a 240 Hz (Probabilmente a causa dell'uso di PWM) Flickering rilevato ad una luminosita' di 57 % (88 cd/m²) o inferiore. Non dovrebbe verificarsi flickering o PWM sopra questo valore di luminosita'. La frequenza di 240 Hz è relativamente bassa, quindi gli utenti sensibili potrebbero notare il flickering ed accusare stanchezza agli occhi a questo livello di luminosità e a livelli inferiori. Il flickering di verifica con settaggi di luminosita' relativamente bassa, quindi un utilizzo prolungato a questi livelli o a livelli ingeriori potrebbe causare stanchezza agli occhi. In confronto: 52 % di tutti i dispositivi testati non utilizza PWM per ridurre la luminosita' del display. Se è rilevato PWM, una media di 7778 (minimo: 5 - massimo: 343500) Hz è stata rilevata. | |||
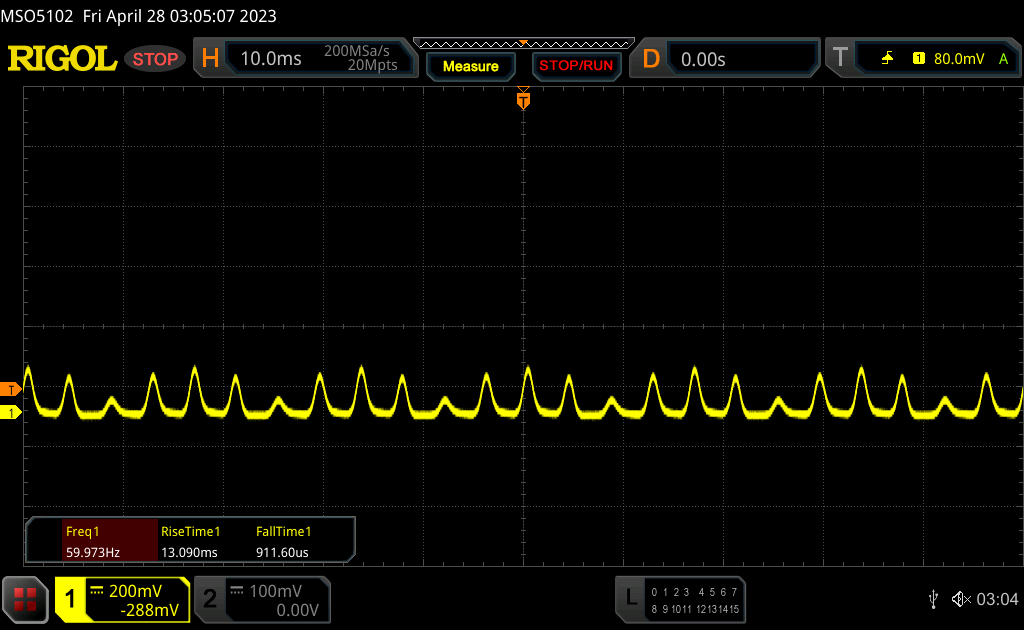
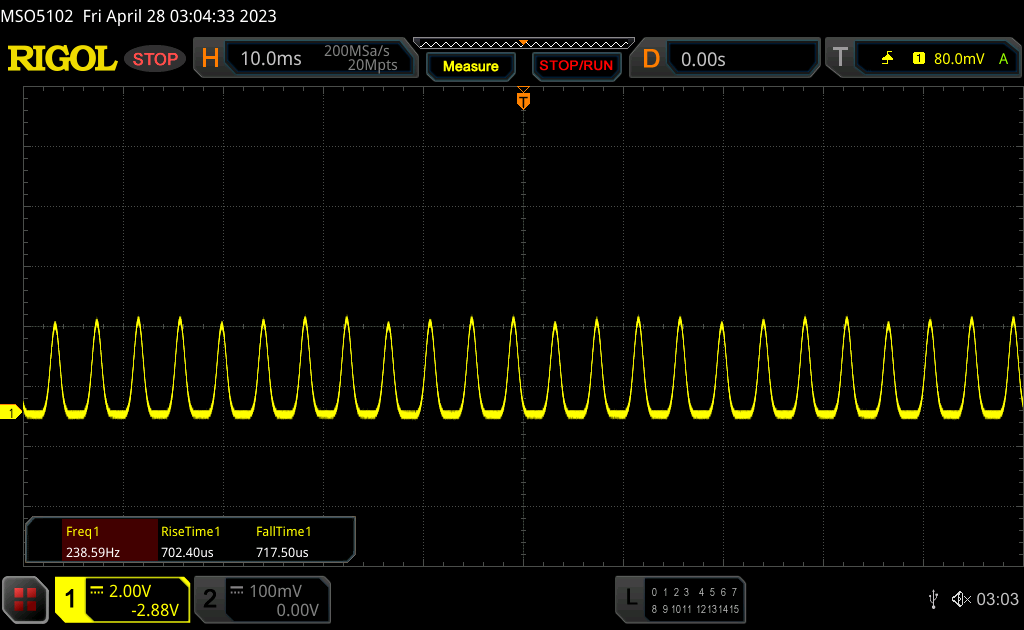
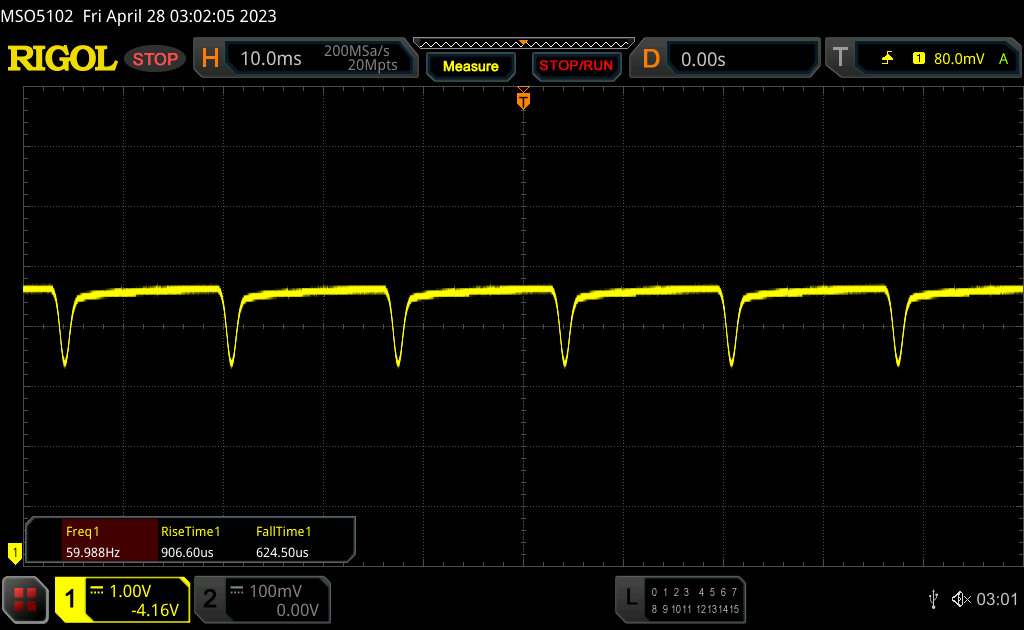
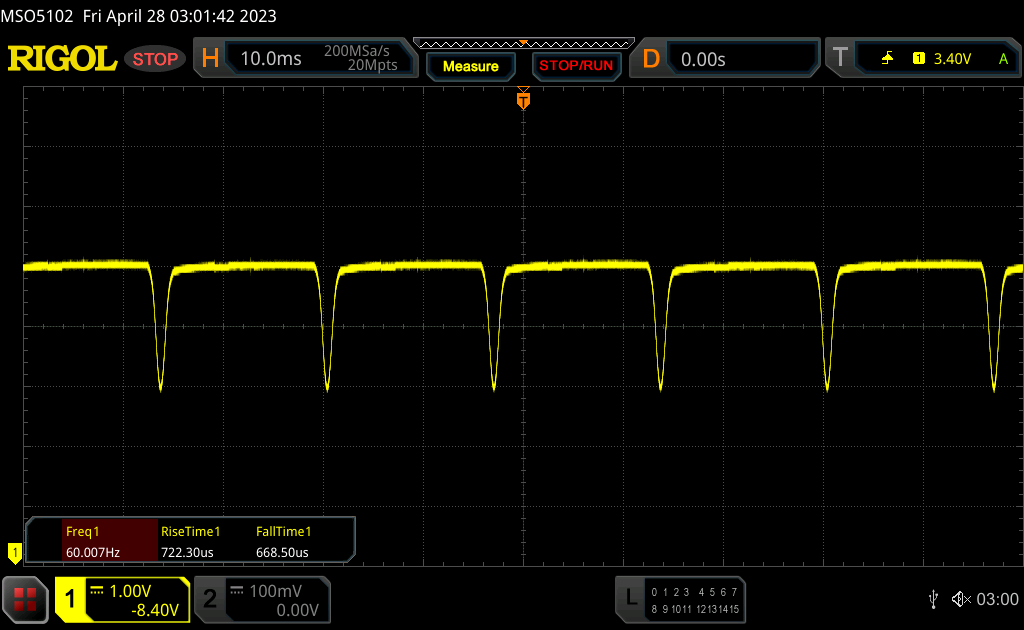
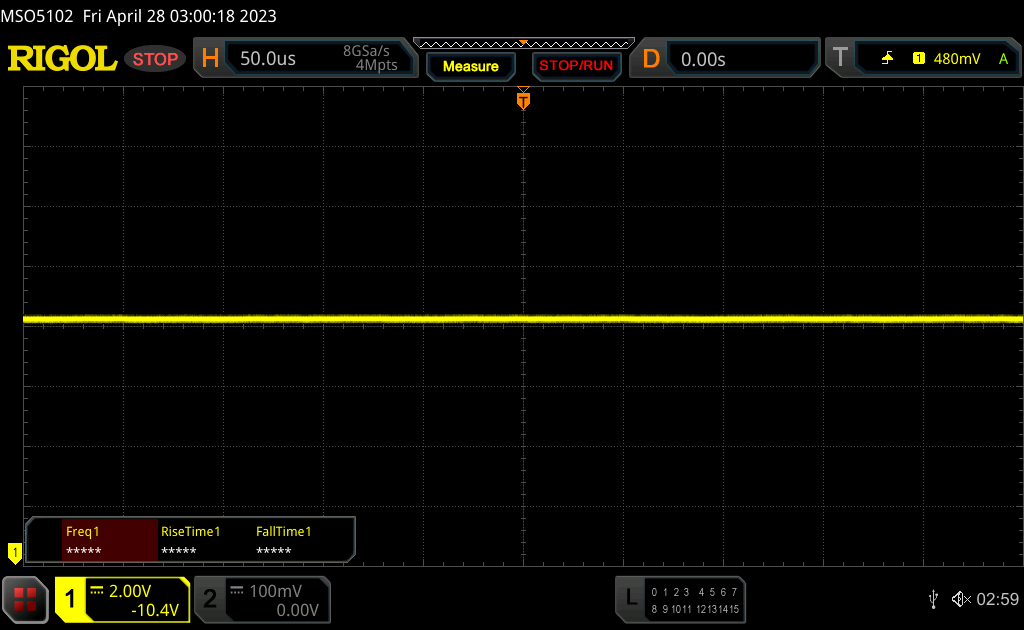
Dobbiamo affrontare l'argomento PWM in modo più dettagliato, poiché ci sono diversi fattori da considerare, come nel caso del predecessore. A una luminosità del 100%, non c'è PWM; nella fascia 58-99%, viene utilizzato il dimming DC a 60 Hz; a partire dal 57% (88 cd/m²) e oltre, viene utilizzato il classico e potenzialmente più dannoso sfarfallio PWM a 240 Hz. Inizialmente, la frequenza di regolazione continua a 60 Hz sembra peggiore di quanto non sia, ma a causa della sua ampiezza notevolmente inferiore, non può essere paragonata alla classica PWM e non dovrebbe causare alcun problema.
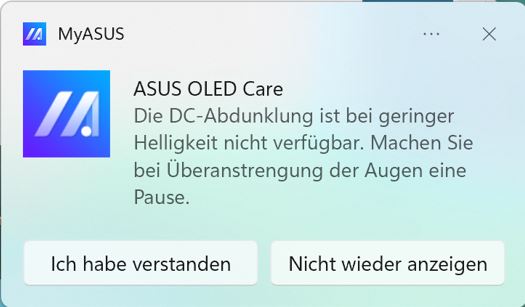
Asus continua a offrire una soluzione software per ridurre la luminosità senza entrare nella dannosa area PWM. Asus chiama questa funzione "oscuramento OLED senza sfarfallio", consentendo di continuare a ridurre la luminosità per gradi. In pratica, non si dovrebbe scendere al di sotto della luminosità di Windows, pari al 60%, e per un'ulteriore riduzione si può utilizzare il software. Anche se Asus fornisce una notifica di avvertimento, avremmo preferito una soluzione più comoda, in cui il metodo software fosse direttamente integrato nelle impostazioni di Windows e l'utente non fosse in grado di accedere alla classica area PWM.
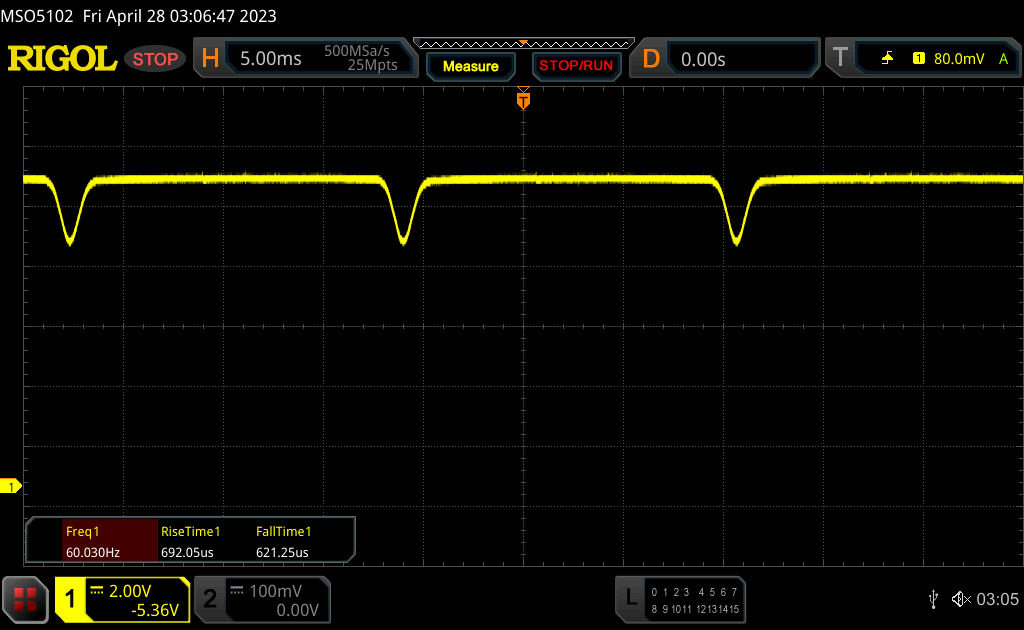
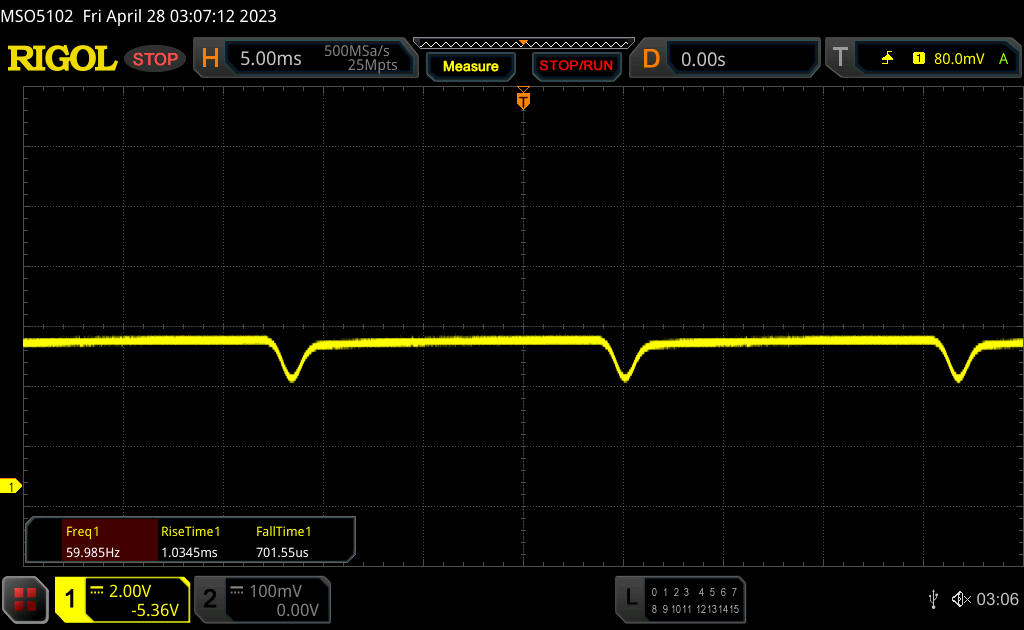
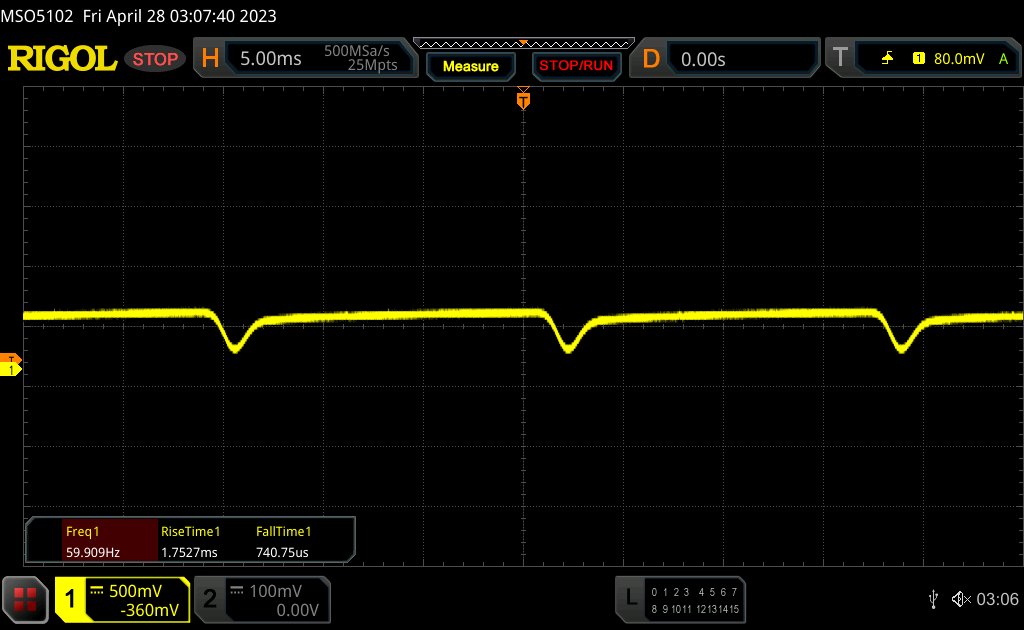
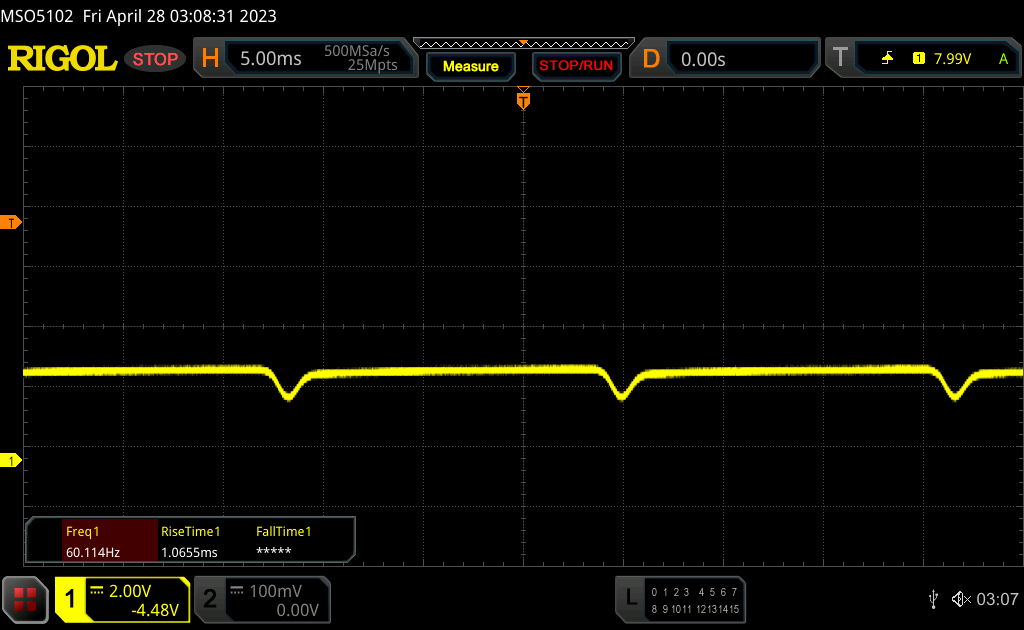
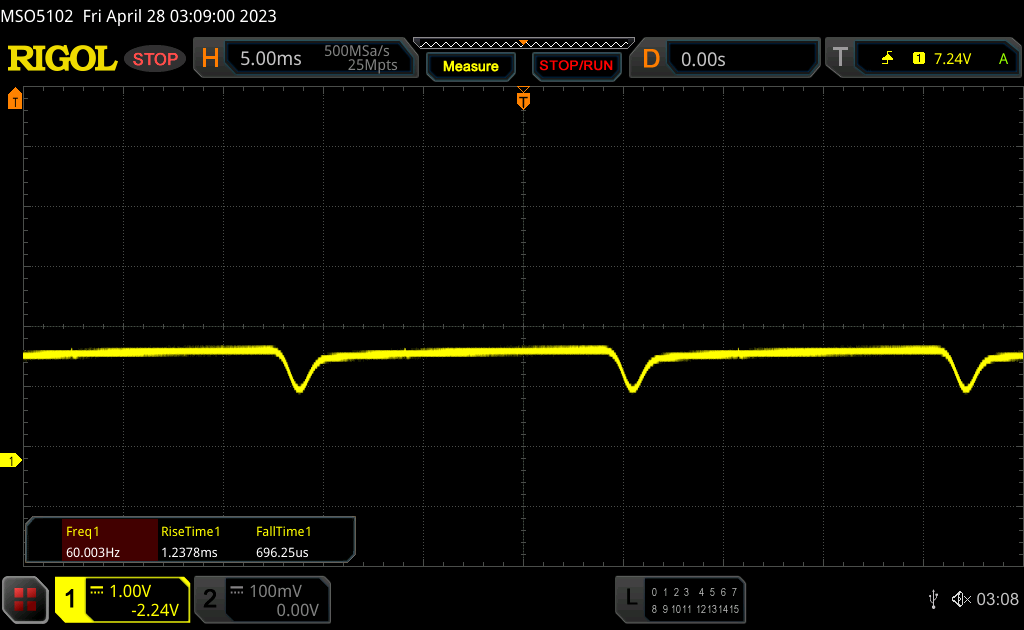
Come esempio, abbiamo misurato diverse impostazioni con le due impostazioni di luminosità di base e vari livelli di oscuramento. Si può notare chiaramente che è possibile implementare livelli di luminosità più bassi con il dimming DC utilizzando l'oscuramento software.
All'aperto, lo Zenbook beneficia di un contrasto estremamente elevato, ma utilizza comunque uno schermo riflettente, il che comporta necessariamente alcuni riflessi. Una maggiore luminosità SDR sarebbe sicuramente utile anche in questo caso. La stabilità dell'angolo di visione è complessivamente molto buona, e si può notare solo la leggera sfumatura blu tipica dei pannelli OLED da alcuni angoli di visione (molto ripidi).
Prestazioni - Asus utilizza ora Raptor Lake U
Condizioni di prova
Asus offre tre diversi profili di prestazioni: Modalità Whisper, Standard e Performance. A causa delle sue ventole rumorose (che non comportano un aumento sensibile delle prestazioni), quest'ultima si esclude dall'utilizzo. Abbiamo eseguito i nostri benchmark e le misurazioni qui sotto in modalità Standard. Quando si utilizza la modalità Whisper, le ventole sono significativamente più silenziose, ma questo non è necessariamente un vantaggio con il rumore delle ventole ad alta frequenza. Ma questo aspetto verrà analizzato più avanti.
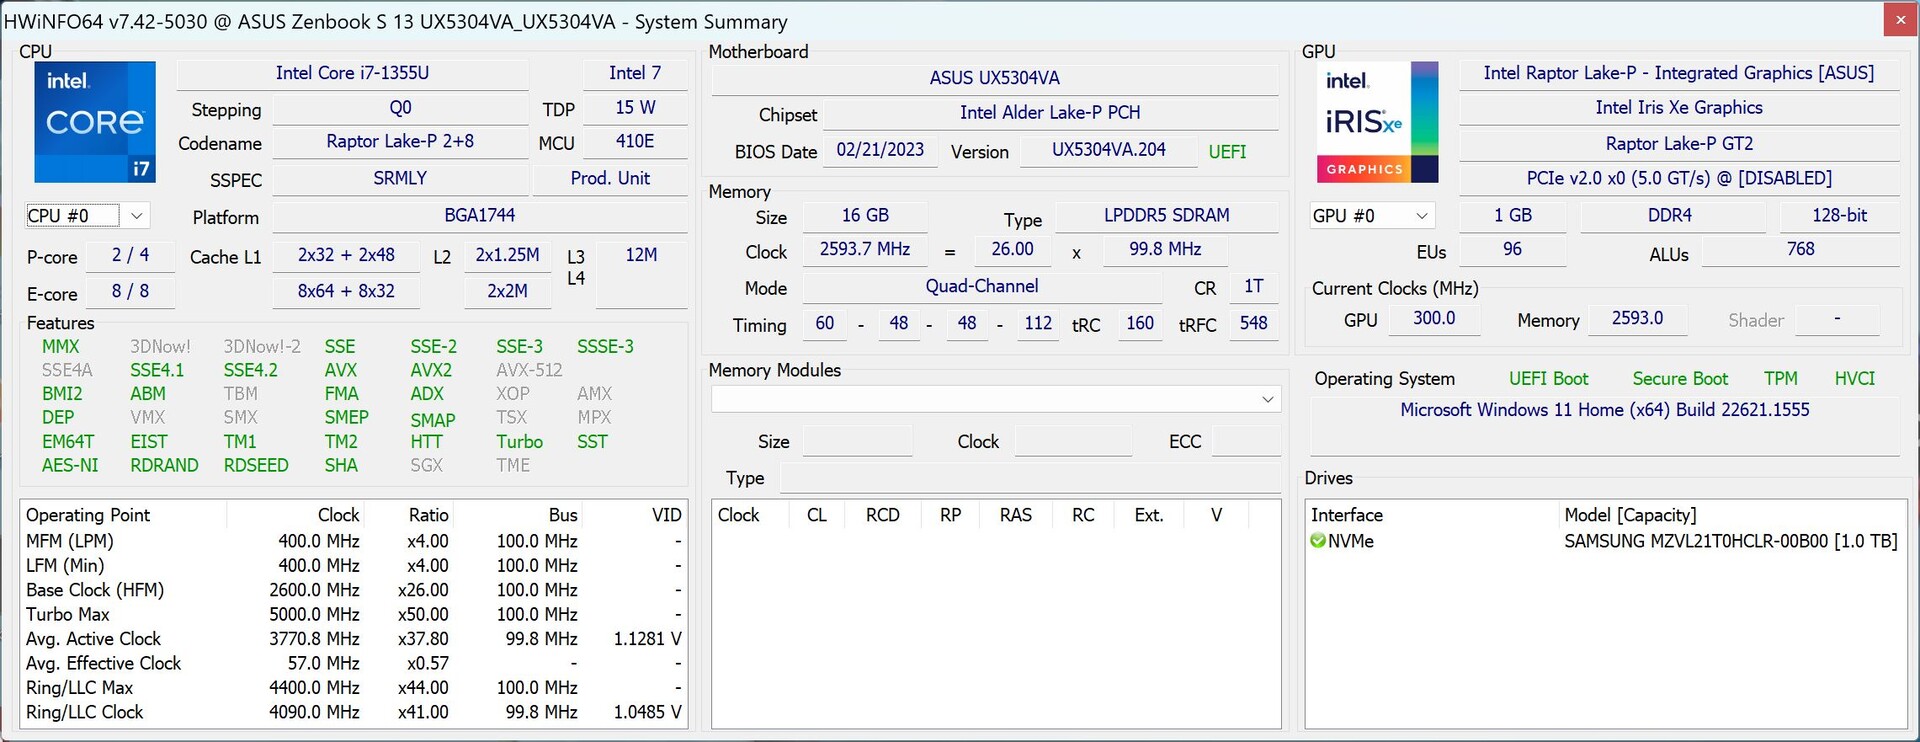
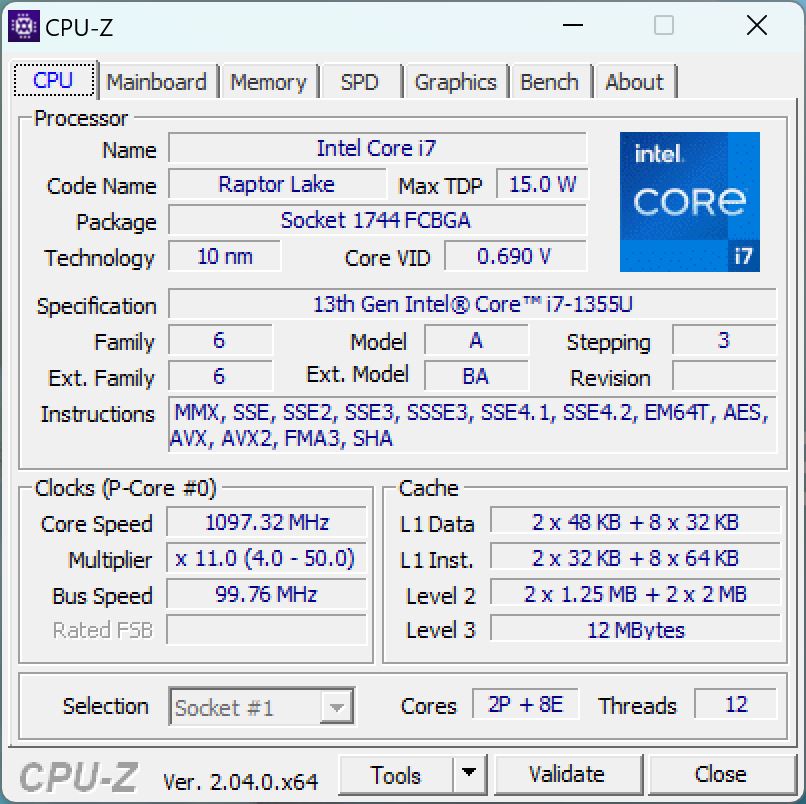
Processore - Core i7-1355U
IlIntel Core i7-1355Udell'attuale generazione Raptor Lake offre due core veloci per le prestazioni e otto per l'efficienza. In pratica, si tratta delAlder Lake Core i7-1255Ucon velocità di clock leggermente più elevate. Il processore può consumare fino a 44 watt per brevi periodi, ma sotto carico costante il consumo scende rapidamente a circa 17 watt.
Nei test multicore, le prestazioni sono quindi competitive solo per un breve periodo di tempo, e il MacBook Air M2 raffreddato passivamente è in grado di offrire un'ottima prestazione MacBook Air M2raffreddato passivamente, ad esempio, è già più veloce nella seconda prova (anche se in questo caso è necessario emulare Cinebench R15). Rispetto allo Zenbook S 13 dello scorso anno con Ryzen 7 6800Usolo nei test single-core notiamo un leggero vantaggio, al massimo del 20%, rispetto al Ryzen 7 6800U Ryzen 7 6800U. Ma in tutti i benchmark della CPU, il nuovo modello si colloca ancora il 10% dietro lo Zenbook S 13 dello scorso anno.
Nel funzionamento a batteria, il consumo energetico si riduce ulteriormente e le prestazioni multicore diminuiscono di circa il 17%. D'altra parte, la riduzione del 3% delle prestazioni single-core è trascurabile. È possibile trovare altri benchmark della CPU qui.
Cinebench R15 Multi Constant Load Test
Cinebench R23: Multi Core | Single Core
Cinebench R20: CPU (Multi Core) | CPU (Single Core)
Cinebench R15: CPU Multi 64Bit | CPU Single 64Bit
Blender: v2.79 BMW27 CPU
7-Zip 18.03: 7z b 4 | 7z b 4 -mmt1
Geekbench 5.5: Multi-Core | Single-Core
HWBOT x265 Benchmark v2.2: 4k Preset
LibreOffice : 20 Documents To PDF
R Benchmark 2.5: Overall mean
| CPU Performance rating | |
| Dell XPS 13 Plus 9320 i7-1280P OLED | |
| Media della classe Subnotebook | |
| Lenovo Yoga Slim 7 Carbon 13IAP7-82U9005FGE | |
| Asus Zenbook S 13 OLED | |
| Media Intel Core i7-1355U | |
| Asus ZenBook S13 OLED UX5304 | |
| Apple MacBook Air M2 10C GPU -5! | |
| Samsung Galaxy Book2 Pro 13 NP930XED-KA1DE | |
| Cinebench R23 / Multi Core | |
| Media della classe Subnotebook (1555 - 21812, n=59, ultimi 2 anni) | |
| Dell XPS 13 Plus 9320 i7-1280P OLED | |
| Asus Zenbook S 13 OLED | |
| Lenovo Yoga Slim 7 Carbon 13IAP7-82U9005FGE | |
| Media Intel Core i7-1355U (6936 - 10252, n=18) | |
| Apple MacBook Air M2 10C GPU | |
| Asus ZenBook S13 OLED UX5304 | |
| Samsung Galaxy Book2 Pro 13 NP930XED-KA1DE | |
| Cinebench R23 / Single Core | |
| Media Intel Core i7-1355U (1687 - 1889, n=18) | |
| Lenovo Yoga Slim 7 Carbon 13IAP7-82U9005FGE | |
| Asus ZenBook S13 OLED UX5304 | |
| Media della classe Subnotebook (358 - 2213, n=60, ultimi 2 anni) | |
| Dell XPS 13 Plus 9320 i7-1280P OLED | |
| Apple MacBook Air M2 10C GPU | |
| Asus Zenbook S 13 OLED | |
| Samsung Galaxy Book2 Pro 13 NP930XED-KA1DE | |
| Cinebench R20 / CPU (Multi Core) | |
| Media della classe Subnotebook (579 - 8541, n=56, ultimi 2 anni) | |
| Dell XPS 13 Plus 9320 i7-1280P OLED | |
| Asus Zenbook S 13 OLED | |
| Lenovo Yoga Slim 7 Carbon 13IAP7-82U9005FGE | |
| Media Intel Core i7-1355U (2849 - 3907, n=18) | |
| Asus ZenBook S13 OLED UX5304 | |
| Apple MacBook Air M2 10C GPU | |
| Samsung Galaxy Book2 Pro 13 NP930XED-KA1DE | |
| Cinebench R20 / CPU (Single Core) | |
| Media Intel Core i7-1355U (654 - 725, n=18) | |
| Asus ZenBook S13 OLED UX5304 | |
| Lenovo Yoga Slim 7 Carbon 13IAP7-82U9005FGE | |
| Media della classe Subnotebook (128 - 832, n=56, ultimi 2 anni) | |
| Dell XPS 13 Plus 9320 i7-1280P OLED | |
| Asus Zenbook S 13 OLED | |
| Apple MacBook Air M2 10C GPU | |
| Samsung Galaxy Book2 Pro 13 NP930XED-KA1DE | |
| Cinebench R15 / CPU Multi 64Bit | |
| Media della classe Subnotebook (327 - 3345, n=56, ultimi 2 anni) | |
| Dell XPS 13 Plus 9320 i7-1280P OLED | |
| Lenovo Yoga Slim 7 Carbon 13IAP7-82U9005FGE | |
| Asus Zenbook S 13 OLED | |
| Media Intel Core i7-1355U (1206 - 1735, n=18) | |
| Asus ZenBook S13 OLED UX5304 | |
| Apple MacBook Air M2 10C GPU | |
| Samsung Galaxy Book2 Pro 13 NP930XED-KA1DE | |
| Cinebench R15 / CPU Single 64Bit | |
| Media della classe Subnotebook (72.4 - 322, n=56, ultimi 2 anni) | |
| Media Intel Core i7-1355U (237 - 267, n=18) | |
| Asus ZenBook S13 OLED UX5304 | |
| Lenovo Yoga Slim 7 Carbon 13IAP7-82U9005FGE | |
| Asus Zenbook S 13 OLED | |
| Dell XPS 13 Plus 9320 i7-1280P OLED | |
| Apple MacBook Air M2 10C GPU | |
| Samsung Galaxy Book2 Pro 13 NP930XED-KA1DE | |
| Blender / v2.79 BMW27 CPU | |
| Apple MacBook Air M2 10C GPU | |
| Samsung Galaxy Book2 Pro 13 NP930XED-KA1DE | |
| Asus ZenBook S13 OLED UX5304 | |
| Asus ZenBook S13 OLED UX5304 | |
| Media Intel Core i7-1355U (328 - 503, n=18) | |
| Media della classe Subnotebook (159 - 2271, n=57, ultimi 2 anni) | |
| Lenovo Yoga Slim 7 Carbon 13IAP7-82U9005FGE | |
| Asus Zenbook S 13 OLED | |
| Dell XPS 13 Plus 9320 i7-1280P OLED | |
| 7-Zip 18.03 / 7z b 4 | |
| Dell XPS 13 Plus 9320 i7-1280P OLED | |
| Asus Zenbook S 13 OLED | |
| Media della classe Subnotebook (11668 - 77867, n=56, ultimi 2 anni) | |
| Lenovo Yoga Slim 7 Carbon 13IAP7-82U9005FGE | |
| Media Intel Core i7-1355U (30255 - 42092, n=18) | |
| Asus ZenBook S13 OLED UX5304 | |
| Samsung Galaxy Book2 Pro 13 NP930XED-KA1DE | |
| 7-Zip 18.03 / 7z b 4 -mmt1 | |
| Asus ZenBook S13 OLED UX5304 | |
| Media Intel Core i7-1355U (5301 - 5911, n=18) | |
| Media della classe Subnotebook (2643 - 6699, n=58, ultimi 2 anni) | |
| Asus Zenbook S 13 OLED | |
| Lenovo Yoga Slim 7 Carbon 13IAP7-82U9005FGE | |
| Dell XPS 13 Plus 9320 i7-1280P OLED | |
| Samsung Galaxy Book2 Pro 13 NP930XED-KA1DE | |
| Geekbench 5.5 / Multi-Core | |
| Dell XPS 13 Plus 9320 i7-1280P OLED | |
| Media della classe Subnotebook (2557 - 17218, n=48, ultimi 2 anni) | |
| Lenovo Yoga Slim 7 Carbon 13IAP7-82U9005FGE | |
| Apple MacBook Air M2 10C GPU | |
| Media Intel Core i7-1355U (7507 - 9328, n=18) | |
| Asus ZenBook S13 OLED UX5304 | |
| Asus Zenbook S 13 OLED | |
| Samsung Galaxy Book2 Pro 13 NP930XED-KA1DE | |
| Geekbench 5.5 / Single-Core | |
| Apple MacBook Air M2 10C GPU | |
| Media della classe Subnotebook (726 - 2224, n=48, ultimi 2 anni) | |
| Dell XPS 13 Plus 9320 i7-1280P OLED | |
| Media Intel Core i7-1355U (1678 - 1872, n=18) | |
| Asus ZenBook S13 OLED UX5304 | |
| Lenovo Yoga Slim 7 Carbon 13IAP7-82U9005FGE | |
| Asus Zenbook S 13 OLED | |
| Samsung Galaxy Book2 Pro 13 NP930XED-KA1DE | |
| HWBOT x265 Benchmark v2.2 / 4k Preset | |
| Dell XPS 13 Plus 9320 i7-1280P OLED | |
| Media della classe Subnotebook (0.97 - 25.1, n=56, ultimi 2 anni) | |
| Asus Zenbook S 13 OLED | |
| Lenovo Yoga Slim 7 Carbon 13IAP7-82U9005FGE | |
| Media Intel Core i7-1355U (7.83 - 11.4, n=18) | |
| Asus ZenBook S13 OLED UX5304 | |
| Samsung Galaxy Book2 Pro 13 NP930XED-KA1DE | |
| LibreOffice / 20 Documents To PDF | |
| Samsung Galaxy Book2 Pro 13 NP930XED-KA1DE | |
| Media della classe Subnotebook (39.9 - 220, n=55, ultimi 2 anni) | |
| Asus Zenbook S 13 OLED | |
| Media Intel Core i7-1355U (41.1 - 108.6, n=18) | |
| Dell XPS 13 Plus 9320 i7-1280P OLED | |
| Asus ZenBook S13 OLED UX5304 | |
| Lenovo Yoga Slim 7 Carbon 13IAP7-82U9005FGE | |
| R Benchmark 2.5 / Overall mean | |
| Samsung Galaxy Book2 Pro 13 NP930XED-KA1DE | |
| Media della classe Subnotebook (0.4024 - 1.456, n=57, ultimi 2 anni) | |
| Asus Zenbook S 13 OLED | |
| Dell XPS 13 Plus 9320 i7-1280P OLED | |
| Media Intel Core i7-1355U (0.4481 - 0.832, n=18) | |
| Lenovo Yoga Slim 7 Carbon 13IAP7-82U9005FGE | |
| Asus ZenBook S13 OLED UX5304 | |
* ... Meglio usare valori piccoli
AIDA64: FP32 Ray-Trace | FPU Julia | CPU SHA3 | CPU Queen | FPU SinJulia | FPU Mandel | CPU AES | CPU ZLib | FP64 Ray-Trace | CPU PhotoWorxx
| Performance rating | |
| Asus Zenbook S 13 OLED | |
| Media della classe Subnotebook | |
| Dell XPS 13 Plus 9320 i7-1280P OLED | |
| Media Intel Core i7-1355U | |
| Lenovo Yoga Slim 7 Carbon 13IAP7-82U9005FGE | |
| Asus ZenBook S13 OLED UX5304 | |
| Samsung Galaxy Book2 Pro 13 NP930XED-KA1DE | |
| AIDA64 / FP32 Ray-Trace | |
| Media della classe Subnotebook (1135 - 32888, n=57, ultimi 2 anni) | |
| Asus Zenbook S 13 OLED | |
| Dell XPS 13 Plus 9320 i7-1280P OLED | |
| Media Intel Core i7-1355U (5673 - 8424, n=18) | |
| Asus ZenBook S13 OLED UX5304 | |
| Lenovo Yoga Slim 7 Carbon 13IAP7-82U9005FGE | |
| Samsung Galaxy Book2 Pro 13 NP930XED-KA1DE | |
| AIDA64 / FPU Julia | |
| Asus Zenbook S 13 OLED | |
| Media della classe Subnotebook (5218 - 123315, n=57, ultimi 2 anni) | |
| Dell XPS 13 Plus 9320 i7-1280P OLED | |
| Media Intel Core i7-1355U (29580 - 42706, n=18) | |
| Asus ZenBook S13 OLED UX5304 | |
| Lenovo Yoga Slim 7 Carbon 13IAP7-82U9005FGE | |
| Samsung Galaxy Book2 Pro 13 NP930XED-KA1DE | |
| AIDA64 / CPU SHA3 | |
| Media della classe Subnotebook (444 - 5287, n=57, ultimi 2 anni) | |
| Dell XPS 13 Plus 9320 i7-1280P OLED | |
| Asus Zenbook S 13 OLED | |
| Media Intel Core i7-1355U (1529 - 2200, n=18) | |
| Lenovo Yoga Slim 7 Carbon 13IAP7-82U9005FGE | |
| Asus ZenBook S13 OLED UX5304 | |
| Samsung Galaxy Book2 Pro 13 NP930XED-KA1DE | |
| AIDA64 / CPU Queen | |
| Dell XPS 13 Plus 9320 i7-1280P OLED | |
| Asus Zenbook S 13 OLED | |
| Lenovo Yoga Slim 7 Carbon 13IAP7-82U9005FGE | |
| Asus ZenBook S13 OLED UX5304 | |
| Media Intel Core i7-1355U (21547 - 66907, n=18) | |
| Media della classe Subnotebook (10579 - 95002, n=50, ultimi 2 anni) | |
| Samsung Galaxy Book2 Pro 13 NP930XED-KA1DE | |
| AIDA64 / FPU SinJulia | |
| Asus Zenbook S 13 OLED | |
| Dell XPS 13 Plus 9320 i7-1280P OLED | |
| Media della classe Subnotebook (744 - 18418, n=57, ultimi 2 anni) | |
| Lenovo Yoga Slim 7 Carbon 13IAP7-82U9005FGE | |
| Media Intel Core i7-1355U (4045 - 5426, n=18) | |
| Asus ZenBook S13 OLED UX5304 | |
| Samsung Galaxy Book2 Pro 13 NP930XED-KA1DE | |
| AIDA64 / FPU Mandel | |
| Asus Zenbook S 13 OLED | |
| Media della classe Subnotebook (3341 - 65433, n=57, ultimi 2 anni) | |
| Dell XPS 13 Plus 9320 i7-1280P OLED | |
| Media Intel Core i7-1355U (14596 - 21627, n=18) | |
| Asus ZenBook S13 OLED UX5304 | |
| Lenovo Yoga Slim 7 Carbon 13IAP7-82U9005FGE | |
| Samsung Galaxy Book2 Pro 13 NP930XED-KA1DE | |
| AIDA64 / CPU AES | |
| Asus Zenbook S 13 OLED | |
| Dell XPS 13 Plus 9320 i7-1280P OLED | |
| Media della classe Subnotebook (638 - 96917, n=57, ultimi 2 anni) | |
| Media Intel Core i7-1355U (31432 - 75408, n=18) | |
| Lenovo Yoga Slim 7 Carbon 13IAP7-82U9005FGE | |
| Asus ZenBook S13 OLED UX5304 | |
| Samsung Galaxy Book2 Pro 13 NP930XED-KA1DE | |
| AIDA64 / CPU ZLib | |
| Media della classe Subnotebook (164.9 - 1379, n=57, ultimi 2 anni) | |
| Dell XPS 13 Plus 9320 i7-1280P OLED | |
| Asus Zenbook S 13 OLED | |
| Lenovo Yoga Slim 7 Carbon 13IAP7-82U9005FGE | |
| Media Intel Core i7-1355U (454 - 684, n=18) | |
| Asus ZenBook S13 OLED UX5304 | |
| Samsung Galaxy Book2 Pro 13 NP930XED-KA1DE | |
| AIDA64 / FP64 Ray-Trace | |
| Media della classe Subnotebook (610 - 17495, n=57, ultimi 2 anni) | |
| Dell XPS 13 Plus 9320 i7-1280P OLED | |
| Asus Zenbook S 13 OLED | |
| Media Intel Core i7-1355U (2991 - 4453, n=18) | |
| Asus ZenBook S13 OLED UX5304 | |
| Lenovo Yoga Slim 7 Carbon 13IAP7-82U9005FGE | |
| Samsung Galaxy Book2 Pro 13 NP930XED-KA1DE | |
| AIDA64 / CPU PhotoWorxx | |
| Dell XPS 13 Plus 9320 i7-1280P OLED | |
| Media della classe Subnotebook (6569 - 85600, n=57, ultimi 2 anni) | |
| Asus ZenBook S13 OLED UX5304 | |
| Media Intel Core i7-1355U (21800 - 46154, n=18) | |
| Lenovo Yoga Slim 7 Carbon 13IAP7-82U9005FGE | |
| Samsung Galaxy Book2 Pro 13 NP930XED-KA1DE | |
| Asus Zenbook S 13 OLED | |
Prestazioni del sistema
Le prestazioni soggettive del nuovo Zenbook S 13 sono molto buone e tutti gli input vengono eseguiti senza ritardi evidenti. I risultati nei benchmark sintetici sono nella media e in alcune parti rimangono addirittura inferiori a quelli del predecessore. Tuttavia, nella pratica non si nota nulla di tutto ciò.
CrossMark: Overall | Productivity | Creativity | Responsiveness
| PCMark 10 / Score | |
| Media della classe Subnotebook (4920 - 9939, n=44, ultimi 2 anni) | |
| Asus Zenbook S 13 OLED | |
| Media Intel Core i7-1355U, Intel Iris Xe Graphics G7 96EUs (5455 - 5933, n=15) | |
| Dell XPS 13 Plus 9320 i7-1280P OLED | |
| Lenovo Yoga Slim 7 Carbon 13IAP7-82U9005FGE | |
| Asus ZenBook S13 OLED UX5304 | |
| Samsung Galaxy Book2 Pro 13 NP930XED-KA1DE | |
| PCMark 10 / Essentials | |
| Media Intel Core i7-1355U, Intel Iris Xe Graphics G7 96EUs (10203 - 11822, n=15) | |
| Asus Zenbook S 13 OLED | |
| Asus ZenBook S13 OLED UX5304 | |
| Lenovo Yoga Slim 7 Carbon 13IAP7-82U9005FGE | |
| Dell XPS 13 Plus 9320 i7-1280P OLED | |
| Media della classe Subnotebook (8552 - 11646, n=44, ultimi 2 anni) | |
| Samsung Galaxy Book2 Pro 13 NP930XED-KA1DE | |
| PCMark 10 / Productivity | |
| Media della classe Subnotebook (5435 - 16606, n=44, ultimi 2 anni) | |
| Asus Zenbook S 13 OLED | |
| Media Intel Core i7-1355U, Intel Iris Xe Graphics G7 96EUs (6763 - 7536, n=15) | |
| Asus ZenBook S13 OLED UX5304 | |
| Dell XPS 13 Plus 9320 i7-1280P OLED | |
| Lenovo Yoga Slim 7 Carbon 13IAP7-82U9005FGE | |
| Samsung Galaxy Book2 Pro 13 NP930XED-KA1DE | |
| PCMark 10 / Digital Content Creation | |
| Media della classe Subnotebook (5722 - 13779, n=44, ultimi 2 anni) | |
| Asus Zenbook S 13 OLED | |
| Dell XPS 13 Plus 9320 i7-1280P OLED | |
| Lenovo Yoga Slim 7 Carbon 13IAP7-82U9005FGE | |
| Media Intel Core i7-1355U, Intel Iris Xe Graphics G7 96EUs (5723 - 6712, n=15) | |
| Asus ZenBook S13 OLED UX5304 | |
| Samsung Galaxy Book2 Pro 13 NP930XED-KA1DE | |
| CrossMark / Overall | |
| Dell XPS 13 Plus 9320 i7-1280P OLED | |
| Media della classe Subnotebook (365 - 2356, n=59, ultimi 2 anni) | |
| Lenovo Yoga Slim 7 Carbon 13IAP7-82U9005FGE | |
| Asus ZenBook S13 OLED UX5304 | |
| Media Intel Core i7-1355U, Intel Iris Xe Graphics G7 96EUs (1478 - 1643, n=15) | |
| Apple MacBook Air M2 10C GPU | |
| Asus Zenbook S 13 OLED | |
| CrossMark / Productivity | |
| Dell XPS 13 Plus 9320 i7-1280P OLED | |
| Asus ZenBook S13 OLED UX5304 | |
| Media della classe Subnotebook (364 - 2277, n=59, ultimi 2 anni) | |
| Media Intel Core i7-1355U, Intel Iris Xe Graphics G7 96EUs (1444 - 1665, n=15) | |
| Lenovo Yoga Slim 7 Carbon 13IAP7-82U9005FGE | |
| Asus Zenbook S 13 OLED | |
| Apple MacBook Air M2 10C GPU | |
| CrossMark / Creativity | |
| Dell XPS 13 Plus 9320 i7-1280P OLED | |
| Media della classe Subnotebook (372 - 2743, n=59, ultimi 2 anni) | |
| Apple MacBook Air M2 10C GPU | |
| Lenovo Yoga Slim 7 Carbon 13IAP7-82U9005FGE | |
| Asus ZenBook S13 OLED UX5304 | |
| Media Intel Core i7-1355U, Intel Iris Xe Graphics G7 96EUs (1563 - 1732, n=15) | |
| Asus Zenbook S 13 OLED | |
| CrossMark / Responsiveness | |
| Dell XPS 13 Plus 9320 i7-1280P OLED | |
| Asus ZenBook S13 OLED UX5304 | |
| Media Intel Core i7-1355U, Intel Iris Xe Graphics G7 96EUs (1217 - 1681, n=15) | |
| Media della classe Subnotebook (312 - 1854, n=59, ultimi 2 anni) | |
| Lenovo Yoga Slim 7 Carbon 13IAP7-82U9005FGE | |
| Asus Zenbook S 13 OLED | |
| Apple MacBook Air M2 10C GPU | |
| PCMark 10 Score | 5576 punti | |
Aiuto | ||
| AIDA64 / Memory Copy | |
| Media della classe Subnotebook (14554 - 131023, n=57, ultimi 2 anni) | |
| Dell XPS 13 Plus 9320 i7-1280P OLED | |
| Asus ZenBook S13 OLED UX5304 | |
| Lenovo Yoga Slim 7 Carbon 13IAP7-82U9005FGE | |
| Media Intel Core i7-1355U (35017 - 71600, n=18) | |
| Samsung Galaxy Book2 Pro 13 NP930XED-KA1DE | |
| Asus Zenbook S 13 OLED | |
| AIDA64 / Memory Read | |
| Media della classe Subnotebook (15948 - 127174, n=57, ultimi 2 anni) | |
| Dell XPS 13 Plus 9320 i7-1280P OLED | |
| Lenovo Yoga Slim 7 Carbon 13IAP7-82U9005FGE | |
| Samsung Galaxy Book2 Pro 13 NP930XED-KA1DE | |
| Media Intel Core i7-1355U (38551 - 73377, n=18) | |
| Asus ZenBook S13 OLED UX5304 | |
| Asus Zenbook S 13 OLED | |
| AIDA64 / Memory Write | |
| Media della classe Subnotebook (15709 - 135141, n=57, ultimi 2 anni) | |
| Asus ZenBook S13 OLED UX5304 | |
| Media Intel Core i7-1355U (35910 - 93342, n=18) | |
| Dell XPS 13 Plus 9320 i7-1280P OLED | |
| Lenovo Yoga Slim 7 Carbon 13IAP7-82U9005FGE | |
| Samsung Galaxy Book2 Pro 13 NP930XED-KA1DE | |
| Asus Zenbook S 13 OLED | |
| AIDA64 / Memory Latency | |
| Asus Zenbook S 13 OLED | |
| Lenovo Yoga Slim 7 Carbon 13IAP7-82U9005FGE | |
| Media Intel Core i7-1355U (72.2 - 346, n=18) | |
| Dell XPS 13 Plus 9320 i7-1280P OLED | |
| Media della classe Subnotebook (6.1 - 159.9, n=55, ultimi 2 anni) | |
| Asus ZenBook S13 OLED UX5304 | |
* ... Meglio usare valori piccoli
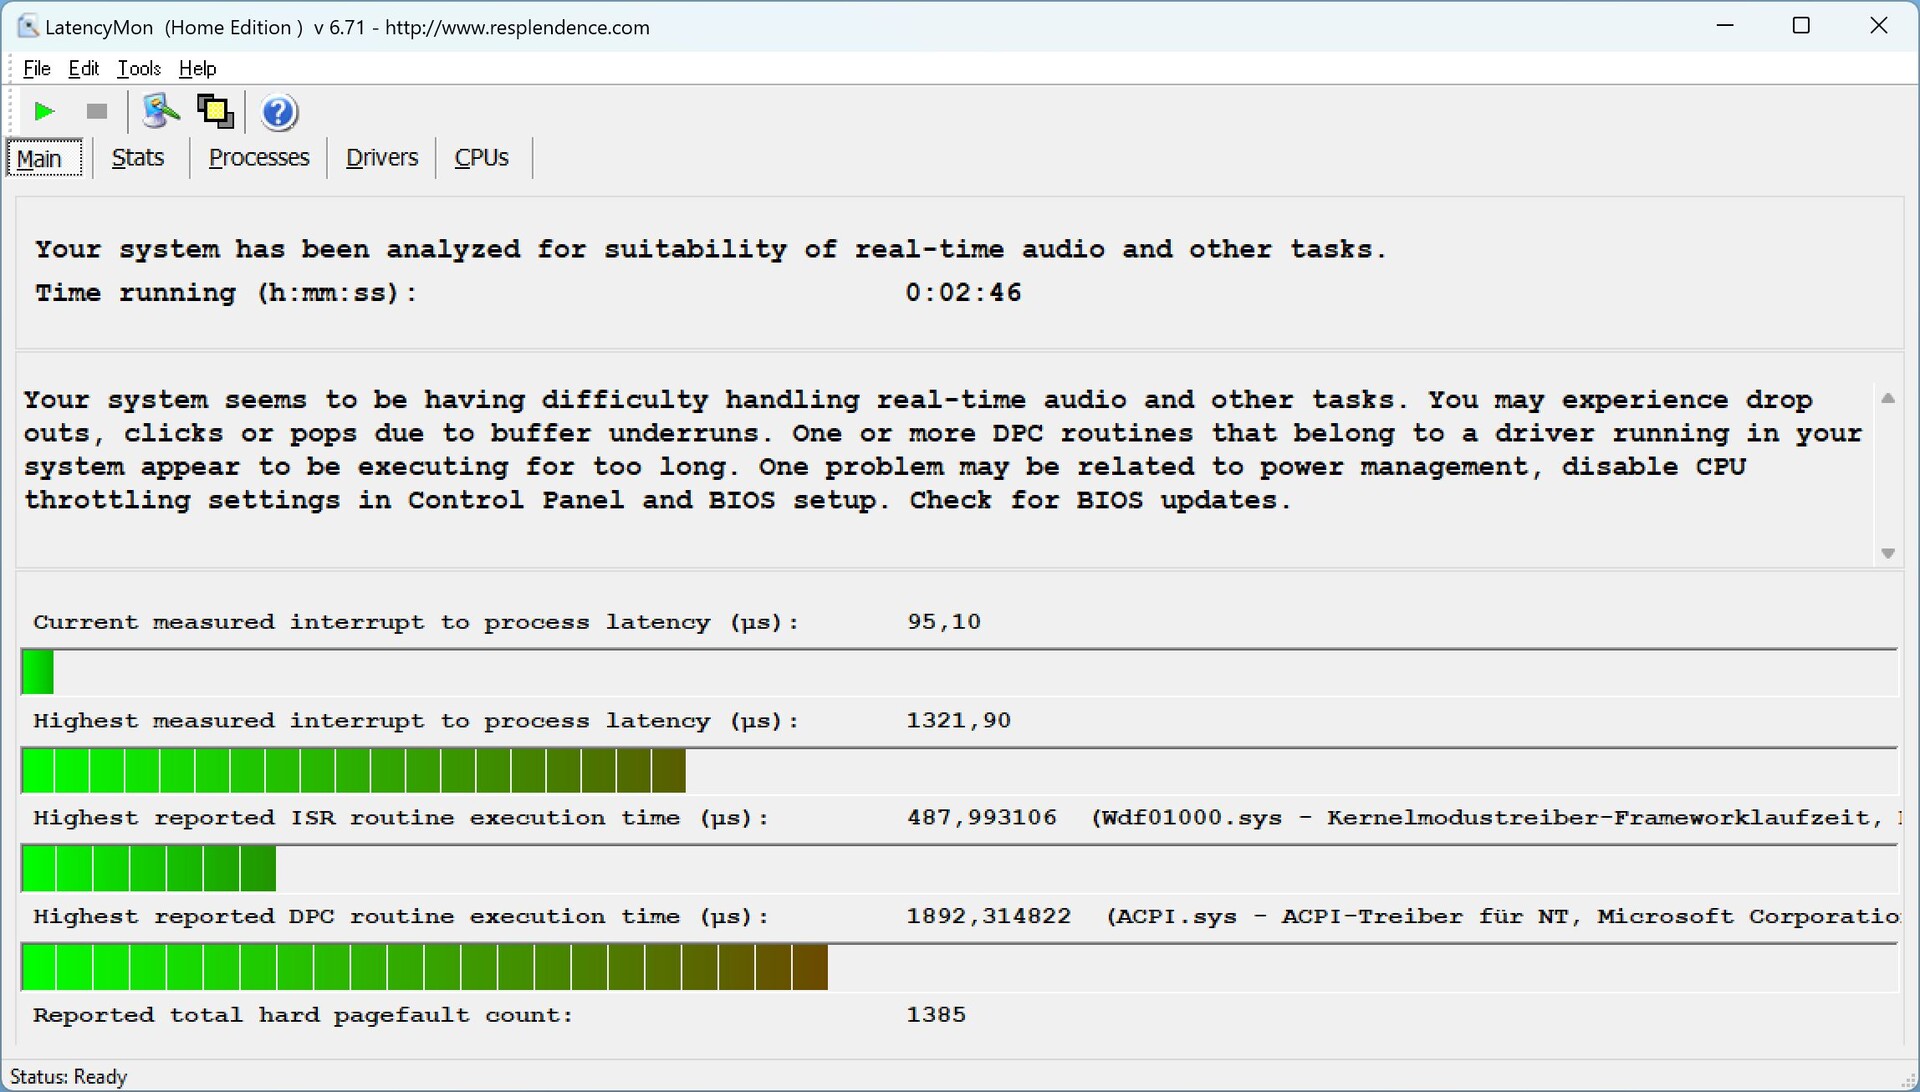
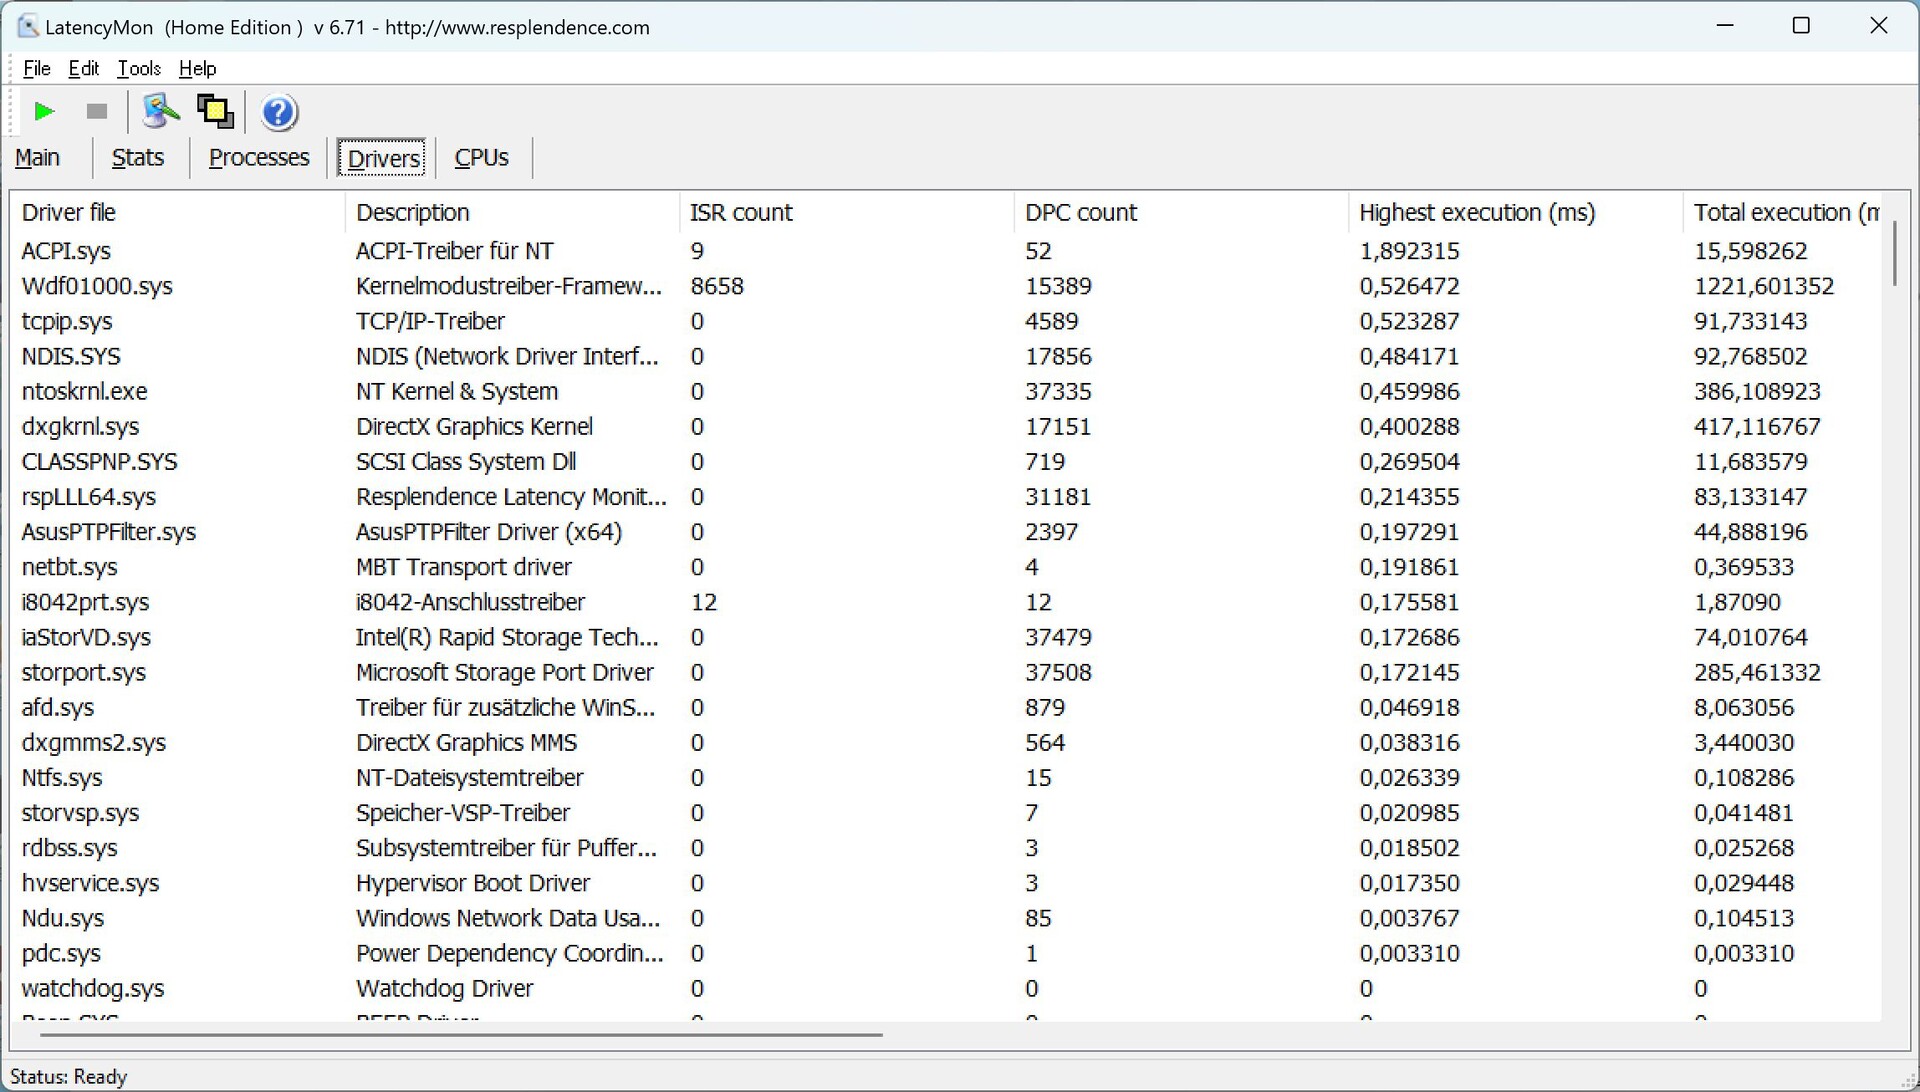
Latenze DPC
Nel nostro test di latenza standardizzato (con navigazione in Internet, riproduzione di video YouTube in 4K e carico della CPU), la nostra unità di test con la versione del BIOS corrispondente mostra alcune lievi limitazioni e non è quindi incondizionatamente adatta all'utilizzo di applicazioni in tempo reale.
| DPC Latencies / LatencyMon - interrupt to process latency (max), Web, Youtube, Prime95 | |
| Samsung Galaxy Book2 Pro 13 NP930XED-KA1DE | |
| Asus ZenBook S13 OLED UX5304 | |
| Lenovo Yoga Slim 7 Carbon 13IAP7-82U9005FGE | |
| Asus Zenbook S 13 OLED | |
| Dell XPS 13 Plus 9320 i7-1280P OLED | |
* ... Meglio usare valori piccoli
Soluzione di stoccaggio
Asus ha dotato lo Zenbook S 13 di un veloce SSD PCIe 4.0 di Samsung che offre una capacità di archiviazione di 1 TB. Dopo il primo avvio, 903 GB rimangono a disposizione dell'utente per l'archiviazione. Il PM9A1 raggiunge velocità di trasferimento superiori a 7 GB/s, e anche le prestazioni costanti rimangono stabili per lungo tempo, con solo un minimo calo di prestazioni alla fine del nostro test di prestazioni costanti. Considerando il case sottile, si tratta di prestazioni molto buone. Potete trovare altri benchmark sulle unità SSD qui.

* ... Meglio usare valori piccoli
Disk Throttling: DiskSpd Read Loop, Queue Depth 8
Scheda grafica
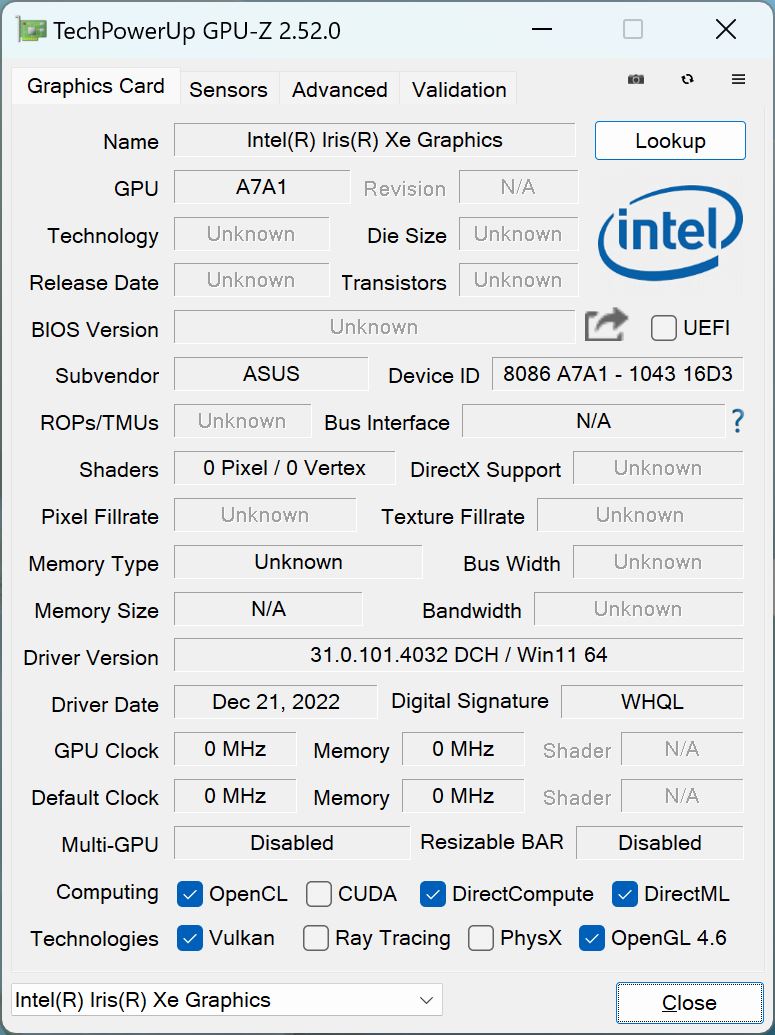
Conosciamo già la grafica integrata Iris Xe Graphics G7di Intel e lo Zenbook utilizza la versione più veloce con 96 EU e una velocità di clock massima di 1.300 MHz. Per le attività di tutti i giorni, compresa la riproduzione di video ad alta risoluzione, la iGPU è sufficiente, ma il problema si rivela nel confronto con laRadeon 680M del predecessore che funziona in media il 36% più velocemente nei nostri test sintetici sulle GPU.
Nei nostri benchmark di gioco, la differenza a risoluzione 1080p e ad alti dettagli è ancora più marcata, e la vecchia Radeon 680M è addirittura più veloce del 56%. Ciò significa che le prestazioni di gioco del nuovo Zenbook S 13 sono significativamente inferiori e, se vi piace giocare, dovrete ridurre notevolmente i dettagli grafici. Ma almeno le prestazioni grafiche rimangono stabili anche durante le sessioni di gioco più lunghe. Tuttavia, le prestazioni sono inferiori del 12% durante il funzionamento a batteria. È possibile trovare altri benchmark della GPU qui.
| 3DMark 06 Standard Score | 25303 punti | |
| 3DMark 11 Performance | 6644 punti | |
| 3DMark Fire Strike Score | 4613 punti | |
| 3DMark Time Spy Score | 1683 punti | |
Aiuto | ||
* ... Meglio usare valori piccoli
| The Witcher 3 - 1920x1080 Ultra Graphics & Postprocessing (HBAO+) | |
| Media della classe Subnotebook (13.9 - 34.6, n=13, ultimi 2 anni) | |
| Asus Zenbook S 13 OLED | |
| Dell XPS 13 Plus 9320 i7-1280P OLED | |
| Lenovo Yoga Slim 7 Carbon 13IAP7-82U9005FGE | |
| Asus ZenBook S13 OLED UX5304 | |
| Samsung Galaxy Book2 Pro 13 NP930XED-KA1DE | |
| Final Fantasy XV Benchmark - 1920x1080 High Quality | |
| Media della classe Subnotebook (11.6 - 54.5, n=53, ultimi 2 anni) | |
| Lenovo Yoga Slim 7 Carbon 13IAP7-82U9005FGE | |
| Asus Zenbook S 13 OLED | |
| Dell XPS 13 Plus 9320 i7-1280P OLED | |
| Asus ZenBook S13 OLED UX5304 | |
| Strange Brigade - 1920x1080 ultra AA:ultra AF:16 | |
| Media della classe Subnotebook (19 - 101.3, n=49, ultimi 2 anni) | |
| Asus Zenbook S 13 OLED | |
| Dell XPS 13 Plus 9320 i7-1280P OLED | |
| Asus ZenBook S13 OLED UX5304 | |
| Lenovo Yoga Slim 7 Carbon 13IAP7-82U9005FGE | |
The Witcher 3 FPS Chart
| basso | medio | alto | ultra | |
|---|---|---|---|---|
| GTA V (2015) | 94.8 | 81 | 22.5 | 9.42 |
| The Witcher 3 (2015) | 79 | 51 | 28 | 12.3 |
| Dota 2 Reborn (2015) | 84.8 | 66.7 | 54.9 | 51.1 |
| Final Fantasy XV Benchmark (2018) | 37.4 | 20.5 | 14.9 | |
| X-Plane 11.11 (2018) | 34.6 | 32.1 | 27.3 | |
| Far Cry 5 (2018) | 42 | 25 | 24 | 22 |
| Strange Brigade (2018) | 88.4 | 37.8 | 29.1 | 23.6 |
| F1 2021 (2021) | 94.8 | 45.6 | 35.2 | 24.9 |
| F1 22 (2022) | 41.6 | 36.6 | 27.6 | 20.7 |
Emissioni - Lo Zenbook soffre di un rumore ad alta frequenza della ventola
Livelli di rumore
Le due piccole ventole rappresentano chiaramente il problema più grande dello Zenbook S 13. Sebbene il livello di rumorosità rimanga sostanzialmente entro i limiti - a patto di non considerare la modalità Performance che produce un massimo di 47,8 dB(A) - il problema è un rumore ad alta frequenza. Guardando il grafico sottostante, si potrebbe pensare che la modalità Whisper potrebbe essere la scelta migliore, ma il rumore ad alta frequenza si sente già chiaramente anche a una bassa velocità della ventola e diventa molto fastidioso. In modalità Standard, una parte del rumore è almeno coperta dal fruscio. Inoltre, le ventole si attivano rapidamente, ad esempio durante la riproduzione di un video di YouTube, peggiorando ulteriormente la situazione. Questo problema rappresenterebbe sicuramente un punto di squalifica per noi.
| Modalità Whisper | Modalità standard | Modalità Performance | |
|---|---|---|---|
| 3DMark 06 | 26 dB(A) | 37,7 dB(A) | 47,8 dB(A) |
| Witcher 3 | 26 dB(A) | 40,1 dB(A) | 47,8 dB(A) |
| Stress test | 26 dB(A) | 40,1 dB(A) | 47,8 dB(A) |
Rumorosità
| Idle |
| 23.3 / 23.3 / 23.3 dB(A) |
| Sotto carico |
| 37.7 / 40.1 dB(A) |
 | ||
30 dB silenzioso 40 dB(A) udibile 50 dB(A) rumoroso |
||
min: | ||
| Asus ZenBook S13 OLED UX5304 Iris Xe G7 96EUs, i7-1355U, Samsung PM9A1 MZVL21T0HCLR | Asus Zenbook S 13 OLED Radeon 680M, R7 6800U, Samsung PM9A1 MZVL21T0HCLR | Lenovo Yoga Slim 7 Carbon 13IAP7-82U9005FGE Iris Xe G7 96EUs, i7-1260P, Samsung PM9A1 MZVL21T0HCLR | Dell XPS 13 Plus 9320 i7-1280P OLED Iris Xe G7 96EUs, i7-1280P, WDC PC SN810 512GB | Samsung Galaxy Book2 Pro 13 NP930XED-KA1DE Iris Xe G7 80EUs, i5-1240P, Samsung PM991a MZVLQ256HBJD | |
|---|---|---|---|---|---|
| Noise | -1% | -6% | 0% | -5% | |
| off /ambiente * (dB) | 23.3 | 24 -3% | 24.2 -4% | 23.4 -0% | 24.6 -6% |
| Idle Minimum * (dB) | 23.3 | 24 -3% | 24.2 -4% | 23.4 -0% | 24.6 -6% |
| Idle Average * (dB) | 23.3 | 24 -3% | 24.2 -4% | 23.4 -0% | 24.6 -6% |
| Idle Maximum * (dB) | 23.3 | 24 -3% | 25.1 -8% | 23.4 -0% | 26.3 -13% |
| Load Average * (dB) | 37.7 | 33.1 12% | 41.9 -11% | 35 7% | 38.4 -2% |
| Witcher 3 ultra * (dB) | 40.1 | 40.2 -0% | 41.9 -4% | 41.6 -4% | |
| Load Maximum * (dB) | 40.1 | 41.7 -4% | 41.9 -4% | 39.9 -0% | 38.7 3% |
* ... Meglio usare valori piccoli
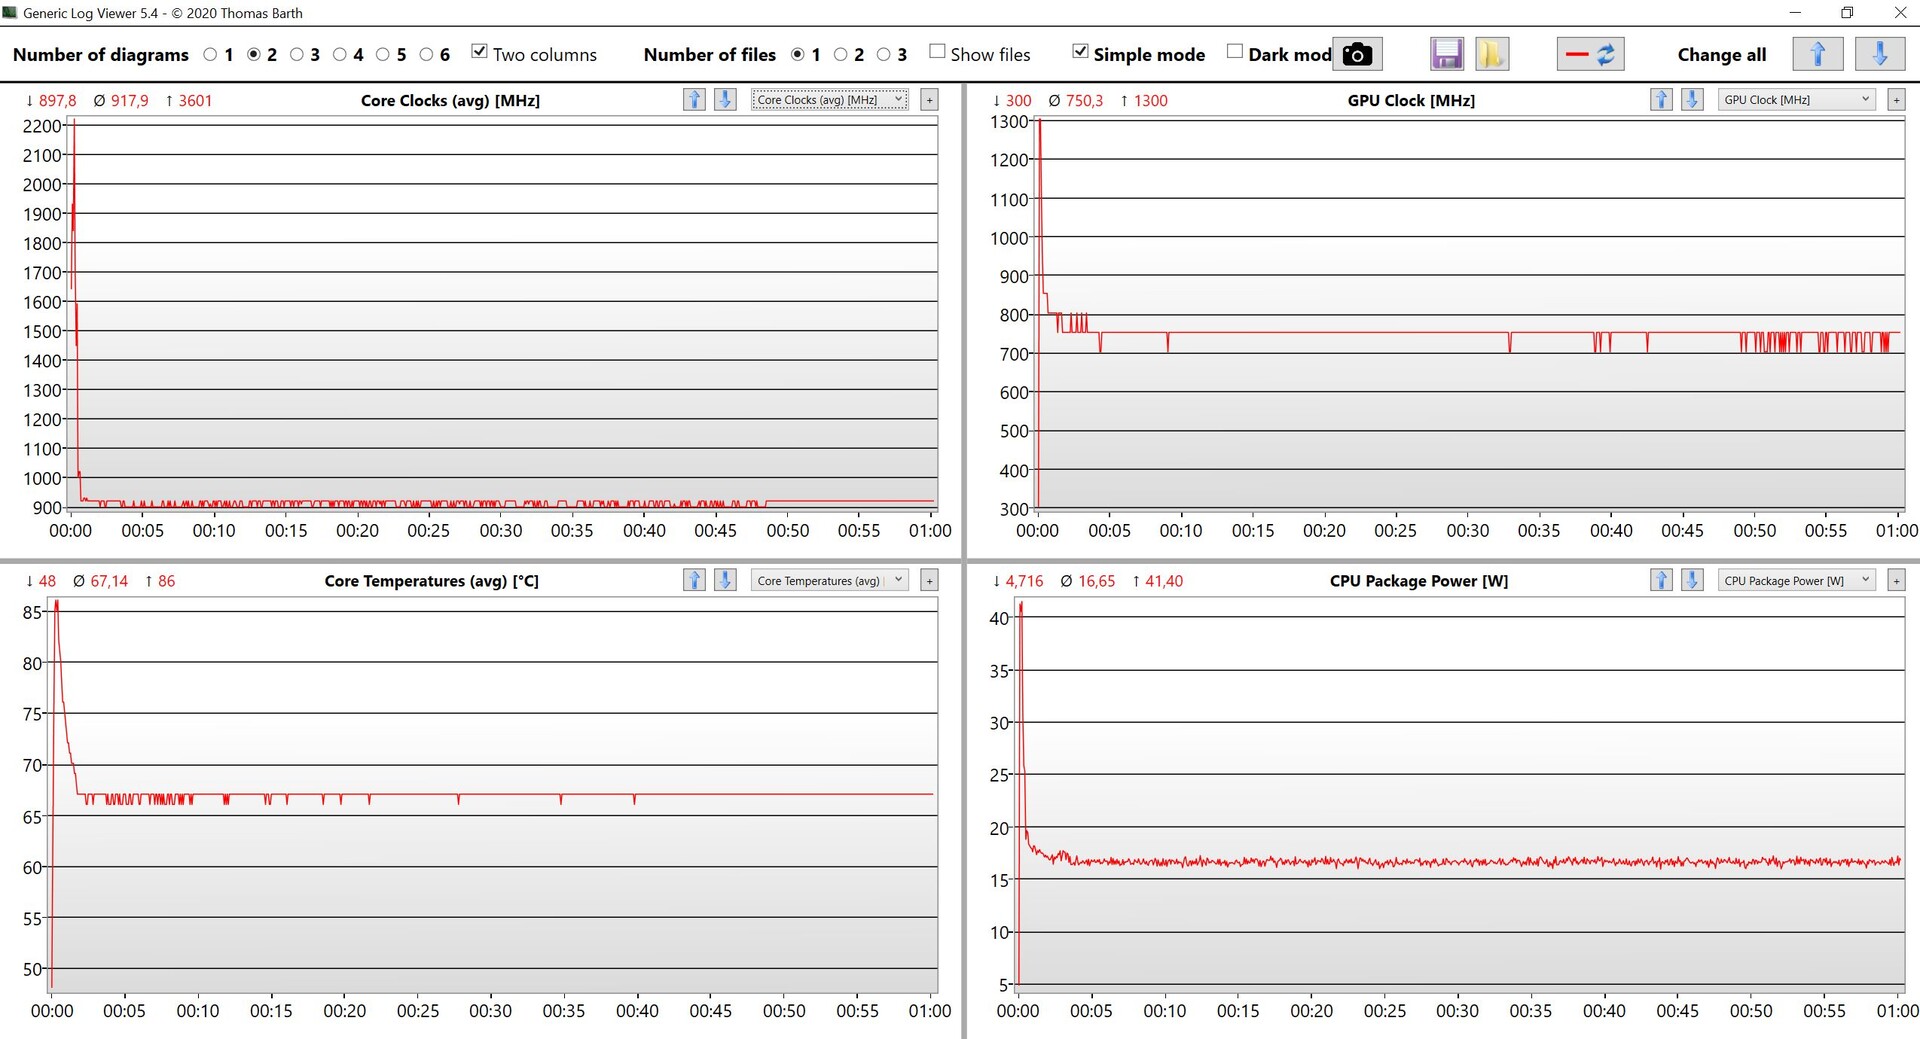
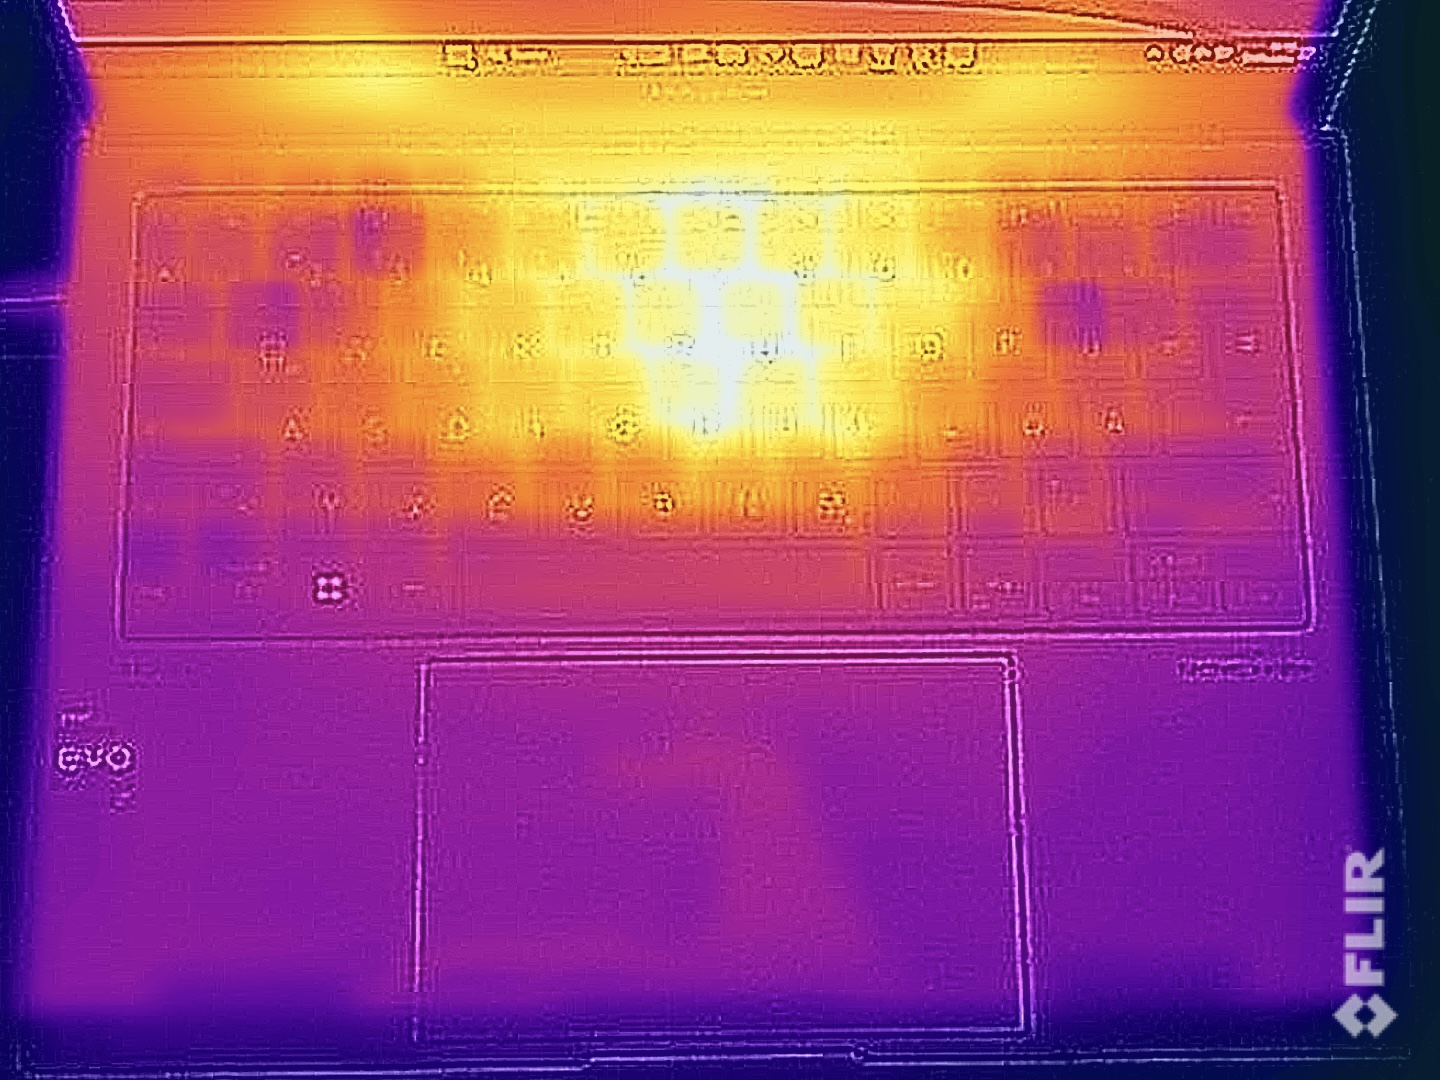
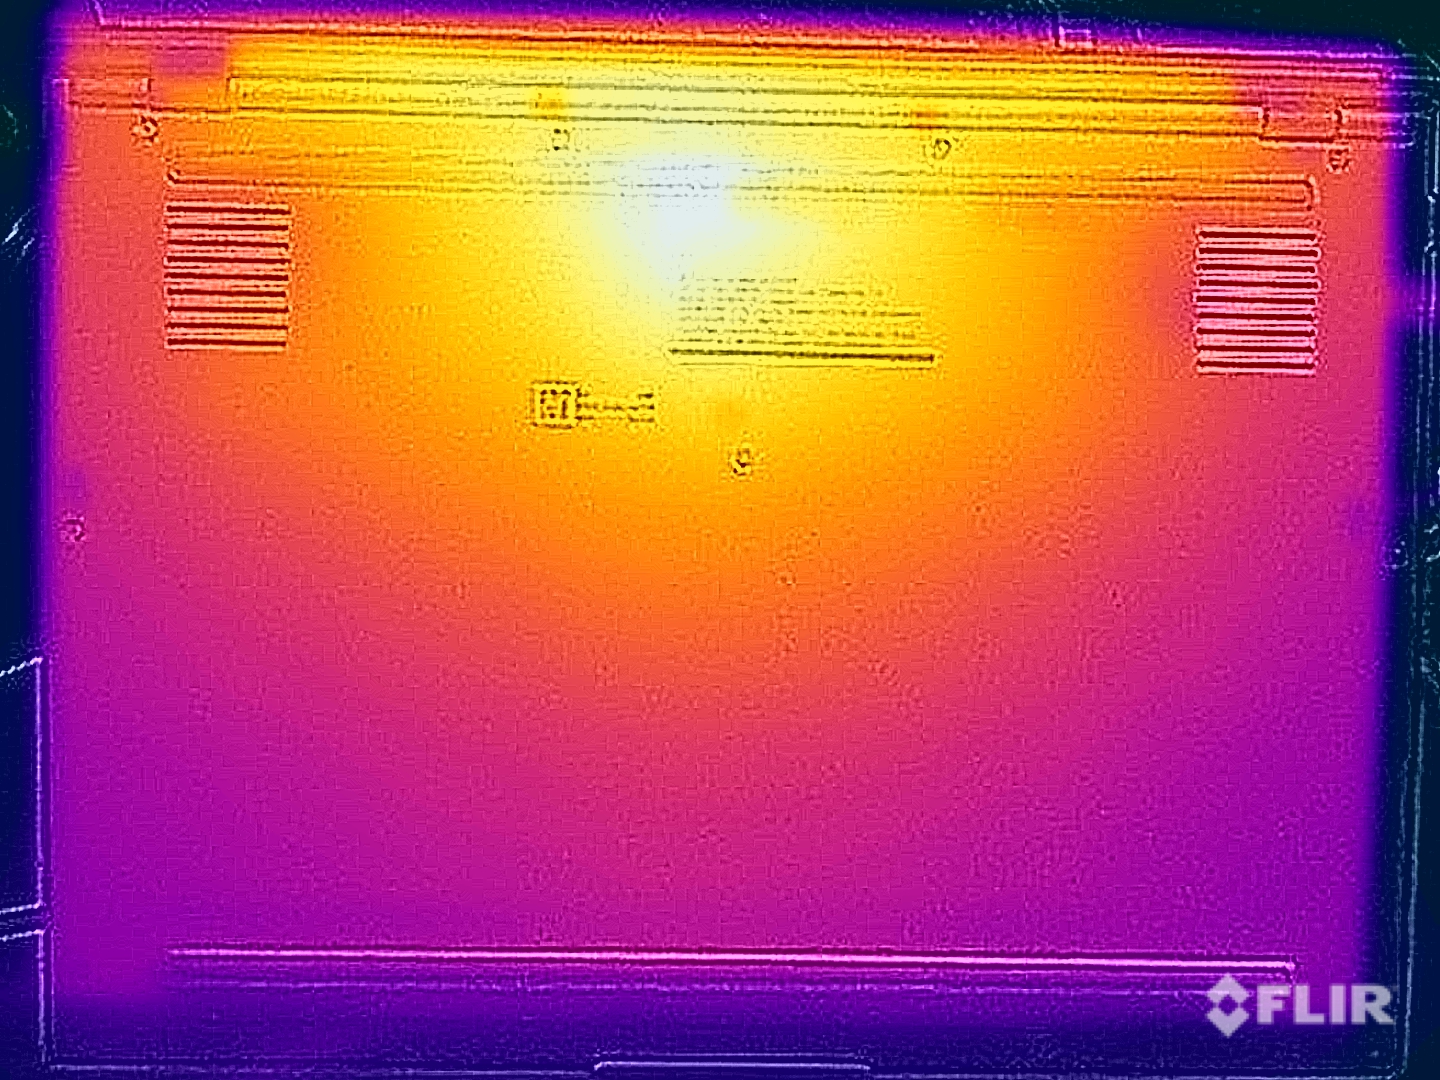
Temperature
Nel funzionamento quotidiano, lo Zenbook rimane molto fresco. Sotto carico, si scalda soprattutto l'area centrale sulla parte superiore dell'unità di base. Tuttavia, è possibile tenere il dispositivo sulle ginocchia senza problemi, poiché l'unità di base è leggermente sollevata. Il calore si fa sentire anche durante la digitazione, ma non crea alcuna limitazione.
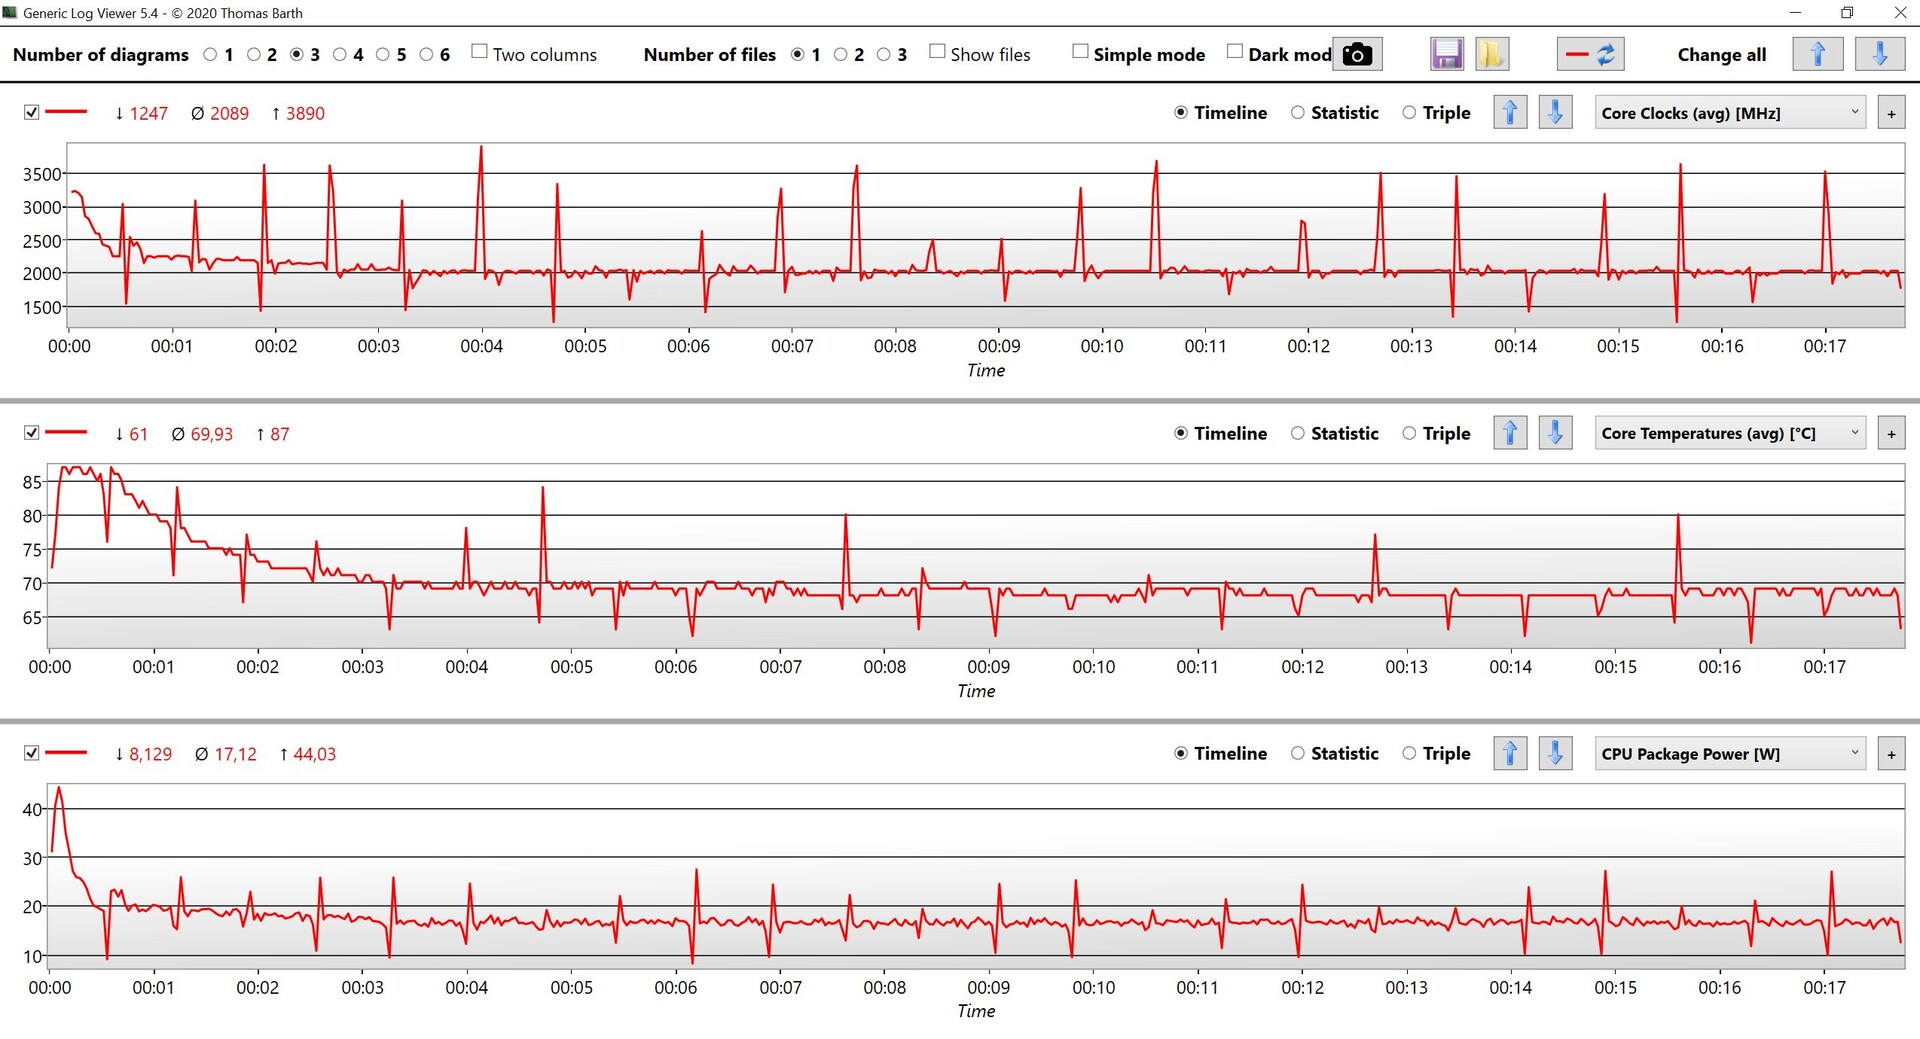
Durante lo stress test, si nota brevemente un consumo di oltre 40 watt, ma già dopo pochi secondi il valore si stabilizza a poco meno di 17 watt, rimanendo poi a questo livello.
(±) La temperatura massima sul lato superiore è di 43.1 °C / 110 F, rispetto alla media di 35.9 °C / 97 F, che varia da 21.4 a 59 °C per questa classe Subnotebook.
(±) Il lato inferiore si riscalda fino ad un massimo di 45 °C / 113 F, rispetto alla media di 39.2 °C / 103 F
(+) In idle, la temperatura media del lato superiore è di 24.6 °C / 76 F, rispetto alla media deld ispositivo di 30.8 °C / 87 F.
(±) Riproducendo The Witcher 3, la temperatura media per il lato superiore e' di 34.8 °C / 95 F, rispetto alla media del dispositivo di 30.8 °C / 87 F.
(+) I poggiapolsi e il touchpad sono piu' freddi della temperatura della pelle con un massimo di 26.1 °C / 79 F e sono quindi freddi al tatto.
(+) La temperatura media della zona del palmo della mano di dispositivi simili e'stata di 28.2 °C / 82.8 F (+2.1 °C / 3.8 F).
| Asus ZenBook S13 OLED UX5304 Intel Core i7-1355U, Intel Iris Xe Graphics G7 96EUs | Asus Zenbook S 13 OLED AMD Ryzen 7 6800U, AMD Radeon 680M | Apple MacBook Air M2 10C GPU Apple M2, Apple M2 10-Core GPU | Lenovo Yoga Slim 7 Carbon 13IAP7-82U9005FGE Intel Core i7-1260P, Intel Iris Xe Graphics G7 96EUs | Samsung Galaxy Book2 Pro 13 NP930XED-KA1DE Intel Core i5-1240P, Intel Iris Xe Graphics G7 80EUs | |
|---|---|---|---|---|---|
| Heat | -8% | 4% | -10% | -9% | |
| Maximum Upper Side * (°C) | 43.1 | 47.9 -11% | 44.7 -4% | 43.9 -2% | 47.9 -11% |
| Maximum Bottom * (°C) | 45 | 56.1 -25% | 44.6 1% | 53.1 -18% | 51.3 -14% |
| Idle Upper Side * (°C) | 27.3 | 26.8 2% | 25.1 8% | 28.7 -5% | 28.5 -4% |
| Idle Bottom * (°C) | 27.8 | 27.3 2% | 25.3 9% | 31.6 -14% | 29.6 -6% |
* ... Meglio usare valori piccoli
Altoparlanti
I due altoparlanti integrati offrono buone prestazioni e possono persino diventare molto forti grazie all'amplificazione software. Ma la differenza rispetto all'attuale MacBook Air M2 è chiaramente percepibile Apple MacBook Air M2in generale. Tuttavia, la qualità è ancora del tutto sufficiente per la musica di sottofondo o i video.
Asus ZenBook S13 OLED UX5304 analisi audio
(+) | gli altoparlanti sono relativamente potenti (83 dB)
Bassi 100 - 315 Hz
(±) | bassi ridotti - in media 14.4% inferiori alla media
(+) | bassi in lineaa (6.6% delta rispetto alla precedente frequenza)
Medi 400 - 2000 Hz
(+) | medi bilanciati - solo only 3.2% rispetto alla media
(+) | medi lineari (4.1% delta rispetto alla precedente frequenza)
Alti 2 - 16 kHz
(+) | Alti bilanciati - appena 2.7% dalla media
(+) | alti lineari (3.5% delta rispetto alla precedente frequenza)
Nel complesso 100 - 16.000 Hz
(+) | suono nel complesso lineare (12.8% differenza dalla media)
Rispetto alla stessa classe
» 19% di tutti i dispositivi testati in questa classe è stato migliore, 4% simile, 77% peggiore
» Il migliore ha avuto un delta di 5%, medio di 18%, peggiore di 53%
Rispetto a tutti i dispositivi testati
» 12% di tutti i dispositivi testati in questa classe è stato migliore, 3% similare, 85% peggiore
» Il migliore ha avuto un delta di 4%, medio di 24%, peggiore di 134%
Apple MacBook Air M2 10C GPU analisi audio
(+) | gli altoparlanti sono relativamente potenti (82.7 dB)
Bassi 100 - 315 Hz
(±) | bassi ridotti - in media 12.2% inferiori alla media
(±) | la linearità dei bassi è media (12.6% delta rispetto alla precedente frequenza)
Medi 400 - 2000 Hz
(+) | medi bilanciati - solo only 1.1% rispetto alla media
(+) | medi lineari (3.1% delta rispetto alla precedente frequenza)
Alti 2 - 16 kHz
(+) | Alti bilanciati - appena 2.4% dalla media
(+) | alti lineari (1.9% delta rispetto alla precedente frequenza)
Nel complesso 100 - 16.000 Hz
(+) | suono nel complesso lineare (9.5% differenza dalla media)
Rispetto alla stessa classe
» 5% di tutti i dispositivi testati in questa classe è stato migliore, 2% simile, 93% peggiore
» Il migliore ha avuto un delta di 5%, medio di 18%, peggiore di 53%
Rispetto a tutti i dispositivi testati
» 4% di tutti i dispositivi testati in questa classe è stato migliore, 1% similare, 95% peggiore
» Il migliore ha avuto un delta di 4%, medio di 24%, peggiore di 134%
Gestione dell'alimentazione - Uno Zenbook di lunga durata
Consumo di energia
Durante il funzionamento al minimo, il nuovo modello è leggermente più efficiente del suo Predecessore AMD. Abbiamo misurato entrambi i modelli con lo stesso sfondo e la modalità Windows scura. Con contenuti d'immagine luminosi, il consumo energetico del pannello OLED aumenta. Ciò accade anche durante la riproduzione di video HDR, dove i valori di picco possono raggiungere più di 20 watt alla massima luminosità.
Durante lo stress test, misuriamo un massimo di quasi 60 watt all'inizio, ma già dopo pochi secondi il consumo si stabilizza intorno ai 30 watt. Il caricabatterie da 65 watt in dotazione è del tutto sufficiente.
| Off / Standby | |
| Idle | |
| Sotto carico |
|
Leggenda:
min: | |
| Asus ZenBook S13 OLED UX5304 i7-1355U, Iris Xe G7 96EUs, Samsung PM9A1 MZVL21T0HCLR, OLED, 2880x1800, 13.3" | Asus Zenbook S 13 OLED R7 6800U, Radeon 680M, Samsung PM9A1 MZVL21T0HCLR, OLED, 2880x1800, 13.3" | Apple MacBook Air M2 10C GPU M2, M2 10-Core GPU, Apple SSD AP1024Z, IPS, 2560x1664, 13.6" | Lenovo Yoga Slim 7 Carbon 13IAP7-82U9005FGE i7-1260P, Iris Xe G7 96EUs, Samsung PM9A1 MZVL21T0HCLR, IPS, 2560x1600, 13.3" | Dell XPS 13 Plus 9320 i7-1280P OLED i7-1280P, Iris Xe G7 96EUs, WDC PC SN810 512GB, OLED, 3456x2160, 13.4" | Samsung Galaxy Book2 Pro 13 NP930XED-KA1DE i5-1240P, Iris Xe G7 80EUs, Samsung PM991a MZVLQ256HBJD, OLED, 1920x1080, 13.3" | Media Intel Iris Xe Graphics G7 96EUs | Media della classe Subnotebook | |
|---|---|---|---|---|---|---|---|---|
| Power Consumption | -11% | 13% | -29% | -33% | 5% | -13% | 7% | |
| Idle Minimum * (Watt) | 5.8 | 4.8 17% | 1.9 67% | 6.9 -19% | 6.5 -12% | 4.3 26% | 5.51 ? 5% | 3.86 ? 33% |
| Idle Average * (Watt) | 8.5 | 8.7 -2% | 9.6 -13% | 10.3 -21% | 7.8 8% | 6 29% | 8.66 ? -2% | 6.61 ? 22% |
| Idle Maximum * (Watt) | 8.8 | 10.1 -15% | 9.7 -10% | 10.9 -24% | 13 -48% | 8.8 -0% | 10.9 ? -24% | 8 ? 9% |
| Load Average * (Watt) | 35.1 | 45.6 -30% | 32.4 8% | 49.2 -40% | 56.6 -61% | 36 -3% | 45.6 ? -30% | 42.2 ? -20% |
| Witcher 3 ultra * (Watt) | 27.6 | 42.4 -54% | 30.8 -12% | 45.3 -64% | 49.2 -78% | 32.9 -19% | ||
| Load Maximum * (Watt) | 59.5 | 49.5 17% | 35.7 40% | 62.5 -5% | 63 -6% | 60 -1% | 67.8 ? -14% | 64.5 ? -8% |
* ... Meglio usare valori piccoli
Power Consumption The Witcher 3 / Stress Test
Power Consumption With External Monitor
Durata della batteria
Con 63 Wh, la capacità della batteria è leggermente inferiore a quella del vecchio modello vecchio modello. Nel nostro test video a 150 cd/m² (corrispondente al 74% della luminosità massima SDR della nostra unità di test), una durata della batteria di quasi 14 ore è ancora un ottimo risultato. Il test WLAN dura più di 11 ore a 150 cd/m² e poco più di 8 ore alla massima luminosità, mentre un video HDR su YouTube dura 4,5 ore alla massima luminosità. Nel complesso, si tratta di risultati molto buoni per il sottile Zenbook.
| Asus ZenBook S13 OLED UX5304 i7-1355U, Iris Xe G7 96EUs, 63 Wh | Asus Zenbook S 13 OLED R7 6800U, Radeon 680M, 67 Wh | Apple MacBook Air M2 10C GPU M2, M2 10-Core GPU, 52.6 Wh | Lenovo Yoga Slim 7 Carbon 13IAP7-82U9005FGE i7-1260P, Iris Xe G7 96EUs, 50.2 Wh | Dell XPS 13 Plus 9320 i7-1280P OLED i7-1280P, Iris Xe G7 96EUs, 55 Wh | Samsung Galaxy Book2 Pro 13 NP930XED-KA1DE i5-1240P, Iris Xe G7 80EUs, 63 Wh | Media della classe Subnotebook | |
|---|---|---|---|---|---|---|---|
| Autonomia della batteria | -3% | 22% | -37% | -49% | -3% | 6% | |
| H.264 (h) | 13.8 | 15.2 10% | 15.8 14% | 10.5 -24% | 11.6 -16% | 15.4 ? 12% | |
| WiFi v1.3 (h) | 11.3 | 9.2 -19% | 14.7 30% | 7.5 -34% | 5.8 -49% | 11.6 3% | 14 ? 24% |
| Load (h) | 2.4 | 2.4 0% | 1.1 -54% | 2.5 4% | 1.969 ? -18% |
Pro
Contro
Verdetto - Tanta luce ma anche un'ombra scura
Il nuovo Zenbook S 13 ci lascia con sentimenti contrastanti, soprattutto perché il modello dell'anno scorso modello dell'anno scorsodell'anno scorso era così buono. Asus ha completamente rielaborato il dispositivo, rendendo il portatile sensibilmente più sottile. Il risultato è anche bello e il case fa un'ottima impressione, soprattutto in termini di stabilità. La nuova superficie in plasma-ceramica è ottima e non presenta problemi di impronte digitali. Inoltre, ora include alcune delle connessioni note, come una porta HDMI e una normale connessione USB-A, il che è un buon risultato in un dispositivo così sottile.
Tuttavia, la corsa dei tasti ha dovuto essere accorciata di 0,3 mm (~0,012 in) per snellire il design. Sebbene la tastiera continui a essere decente, il vecchio Zenbook offriva un'esperienza di digitazione più confortevole. Inoltre, il raffreddamento è ora più debole, e anche se il nuovo Intel Core i7-1355U Raptor Lake offre prestazioni in single-core leggermente superiori, è stato chiaramente superato dall'AMD Ryzen 7 6800U dello scorso anno AMD Ryzen 7 6800U negli scenari multicore e soprattutto in termini di iGPU.
Il display OLED continua a offrire un'ottima qualità d'immagine, raggiungendo una riproduzione dei colori molto accurata già in fase di consegna. Inoltre, Asus è attualmente l'unico produttore che offre una soluzione software per prevenire il dannoso sfarfallio PWM, consentendo l'oscuramento DC anche a basse impostazioni di luminosità.
Il nuovo Asus Zenbook S 13 è diventato significativamente più sottile, ma il nuovo processore Intel offre anche prestazioni complessivamente inferiori rispetto al suo predecessore AMD. Il problema principale è la rumorosità della ventola ad alta frequenza anche a basse velocità.
Il problema principale del nuovo Zenbook è rappresentato dalle ventole che producono un rumore ad alta frequenza anche a bassa velocità. Questo è semplicemente fastidioso, anche durante le attività quotidiane. Per questo motivo abbiamo abbassato la valutazione anche in questa categoria. Sebbene le prestazioni siano buone in molte aree, non possiamo consigliare il nuovo modello per questo motivo. Chi non ha problemi con un dispositivo più spesso di 3 mm (~0,12 in) dovrebbe piuttosto dare un'occhiata allo lo Zenbook S 13 dello scorso annoo aspettare la versione aggiornata 2022 con il nuovo chip Ryzen Zen4.
Prezzo e disponibilità
Il nuovo Zenbook S 13 OLED, ad esempio, è attualmente disponibile su Amazon a 1529 dollari.
Asus ZenBook S13 OLED UX5304
- 04/29/2023 v7 (old)
Andreas Osthoff
Transparency
La selezione dei dispositivi da recensire viene effettuata dalla nostra redazione. Il campione di prova è stato fornito all'autore come prestito dal produttore o dal rivenditore ai fini di questa recensione. L'istituto di credito non ha avuto alcuna influenza su questa recensione, né il produttore ne ha ricevuto una copia prima della pubblicazione. Non vi era alcun obbligo di pubblicare questa recensione. In quanto società mediatica indipendente, Notebookcheck non è soggetta all'autorità di produttori, rivenditori o editori.
Ecco come Notebookcheck esegue i test
Ogni anno, Notebookcheck esamina in modo indipendente centinaia di laptop e smartphone utilizzando procedure standardizzate per garantire che tutti i risultati siano comparabili. Da circa 20 anni sviluppiamo continuamente i nostri metodi di prova e nel frattempo stabiliamo gli standard di settore. Nei nostri laboratori di prova, tecnici ed editori esperti utilizzano apparecchiature di misurazione di alta qualità. Questi test comportano un processo di validazione in più fasi. Il nostro complesso sistema di valutazione si basa su centinaia di misurazioni e parametri di riferimento ben fondati, che mantengono l'obiettività.Price comparison

