Recensione breve dell'Ultrabook Dell Latitude 13 7370
Sfarfallio dello schermo / PWM (Pulse-Width Modulation)
| flickering dello schermo / PWM non rilevato | ||
In confronto: 52 % di tutti i dispositivi testati non utilizza PWM per ridurre la luminosita' del display. Se è rilevato PWM, una media di 7754 (minimo: 5 - massimo: 343500) Hz è stata rilevata. | ||
| |||||||||||||||||||||||||
Distribuzione della luminosità: 85 %
Al centro con la batteria: 261 cd/m²
Contrasto: 1004:1 (Nero: 0.26 cd/m²)
ΔE ColorChecker Calman: 4.3 | ∀{0.5-29.43 Ø4.71}
ΔE Greyscale Calman: 5.82 | ∀{0.09-98 Ø4.96}
77.84% sRGB (Argyll 1.6.3 3D)
49.18% AdobeRGB 1998 (Argyll 1.6.3 3D)
53.9% AdobeRGB 1998 (Argyll 3D)
78.3% sRGB (Argyll 3D)
52.2% Display P3 (Argyll 3D)
Gamma: 2.44
CCT: 6771 K
| Dell Latitude 13 7370 1920x1080, IPS | Lenovo ThinkPad X1 Carbon 20FB003RGE 2560x1440, IPS | HP EliteBook Folio 1040 G3 2560x1440, IPS | Toshiba Portege Z30-C-138 1920x1080, IPS | Apple MacBook 12 (Early 2016) 1.1 GHz 2304x1440, IPS | |
|---|---|---|---|---|---|
| Display | 25% | 28% | 28% | 25% | |
| Display P3 Coverage (%) | 52.2 | 66.7 28% | 67.9 30% | 67.9 30% | 66.8 28% |
| sRGB Coverage (%) | 78.3 | 94.7 21% | 96.8 24% | 98 25% | 95.4 22% |
| AdobeRGB 1998 Coverage (%) | 53.9 | 68.4 27% | 70 30% | 69.8 29% | 68 26% |
| Response Times | 21% | 15% | 17% | 14% | |
| Response Time Grey 50% / Grey 80% * (ms) | 50.4 ? | 44 ? 13% | 46.4 ? 8% | 42 ? 17% | 41.2 ? 18% |
| Response Time Black / White * (ms) | 33.6 ? | 24 ? 29% | 26.4 ? 21% | 28 ? 17% | 30.4 ? 10% |
| PWM Frequency (Hz) | 220 ? | 217 ? | |||
| Screen | 15% | 10% | 3% | 23% | |
| Brightness middle (cd/m²) | 261 | 272 4% | 327 25% | 300 15% | 387 48% |
| Brightness (cd/m²) | 241 | 268 11% | 316 31% | 280 16% | 358 49% |
| Brightness Distribution (%) | 85 | 95 12% | 87 2% | 87 2% | 88 4% |
| Black Level * (cd/m²) | 0.26 | 0.32 -23% | 0.35 -35% | 0.31 -19% | 0.47 -81% |
| Contrast (:1) | 1004 | 850 -15% | 934 -7% | 968 -4% | 823 -18% |
| Colorchecker dE 2000 * | 4.3 | 2.61 39% | 4.39 -2% | 4.9 -14% | 1.6 63% |
| Colorchecker dE 2000 max. * | 8.66 | 6.43 26% | 7.27 16% | 8.91 -3% | 4 54% |
| Greyscale dE 2000 * | 5.82 | 3.31 43% | 4.69 19% | 6.69 -15% | 1 83% |
| Gamma | 2.44 90% | 2.35 94% | 2.15 102% | 2.33 94% | 2.26 97% |
| CCT | 6771 96% | 6360 102% | 7101 92% | 6487 100% | 6680 97% |
| Color Space (Percent of AdobeRGB 1998) (%) | 49.18 | 63 28% | 62.52 27% | 63 28% | 61.6 25% |
| Color Space (Percent of sRGB) (%) | 77.84 | 95 22% | 96.71 24% | 98 26% | 82.2 6% |
| Media totale (Programma / Settaggio) | 20% /
18% | 18% /
14% | 16% /
10% | 21% /
22% |
* ... Meglio usare valori piccoli
Tempi di risposta del Display
| ↔ Tempi di risposta dal Nero al Bianco | ||
|---|---|---|
| 33.6 ms ... aumenta ↗ e diminuisce ↘ combinato | ↗ 13.2 ms Incremento | |
| ↘ 20.4 ms Calo | ||
| Lo schermo mostra tempi di risposta lenti nei nostri tests e sarà insoddisfacente per i gamers. In confronto, tutti i dispositivi di test variano da 0.1 (minimo) a 240 (massimo) ms. » 90 % di tutti i dispositivi è migliore. Questo significa che i tempi di risposta rilevati sono peggiori rispetto alla media di tutti i dispositivi testati (19.8 ms). | ||
| ↔ Tempo di risposta dal 50% Grigio all'80% Grigio | ||
| 50.4 ms ... aumenta ↗ e diminuisce ↘ combinato | ↗ 20.4 ms Incremento | |
| ↘ 30 ms Calo | ||
| Lo schermo mostra tempi di risposta lenti nei nostri tests e sarà insoddisfacente per i gamers. In confronto, tutti i dispositivi di test variano da 0.165 (minimo) a 636 (massimo) ms. » 87 % di tutti i dispositivi è migliore. Questo significa che i tempi di risposta rilevati sono peggiori rispetto alla media di tutti i dispositivi testati (31 ms). | ||
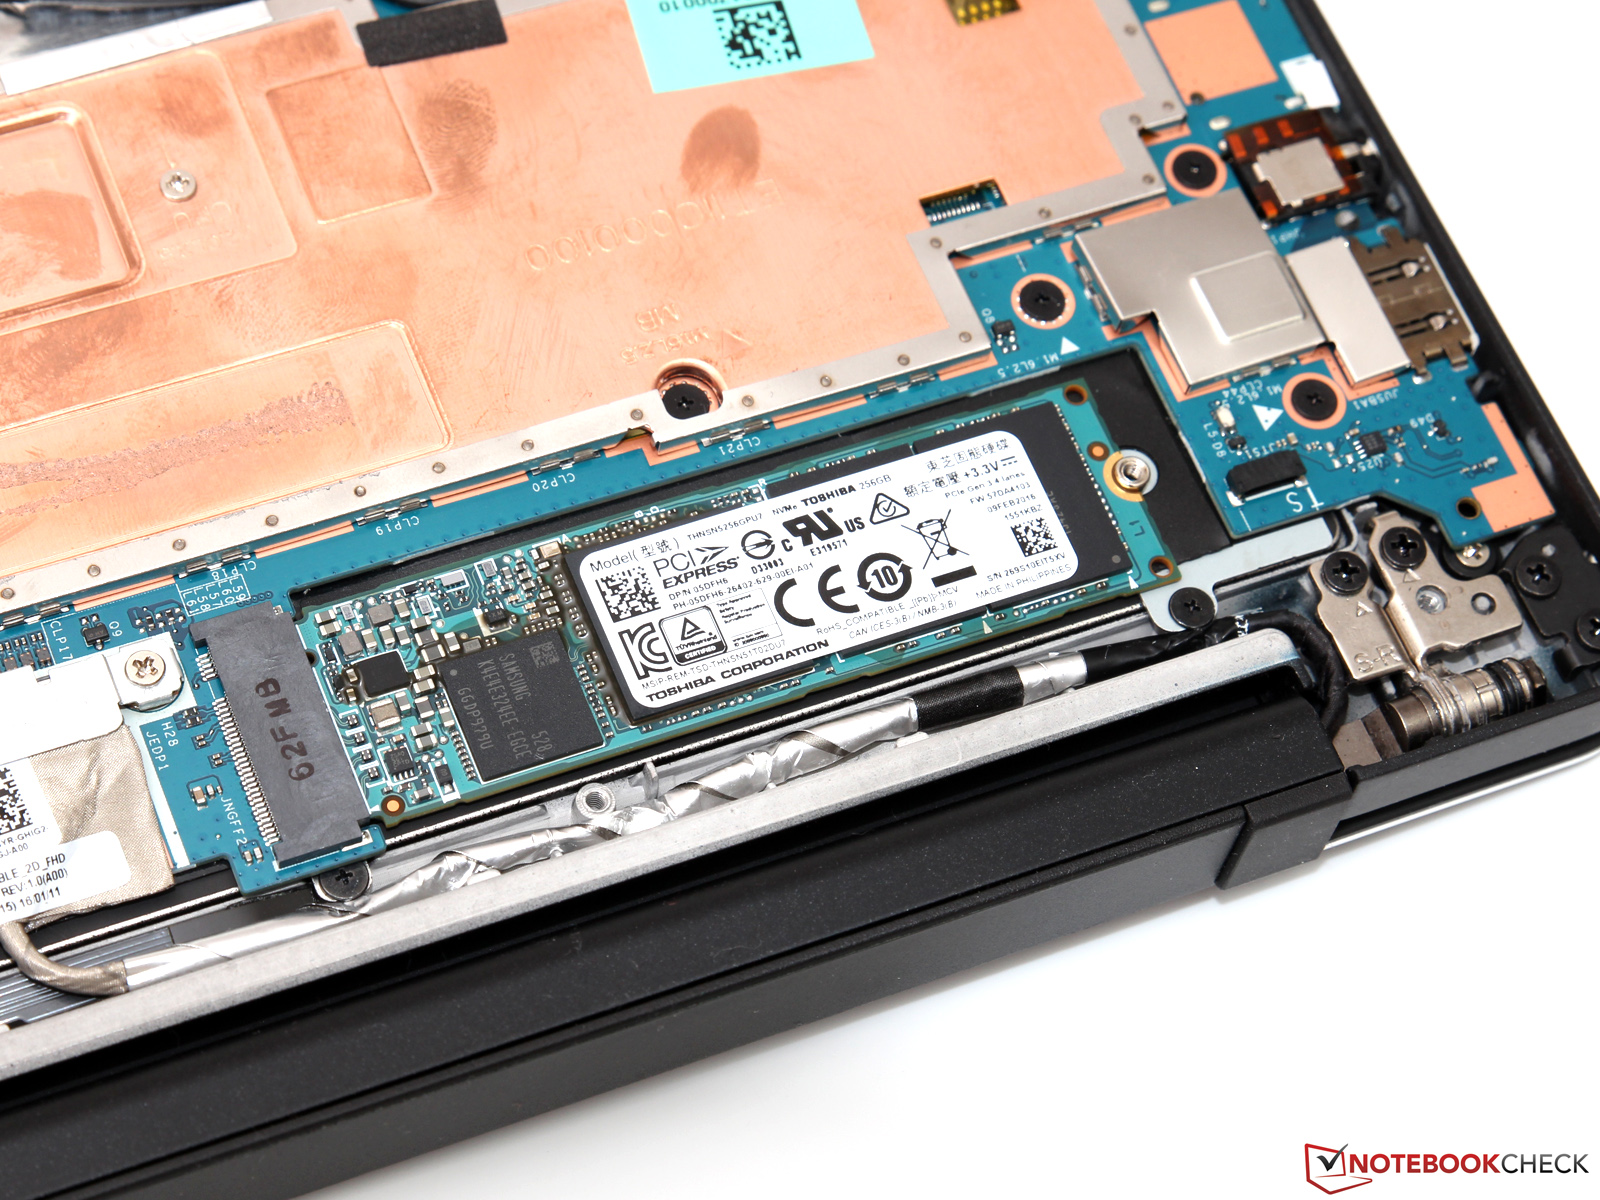
| Dell Latitude 13 7370 Toshiba NVMe THNSN5256GPU7 | Lenovo ThinkPad X1 Carbon 20FB003RGE Samsung SSD PM871 MZNLN256HCHP | HP EliteBook Folio 1040 G3 Samsung SM951 MZVPV256HDGL m.2 PCI-e | Toshiba Portege Z30-C-138 Toshiba HG6 THNSNJ512G8NY | Apple MacBook 12 (Early 2016) 1.1 GHz Apple SSD AP0256 | |
|---|---|---|---|---|---|
| AS SSD | -40% | 75% | -52% | -30% | |
| Seq Read (MB/s) | 1425 | 499.1 -65% | 1839 29% | 494.9 -65% | 1056 -26% |
| Seq Write (MB/s) | 889 | 294 -67% | 1190 34% | 431.9 -51% | 651 -27% |
| 4K Read (MB/s) | 35.72 | 30.43 -15% | 47.72 34% | 16.97 -52% | 16.4 -54% |
| 4K Write (MB/s) | 97.9 | 74.6 -24% | 126.6 29% | 65.6 -33% | 22.1 -77% |
| 4K-64 Read (MB/s) | 450.6 | 370.4 -18% | 1858 312% | 217.9 -52% | 509 13% |
| 4K-64 Write (MB/s) | 347.2 | 253.4 -27% | 344.3 -1% | 147.9 -57% | 283 -18% |
| Copy ISO MB/s (MB/s) | 704 | 236.2 -66% | 1313 87% | 545 -23% |

| PCMark 7 - Score | |
| Lenovo ThinkPad X1 Carbon 20FB003RGE | |
| Microsoft Surface Pro 4, Core m3 | |
| Dell Latitude 13 7370 | |
| PCMark 7 Score | 4165 punti | |
| PCMark 8 Home Score Accelerated v2 | 3048 punti | |
| PCMark 8 Creative Score Accelerated v2 | 3528 punti | |
| PCMark 8 Work Score Accelerated v2 | 4238 punti | |
Aiuto | ||
| 3DMark 06 Standard Score | 6244 punti | |
| 3DMark 11 Performance | 1094 punti | |
| 3DMark Ice Storm Standard Score | 38931 punti | |
| 3DMark Cloud Gate Standard Score | 3481 punti | |
| 3DMark Fire Strike Score | 509 punti | |
Aiuto | ||
| basso | medio | alto | ultra | |
|---|---|---|---|---|
| BioShock Infinite (2013) | 38 | 20.3 | 17.6 | 5.3 |
| Metro: Last Light (2013) | 16.4 | 13.5 | 8.7 | |
| Battlefield 4 (2013) | 24.6 | 18.2 | 12.8 |
(±) La temperatura massima sul lato superiore è di 43.2 °C / 110 F, rispetto alla media di 35.9 °C / 97 F, che varia da 21.4 a 59 °C per questa classe Subnotebook.
(-) Il lato inferiore si riscalda fino ad un massimo di 50.8 °C / 123 F, rispetto alla media di 39.2 °C / 103 F
(+) In idle, la temperatura media del lato superiore è di 28.3 °C / 83 F, rispetto alla media deld ispositivo di 30.8 °C / 87 F.
(+) I poggiapolsi e il touchpad sono piu' freddi della temperatura della pelle con un massimo di 29.8 °C / 85.6 F e sono quindi freddi al tatto.
(±) La temperatura media della zona del palmo della mano di dispositivi simili e'stata di 28.2 °C / 82.8 F (-1.6 °C / -2.8 F).
| Off / Standby | |
| Idle | |
| Sotto carico |
|
Leggenda:
min: | |
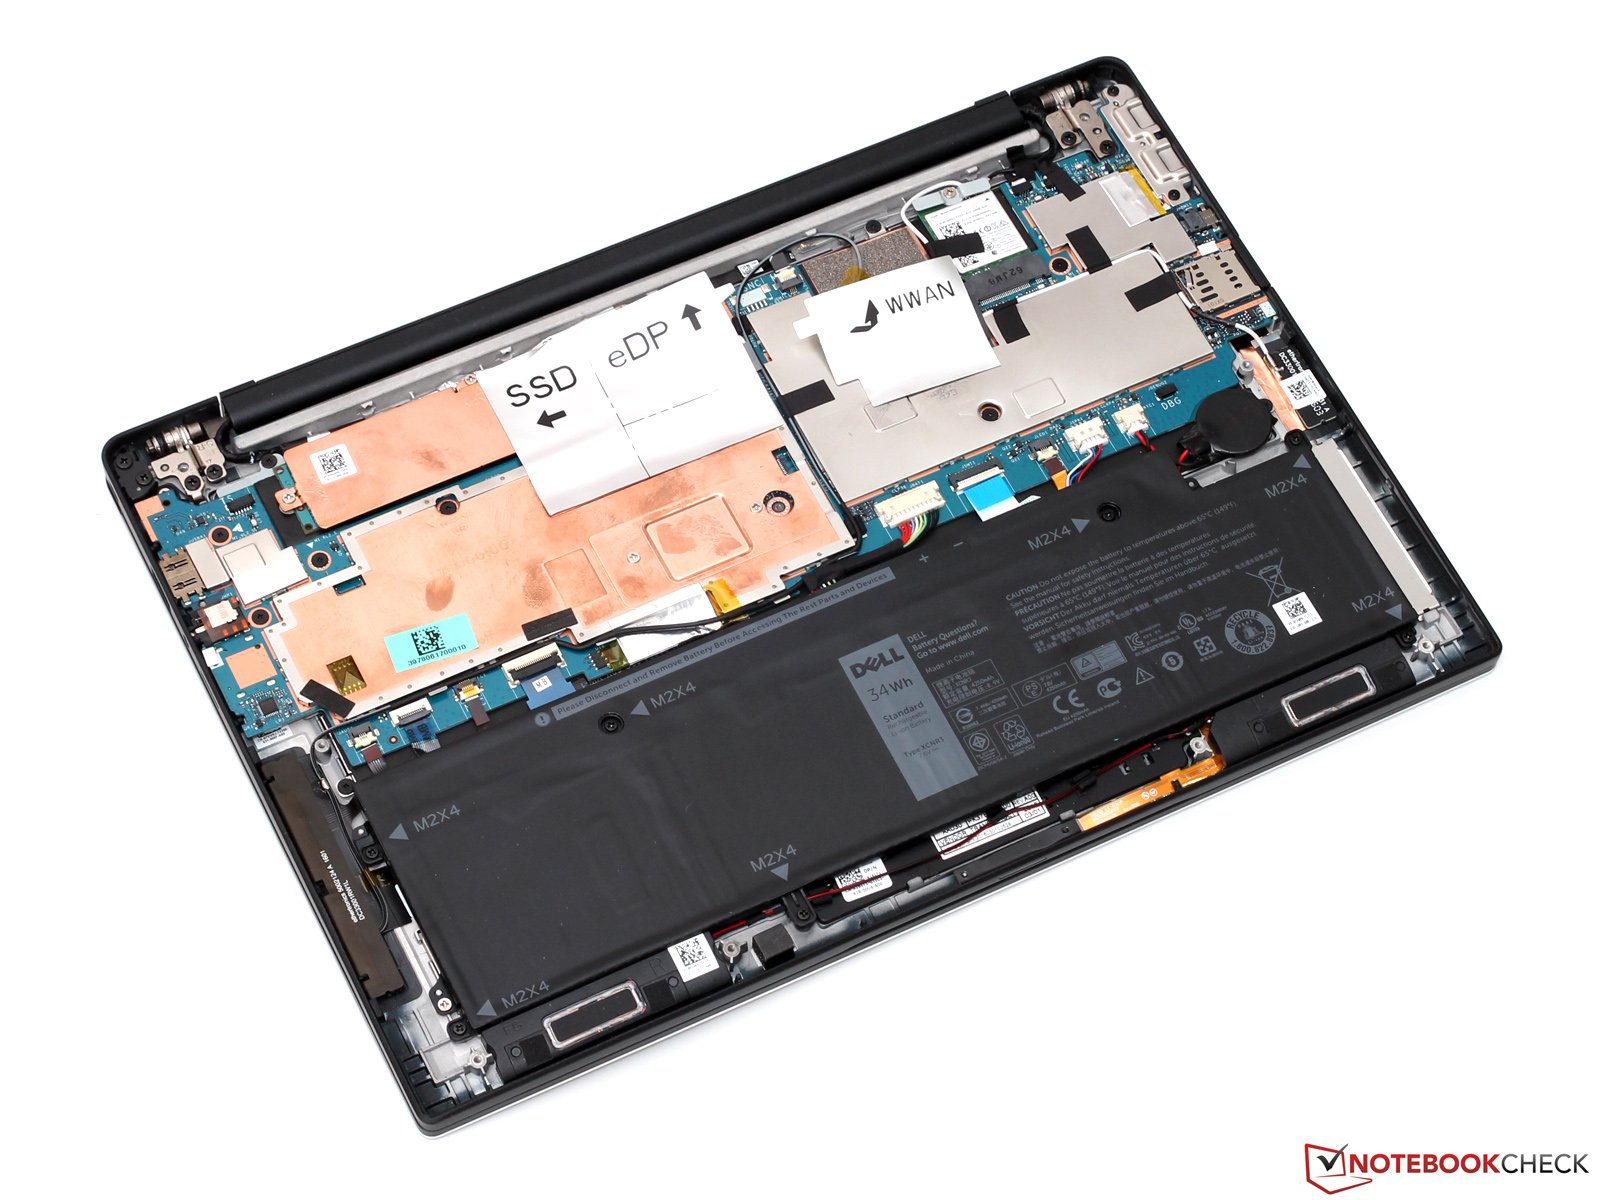
| Dell Latitude 13 7370 34 Wh | Lenovo ThinkPad X1 Carbon 20FB003RGE 52 Wh | HP EliteBook Folio 1040 G3 45.6 Wh | Toshiba Portege Z30-C-138 52 Wh | Apple MacBook 12 (Early 2016) 1.1 GHz 41.4 Wh | |
|---|---|---|---|---|---|
| Autonomia della batteria | 19% | -15% | -5% | 34% | |
| Reader / Idle (h) | 9.8 | 15.7 60% | 8.8 -10% | ||
| H.264 (h) | 6.5 | 8.5 31% | 5.7 -12% | 8.5 31% | |
| WiFi v1.3 (h) | 6.1 | 7.2 18% | 5.2 -15% | 5.8 -5% | 8.4 38% |
| Load (h) | 2.9 | 1.9 -34% | 2.2 -24% | 3.9 34% |
Pro
Contro
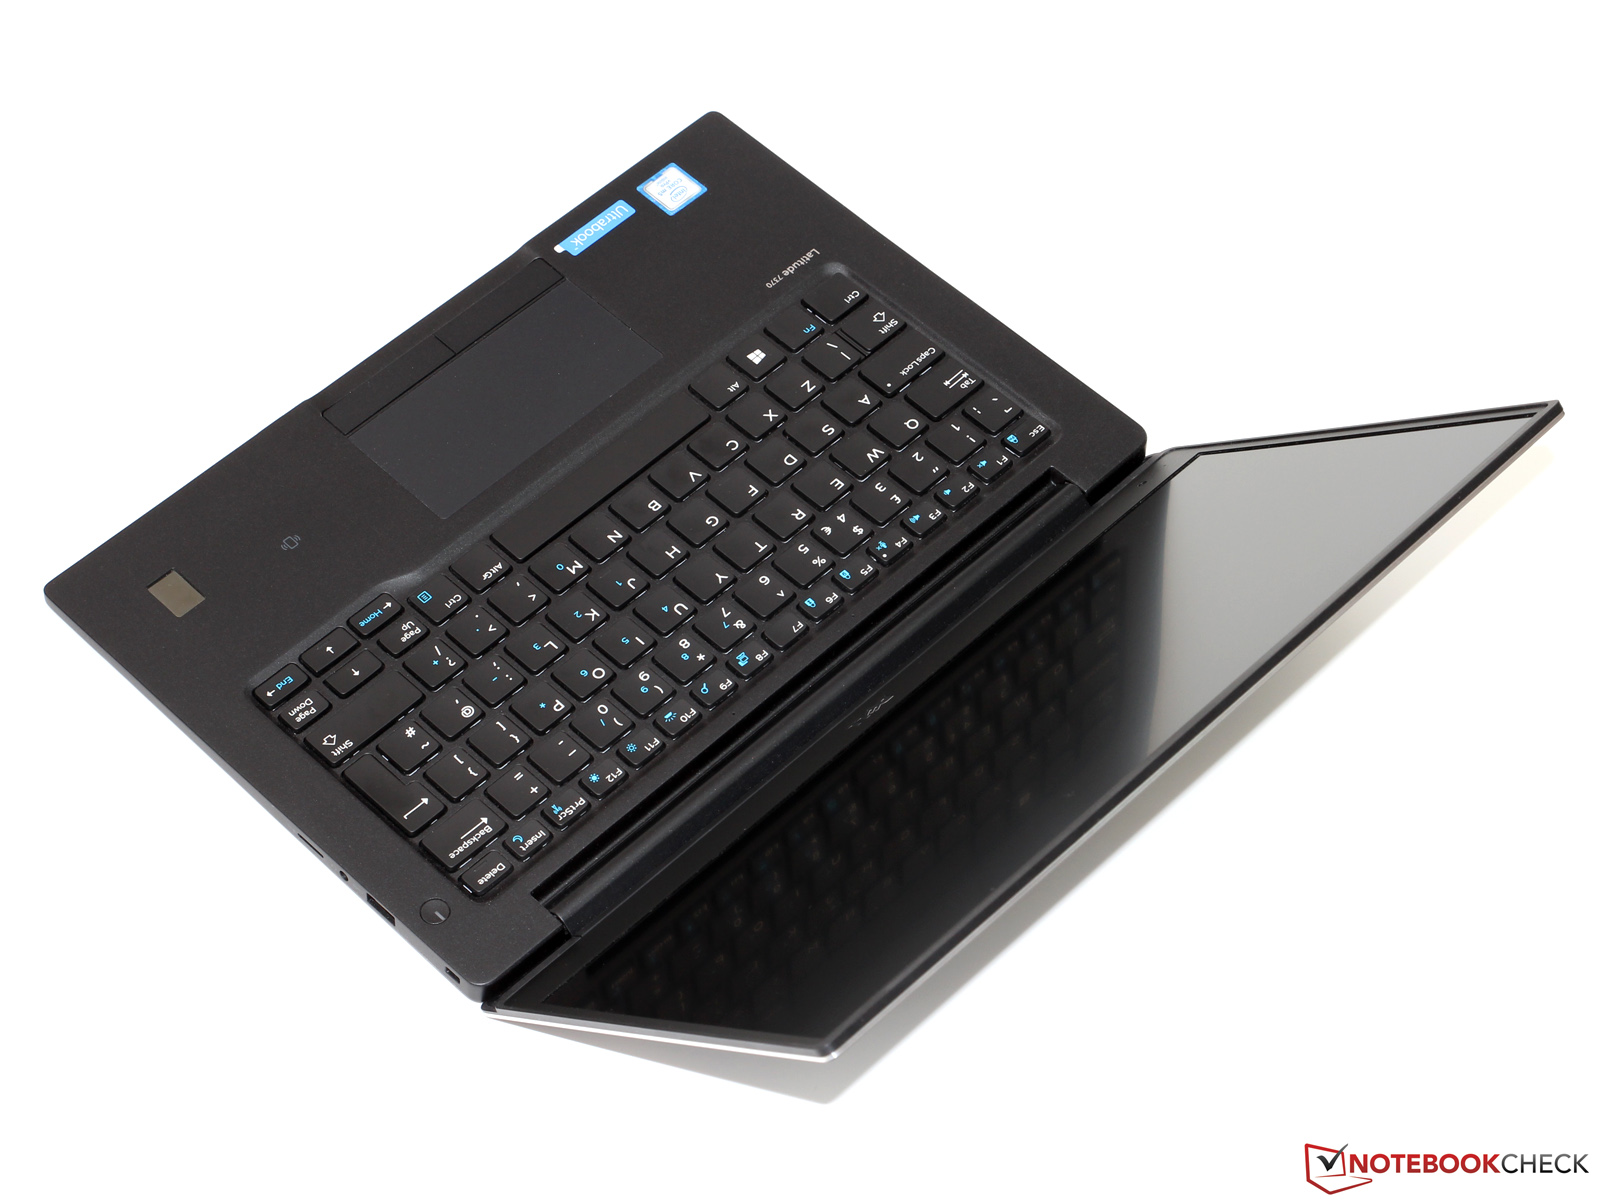
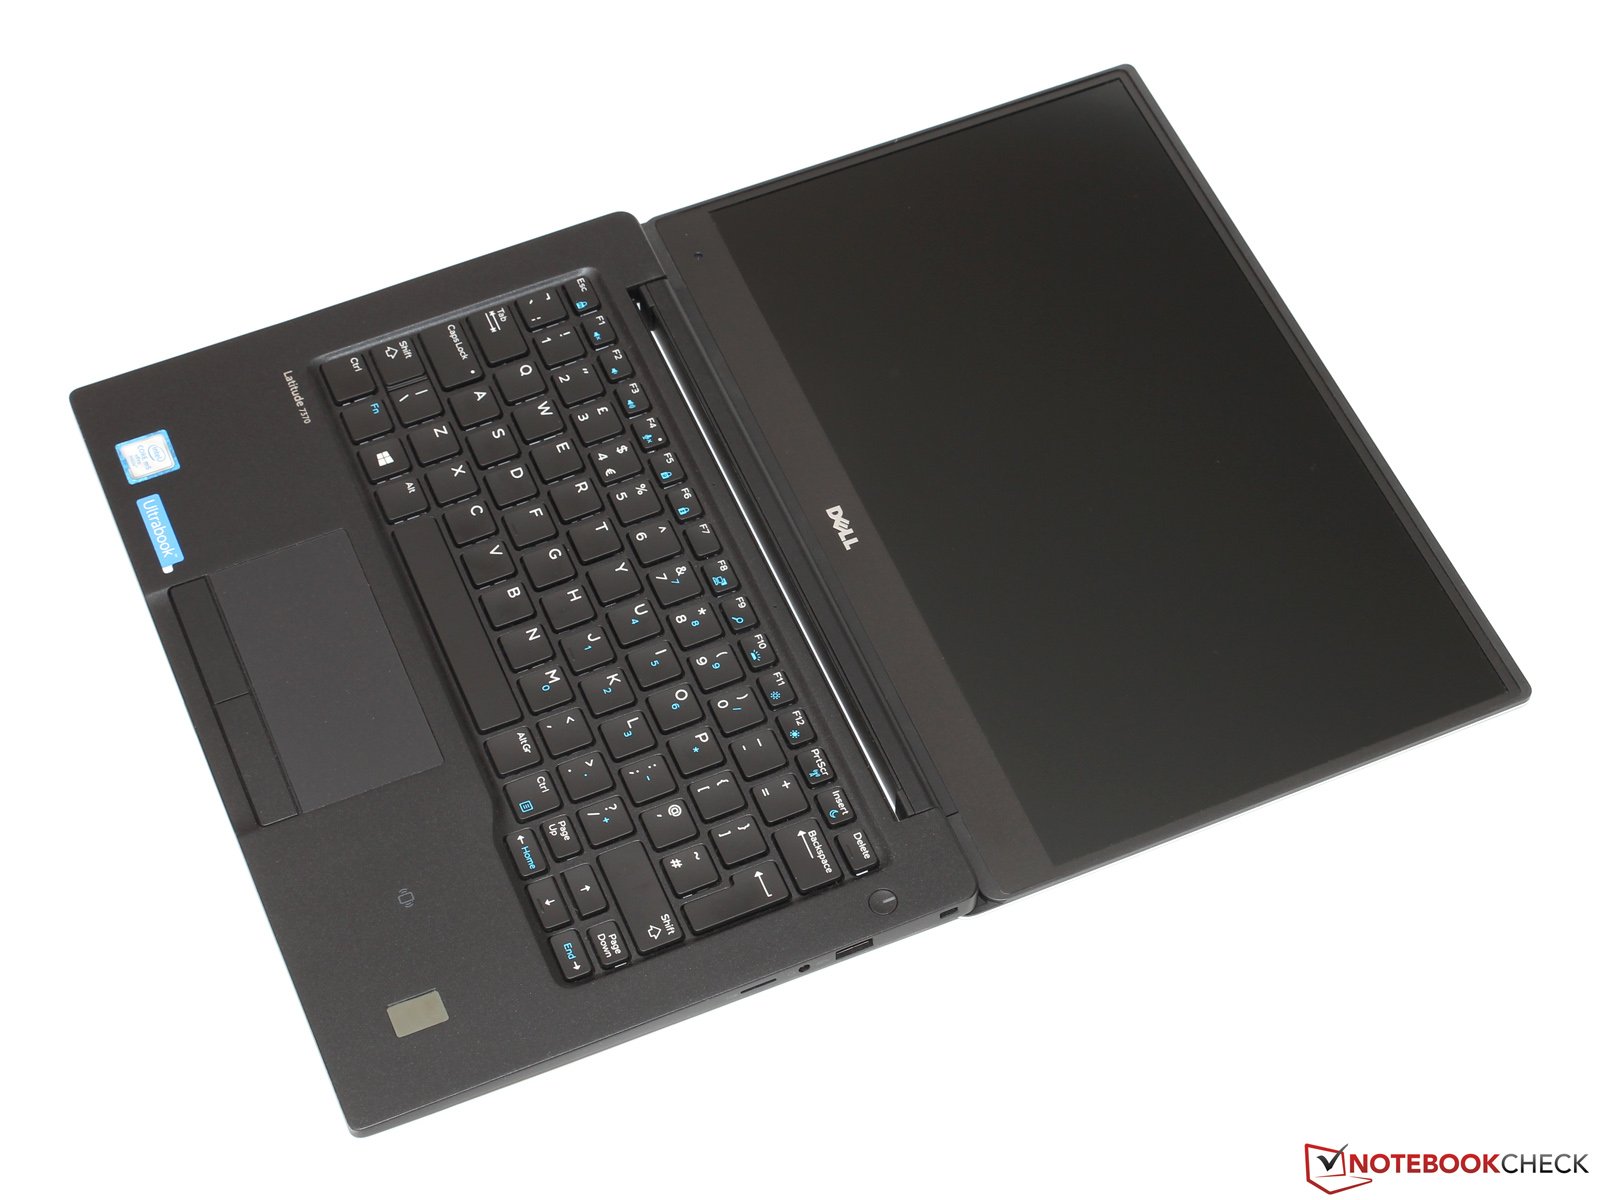
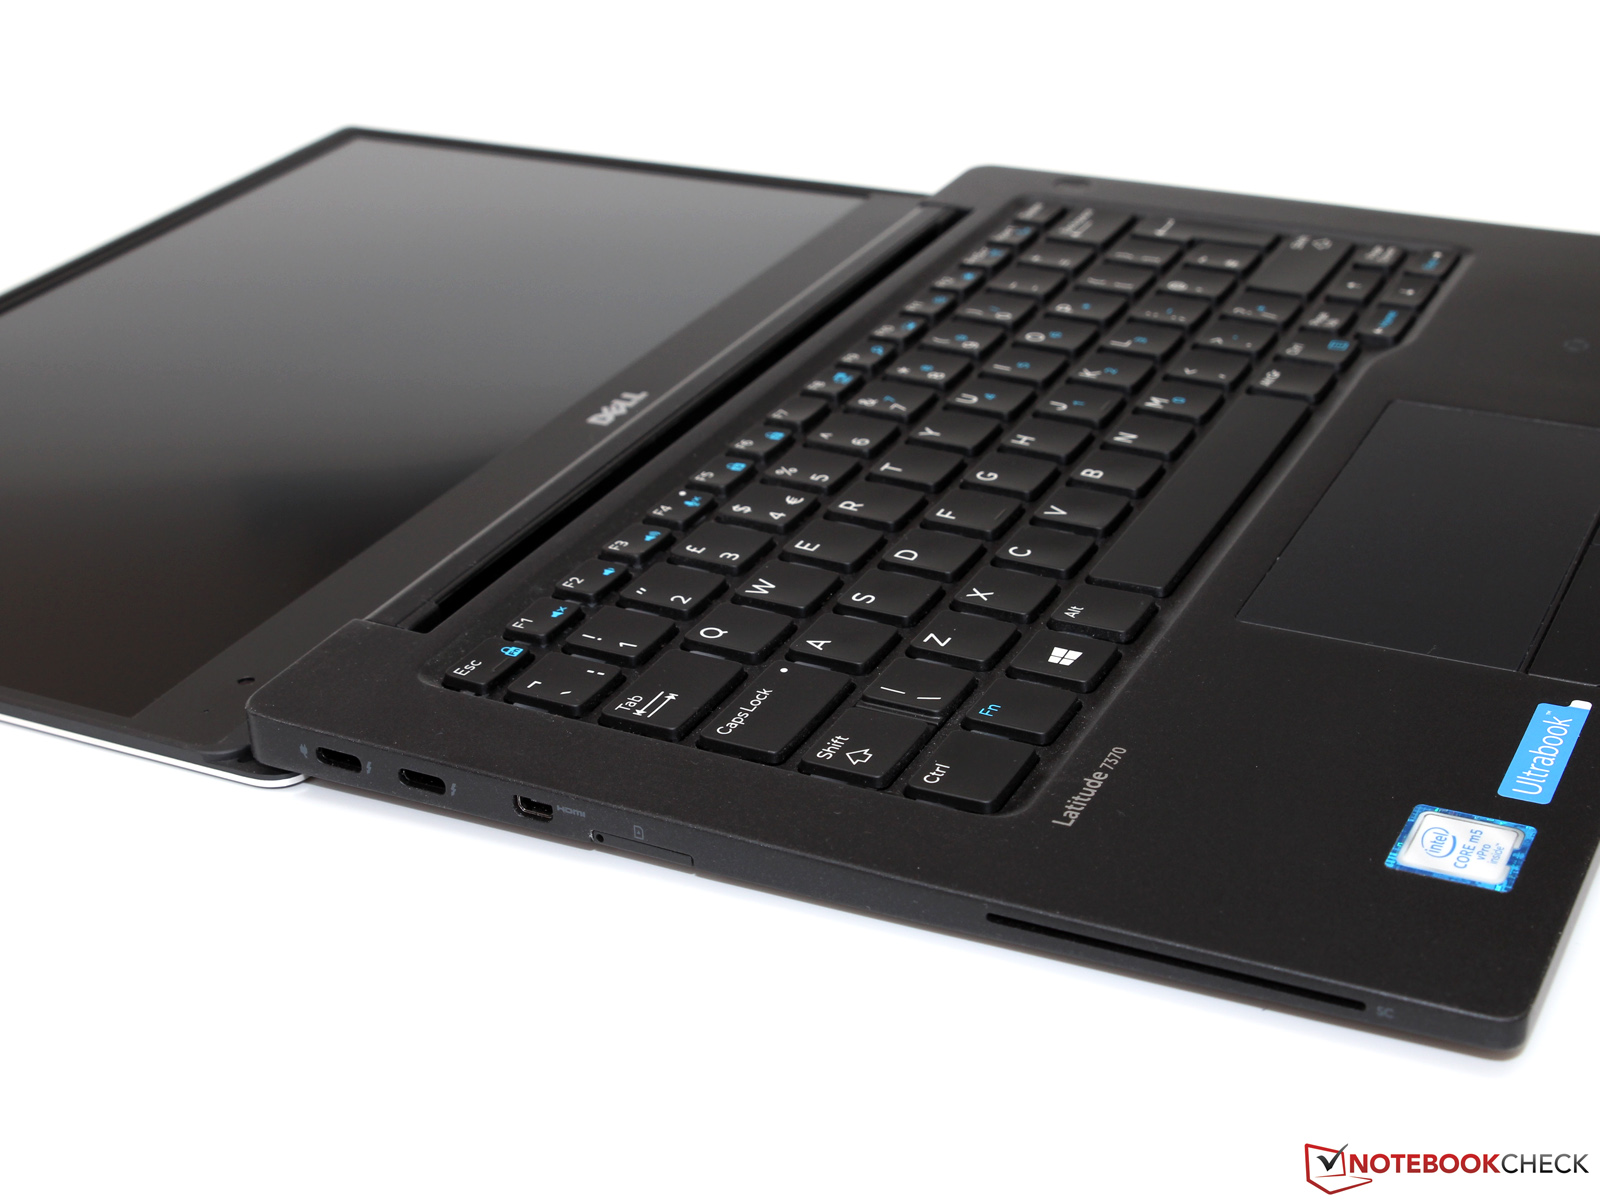
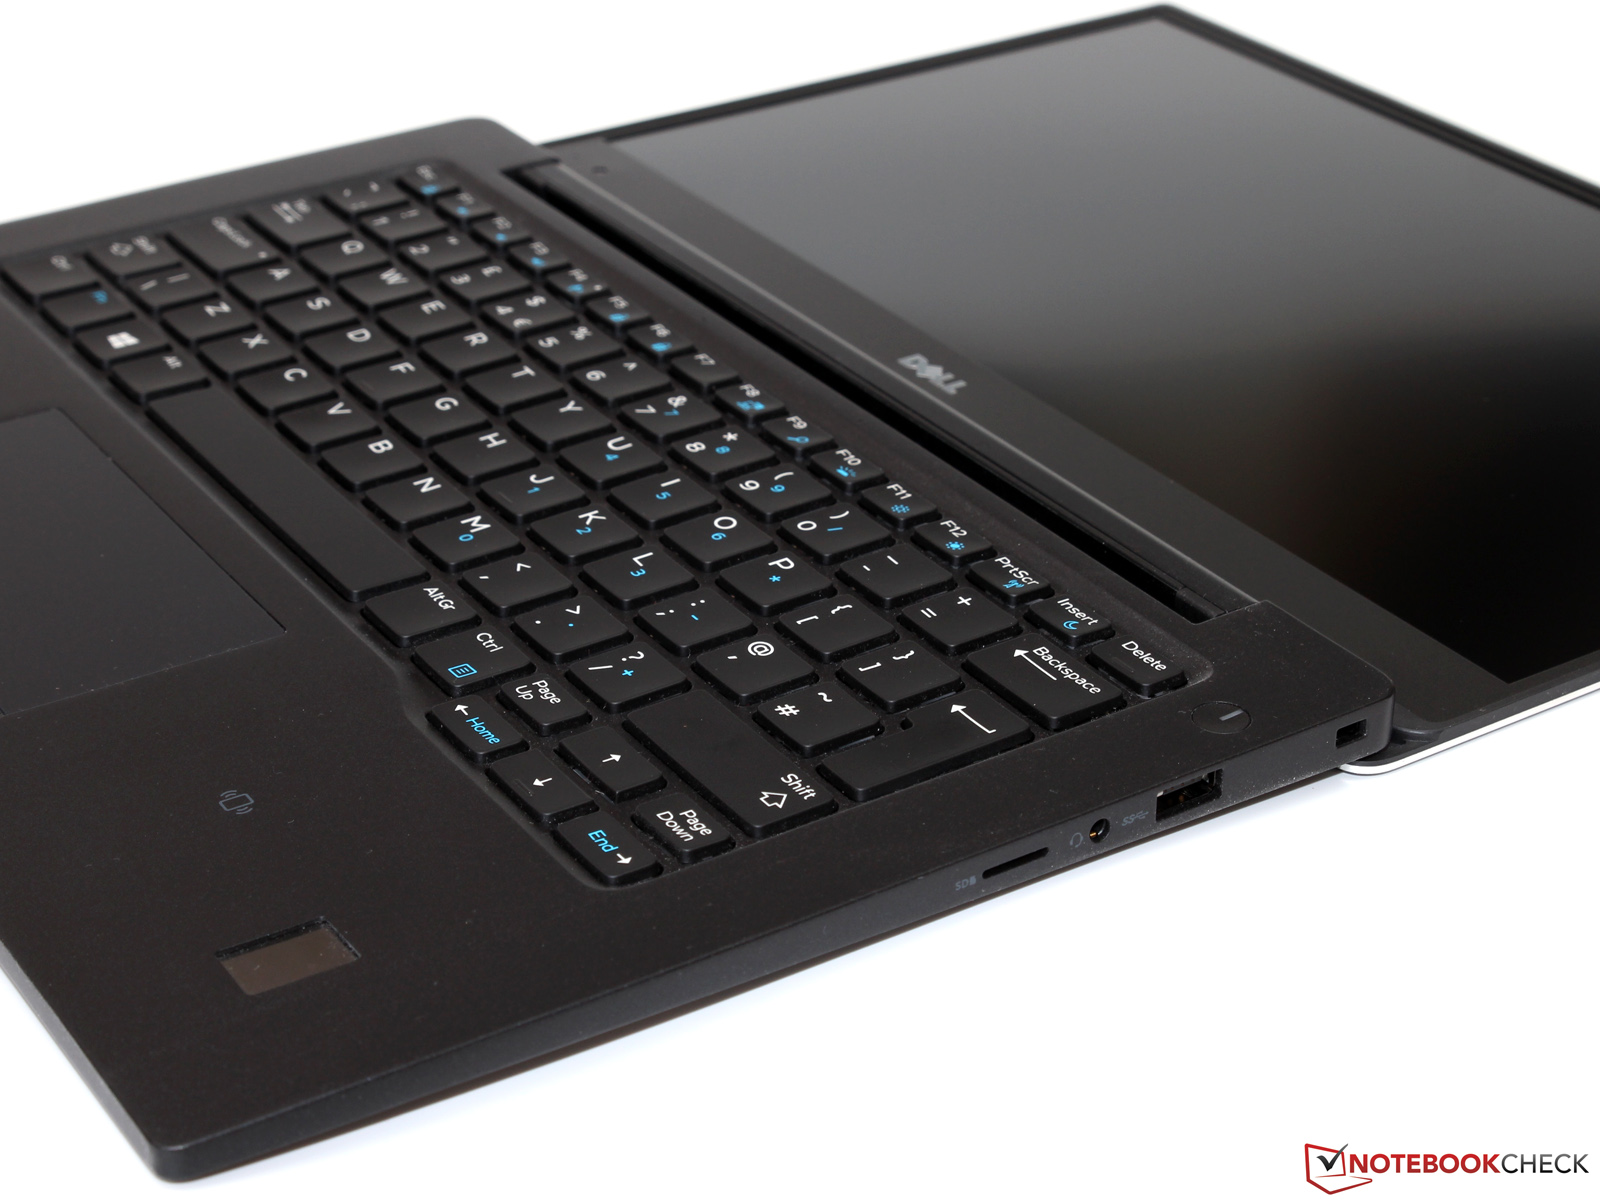
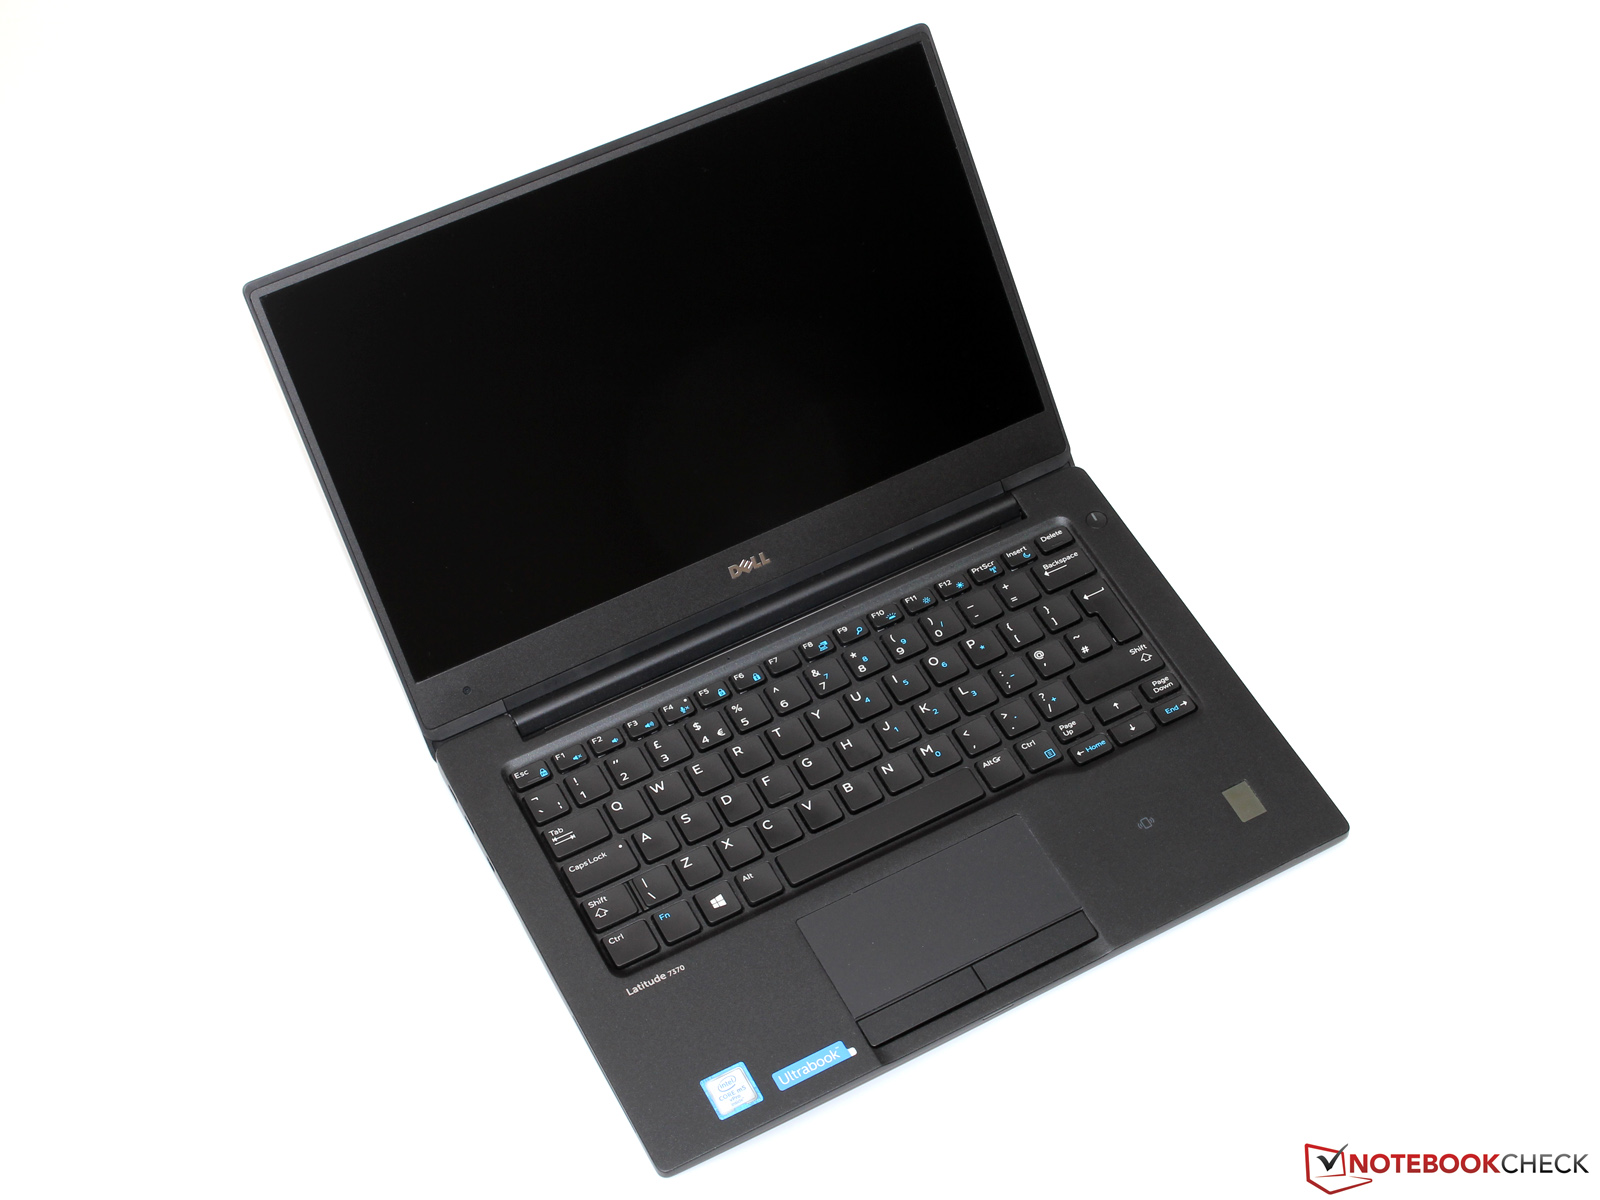
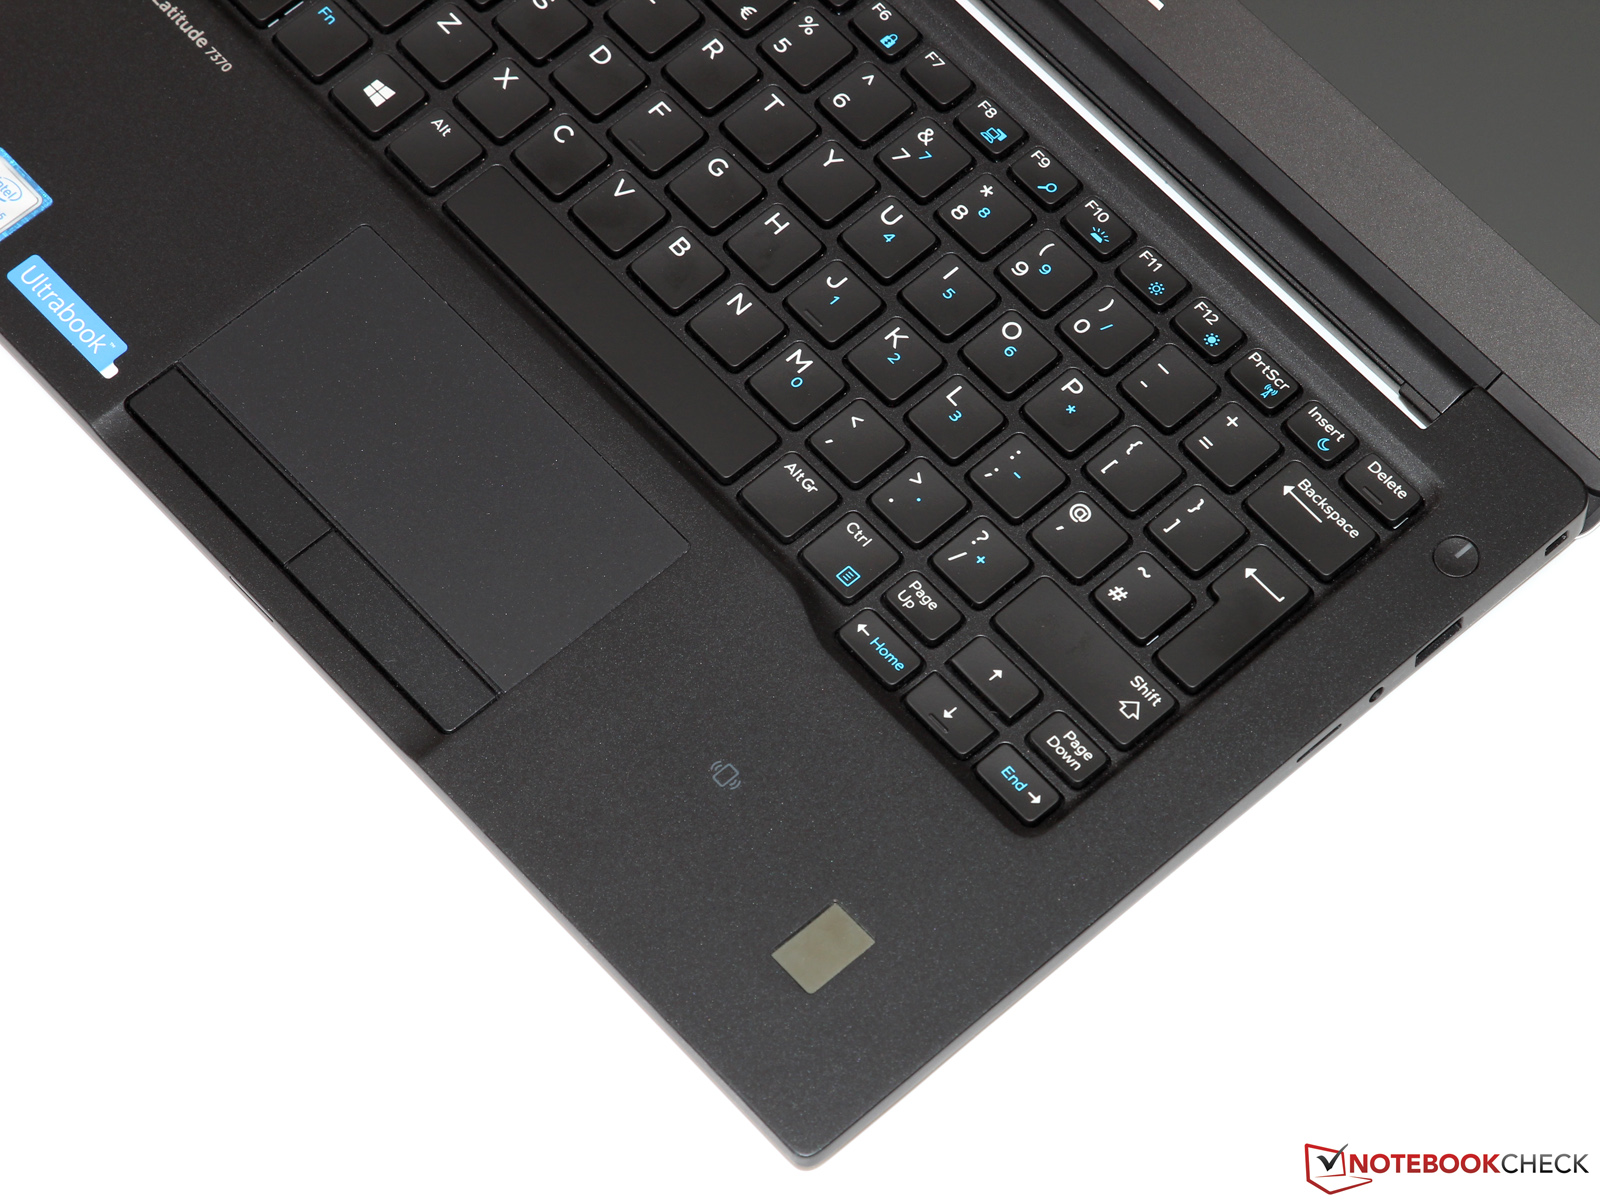
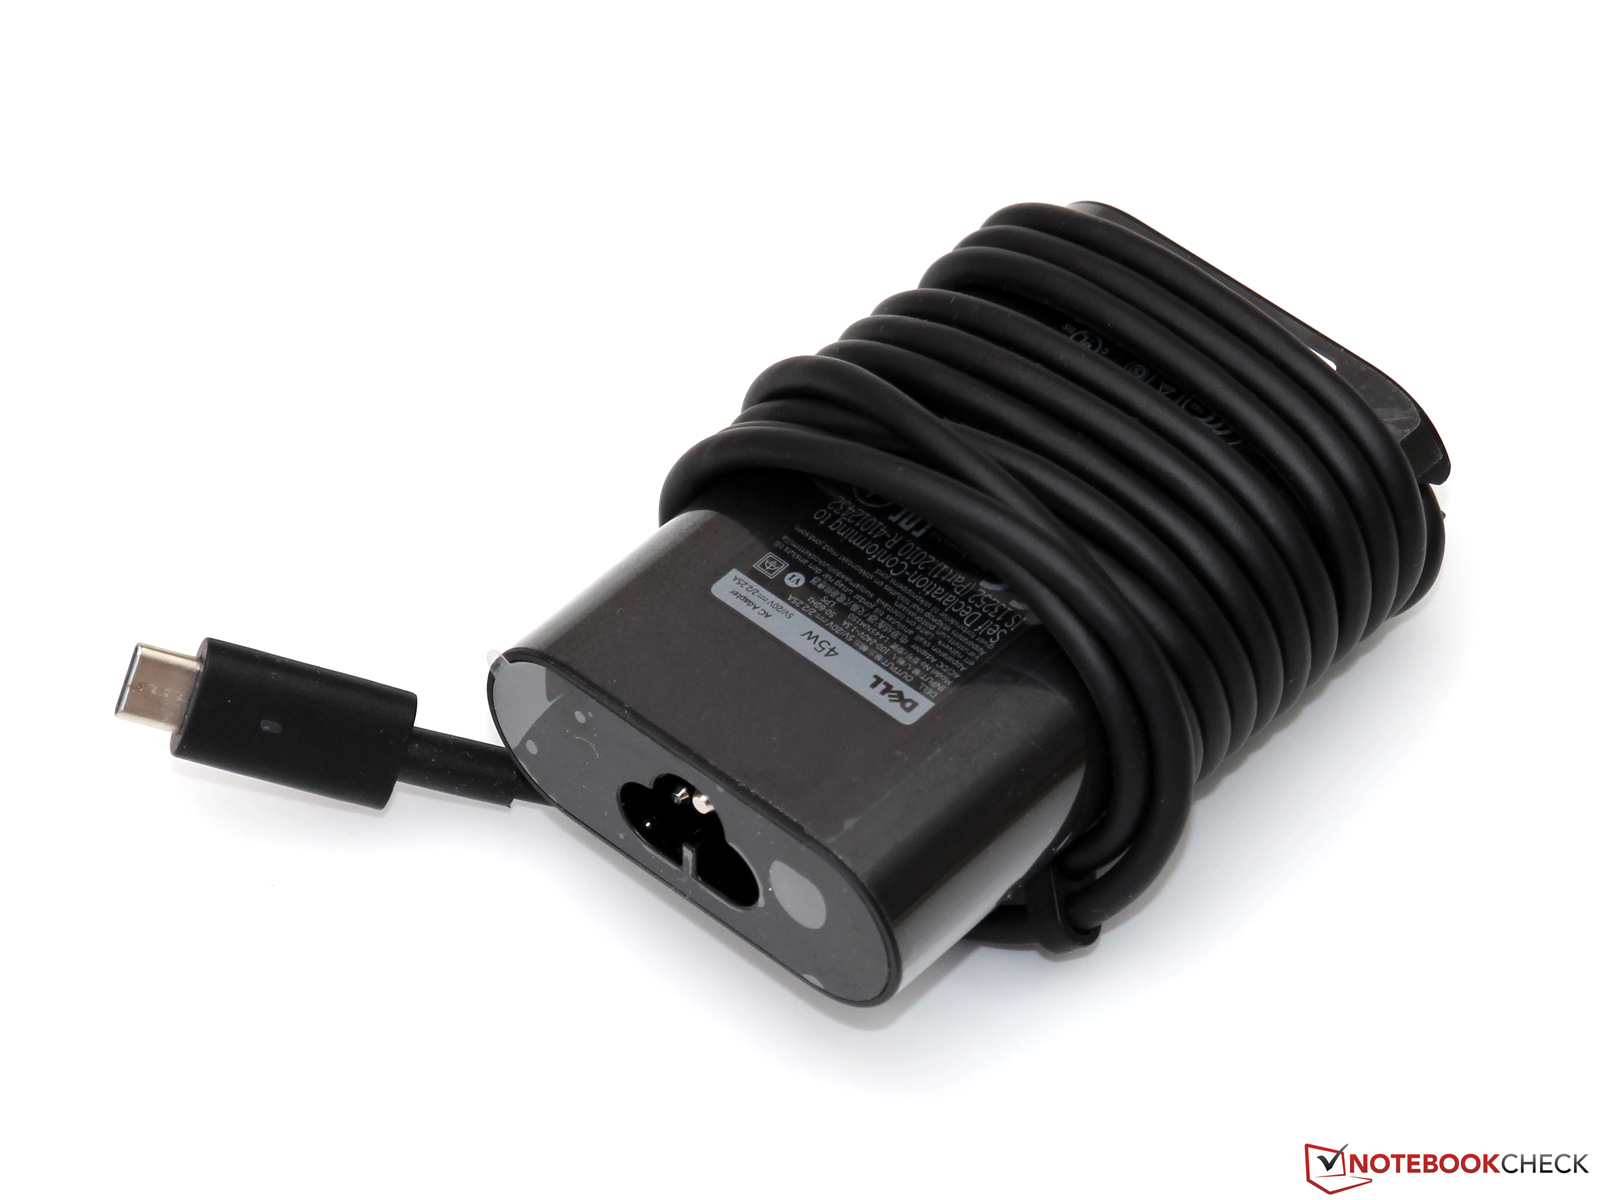
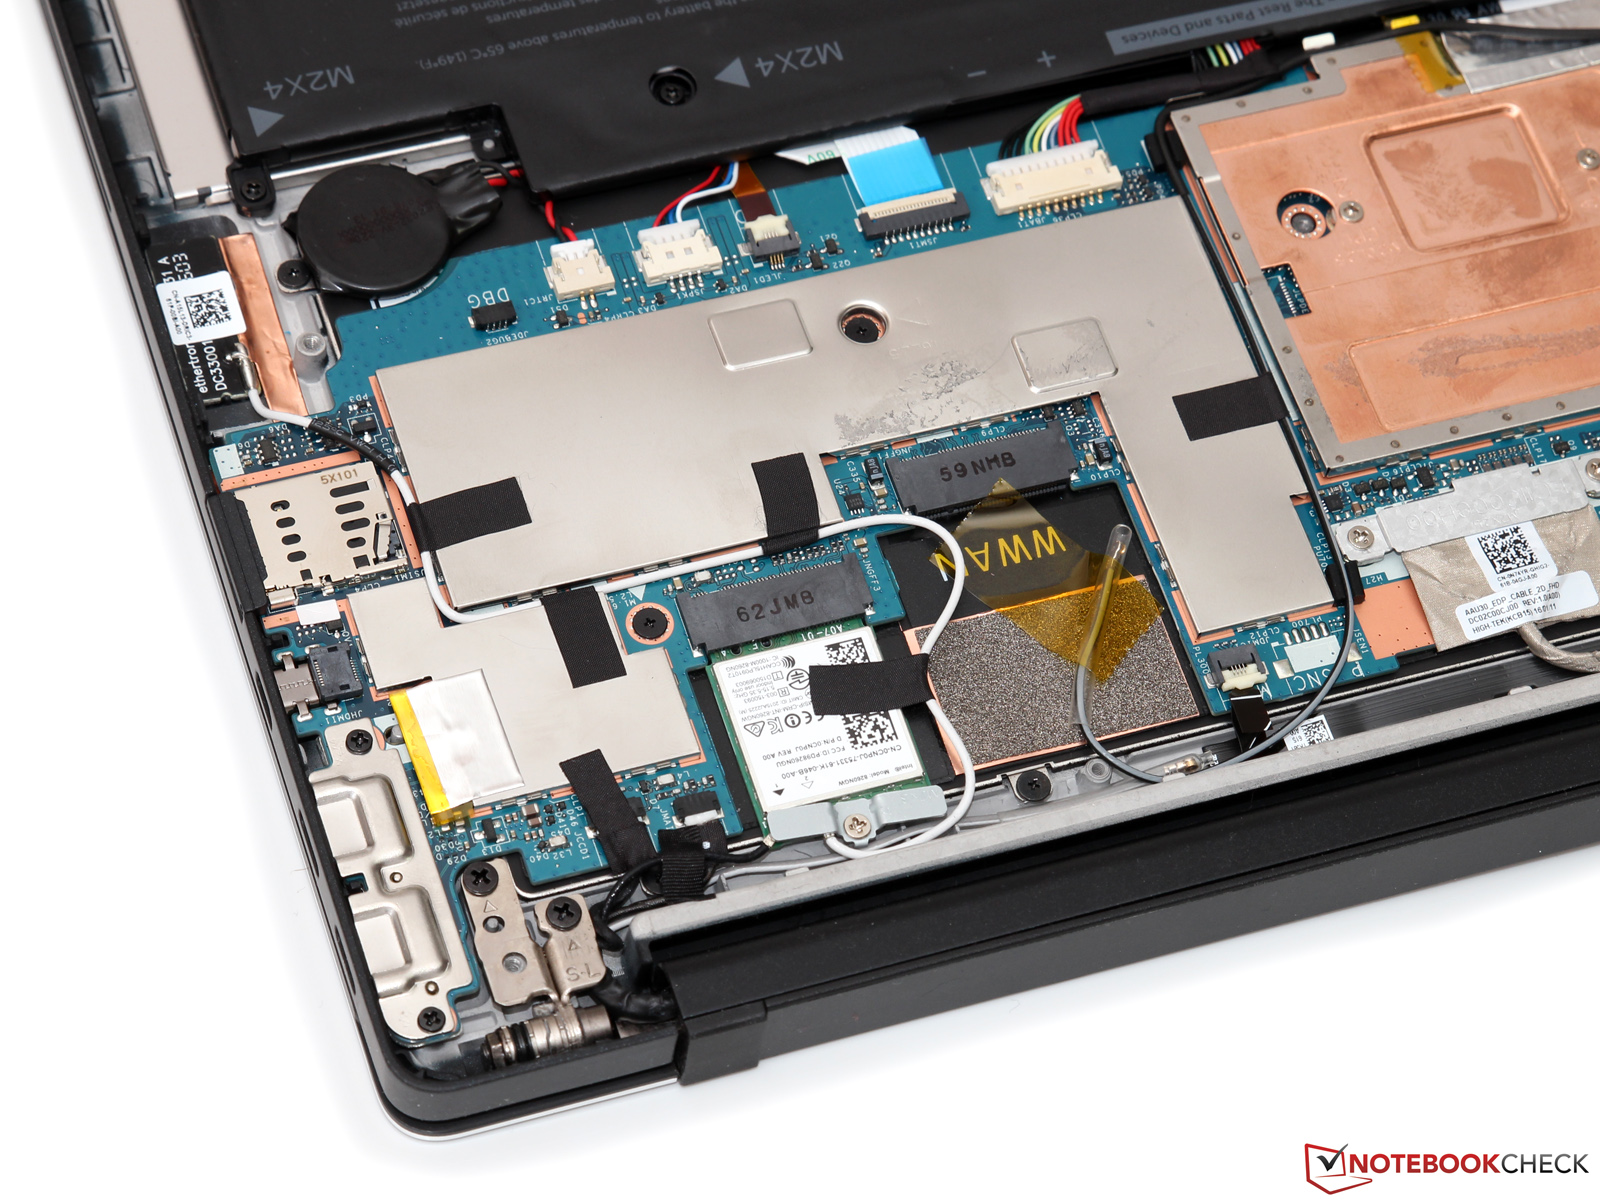
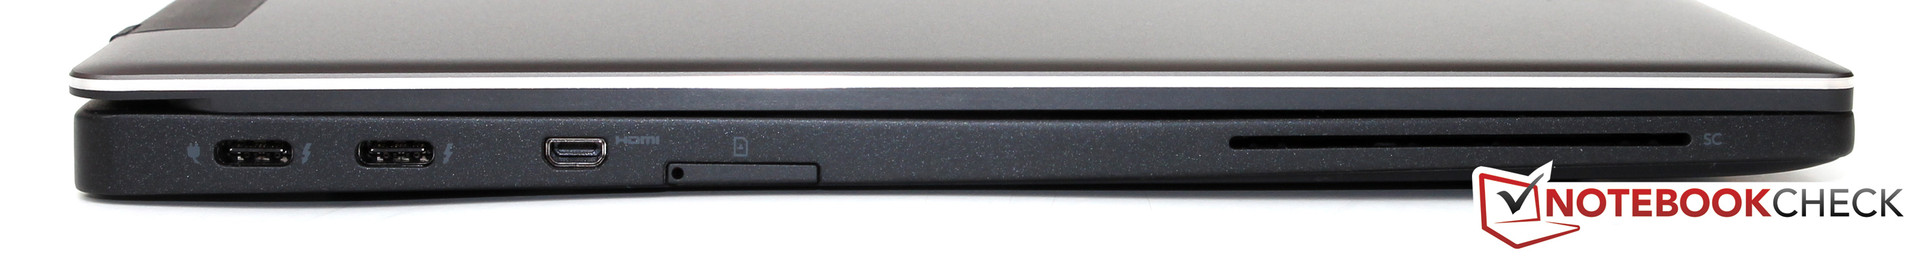
Un display quasi senza cornice, raffreddamento passivo e porte Thunderbolt 3 – il Dell Latitude 13 7370 si distingue dalla massa noiosa dei portatili mainstream. Questo Ultrabook non teme la concorrenza in termini di mobilità e qualità e convince con una qualità di costruzione impeccabile, eccellente stabilità e solidi dispositivi di input. Le performance della piattaforma Core-m sono altrettanto buone: un breve picco di carico - almeno dopo l'update del BIOS - gestito in modo abbastanza buono. I clocks e le performance ne risentono solo sotto carico sostenuto, ma non dovrebbe essere un problema nell'utilizzo di applicazioni comuni.
Il fatto che il 7370 manchi un punteggio molto buono dipende dal display. Dell ha implementato un pannello molto decente con una potente retroilluminazione, ma non sempre la potete usare a causa del controllo automatico di luminosità e contrasto. Un problema fastidioso, ma che speriamo sia risolto con un update del BIOS. In definitiva solo un prezzo molto alto garantisce una raccomandazione: attualmente con un prezzo di circa 2200 Euro (~$2468), il Latitude 13 non è certo un affare - visto che un (consumer-oriented) Apple MacBook 12 costi un paio di centinaia di euro in meno.
Nota: si tratta di una recensione breve, con alcune sezioni non tradotte, per la versione integrale in inglese guardate qui.
Dell Latitude 13 7370
- 05/12/2016 v5.1 (old)
Till Schönborn
Price comparison
