Recensione breve dell'Ultrabook Lenovo ThinkPad X1 Carbon 2016 (Core i7, WQHD)
| |||||||||||||||||||||||||
Distribuzione della luminosità: 95 %
Al centro con la batteria: 273 cd/m²
Contrasto: 850:1 (Nero: 0.32 cd/m²)
ΔE ColorChecker Calman: 2.61 | ∀{0.5-29.43 Ø4.71}
ΔE Greyscale Calman: 3.31 | ∀{0.09-98 Ø4.96}
95% sRGB (Argyll 1.6.3 3D)
63% AdobeRGB 1998 (Argyll 1.6.3 3D)
68.4% AdobeRGB 1998 (Argyll 3D)
94.7% sRGB (Argyll 3D)
66.7% Display P3 (Argyll 3D)
Gamma: 2.35
CCT: 6360 K
| Lenovo ThinkPad X1 Carbon 20FB003RGE 2.560 x 1.440 IPS-Panel | Lenovo ThinkPad T460s-20FA003GGE 2.560 x 1.440 IPS-Panel | Dell Latitude 14 7000 Series E7470 2.560 x 1.440 IPS-Panel | Lenovo ThinkPad X1 Carbon 2015 2.560 x 1.440 IPS-Panel | HP EliteBook Folio 1040 G3 2.560 x 1.440 IPS-Panel | |
|---|---|---|---|---|---|
| Display | 3% | 1% | -20% | 2% | |
| Display P3 Coverage (%) | 66.7 | 68.7 3% | 67.2 1% | 52.4 -21% | 67.9 2% |
| sRGB Coverage (%) | 94.7 | 98.1 4% | 95.9 1% | 77.4 -18% | 96.8 2% |
| AdobeRGB 1998 Coverage (%) | 68.4 | 70.4 3% | 69.3 1% | 54 -21% | 70 2% |
| Response Times | -2% | -11% | -8% | ||
| Response Time Grey 50% / Grey 80% * (ms) | 44 ? | 35.6 ? 19% | 48 ? -9% | 46.4 ? -5% | |
| Response Time Black / White * (ms) | 24 ? | 29.2 ? -22% | 27 ? -13% | 26.4 ? -10% | |
| PWM Frequency (Hz) | 220 ? | 220 ? | |||
| Screen | -19% | 9% | -17% | -9% | |
| Brightness middle (cd/m²) | 272 | 257 -6% | 380 40% | 252.3 -7% | 327 20% |
| Brightness (cd/m²) | 268 | 248 -7% | 354 32% | 246 -8% | 316 18% |
| Brightness Distribution (%) | 95 | 94 -1% | 81 -15% | 95 0% | 87 -8% |
| Black Level * (cd/m²) | 0.32 | 0.26 19% | 0.26 19% | 0.426 -33% | 0.35 -9% |
| Contrast (:1) | 850 | 988 16% | 1462 72% | 592 -30% | 934 10% |
| Colorchecker dE 2000 * | 2.61 | 4.59 -76% | 3.11 -19% | 3.8 -46% | 4.39 -68% |
| Colorchecker dE 2000 max. * | 6.43 | 9.72 -51% | 6.73 -5% | 7.27 -13% | |
| Greyscale dE 2000 * | 3.31 | 6.38 -93% | 4.35 -31% | 2.92 12% | 4.69 -42% |
| Gamma | 2.35 94% | 2.51 88% | 2.37 93% | 2.08 106% | 2.15 102% |
| CCT | 6360 102% | 6238 104% | 6771 96% | 6070 107% | 7101 92% |
| Color Space (Percent of AdobeRGB 1998) (%) | 63 | 65 3% | 62 -2% | 50.41 -20% | 62.52 -1% |
| Color Space (Percent of sRGB) (%) | 95 | 98 3% | 96 1% | 96.71 2% | |
| Media totale (Programma / Settaggio) | -6% /
-12% | -0% /
5% | -19% /
-17% | -5% /
-7% |
* ... Meglio usare valori piccoli
Tempi di risposta del Display
| ↔ Tempi di risposta dal Nero al Bianco | ||
|---|---|---|
| 24 ms ... aumenta ↗ e diminuisce ↘ combinato | ↗ 5.2 ms Incremento | 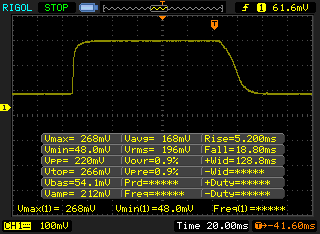 |
| ↘ 18.8 ms Calo | ||
| Lo schermo mostra buoni tempi di risposta durante i nostri tests, ma potrebbe essere troppo lento per i gamers competitivi. In confronto, tutti i dispositivi di test variano da 0.1 (minimo) a 240 (massimo) ms. » 54 % di tutti i dispositivi è migliore. Questo significa che i tempi di risposta rilevati sono peggiori rispetto alla media di tutti i dispositivi testati (19.8 ms). | ||
| ↔ Tempo di risposta dal 50% Grigio all'80% Grigio | ||
| 44 ms ... aumenta ↗ e diminuisce ↘ combinato | ↗ 17 ms Incremento | 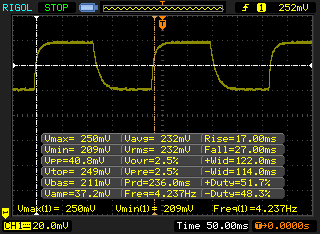 |
| ↘ 27 ms Calo | ||
| Lo schermo mostra tempi di risposta lenti nei nostri tests e sarà insoddisfacente per i gamers. In confronto, tutti i dispositivi di test variano da 0.165 (minimo) a 636 (massimo) ms. » 73 % di tutti i dispositivi è migliore. Questo significa che i tempi di risposta rilevati sono peggiori rispetto alla media di tutti i dispositivi testati (31 ms). | ||
Sfarfallio dello schermo / PWM (Pulse-Width Modulation)
| flickering dello schermo / PWM rilevato | 220 Hz | ≤ 90 % settaggio luminosita' | 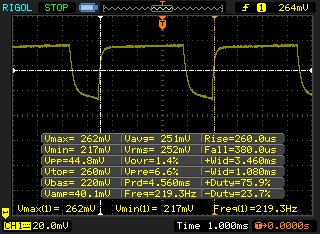 |
Il display sfarfalla a 220 Hz (Probabilmente a causa dell'uso di PWM) Flickering rilevato ad una luminosita' di 90 % o inferiore. Non dovrebbe verificarsi flickering o PWM sopra questo valore di luminosita'. La frequenza di 220 Hz è relativamente bassa, quindi gli utenti sensibili potrebbero notare il flickering ed accusare stanchezza agli occhi a questo livello di luminosità e a livelli inferiori. In confronto: 52 % di tutti i dispositivi testati non utilizza PWM per ridurre la luminosita' del display. Se è rilevato PWM, una media di 7757 (minimo: 5 - massimo: 343500) Hz è stata rilevata. | |||
| Cinebench R15 | |
| CPU Single 64Bit | |
| Dell Latitude 14 7000 Series E7470 | |
| Lenovo ThinkPad T460s-20FA003GGE | |
| Lenovo ThinkPad X1 Carbon 20FB003RGE | |
| HP EliteBook Folio 1040 G3 | |
| Lenovo ThinkPad X1 Carbon 2015 | |
| Lenovo ThinkPad T460s-20F9003SGE | |
| CPU Multi 64Bit | |
| Lenovo ThinkPad T460s-20FA003GGE | |
| Dell Latitude 14 7000 Series E7470 | |
| Lenovo ThinkPad X1 Carbon 20FB003RGE | |
| HP EliteBook Folio 1040 G3 | |
| Lenovo ThinkPad T460s-20F9003SGE | |
| Lenovo ThinkPad X1 Carbon 2015 | |
| Cinebench R11.5 | |
| CPU Single 64Bit | |
| Dell Latitude 14 7000 Series E7470 | |
| Lenovo ThinkPad T460s-20FA003GGE | |
| Lenovo ThinkPad X1 Carbon 20FB003RGE | |
| Lenovo ThinkPad X1 Carbon 2015 | |
| Lenovo ThinkPad T460s-20F9003SGE | |
| CPU Multi 64Bit | |
| Lenovo ThinkPad T460s-20FA003GGE | |
| Dell Latitude 14 7000 Series E7470 | |
| Lenovo ThinkPad X1 Carbon 20FB003RGE | |
| Lenovo ThinkPad T460s-20F9003SGE | |
| Lenovo ThinkPad X1 Carbon 2015 | |
| X264 HD Benchmark 4.0 | |
| Pass 1 | |
| Lenovo ThinkPad T460s-20FA003GGE | |
| Lenovo ThinkPad X1 Carbon 20FB003RGE | |
| Pass 2 | |
| Lenovo ThinkPad T460s-20FA003GGE | |
| Lenovo ThinkPad X1 Carbon 20FB003RGE | |
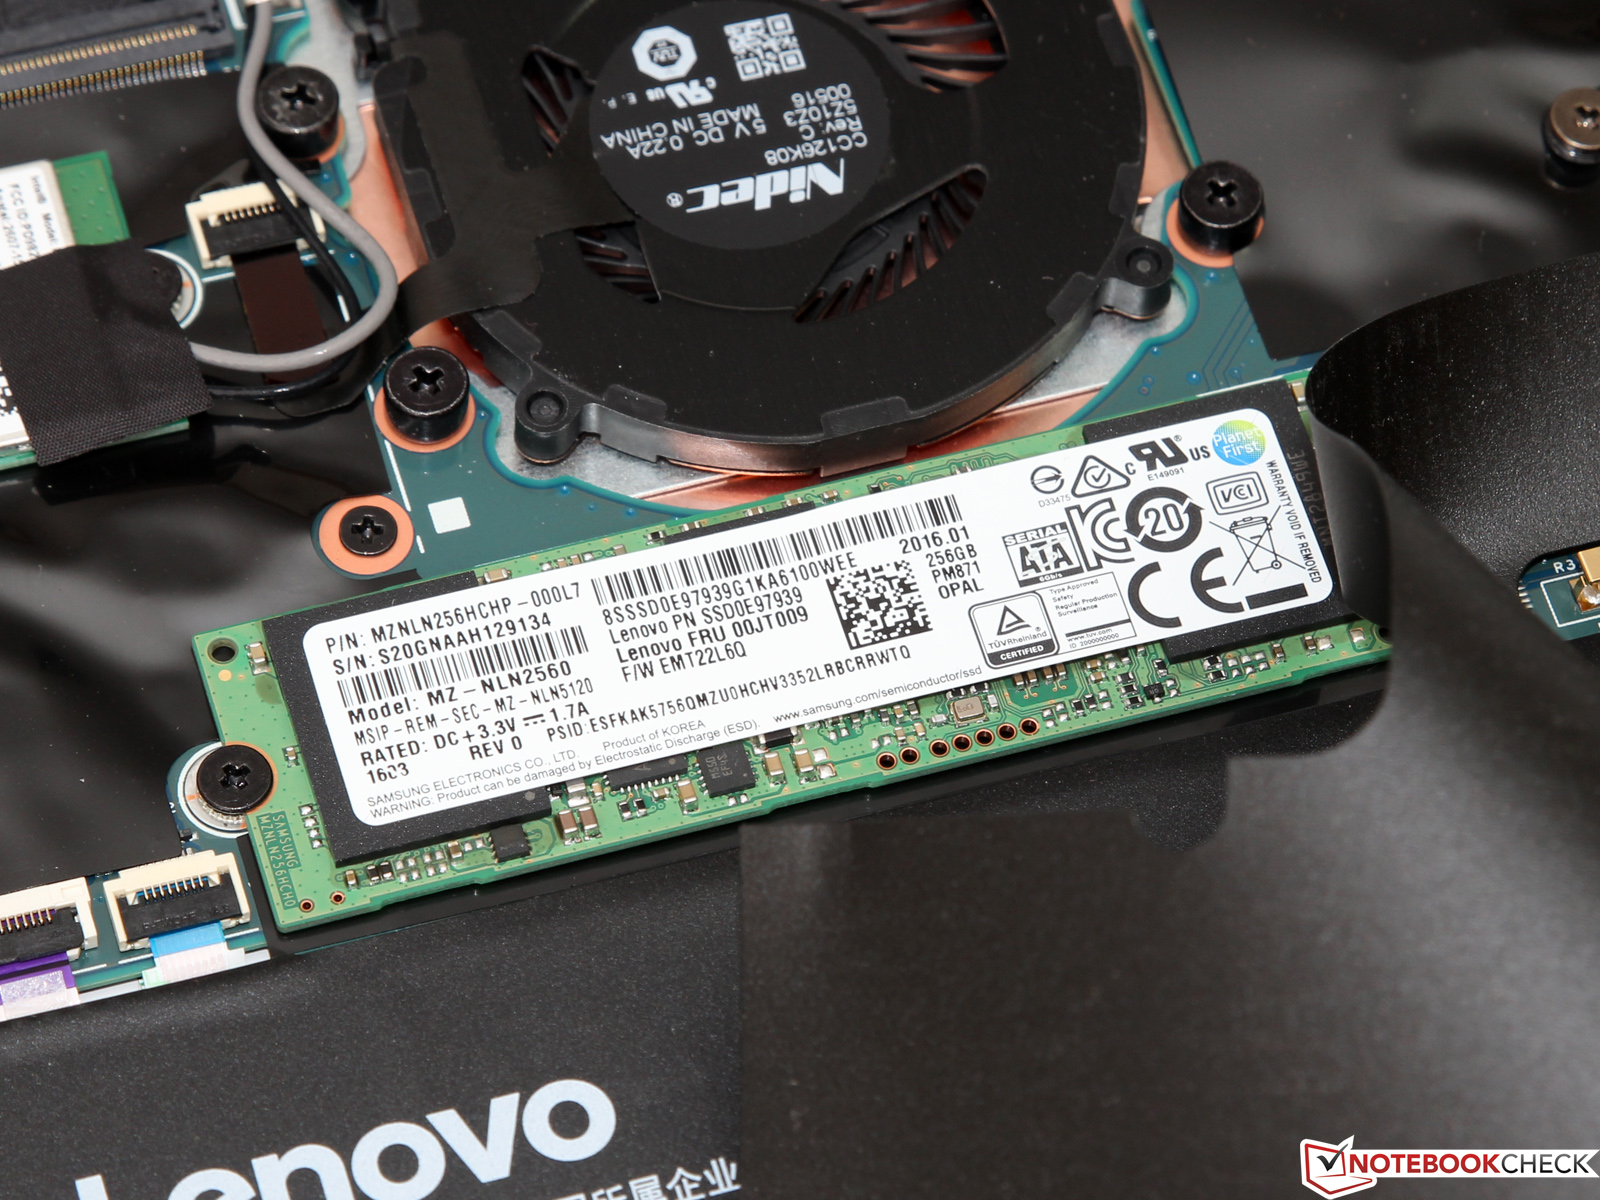
| Lenovo ThinkPad X1 Carbon 20FB003RGE Samsung SSD PM871 MZNLN256HCHP | Lenovo ThinkPad T460s-20FA003GGE Samsung SSD SM951a 512GB M.2 PCIe 3.0 x4 NVMe (MZVKV512) | Lenovo ThinkPad X1 Carbon 2015 Samsung SSD SM951 512 GB MZHPV512HDGL | Lenovo ThinkPad X1 Carbon 2015 Samsung SSD PM851 256 GB MZNTE256HMHP | HP EliteBook Folio 1040 G3 Samsung SM951 MZVPV256HDGL m.2 PCI-e | |
|---|---|---|---|---|---|
| AS SSD | 166% | 105% | -4% | 190% | |
| Seq Read (MB/s) | 499.1 | 2039 309% | 1339 168% | 512 3% | 1839 268% |
| Seq Write (MB/s) | 294 | 1407 379% | 1209 311% | 235.7 -20% | 1190 305% |
| 4K Read (MB/s) | 30.43 | 45.41 49% | 39.9 31% | 32.41 7% | 47.72 57% |
| 4K Write (MB/s) | 74.6 | 114.4 53% | 91.3 22% | 89.9 21% | 126.6 70% |
| 4K-64 Read (MB/s) | 370.4 | 968 161% | 510 38% | 355 -4% | 1858 402% |
| 4K-64 Write (MB/s) | 253.4 | 366 44% | 402.2 59% | 170.3 -33% | 344.3 36% |

| PCMark 8 | |
| Home Score Accelerated v2 | |
| Lenovo ThinkPad T460s-20FA003GGE | |
| Lenovo ThinkPad X1 Carbon 20FB003RGE | |
| HP EliteBook Folio 1040 G3 | |
| Lenovo ThinkPad X1 Carbon 2015 | |
| Lenovo ThinkPad X1 Carbon 2015 | |
| Creative Score Accelerated v2 | |
| Lenovo ThinkPad T460s-20FA003GGE | |
| Lenovo ThinkPad X1 Carbon 20FB003RGE | |
| HP EliteBook Folio 1040 G3 | |
| Lenovo ThinkPad X1 Carbon 2015 | |
| Work Score Accelerated v2 | |
| Lenovo ThinkPad T460s-20FA003GGE | |
| Lenovo ThinkPad X1 Carbon 20FB003RGE | |
| HP EliteBook Folio 1040 G3 | |
| Lenovo ThinkPad X1 Carbon 2015 | |
| PCMark 7 - Score | |
| Lenovo ThinkPad X1 Carbon 20FB003RGE | |
| Lenovo ThinkPad X1 Carbon 2015 | |
| Lenovo ThinkPad T460s-20FA003GGE | |
| Lenovo ThinkPad X1 Carbon 2015 | |
| PCMark 7 Score | 5350 punti | |
| PCMark 8 Home Score Accelerated v2 | 3385 punti | |
| PCMark 8 Creative Score Accelerated v2 | 4150 punti | |
| PCMark 8 Work Score Accelerated v2 | 4342 punti | |
Aiuto | ||
| 3DMark 11 - 1280x720 Performance GPU | |
| Microsoft Surface Pro 4 Core i7 | |
| Lenovo ThinkPad T450s-20BWS1UT00 | |
| Lenovo ThinkPad T460s-20FA003GGE | |
| Lenovo ThinkPad X1 Carbon 20FB003RGE | |
| HP EliteBook Folio 1040 G3 | |
| Lenovo ThinkPad T460s-20F9003SGE | |
| Lenovo ThinkPad X1 Carbon 2015 | |
| 3DMark - 1920x1080 Fire Strike Graphics | |
| Lenovo ThinkPad T450s-20BWS1UT00 | |
| Microsoft Surface Pro 4 Core i7 | |
| Lenovo ThinkPad X1 Carbon 20FB003RGE | |
| Lenovo ThinkPad T460s-20FA003GGE | |
| HP EliteBook Folio 1040 G3 | |
| Lenovo ThinkPad X1 Carbon 2015 | |
| Lenovo ThinkPad T460s-20F9003SGE | |
| 3DMark 06 Standard Score | 9532 punti | |
| 3DMark 11 Performance | 1553 punti | |
| 3DMark Ice Storm Standard Score | 52800 punti | |
| 3DMark Cloud Gate Standard Score | 5978 punti | |
| 3DMark Fire Strike Score | 892 punti | |
Aiuto | ||
| basso | medio | alto | ultra | |
|---|---|---|---|---|
| BioShock Infinite (2013) | 51 | 28.3 | 23.8 | 6.9 |
| Battlefield 4 (2013) | 42 | 29.9 | 19 | 5.9 |
| Dirt Rally (2015) | 101.4 | 26.7 | 13 |
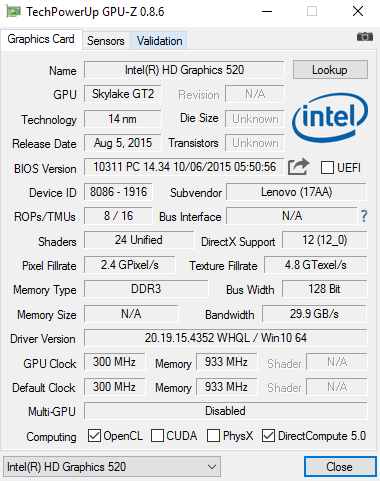
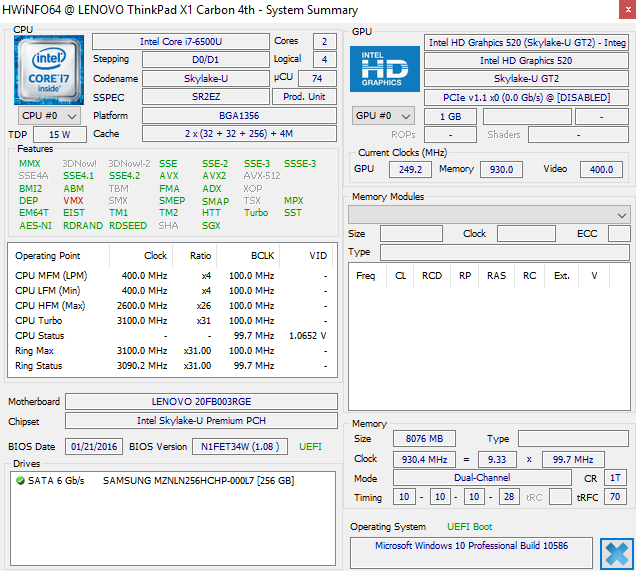
| Lenovo ThinkPad X1 Carbon 20FB003RGE Intel Core i7-6500U, Intel HD Graphics 520 | HP EliteBook Folio 1040 G3 Intel Core i5-6300U, Intel HD Graphics 520 | Dell Latitude 14 7000 Series E7470 Intel Core i7-6600U, Intel HD Graphics 520 | Lenovo ThinkPad T460s-20FA003GGE Intel Core i7-6600U, Intel HD Graphics 520 | Lenovo ThinkPad X1 Carbon 2015 Intel Core i5-5300U, Intel HD Graphics 5500 | |
|---|---|---|---|---|---|
| Noise | 2% | -0% | 1% | 4% | |
| off /ambiente * (dB) | 29.1 | 29.1 -0% | 31.2 -7% | 29.2 -0% | |
| Idle Minimum * (dB) | 29.1 | 29.1 -0% | 31.2 -7% | 29.2 -0% | 28.5 2% |
| Idle Average * (dB) | 29.1 | 29.1 -0% | 31.2 -7% | 29.2 -0% | 28.6 2% |
| Idle Maximum * (dB) | 29.1 | 29.1 -0% | 31.2 -7% | 29.2 -0% | 28.8 1% |
| Load Average * (dB) | 35.6 | 32.6 8% | 31.9 10% | 33.7 5% | 30.7 14% |
| Load Maximum * (dB) | 38.1 | 37.8 1% | 31.9 16% | 38.5 -1% | 36.9 3% |
* ... Meglio usare valori piccoli
Rumorosità
| Idle |
| 29.1 / 29.1 / 29.1 dB(A) |
| Sotto carico |
| 35.6 / 38.1 dB(A) |
 | ||
30 dB silenzioso 40 dB(A) udibile 50 dB(A) rumoroso |
||
min: | ||
(±) La temperatura massima sul lato superiore è di 43.2 °C / 110 F, rispetto alla media di 34.3 °C / 94 F, che varia da 21.2 a 62.5 °C per questa classe Office.
(±) Il lato inferiore si riscalda fino ad un massimo di 45 °C / 113 F, rispetto alla media di 36.8 °C / 98 F
(+) In idle, la temperatura media del lato superiore è di 27.1 °C / 81 F, rispetto alla media deld ispositivo di 29.5 °C / 85 F.
(+) I poggiapolsi e il touchpad sono piu' freddi della temperatura della pelle con un massimo di 26.6 °C / 79.9 F e sono quindi freddi al tatto.
(±) La temperatura media della zona del palmo della mano di dispositivi simili e'stata di 27.5 °C / 81.5 F (+0.9 °C / 1.6 F).
| Off / Standby | |
| Idle | |
| Sotto carico |
|
Leggenda:
min: | |
| Lenovo ThinkPad X1 Carbon 20FB003RGE 52 Wh | Lenovo ThinkPad T460s-20FA003GGE 49 Wh | Lenovo ThinkPad X1 Carbon 2015 50 Wh | HP EliteBook Folio 1040 G3 45.6 Wh | Dell Latitude 14 7000 Series E7470 55 Wh | |
|---|---|---|---|---|---|
| Autonomia della batteria | -25% | -1% | -22% | -10% | |
| Reader / Idle (h) | 15.7 | 13.9 -11% | 16.4 4% | 8.8 -44% | |
| H.264 (h) | 8.5 | 6.6 -22% | 5.7 -33% | ||
| WiFi v1.3 (h) | 7.2 | 5.7 -21% | 4.8 -33% | 5.2 -28% | 5.8 -19% |
| Load (h) | 1.9 | 1 -47% | 2.4 26% | 2.2 16% | 1.9 0% |
| WiFi (h) | 6.7 |
Pro
Contro
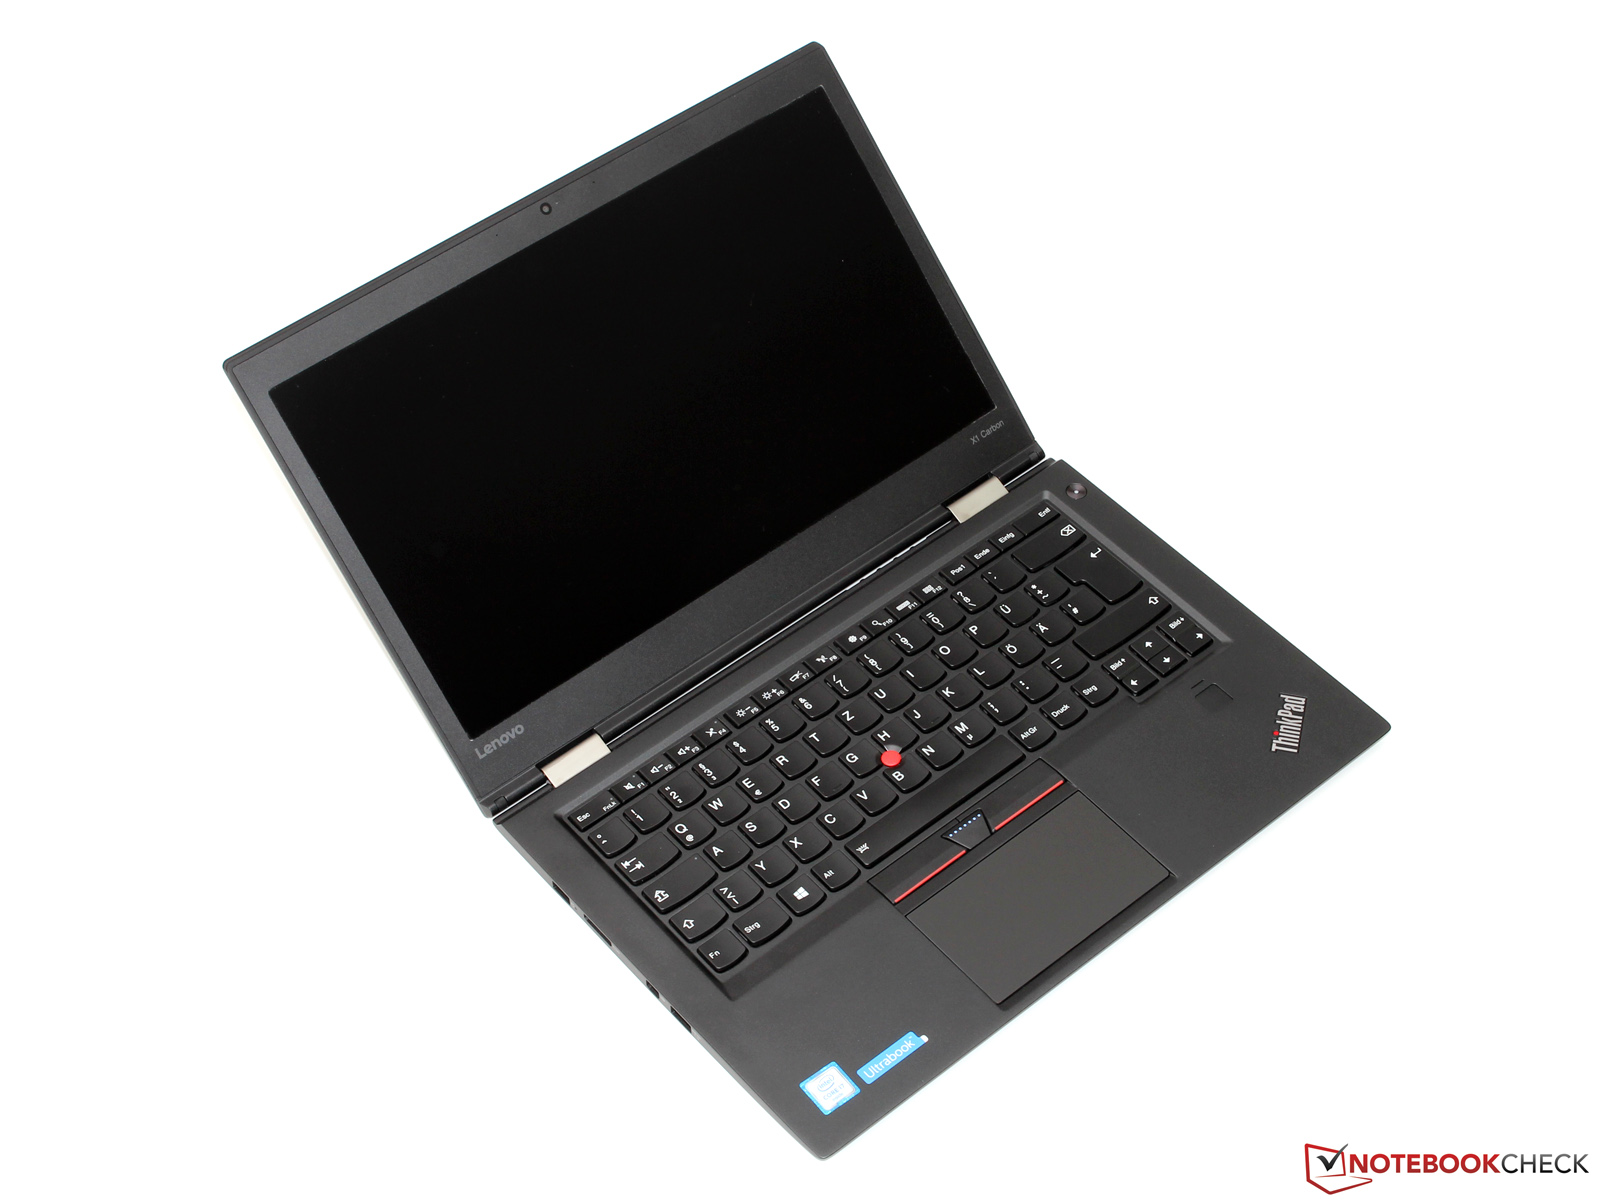
E460, L460, T460, T460p, T460s, ed ora l'X1 Carbon: è evidente che Lenovo vuole occupare anche il minimo spazio con un modello ThinkPad. Non vogliamo giudicare se sia necessario o ragionevole - ma aiuta a trovare il modello migliore per ogni esigenza.
Specialmente la sua eccellente mobilità è un forte argomento per l'X1 Carbon.
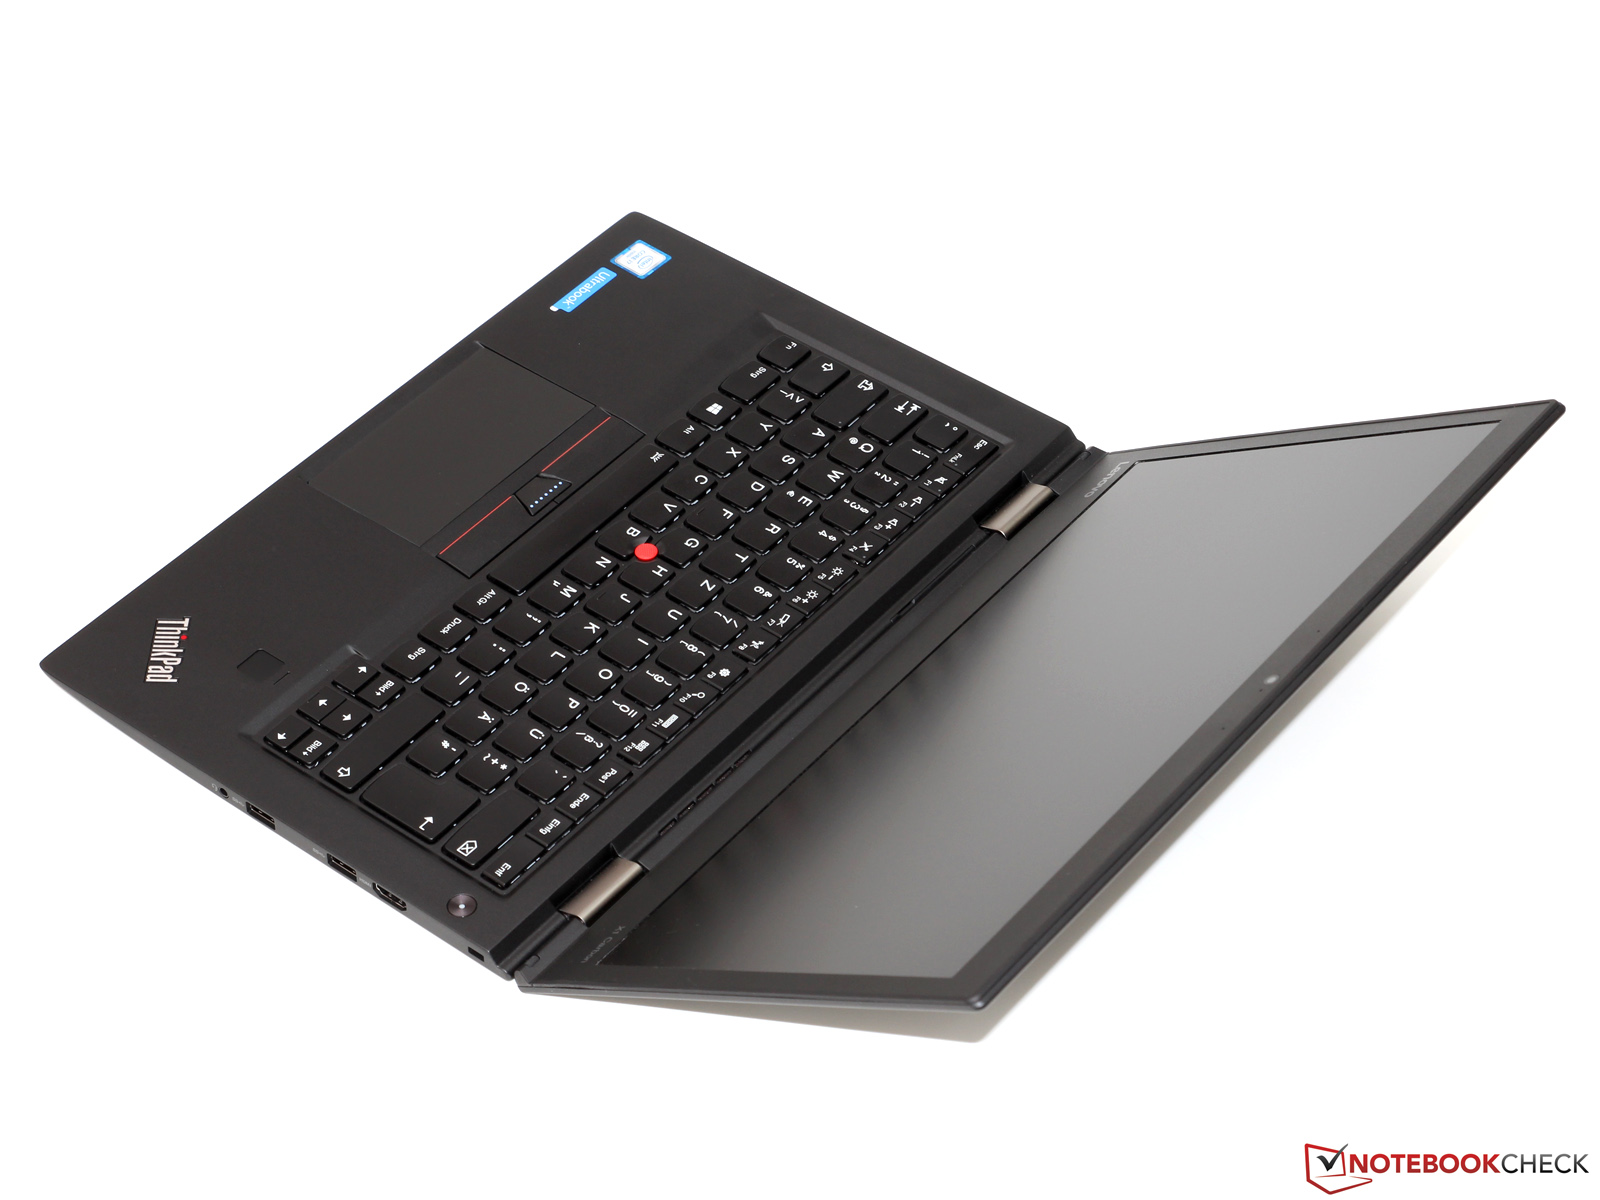
Con un peso di 1.2 kg, potete portare il ThinkPad in ogni viaggio di affari e dura tranquillamente una giornata di lavoro senza alimentatore. Nonostante il design sottile, non vi lamenterete delle prestazioni, della connettività o delle emissioni. Oltre questo, Lenovo ha incorporato un pannello WQHD molto attraente con colori e contrasto eccellenti, che al massimo potrebbe essere un po' più luminoso.
Tuttavia, ci sono buone ragioni per preferire il T460s rispetto all'X1 Carbon. In cambio di un case leggermente più grande, avrete una tastiera migliore, opzioni di upgrade e connettività (porta nativa LAN, SmartCard, SD reader) oltre a prestazioni migliori grazie al TDP superiore. In aggiunta, il prezzo del T460s è più attraente, sebbene sempre elevato. Considerando il tutto, tendiamo a raccomandare la serie T - tuttavia, questa decisione potrebbe variare in base all'utente.
Nota: si tratta di una recensione breve, con alcune sezioni non tradotte, per la versione integrale in inglese guardate qui.
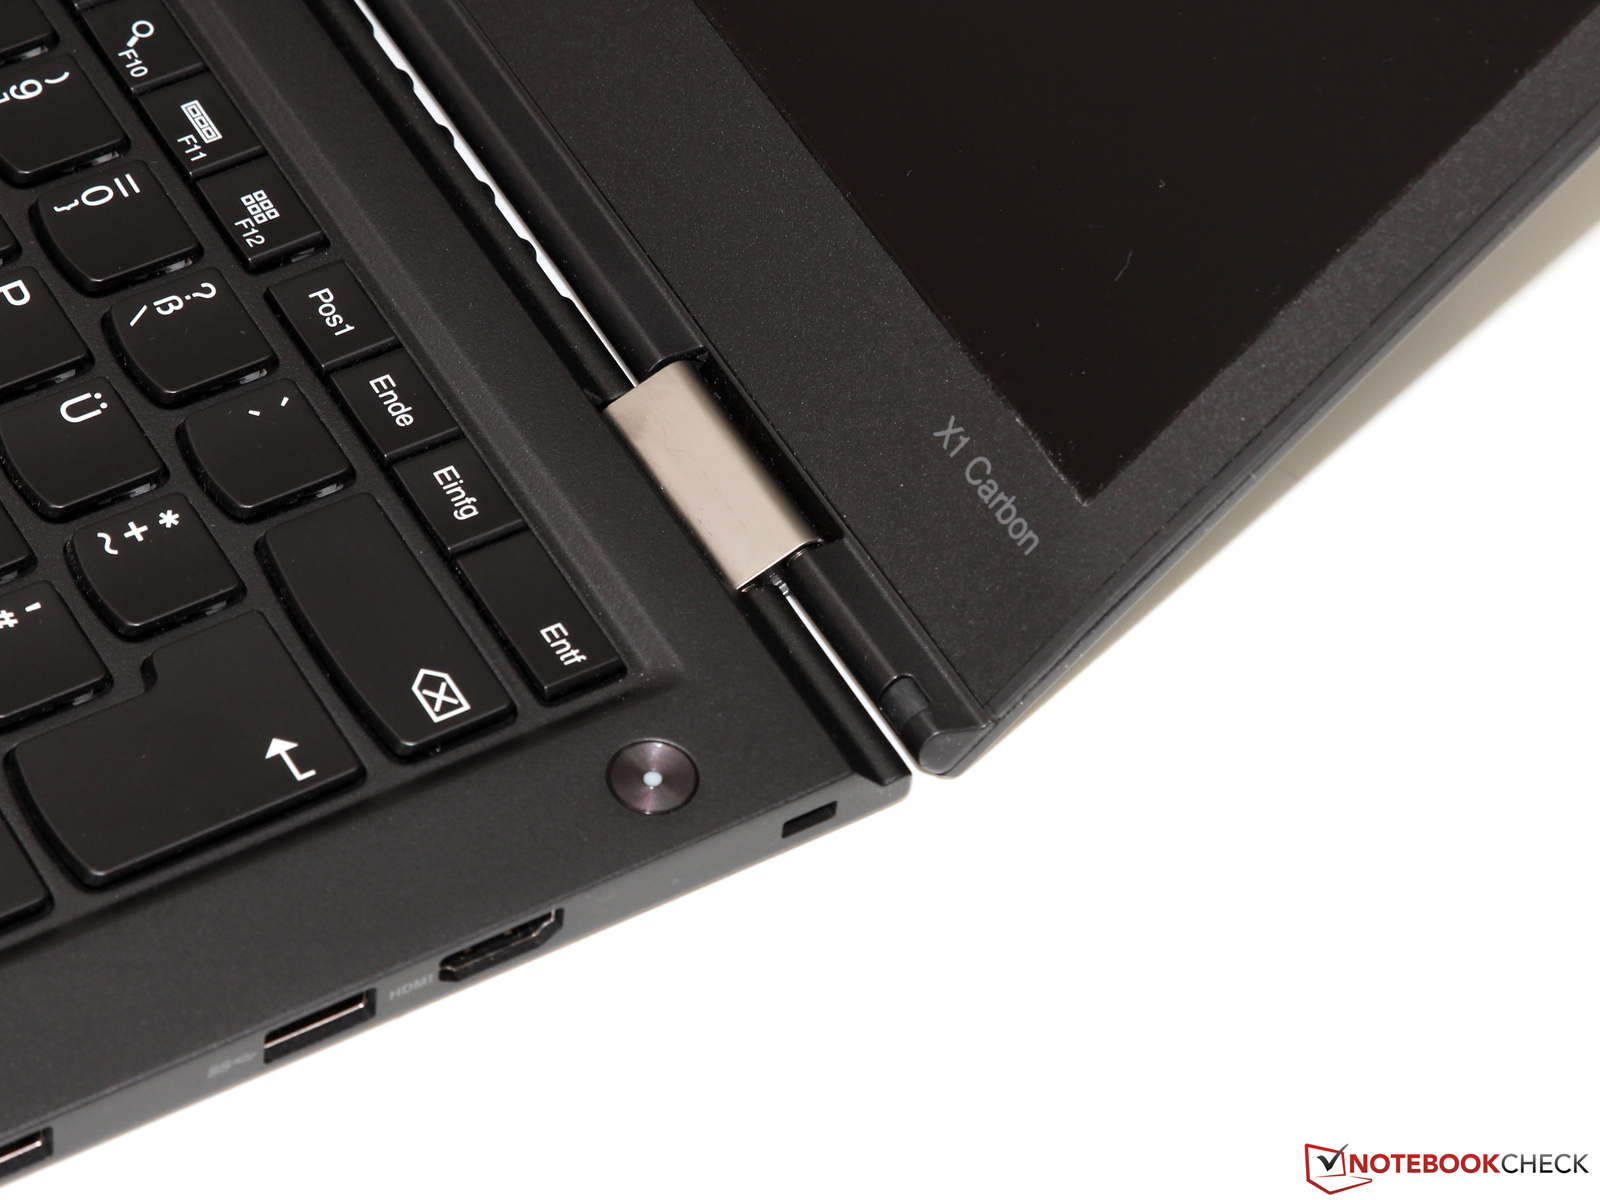
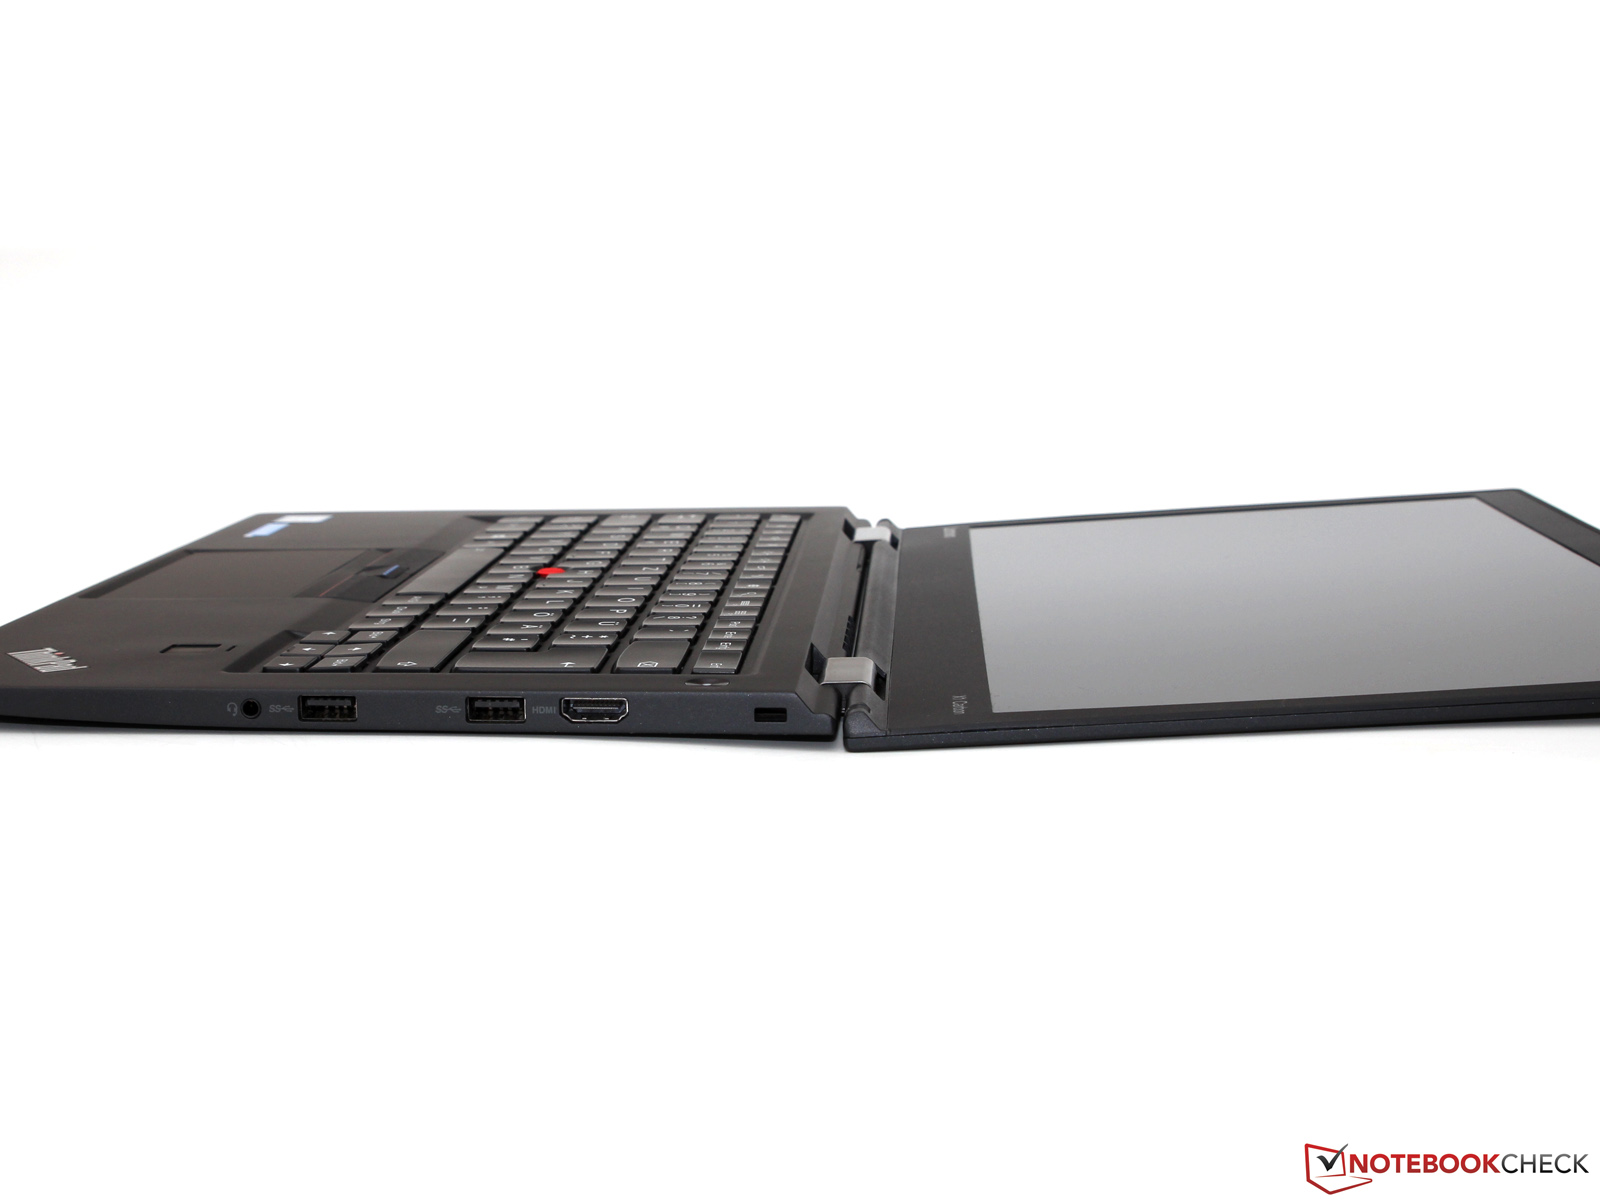
Lenovo ThinkPad X1 Carbon 20FB003RGE
- 04/18/2016 v5.1 (old)
Till Schönborn