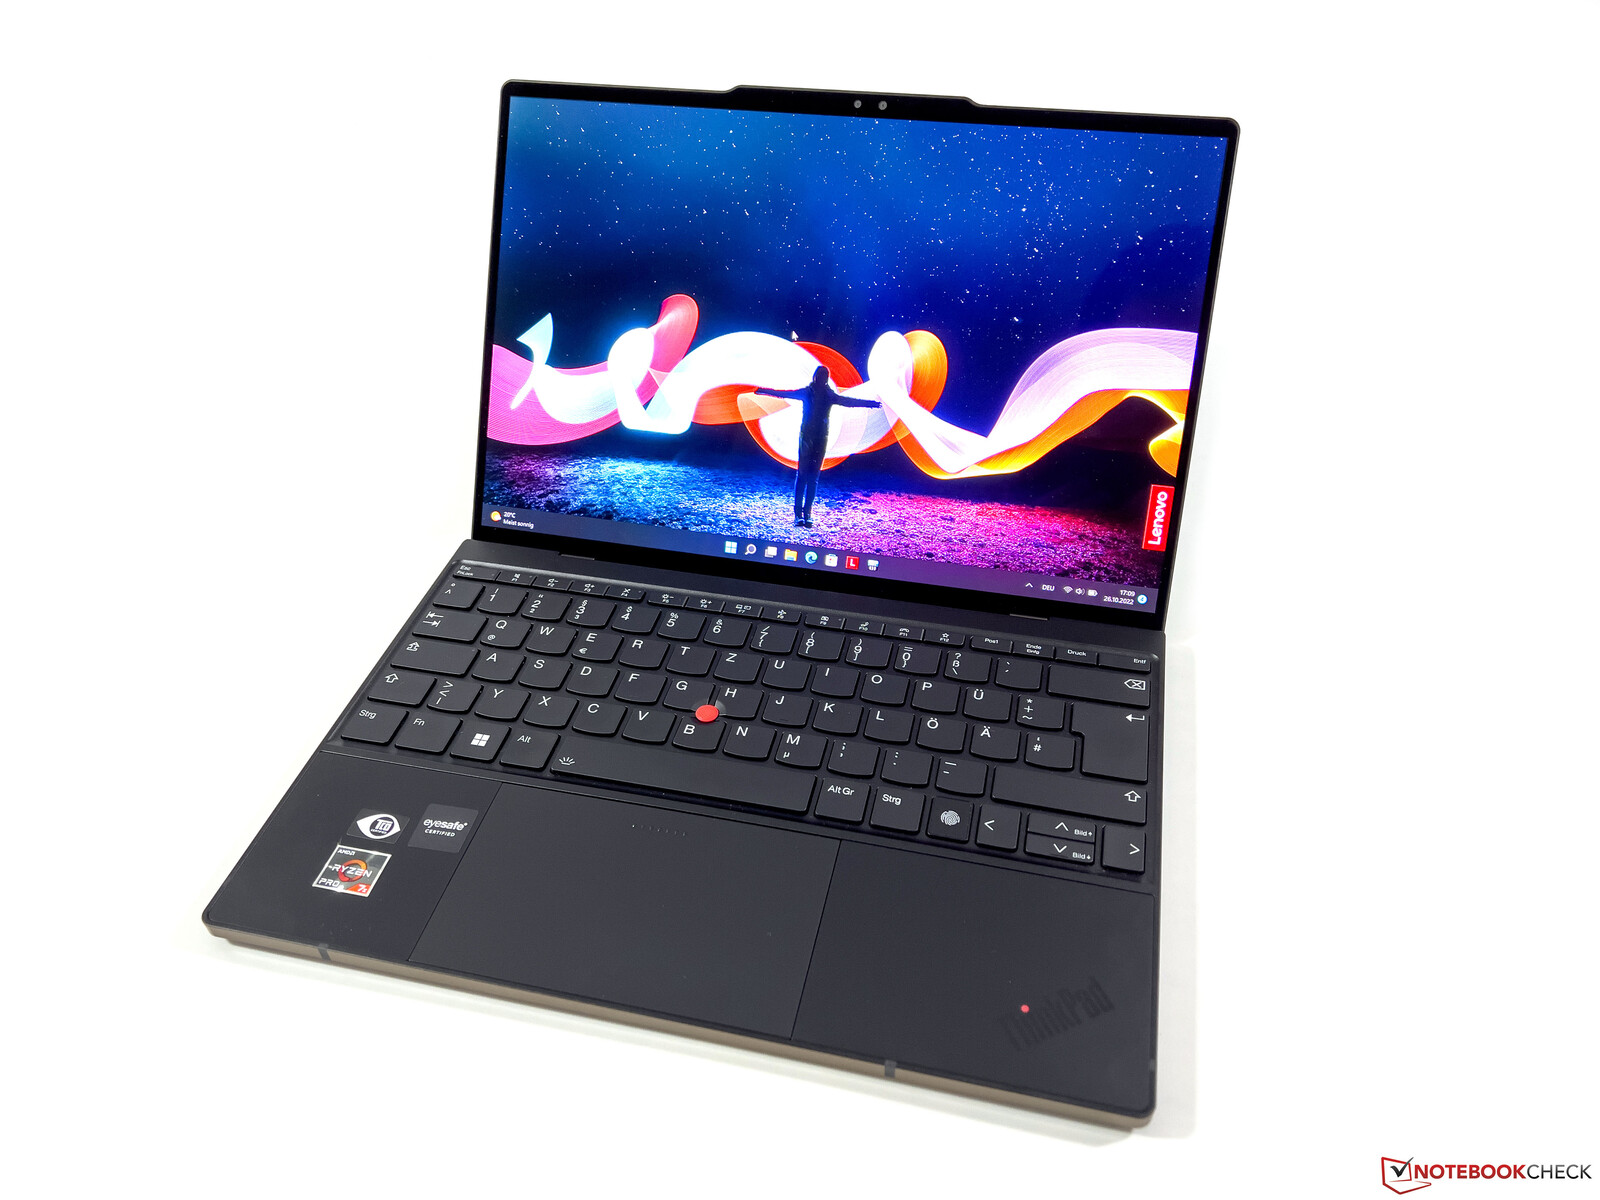
Recensione del Lenovo ThinkPad Z13 G1 OLED - Laptop business con AMD Ryzen 7 Pro 6860Z
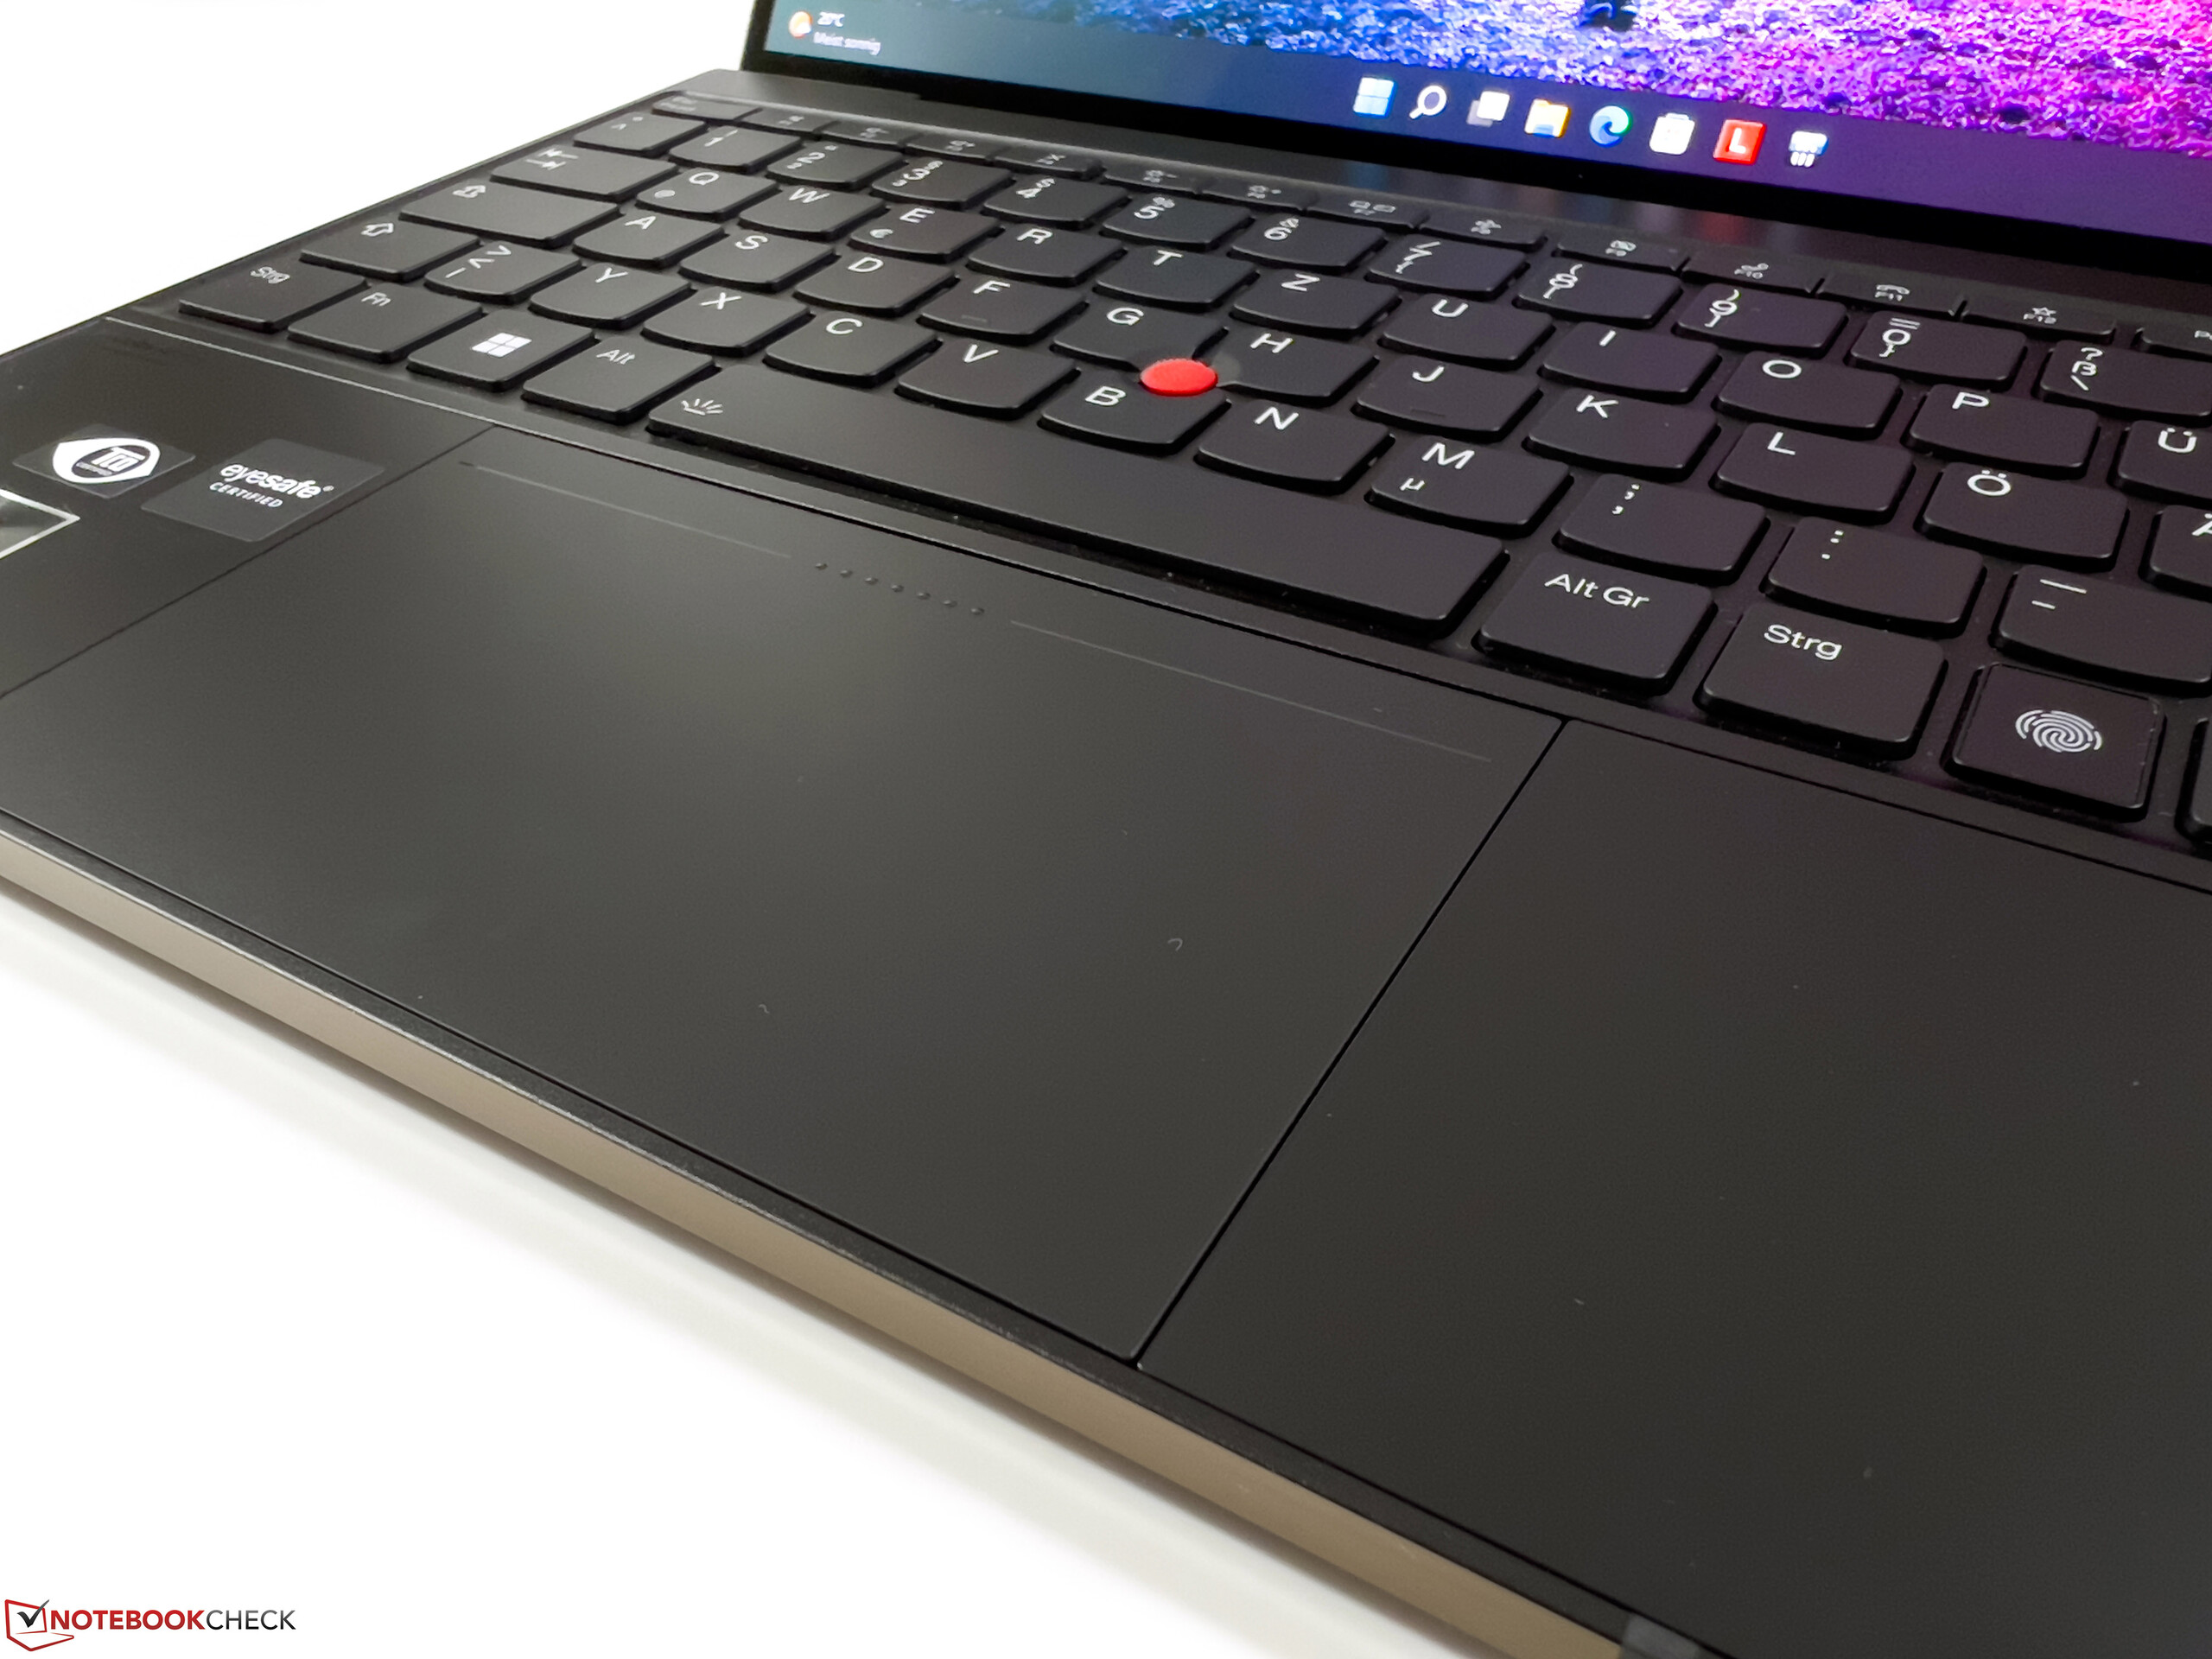
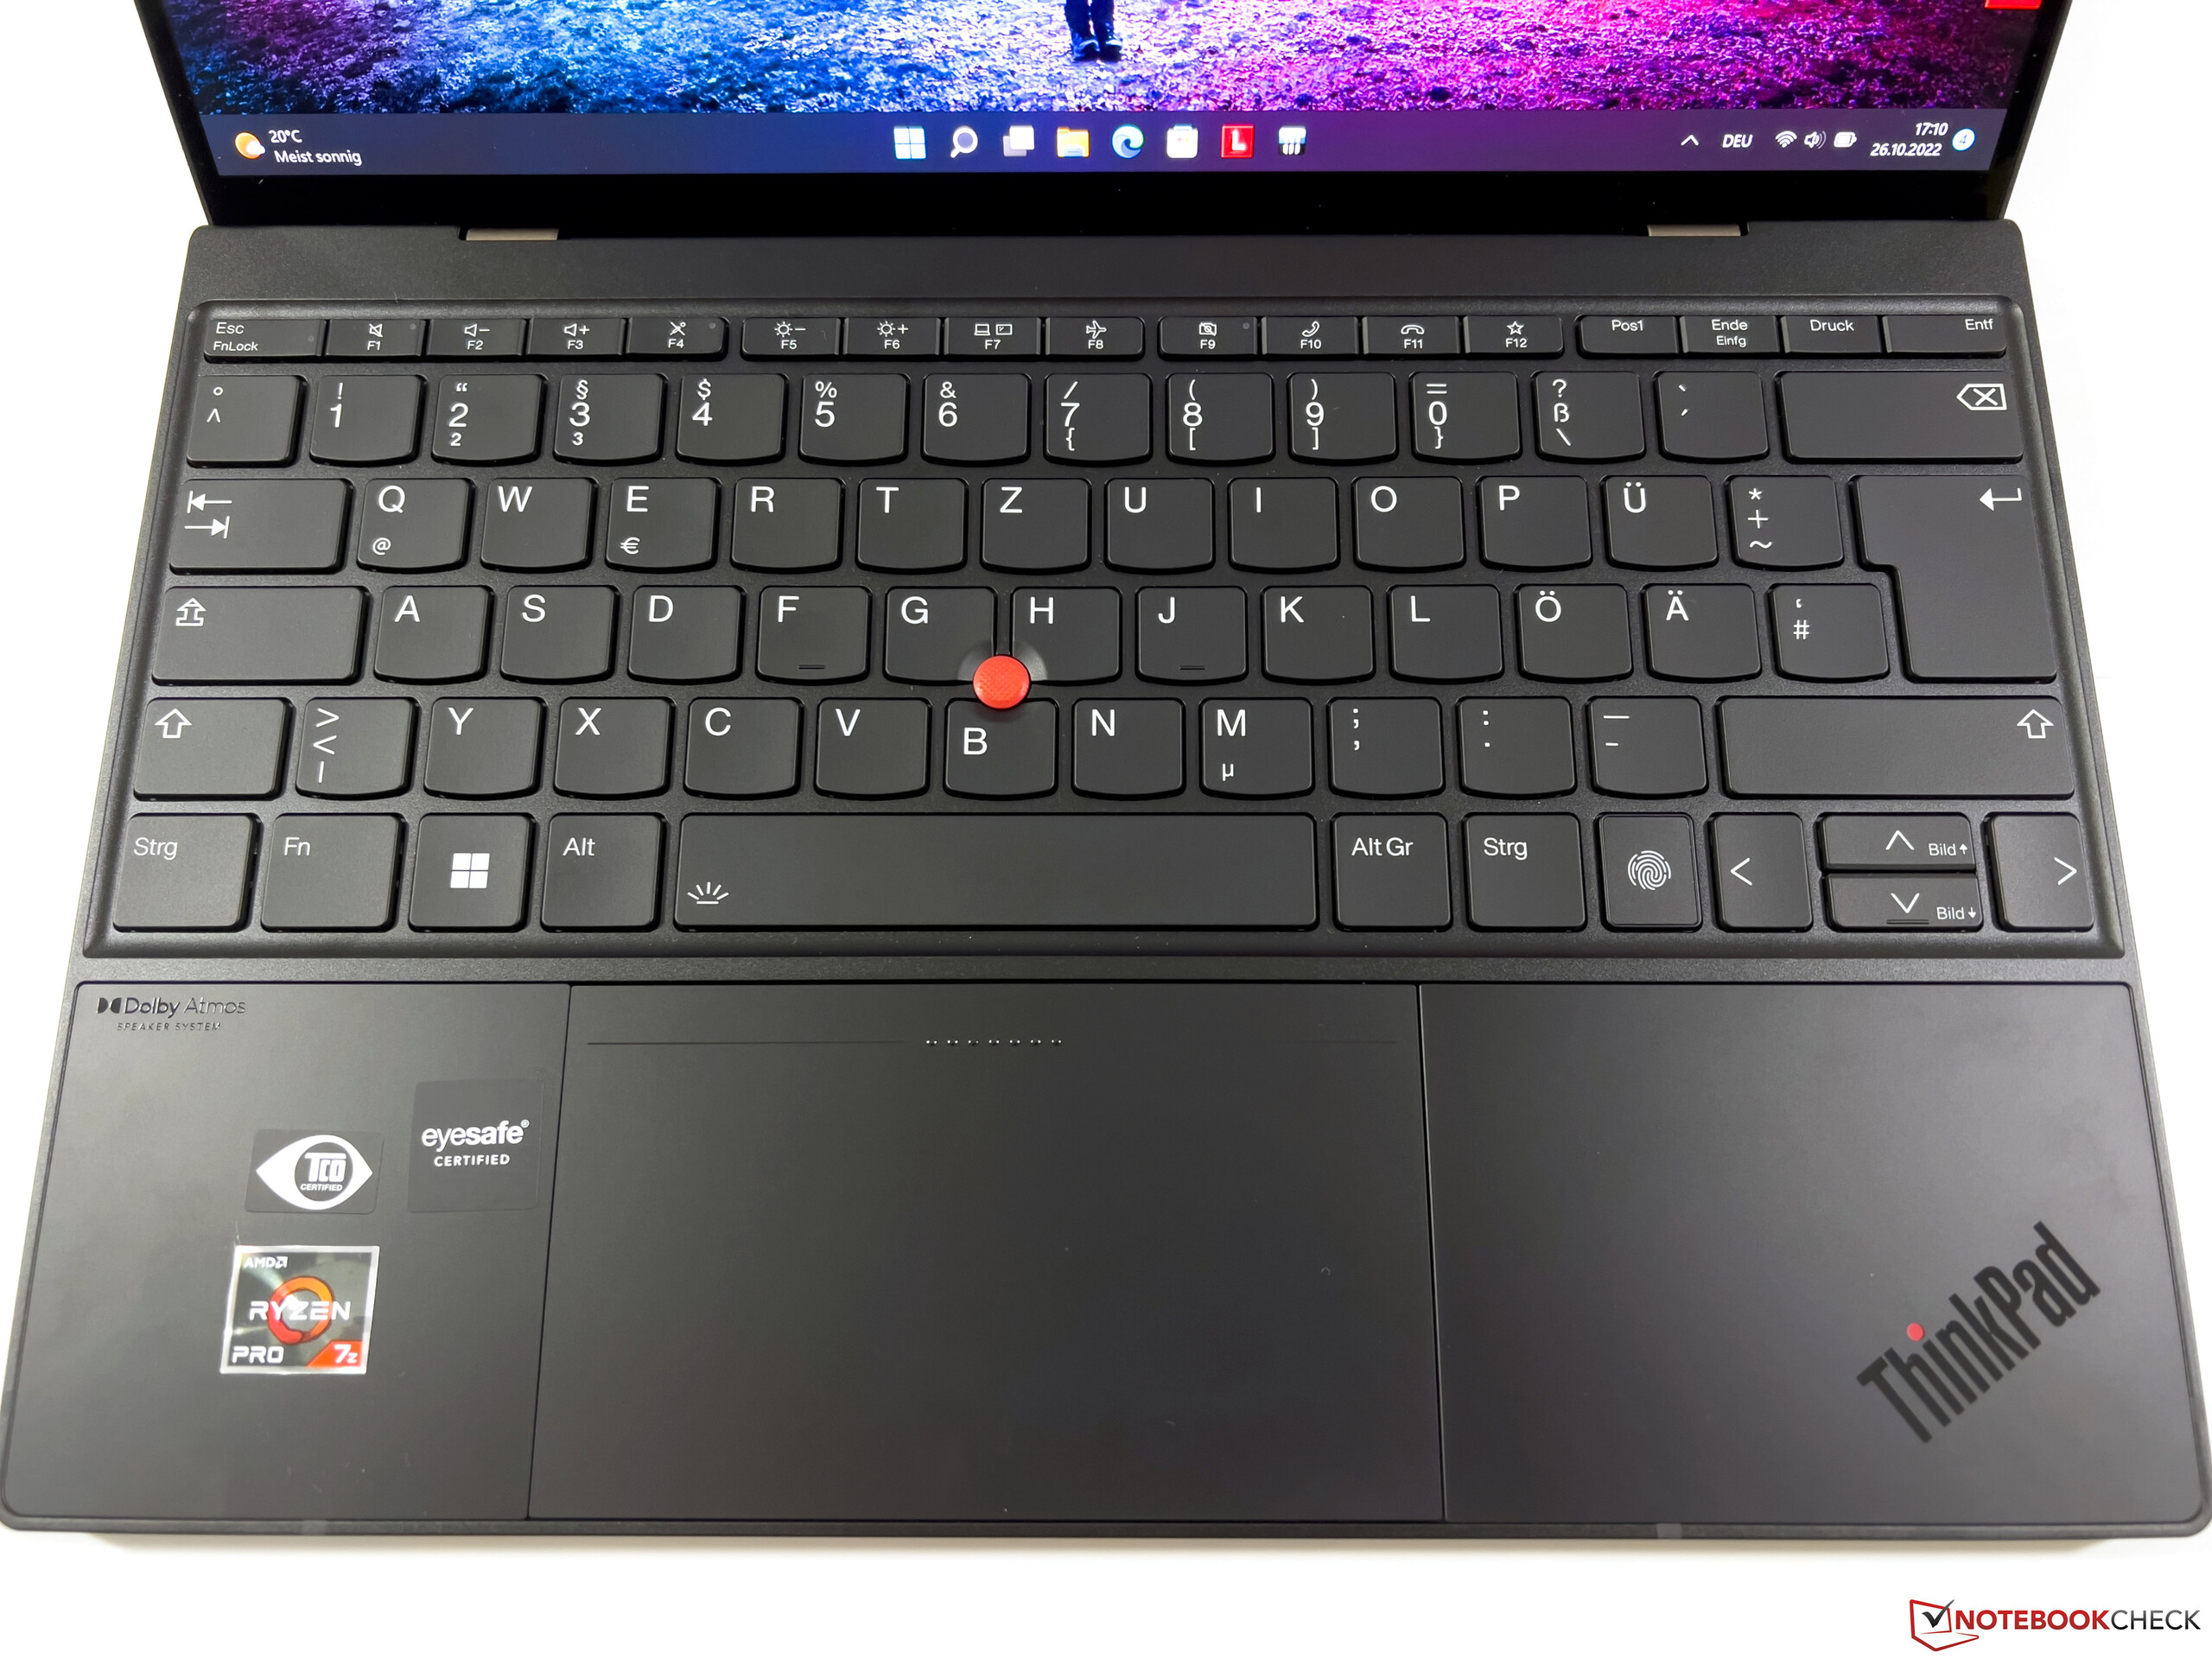
Con la serie ThinkPad Z, Lenovo ha da qualche mese una linea di prodotti dedicata ai modelli AMD. Abbiamo già testato a fondo il modello entry-level del ThinkPad Z13 con Ryzen 5 Pro e un normale pannello IPS Full HD. Il design completamente nuovo offre alcuni nuovi approcci e gli utenti ThinkPad di vecchia data dovranno abituarsi ad alcuni cambiamenti (TrackPoint senza tasti dedicati, cerniera che si apre solo fino a 135 gradi, riposizionamento del tasto Fn, assenza di Kensington Lock).
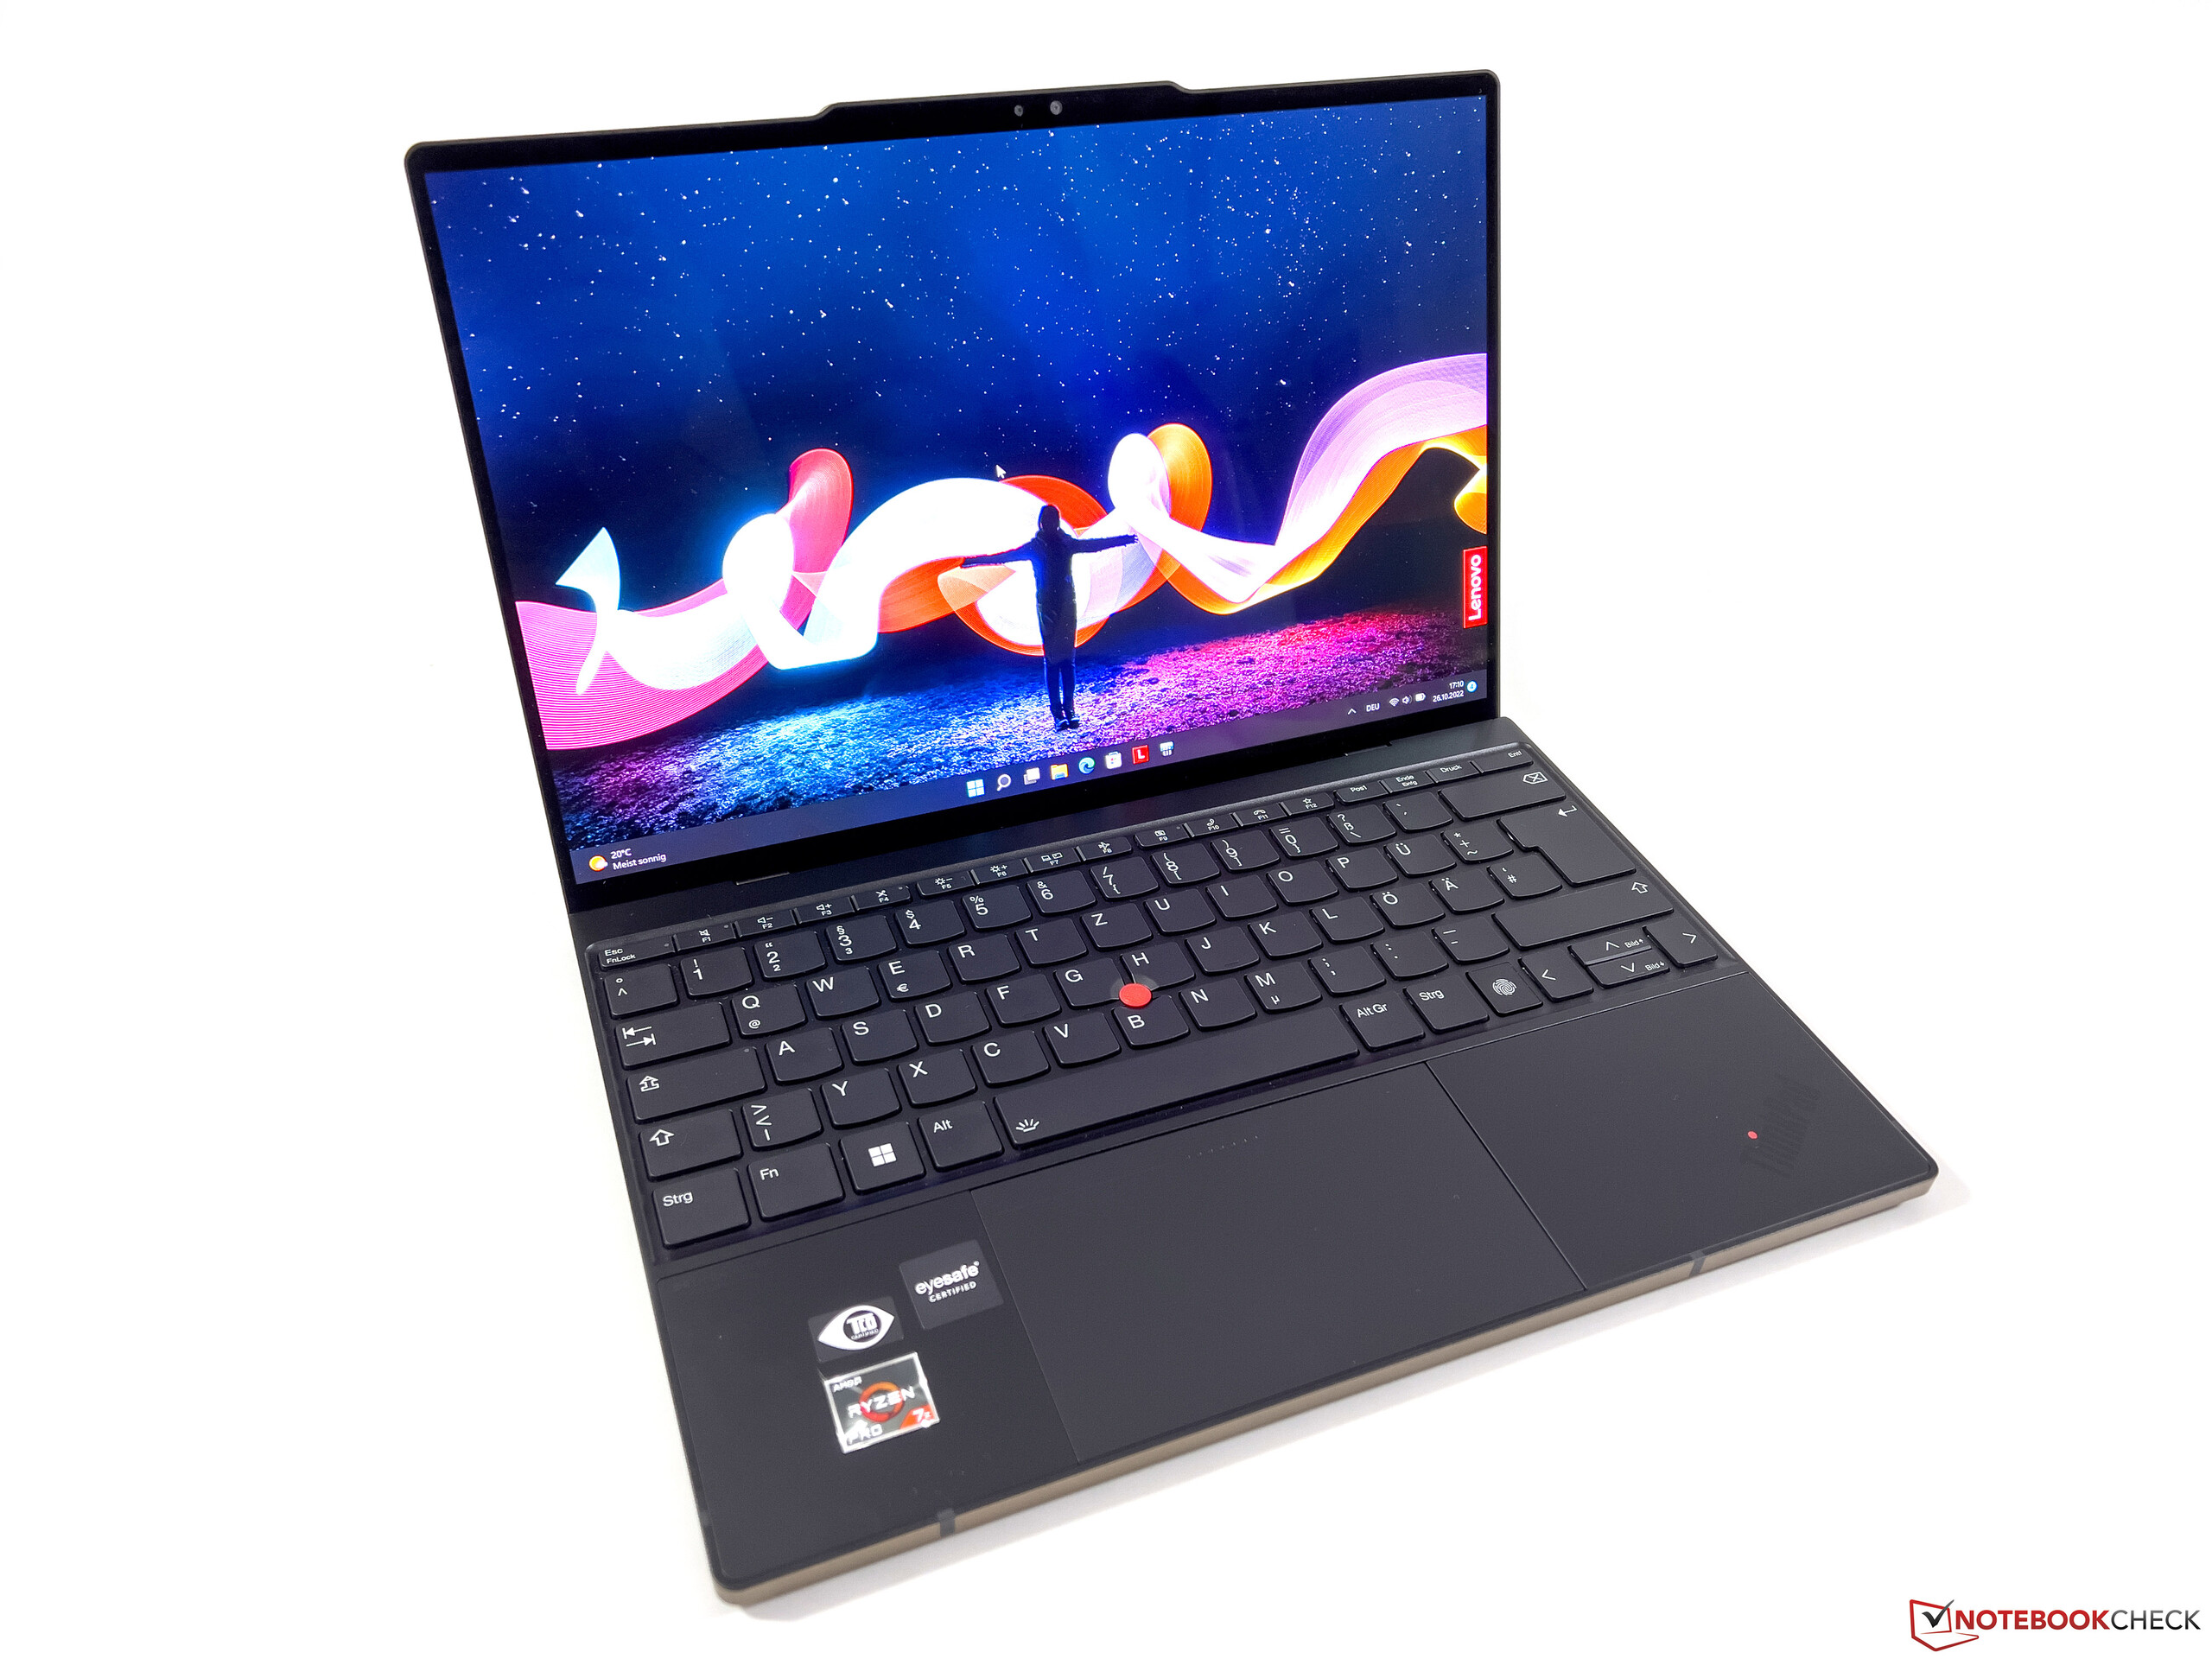
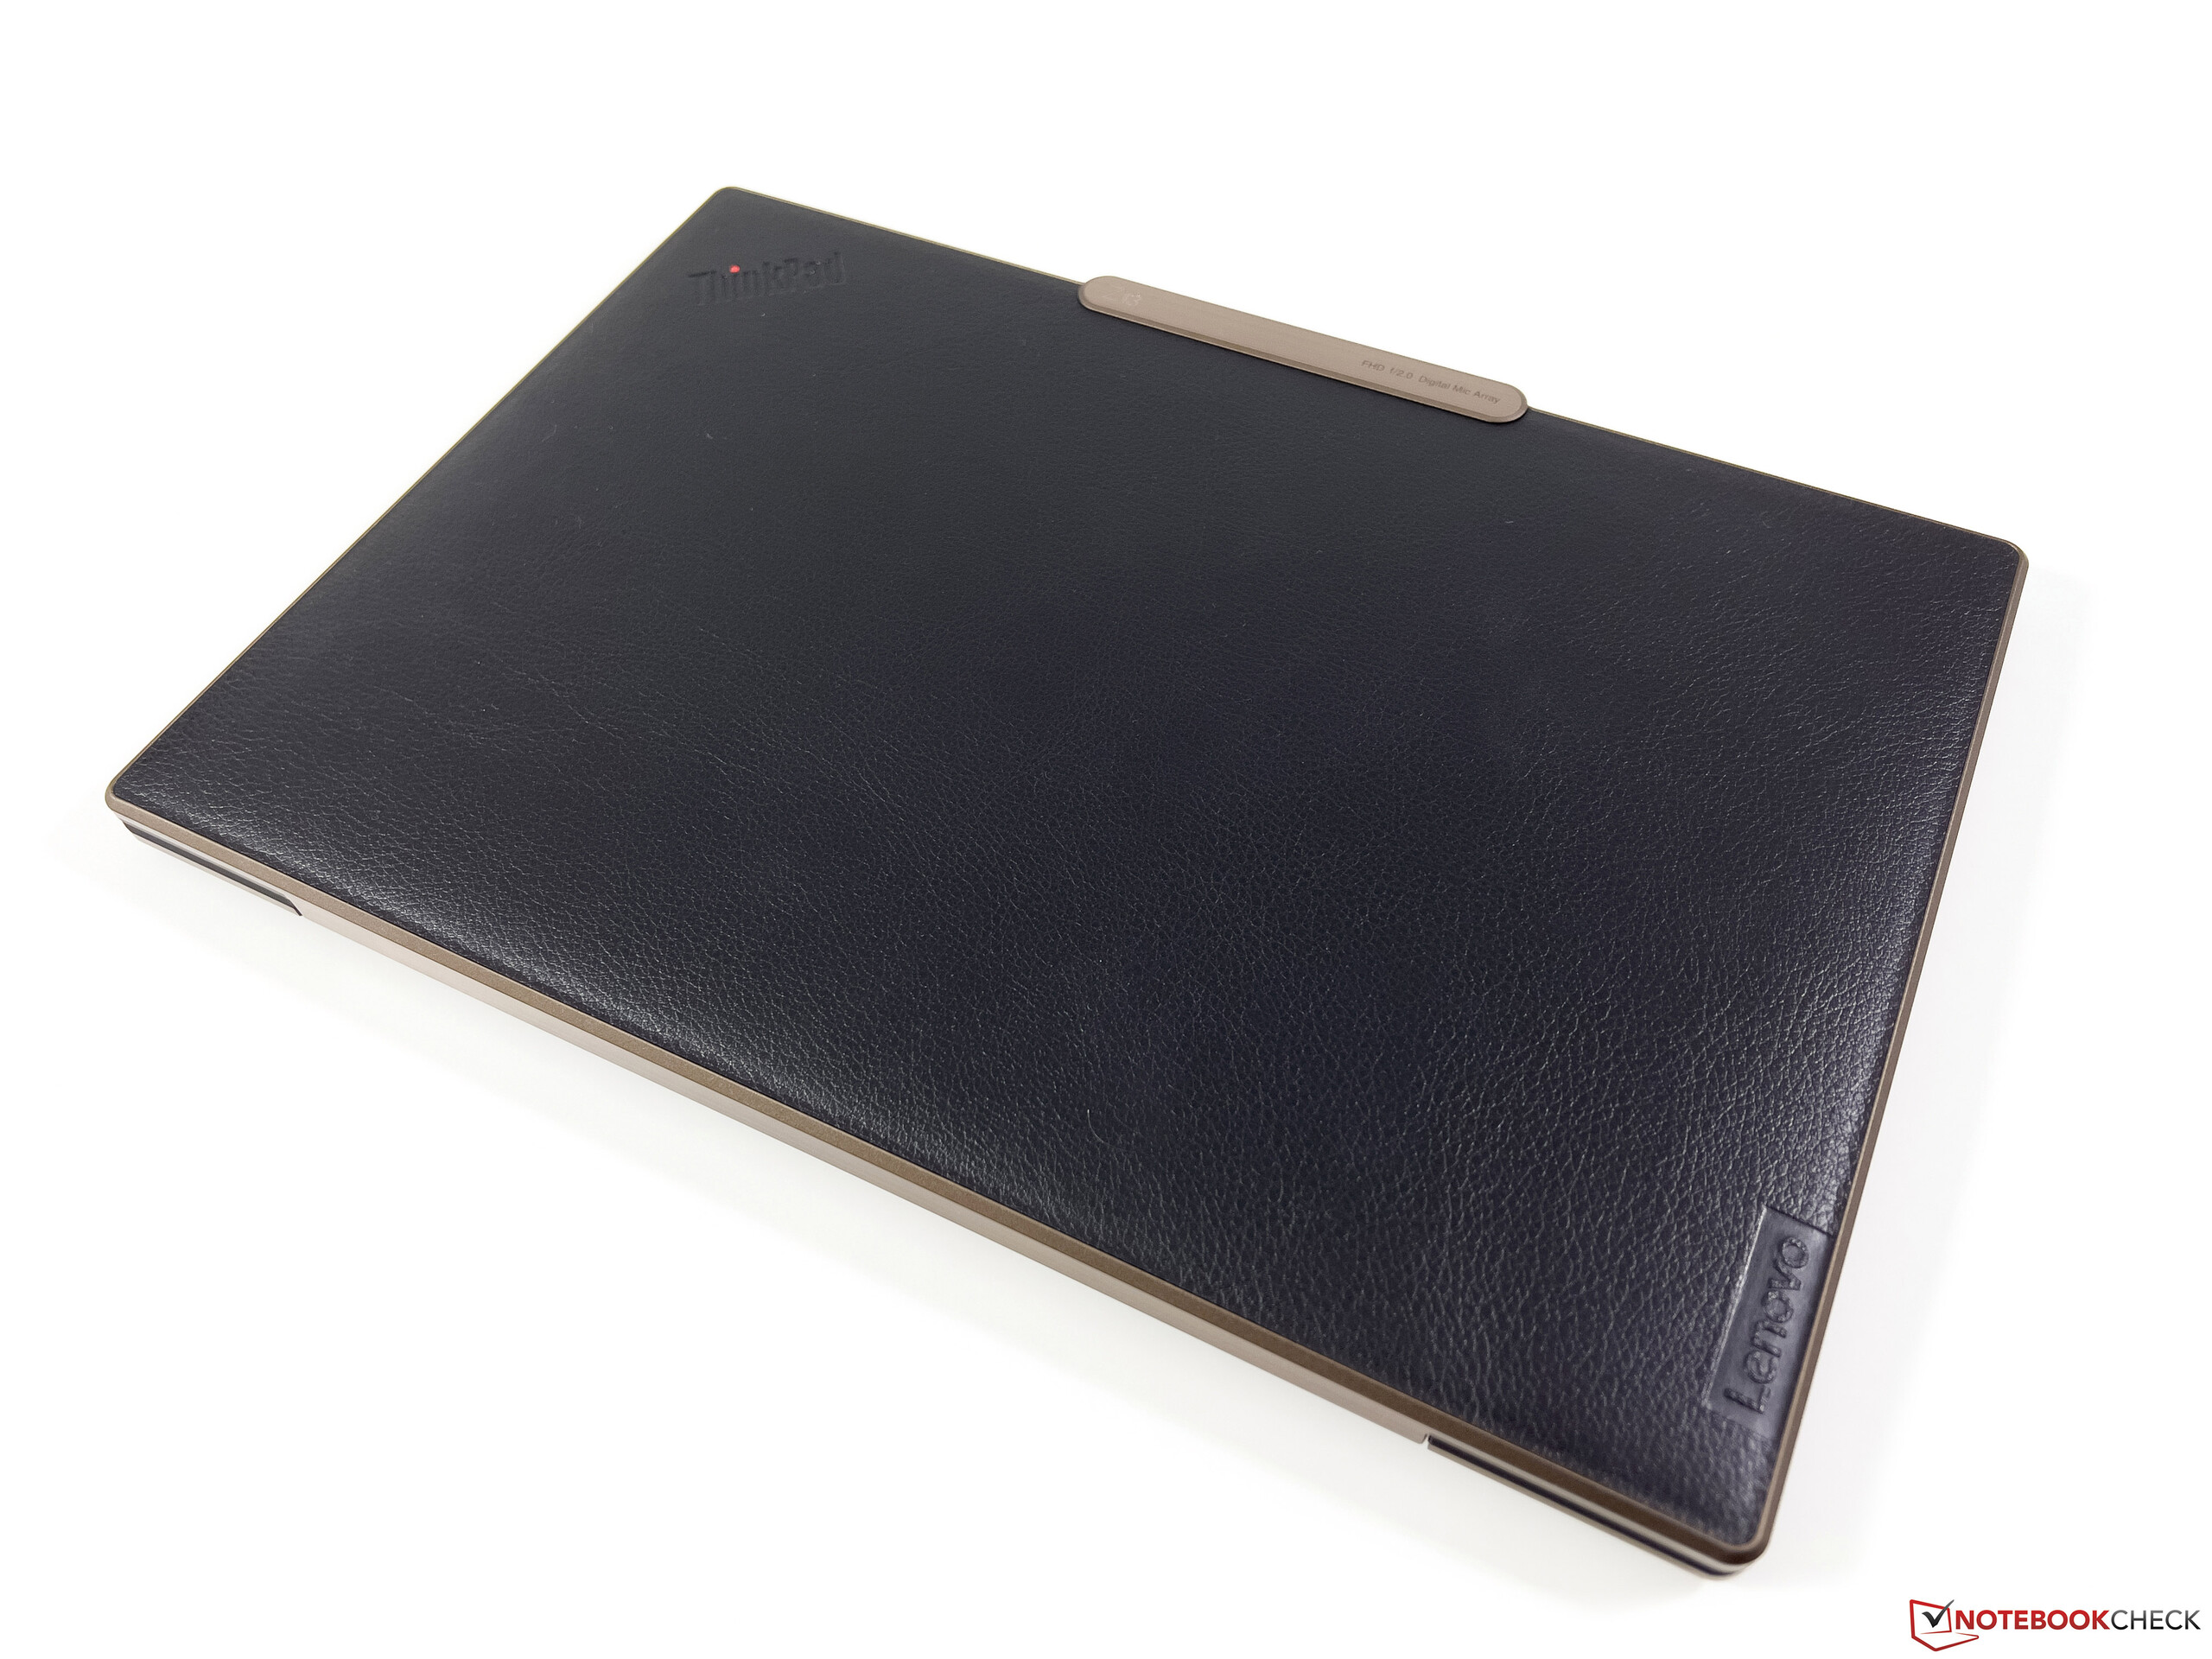
Oggi diamo un'occhiata al modello di fascia alta del ThinkPad Z13 con il suo AMD Ryzen 7 Pro 6860Z che viene offerto esclusivamente nel ThinkPad Z13. Questa configurazione ha uno schermo OLED, un modulo LTE e un design speciale con un coperchio dello schermo in finta pelle con riflessi color bronzo. In questo report ci concentriamo principalmente sulle differenze rispetto al modello entry-level e non ci soffermiamo sulle somiglianze. Informazioni pertinenti sono disponibili nella nostra recensione dettagliata del ThinkPad Z13 con il processore Ryzen 5 Pro 6650U
- Recensione del portatile Lenovo ThinkPad Z13: Il ThinkPad premium di AMD con una lunga durata della batteria
- Recensione del portatile Lenovo ThinkPad Z16 G1: La potente ammiraglia AMD con un intoppo
Potenziali concorrenti a confronto
Punteggio | Data | Modello | Peso | Altezza | Dimensione | Risoluzione | Prezzo |
|---|---|---|---|---|---|---|---|
| 88.8 % v7 (old) | 10/2022 | Lenovo ThinkPad Z13 G1-21D20016GE R7 PRO 6860Z, Radeon 680M | 1.3 kg | 14 mm | 13.30" | 2880x1800 | |
| 90.1 % v7 (old) | 07/2022 | Asus Zenbook S 13 OLED R7 6800U, Radeon 680M | 1.1 kg | 14.9 mm | 13.30" | 2880x1800 | |
| 87.3 % v7 (old) | 09/2022 | Dell XPS 13 Plus 9320 i7-1280P OLED i7-1280P, Iris Xe G7 96EUs | 1.3 kg | 15.28 mm | 13.40" | 3456x2160 | |
| 92 % v7 (old) | 08/2022 | Apple MacBook Air M2 10C GPU M2, M2 10-Core GPU | 1.2 kg | 11.3 mm | 13.60" | 2560x1664 | |
| 90.5 % v7 (old) | 08/2022 | Lenovo ThinkPad Z13 21D2CTO1WW R5 PRO 6650U, Radeon 660M | 1.2 kg | 13.99 mm | 13.30" | 1920x1200 |
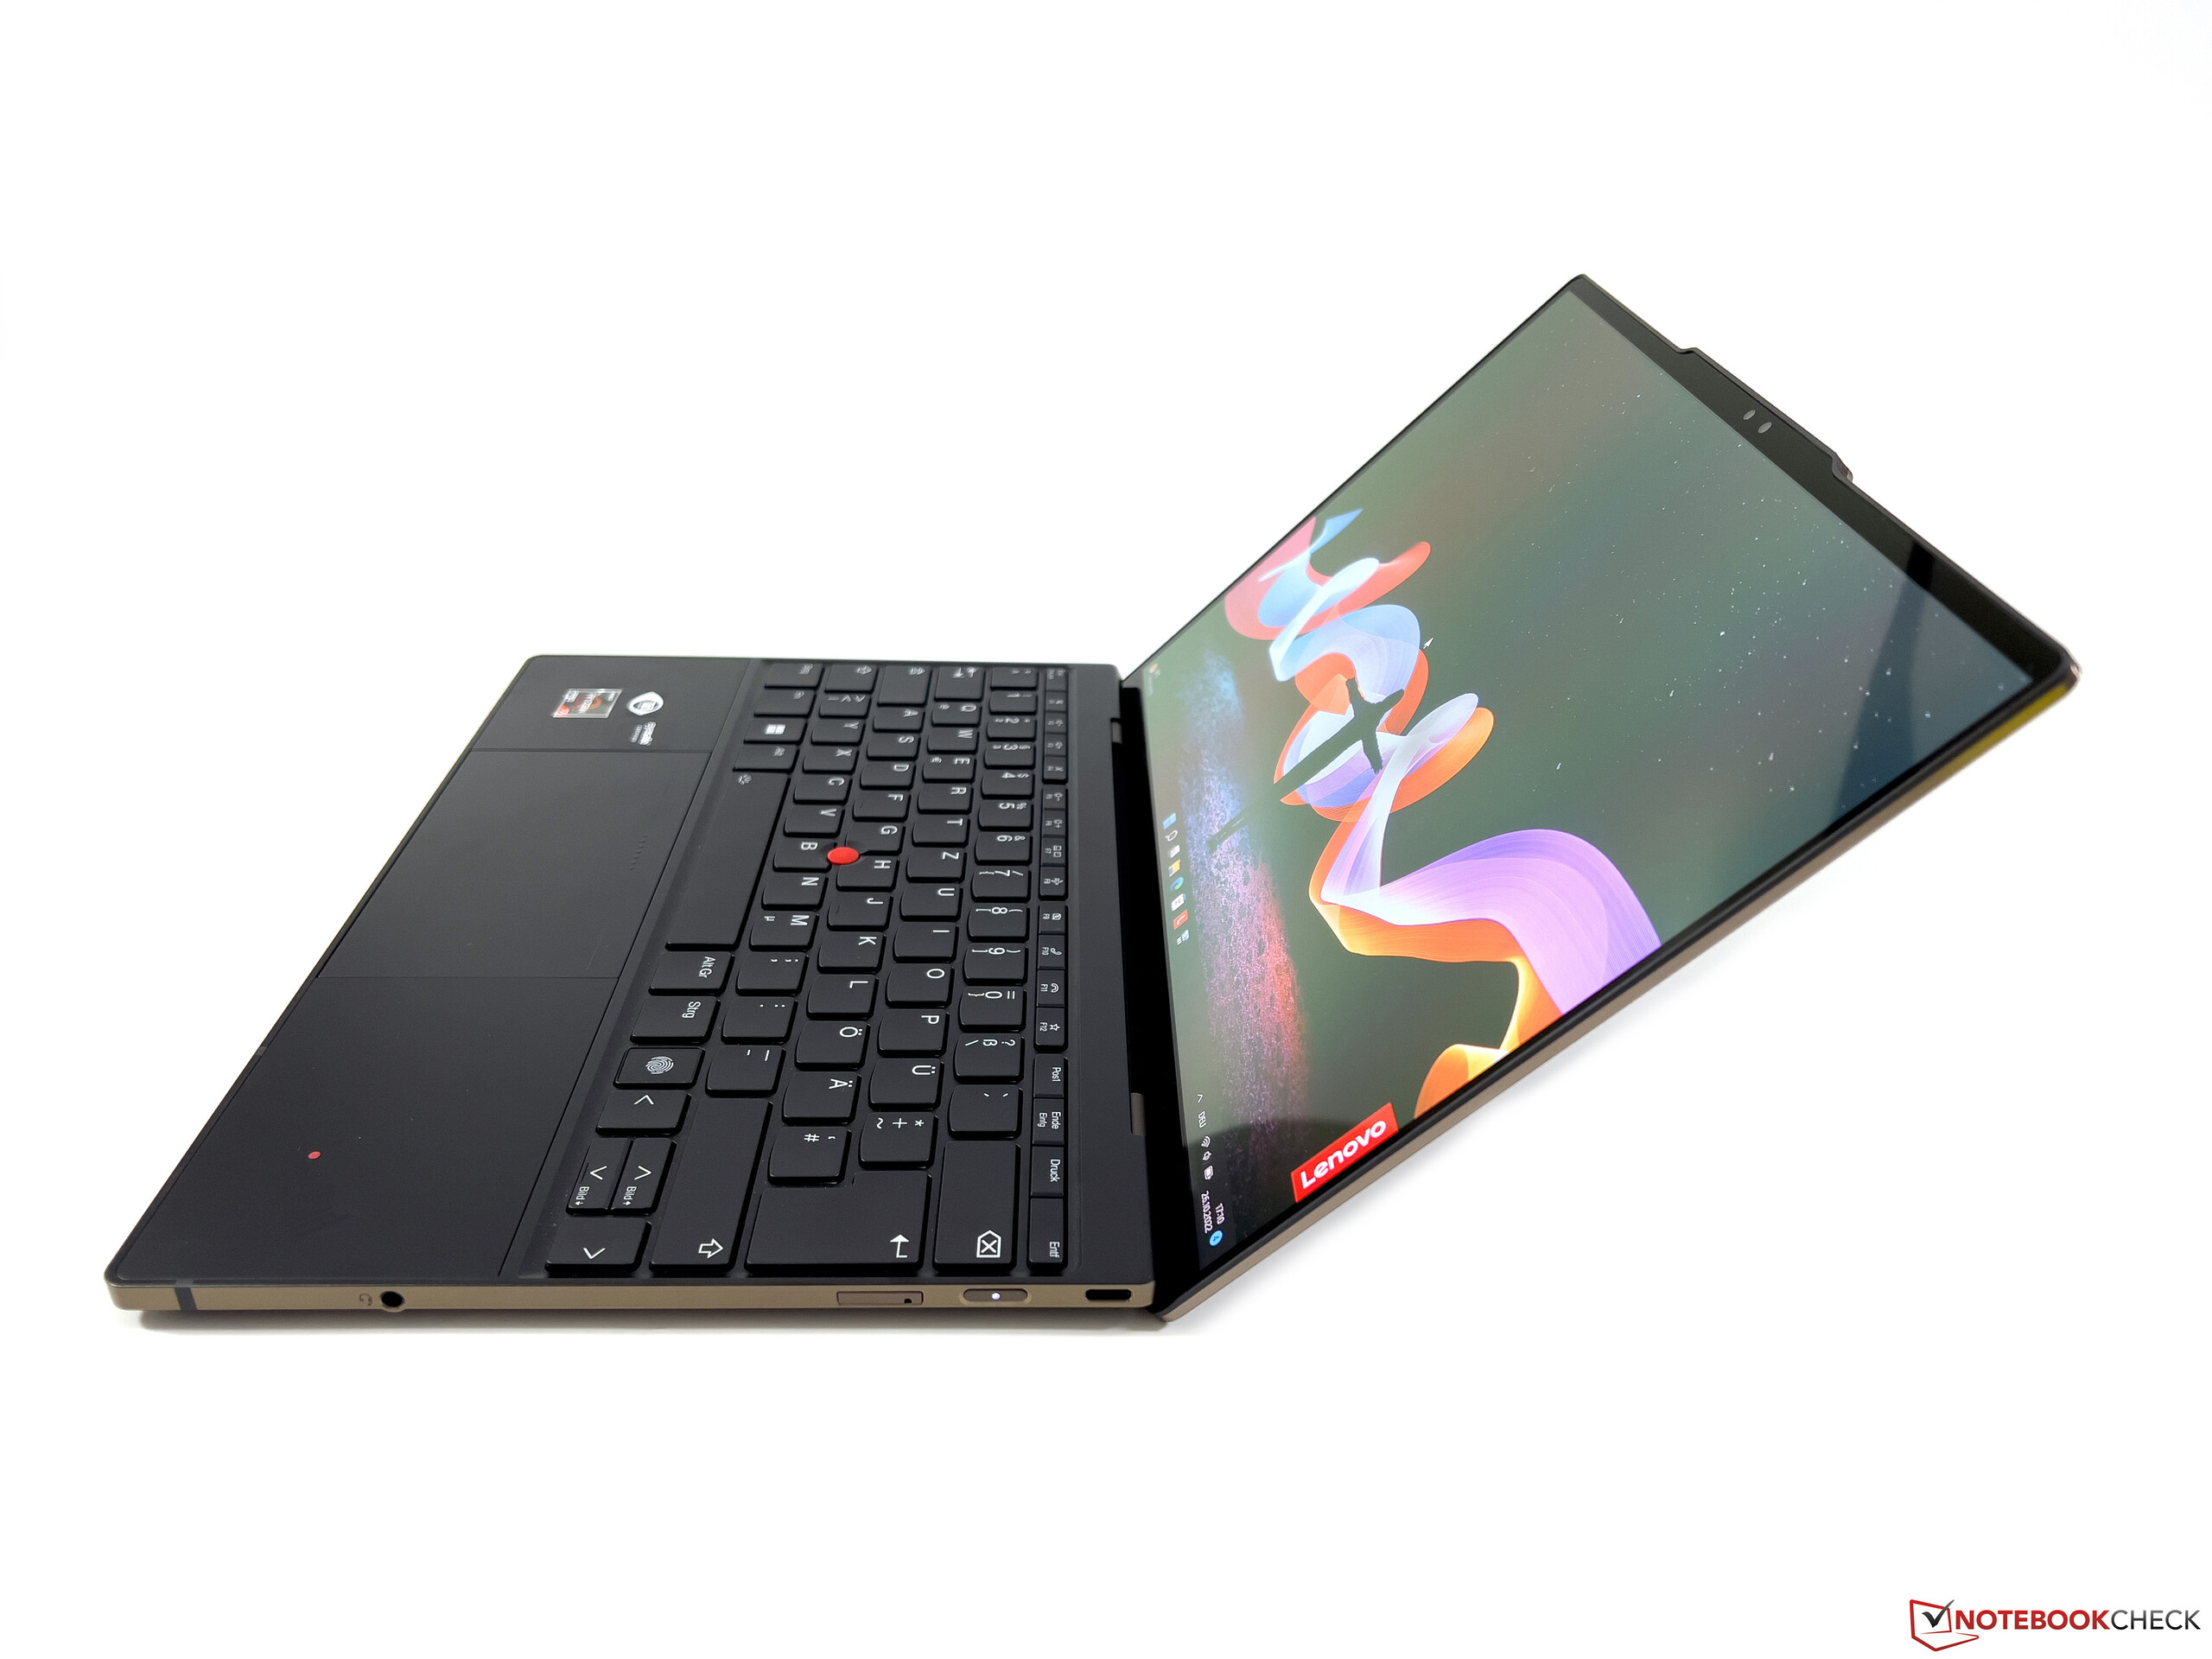
Caso
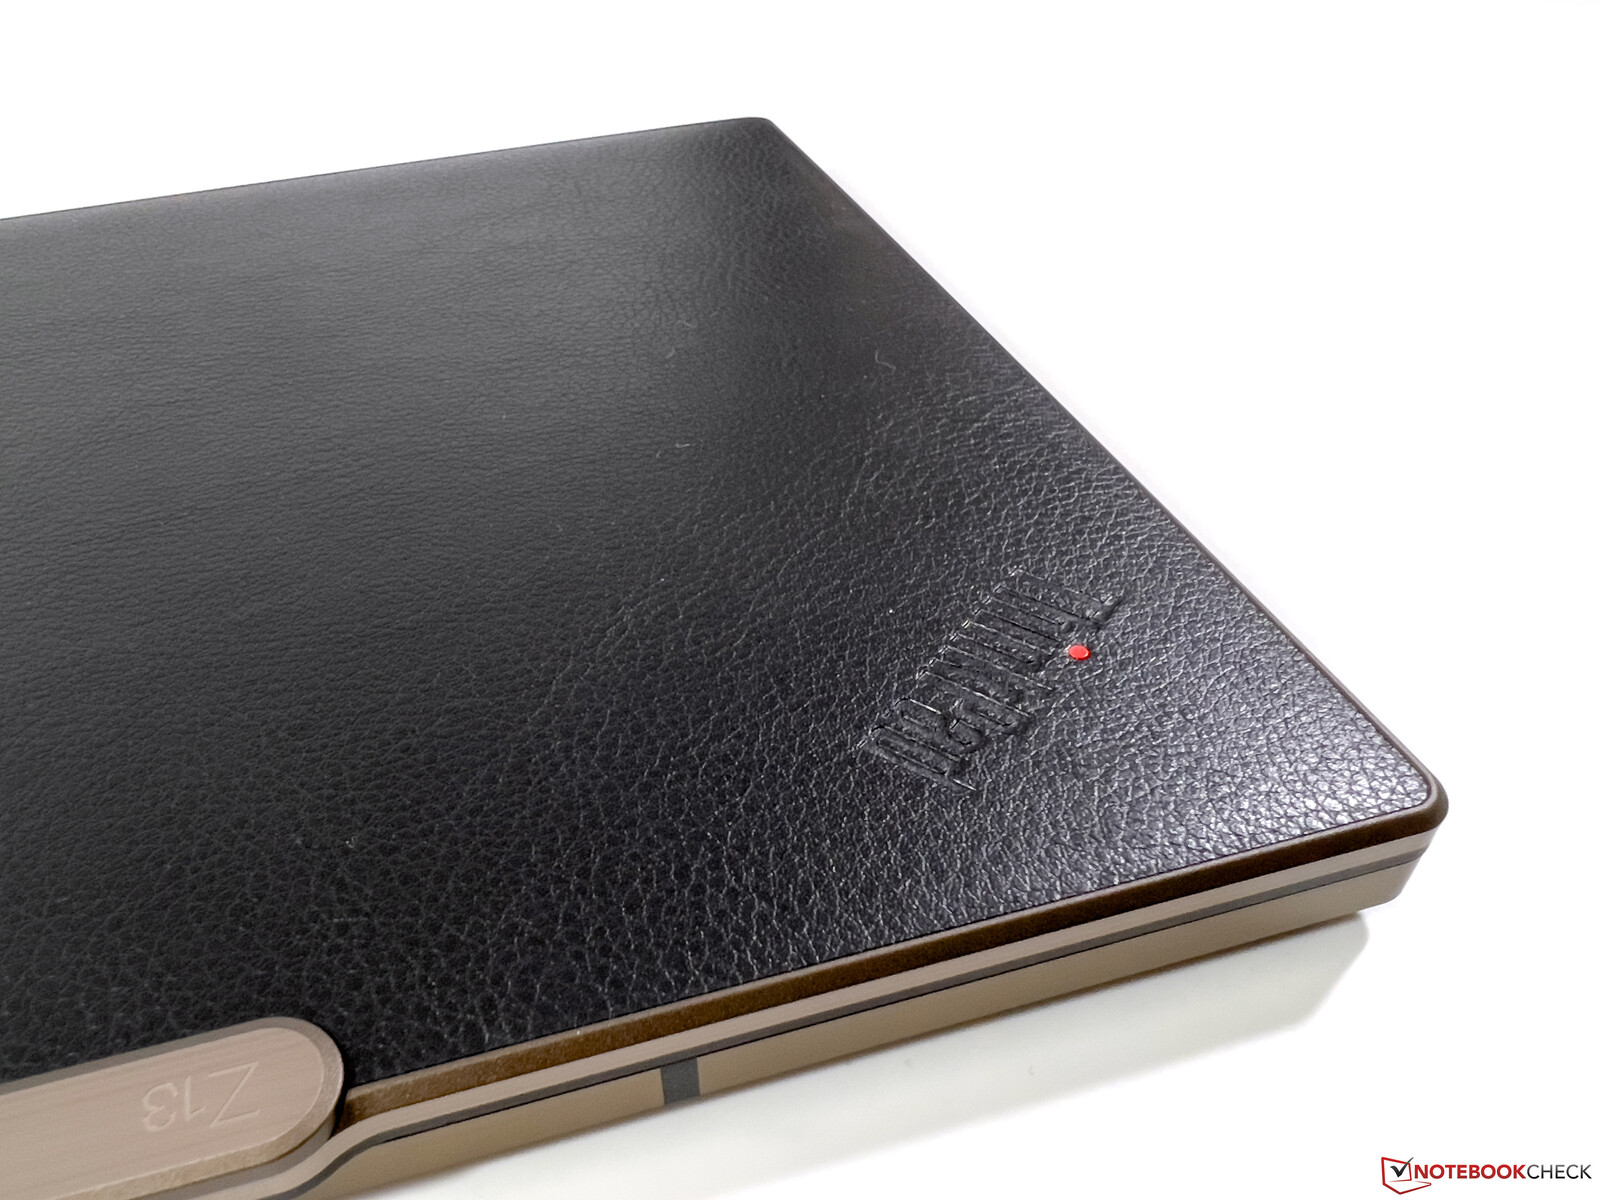
Il case è sostanzialmente identico al modello entry-level del ThinkPad Z13ma nella versione di fascia alta è presente un coperchio per lo schermo con una superficie in finta pelle nera con riflessi color bronzo. È indubbiamente una questione di gusti personali e Lenovo offre delle alternative, ma il paragone con una borsa è difficile da evitare. Se l'attuale Z13 sia diventato più un oggetto di moda o se sia ancora visivamente adatto a un ambiente di lavoro, è una questione di scelta personale. Dal punto di vista della qualità, tuttavia, non c'è nulla di sbagliato e il ThinkPad Z13 è davvero di alta qualità.
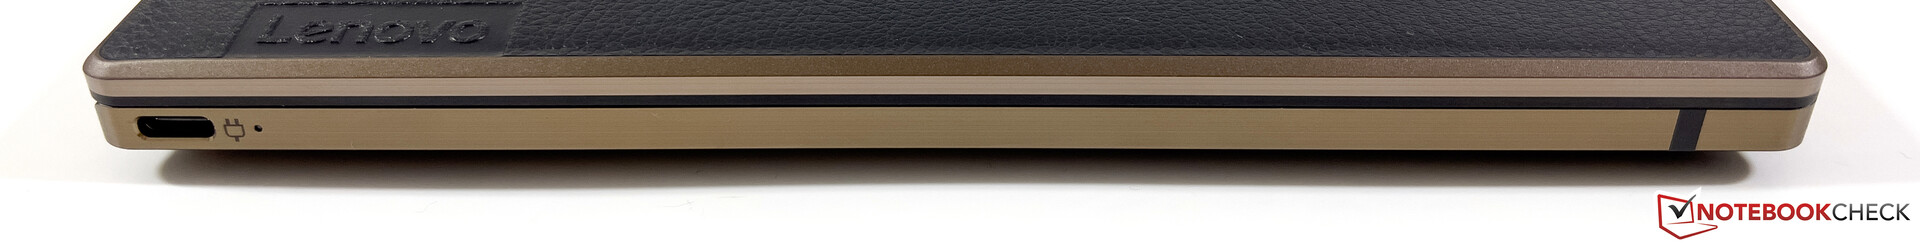
Connettività - Z13 con Wi-Fi 6E e LTE
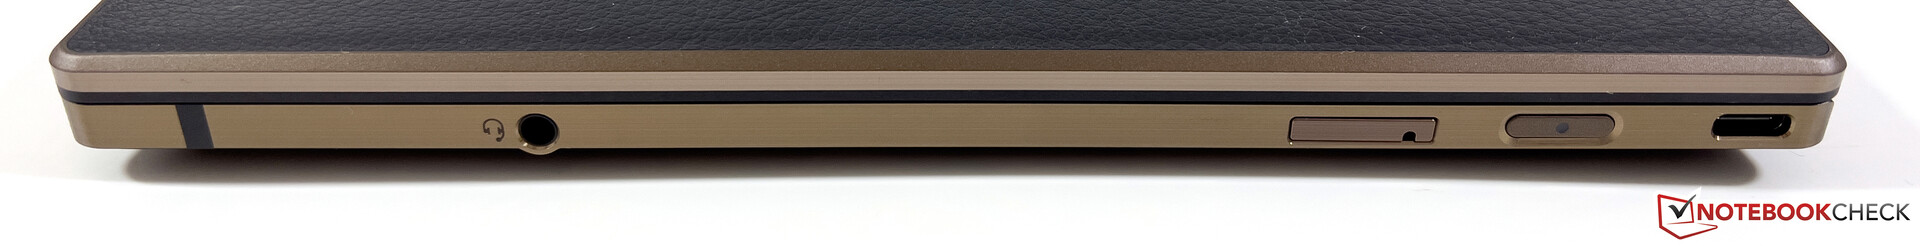
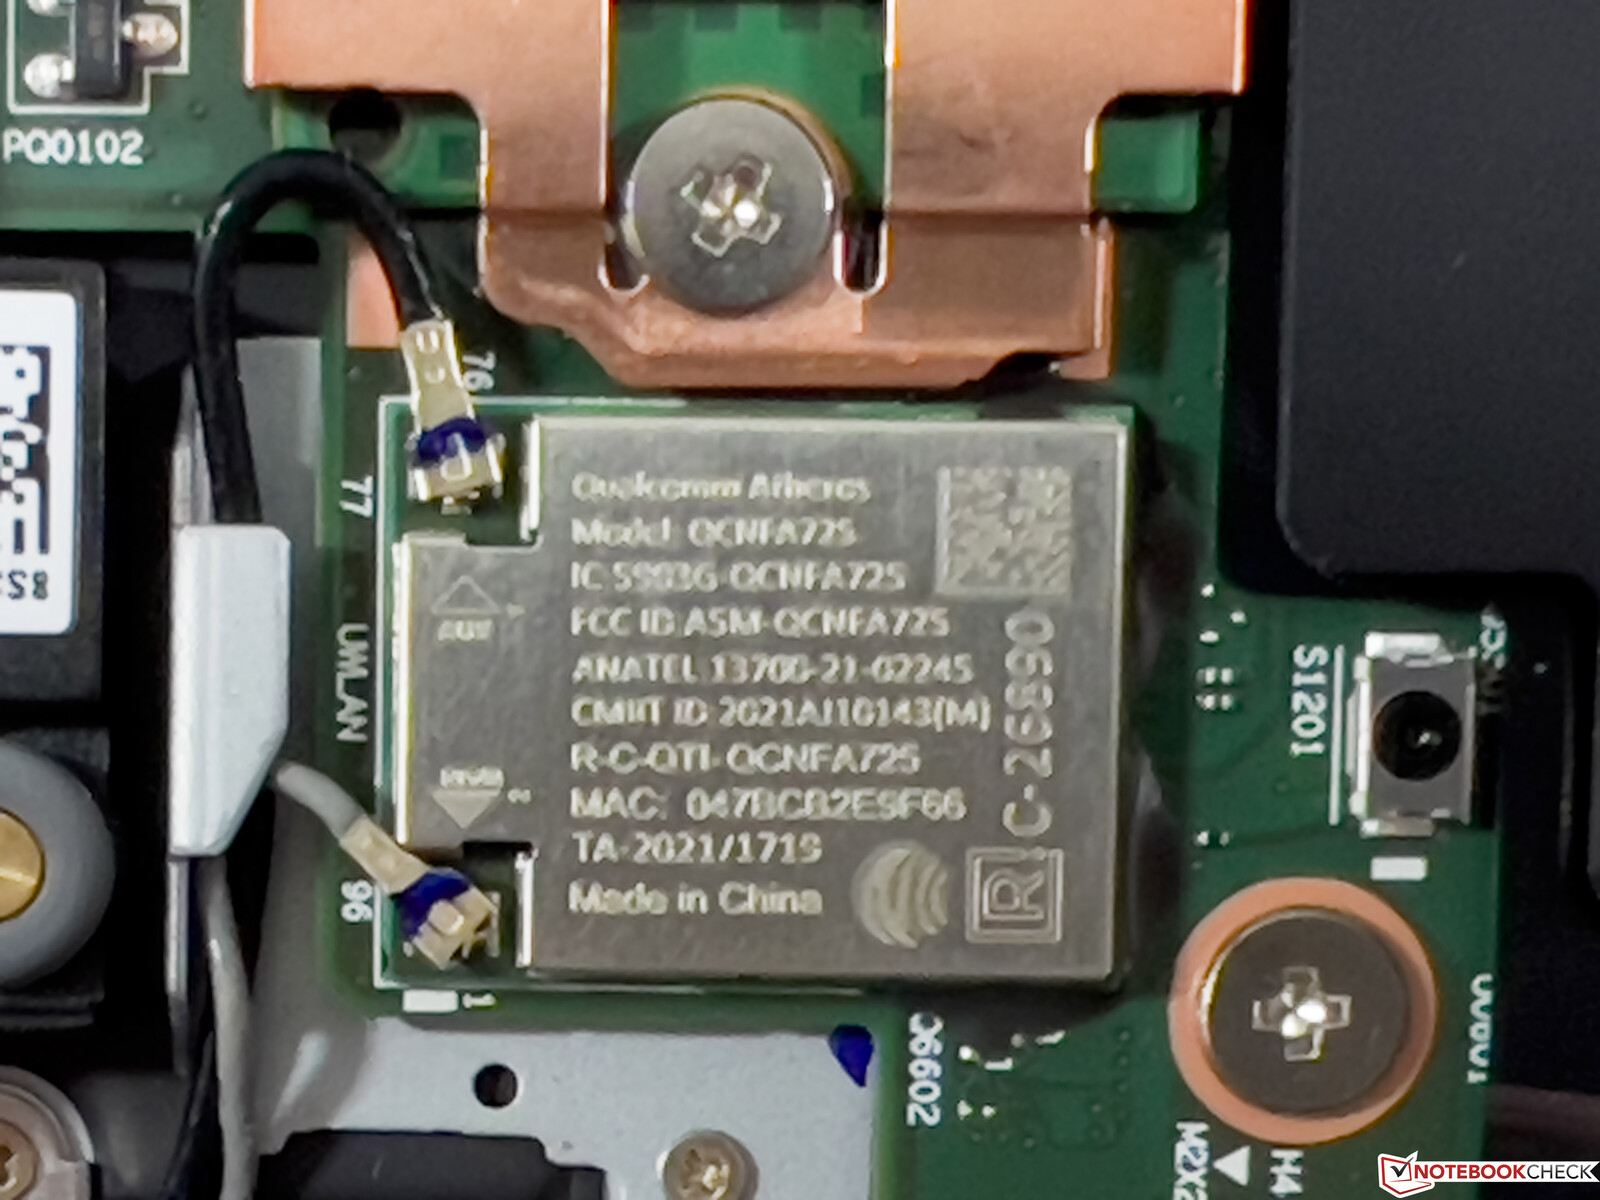
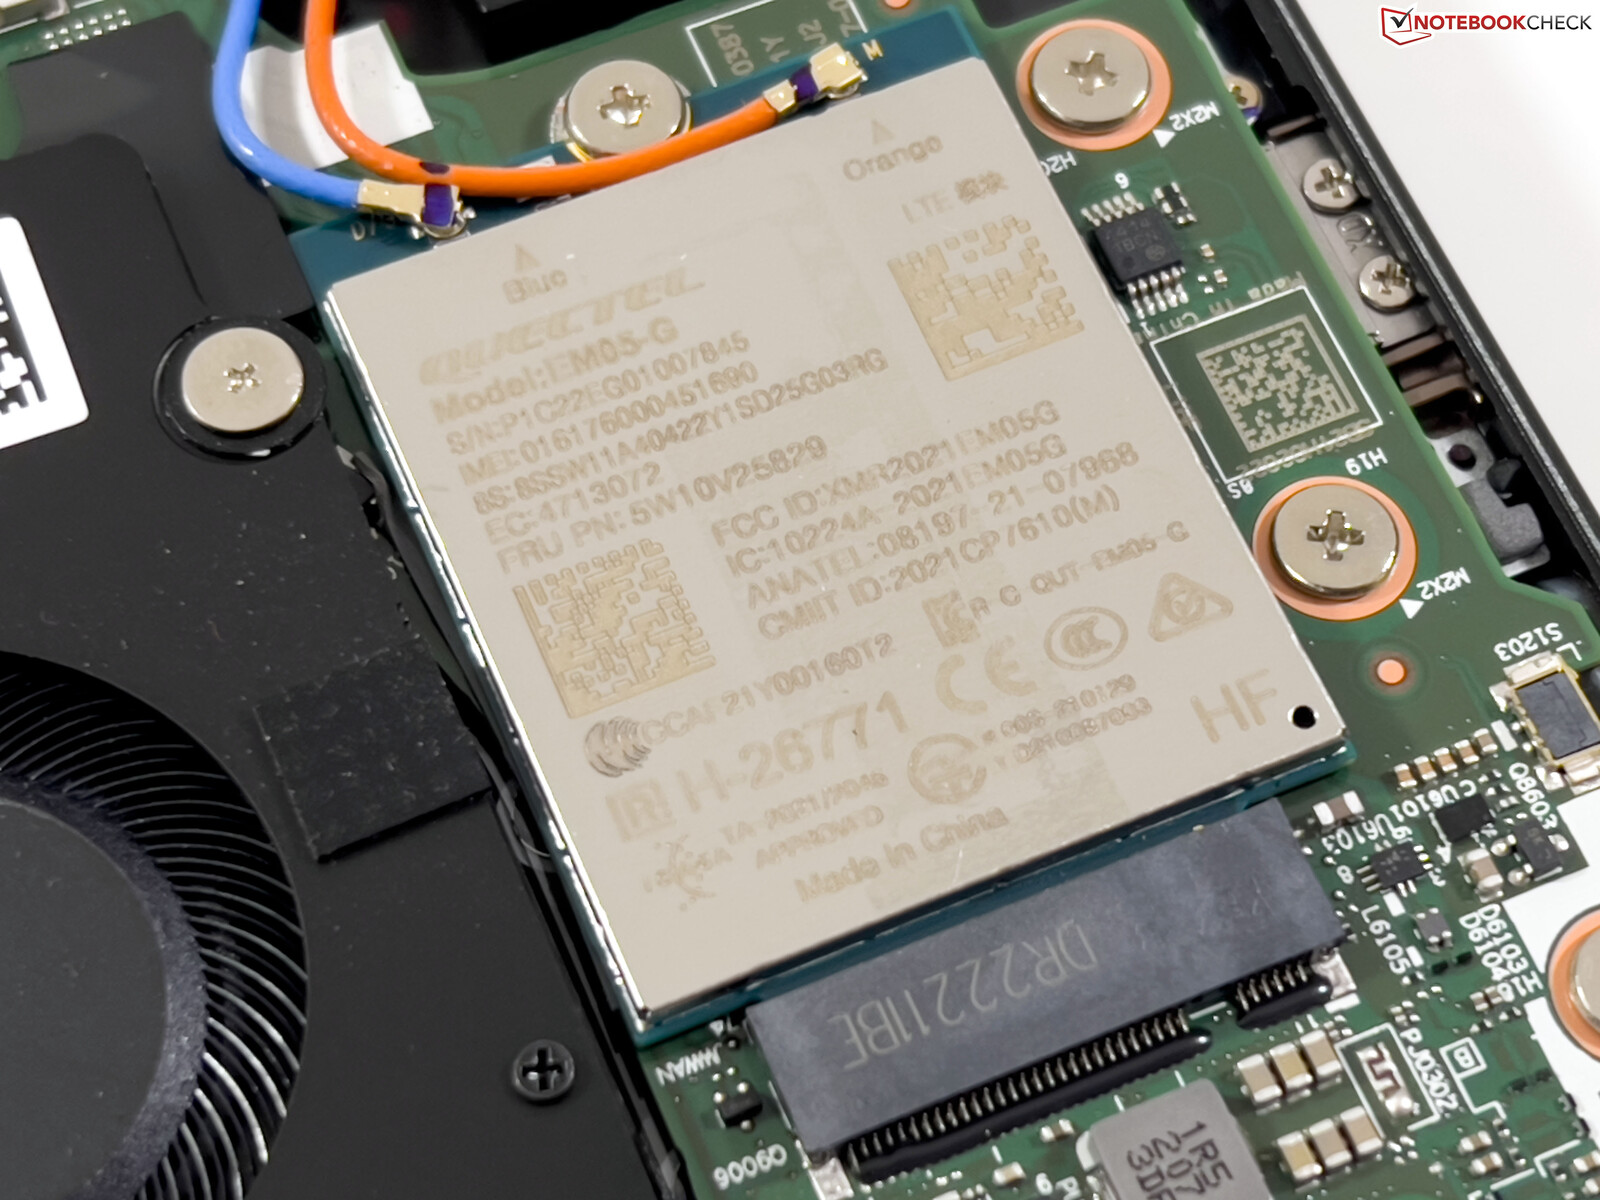
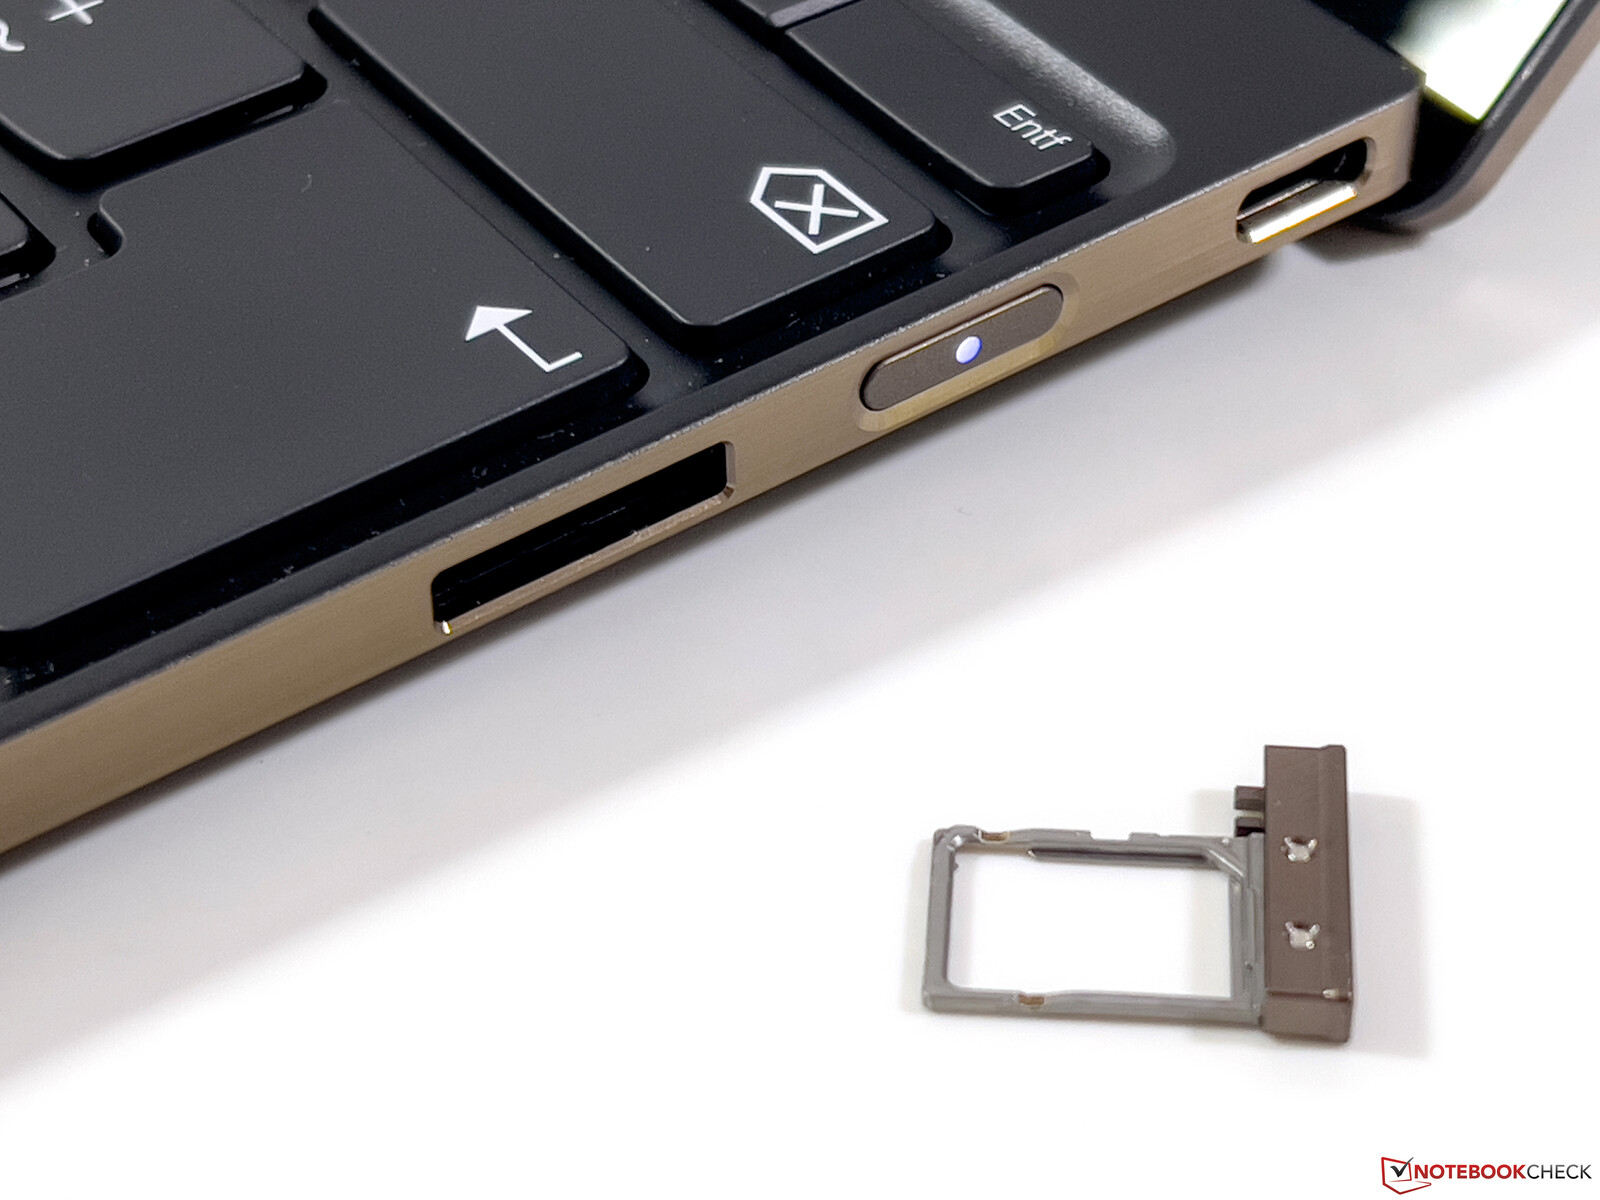
La nostra unità di prova era dotata di un modulo Wi-Fi 6E (Qualcomm WCN685x) e siamo riusciti a connetterci facilmente alla rete a 6 GHz del nostro router di riferimento Asus. Le velocità di trasferimento nel test sono state molto elevate e stabili. Nel dispositivo di prova è stato installato anche un modulo WWAN di Quectel, che supporta solo LTE Cat.4. Oltre a una eSIM, è possibile inserire una scheda nano-SIM sul bordo destro. Siamo stati in grado di utilizzare una scheda SIM di Telekom (Germania) nella rete LTE senza problemi. Tuttavia, non è disponibile un modulo 5G.
| Networking | |
| Lenovo ThinkPad Z13 G1-21D20016GE | |
| iperf3 receive AXE11000 6GHz | |
| iperf3 transmit AXE11000 6GHz | |
| Asus Zenbook S 13 OLED | |
| iperf3 receive AXE11000 | |
| iperf3 transmit AXE11000 | |
| Lenovo ThinkPad Z13 21D2CTO1WW | |
| iperf3 receive AXE11000 6GHz | |
| iperf3 transmit AXE11000 6GHz | |
| Apple MacBook Air M2 Entry | |
| iperf3 receive AXE11000 | |
| iperf3 transmit AXE11000 | |
| Dell XPS 13 Plus 9320 4K | |
| iperf3 receive AXE11000 | |
| iperf3 transmit AXE11000 | |
| Media Qualcomm WCN685x | |
| iperf3 receive AXE11000 6GHz | |
| iperf3 transmit AXE11000 6GHz | |
| iperf3 receive AXE11000 | |
| iperf3 transmit AXE11000 | |


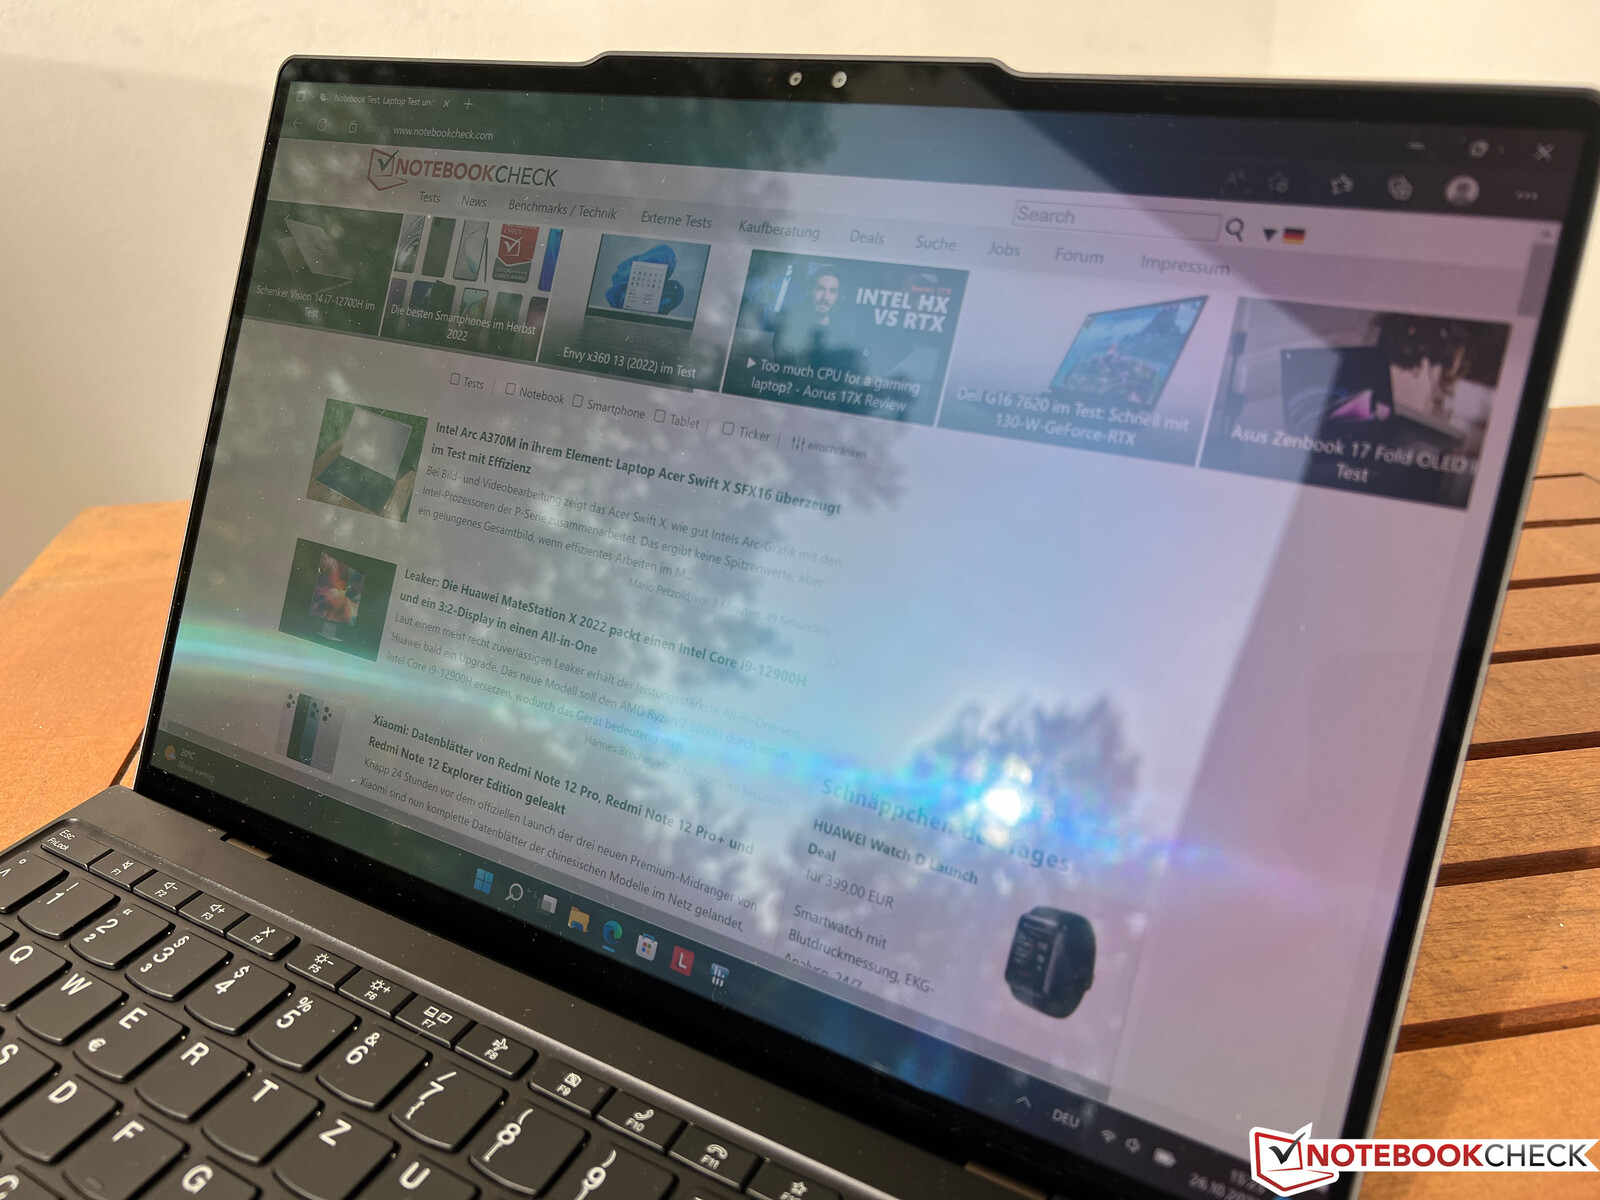
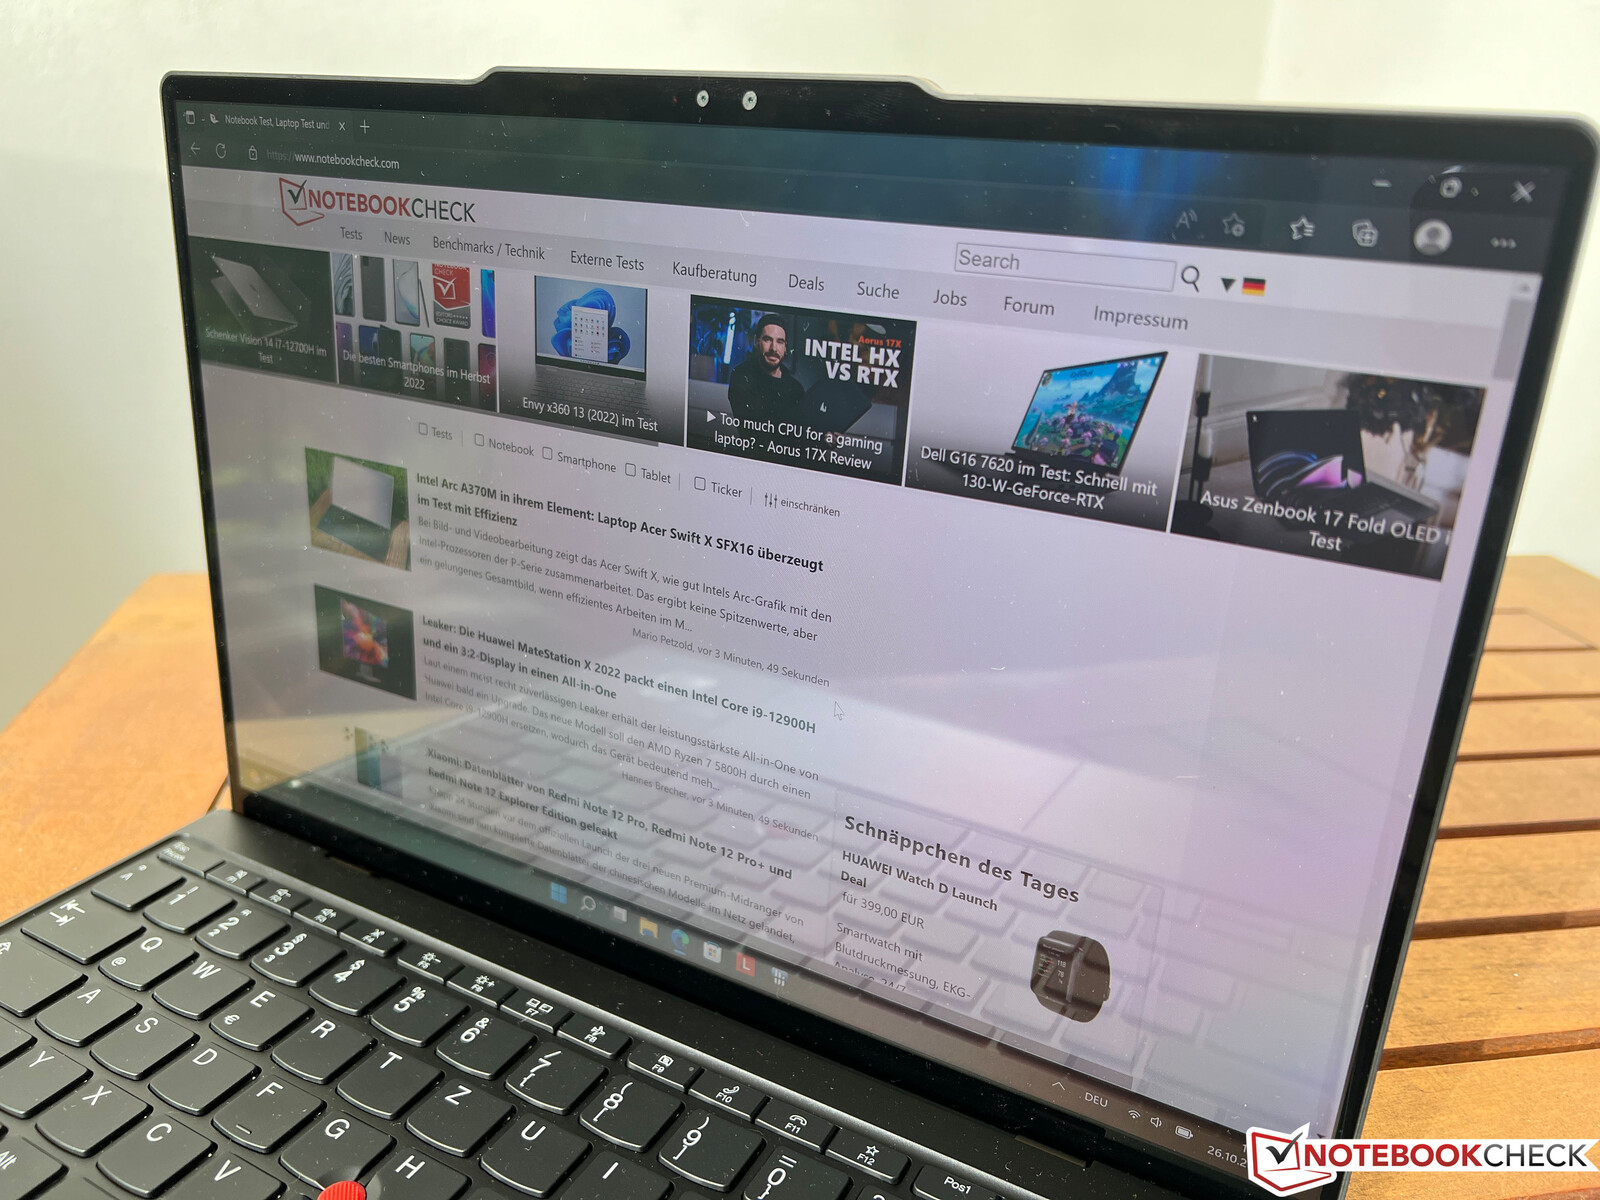
Display - Touchscreen OLED da 2,8K
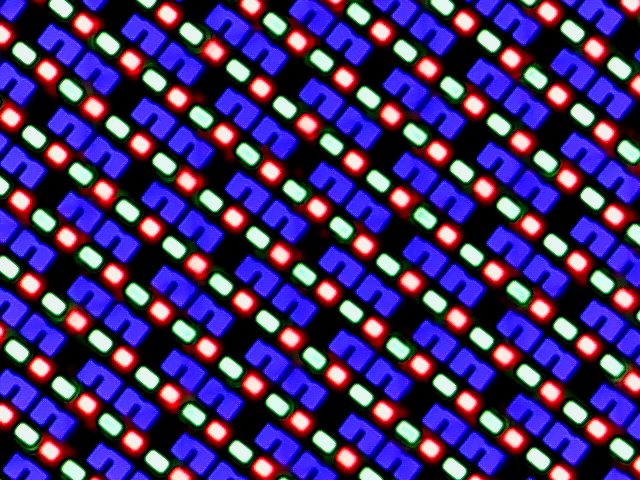
Il nostro dispositivo di prova utilizza il touchscreen OLED opzionale da 13,3 pollici con una risoluzione di 2.880 x 1.800 pixel. Soggettivamente, l'immagine del pannello riflettente fa una buona impressione in linea di principio. I contenuti vengono visualizzati in modo molto nitido e i colori sono molto intensi. Con i contenuti luminosi, tuttavia, è visibile un effetto griglia (effetto moiré) che richiede di sedersi relativamente vicino al display. Windows utilizza la modalità colore scuro per impostazione predefinita per risparmiare energia, quindi in pratica l'effetto non si nota.
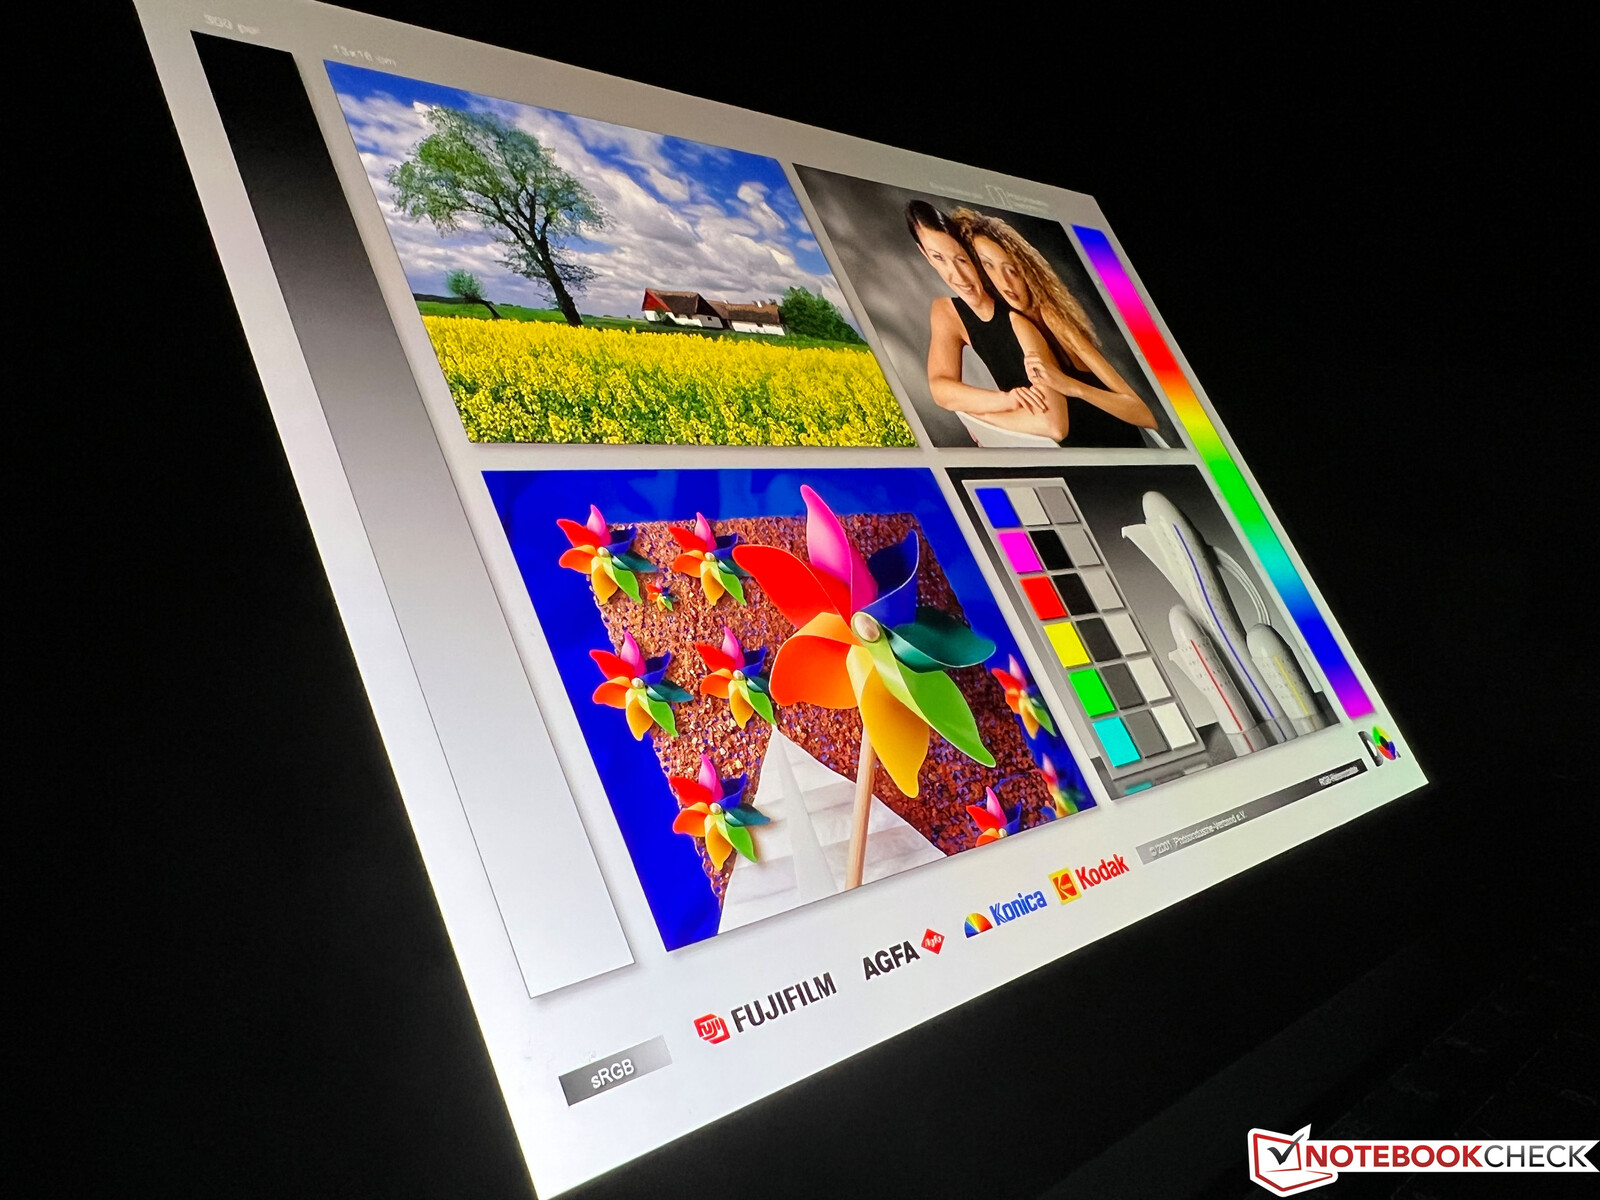
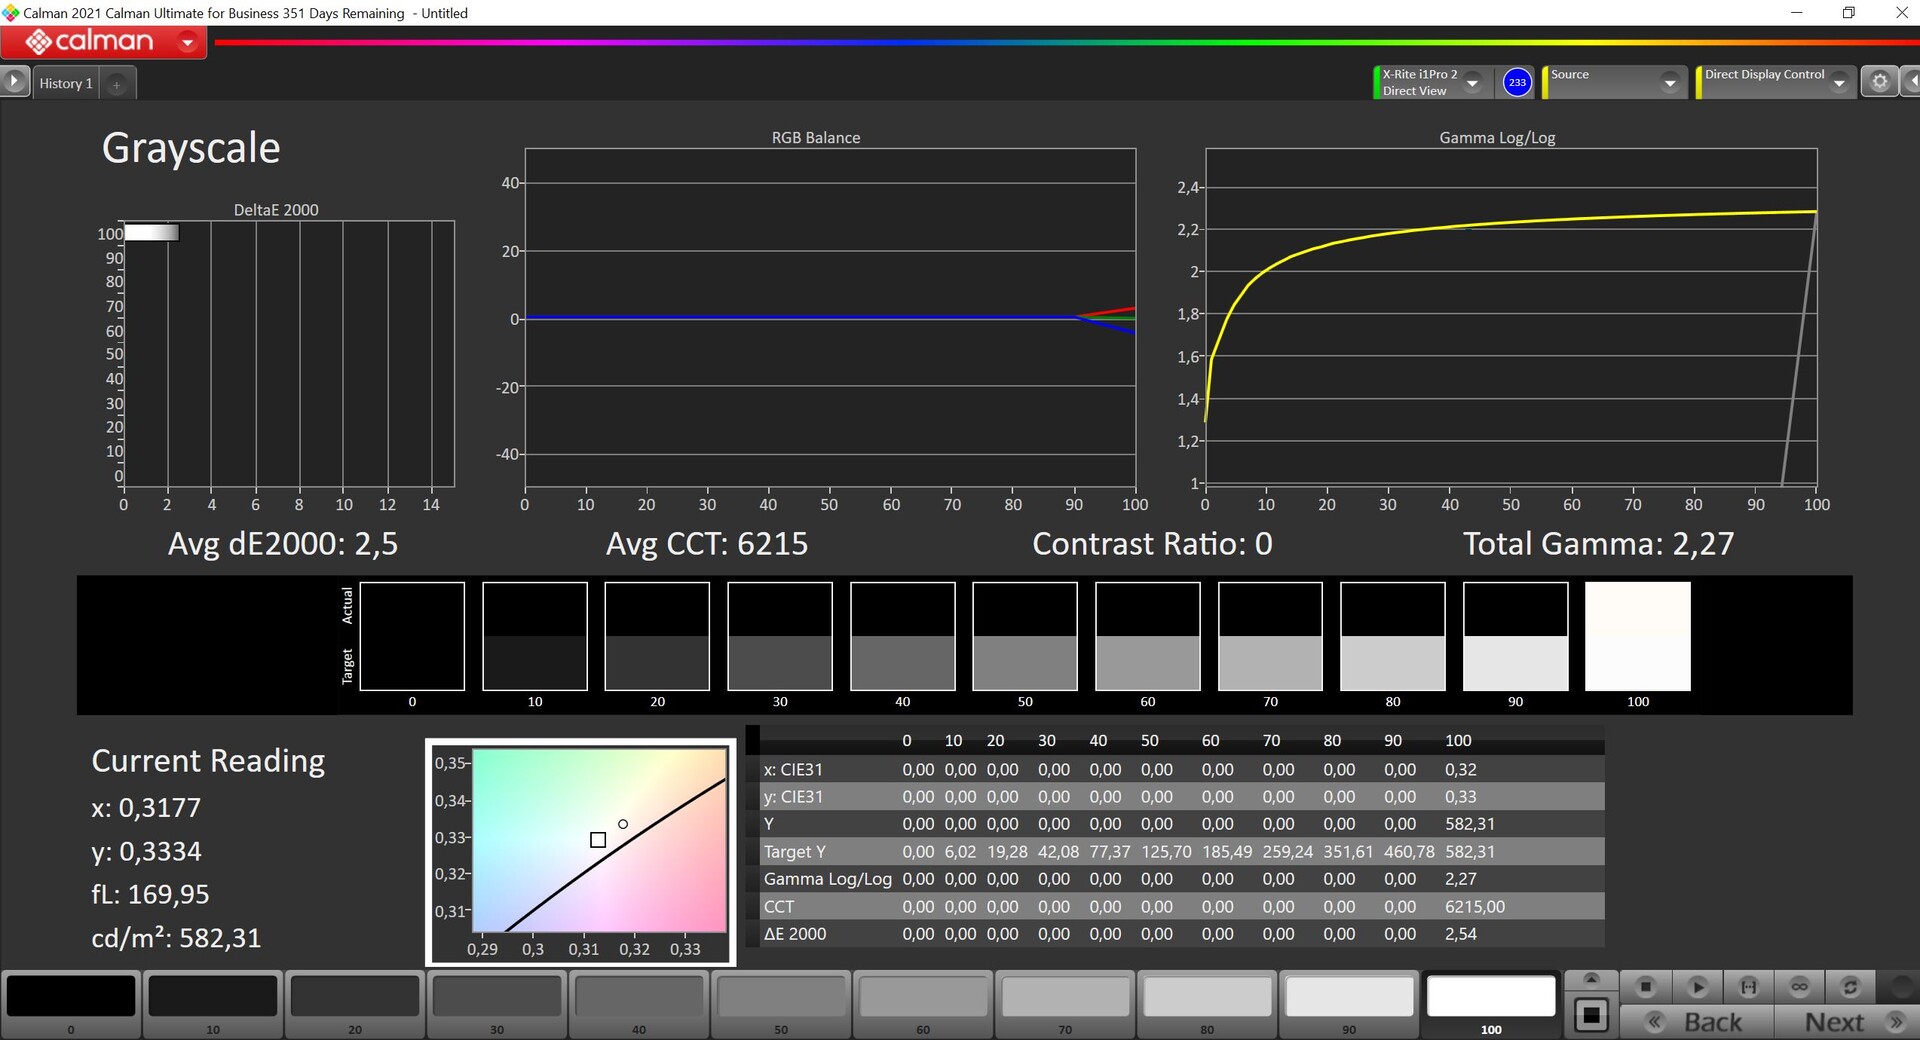
Lenovo pubblicizza una luminosità di 400 cd/m², per cui bisogna distinguere (come avviene di solito con i pannelli OLED) tra contenuti SDR e HDR. In modalità SDR normale, abbiamo determinato una luminosità di circa 380 cd/m² e, insieme al livello di nero estremamente basso, si ottiene un rapporto di contrasto estremamente elevato. In modalità HDR (che deve essere attivata manualmente), raggiunge un massimo di 582 cd/m² per piccole sezioni di immagine e circa 470 cd/m² per un'immagine quasi completamente luminosa. La stabilità dell'angolo di visione è molto buona e i tempi di risposta sono estremamente rapidi. I pannelli OLED non presentano aloni.
| |||||||||||||||||||||||||
Distribuzione della luminosità: 98 %
Al centro con la batteria: 373 cd/m²
Contrasto: 9275:1 (Nero: 0.04 cd/m²)
ΔE ColorChecker Calman: 2.5 | ∀{0.5-29.43 Ø4.71}
calibrated: 1.9
ΔE Greyscale Calman: 2 | ∀{0.09-98 Ø4.96}
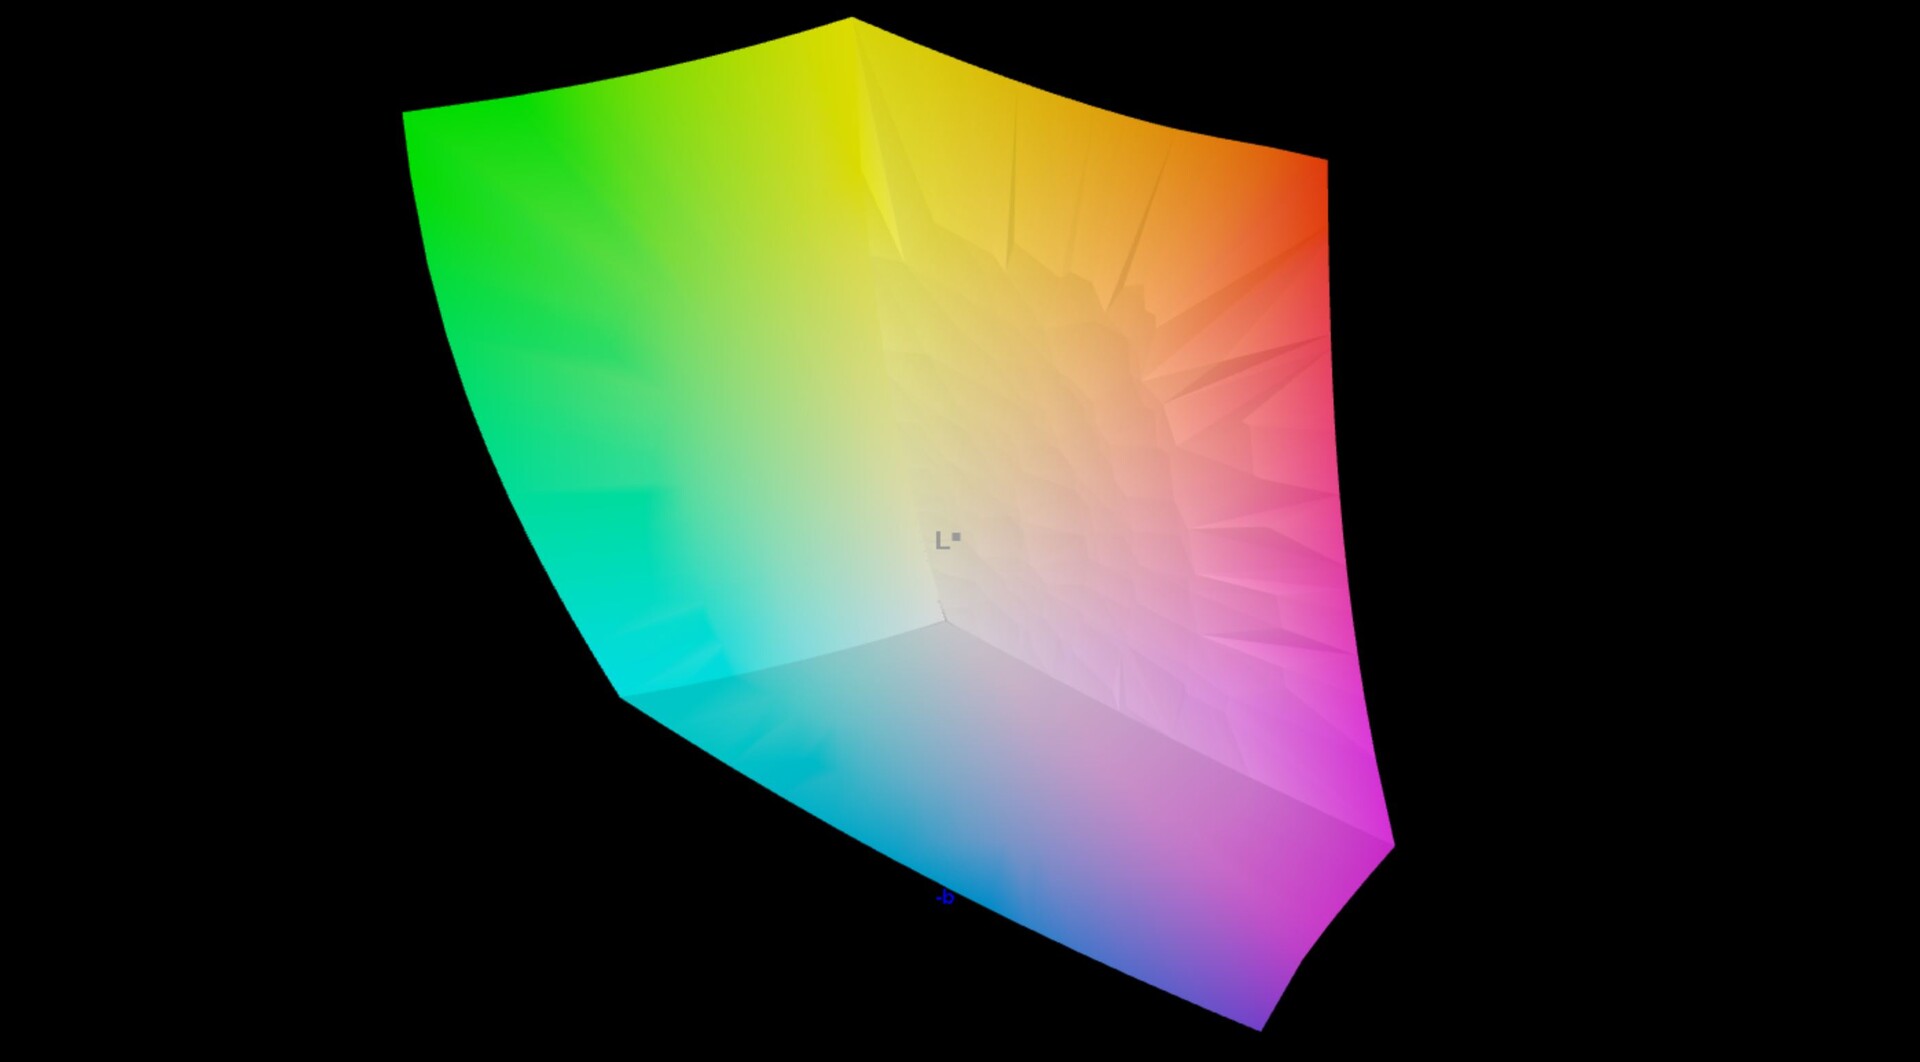
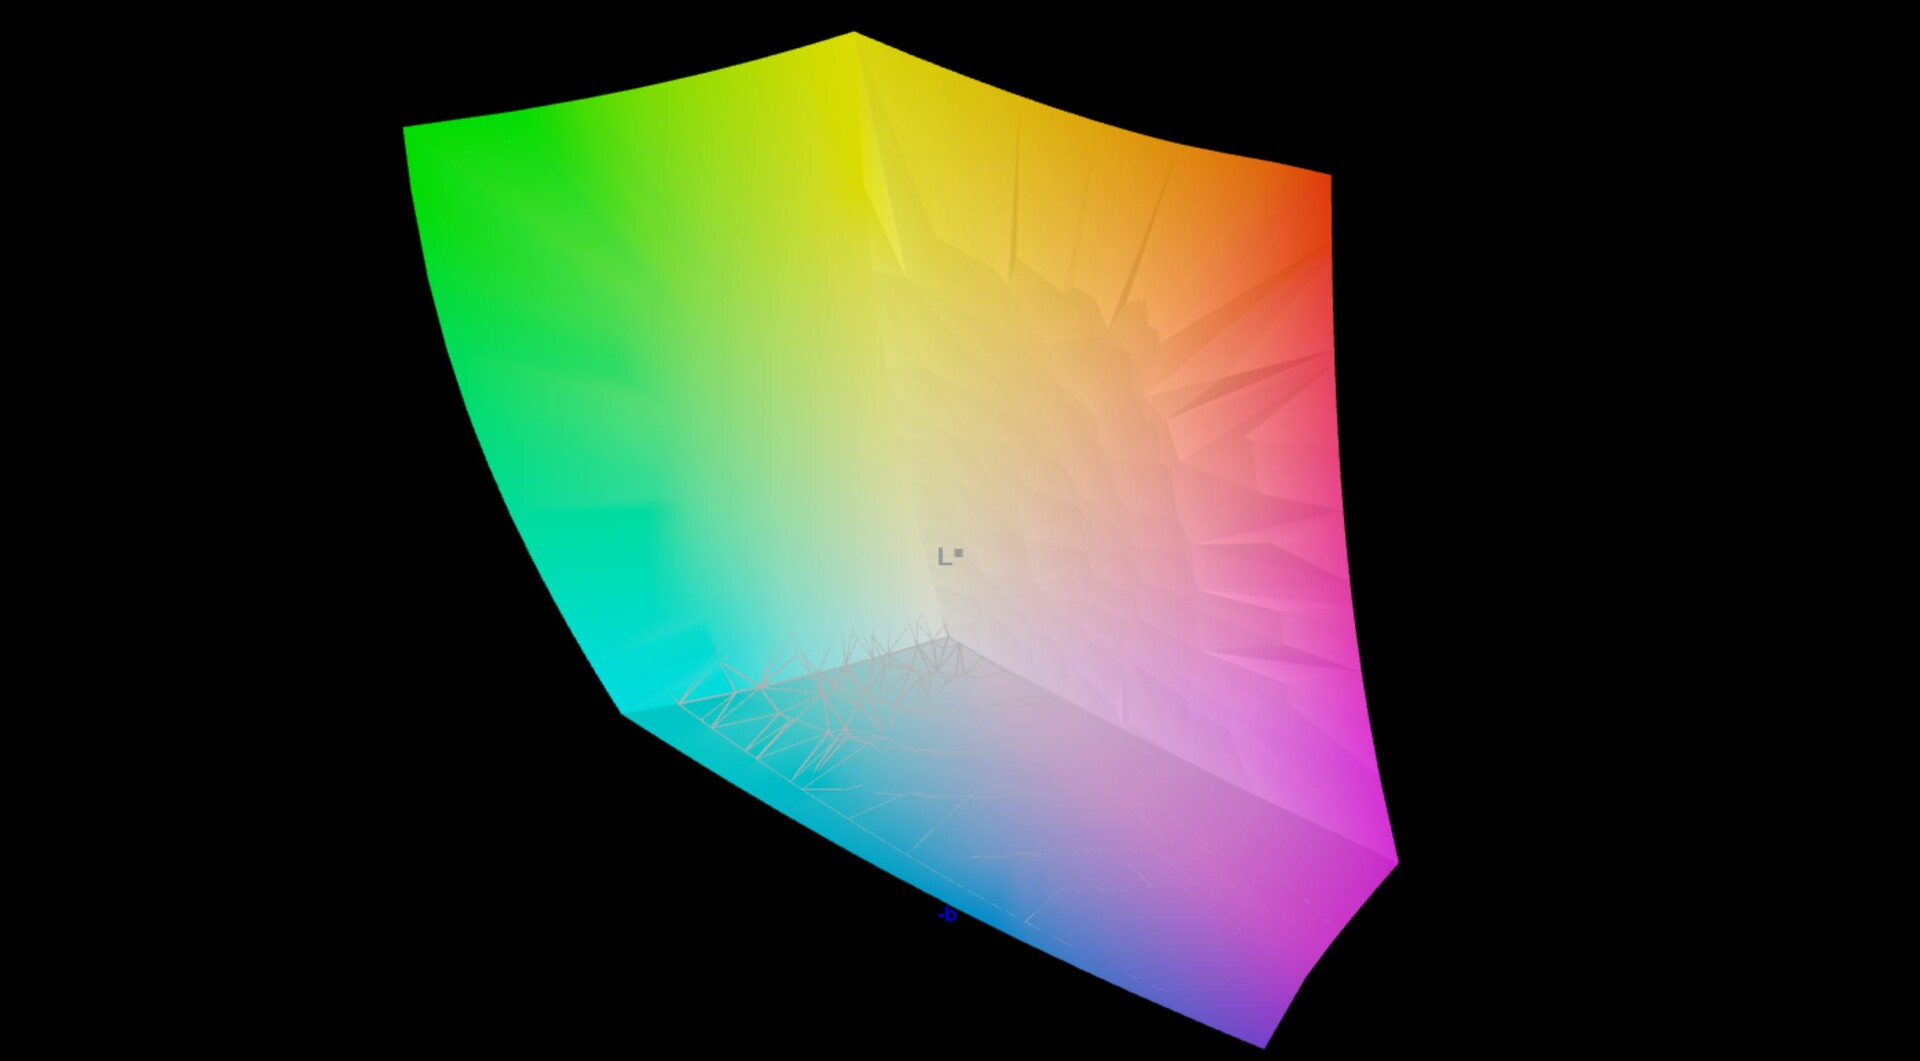
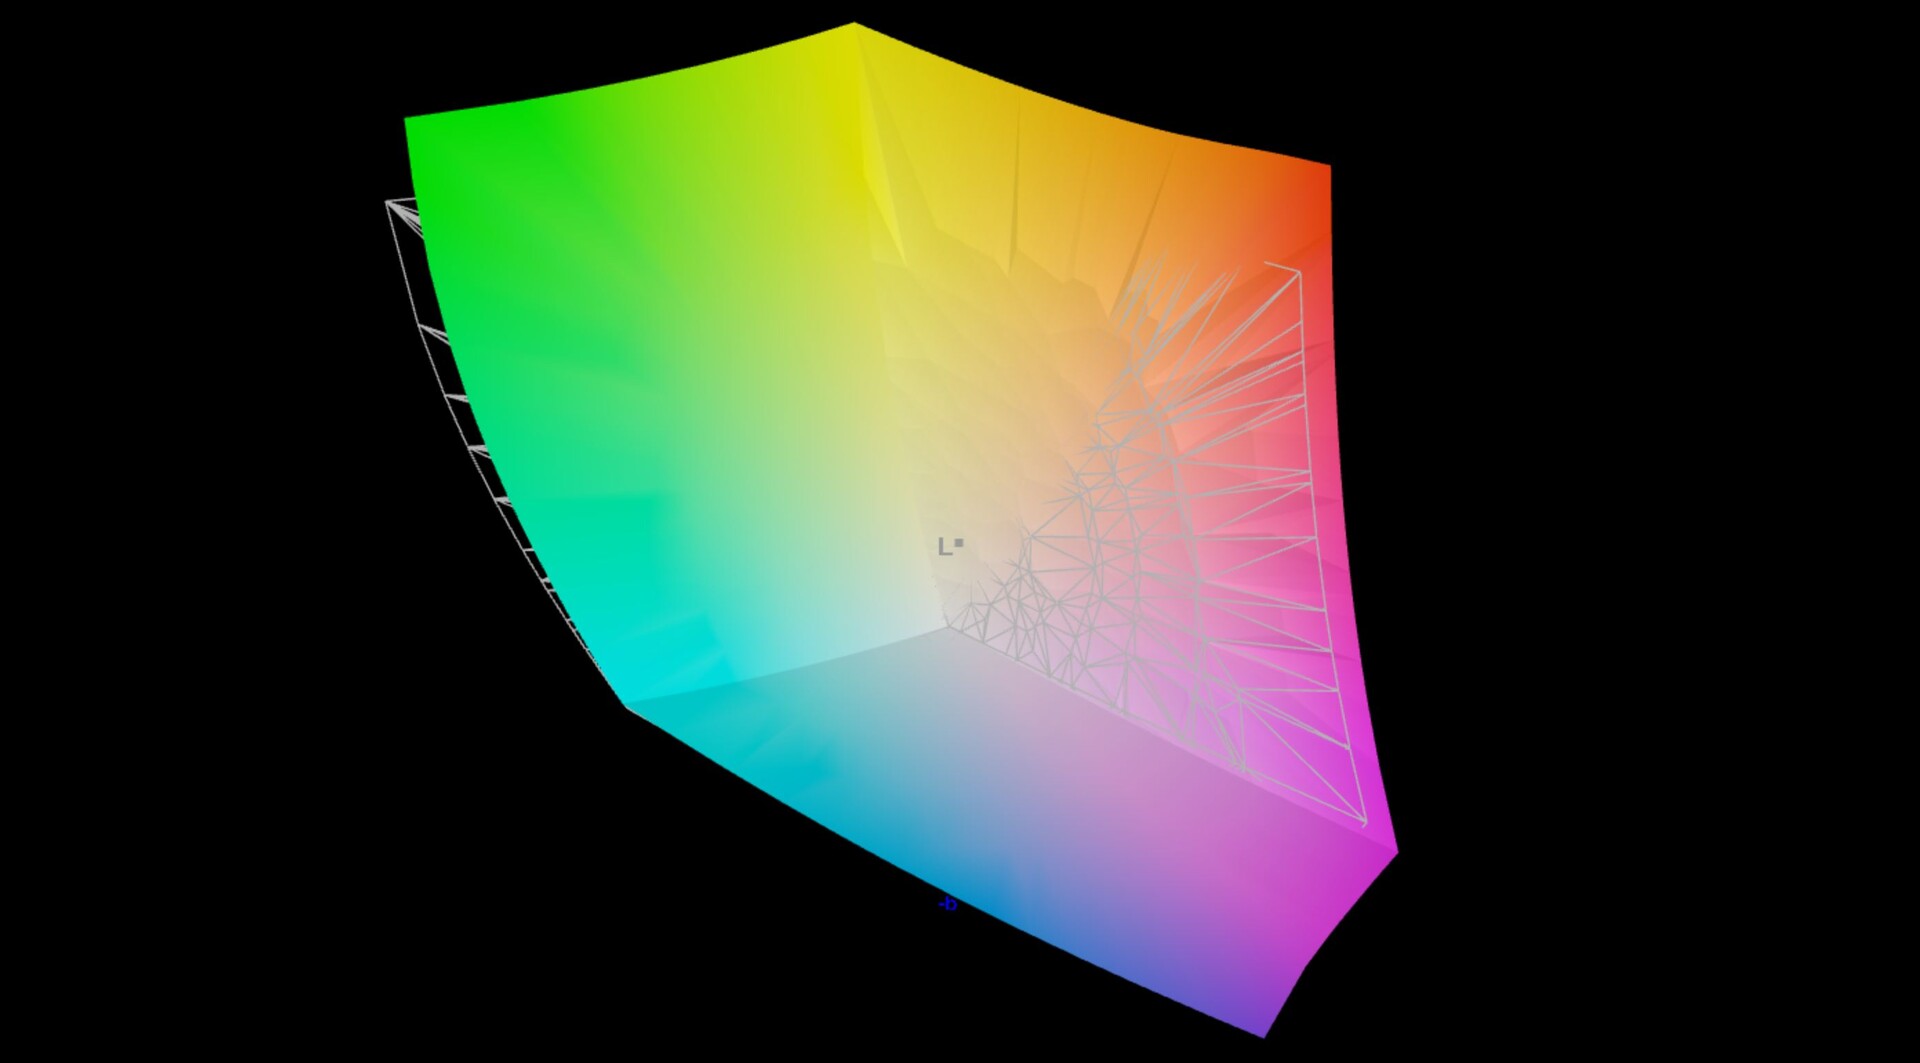
97.5% AdobeRGB 1998 (Argyll 3D)
100% sRGB (Argyll 3D)
99.9% Display P3 (Argyll 3D)
Gamma: 2.17
CCT: 6228 K
| Lenovo ThinkPad Z13 G1-21D20016GE ATNA33AA02-0, OLED, 2880x1800, 13.3" | Asus Zenbook S 13 OLED SDC4172, OLED, 2880x1800, 13.3" | Dell XPS 13 Plus 9320 i7-1280P OLED Samsung 134XK04, OLED, 3456x2160, 13.4" | Lenovo ThinkPad Z13 21D2CTO1WW NV133WUM-N63, IPS LED, 1920x1200, 13.3" | Apple MacBook Air M2 Entry IPS, 2560x1664, 13.6" | |
|---|---|---|---|---|---|
| Display | 0% | 0% | -21% | -4% | |
| Display P3 Coverage (%) | 99.9 | 99.8 0% | 99.5 0% | 67.7 -32% | 98.4 -2% |
| sRGB Coverage (%) | 100 | 100 0% | 100 0% | 96.5 -3% | 99.9 0% |
| AdobeRGB 1998 Coverage (%) | 97.5 | 97.8 0% | 98.4 1% | 69.7 -29% | 87.6 -10% |
| Response Times | -8% | -34% | -1909% | -1544% | |
| Response Time Grey 50% / Grey 80% * (ms) | 1.9 ? | 2.1 ? -11% | 2.6 ? -37% | 49 ? -2479% | 32.9 ? -1632% |
| Response Time Black / White * (ms) | 1.6 ? | 1.68 ? -5% | 2.1 ? -31% | 23 ? -1338% | 24.9 ? -1456% |
| PWM Frequency (Hz) | 240 ? | 240.4 ? | 59.5 | ||
| Screen | 24% | -6% | -81% | -81% | |
| Brightness middle (cd/m²) | 371 | 336 -9% | 371.8 0% | 418 13% | 526 42% |
| Brightness (cd/m²) | 378 | 338 -11% | 374 -1% | 379 0% | 486 29% |
| Brightness Distribution (%) | 98 | 99 1% | 98 0% | 81 -17% | 87 -11% |
| Black Level * (cd/m²) | 0.04 | 0.02 50% | 0.33 -725% | 0.38 -850% | |
| Contrast (:1) | 9275 | 16800 81% | 1267 -86% | 1384 -85% | |
| Colorchecker dE 2000 * | 2.5 | 1.8 28% | 2.37 5% | 1.7 32% | 1.3 48% |
| Colorchecker dE 2000 max. * | 4.4 | 3.8 14% | 6.1 -39% | 3.3 25% | 2.7 39% |
| Colorchecker dE 2000 calibrated * | 1.9 | 1.8 5% | 1.1 42% | 0.7 63% | |
| Greyscale dE 2000 * | 2 | 0.9 55% | 2 -0% | 2.3 -15% | 2 -0% |
| Gamma | 2.17 101% | 2.22 99% | 2.29 96% | 2.14 103% | 2.25 98% |
| CCT | 6228 104% | 6580 99% | 6261 104% | 6499 100% | 6858 95% |
| Media totale (Programma / Settaggio) | 5% /
14% | -13% /
-9% | -670% /
-329% | -543% /
-273% |
* ... Meglio usare valori piccoli
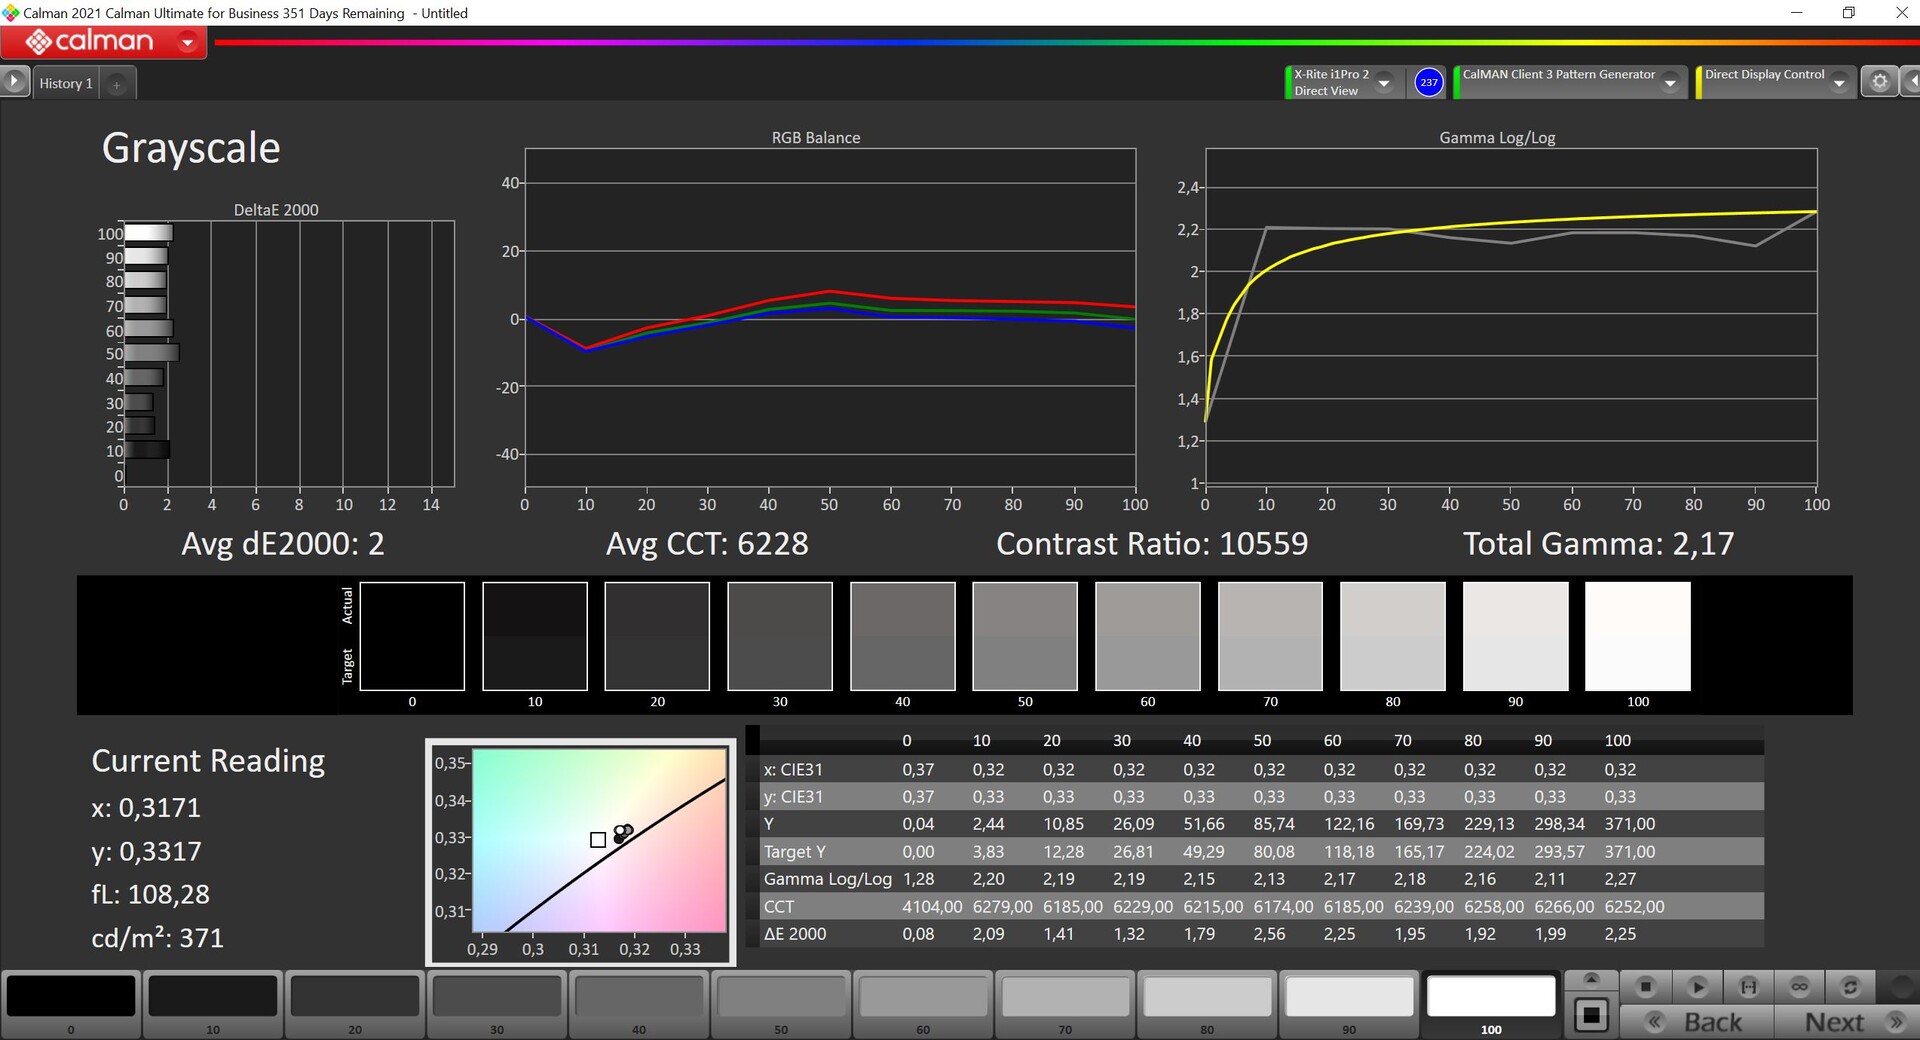
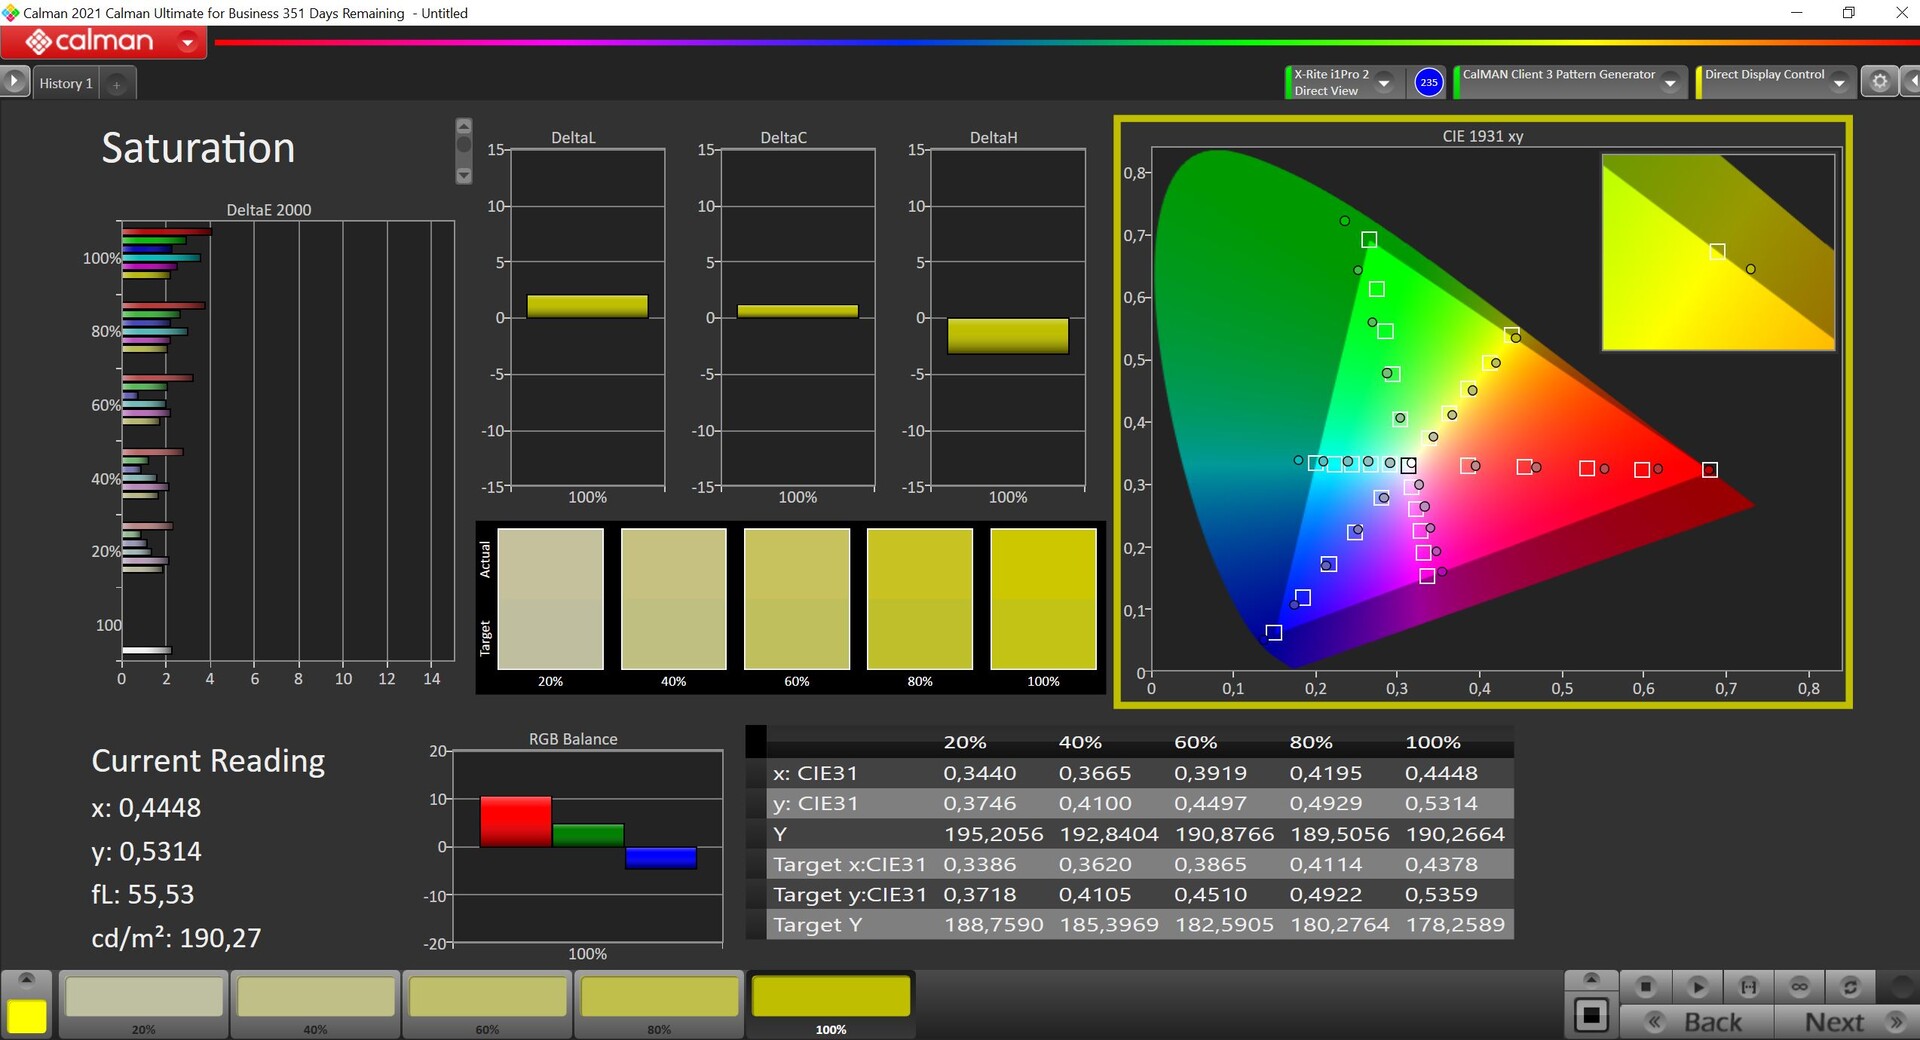
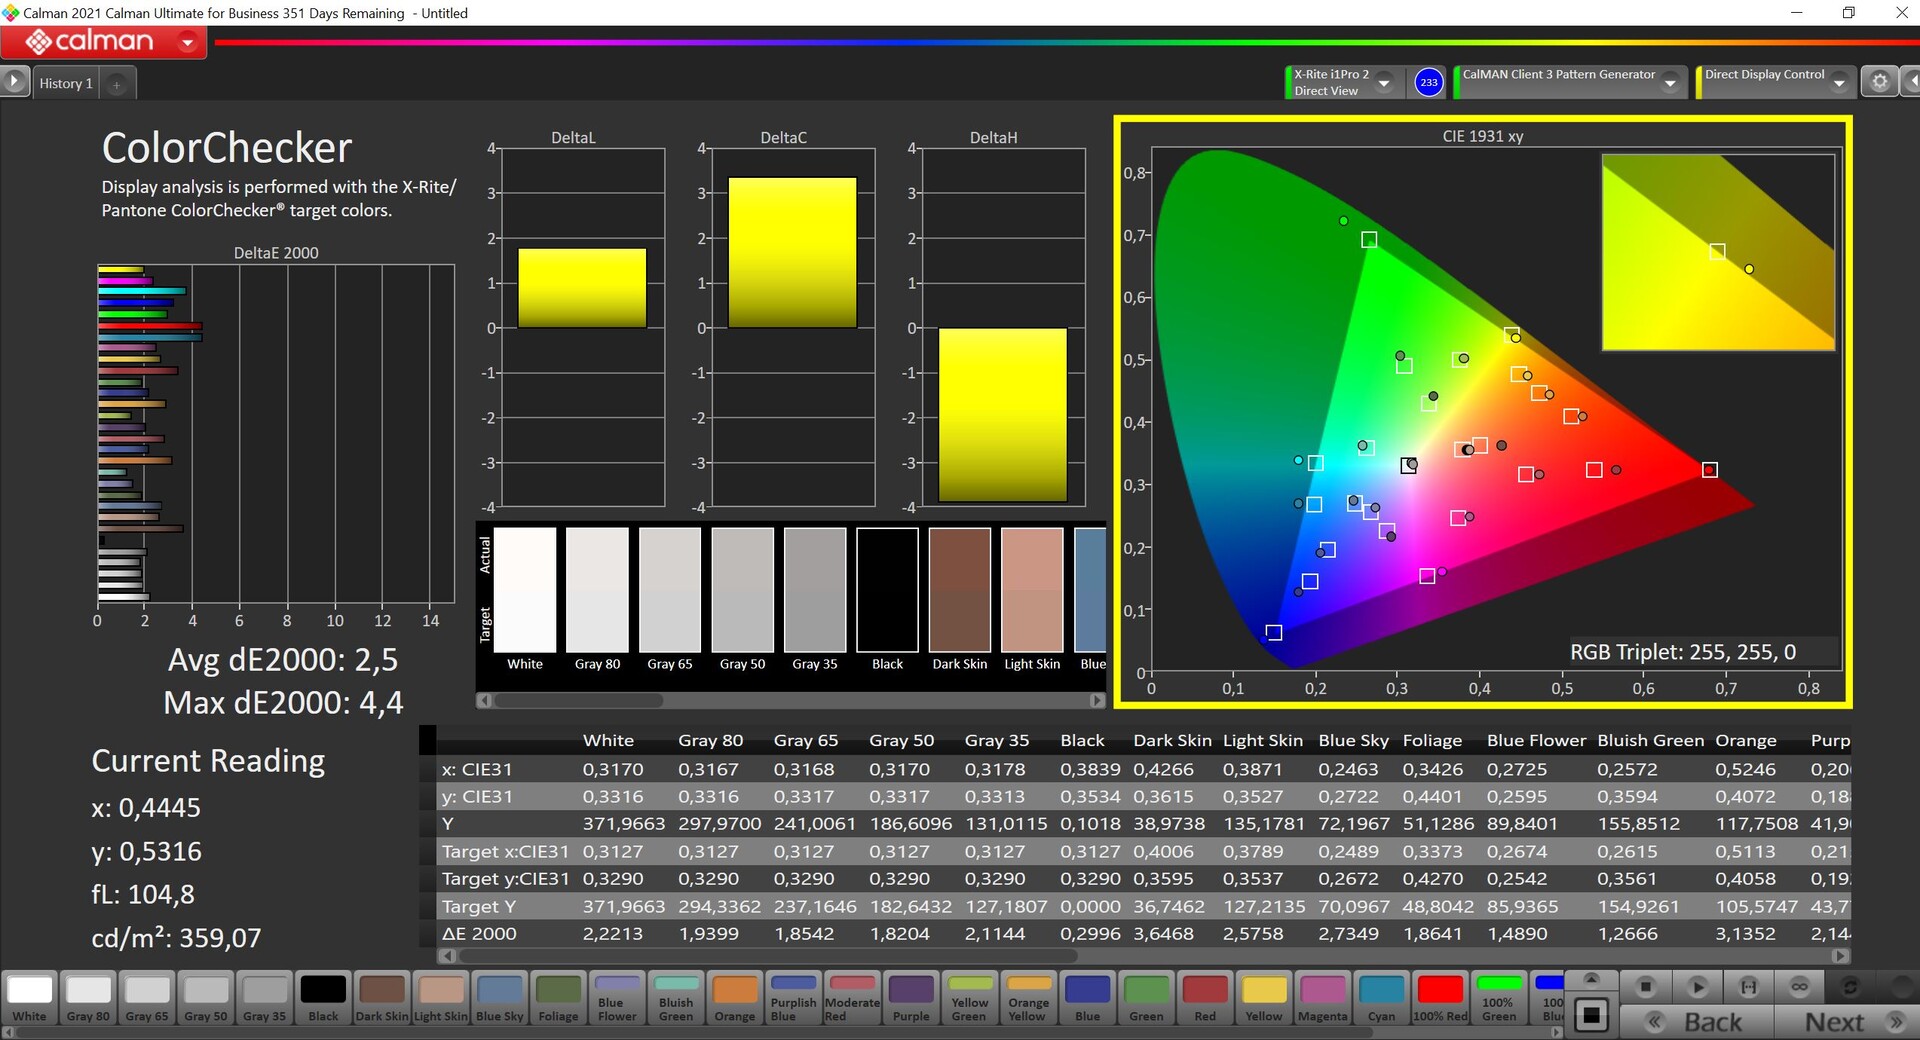
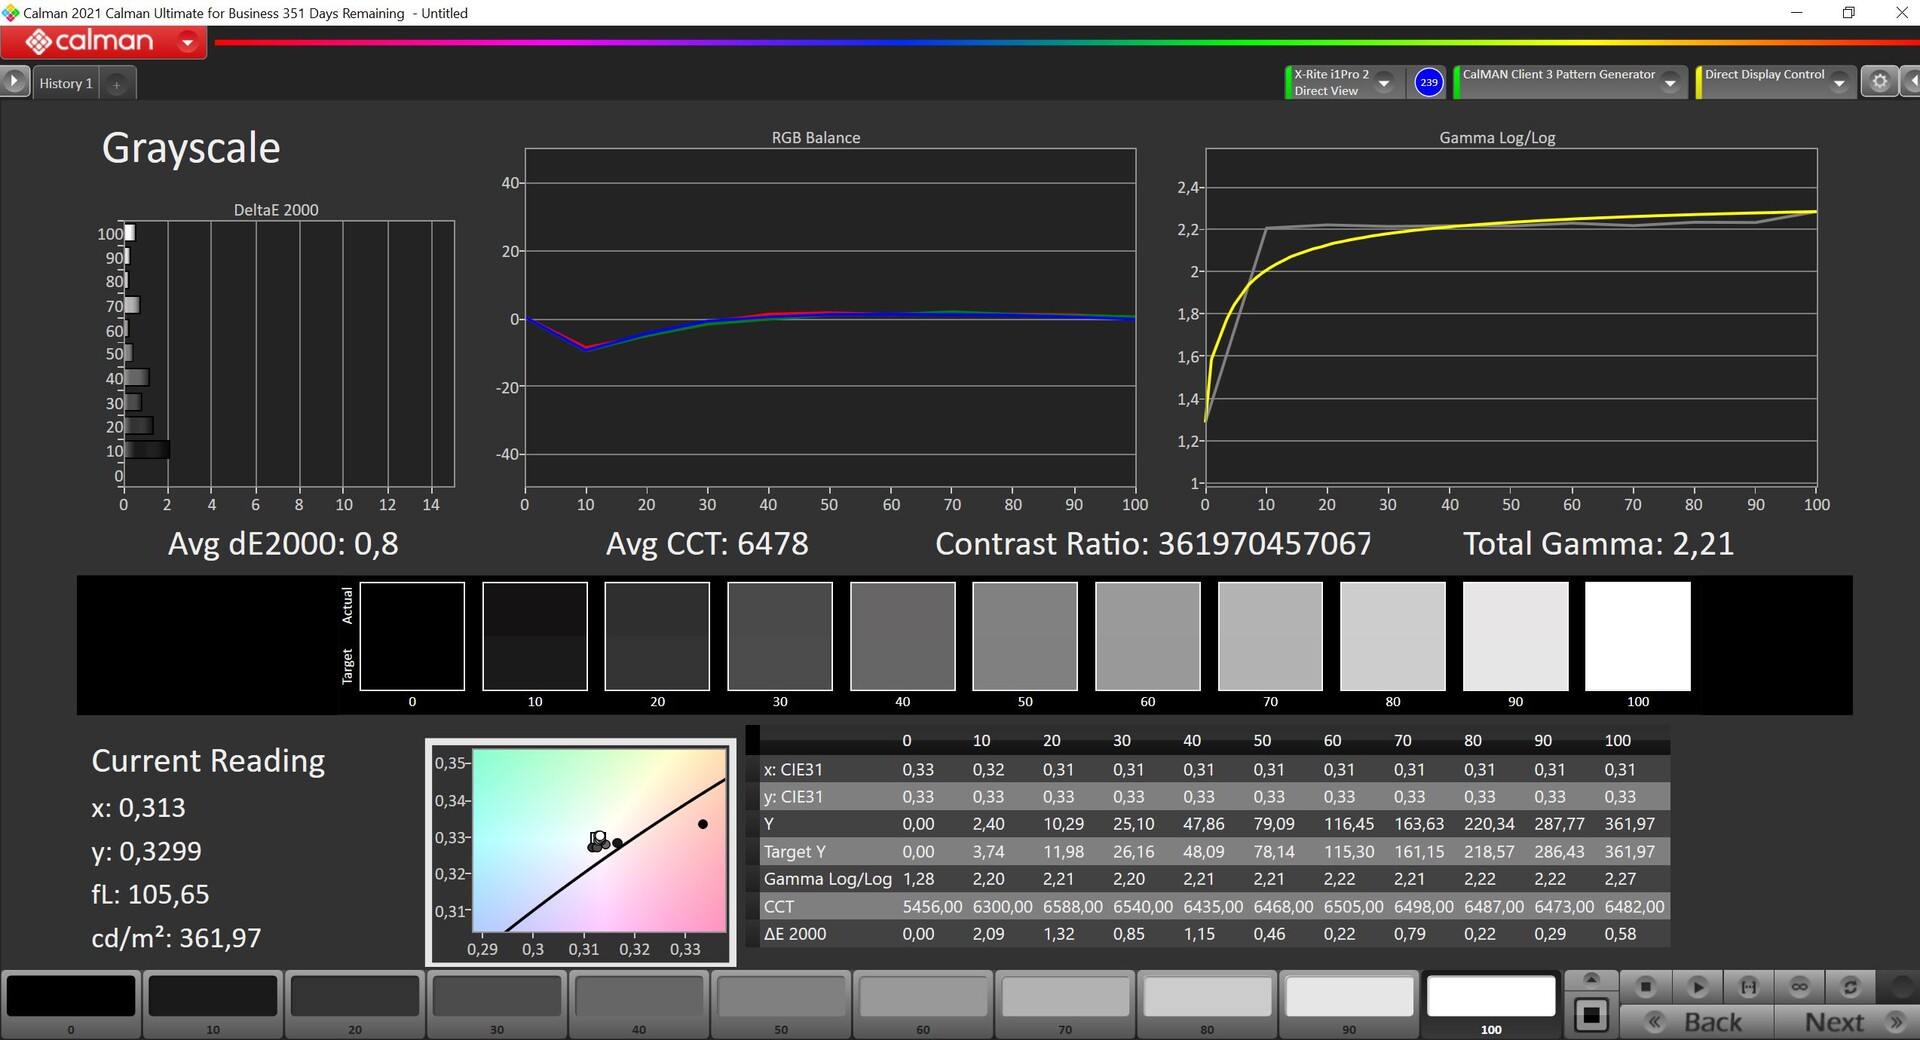
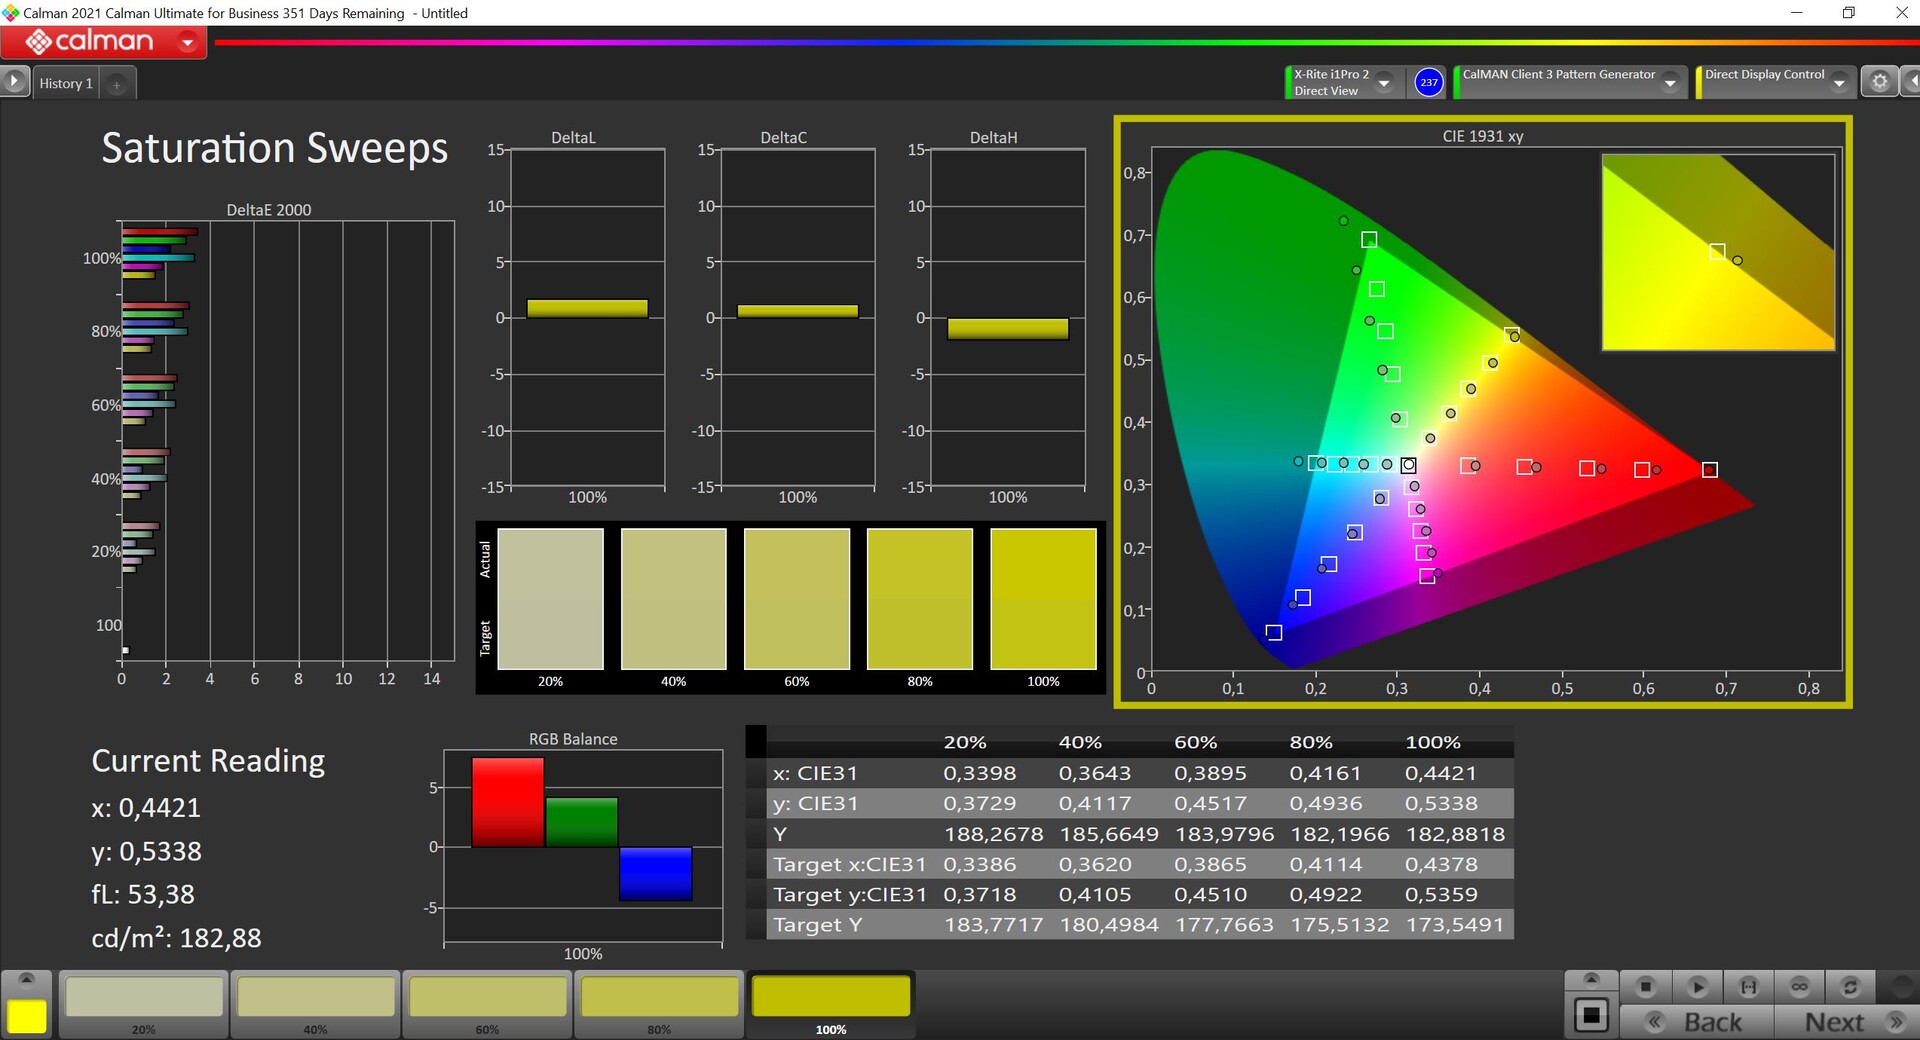
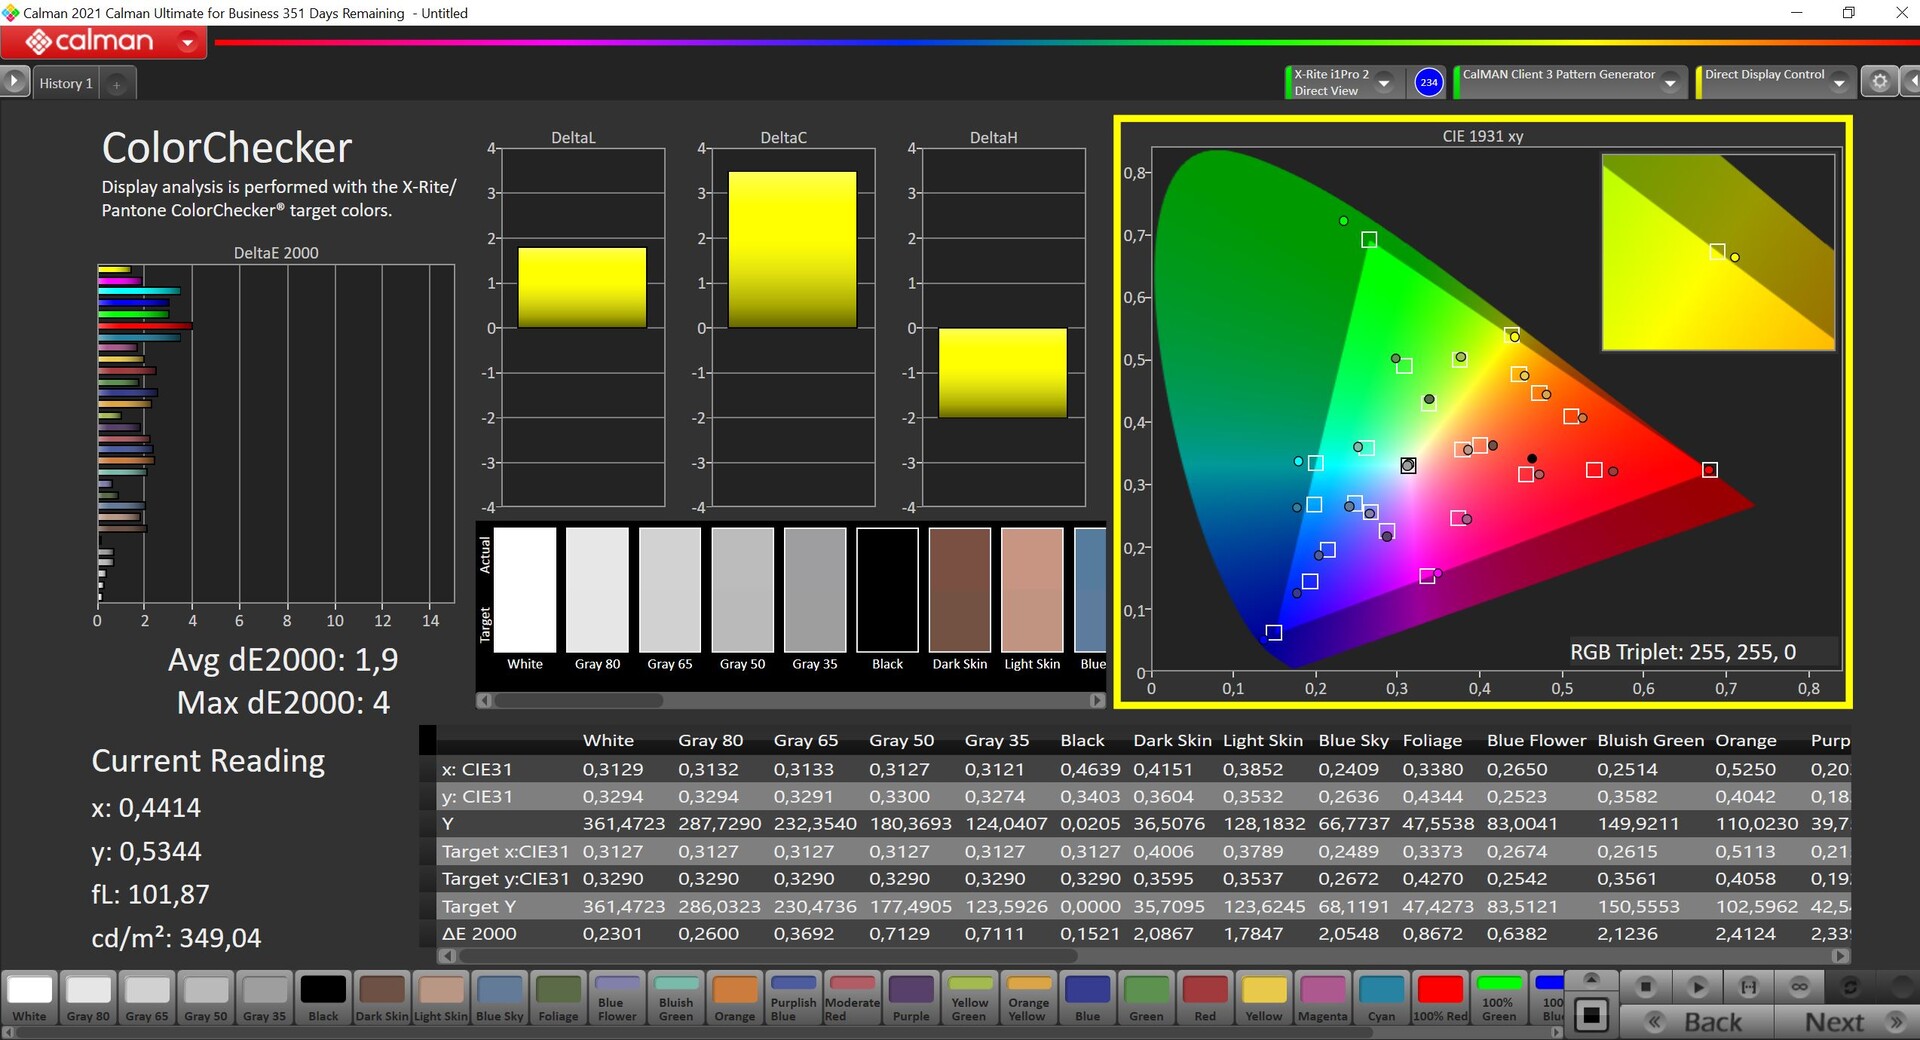
La nostra analisi con il software professionale CalMAN (X-Rite i1 Pro 2) mostra che lo schermo OLED consegnato è già correttamente calibrato. Il colore del rosso vero è minimo e la temperatura del colore è leggermente troppo calda. Siamo stati in grado di migliorare ulteriormente il display con la nostra calibrazione (il profilo è disponibile per il download qui sopra) e la maggior parte dei colori è al di sotto del limite importante di 3. Lo spazio colore P3 è completamente coperto
Tempi di risposta del Display
| ↔ Tempi di risposta dal Nero al Bianco | ||
|---|---|---|
| 1.6 ms ... aumenta ↗ e diminuisce ↘ combinato | ↗ 0.8 ms Incremento | 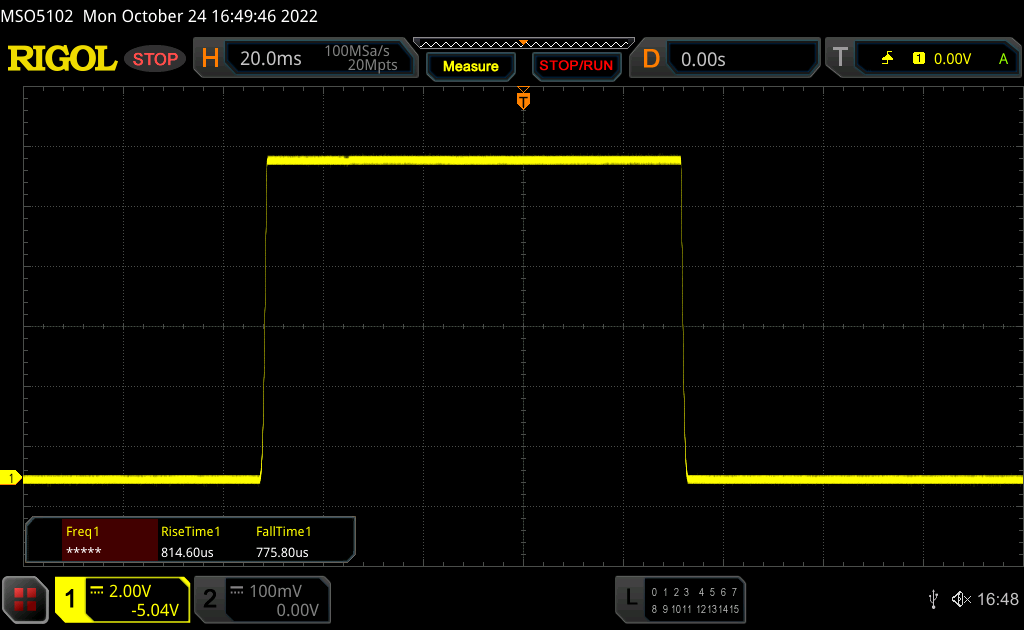 |
| ↘ 0.8 ms Calo | ||
| Lo schermo ha mostrato valori di risposta molto veloci nei nostri tests ed è molto adatto per i gaming veloce. In confronto, tutti i dispositivi di test variano da 0.1 (minimo) a 240 (massimo) ms. » 10 % di tutti i dispositivi è migliore. Questo significa che i tempi di risposta rilevati sono migliori rispettto alla media di tutti i dispositivi testati (19.8 ms). | ||
| ↔ Tempo di risposta dal 50% Grigio all'80% Grigio | ||
| 1.9 ms ... aumenta ↗ e diminuisce ↘ combinato | ↗ 1 ms Incremento | 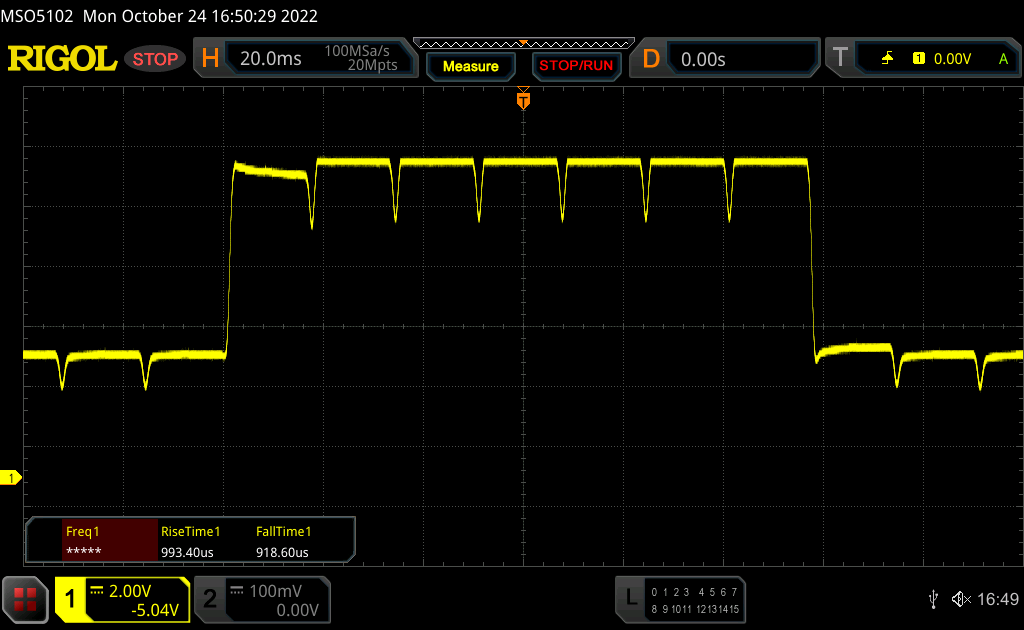 |
| ↘ 0.9 ms Calo | ||
| Lo schermo ha mostrato valori di risposta molto veloci nei nostri tests ed è molto adatto per i gaming veloce. In confronto, tutti i dispositivi di test variano da 0.165 (minimo) a 636 (massimo) ms. » 9 % di tutti i dispositivi è migliore. Questo significa che i tempi di risposta rilevati sono migliori rispettto alla media di tutti i dispositivi testati (31 ms). | ||
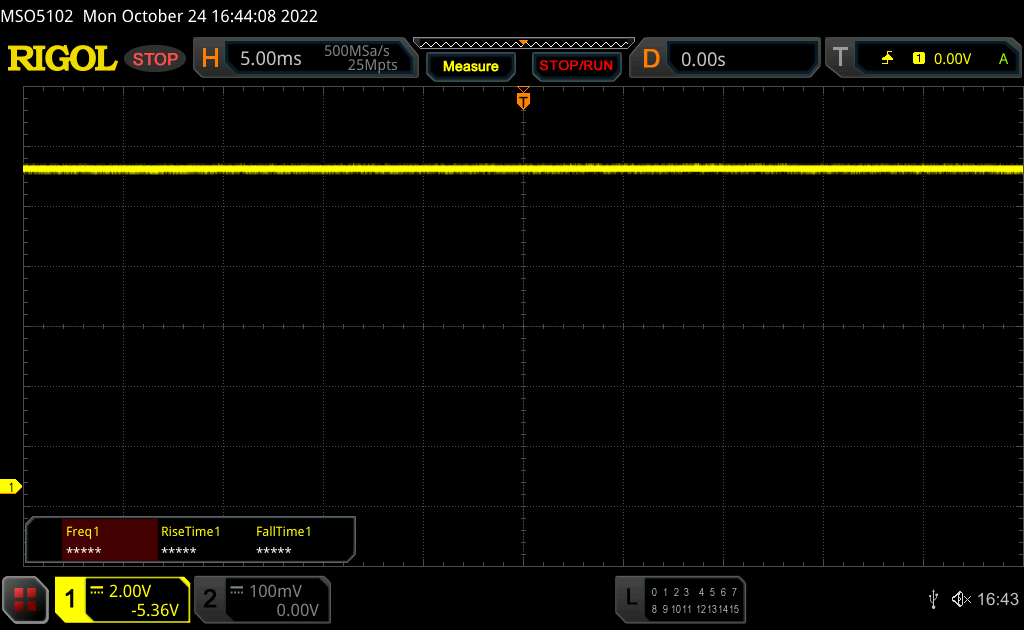
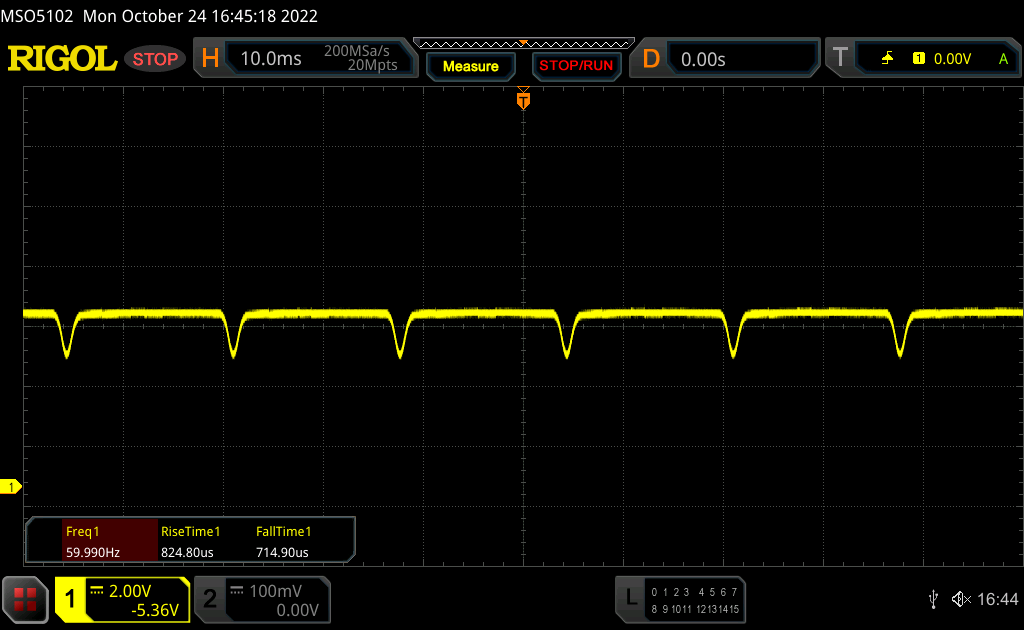
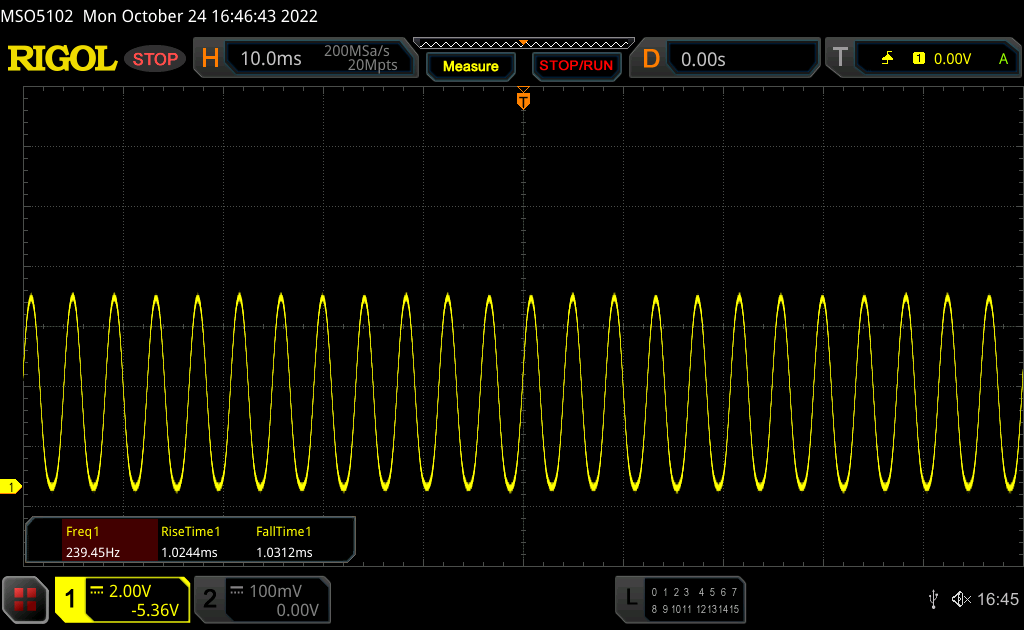
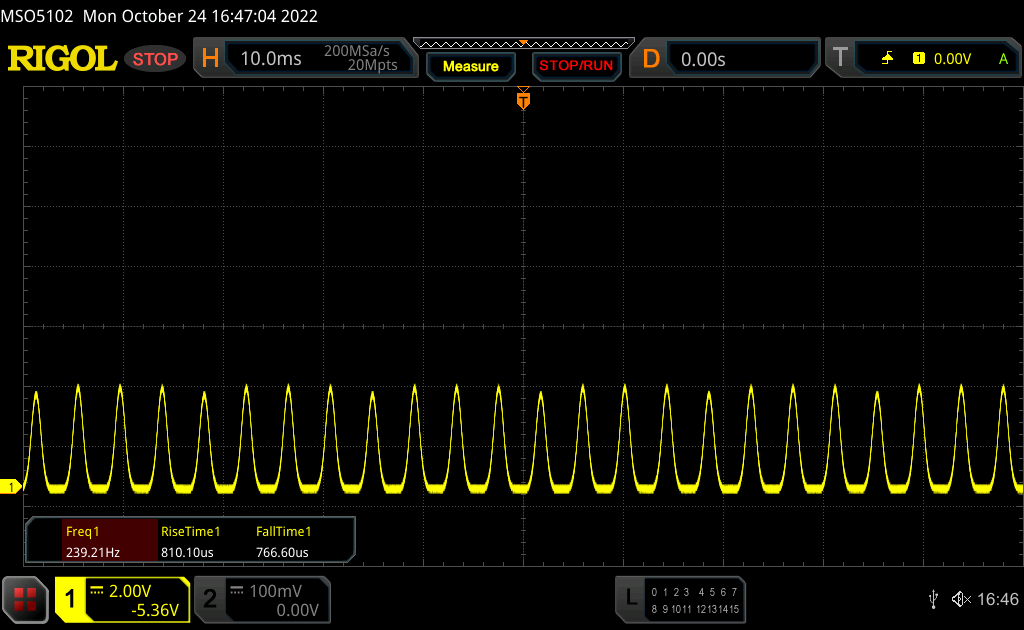
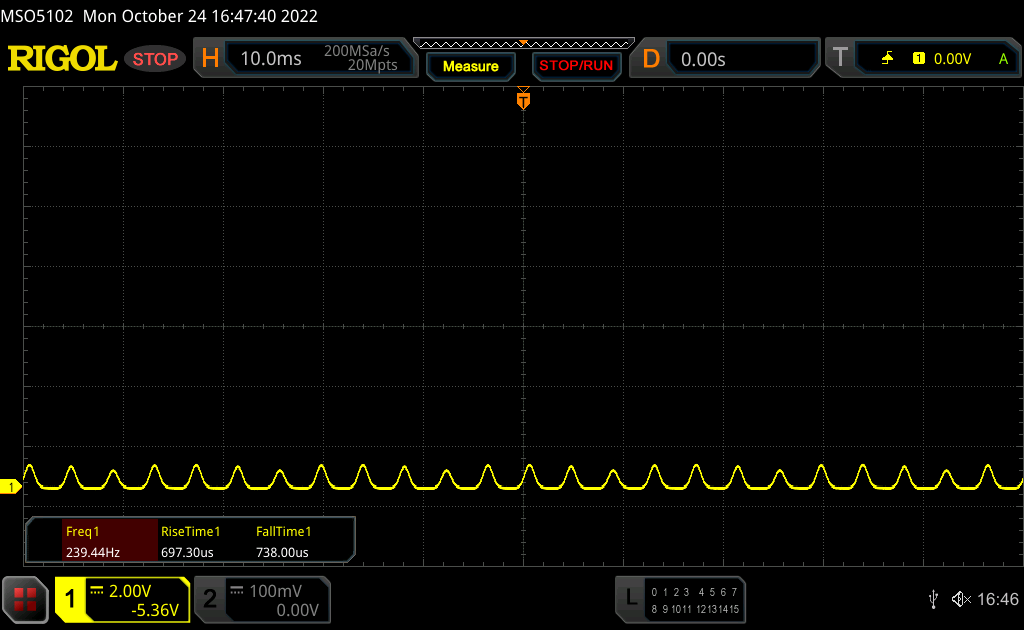
Sfarfallio dello schermo / PWM (Pulse-Width Modulation)
| flickering dello schermo / PWM rilevato | 240 Hz | ≤ 50 % settaggio luminosita' | 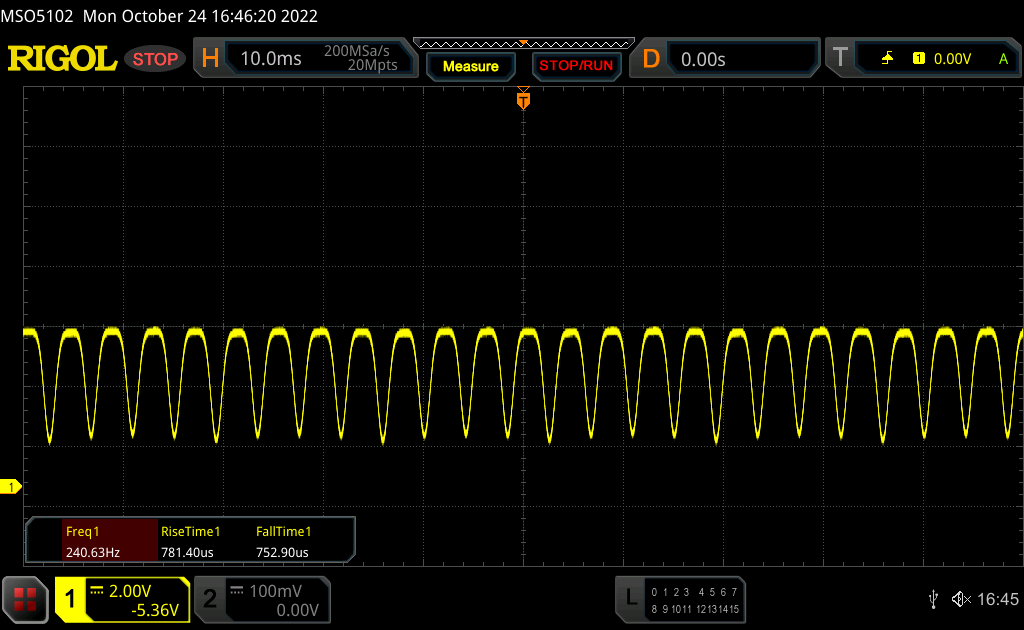 |
| ≤ 86 luminosita' cd/m² | |||
Il display sfarfalla a 240 Hz (Probabilmente a causa dell'uso di PWM) Flickering rilevato ad una luminosita' di 50 % (86 cd/m²) o inferiore. Non dovrebbe verificarsi flickering o PWM sopra questo valore di luminosita'. La frequenza di 240 Hz è relativamente bassa, quindi gli utenti sensibili potrebbero notare il flickering ed accusare stanchezza agli occhi a questo livello di luminosità e a livelli inferiori. Il flickering di verifica con settaggi di luminosita' relativamente bassa, quindi un utilizzo prolungato a questi livelli o a livelli ingeriori potrebbe causare stanchezza agli occhi. In confronto: 52 % di tutti i dispositivi testati non utilizza PWM per ridurre la luminosita' del display. Se è rilevato PWM, una media di 7747 (minimo: 5 - massimo: 343500) Hz è stata rilevata. | |||
Nell'intervallo tra il 51 e il 90% di luminosità viene utilizzato il dimming DC con una frequenza di 60 Hz, ma poiché l'ampiezza è molto bassa, non dovrebbero esserci problemi. A partire da una luminosità del 50% (~86 cd/m²) si può notare il noto sfarfallio PWM a 240 Hz. Lenovo non offre una soluzione software come quella dell'Asus Zenbook S 13 per abilitare il DC dimming anche a livelli di luminosità inferiori.

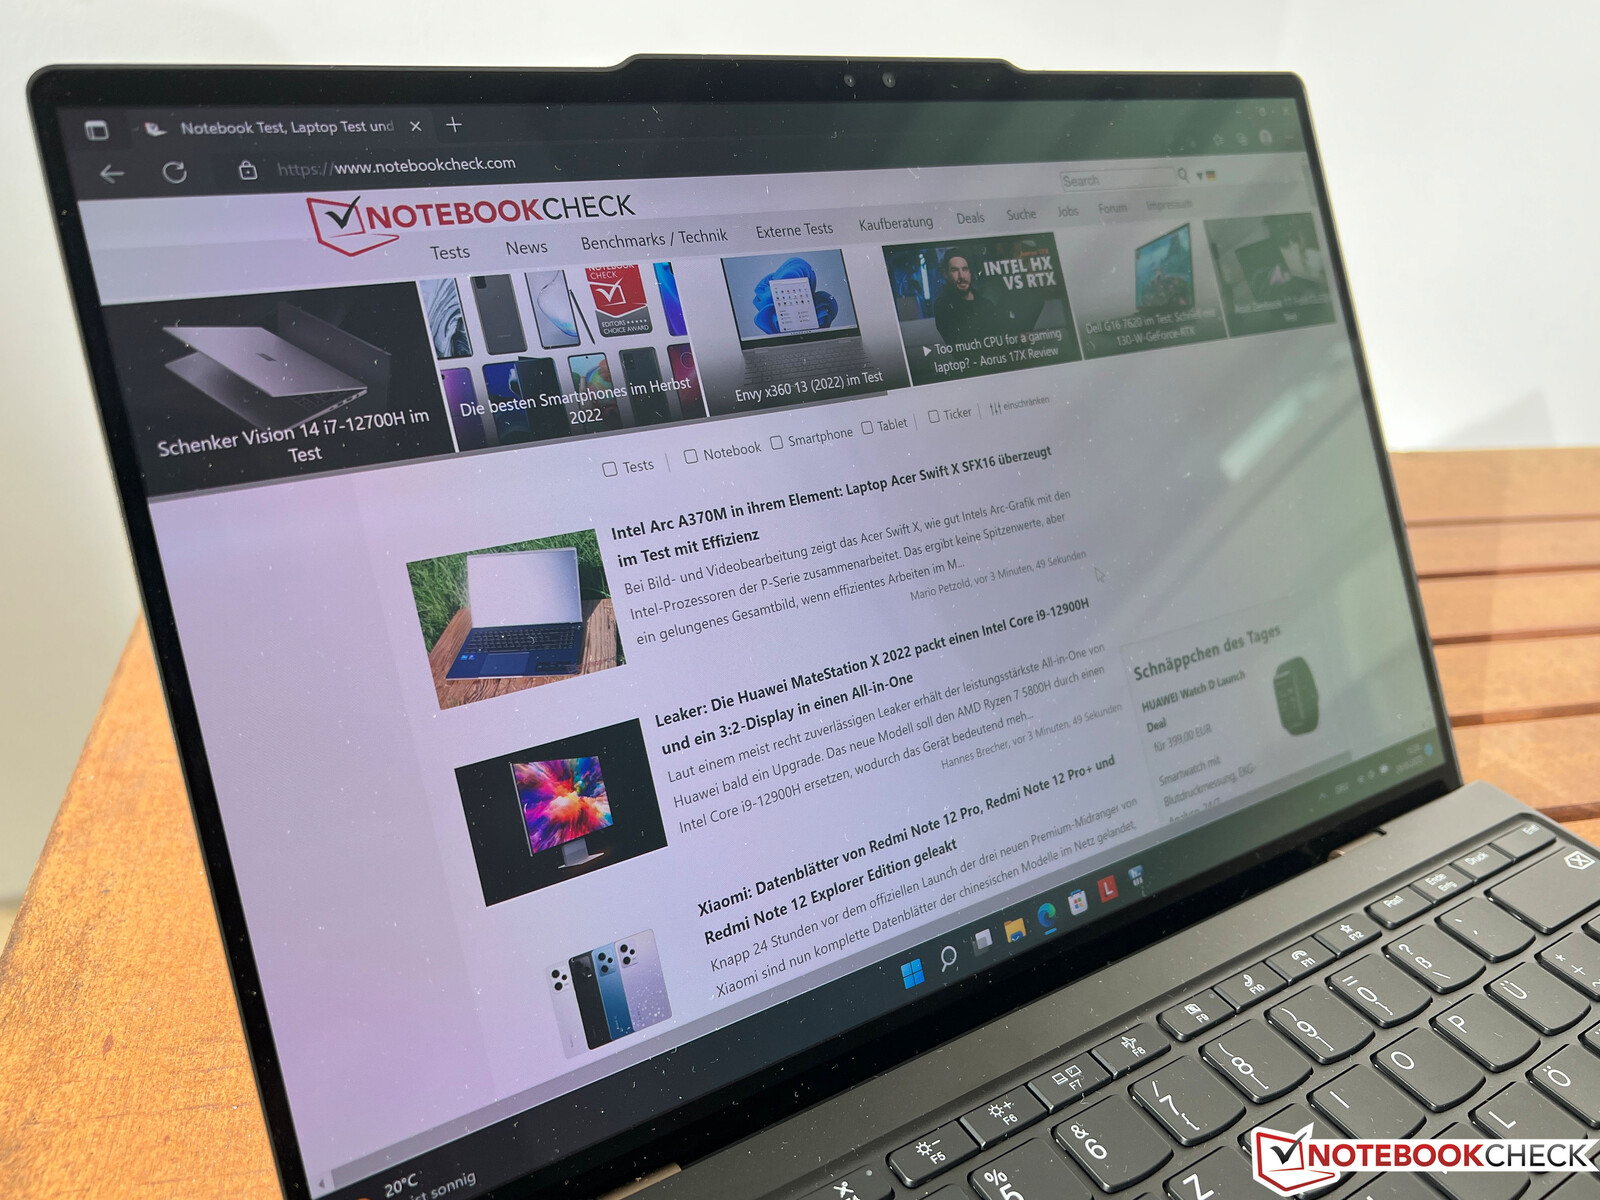
I riflessi sono ovviamente un problema sul display riflettente, ma se si riesce a evitarli, il contenuto dello schermo può essere letto correttamente all'aperto grazie al rapporto di contrasto estremamente elevato anche nelle giornate luminose.
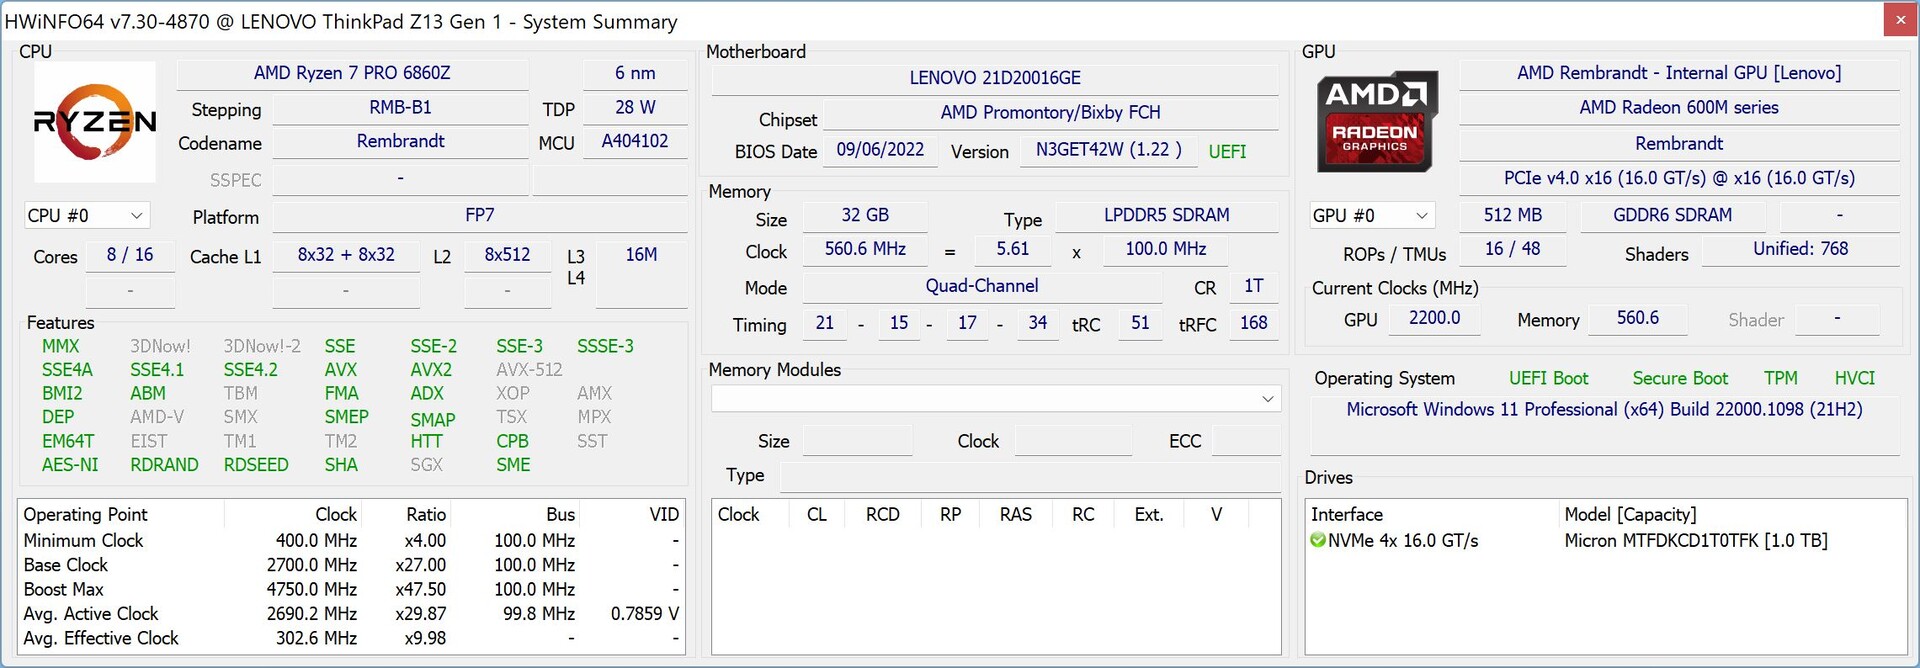
Prestazioni - AMD Ryzen 7 Pro 6860Z
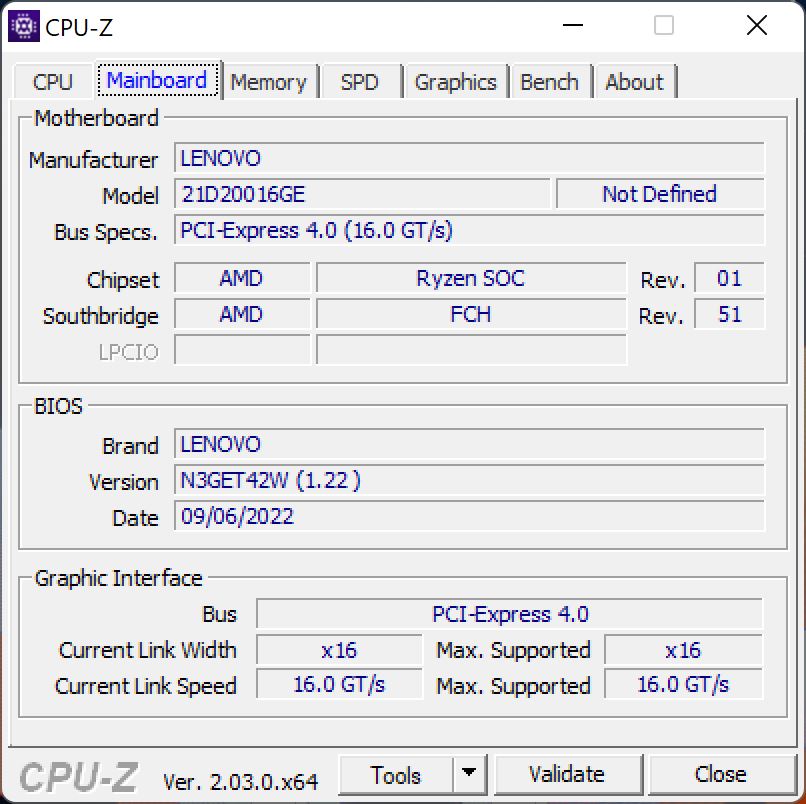
Condizioni di prova
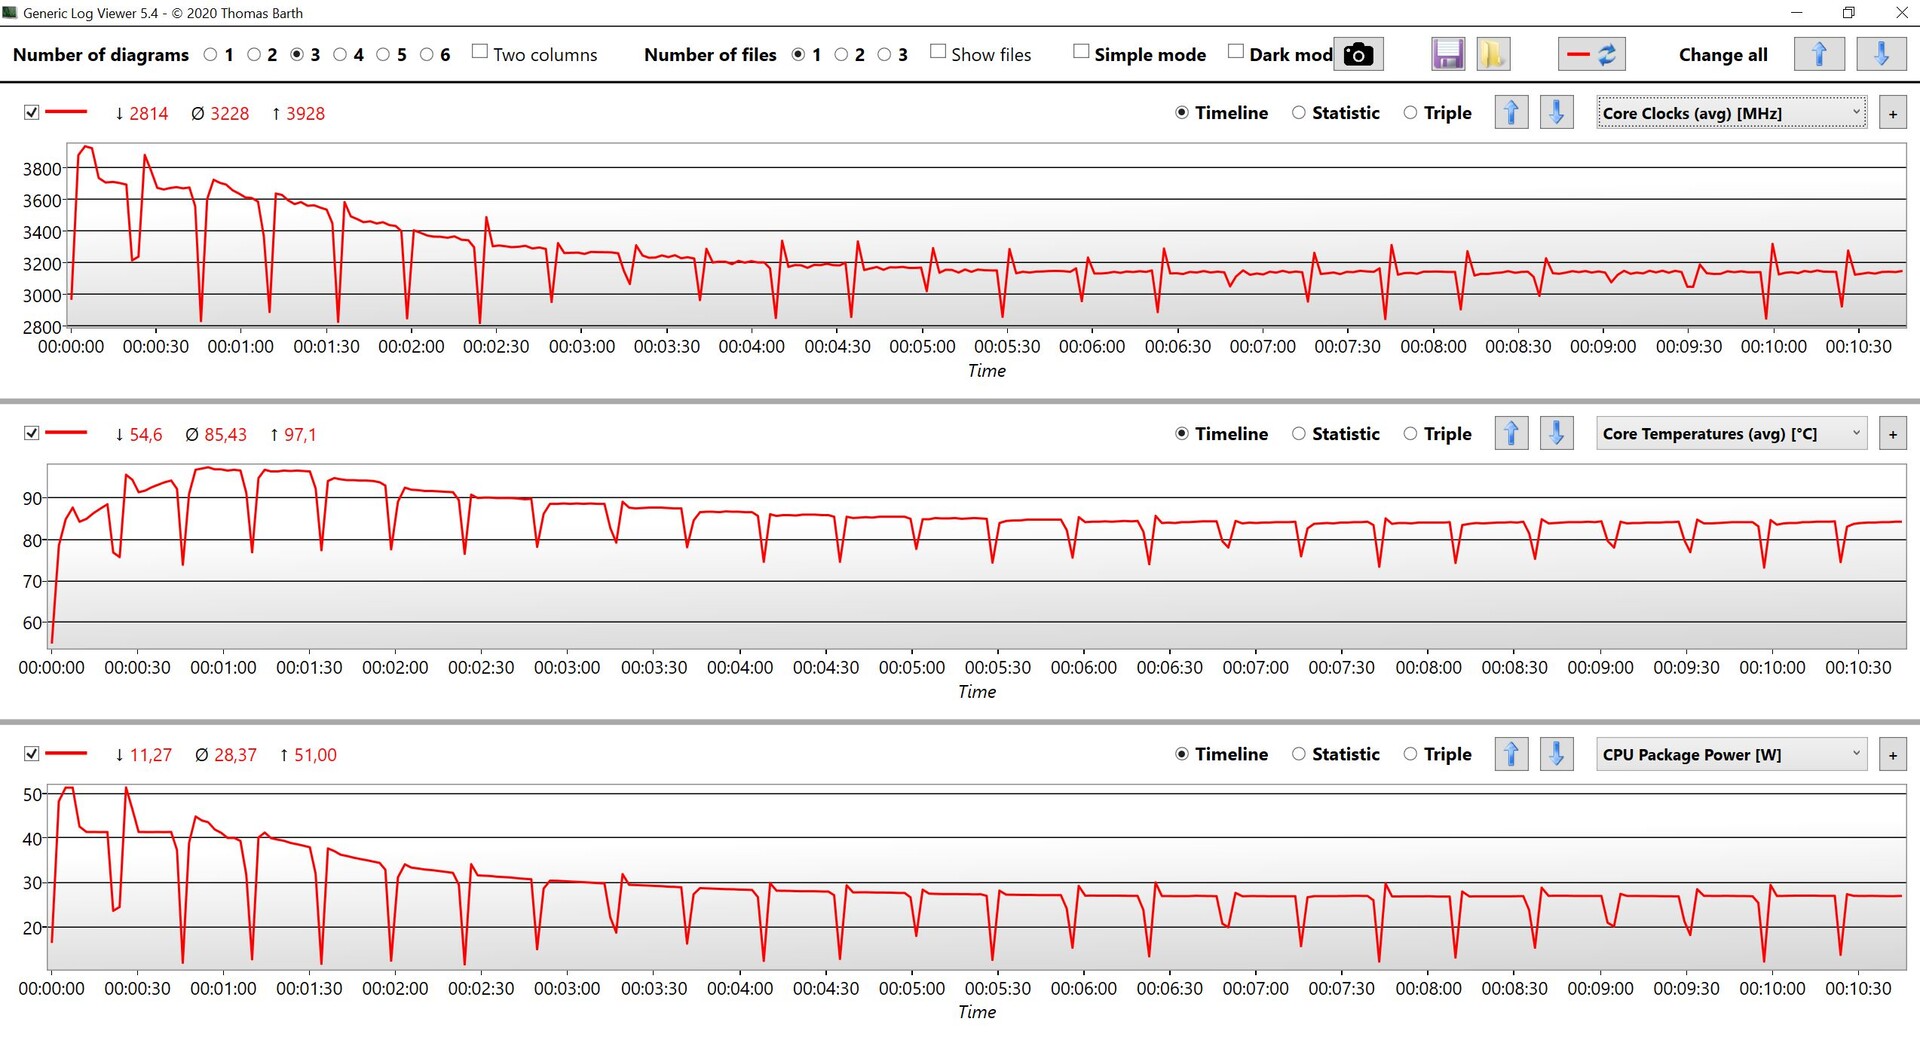
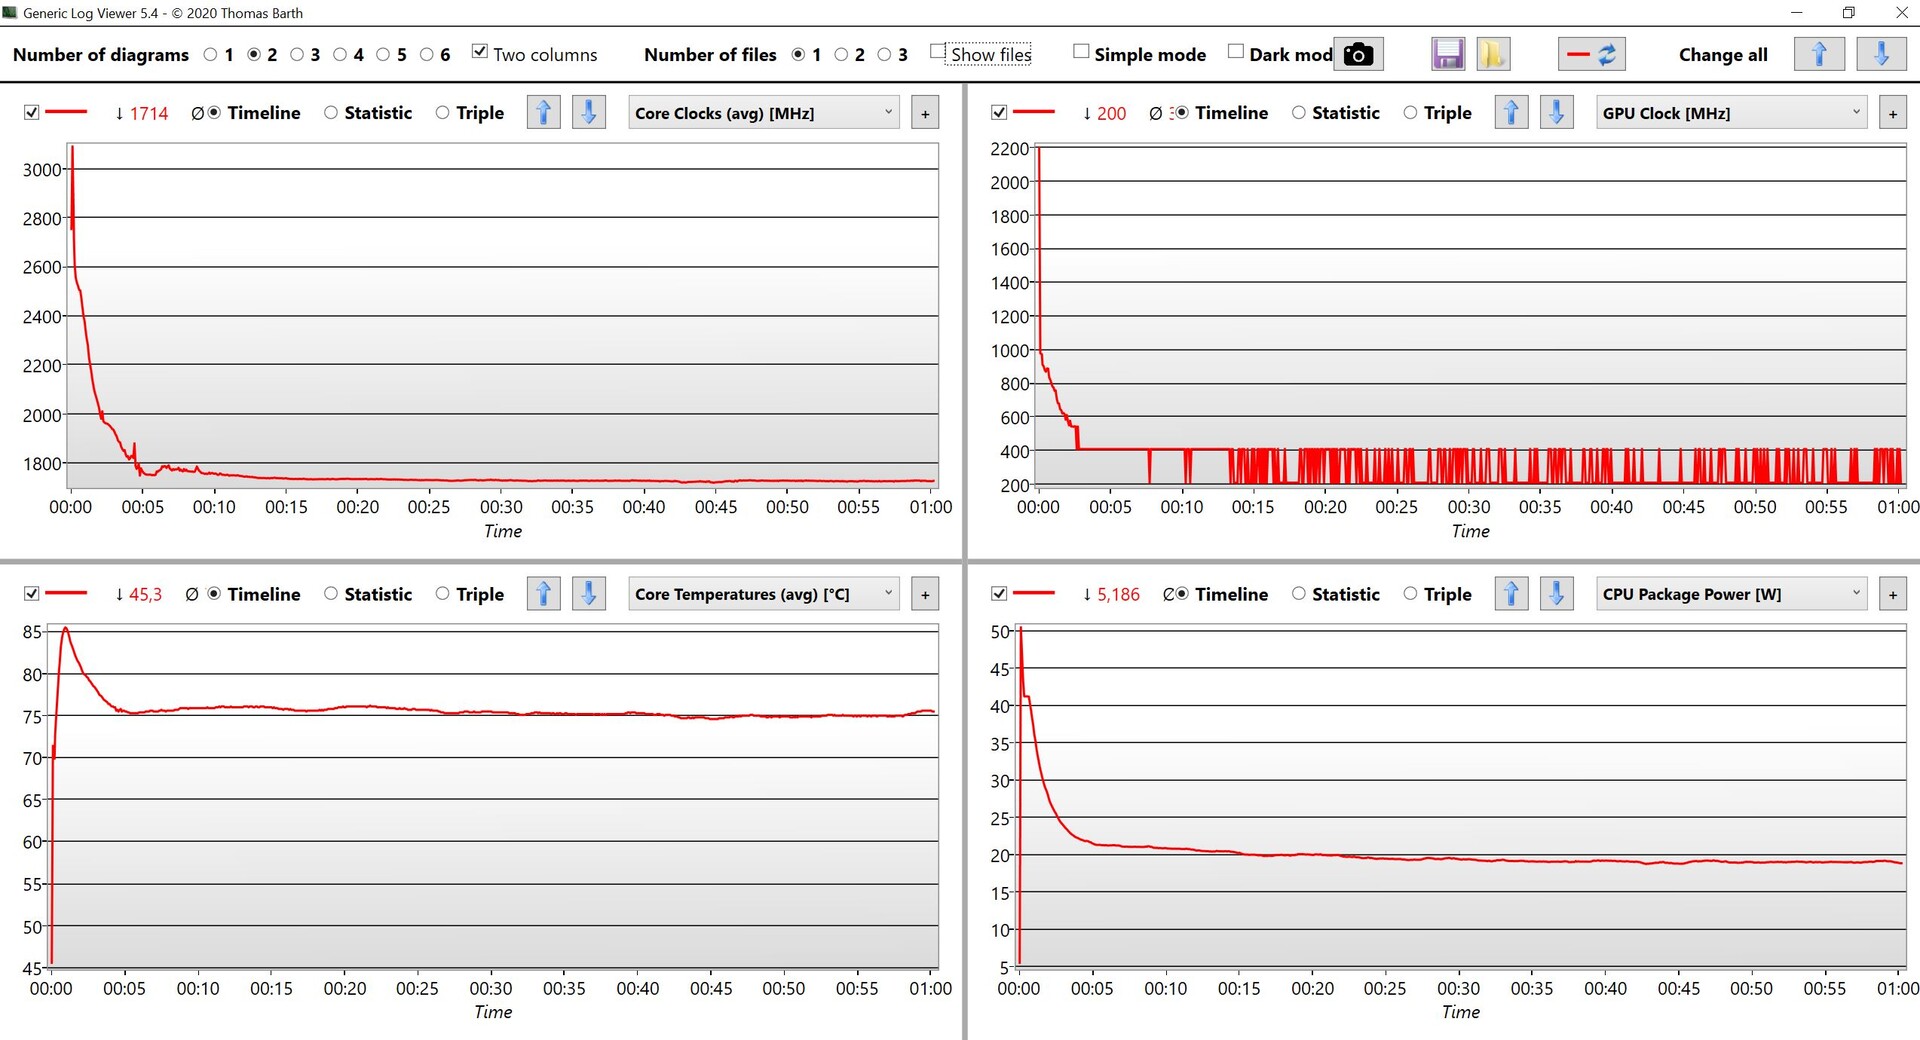
Oltre alle normali impostazioni delle prestazioni di Windows, il ThinkPad AMD offre un raffreddamento intelligente, che può essere disattivato tramite la combinazione di tasti Fn+T. Nei nostri test con il Ryzen 7 Pro abbiamo ottenuto risultati leggermente migliori quando la funzione è stata attivata. In pratica, al processore vengono assegnati 51 watt per un breve periodo, per poi scendere a 27 watt.
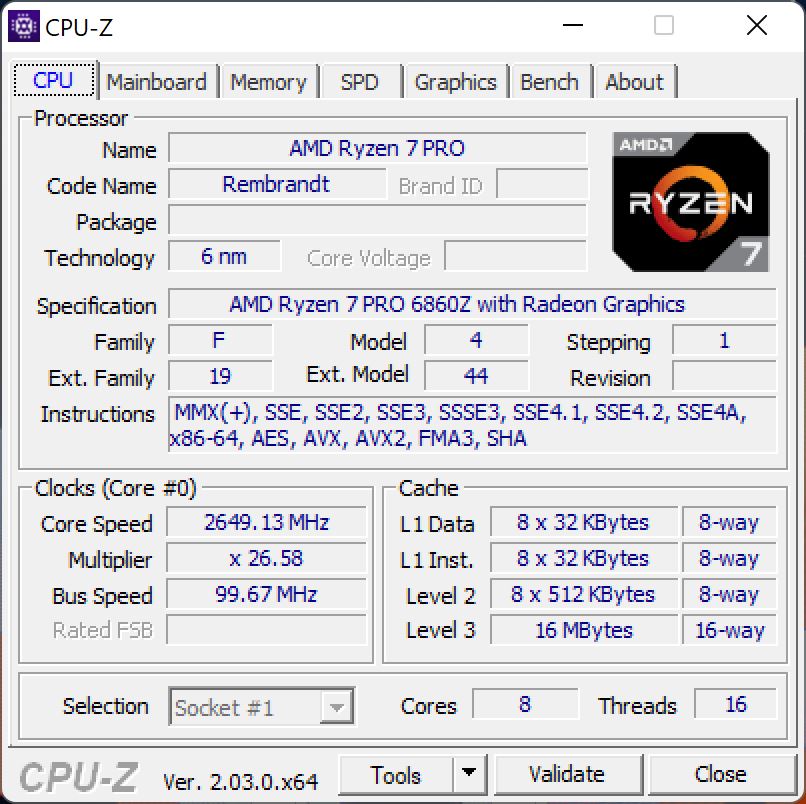
Processore
Lenovo equipaggia il modello di punta del ThinkPad Z13 con un AMD Ryzen 7 Pro 6860Z, che è un'esclusiva di questo modello. È disponibile pochissima documentazione sulle regolazioni di questo chip e anche dopo il nostro test non ne siamo molto consapevoli. In linea di massima, si tratta di un Ryzen 7 Pro 6850U standard (disponibile anche per lo Z13), solo che il boost clock massimo è impostato a 50 MHz in più, a 4,75 GHz. Entrambi i modelli Ryzen 7 Pro possono essere configurati con un massimo di 32 GB di RAM.
Le prestazioni della CPU sono molto buone, soprattutto nei primi minuti, poiché il consumo energetico non cala immediatamente. Sotto carico permanente, tuttavia, il Ryzen 7 Pro 6860Z è alla pari con il Ryzen 7 Pro 6850U e anche con il Ryzen 7 6800U di fascia consumer, se vengono utilizzati con un TDP uguale o simile (generalmente 25 watt). Il Ryzen 5 Pro 6650U nel ThinkPad Z13 è mediamente più lento del 19% in tutti i benchmark della CPU.
Cinebench R15 score
Con l'alimentazione a batteria, le prestazioni multi-core sono inferiori di circa il 30%, mentre quelle single-core rimangono stabili. Altri benchmark della CPU sono disponibili nella la nostra sezione tecnica.
Cinebench R23: Multi Core | Single Core
Cinebench R20: CPU (Multi Core) | CPU (Single Core)
Cinebench R15: CPU Multi 64Bit | CPU Single 64Bit
Blender: v2.79 BMW27 CPU
7-Zip 18.03: 7z b 4 | 7z b 4 -mmt1
Geekbench 5.5: Multi-Core | Single-Core
HWBOT x265 Benchmark v2.2: 4k Preset
LibreOffice : 20 Documents To PDF
R Benchmark 2.5: Overall mean
| CPU Performance rating | |
| Lenovo ThinkPad Z16 G1 21D5S00T00 | |
| Dell XPS 13 Plus 9320 i7-1280P OLED | |
| Media della classe Subnotebook | |
| Lenovo ThinkPad Z13 G1-21D20016GE | |
| Media AMD Ryzen 7 PRO 6860Z | |
| Lenovo ThinkPad T14 G3-21CF004NGE | |
| Asus Zenbook S 13 OLED | |
| Apple MacBook Air M2 10C GPU -5! | |
| Lenovo ThinkPad Z13 21D2CTO1WW | |
| Cinebench R23 / Multi Core | |
| Media della classe Subnotebook (1555 - 21812, n=60, ultimi 2 anni) | |
| Lenovo ThinkPad Z16 G1 21D5S00T00 | |
| Dell XPS 13 Plus 9320 i7-1280P OLED | |
| Lenovo ThinkPad Z13 G1-21D20016GE | |
| Media AMD Ryzen 7 PRO 6860Z (n=1) | |
| Asus Zenbook S 13 OLED | |
| Lenovo ThinkPad T14 G3-21CF004NGE | |
| Lenovo ThinkPad Z13 21D2CTO1WW | |
| Apple MacBook Air M2 10C GPU | |
| Cinebench R23 / Single Core | |
| Media della classe Subnotebook (358 - 2213, n=61, ultimi 2 anni) | |
| Dell XPS 13 Plus 9320 i7-1280P OLED | |
| Apple MacBook Air M2 10C GPU | |
| Lenovo ThinkPad T14 G3-21CF004NGE | |
| Lenovo ThinkPad Z16 G1 21D5S00T00 | |
| Asus Zenbook S 13 OLED | |
| Lenovo ThinkPad Z13 G1-21D20016GE | |
| Media AMD Ryzen 7 PRO 6860Z (n=1) | |
| Lenovo ThinkPad Z13 21D2CTO1WW | |
| Cinebench R20 / CPU (Multi Core) | |
| Lenovo ThinkPad Z16 G1 21D5S00T00 | |
| Media della classe Subnotebook (579 - 8541, n=57, ultimi 2 anni) | |
| Dell XPS 13 Plus 9320 i7-1280P OLED | |
| Lenovo ThinkPad Z13 G1-21D20016GE | |
| Media AMD Ryzen 7 PRO 6860Z (n=1) | |
| Lenovo ThinkPad T14 G3-21CF004NGE | |
| Asus Zenbook S 13 OLED | |
| Lenovo ThinkPad Z13 21D2CTO1WW | |
| Apple MacBook Air M2 10C GPU | |
| Cinebench R20 / CPU (Single Core) | |
| Media della classe Subnotebook (128 - 832, n=57, ultimi 2 anni) | |
| Dell XPS 13 Plus 9320 i7-1280P OLED | |
| Lenovo ThinkPad Z13 G1-21D20016GE | |
| Media AMD Ryzen 7 PRO 6860Z (n=1) | |
| Lenovo ThinkPad T14 G3-21CF004NGE | |
| Lenovo ThinkPad Z16 G1 21D5S00T00 | |
| Lenovo ThinkPad Z13 21D2CTO1WW | |
| Asus Zenbook S 13 OLED | |
| Apple MacBook Air M2 10C GPU | |
| Cinebench R15 / CPU Multi 64Bit | |
| Lenovo ThinkPad Z16 G1 21D5S00T00 | |
| Media della classe Subnotebook (327 - 3345, n=57, ultimi 2 anni) | |
| Lenovo ThinkPad Z13 G1-21D20016GE | |
| Media AMD Ryzen 7 PRO 6860Z (n=1) | |
| Dell XPS 13 Plus 9320 i7-1280P OLED | |
| Lenovo ThinkPad T14 G3-21CF004NGE | |
| Asus Zenbook S 13 OLED | |
| Lenovo ThinkPad Z13 21D2CTO1WW | |
| Apple MacBook Air M2 10C GPU | |
| Cinebench R15 / CPU Single 64Bit | |
| Media della classe Subnotebook (72.4 - 322, n=57, ultimi 2 anni) | |
| Lenovo ThinkPad Z16 G1 21D5S00T00 | |
| Asus Zenbook S 13 OLED | |
| Lenovo ThinkPad T14 G3-21CF004NGE | |
| Lenovo ThinkPad Z13 21D2CTO1WW | |
| Lenovo ThinkPad Z13 G1-21D20016GE | |
| Media AMD Ryzen 7 PRO 6860Z (n=1) | |
| Dell XPS 13 Plus 9320 i7-1280P OLED | |
| Apple MacBook Air M2 10C GPU | |
| Blender / v2.79 BMW27 CPU | |
| Apple MacBook Air M2 10C GPU | |
| Lenovo ThinkPad Z13 21D2CTO1WW | |
| Media della classe Subnotebook (159 - 2271, n=58, ultimi 2 anni) | |
| Asus Zenbook S 13 OLED | |
| Lenovo ThinkPad T14 G3-21CF004NGE | |
| Lenovo ThinkPad Z13 G1-21D20016GE | |
| Media AMD Ryzen 7 PRO 6860Z (n=1) | |
| Dell XPS 13 Plus 9320 i7-1280P OLED | |
| Lenovo ThinkPad Z16 G1 21D5S00T00 | |
| 7-Zip 18.03 / 7z b 4 | |
| Lenovo ThinkPad Z16 G1 21D5S00T00 | |
| Lenovo ThinkPad Z13 G1-21D20016GE | |
| Media AMD Ryzen 7 PRO 6860Z (n=1) | |
| Lenovo ThinkPad T14 G3-21CF004NGE | |
| Dell XPS 13 Plus 9320 i7-1280P OLED | |
| Asus Zenbook S 13 OLED | |
| Media della classe Subnotebook (11668 - 77867, n=57, ultimi 2 anni) | |
| Lenovo ThinkPad Z13 21D2CTO1WW | |
| 7-Zip 18.03 / 7z b 4 -mmt1 | |
| Media della classe Subnotebook (2643 - 6699, n=59, ultimi 2 anni) | |
| Asus Zenbook S 13 OLED | |
| Lenovo ThinkPad Z16 G1 21D5S00T00 | |
| Lenovo ThinkPad T14 G3-21CF004NGE | |
| Lenovo ThinkPad Z13 G1-21D20016GE | |
| Media AMD Ryzen 7 PRO 6860Z (n=1) | |
| Lenovo ThinkPad Z13 21D2CTO1WW | |
| Dell XPS 13 Plus 9320 i7-1280P OLED | |
| Geekbench 5.5 / Multi-Core | |
| Dell XPS 13 Plus 9320 i7-1280P OLED | |
| Media della classe Subnotebook (2557 - 17218, n=48, ultimi 2 anni) | |
| Apple MacBook Air M2 10C GPU | |
| Lenovo ThinkPad Z16 G1 21D5S00T00 | |
| Lenovo ThinkPad Z13 G1-21D20016GE | |
| Media AMD Ryzen 7 PRO 6860Z (n=1) | |
| Lenovo ThinkPad T14 G3-21CF004NGE | |
| Asus Zenbook S 13 OLED | |
| Lenovo ThinkPad Z13 21D2CTO1WW | |
| Geekbench 5.5 / Single-Core | |
| Apple MacBook Air M2 10C GPU | |
| Media della classe Subnotebook (726 - 2224, n=48, ultimi 2 anni) | |
| Dell XPS 13 Plus 9320 i7-1280P OLED | |
| Asus Zenbook S 13 OLED | |
| Lenovo ThinkPad T14 G3-21CF004NGE | |
| Lenovo ThinkPad Z16 G1 21D5S00T00 | |
| Lenovo ThinkPad Z13 21D2CTO1WW | |
| Lenovo ThinkPad Z13 G1-21D20016GE | |
| Media AMD Ryzen 7 PRO 6860Z (n=1) | |
| HWBOT x265 Benchmark v2.2 / 4k Preset | |
| Lenovo ThinkPad Z16 G1 21D5S00T00 | |
| Lenovo ThinkPad Z13 G1-21D20016GE | |
| Media AMD Ryzen 7 PRO 6860Z (n=1) | |
| Dell XPS 13 Plus 9320 i7-1280P OLED | |
| Lenovo ThinkPad T14 G3-21CF004NGE | |
| Media della classe Subnotebook (0.97 - 25.1, n=57, ultimi 2 anni) | |
| Asus Zenbook S 13 OLED | |
| Lenovo ThinkPad Z13 21D2CTO1WW | |
| LibreOffice / 20 Documents To PDF | |
| Lenovo ThinkPad Z13 21D2CTO1WW | |
| Media della classe Subnotebook (39.9 - 220, n=56, ultimi 2 anni) | |
| Asus Zenbook S 13 OLED | |
| Lenovo ThinkPad T14 G3-21CF004NGE | |
| Lenovo ThinkPad Z16 G1 21D5S00T00 | |
| Lenovo ThinkPad Z13 G1-21D20016GE | |
| Media AMD Ryzen 7 PRO 6860Z (n=1) | |
| Dell XPS 13 Plus 9320 i7-1280P OLED | |
| R Benchmark 2.5 / Overall mean | |
| Lenovo ThinkPad Z13 21D2CTO1WW | |
| Asus Zenbook S 13 OLED | |
| Media della classe Subnotebook (0.4024 - 1.456, n=58, ultimi 2 anni) | |
| Lenovo ThinkPad T14 G3-21CF004NGE | |
| Lenovo ThinkPad Z13 G1-21D20016GE | |
| Media AMD Ryzen 7 PRO 6860Z (n=1) | |
| Lenovo ThinkPad Z16 G1 21D5S00T00 | |
| Dell XPS 13 Plus 9320 i7-1280P OLED | |
* ... Meglio usare valori piccoli
Tuttavia, gli alti valori di consumo energetico hanno anche un effetto negativo sull'efficienza e si può chiaramente vedere che le CPU Ryzen 7 funzionano in modo molto più efficiente nell'intervallo di 25-30 watt. Nell'analisi che segue, esaminiamo l'efficienza nei due benchmark della CPU Cinebench R15 e Cinebench R23 Multi, ciascuno eseguito su un monitor esterno. In questo modo possiamo escludere le diverse prestazioni del monitor come fattori di influenza. Qui si può vedere chiaramente che il Ryzen 7 Pro 6860Z è dietro all' Asus Zenbook S 13 (Ryzen 7 6800U) e il Lenovo ThinkPad T14 G3 (Ryzen 7 Pro 6850U).
| Power Consumption / Cinebench R23 Multi Power Efficiency - external Monitor | |
| Apple MacBook Air M2 10C GPU | |
| Lenovo ThinkPad T14 G3-21CF004NGE | |
| Lenovo Yoga 7-14ARB G7 | |
| Lenovo Yoga Slim 7 Carbon 13IAP7-82U9005FGE | |
| Lenovo ThinkPad Z13 G1-21D20016GE | |
| Schenker Vision 14 2022 RTX 3050 Ti | |
AIDA64: FP32 Ray-Trace | FPU Julia | CPU SHA3 | CPU Queen | FPU SinJulia | FPU Mandel | CPU AES | CPU ZLib | FP64 Ray-Trace | CPU PhotoWorxx
| Performance rating | |
| Lenovo ThinkPad Z16 G1 21D5S00T00 | |
| Lenovo ThinkPad Z13 G1-21D20016GE | |
| Media AMD Ryzen 7 PRO 6860Z | |
| Asus Zenbook S 13 OLED | |
| Media della classe Subnotebook | |
| Lenovo ThinkPad T14 G3-21CF004NGE | |
| Dell XPS 13 Plus 9320 i7-1280P OLED | |
| Lenovo ThinkPad Z13 21D2CTO1WW | |
| AIDA64 / FP32 Ray-Trace | |
| Lenovo ThinkPad Z16 G1 21D5S00T00 | |
| Media della classe Subnotebook (1135 - 32888, n=58, ultimi 2 anni) | |
| Lenovo ThinkPad Z13 G1-21D20016GE | |
| Media AMD Ryzen 7 PRO 6860Z (n=1) | |
| Lenovo ThinkPad T14 G3-21CF004NGE | |
| Asus Zenbook S 13 OLED | |
| Dell XPS 13 Plus 9320 i7-1280P OLED | |
| Lenovo ThinkPad Z13 21D2CTO1WW | |
| AIDA64 / FPU Julia | |
| Lenovo ThinkPad Z16 G1 21D5S00T00 | |
| Lenovo ThinkPad Z13 G1-21D20016GE | |
| Media AMD Ryzen 7 PRO 6860Z (n=1) | |
| Lenovo ThinkPad T14 G3-21CF004NGE | |
| Asus Zenbook S 13 OLED | |
| Media della classe Subnotebook (5218 - 123315, n=58, ultimi 2 anni) | |
| Lenovo ThinkPad Z13 21D2CTO1WW | |
| Dell XPS 13 Plus 9320 i7-1280P OLED | |
| AIDA64 / CPU SHA3 | |
| Lenovo ThinkPad Z16 G1 21D5S00T00 | |
| Media della classe Subnotebook (444 - 5287, n=58, ultimi 2 anni) | |
| Lenovo ThinkPad Z13 G1-21D20016GE | |
| Media AMD Ryzen 7 PRO 6860Z (n=1) | |
| Dell XPS 13 Plus 9320 i7-1280P OLED | |
| Lenovo ThinkPad T14 G3-21CF004NGE | |
| Asus Zenbook S 13 OLED | |
| Lenovo ThinkPad Z13 21D2CTO1WW | |
| AIDA64 / CPU Queen | |
| Lenovo ThinkPad Z16 G1 21D5S00T00 | |
| Lenovo ThinkPad Z13 G1-21D20016GE | |
| Media AMD Ryzen 7 PRO 6860Z (n=1) | |
| Dell XPS 13 Plus 9320 i7-1280P OLED | |
| Lenovo ThinkPad T14 G3-21CF004NGE | |
| Asus Zenbook S 13 OLED | |
| Lenovo ThinkPad Z13 21D2CTO1WW | |
| Media della classe Subnotebook (10579 - 95002, n=49, ultimi 2 anni) | |
| AIDA64 / FPU SinJulia | |
| Lenovo ThinkPad Z16 G1 21D5S00T00 | |
| Lenovo ThinkPad Z13 G1-21D20016GE | |
| Media AMD Ryzen 7 PRO 6860Z (n=1) | |
| Lenovo ThinkPad T14 G3-21CF004NGE | |
| Asus Zenbook S 13 OLED | |
| Lenovo ThinkPad Z13 21D2CTO1WW | |
| Dell XPS 13 Plus 9320 i7-1280P OLED | |
| Media della classe Subnotebook (744 - 18418, n=58, ultimi 2 anni) | |
| AIDA64 / FPU Mandel | |
| Lenovo ThinkPad Z16 G1 21D5S00T00 | |
| Lenovo ThinkPad Z13 G1-21D20016GE | |
| Media AMD Ryzen 7 PRO 6860Z (n=1) | |
| Lenovo ThinkPad T14 G3-21CF004NGE | |
| Asus Zenbook S 13 OLED | |
| Lenovo ThinkPad Z13 21D2CTO1WW | |
| Media della classe Subnotebook (3341 - 65433, n=58, ultimi 2 anni) | |
| Dell XPS 13 Plus 9320 i7-1280P OLED | |
| AIDA64 / CPU AES | |
| Asus Zenbook S 13 OLED | |
| Lenovo ThinkPad Z16 G1 21D5S00T00 | |
| Lenovo ThinkPad Z13 G1-21D20016GE | |
| Media AMD Ryzen 7 PRO 6860Z (n=1) | |
| Dell XPS 13 Plus 9320 i7-1280P OLED | |
| Media della classe Subnotebook (638 - 96917, n=58, ultimi 2 anni) | |
| Lenovo ThinkPad T14 G3-21CF004NGE | |
| Lenovo ThinkPad Z13 21D2CTO1WW | |
| AIDA64 / CPU ZLib | |
| Lenovo ThinkPad Z16 G1 21D5S00T00 | |
| Media della classe Subnotebook (164.9 - 1379, n=58, ultimi 2 anni) | |
| Dell XPS 13 Plus 9320 i7-1280P OLED | |
| Lenovo ThinkPad T14 G3-21CF004NGE | |
| Lenovo ThinkPad Z13 G1-21D20016GE | |
| Media AMD Ryzen 7 PRO 6860Z (n=1) | |
| Asus Zenbook S 13 OLED | |
| Lenovo ThinkPad Z13 21D2CTO1WW | |
| AIDA64 / FP64 Ray-Trace | |
| Lenovo ThinkPad Z16 G1 21D5S00T00 | |
| Media della classe Subnotebook (610 - 17495, n=58, ultimi 2 anni) | |
| Lenovo ThinkPad Z13 G1-21D20016GE | |
| Media AMD Ryzen 7 PRO 6860Z (n=1) | |
| Lenovo ThinkPad T14 G3-21CF004NGE | |
| Dell XPS 13 Plus 9320 i7-1280P OLED | |
| Asus Zenbook S 13 OLED | |
| Lenovo ThinkPad Z13 21D2CTO1WW | |
| AIDA64 / CPU PhotoWorxx | |
| Media della classe Subnotebook (6569 - 85600, n=58, ultimi 2 anni) | |
| Dell XPS 13 Plus 9320 i7-1280P OLED | |
| Lenovo ThinkPad Z16 G1 21D5S00T00 | |
| Lenovo ThinkPad Z13 21D2CTO1WW | |
| Lenovo ThinkPad T14 G3-21CF004NGE | |
| Asus Zenbook S 13 OLED | |
| Lenovo ThinkPad Z13 G1-21D20016GE | |
| Media AMD Ryzen 7 PRO 6860Z (n=1) | |
Prestazioni del sistema
Il ThinkPad Z13 è un dispositivo molto reattivo e anche i risultati dei benchmark sintetici sono molto buoni. Non abbiamo riscontrato alcun problema durante l'esecuzione del test.
CrossMark: Overall | Productivity | Creativity | Responsiveness
| PCMark 10 / Score | |
| Media della classe Subnotebook (4920 - 9939, n=45, ultimi 2 anni) | |
| Lenovo ThinkPad Z16 G1 21D5S00T00 | |
| Asus Zenbook S 13 OLED | |
| Lenovo ThinkPad Z13 G1-21D20016GE | |
| Media AMD Ryzen 7 PRO 6860Z, AMD Radeon 680M (n=1) | |
| Lenovo ThinkPad T14 G3-21CF004NGE | |
| Dell XPS 13 Plus 9320 i7-1280P OLED | |
| Lenovo ThinkPad Z13 21D2CTO1WW | |
| PCMark 10 / Essentials | |
| Asus Zenbook S 13 OLED | |
| Dell XPS 13 Plus 9320 i7-1280P OLED | |
| Media della classe Subnotebook (8552 - 11646, n=45, ultimi 2 anni) | |
| Lenovo ThinkPad Z13 G1-21D20016GE | |
| Media AMD Ryzen 7 PRO 6860Z, AMD Radeon 680M (n=1) | |
| Lenovo ThinkPad Z16 G1 21D5S00T00 | |
| Lenovo ThinkPad T14 G3-21CF004NGE | |
| Lenovo ThinkPad Z13 21D2CTO1WW | |
| PCMark 10 / Productivity | |
| Media della classe Subnotebook (5435 - 16606, n=45, ultimi 2 anni) | |
| Asus Zenbook S 13 OLED | |
| Lenovo ThinkPad T14 G3-21CF004NGE | |
| Lenovo ThinkPad Z16 G1 21D5S00T00 | |
| Lenovo ThinkPad Z13 G1-21D20016GE | |
| Media AMD Ryzen 7 PRO 6860Z, AMD Radeon 680M (n=1) | |
| Lenovo ThinkPad Z13 21D2CTO1WW | |
| Dell XPS 13 Plus 9320 i7-1280P OLED | |
| PCMark 10 / Digital Content Creation | |
| Media della classe Subnotebook (5722 - 13779, n=45, ultimi 2 anni) | |
| Lenovo ThinkPad Z16 G1 21D5S00T00 | |
| Lenovo ThinkPad Z13 G1-21D20016GE | |
| Media AMD Ryzen 7 PRO 6860Z, AMD Radeon 680M (n=1) | |
| Lenovo ThinkPad T14 G3-21CF004NGE | |
| Asus Zenbook S 13 OLED | |
| Dell XPS 13 Plus 9320 i7-1280P OLED | |
| Lenovo ThinkPad Z13 21D2CTO1WW | |
| CrossMark / Overall | |
| Dell XPS 13 Plus 9320 i7-1280P OLED | |
| Media della classe Subnotebook (365 - 2356, n=60, ultimi 2 anni) | |
| Lenovo ThinkPad Z13 G1-21D20016GE | |
| Media AMD Ryzen 7 PRO 6860Z, AMD Radeon 680M (n=1) | |
| Apple MacBook Air M2 10C GPU | |
| Asus Zenbook S 13 OLED | |
| Lenovo ThinkPad Z16 G1 21D5S00T00 | |
| Lenovo ThinkPad Z13 21D2CTO1WW | |
| Lenovo ThinkPad T14 G3-21CF004NGE | |
| CrossMark / Productivity | |
| Dell XPS 13 Plus 9320 i7-1280P OLED | |
| Media della classe Subnotebook (364 - 2277, n=60, ultimi 2 anni) | |
| Lenovo ThinkPad Z13 G1-21D20016GE | |
| Media AMD Ryzen 7 PRO 6860Z, AMD Radeon 680M (n=1) | |
| Asus Zenbook S 13 OLED | |
| Lenovo ThinkPad Z16 G1 21D5S00T00 | |
| Lenovo ThinkPad Z13 21D2CTO1WW | |
| Lenovo ThinkPad T14 G3-21CF004NGE | |
| Apple MacBook Air M2 10C GPU | |
| CrossMark / Creativity | |
| Dell XPS 13 Plus 9320 i7-1280P OLED | |
| Media della classe Subnotebook (372 - 2743, n=60, ultimi 2 anni) | |
| Apple MacBook Air M2 10C GPU | |
| Lenovo ThinkPad Z16 G1 21D5S00T00 | |
| Lenovo ThinkPad Z13 G1-21D20016GE | |
| Media AMD Ryzen 7 PRO 6860Z, AMD Radeon 680M (n=1) | |
| Asus Zenbook S 13 OLED | |
| Lenovo ThinkPad Z13 21D2CTO1WW | |
| Lenovo ThinkPad T14 G3-21CF004NGE | |
| CrossMark / Responsiveness | |
| Dell XPS 13 Plus 9320 i7-1280P OLED | |
| Media della classe Subnotebook (312 - 1854, n=60, ultimi 2 anni) | |
| Asus Zenbook S 13 OLED | |
| Lenovo ThinkPad Z13 G1-21D20016GE | |
| Media AMD Ryzen 7 PRO 6860Z, AMD Radeon 680M (n=1) | |
| Lenovo ThinkPad Z16 G1 21D5S00T00 | |
| Lenovo ThinkPad T14 G3-21CF004NGE | |
| Lenovo ThinkPad Z13 21D2CTO1WW | |
| Apple MacBook Air M2 10C GPU | |
| PCMark 10 Score | 6240 punti | |
Aiuto | ||
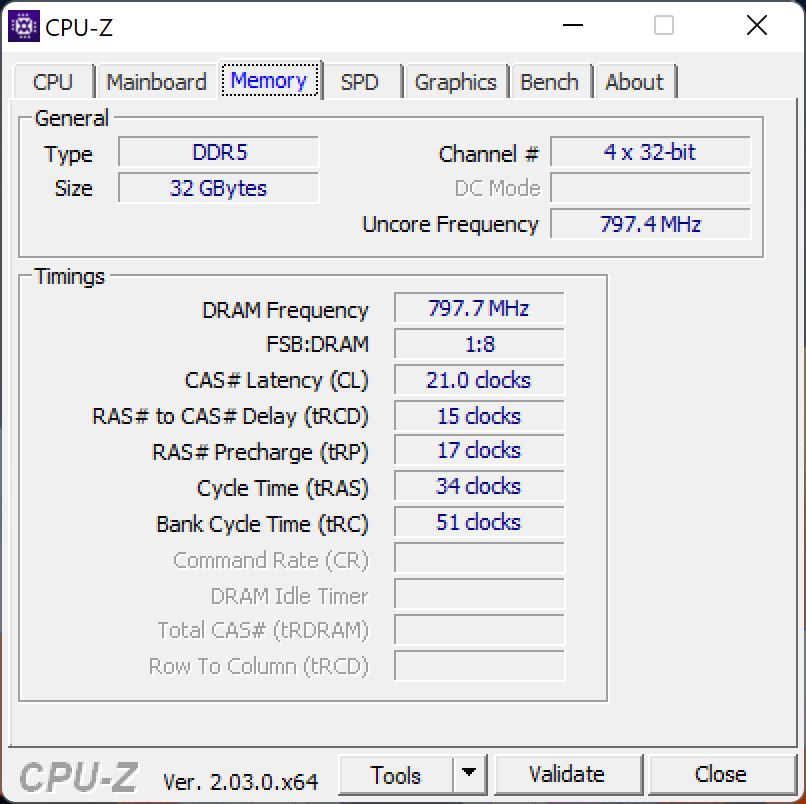
| AIDA64 / Memory Copy | |
| Media della classe Subnotebook (14554 - 131023, n=58, ultimi 2 anni) | |
| Dell XPS 13 Plus 9320 i7-1280P OLED | |
| Lenovo ThinkPad T14 G3-21CF004NGE | |
| Lenovo ThinkPad Z13 21D2CTO1WW | |
| Lenovo ThinkPad Z16 G1 21D5S00T00 | |
| Lenovo ThinkPad Z13 G1-21D20016GE | |
| Media AMD Ryzen 7 PRO 6860Z (n=1) | |
| Asus Zenbook S 13 OLED | |
| AIDA64 / Memory Read | |
| Media della classe Subnotebook (15948 - 127174, n=58, ultimi 2 anni) | |
| Dell XPS 13 Plus 9320 i7-1280P OLED | |
| Lenovo ThinkPad Z16 G1 21D5S00T00 | |
| Lenovo ThinkPad T14 G3-21CF004NGE | |
| Lenovo ThinkPad Z13 21D2CTO1WW | |
| Asus Zenbook S 13 OLED | |
| Lenovo ThinkPad Z13 G1-21D20016GE | |
| Media AMD Ryzen 7 PRO 6860Z (n=1) | |
| AIDA64 / Memory Write | |
| Media della classe Subnotebook (15709 - 135141, n=58, ultimi 2 anni) | |
| Dell XPS 13 Plus 9320 i7-1280P OLED | |
| Lenovo ThinkPad Z16 G1 21D5S00T00 | |
| Lenovo ThinkPad Z13 21D2CTO1WW | |
| Lenovo ThinkPad Z13 G1-21D20016GE | |
| Media AMD Ryzen 7 PRO 6860Z (n=1) | |
| Lenovo ThinkPad T14 G3-21CF004NGE | |
| Asus Zenbook S 13 OLED | |
| AIDA64 / Memory Latency | |
| Lenovo ThinkPad Z16 G1 21D5S00T00 | |
| Lenovo ThinkPad Z13 21D2CTO1WW | |
| Lenovo ThinkPad Z13 G1-21D20016GE | |
| Media AMD Ryzen 7 PRO 6860Z (n=1) | |
| Asus Zenbook S 13 OLED | |
| Lenovo ThinkPad T14 G3-21CF004NGE | |
| Dell XPS 13 Plus 9320 i7-1280P OLED | |
| Media della classe Subnotebook (6.1 - 159.9, n=56, ultimi 2 anni) | |
* ... Meglio usare valori piccoli
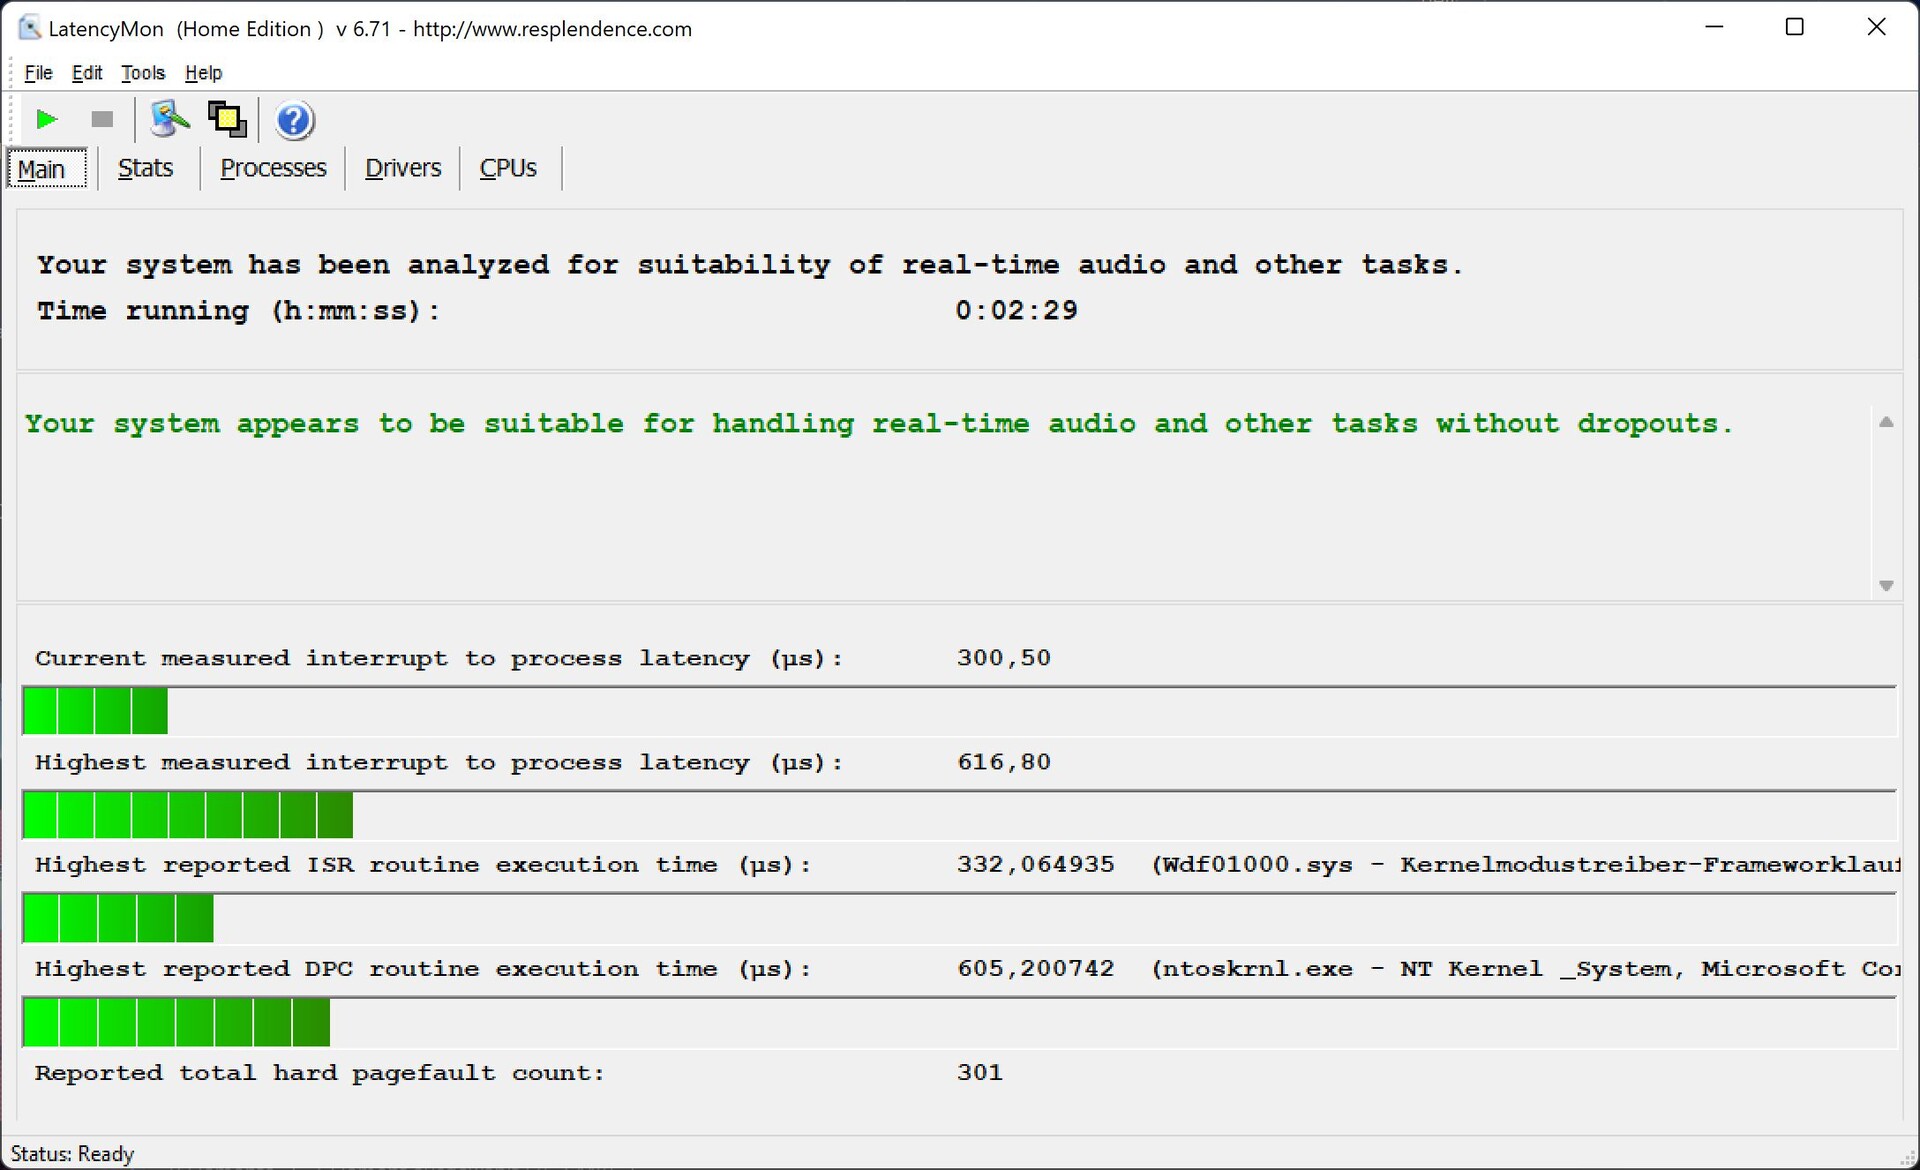
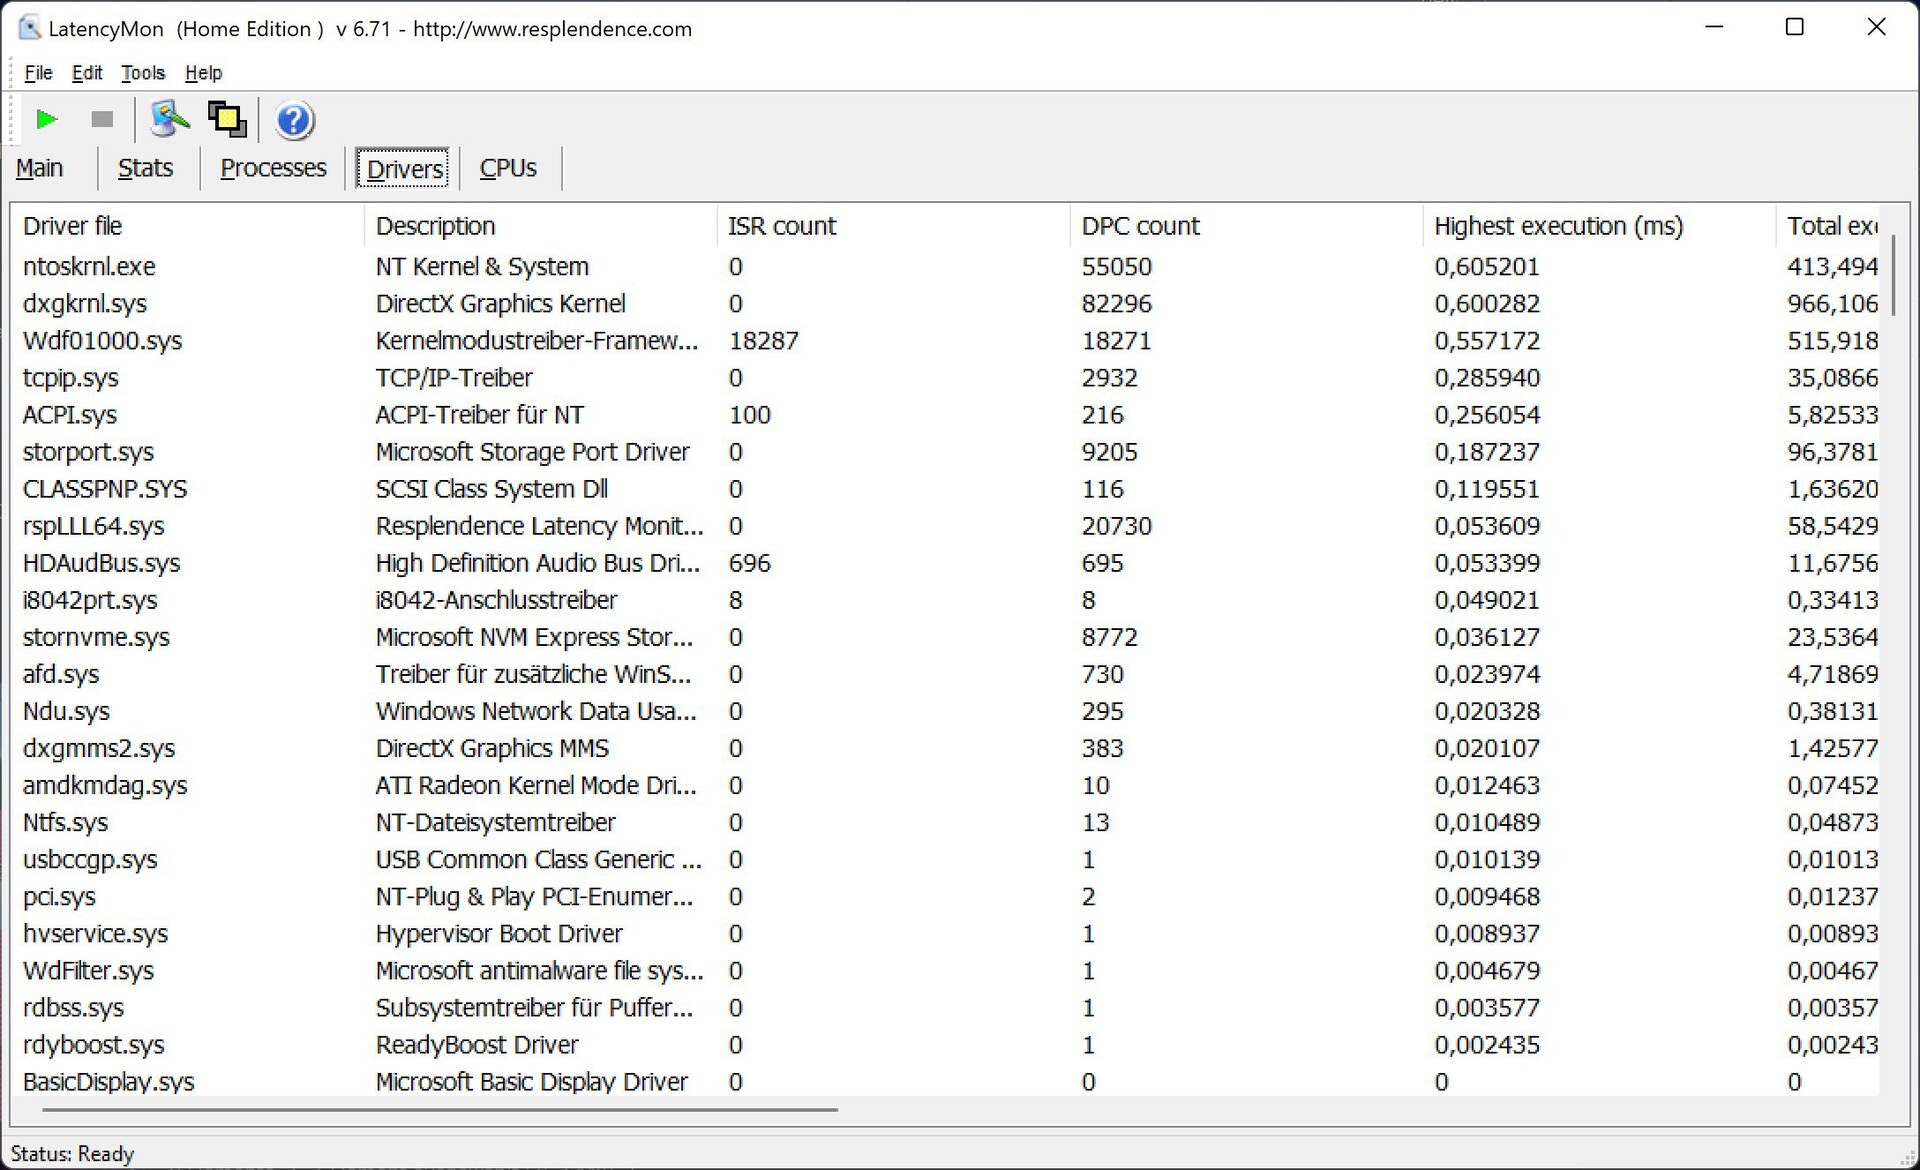
Latenza DPC
Nel nostro test di latenza standardizzato (navigazione web, riproduzione di YouTube in 4K, carico della CPU), il dispositivo di prova si è comportato molto bene con l'attuale versione del BIOS e non ha mostrato alcuna evidenza di carenza di prestazioni tecniche.
| DPC Latencies / LatencyMon - interrupt to process latency (max), Web, Youtube, Prime95 | |
| Lenovo ThinkPad Z13 21D2CTO1WW | |
| Lenovo ThinkPad T14 G3-21CF004NGE | |
| Lenovo ThinkPad Z16 G1 21D5S00T00 | |
| Lenovo ThinkPad Z13 G1-21D20016GE | |
| Asus Zenbook S 13 OLED | |
| Dell XPS 13 Plus 9320 i7-1280P OLED | |
* ... Meglio usare valori piccoli
Dispositivi di archiviazione
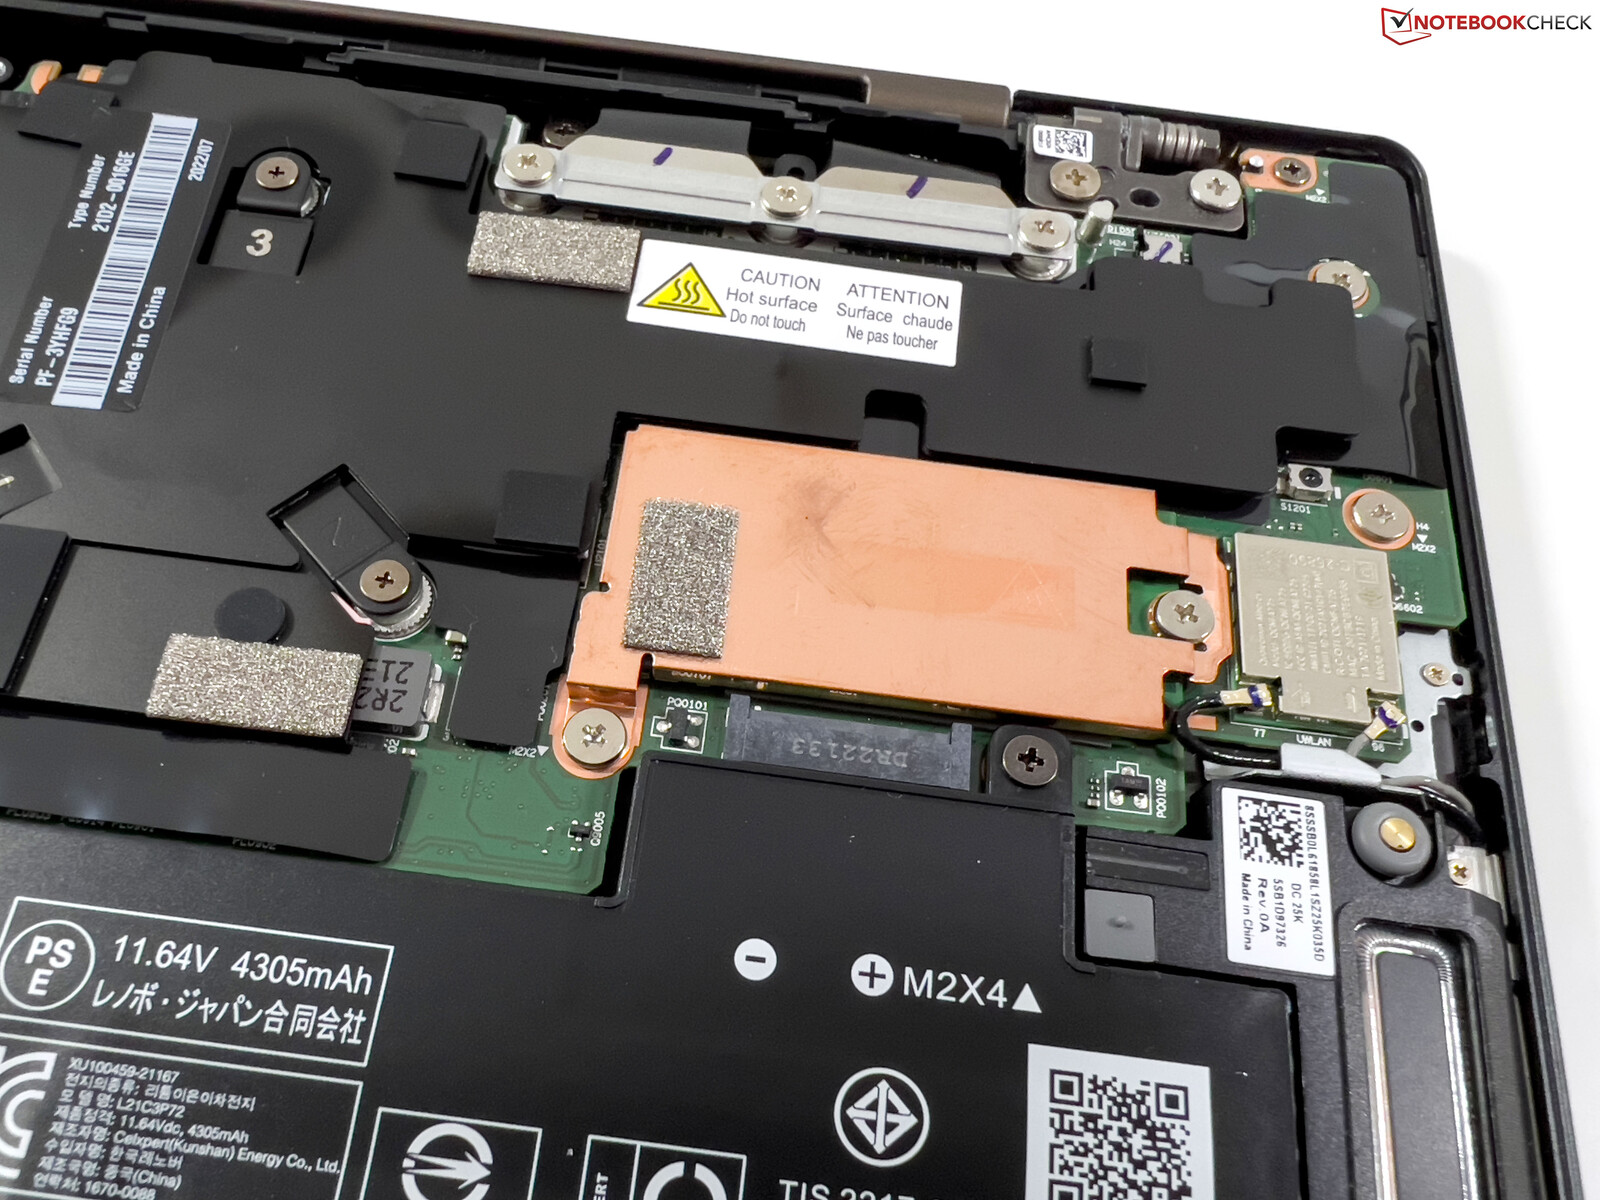
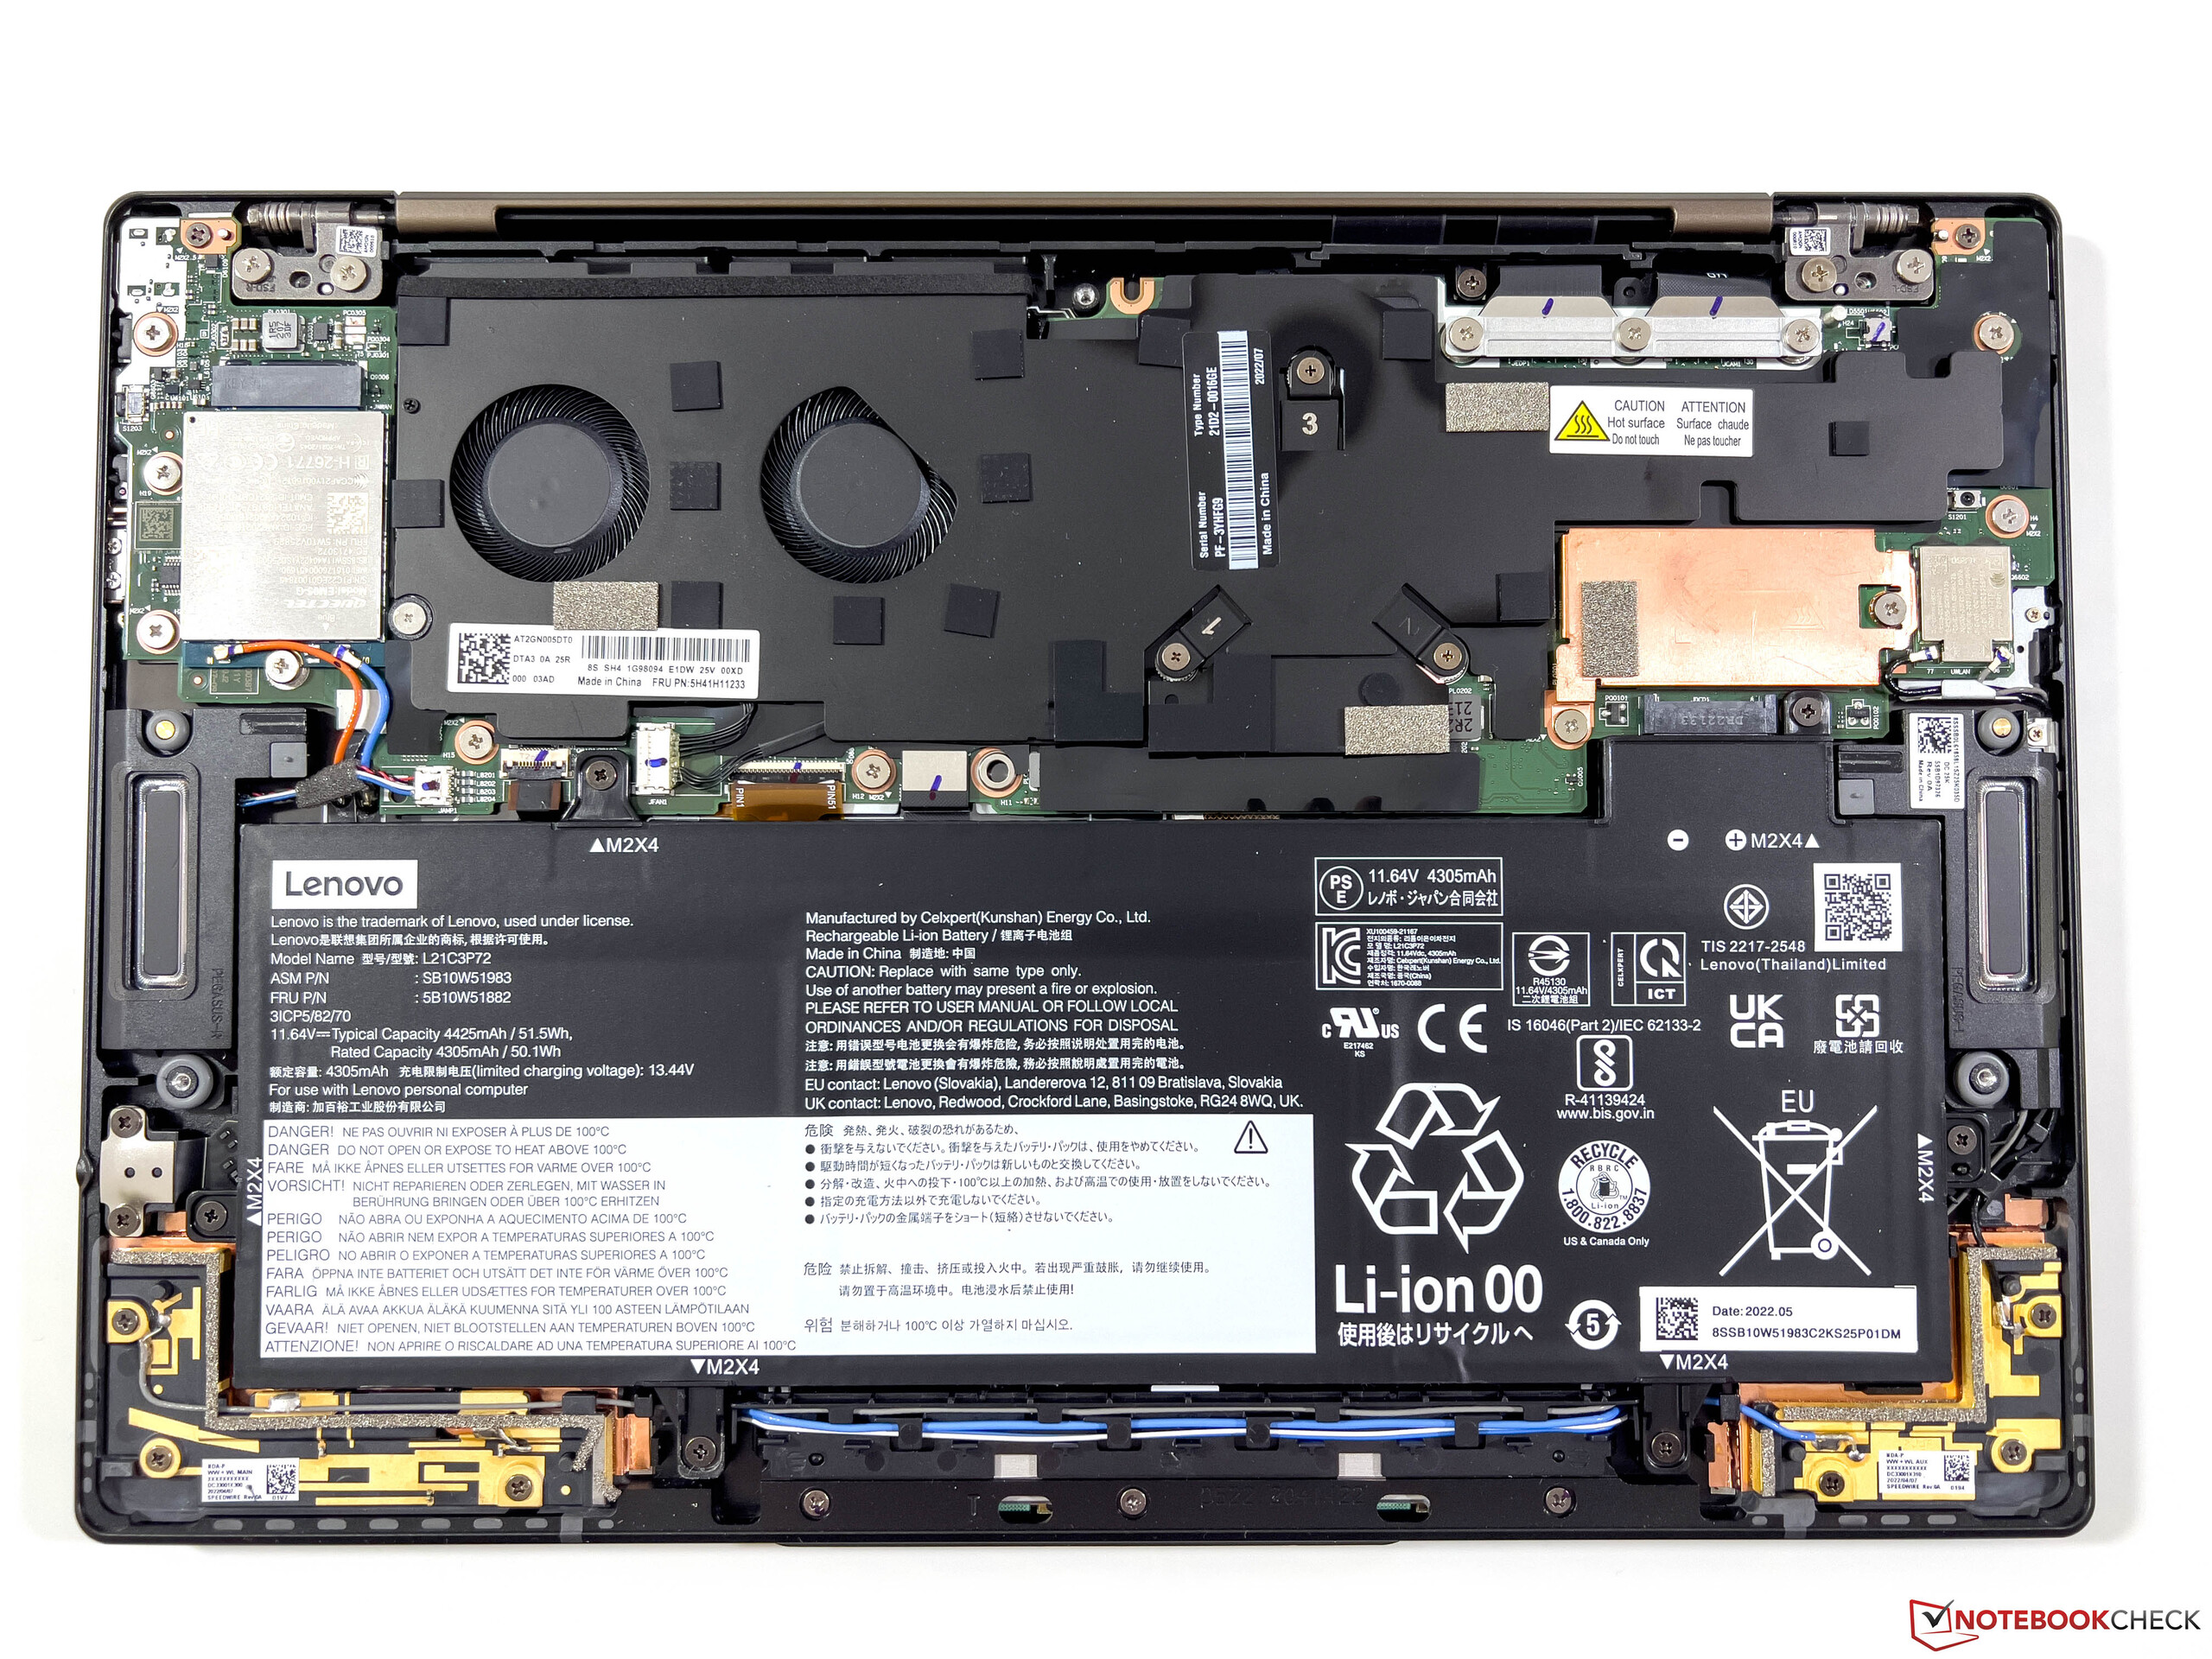
Il ThinkPad Z13 ha spazio solo per un'unità SSD compatta M.2-2242, che è almeno collegata tramite un'interfaccia PCIe 4.0 attuale. Il modello Micron 2450 consente di installare un'unità SSD PCIe 4.0 con una velocità di trasferimento massima di circa 3,3 GB/s. Questo può far perdere un po' di capacità potenziale, ma almeno le prestazioni rimangono costanti anche sotto carico permanente. Di 1 TB, circa 900 GB sono ancora liberamente disponibili per l'utente al primo utilizzo del portatile. Altri benchmark sulle SSD sono disponibili qui.

* ... Meglio usare valori piccoli
Disk Throttling: DiskSpd Read Loop, Queue Depth 8
Scheda grafica
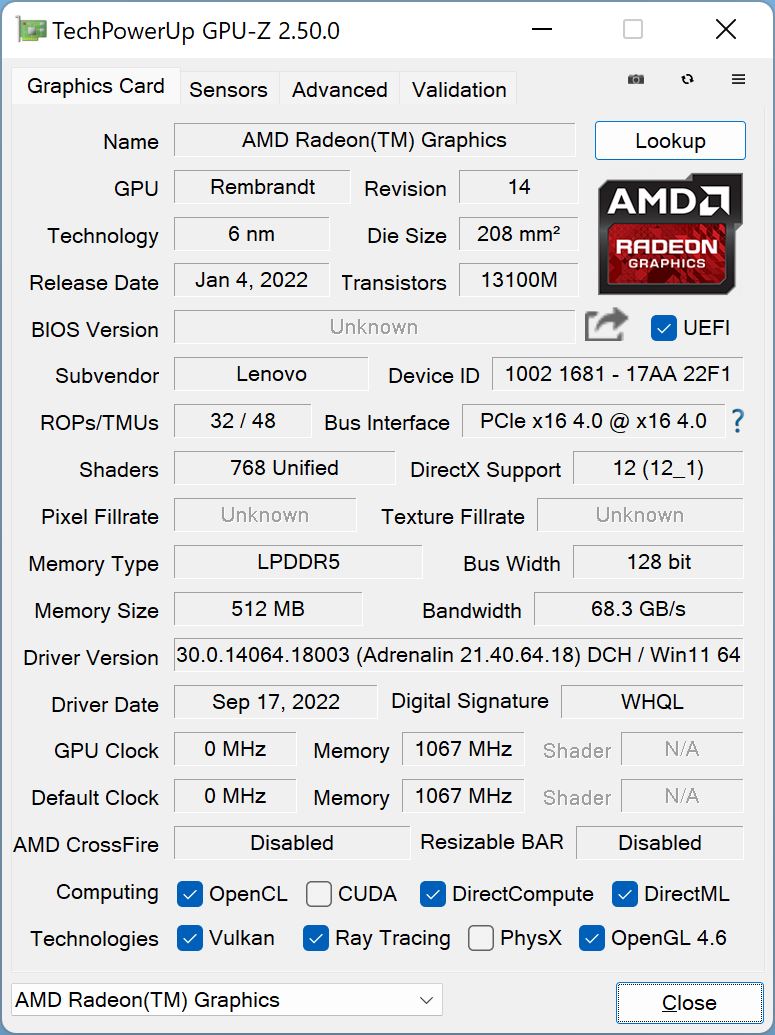
Il Ryzen 7 Pro 6860Z utilizza la nota GPU integrata Radeon 680M con una velocità di clock massima di 2,2 GHz come per le CPU Ryzen 7 convenzionali. Anche nei benchmark sintetici i risultati sono inizialmente molto buoni, ma le prestazioni non rimangono stabili. Lo stress test di 3DMark (Time Spy) fallisce con l'82,7% e quando si sperimenta (cosa che sarebbe abbastanza possibile con la Radeon 680M) con il carico simultaneo della CPU, il chip è stato strozzato ancora di più (per un totale di circa 19 watt). L'Asus Zenbook S 13 o il Lenovo ThinkPad T14 G3 hanno prestazioni nettamente superiori in caso di carico simultaneo.
La Radeon 660M del ThinkPad Z13 entry-level è circa il 35% più lenta ed è anche affetta da throttling. La batteria non riduce le prestazioni grafiche. Altri benchmark delle GPU sono disponibili qui
| 3DMark 11 Performance | 10387 punti | |
| 3DMark Cloud Gate Standard Score | 31075 punti | |
| 3DMark Fire Strike Score | 6287 punti | |
| 3DMark Time Spy Score | 2416 punti | |
Aiuto | ||
* ... Meglio usare valori piccoli
Witcher 3 FPS-Diagramm
| basso | medio | alto | ultra | QHD | |
|---|---|---|---|---|---|
| GTA V (2015) | 136.9 | 122.7 | 46.8 | 20.9 | |
| The Witcher 3 (2015) | 131 | 78 | 33 | 18.3 | |
| Dota 2 Reborn (2015) | 107.7 | 91.8 | 72.2 | 60.6 | |
| Final Fantasy XV Benchmark (2018) | 59.3 | 30.5 | 21.7 | ||
| X-Plane 11.11 (2018) | 51.8 | 40.6 | 34.3 | ||
| Far Cry 5 (2018) | 55 | 34 | 30 | 28 | |
| Strange Brigade (2018) | 133.5 | 55.3 | 44.8 | 38.9 | |
| F1 2021 (2021) | 155.3 | 75.1 | 54.9 | 23 | 15.8 |
| F1 22 (2022) | 71.4 | 61.1 | 44.5 | 9.35 |
Emissioni e consumo di energia
Rumore del sistema
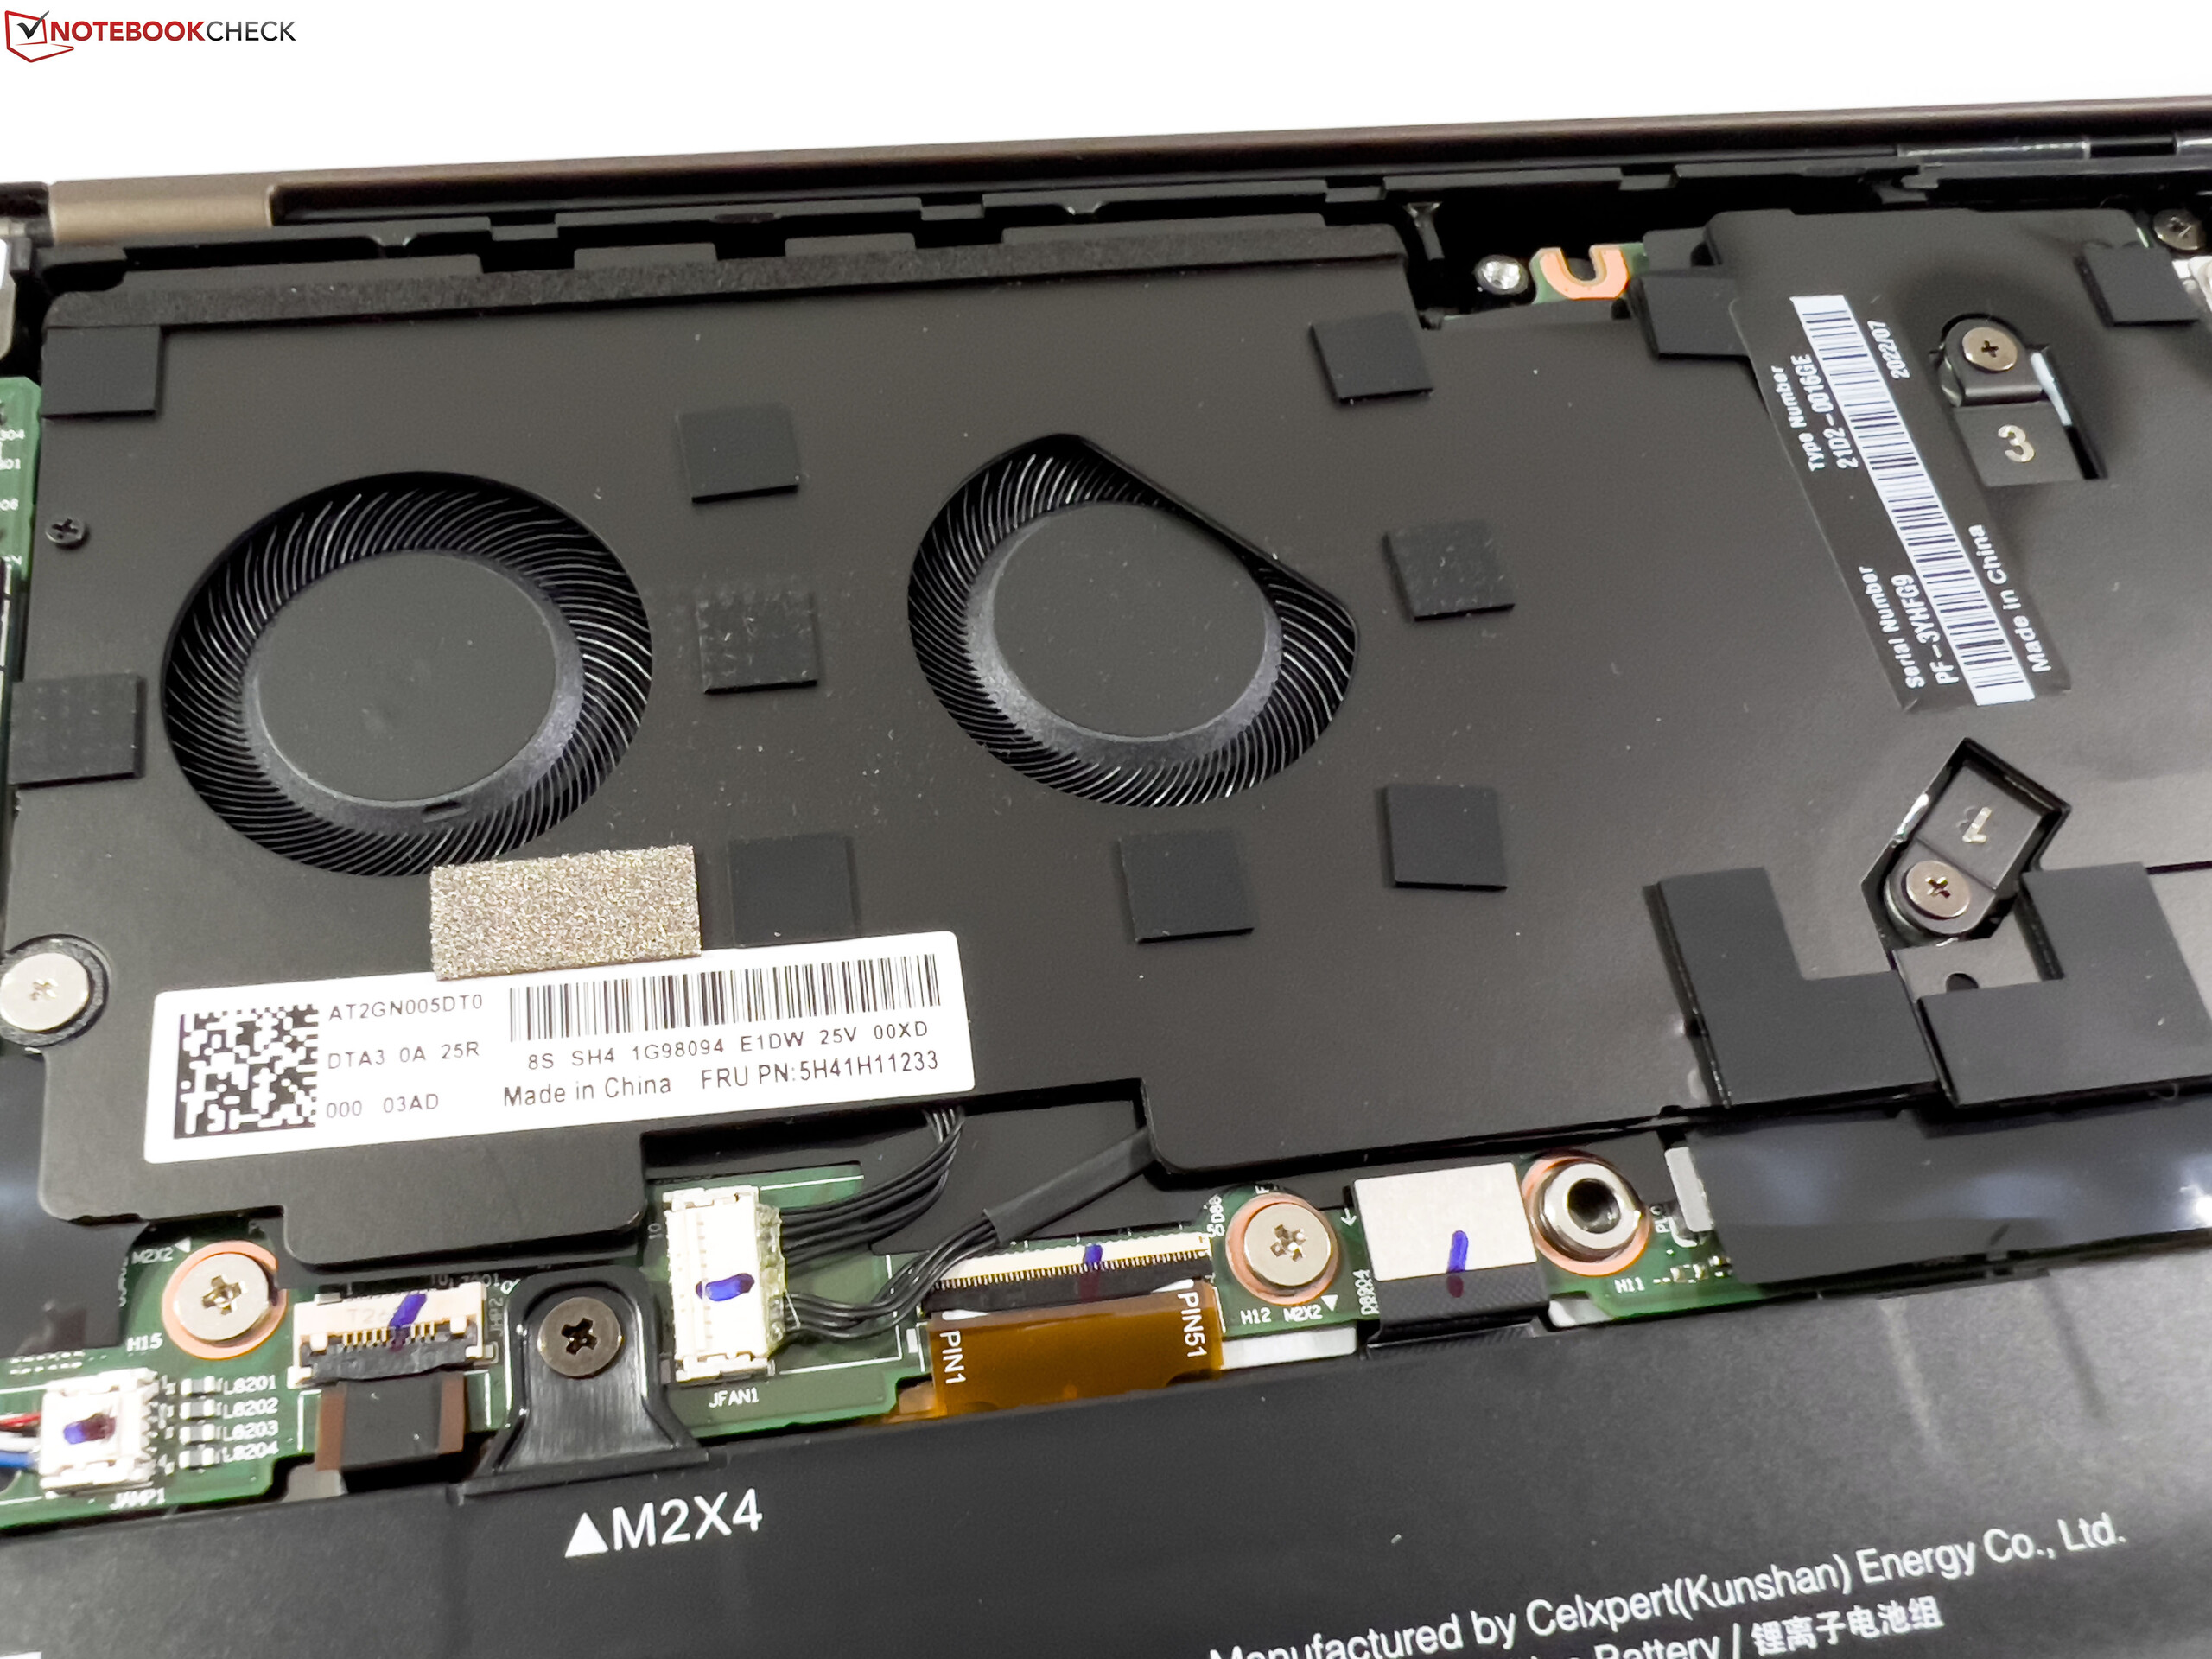
Il ThinkPad Z13 si raffredda con due piccole ventole. Queste sono normalmente inattive e per attività molto leggere sono generalmente silenziose. Tuttavia, a volte le ventole si attivano anche durante la navigazione. A causa degli elevati valori di TDP, le ventole raggiungono quasi subito la velocità massima sotto carico, che corrisponde a circa 41 dB(A). Il rumore è chiaramente udibile, ma non ci sono frequenze fastidiose. Non abbiamo rilevato altri rumori di origine elettronica.
Rumorosità
| Idle |
| 24.3 / 24.3 / 24.3 dB(A) |
| Sotto carico |
| 41 / 41 dB(A) |
 | ||
30 dB silenzioso 40 dB(A) udibile 50 dB(A) rumoroso |
||
min: | ||
| Lenovo ThinkPad Z13 G1-21D20016GE Radeon 680M, R7 PRO 6860Z, Micron 2450 1TB MTFDKCD1T0TFK | Asus Zenbook S 13 OLED Radeon 680M, R7 6800U, Samsung PM9A1 MZVL21T0HCLR | Dell XPS 13 Plus 9320 i7-1280P OLED Iris Xe G7 96EUs, i7-1280P, WDC PC SN810 512GB | Lenovo ThinkPad Z13 21D2CTO1WW Radeon 660M, R5 PRO 6650U, Lenovo UMIS AM630 RPJTJ512MGE1QDQ | Lenovo ThinkPad T14 G3-21CF004NGE Radeon 680M, R7 PRO 6850U, Kioxia BG5 KBG5AZNV512G | |
|---|---|---|---|---|---|
| Noise | 3% | 5% | 5% | 5% | |
| off /ambiente * (dB) | 24.3 | 24 1% | 23.4 4% | 23.71 2% | 24.2 -0% |
| Idle Minimum * (dB) | 24.3 | 24 1% | 23.4 4% | 23.71 2% | 24.2 -0% |
| Idle Average * (dB) | 24.3 | 24 1% | 23.4 4% | 23.71 2% | 24.2 -0% |
| Idle Maximum * (dB) | 24.3 | 24 1% | 23.4 4% | 23.71 2% | 25.8 -6% |
| Load Average * (dB) | 41 | 33.1 19% | 35 15% | 32.35 21% | 32.2 21% |
| Witcher 3 ultra * (dB) | 41 | 40.2 2% | 41.6 -1% | 38.8 5% | 34.1 17% |
| Load Maximum * (dB) | 41 | 41.7 -2% | 39.9 3% | 39.53 4% | 38.8 5% |
* ... Meglio usare valori piccoli
Temperatura
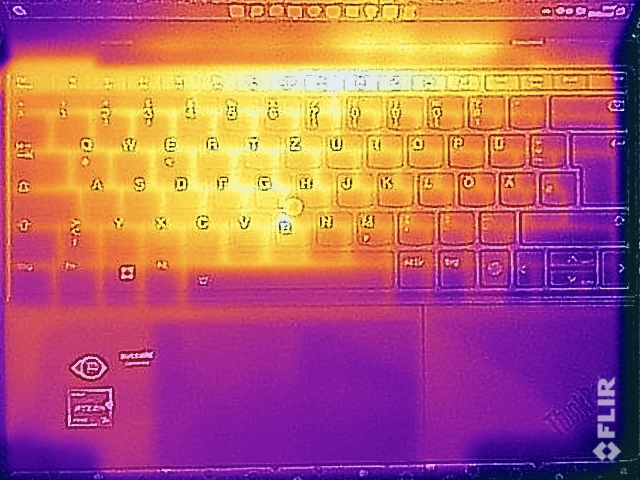
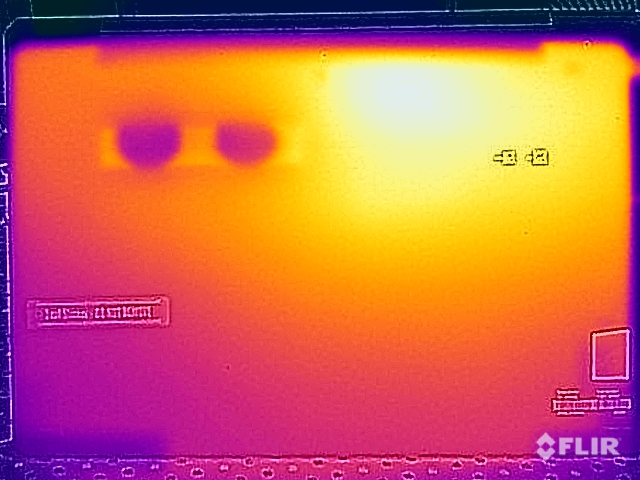
Le temperature superficiali del ThinkPad Z13 sono insignificanti a basso carico, ma sotto carico abbiamo misurato valori più alti rispetto al modello entry-level. Ciò non sorprende, poiché il raffreddamento è identico e anche le ventole lavorano a un livello comparabile, ma il TDP del processore è più alto. Le temperature sulla superficie del coperchio superiore rimangono entro i limiti normali, non superando i 45 °C, e rimangono sicure. Ma abbiamo misurato oltre 50 °C nell'area centrale superiore della superficie inferiore, che a contatto diretto con la pelle può diventare rapidamente fastidiosa.
Mentre il consumo energetico di Ryzen 7 Pro si stabilizza a 27 watt con carico puro della CPU, è di soli 19 watt nello stress test con carico combinato CPU/GPU (nello Z13 con Ryzen 5 Pro era di circa 14 watt). A fronte di questi valori bassi, le temperature di superficie sono già piuttosto elevate. Ci vogliono alcuni minuti prima che la piena potenza sia di nuovo disponibile subito dopo lo stress test.
(-) La temperatura massima sul lato superiore è di 45.6 °C / 114 F, rispetto alla media di 35.9 °C / 97 F, che varia da 21.4 a 59 °C per questa classe Subnotebook.
(-) Il lato inferiore si riscalda fino ad un massimo di 51 °C / 124 F, rispetto alla media di 39.2 °C / 103 F
(+) In idle, la temperatura media del lato superiore è di 25.9 °C / 79 F, rispetto alla media deld ispositivo di 30.8 °C / 87 F.
(-) Riproducendo The Witcher 3, la temperatura media per il lato superiore e' di 38.9 °C / 102 F, rispetto alla media del dispositivo di 30.8 °C / 87 F.
(+) I poggiapolsi e il touchpad raggiungono la temperatura massima della pelle (33 °C / 91.4 F) e quindi non sono caldi.
(-) La temperatura media della zona del palmo della mano di dispositivi simili e'stata di 28.2 °C / 82.8 F (-4.8 °C / -8.6 F).
| Lenovo ThinkPad Z13 G1-21D20016GE AMD Ryzen 7 PRO 6860Z, AMD Radeon 680M | Asus Zenbook S 13 OLED AMD Ryzen 7 6800U, AMD Radeon 680M | Apple MacBook Air M2 10C GPU Apple M2, Apple M2 10-Core GPU | Lenovo ThinkPad Z13 21D2CTO1WW AMD Ryzen 5 PRO 6650U, AMD Radeon 660M | Lenovo ThinkPad T14 G3-21CF004NGE AMD Ryzen 7 PRO 6850U, AMD Radeon 680M | Dell XPS 13 Plus 9320 4K Intel Core i7-1260P, Intel Iris Xe Graphics G7 96EUs | |
|---|---|---|---|---|---|---|
| Heat | -3% | 8% | -4% | 3% | 1% | |
| Maximum Upper Side * (°C) | 45.6 | 47.9 -5% | 44.7 2% | 44.9 2% | 48.2 -6% | 41.1 10% |
| Maximum Bottom * (°C) | 51 | 56.1 -10% | 44.6 13% | 44.3 13% | 52.8 -4% | 48.8 4% |
| Idle Upper Side * (°C) | 27 | 26.8 1% | 25.1 7% | 31.4 -16% | 24.4 10% | 28 -4% |
| Idle Bottom * (°C) | 27.9 | 27.3 2% | 25.3 9% | 31.5 -13% | 24.5 12% | 29.3 -5% |
* ... Meglio usare valori piccoli
Altoparlanti
Lenovo ThinkPad Z13 G1-21D20016GE analisi audio
(±) | potenza degli altiparlanti media ma buona (77.6 dB)
Bassi 100 - 315 Hz
(-) | quasi nessun basso - in media 15.4% inferiori alla media
(±) | la linearità dei bassi è media (9.5% delta rispetto alla precedente frequenza)
Medi 400 - 2000 Hz
(+) | medi bilanciati - solo only 3.2% rispetto alla media
(+) | medi lineari (5.1% delta rispetto alla precedente frequenza)
Alti 2 - 16 kHz
(+) | Alti bilanciati - appena 3.1% dalla media
(+) | alti lineari (3.8% delta rispetto alla precedente frequenza)
Nel complesso 100 - 16.000 Hz
(+) | suono nel complesso lineare (14.7% differenza dalla media)
Rispetto alla stessa classe
» 31% di tutti i dispositivi testati in questa classe è stato migliore, 5% simile, 64% peggiore
» Il migliore ha avuto un delta di 5%, medio di 18%, peggiore di 53%
Rispetto a tutti i dispositivi testati
» 19% di tutti i dispositivi testati in questa classe è stato migliore, 4% similare, 77% peggiore
» Il migliore ha avuto un delta di 4%, medio di 23%, peggiore di 134%
Apple MacBook Air M2 10C GPU analisi audio
(+) | gli altoparlanti sono relativamente potenti (82.7 dB)
Bassi 100 - 315 Hz
(±) | bassi ridotti - in media 12.2% inferiori alla media
(±) | la linearità dei bassi è media (12.6% delta rispetto alla precedente frequenza)
Medi 400 - 2000 Hz
(+) | medi bilanciati - solo only 1.1% rispetto alla media
(+) | medi lineari (3.1% delta rispetto alla precedente frequenza)
Alti 2 - 16 kHz
(+) | Alti bilanciati - appena 2.4% dalla media
(+) | alti lineari (1.9% delta rispetto alla precedente frequenza)
Nel complesso 100 - 16.000 Hz
(+) | suono nel complesso lineare (9.5% differenza dalla media)
Rispetto alla stessa classe
» 5% di tutti i dispositivi testati in questa classe è stato migliore, 2% simile, 93% peggiore
» Il migliore ha avuto un delta di 5%, medio di 18%, peggiore di 53%
Rispetto a tutti i dispositivi testati
» 4% di tutti i dispositivi testati in questa classe è stato migliore, 1% similare, 95% peggiore
» Il migliore ha avuto un delta di 4%, medio di 23%, peggiore di 134%
Consumo di energia
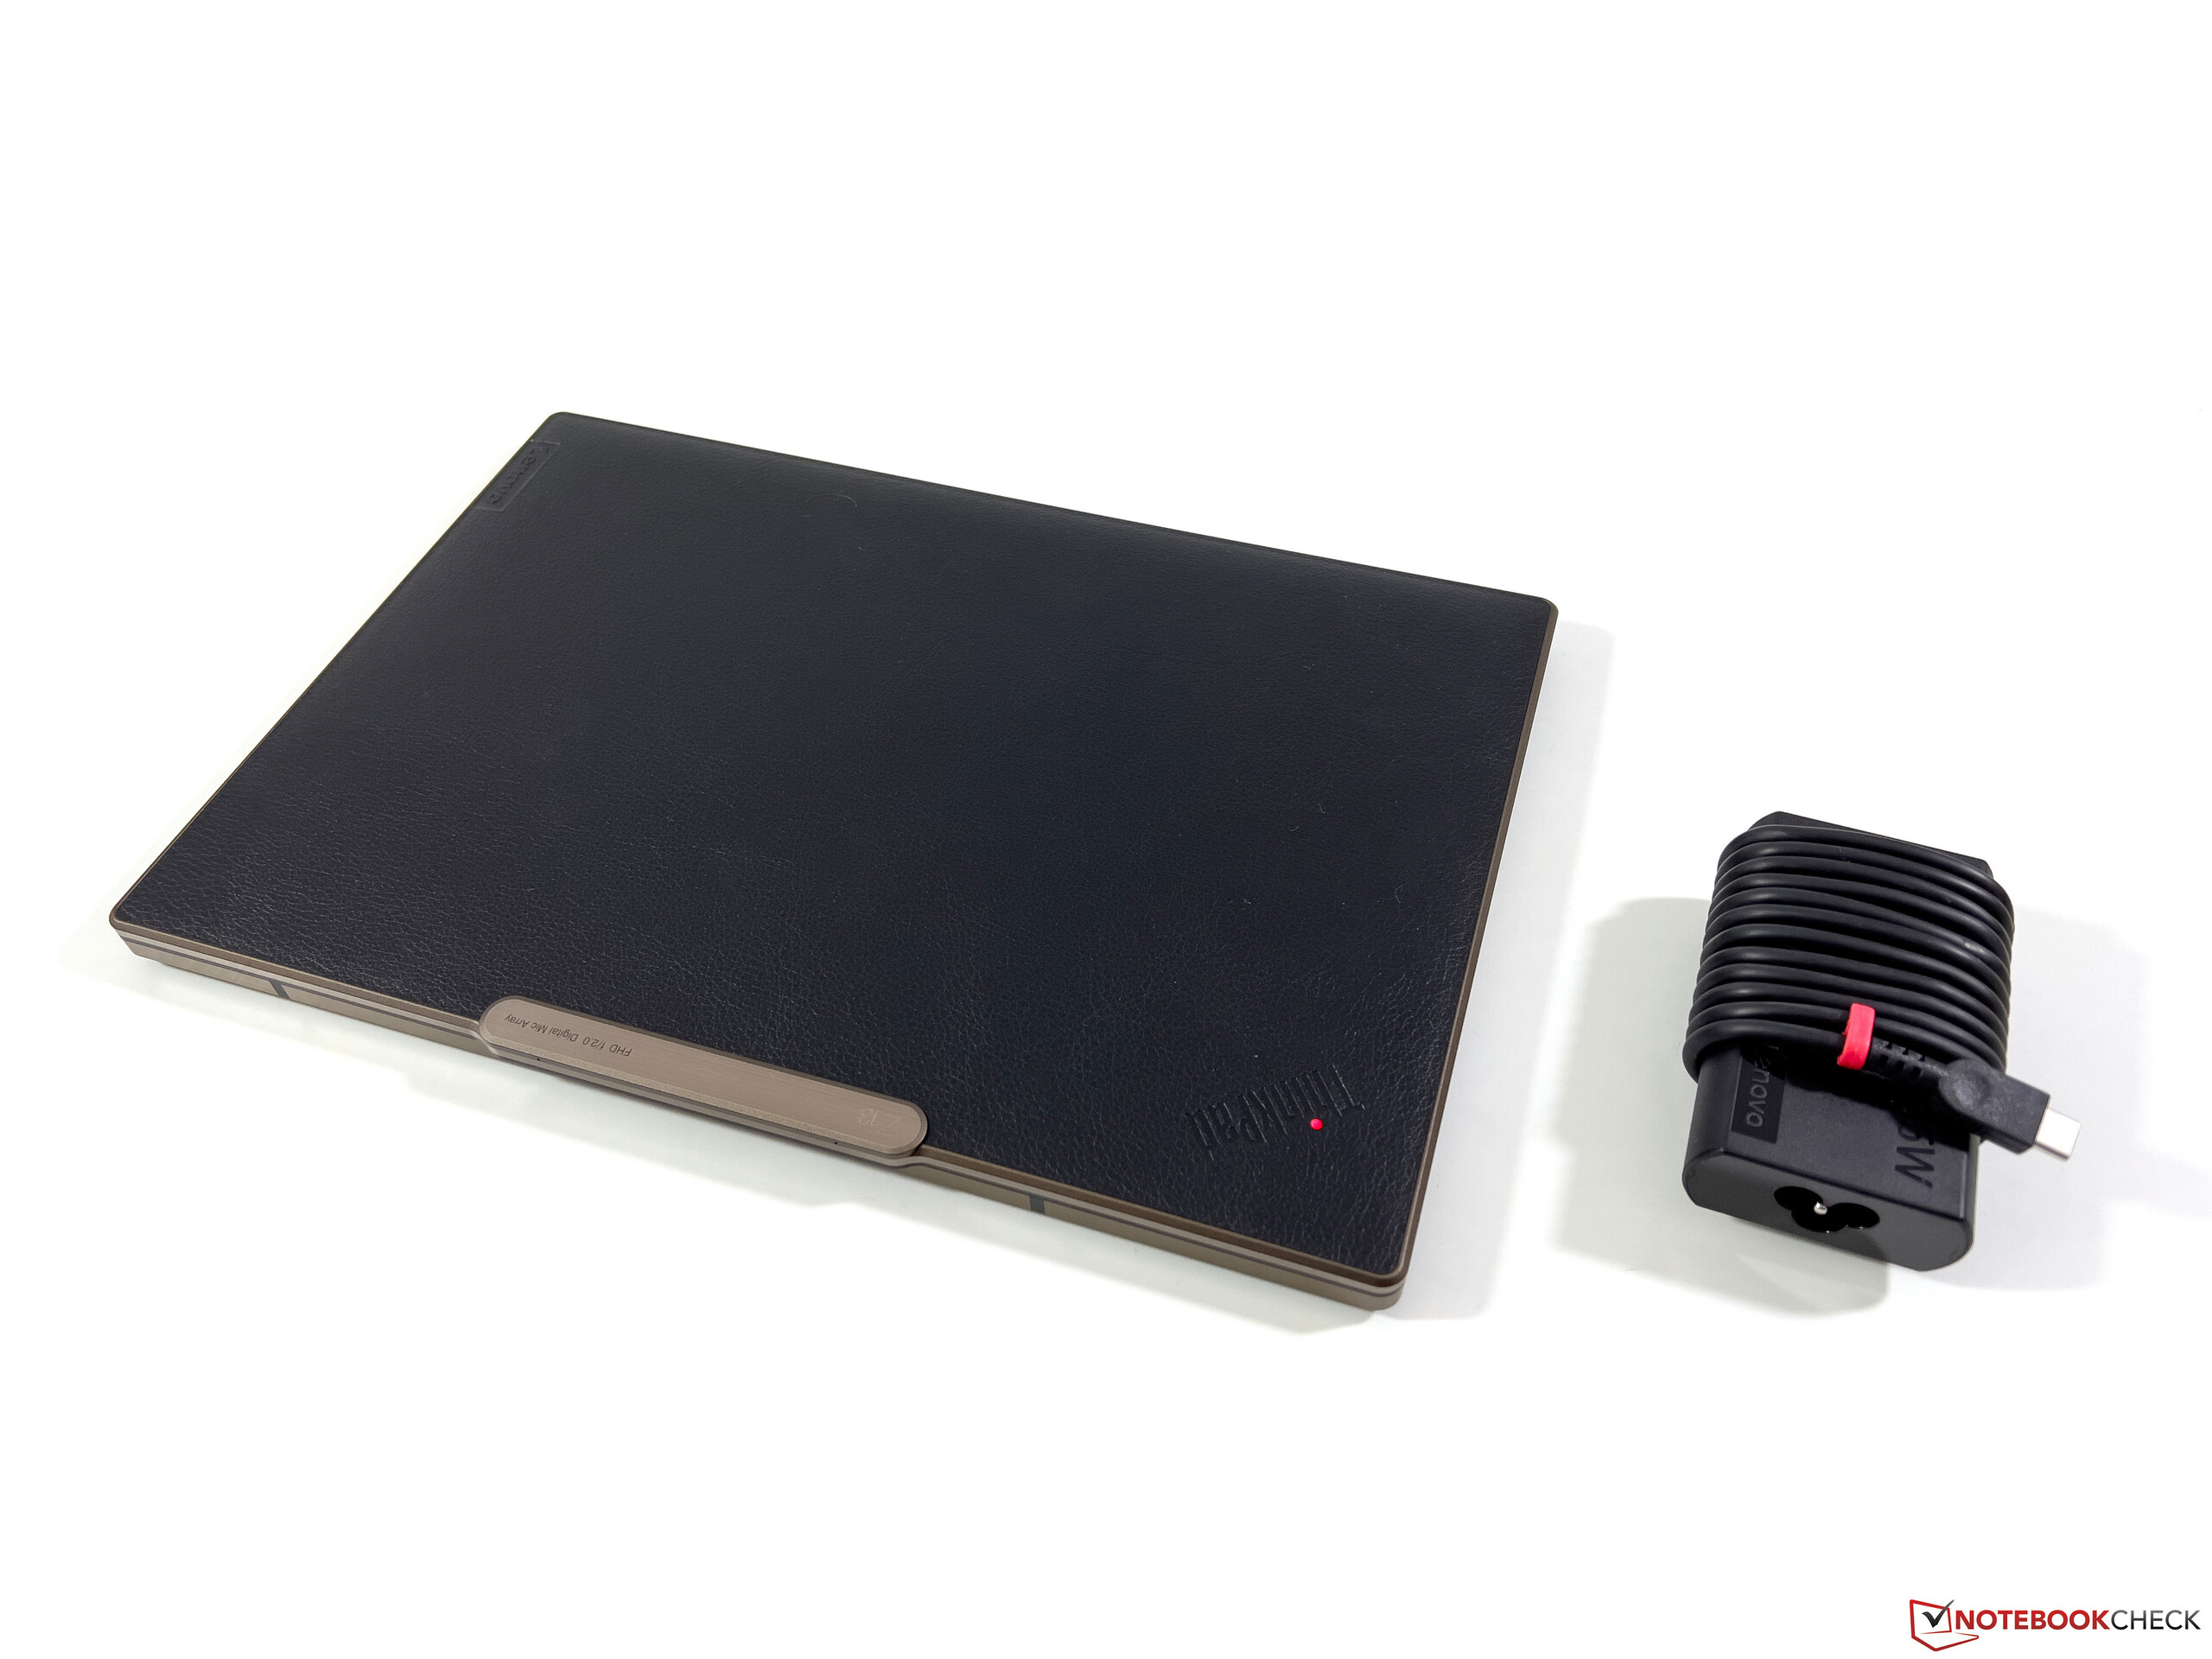
Nelle misurazioni del consumo energetico, l'impatto dello schermo OLED si nota chiaramente. Anche con l'immagine di sfondo piuttosto scura, abbiamo misurato un massimo di 8,4 watt quando è inattivo, ma con un'immagine luminosa era di 11-12 watt. Sotto carico, il consumo massimo è di circa 63 watt, anche se il valore scende rapidamente a circa 46 watt sotto carico continuo per poi stabilizzarsi a circa 30 watt. L'alimentatore da 65 watt in dotazione è quindi del tutto adeguato.
| Off / Standby | |
| Idle | |
| Sotto carico |
|
Leggenda:
min: | |
Power Consumption Witcher 3 / Stresstest
Power Consumption external Monitor
Durata della batteria
Lo schermo OLED riduce notevolmente la durata della batteria e il nostro test WLAN, che include un gran numero di siti web, evoca lo scenario peggiore per i pannelli OLED. La durata della batteria è significativamente peggiore rispetto al modello entry-level dello Z13 con il pannello IPSche ha superato le 10 ore anche con la massima luminosità. Il modello OLED, invece, raggiunge solo 7,5 ore a 150 cd/m² e meno di 6 ore alla massima luminosità SDR e quindi anche un'autonomia significativamente inferiore rispetto allo Zenbook S 13 con la batteria più grande da 67 Wh.
La ricarica completa richiede poco più di due ore quando il dispositivo è acceso; l'80% della capacità è nuovamente disponibile dopo circa 64 minuti.
Pro
Contro
Verdetto - Il ThinkPad Z13 pone alcuni interrogativi
Dopo aver testato la versione di fascia alta del ThinkPad Z13, ci chiediamo se sia ancora un portatile business, se sia davvero ancora un ThinkPad. Nella configurazione con schermo OLED e coperchio in similpelle, è di fatto un concorrente ideale per il modello consumer Asus Zenbook S 13. Inoltre, si deve rinunciare ad alcune caratteristiche tipiche dei ThinkPad. Queste includono un angolo di apertura limitato del display, l'omissione dello slot per il Kensington Lock e anche un layout dei pulsanti modificato che non include i pulsanti dedicati per Page Up e Page Off. Il problema più grande per gli utenti di lunga data del ThinkPad, tuttavia, è l'eliminazione dei tasti TrackPoint dedicati. Possiamo solo sperare che Lenovo non adotti questa soluzione per altre serie di modelli.
Il notebook si dimostra convincente per l'uso quotidiano grazie alla sua struttura di alta qualità, all'ottima tastiera e al touchpad in vetro e alle eccellenti prestazioni del sistema. Tuttavia, bisogna chiedersi seriamente perché il Ryzen 7 Pro 6860Z esista come processore, dal momento che si tratta di un normale 6850U. Inoltre, se da un lato il limite di potenza elevato garantisce buoni risultati nei benchmark, dall'altro comporta una maggiore attività della ventola e incongruenze nelle prestazioni. Soprattutto, le prestazioni grafiche tendono a essere un po' irregolari in condizioni di carico permanente, cosa che altri dispositivi come il ThinkPad T14 G3 o l'Asus Zenbook S 13 non subiscono. Lo schermo OLED, con un rapporto di contrasto estremamente elevato, offre fondamentalmente un'ottima qualità dell'immagine, ma si nota un leggero effetto griglia nelle aree luminose. Lo schermo OLED è caratterizzato da uno sfarfallio PWM e consuma molto la batteria
Grazie al pannello OLED e all'uso di finta pelle, il ThinkPad Z13 di fascia alta sembra più un oggetto di moda che un portatile aziendale. Nel complesso, è un ottimo subnotebook, ma non necessariamente un ottimo notebook aziendale.
Per un uso produttivo, il ThinkPad Z13 con un normale pannello IPS è la scelta migliore, in quanto consente un'autonomia della batteria significativamente più lunga. Se avete usato e apprezzato il TrackPoint come utenti ThinkPad, dovreste provare il nuovo Z13 prima di acquistarlo, poiché l'omissione dei tasti TrackPoint dedicati sarebbe un motivo per non acquistarlo per molti utenti. D'altra parte, se siete alla ricerca di un subnotebook con pannello OLED e CPU AMD, dovreste dare un'occhiata all'Asus Zenbook S13 Asus Zenbook S13che ha una buona tastiera, prestazioni più stabili e una soluzione software per il fastidioso sfarfallio PWM. È semplicemente il pacchetto migliore in assoluto.
Prezzo e disponibilità
Il ThinkPad Z13 con un AMD Ryzen 7 Pro 6860Z può essere configurato sul sito web di Lenovo con prezzi a partire da circa 2.700 euro (2.700 dollari).
Lenovo ThinkPad Z13 G1-21D20016GE
- 10/28/2022 v7 (old)
Andreas Osthoff
Price comparison

