Recensione della workstation HP ZBook Studio 16 G11: Leggerezza e prestazioni a regola d'arte
Processore aggiornato e grafica RTX Ada.
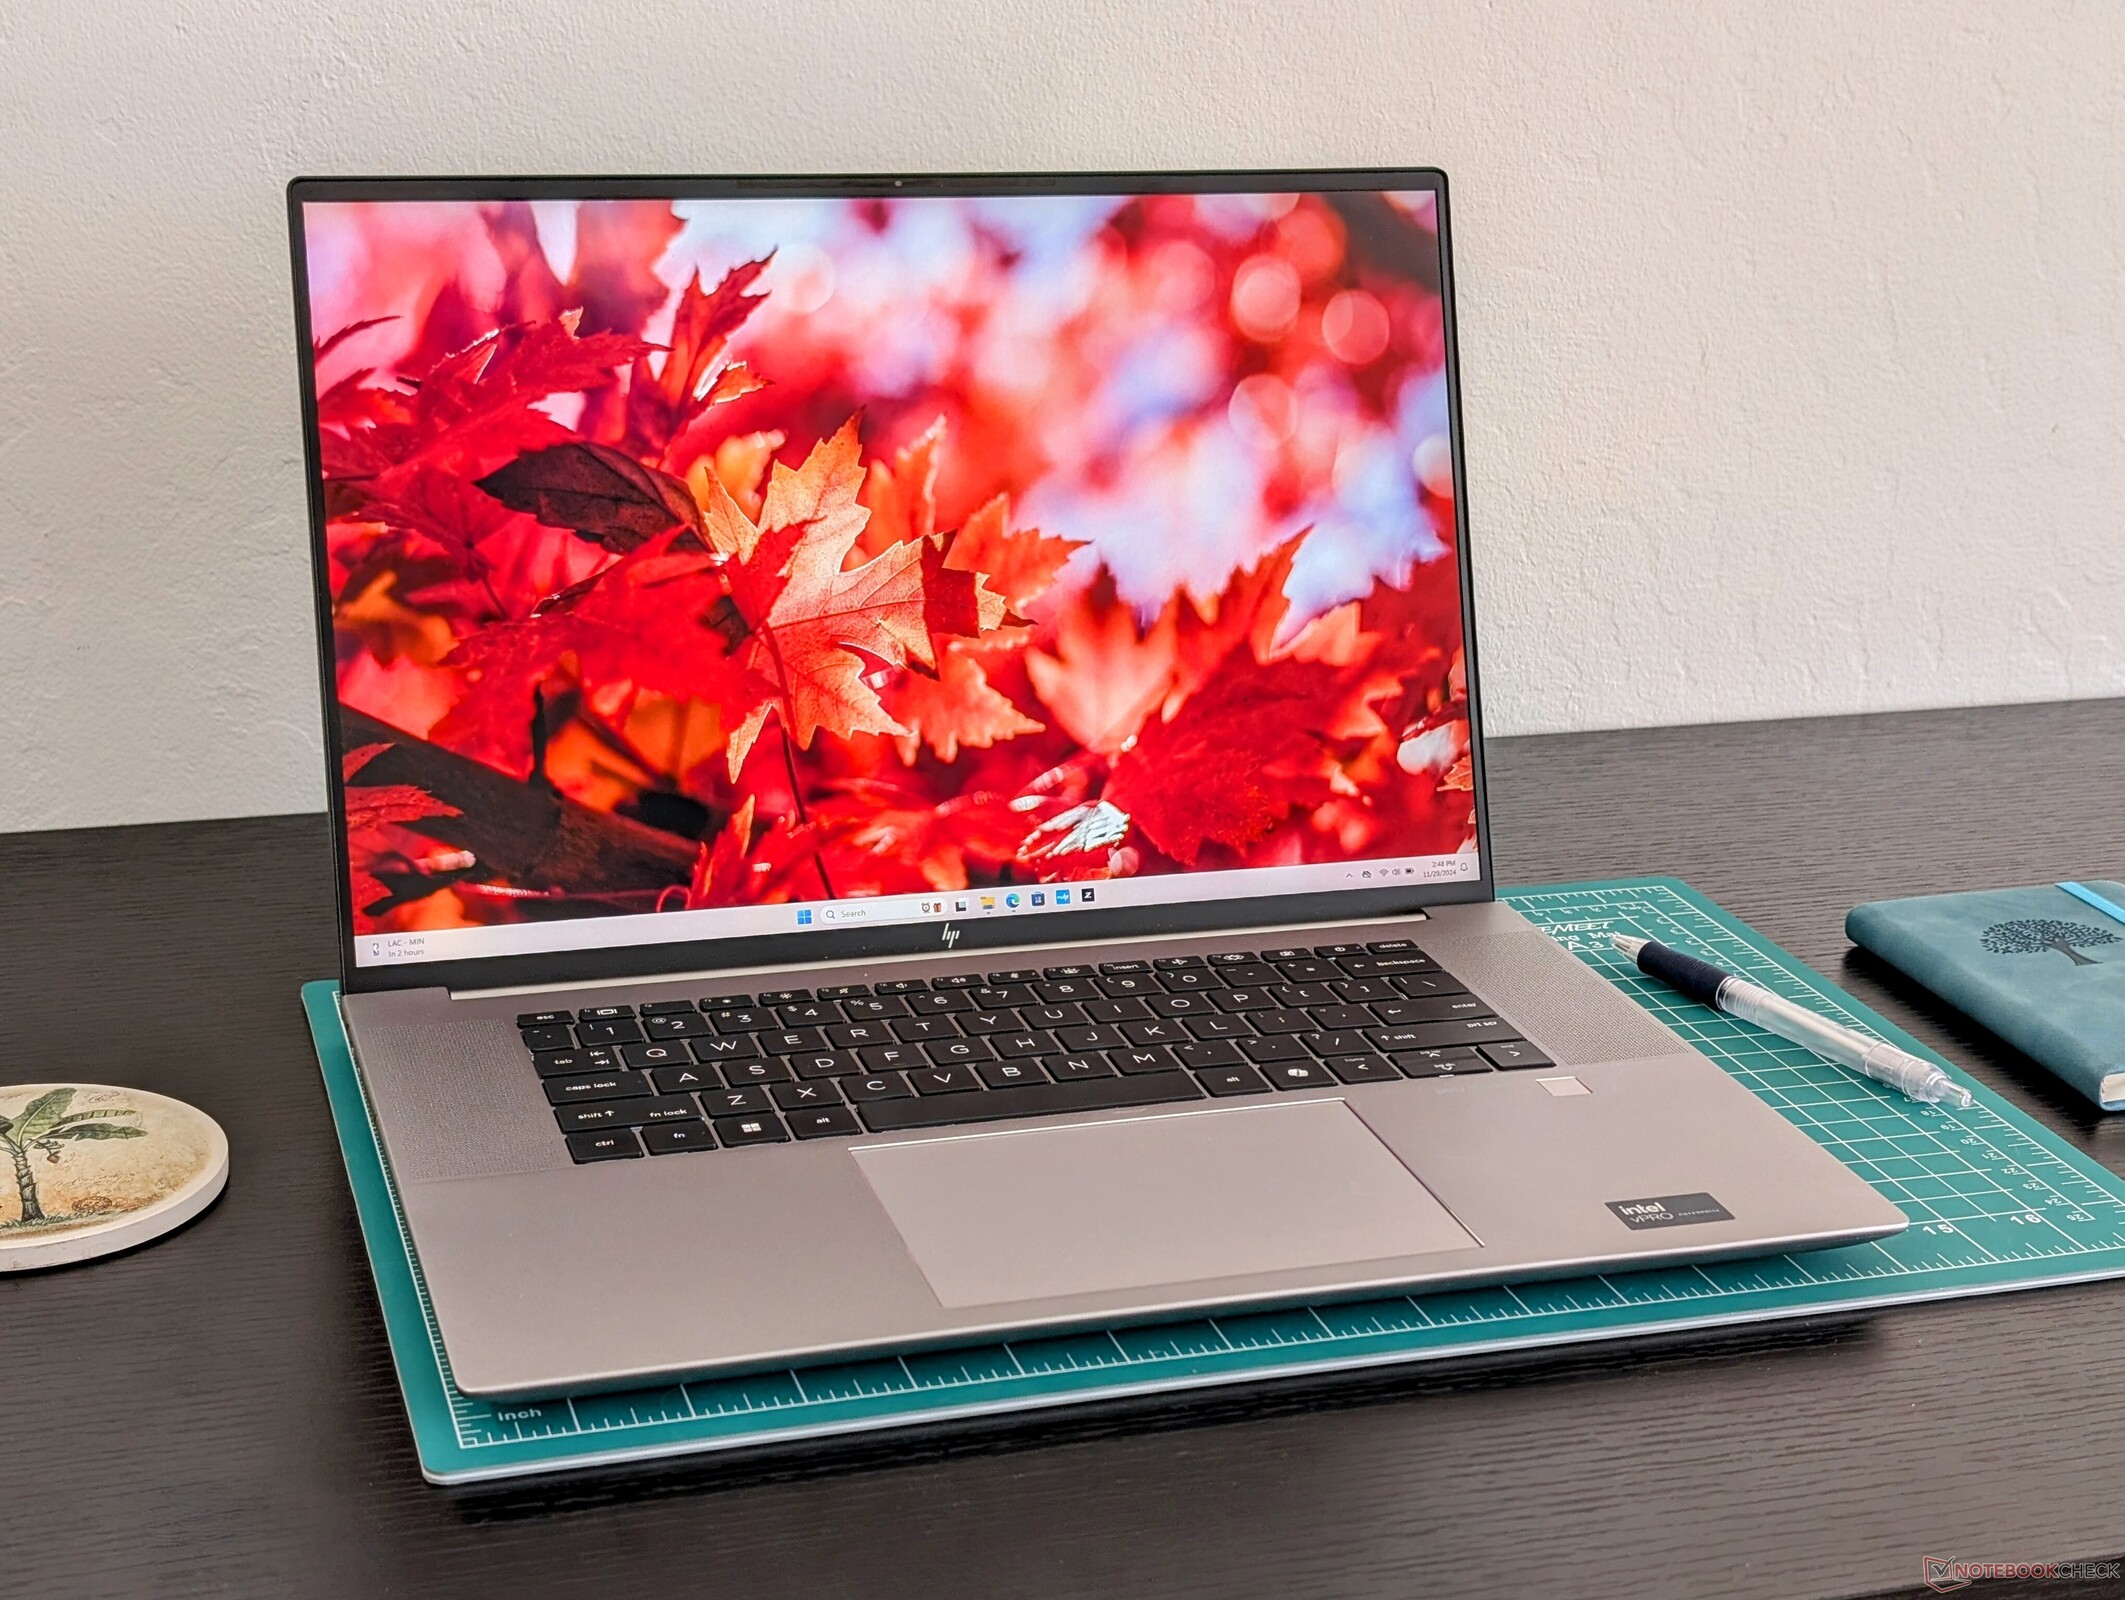
Una delle workstation da 16 pollici più leggere di HP riceve nuove opzioni di processore per prestazioni sensibilmente più veloci rispetto al passato. Per il resto, il design è visivamente identico a quello di ZBook Studio 16 G9 o G10, per un'esperienza utente sostanzialmente identica.Allen Ngo, 👁 Allen Ngo (traduzione a cura di DeepL / Ninh Duy) Pubblicato 🇺🇸 🇫🇷 ...
Verdetto - Più leggero del previsto per una workstation da 16 pollici
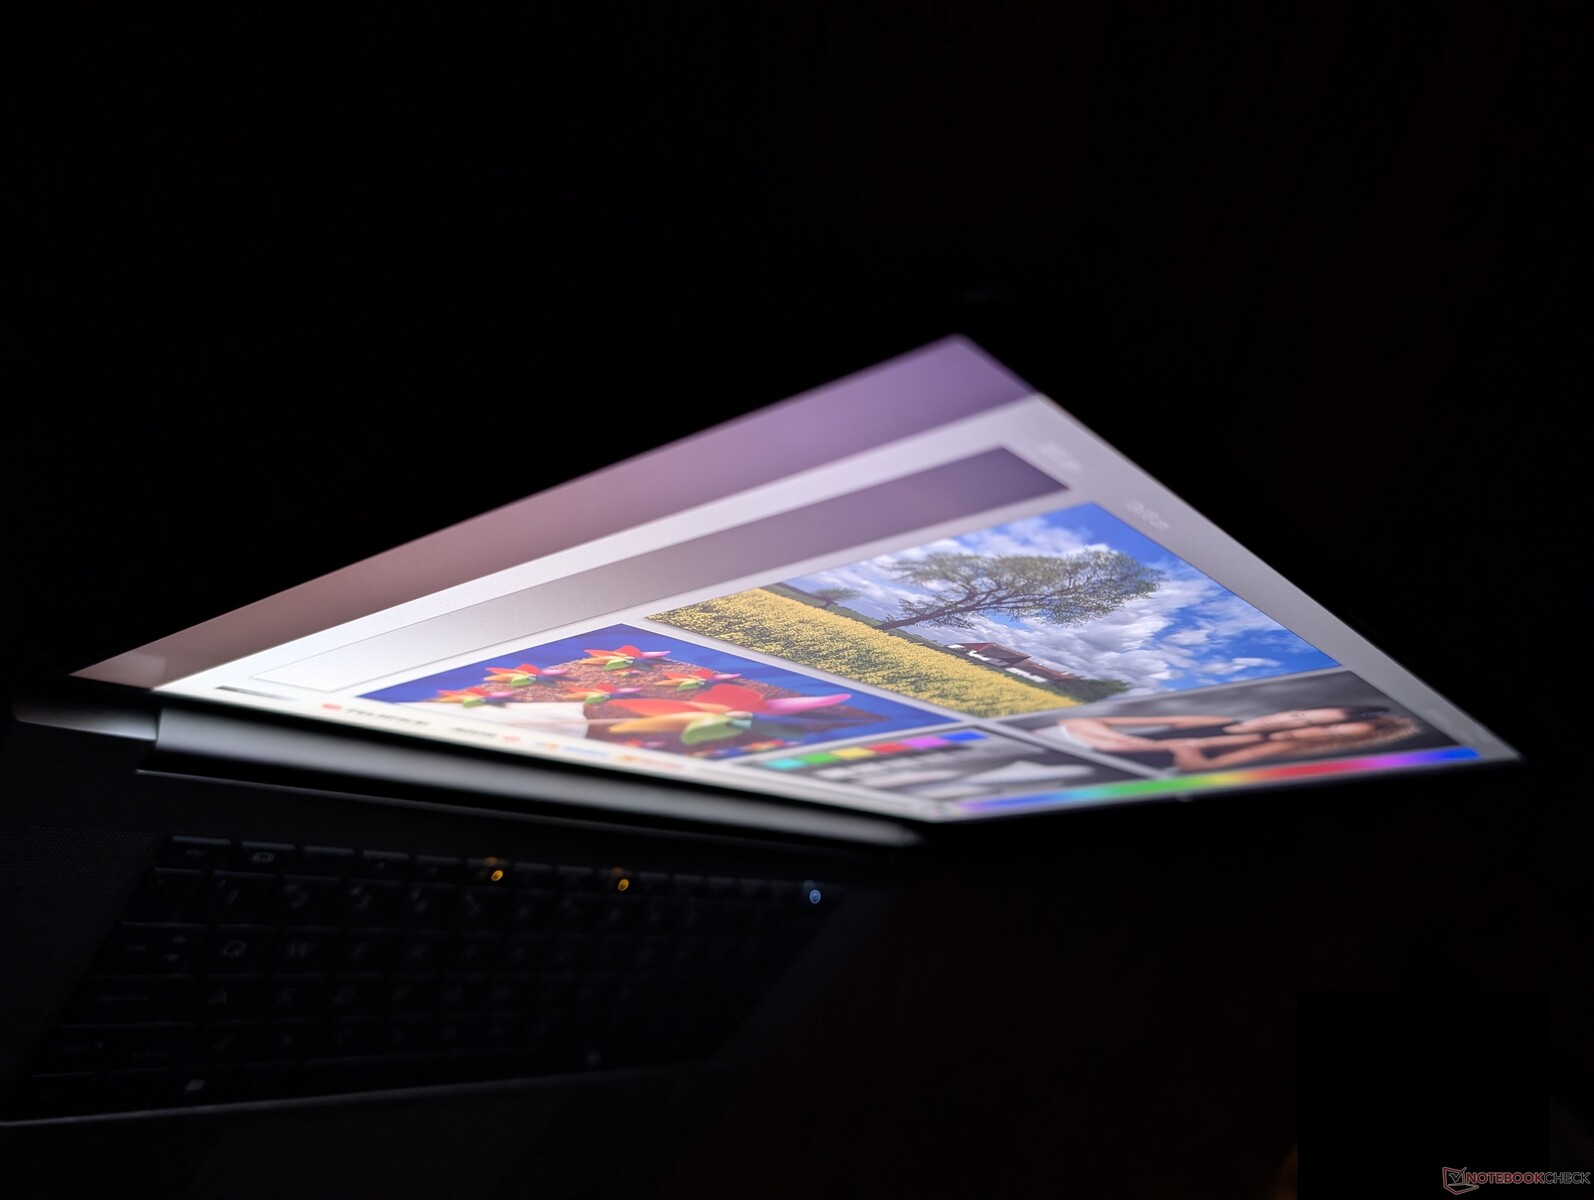
Lo ZBook Studio 16 G11 eccelle per portabilità e qualità costruttiva, nonostante la sottigliezza e l'ampio schermo da 16 pollici. I professionisti che desiderano qualcosa di abbastanza leggero da portare con sé senza sacrificare le dimensioni del display o le prestazioni troveranno molto da apprezzare nello Studio 16 G11, soprattutto ora che le nuove opzioni di GPU sono notevolmente più veloci ed efficienti rispetto a quelle disponibili sul modello G9.
Purtroppo, il sistema soffre ancora di molti degli stessi difetti dei precedenti modelli G10 o G9, dal momento che tutti condividono lo stesso telaio o scheletro. La webcam da 1 MP sfocata e la mancanza dell'otturatore privacy, ad esempio, sono indicativi di un design ormai datato. Altri fattori, come le temperature di funzionamento dei core e la durata della batteria, sono rispettivamente più calde e più brevi di quanto vorremmo, mentre l'aggiornamento della CPU da Alder Lake-H a Meteor Lake-H non è così grande come l'aggiornamento della GPU. Gli utenti che necessitano di una potenza grafica aggiuntiva più veloce della RTX 3000 Ada dovranno guardare ad alternative più spesse come lo ZBook Fury serie 16 che possono essere configurate con opzioni RTX 5000 Ada.
Dobbiamo anche notare che abbiamo riscontrato diversi problemi di congelamento sulla nostra unità di prova. Potrebbe valere la pena di controllare due volte la propria unità al momento dell'acquisto per verificare l'eventuale presenza di un comportamento difettoso.
Pro
Contro
Prezzo e disponibilità
Una SKU minore con Core Ultra 7 e RTX 2000 Ada è disponibile su Amazon a 3200 dollari. Altre SKU sono disponibili direttamente da HP.
Possibili alternative a confronto
Immagine | Modello | Prezzo | Peso | Altezza | Schermo |
|---|---|---|---|---|---|
1. 84.2%  | HP ZBook Studio 16 G11 Intel Core Ultra 9 185H ⎘ NVIDIA RTX 3000 Ada Generation Laptop ⎘ 64 GB Memoria, 1024 GB SSD | Amazon: Prezzo di listino: 4300 USD | 1.8 kg | 19 mm | 16.00" 3840x2400 283 PPI IPS |
2. 90.1% v7 (old)  | HP ZBook Studio 16 G9 62U04EA Intel Core i7-12800H ⎘ NVIDIA RTX A2000 Laptop GPU ⎘ 32 GB Memoria, 1024 GB SSD | Amazon: Prezzo di listino: 3300€ | 1.8 kg | 19 mm | 16.00" 3840x2400 283 PPI IPS |
3. 85.4%  | HP ZBook Power 16 G11 A AMD Ryzen 7 8845HS ⎘ NVIDIA RTX 2000 Ada Generation Laptop ⎘ 64 GB Memoria, 2048 GB SSD | Amazon: Prezzo di listino: 2100 USD | 2.2 kg | 22.9 mm | 16.00" 2560x1600 189 PPI IPS |
4. 85.9%  | Lenovo ThinkPad P16 Gen 2 Intel Core i7-14700HX ⎘ NVIDIA RTX 4000 Ada Generation Laptop ⎘ 32 GB Memoria, 1024 GB SSD | Amazon: Prezzo di listino: 3500 USD | 3.1 kg | 30.23 mm | 16.00" 2560x1600 189 PPI IPS |
5. 88.3% v7 (old)  | Dell Precision 5690 Intel Core Ultra 9 185H ⎘ NVIDIA RTX 5000 Ada Generation Laptop ⎘ 32 GB Memoria, 2048 GB SSD | Amazon: Prezzo di listino: 5900 USD | 2.3 kg | 22.17 mm | 16.00" 3840x2400 283 PPI OLED |
6. 84.3% v7 (old)  | MSI CreatorPro Z16P B12UKST Intel Core i7-12700H ⎘ NVIDIA RTX A3000 Laptop GPU ⎘ 32 GB Memoria, 1024 GB SSD | Amazon: Prezzo di listino: 3500€ | 2.4 kg | 19 mm | 16.00" 2560x1600 189 PPI IPS |
7. 83.5%  | Lenovo ThinkPad P1 Gen 7 21KV001SGE Intel Core Ultra 7 155H ⎘ NVIDIA GeForce RTX 4060 Laptop GPU ⎘ 32 GB Memoria, 1024 GB SSD | Amazon: Prezzo di listino: 3239 Euro | 2 kg | 20.5 mm | 16.00" 2560x1600 189 PPI IPS LED |
L'ultima volta che abbiamo recensito la serie ZBook Studio 16 era il modello Modello G9 nel 2022. Per il 2024, l'ultimo modello è ora il G11, dotato delle opzioni CPU Intel Meteor Lake e GPU Nvidia Ada Lovelace, più veloci, che sostituiscono le opzioni Alder Lake e Ampere delle versioni Studio 16 precedenti.
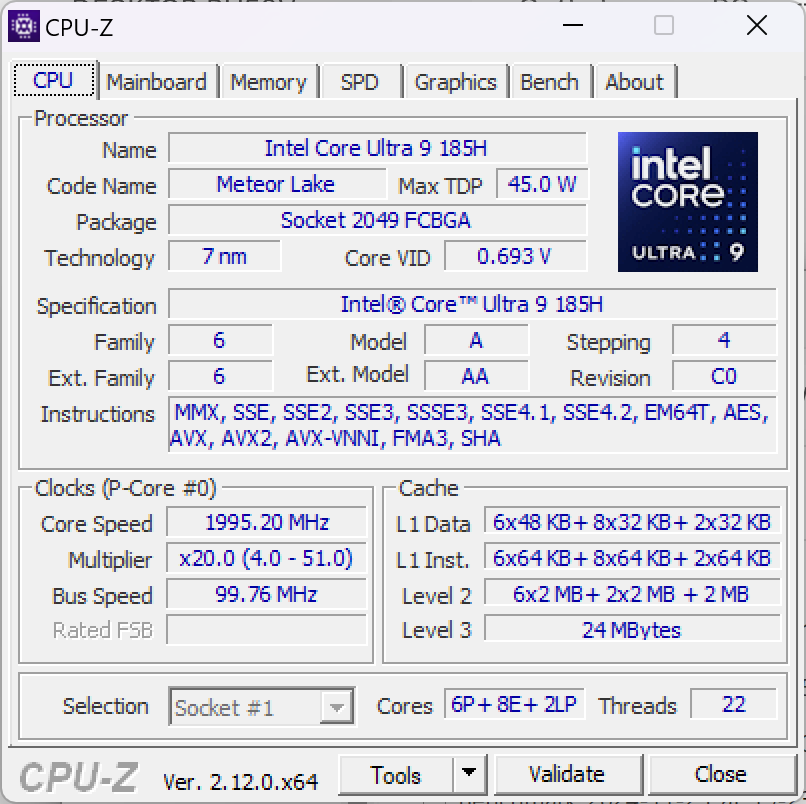
La nostra unità di prova è la configurazione di fascia più alta con CPU Core Ultra 9 185H vPro, GPU RTX 3000 Ada e display IPS 2400p 120 Hz per circa 2.800 dollari. Altre SKU partono dal Core Ultra 7 155H, dalla grafica Arc integrata, da GeForce RTX 4070 o dal display a 1200p, come descritto nella pagina ufficiale del prodotto HP https://www.hp.com/us-en/shop/pdp/hp-zbook-studio-g11-mobile-workstation-pc-customizable-9q574av-mb.
Le alternative allo ZBook Studio 16 G11 includono altre workstation mobili da 16 pollici, come il modello Lenovo ThinkPad P16 Gen 2, Dell Precision 5690o MSI CreatorPro Z16P.
Altre recensioni di HP:
Specifiche
Caso
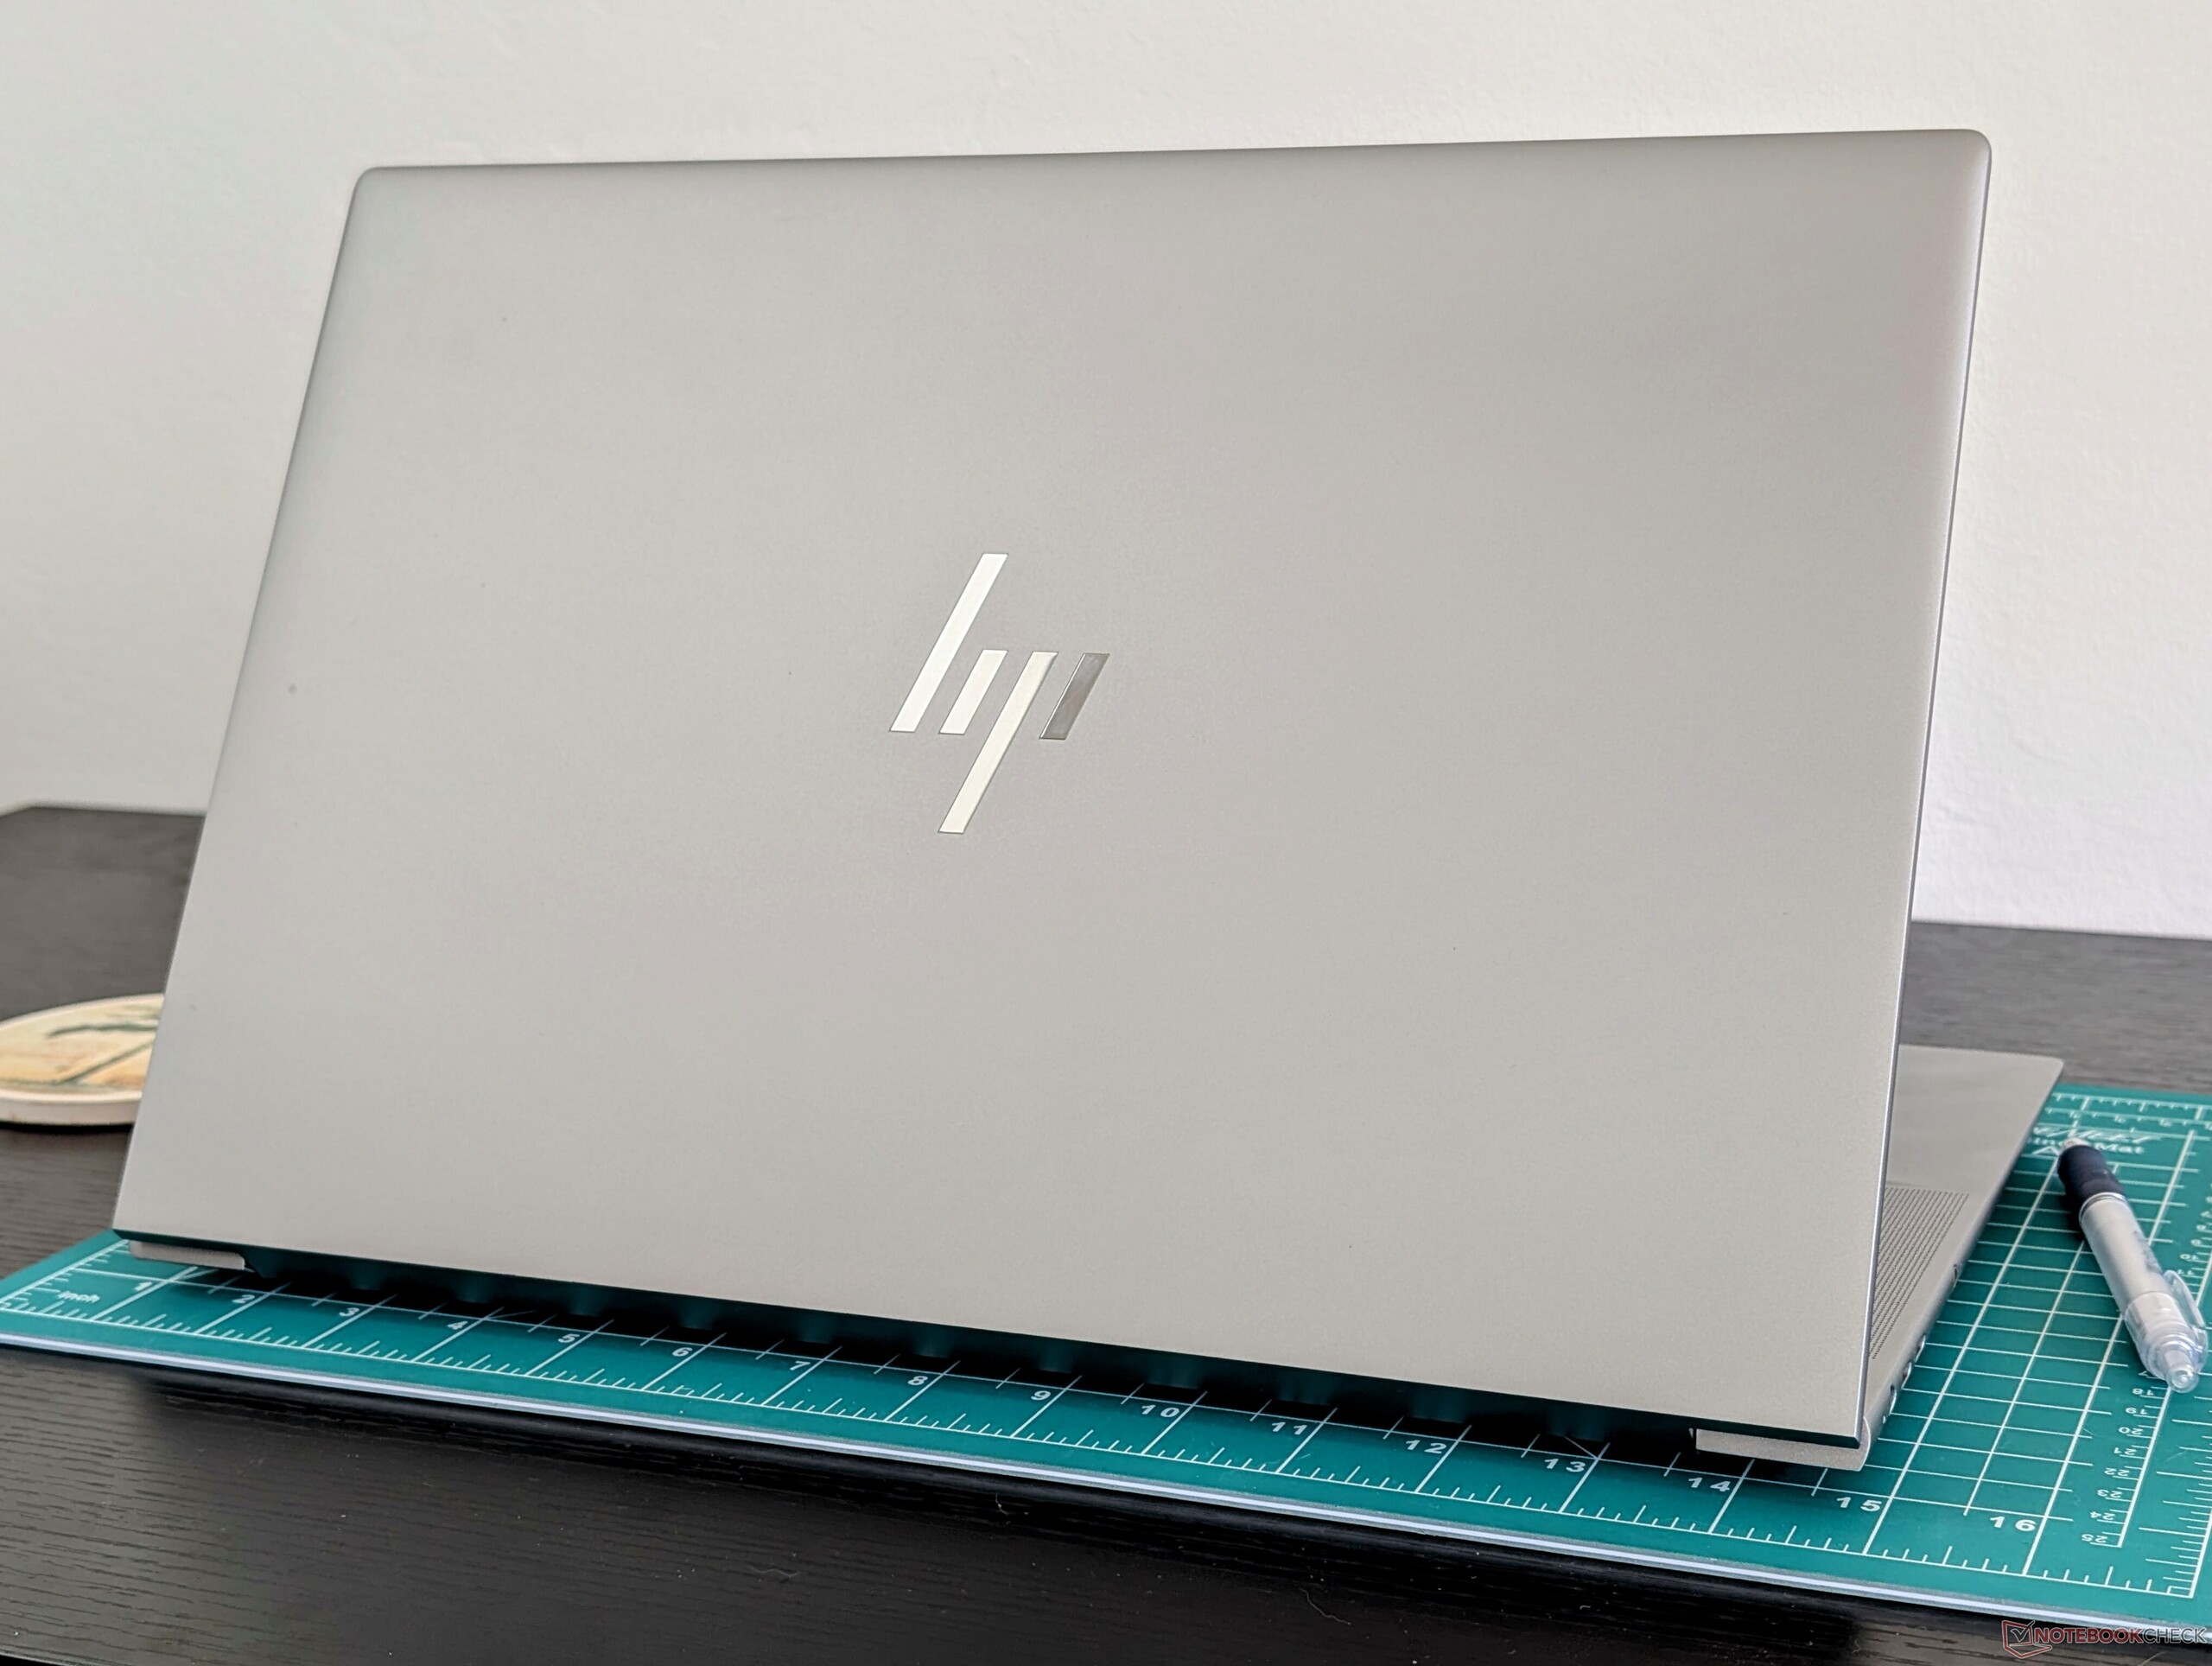
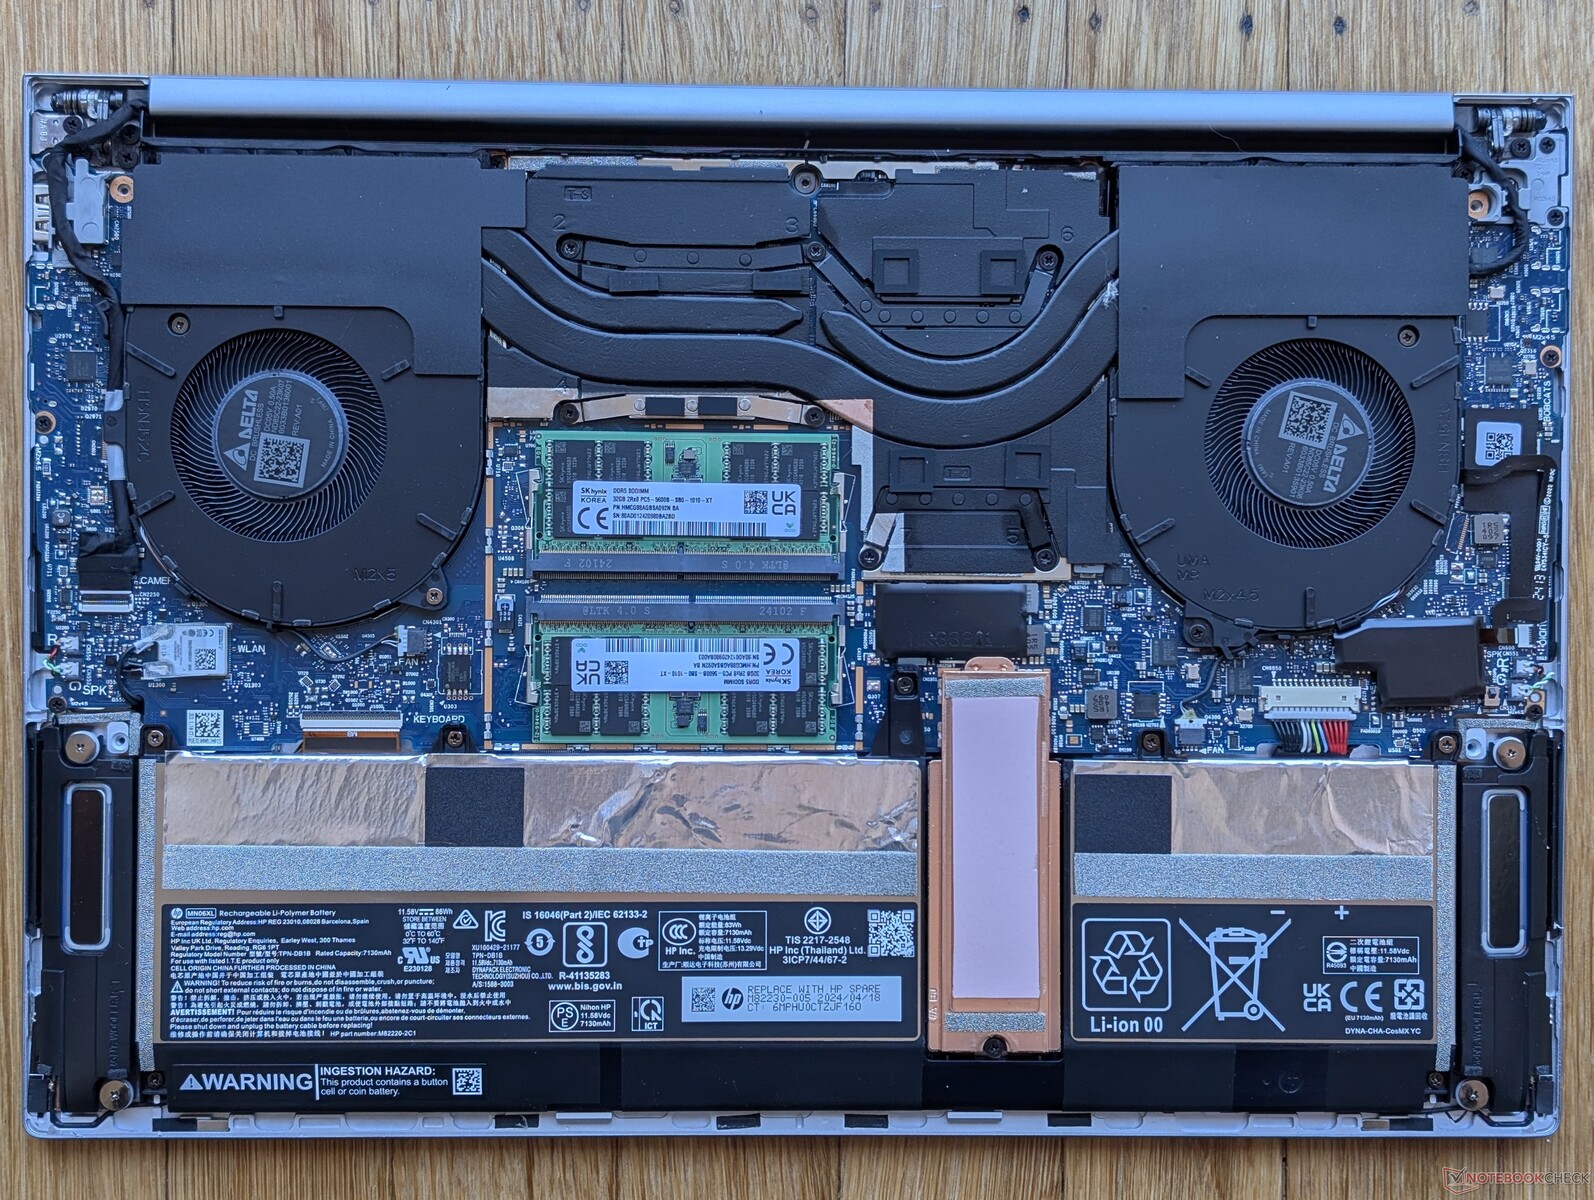
Lo ZBook Studio 16 G11 utilizza lo stesso chassis dello ZBook Studio 16 G9 di due anni fa. Nonostante l'età, si tratta ancora di un design forte, che si distingue soprattutto per la sua sottigliezza e portabilità. Il MSI CreatorPro Z16P o Dell Precision 5690, ad esempio, sono tutti più grandi e notevolmente più pesanti di almeno 400-500 grammi.
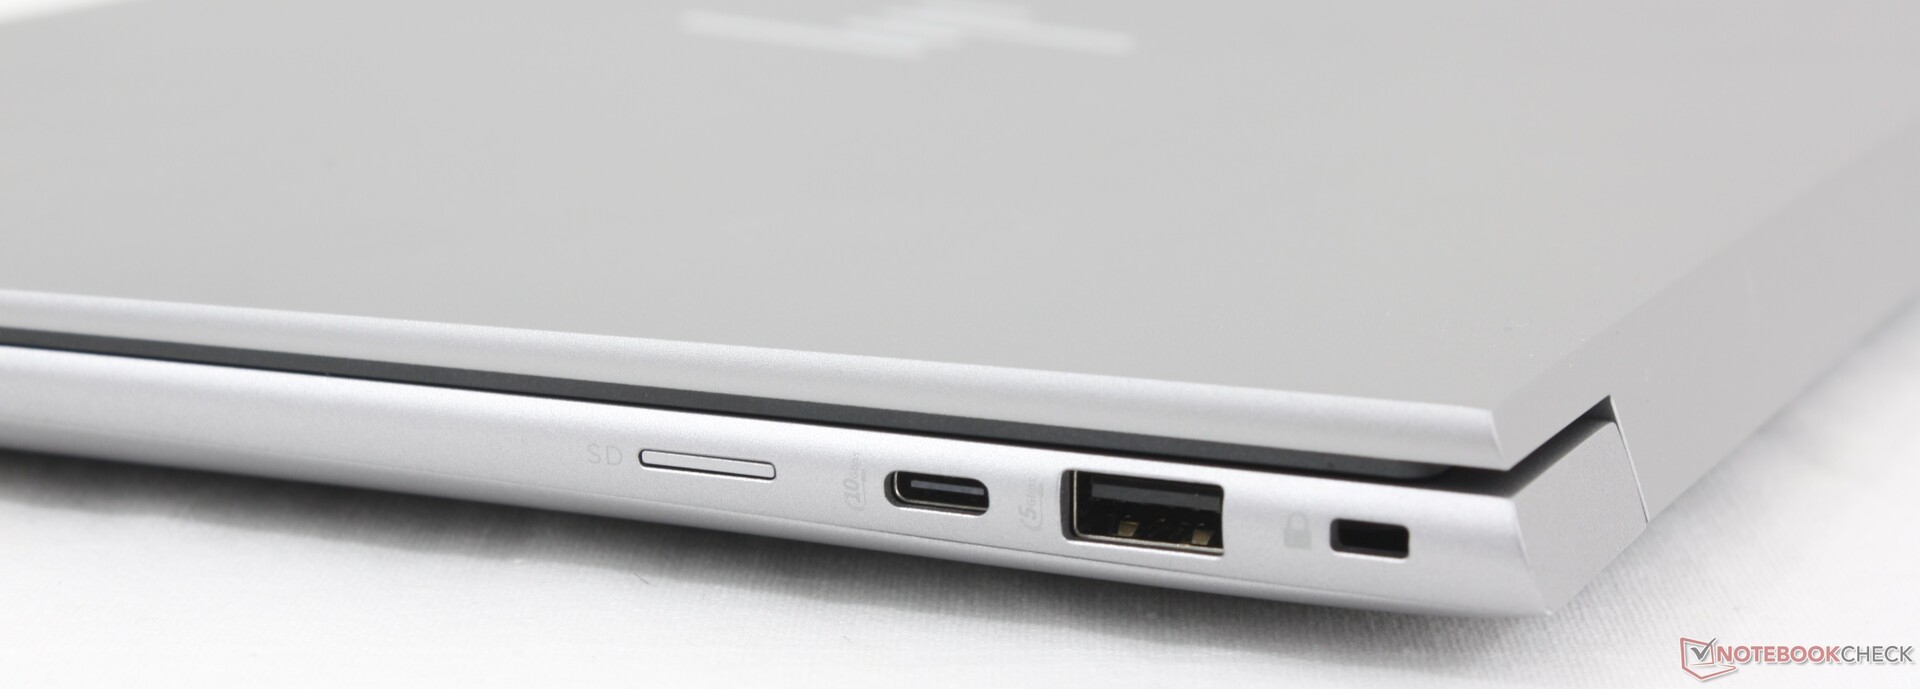
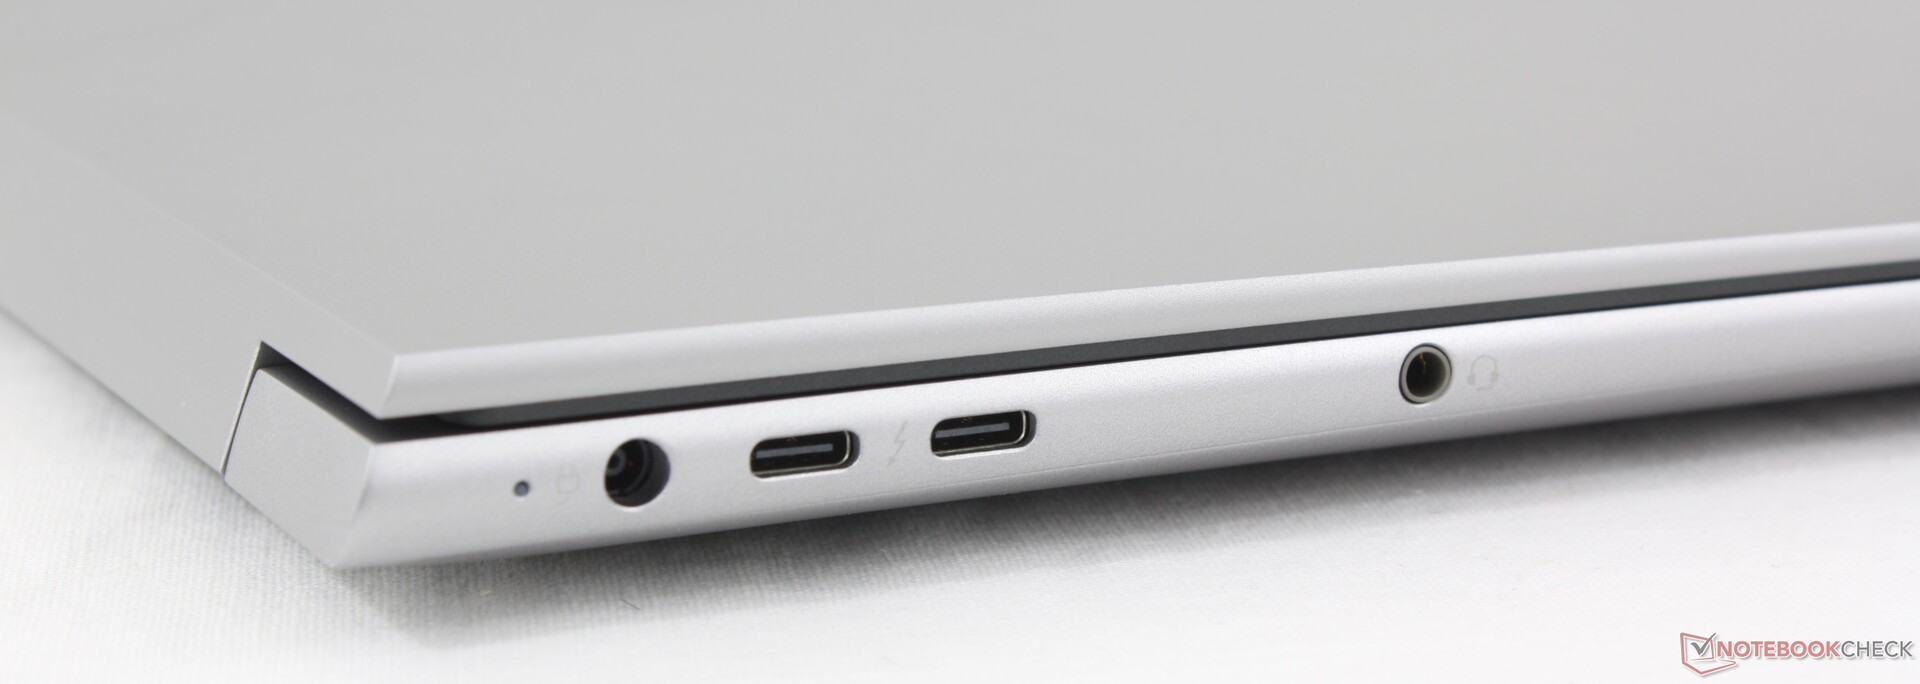
Connettività
Mentre le opzioni delle porte non sono cambiate, il lettore MicroSD integrato nella nostra unità era rotto e quindi non abbiamo potuto testare le prestazioni della velocità di trasferimento.
Comunicazione
Il wireless è stato aggiornato dal MediaTek Wi-Fi 6E MT7922 all'Intel BE200 per supportare sia il Wi-Fi 7 che il Bluetooth 5.4.
Webcam
Purtroppo, la webcam rimane a 720p o a solo 1 MP, mentre la maggior parte degli altri computer portatili ha già abbandonato le opzioni a 1 MP.


Manutenzione
Il pannello inferiore è facilmente rimovibile con un cacciavite Torx. HP fornisce un video ufficiale di assistenza per molti dei suoi modelli, a differenza di altri importanti produttori.
Sostenibilità
HP utilizza plastiche e metalli riciclati per tutti i suoi computer portatili prodotti dal 2022. La proporzione tra materiali riciclati e non riciclati, tuttavia, varia a seconda del modello.
L'imballaggio è costituito principalmente da cartone e carta, con qualche involucro di plastica per il portatile e l'adattatore CA.
Garanzia
Se acquistato negli Stati Uniti, si applica una garanzia limitata di tre anni del produttore.
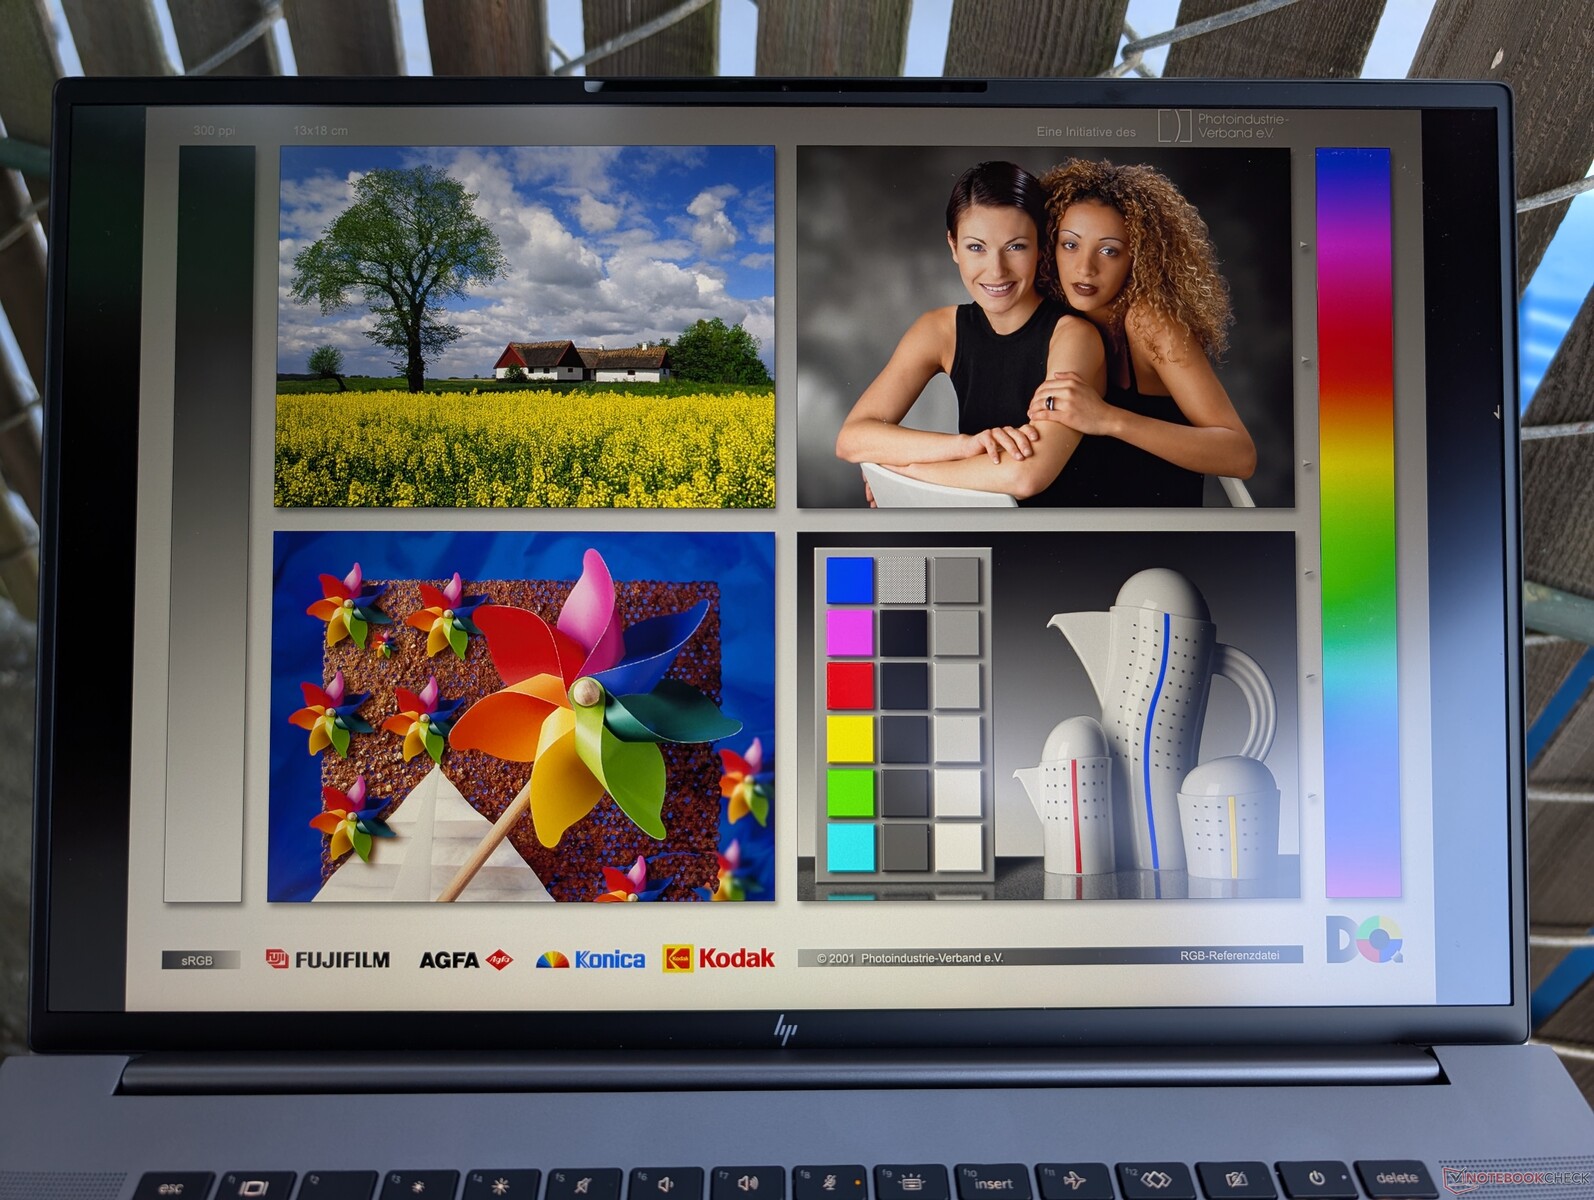
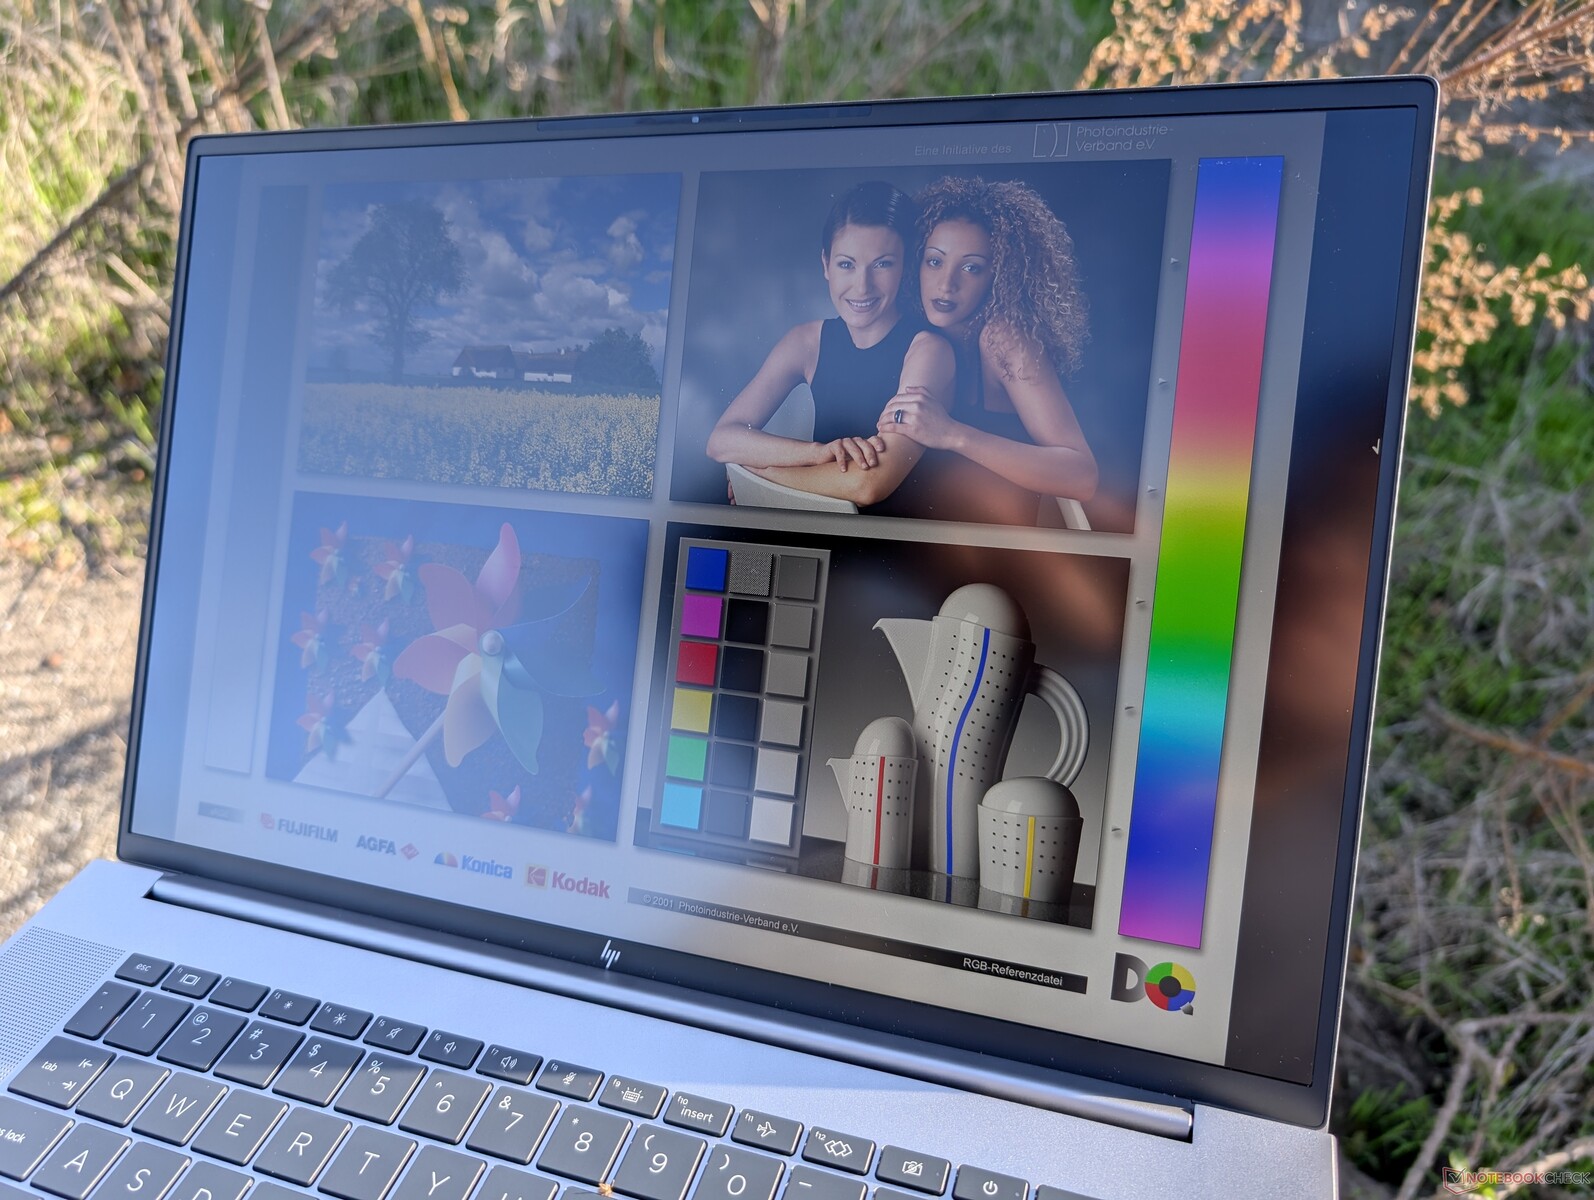
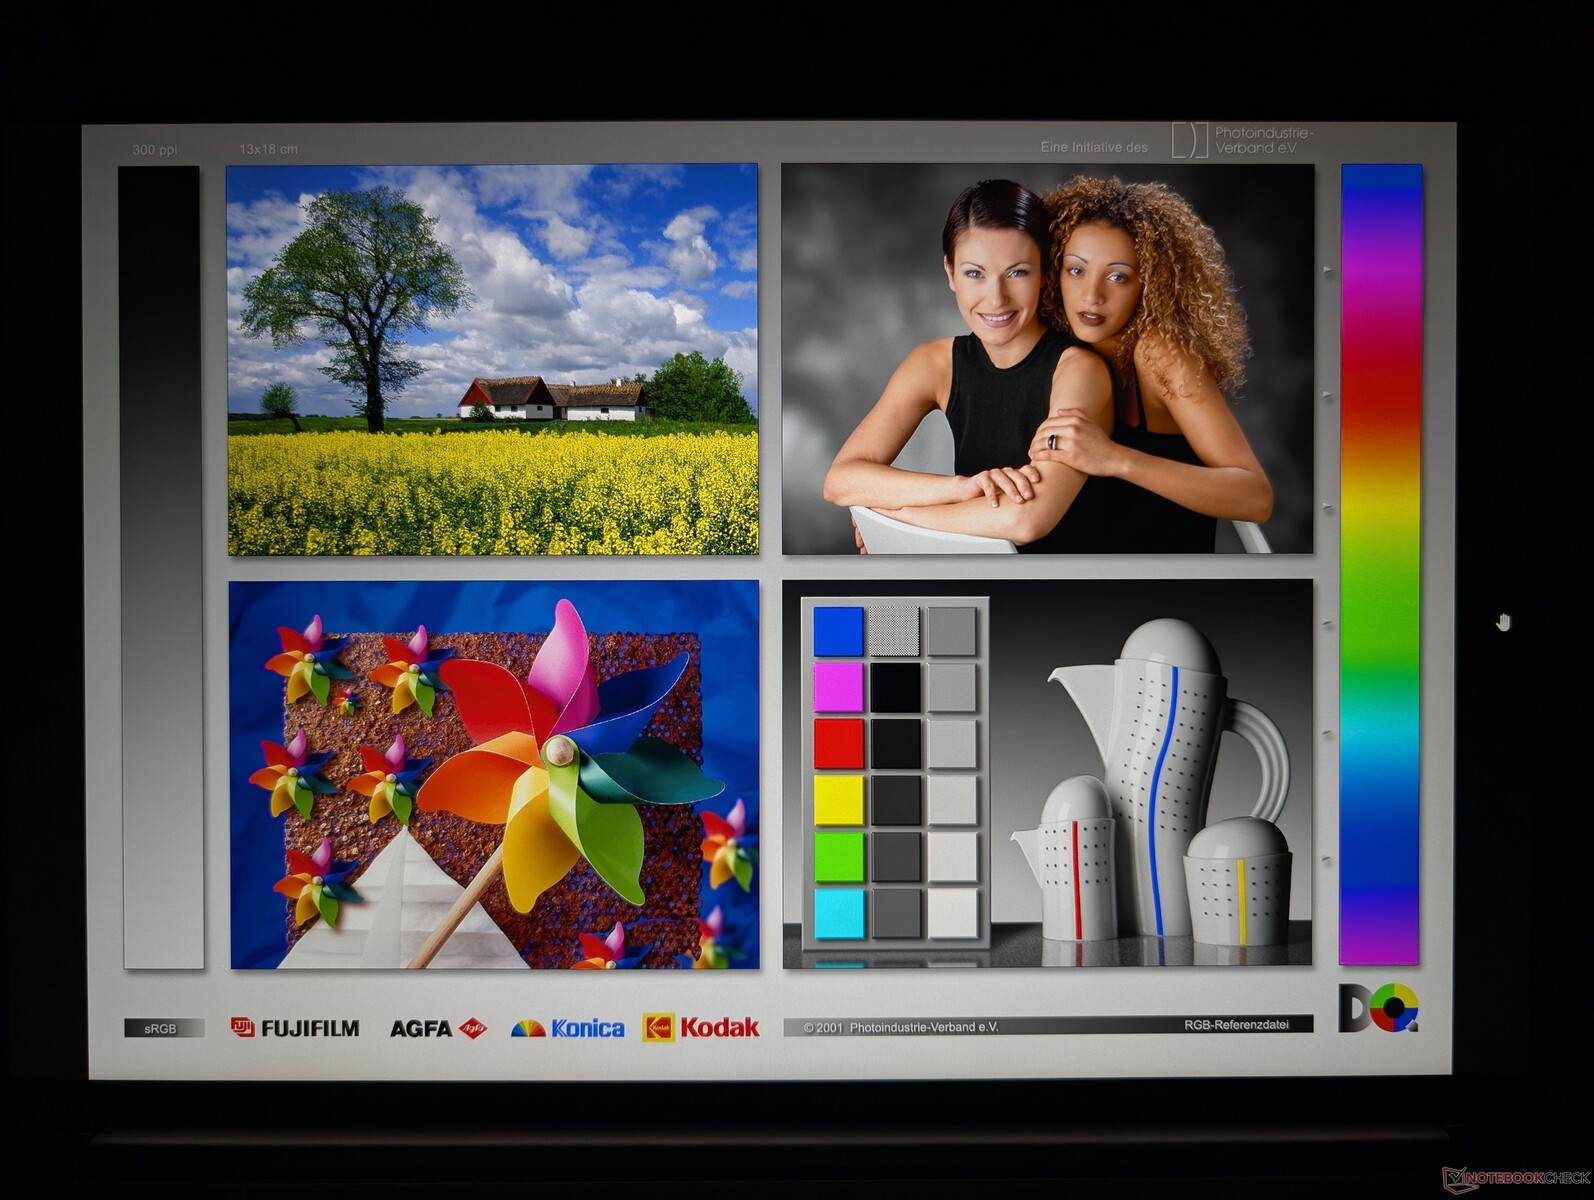
Display
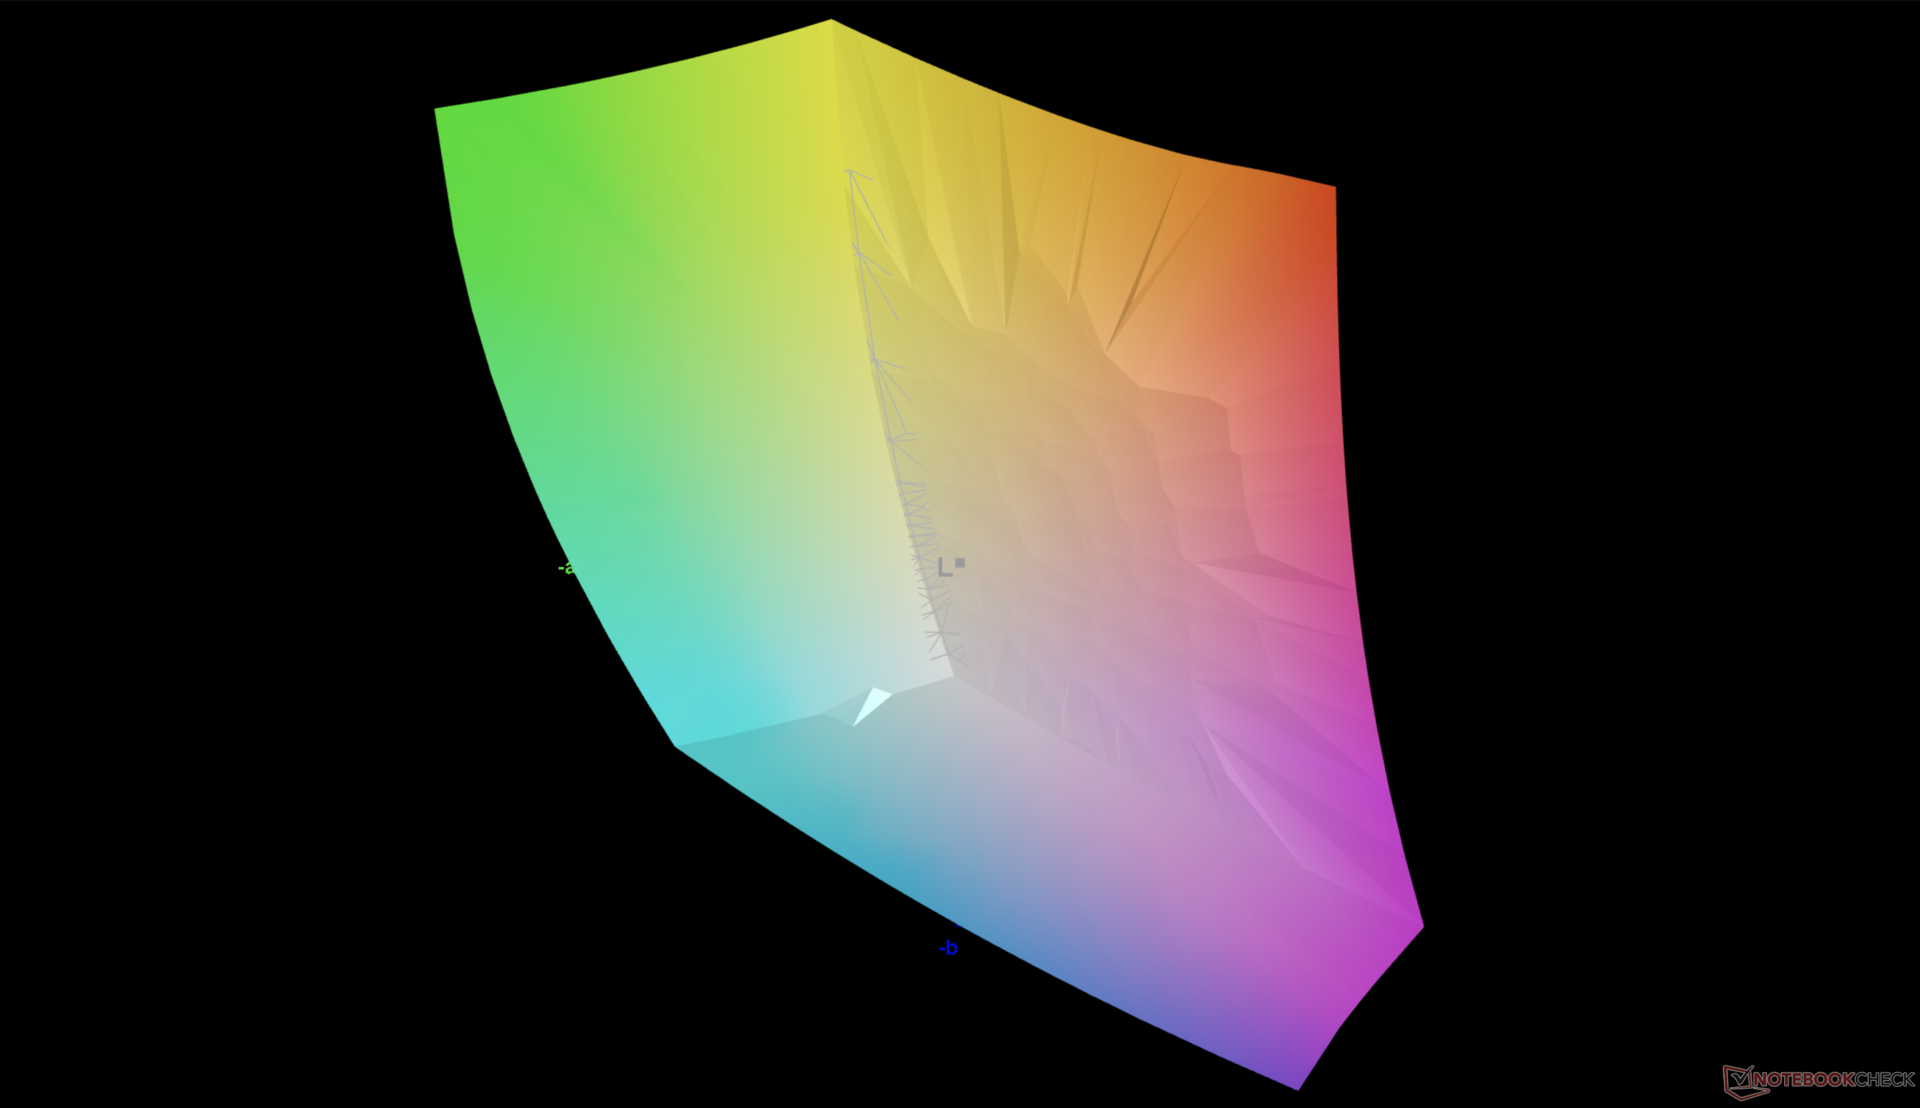
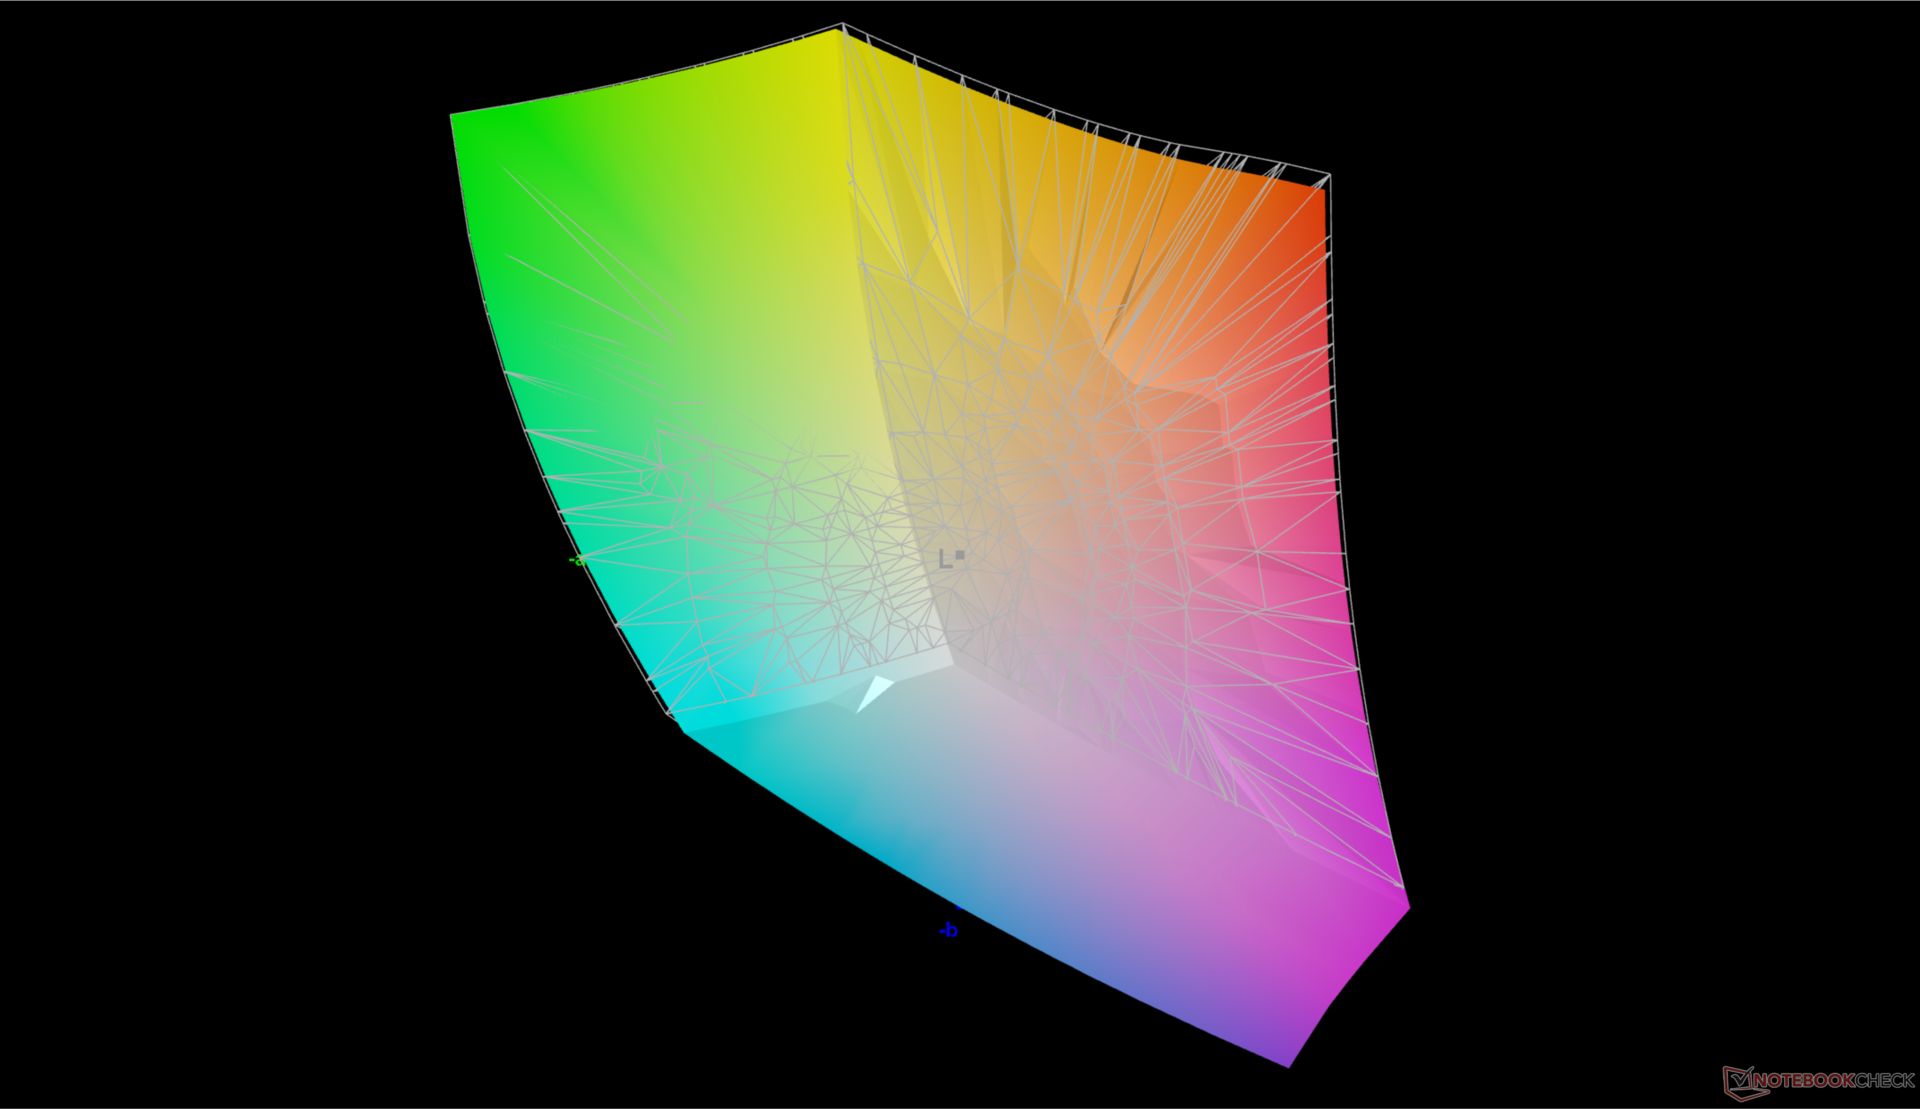
HP ha cambiato fornitore di pannelli 4K, passando da BOE per lo Studio 16 G9 ad AU Optronics per lo Studio 16 G11. Per il resto, le loro caratteristiche principali sono essenzialmente identiche in termini di frequenza di aggiornamento (120 Hz) e copertura del colore (100% DCI-P3). La luminosità, tuttavia, questa volta è inferiore di quasi il 30% e l'HDR continua a non essere supportato. Per ovviare a questo problema è disponibile un'opzione leggermente più luminosa da 500 nit.
Al momento in cui scriviamo, il modello non è disponibile con opzioni OLED.
| |||||||||||||||||||||||||
Distribuzione della luminosità: 92 %
Al centro con la batteria: 404.3 cd/m²
Contrasto: 1444:1 (Nero: 0.28 cd/m²)
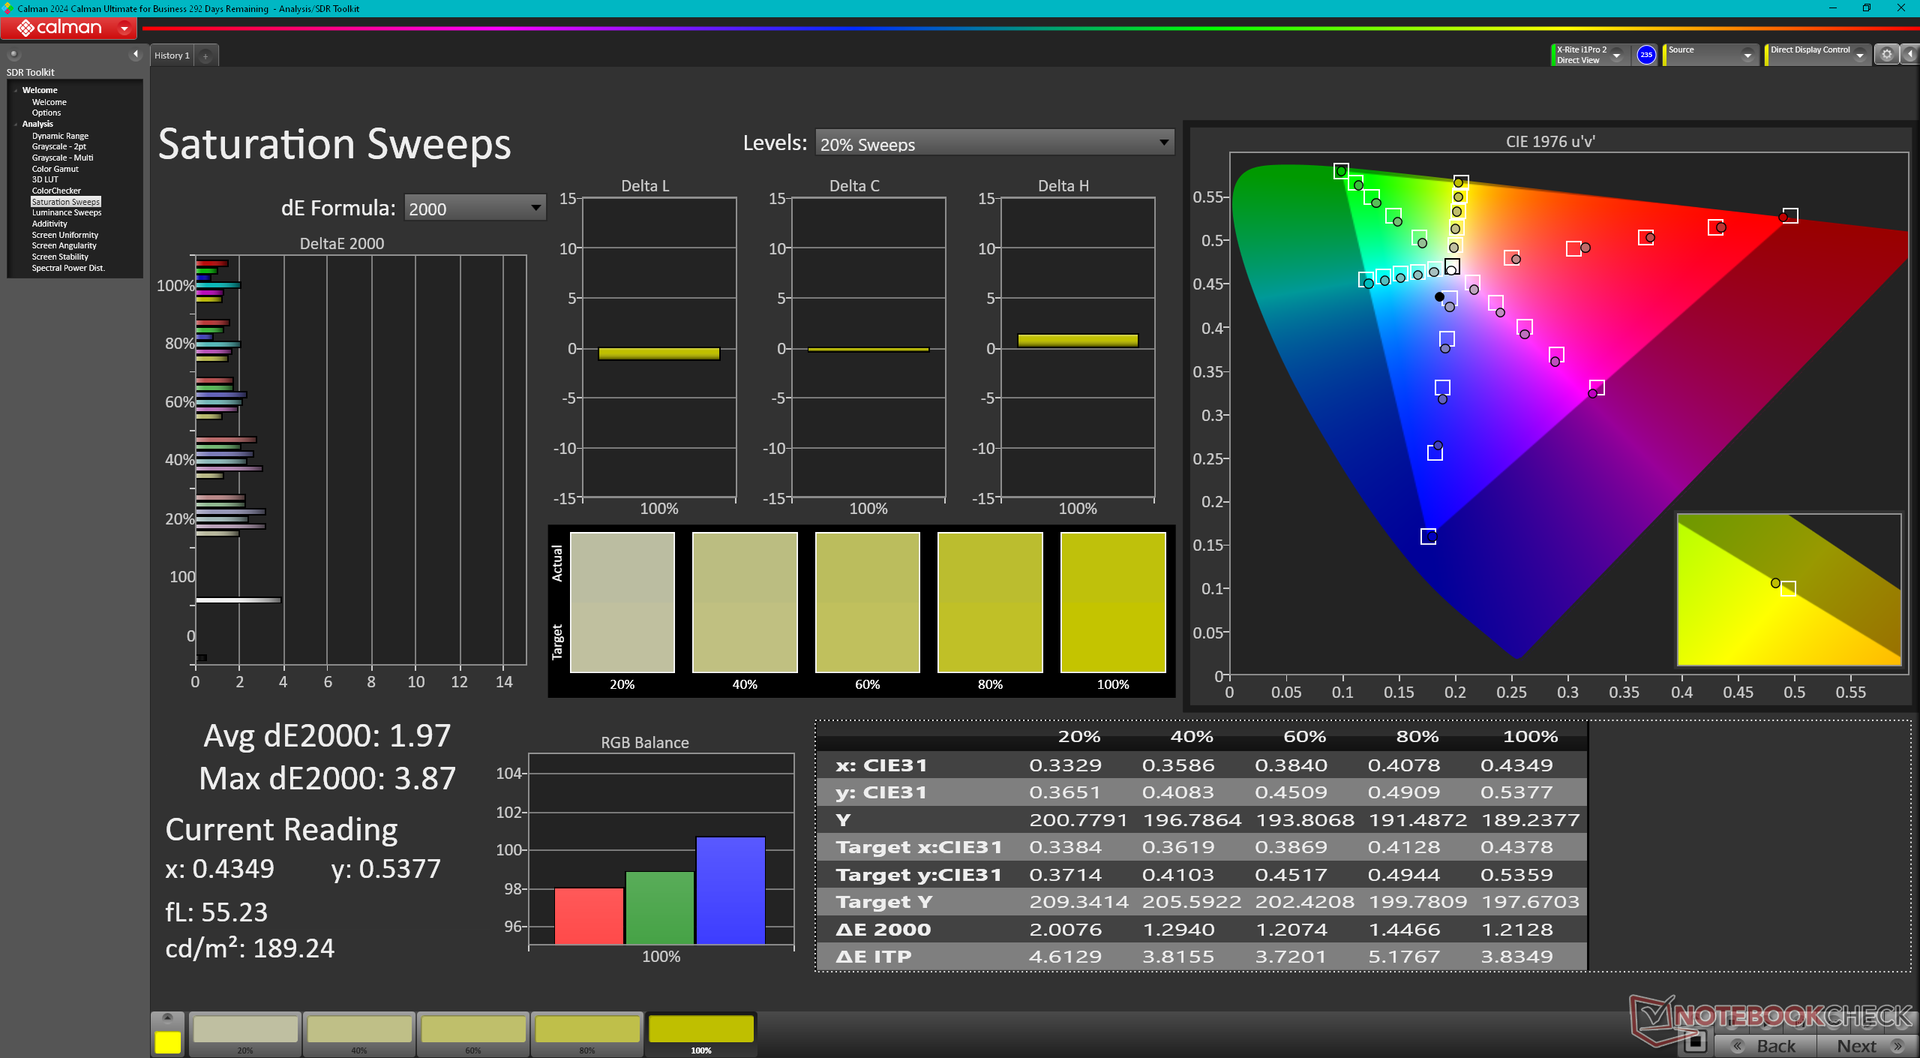
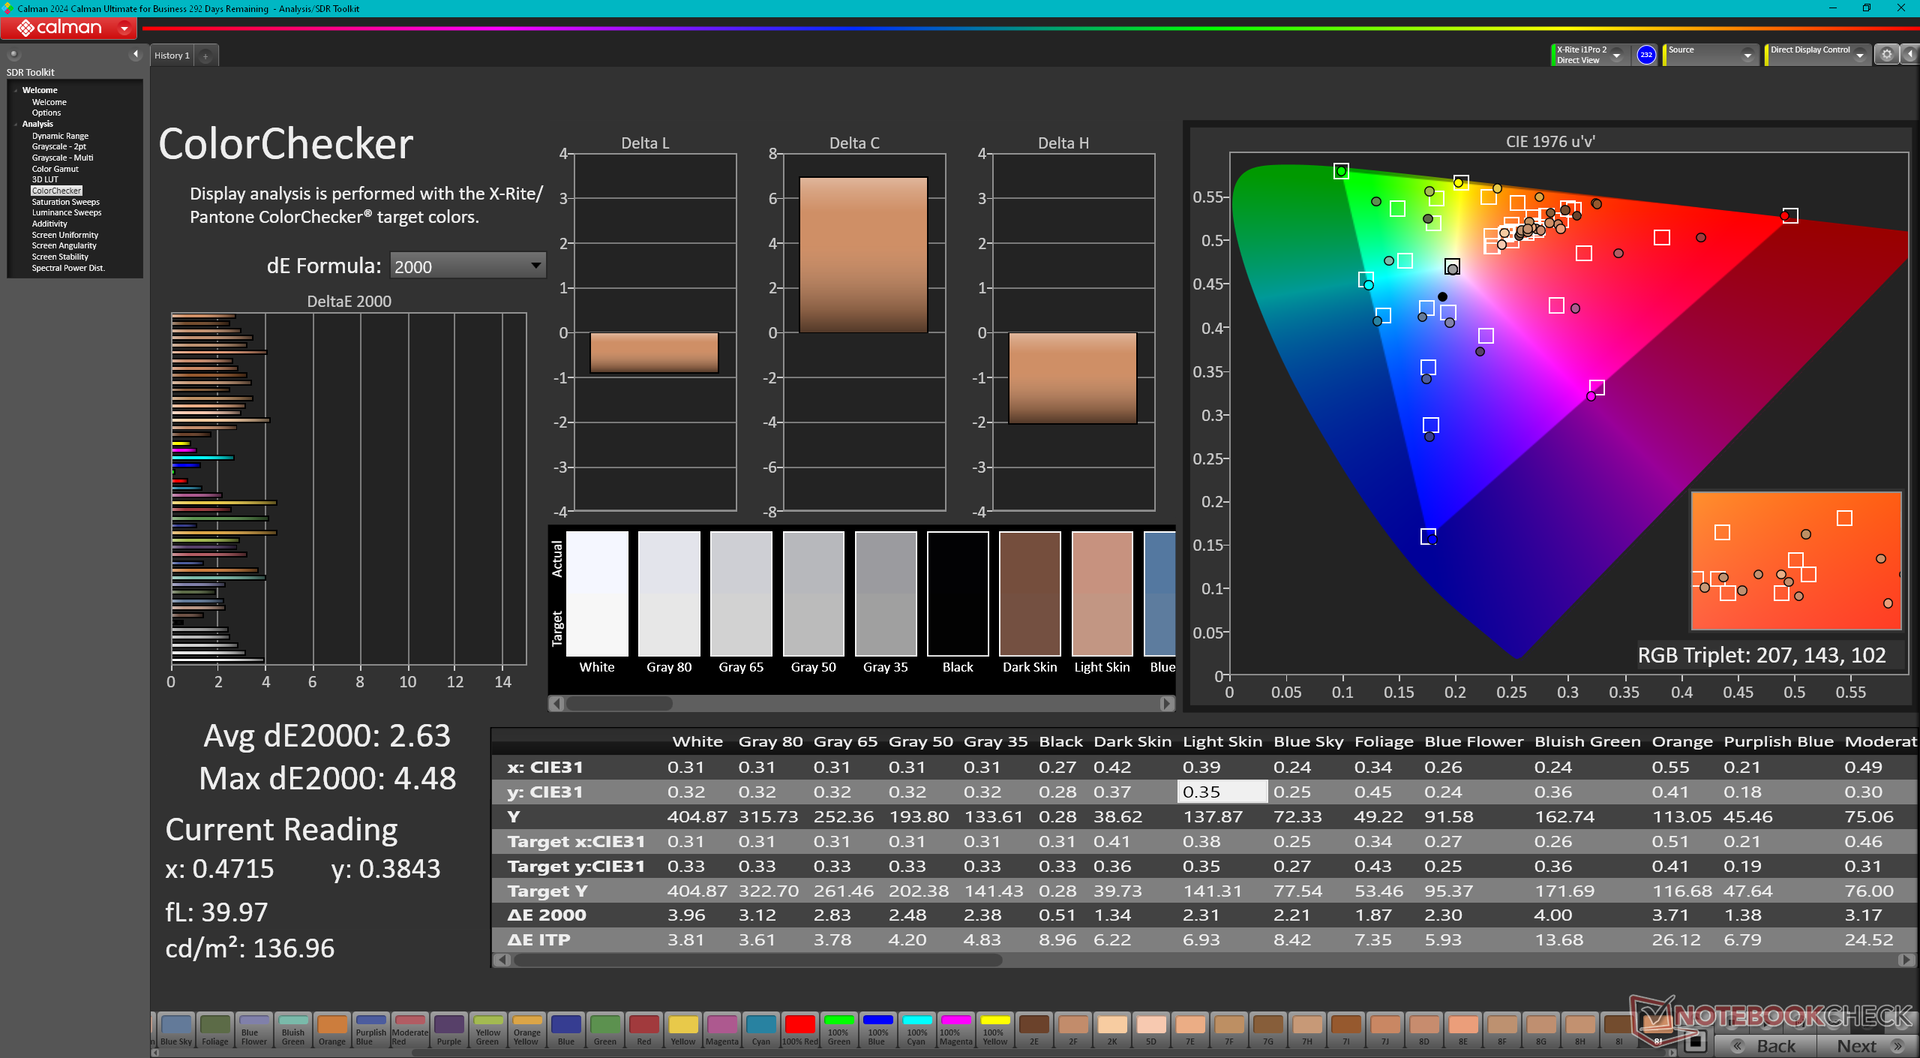
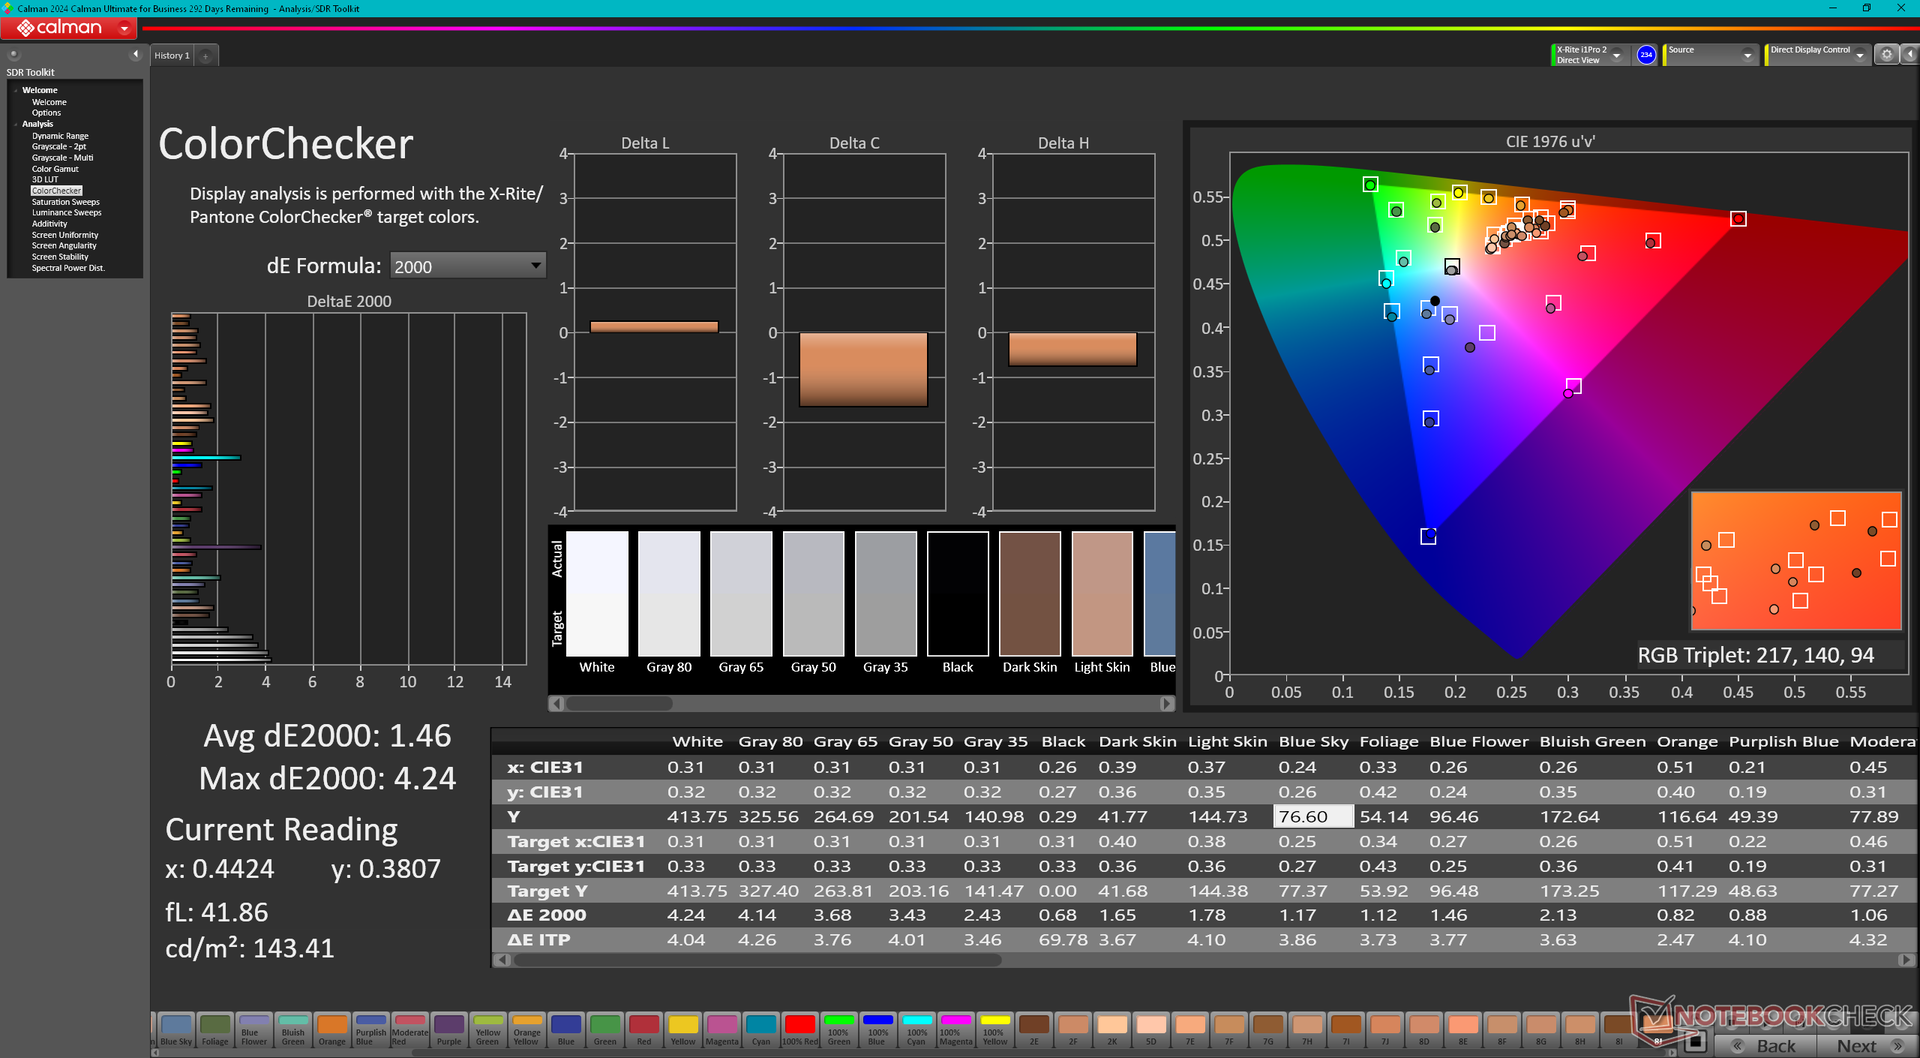
ΔE ColorChecker Calman: 2.63 | ∀{0.5-29.43 Ø4.73}
calibrated: 1.46
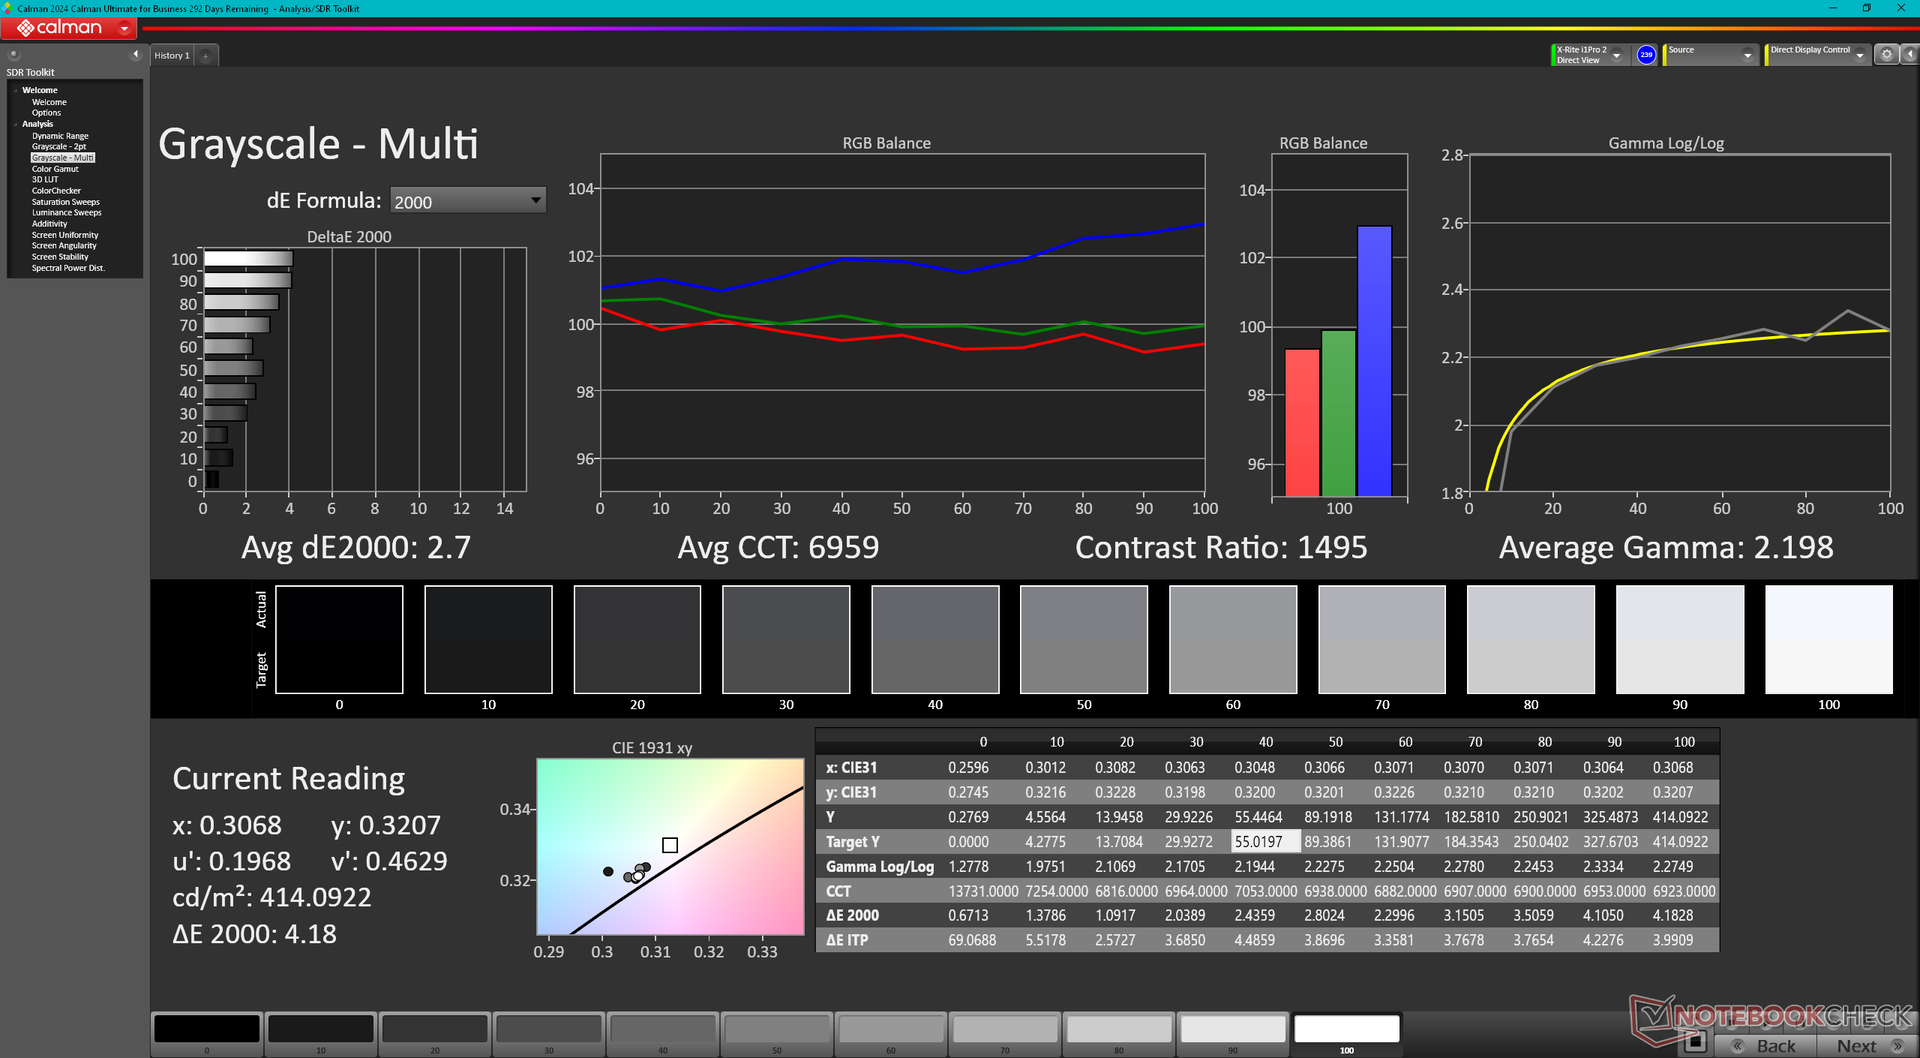
ΔE Greyscale Calman: 2.1 | ∀{0.09-98 Ø4.97}
85.7% AdobeRGB 1998 (Argyll 3D)
99.9% sRGB (Argyll 3D)
97.7% Display P3 (Argyll 3D)
Gamma: 2.3
CCT: 6810 K
| HP ZBook Studio 16 G11 AUO87A8, IPS, 3840x2400, 16", 120 Hz | HP ZBook Studio 16 G9 62U04EA BOE0A52, IPS, 3840x2400, 16", 120 Hz | HP ZBook Power 16 G11 A AUOA0A9, IPS, 2560x1600, 16", 120 Hz | Lenovo ThinkPad P16 Gen 2 NE160QDM-NY1, IPS, 2560x1600, 16", 165 Hz | Dell Precision 5690 Samsung 160YV03, OLED, 3840x2400, 16", 60 Hz | MSI CreatorPro Z16P B12UKST B160QAN02.N, IPS, 2560x1600, 16", 165 Hz | Lenovo ThinkPad P1 Gen 7 21KV001SGE MNG007DA1-9 , IPS LED, 2560x1600, 16", 165 Hz | |
|---|---|---|---|---|---|---|---|
| Display | 0% | -16% | -17% | 5% | 1% | -16% | |
| Display P3 Coverage (%) | 97.7 | 97.5 0% | 69.1 -29% | 68.4 -30% | 99.8 2% | 97.6 0% | 69.4 -29% |
| sRGB Coverage (%) | 99.9 | 99.9 0% | 97.7 -2% | 96.9 -3% | 100 0% | 99.9 0% | 97.6 -2% |
| AdobeRGB 1998 Coverage (%) | 85.7 | 86.3 1% | 71 -17% | 70.6 -18% | 96.6 13% | 87.4 2% | 71.8 -16% |
| Response Times | 17% | 13% | 4% | 86% | 20% | 11% | |
| Response Time Grey 50% / Grey 80% * (ms) | 14.2 ? | 15.3 ? -8% | 13.6 ? 4% | 14.1 ? 1% | 1.7 ? 88% | 12.8 ? 10% | 11.2 ? 21% |
| Response Time Black / White * (ms) | 10.6 ? | 6.1 ? 42% | 8.4 ? 21% | 9.9 ? 7% | 1.7 ? 84% | 7.4 ? 30% | 10.6 ? -0% |
| PWM Frequency (Hz) | 60 ? | ||||||
| Screen | 18% | -20% | 17% | -11% | 10% | -32% | |
| Brightness middle (cd/m²) | 404.3 | 554 37% | 470.7 16% | 531.5 31% | 348.1 -14% | 407 1% | 516 28% |
| Brightness (cd/m²) | 405 | 516 27% | 431 6% | 499 23% | 351 -13% | 388 -4% | 505 25% |
| Brightness Distribution (%) | 92 | 84 -9% | 88 -4% | 89 -3% | 97 5% | 88 -4% | 89 -3% |
| Black Level * (cd/m²) | 0.28 | 0.47 -68% | 0.57 -104% | 0.38 -36% | 0.36 -29% | 0.41 -46% | |
| Contrast (:1) | 1444 | 1179 -18% | 826 -43% | 1399 -3% | 1131 -22% | 1259 -13% | |
| Colorchecker dE 2000 * | 2.63 | 1 62% | 2.16 18% | 1.82 31% | 4.18 -59% | 1.3 51% | 3.5 -33% |
| Colorchecker dE 2000 max. * | 4.48 | 2.4 46% | 4.39 2% | 4.1 8% | 6.68 -49% | 2.5 44% | 8.8 -96% |
| Colorchecker dE 2000 calibrated * | 1.46 | 0.6 59% | 1.37 6% | 0.63 57% | 0.97 34% | 0.7 52% | 1.2 18% |
| Greyscale dE 2000 * | 2.1 | 1.6 24% | 3.7 -76% | 1.2 43% | 1.7 19% | 2.1 -0% | 5.6 -167% |
| Gamma | 2.3 96% | 2.29 96% | 2.38 92% | 2.15 102% | 2.2 100% | 2.26 97% | 2.27 97% |
| CCT | 6810 95% | 6458 101% | 6765 96% | 6484 100% | 6198 105% | 6437 101% | 6071 107% |
| Media totale (Programma / Settaggio) | 12% /
14% | -8% /
-14% | 1% /
8% | 27% /
9% | 10% /
9% | -12% /
-22% |
* ... Meglio usare valori piccoli
Il display è pre-calibrato rispetto allo standard P3, con valori medi bassi di deltaE della scala di grigi e del colore, rispettivamente di soli 2,1 e 2,63.

Tempi di risposta del Display
| ↔ Tempi di risposta dal Nero al Bianco | ||
|---|---|---|
| 10.6 ms ... aumenta ↗ e diminuisce ↘ combinato | ↗ 6.1 ms Incremento | 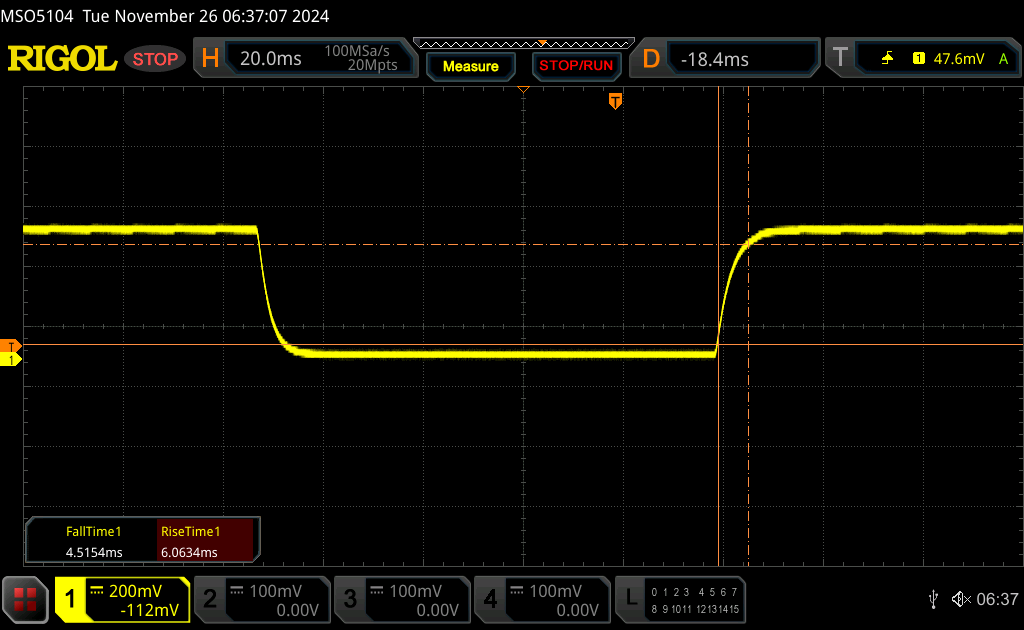 |
| ↘ 4.5 ms Calo | ||
| Lo schermo mostra buoni tempi di risposta durante i nostri tests, ma potrebbe essere troppo lento per i gamers competitivi. In confronto, tutti i dispositivi di test variano da 0.1 (minimo) a 240 (massimo) ms. » 29 % di tutti i dispositivi è migliore. Questo significa che i tempi di risposta rilevati sono migliori rispettto alla media di tutti i dispositivi testati (19.9 ms). | ||
| ↔ Tempo di risposta dal 50% Grigio all'80% Grigio | ||
| 14.2 ms ... aumenta ↗ e diminuisce ↘ combinato | ↗ 6.9 ms Incremento | 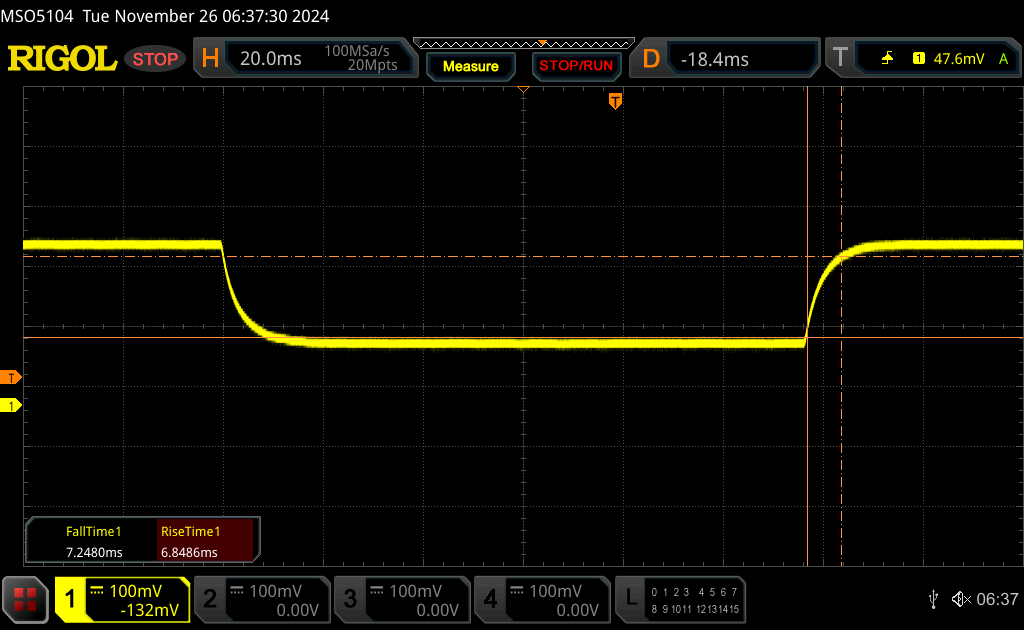 |
| ↘ 7.3 ms Calo | ||
| Lo schermo mostra buoni tempi di risposta durante i nostri tests, ma potrebbe essere troppo lento per i gamers competitivi. In confronto, tutti i dispositivi di test variano da 0.165 (minimo) a 636 (massimo) ms. » 28 % di tutti i dispositivi è migliore. Questo significa che i tempi di risposta rilevati sono migliori rispettto alla media di tutti i dispositivi testati (31.1 ms). | ||
Sfarfallio dello schermo / PWM (Pulse-Width Modulation)
| flickering dello schermo / PWM non rilevato | 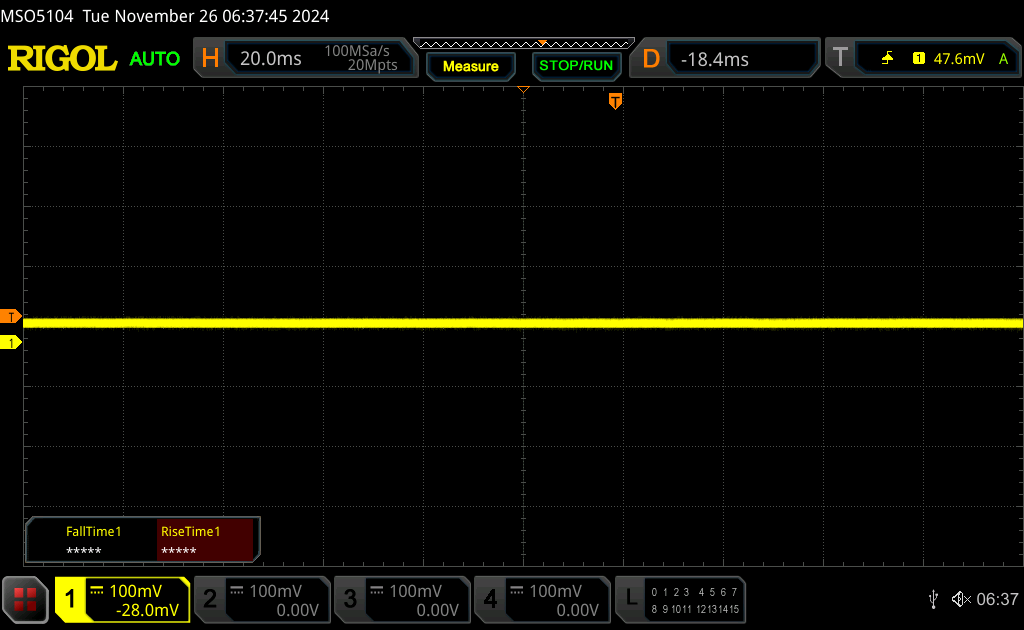 | ||
In confronto: 52 % di tutti i dispositivi testati non utilizza PWM per ridurre la luminosita' del display. Se è rilevato PWM, una media di 7810 (minimo: 5 - massimo: 343500) Hz è stata rilevata. | |||

Prestazioni

Condizioni del test
Abbiamo impostato Windows e MyHP in modalità Prestazioni prima di eseguire i benchmark qui sotto.
Processore
Anche se non è così veloce come la serie adiacente Raptor Lake-HX, il Core Ultra 9 185 basato su Meteor Lake Core Ultra 9 185H è comunque un leggero upgrade rispetto al Core i7-12800H nello ZBook Studio 16 G9 di circa il 10% per quanto riguarda i compiti multi-thread. Purtroppo, non è in grado di sostenere le velocità di clock Turbo Boost per molto tempo, nonostante il fattore di forma da 16 pollici relativamente grande.
Cinebench R15 Multi Loop
Cinebench R23: Multi Core | Single Core
Cinebench R20: CPU (Multi Core) | CPU (Single Core)
Cinebench R15: CPU Multi 64Bit | CPU Single 64Bit
Blender: v2.79 BMW27 CPU
7-Zip 18.03: 7z b 4 | 7z b 4 -mmt1
Geekbench 6.6: Multi-Core | Single-Core
Geekbench 5.5: Multi-Core | Single-Core
HWBOT x265 Benchmark v2.2: 4k Preset
LibreOffice : 20 Documents To PDF
R Benchmark 2.5: Overall mean
| Geekbench 6.6 / Multi-Core | |
| Lenovo ThinkPad P16 Gen 2 | |
| Media della classe Workstation (12196 - 20887, n=25, ultimi 2 anni) | |
| HP ZBook Fury 16 G10 | |
| HP ZBook Fury 16 G11 | |
| Dell Precision 5000 5680 | |
| Dell Precision 5690 | |
| HP ZBook Studio 16 G11 | |
| Media Intel Core Ultra 9 185H (9140 - 14540, n=20) | |
| Lenovo ThinkPad P1 Gen 7 21KV001SGE | |
| Lenovo ThinkPad P1 G6 21FV001KUS | |
| HP ZBook Power 16 G11 A | |
| Lenovo ThinkPad P1 G6-21FV000DGE | |
| Lenovo ThinkPad P16s G2 21K9000CGE | |
| Lenovo ThinkPad P16v G1 AMD | |
| Geekbench 6.6 / Single-Core | |
| HP ZBook Fury 16 G10 | |
| HP ZBook Fury 16 G11 | |
| Lenovo ThinkPad P16 Gen 2 | |
| Media della classe Workstation (2389 - 3065, n=25, ultimi 2 anni) | |
| Lenovo ThinkPad P1 G6 21FV001KUS | |
| Lenovo ThinkPad P1 G6-21FV000DGE | |
| HP ZBook Power 16 G11 A | |
| Dell Precision 5000 5680 | |
| Lenovo ThinkPad P16v G1 AMD | |
| Dell Precision 5690 | |
| HP ZBook Studio 16 G11 | |
| Lenovo ThinkPad P16s G2 21K9000CGE | |
| Media Intel Core Ultra 9 185H (1490 - 2573, n=20) | |
| Lenovo ThinkPad P1 Gen 7 21KV001SGE | |
Cinebench R23: Multi Core | Single Core
Cinebench R20: CPU (Multi Core) | CPU (Single Core)
Cinebench R15: CPU Multi 64Bit | CPU Single 64Bit
Blender: v2.79 BMW27 CPU
7-Zip 18.03: 7z b 4 | 7z b 4 -mmt1
Geekbench 6.6: Multi-Core | Single-Core
Geekbench 5.5: Multi-Core | Single-Core
HWBOT x265 Benchmark v2.2: 4k Preset
LibreOffice : 20 Documents To PDF
R Benchmark 2.5: Overall mean
* ... Meglio usare valori piccoli
AIDA64: FP32 Ray-Trace | FPU Julia | CPU SHA3 | CPU Queen | FPU SinJulia | FPU Mandel | CPU AES | CPU ZLib | FP64 Ray-Trace | CPU PhotoWorxx
| Performance rating | |
| Lenovo ThinkPad P16 Gen 2 | |
| HP ZBook Power 16 G11 A | |
| Dell Precision 5690 | |
| HP ZBook Studio 16 G11 | |
| Lenovo ThinkPad P1 Gen 7 21KV001SGE | |
| Media Intel Core Ultra 9 185H | |
| MSI CreatorPro Z16P B12UKST | |
| HP ZBook Studio 16 G9 62U04EA | |
| AIDA64 / FP32 Ray-Trace | |
| HP ZBook Power 16 G11 A | |
| Lenovo ThinkPad P16 Gen 2 | |
| Dell Precision 5690 | |
| Lenovo ThinkPad P1 Gen 7 21KV001SGE | |
| HP ZBook Studio 16 G11 | |
| Media Intel Core Ultra 9 185H (9220 - 18676, n=20) | |
| HP ZBook Studio 16 G9 62U04EA | |
| MSI CreatorPro Z16P B12UKST | |
| AIDA64 / FPU Julia | |
| HP ZBook Power 16 G11 A | |
| Lenovo ThinkPad P16 Gen 2 | |
| Dell Precision 5690 | |
| HP ZBook Studio 16 G11 | |
| Lenovo ThinkPad P1 Gen 7 21KV001SGE | |
| Media Intel Core Ultra 9 185H (48865 - 96463, n=20) | |
| HP ZBook Studio 16 G9 62U04EA | |
| MSI CreatorPro Z16P B12UKST | |
| AIDA64 / CPU SHA3 | |
| Lenovo ThinkPad P16 Gen 2 | |
| HP ZBook Power 16 G11 A | |
| Dell Precision 5690 | |
| HP ZBook Studio 16 G11 | |
| Lenovo ThinkPad P1 Gen 7 21KV001SGE | |
| Media Intel Core Ultra 9 185H (2394 - 4534, n=20) | |
| HP ZBook Studio 16 G9 62U04EA | |
| MSI CreatorPro Z16P B12UKST | |
| AIDA64 / CPU Queen | |
| Lenovo ThinkPad P16 Gen 2 | |
| HP ZBook Power 16 G11 A | |
| HP ZBook Studio 16 G9 62U04EA | |
| MSI CreatorPro Z16P B12UKST | |
| Dell Precision 5690 | |
| HP ZBook Studio 16 G11 | |
| Lenovo ThinkPad P1 Gen 7 21KV001SGE | |
| Media Intel Core Ultra 9 185H (66785 - 95241, n=20) | |
| AIDA64 / FPU SinJulia | |
| HP ZBook Power 16 G11 A | |
| Lenovo ThinkPad P16 Gen 2 | |
| Dell Precision 5690 | |
| HP ZBook Studio 16 G11 | |
| Lenovo ThinkPad P1 Gen 7 21KV001SGE | |
| Media Intel Core Ultra 9 185H (7255 - 11392, n=20) | |
| HP ZBook Studio 16 G9 62U04EA | |
| MSI CreatorPro Z16P B12UKST | |
| AIDA64 / FPU Mandel | |
| HP ZBook Power 16 G11 A | |
| Lenovo ThinkPad P16 Gen 2 | |
| Dell Precision 5690 | |
| Lenovo ThinkPad P1 Gen 7 21KV001SGE | |
| HP ZBook Studio 16 G11 | |
| Media Intel Core Ultra 9 185H (24004 - 48020, n=20) | |
| HP ZBook Studio 16 G9 62U04EA | |
| MSI CreatorPro Z16P B12UKST | |
| AIDA64 / CPU ZLib | |
| Lenovo ThinkPad P16 Gen 2 | |
| Dell Precision 5690 | |
| HP ZBook Studio 16 G11 | |
| Lenovo ThinkPad P1 Gen 7 21KV001SGE | |
| Media Intel Core Ultra 9 185H (678 - 1341, n=20) | |
| HP ZBook Power 16 G11 A | |
| HP ZBook Studio 16 G9 62U04EA | |
| MSI CreatorPro Z16P B12UKST | |
| AIDA64 / FP64 Ray-Trace | |
| HP ZBook Power 16 G11 A | |
| Lenovo ThinkPad P16 Gen 2 | |
| Dell Precision 5690 | |
| Lenovo ThinkPad P1 Gen 7 21KV001SGE | |
| HP ZBook Studio 16 G9 62U04EA | |
| HP ZBook Studio 16 G11 | |
| Media Intel Core Ultra 9 185H (4428 - 10078, n=20) | |
| MSI CreatorPro Z16P B12UKST | |
| AIDA64 / CPU PhotoWorxx | |
| HP ZBook Studio 16 G11 | |
| Dell Precision 5690 | |
| Media Intel Core Ultra 9 185H (44547 - 53918, n=20) | |
| MSI CreatorPro Z16P B12UKST | |
| Lenovo ThinkPad P1 Gen 7 21KV001SGE | |
| HP ZBook Power 16 G11 A | |
| Lenovo ThinkPad P16 Gen 2 | |
| HP ZBook Studio 16 G9 62U04EA | |
Test da sforzo
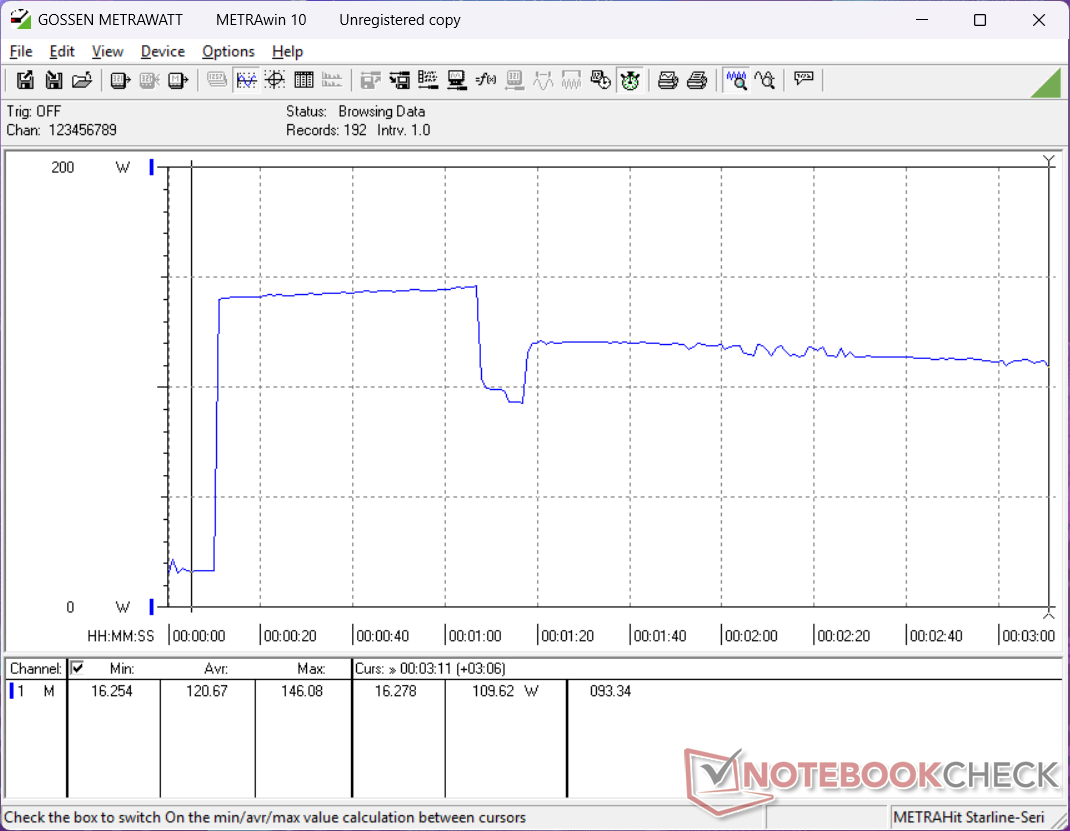
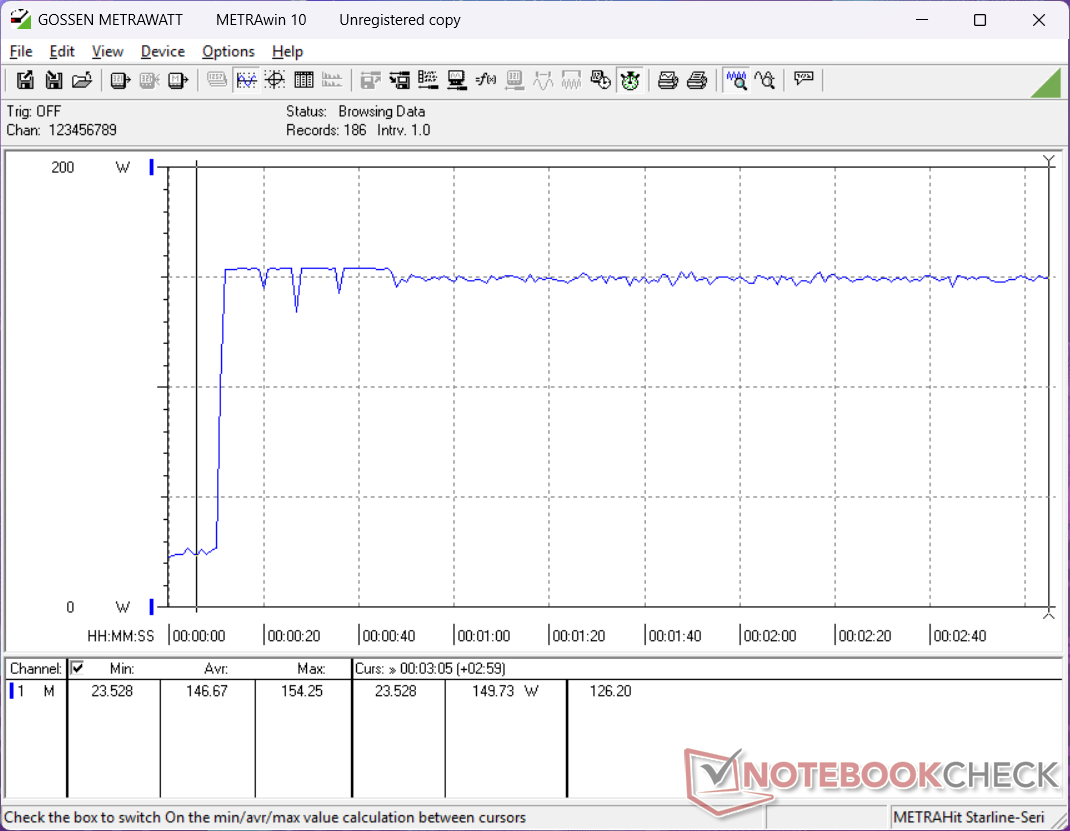
Il limitato potenziale Turbo Boost del sistema diventa evidente quando si osservano più da vicino i suoi parametri vitali in tempo reale. Quando si esegue lo stress Prime95, ad esempio, la CPU raggiunge quasi istantaneamente 89 C nei primi secondi del test. Poi scendeva rapidamente da 3,3 GHz e 89 W a soli 2,3 GHz e 70 W per mantenere la temperatura del core al di sotto dei 100 C.
La temperatura della CPU e della GPU durante l'esecuzione di Cyberpunk 2077 si stabilizzava rispettivamente a 68 C e 70 C, rispetto ai 75 C e 62 C del più potente Dell Precision 5690.
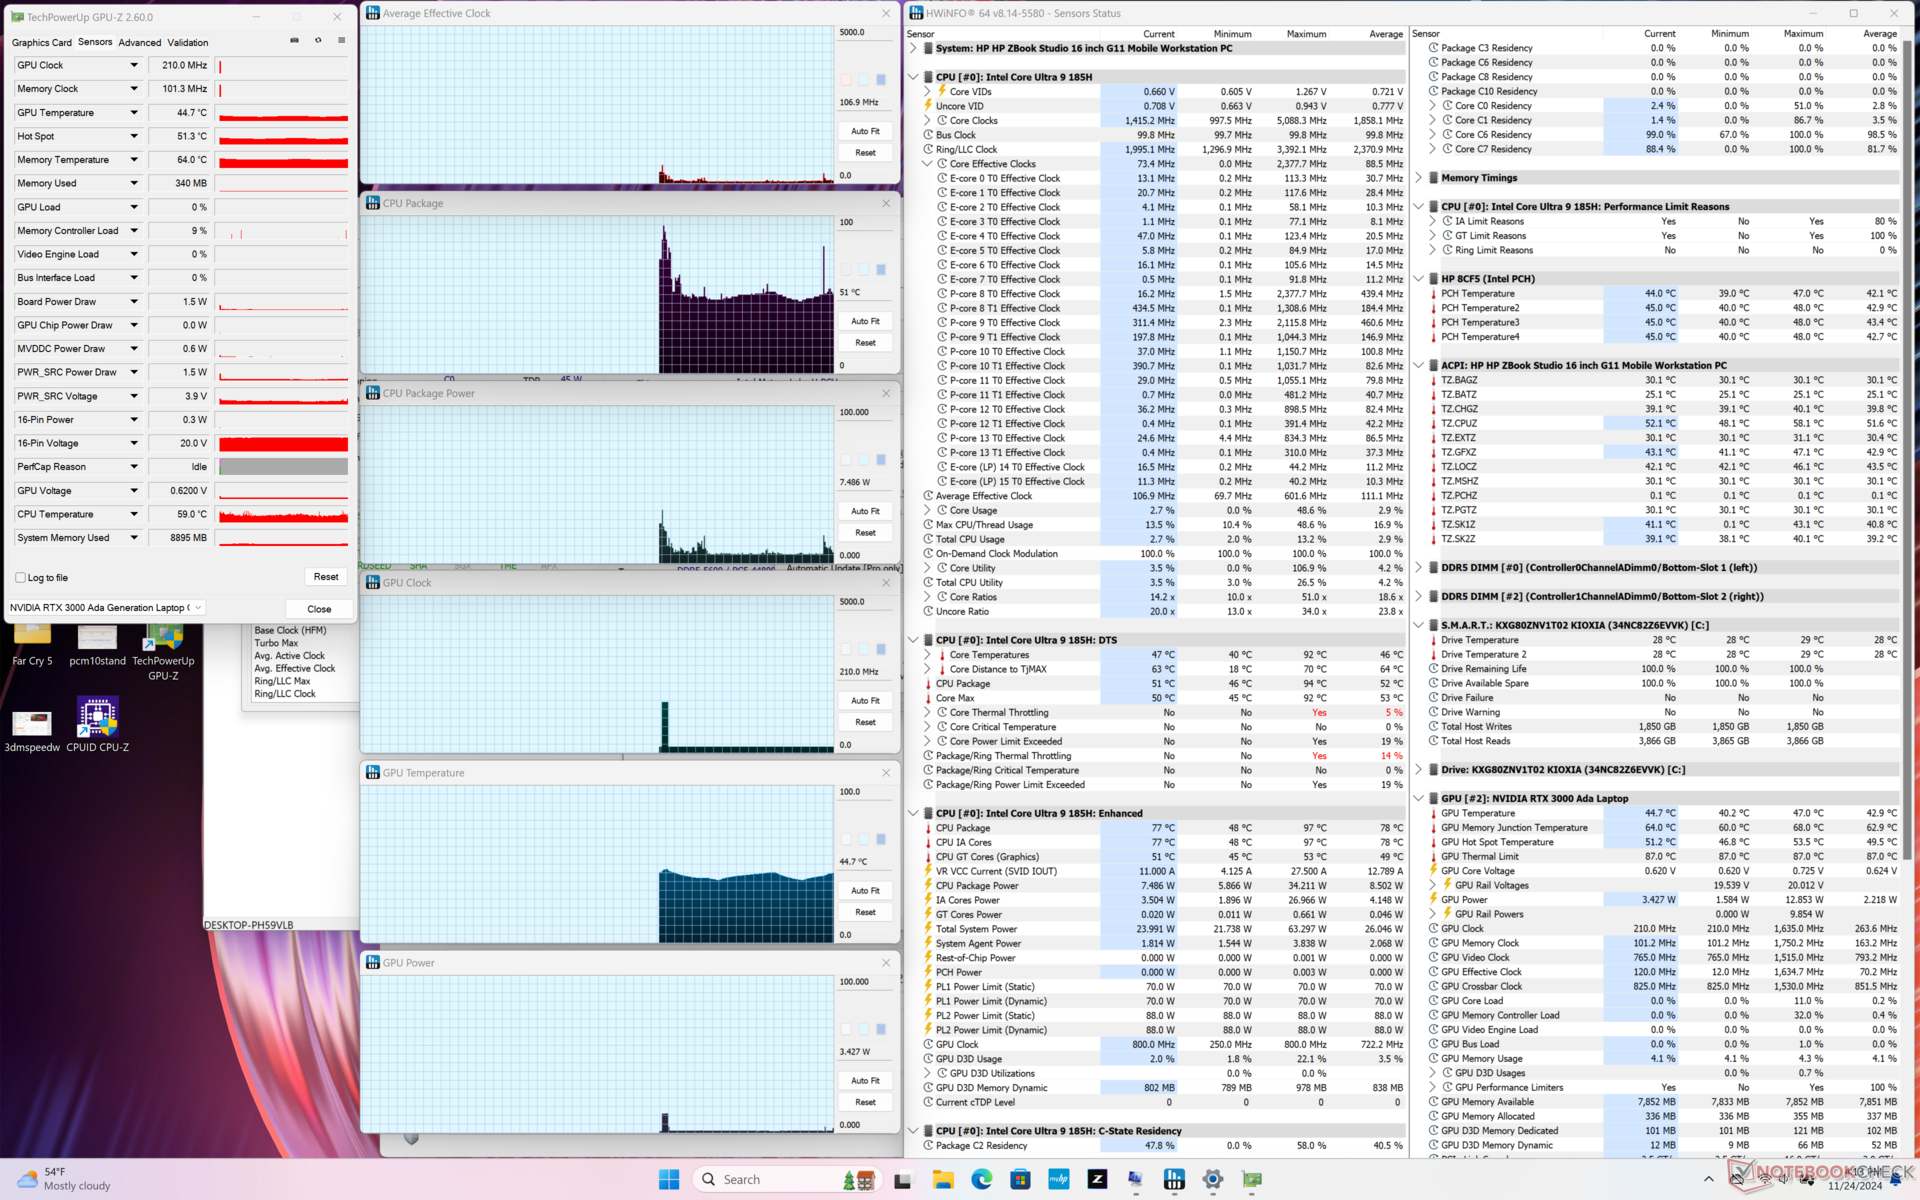
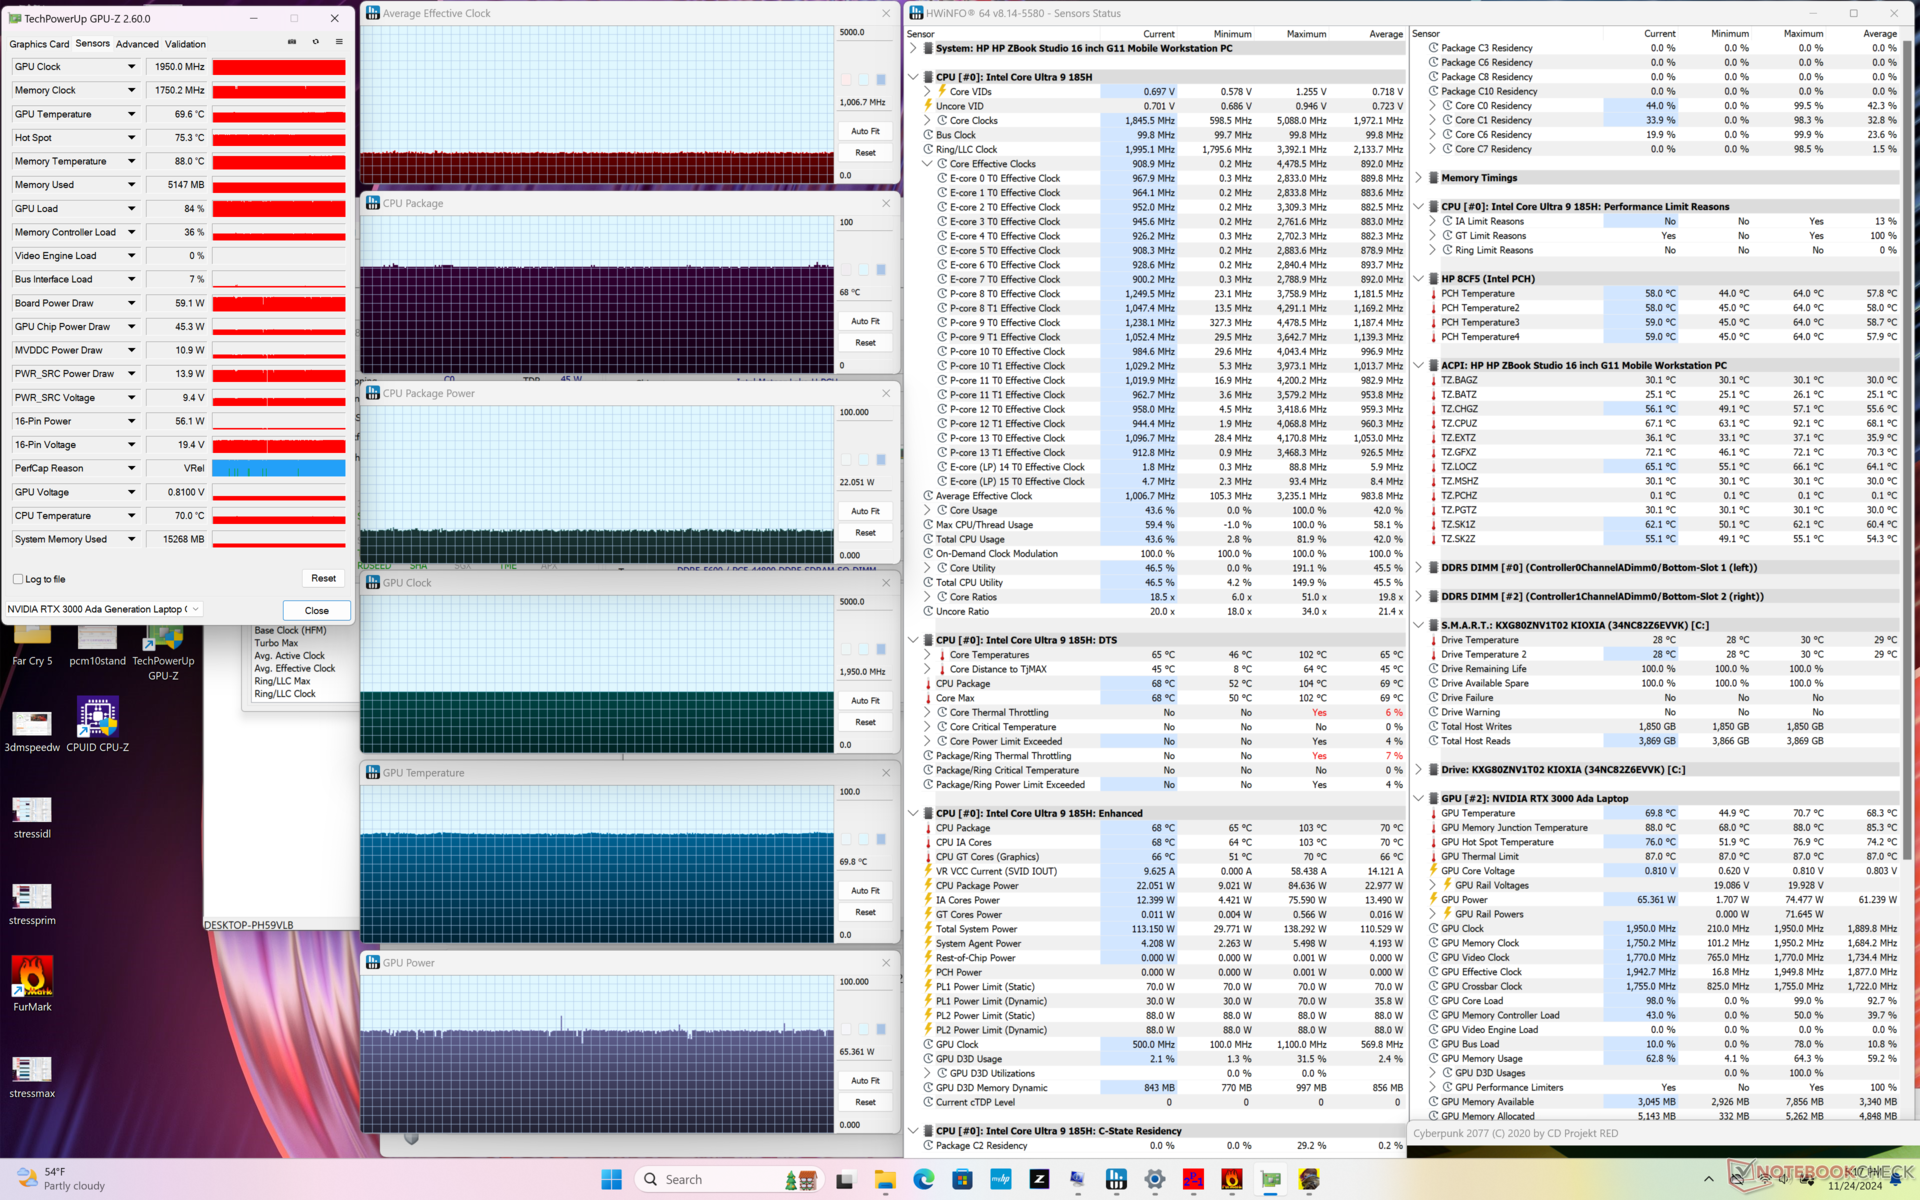
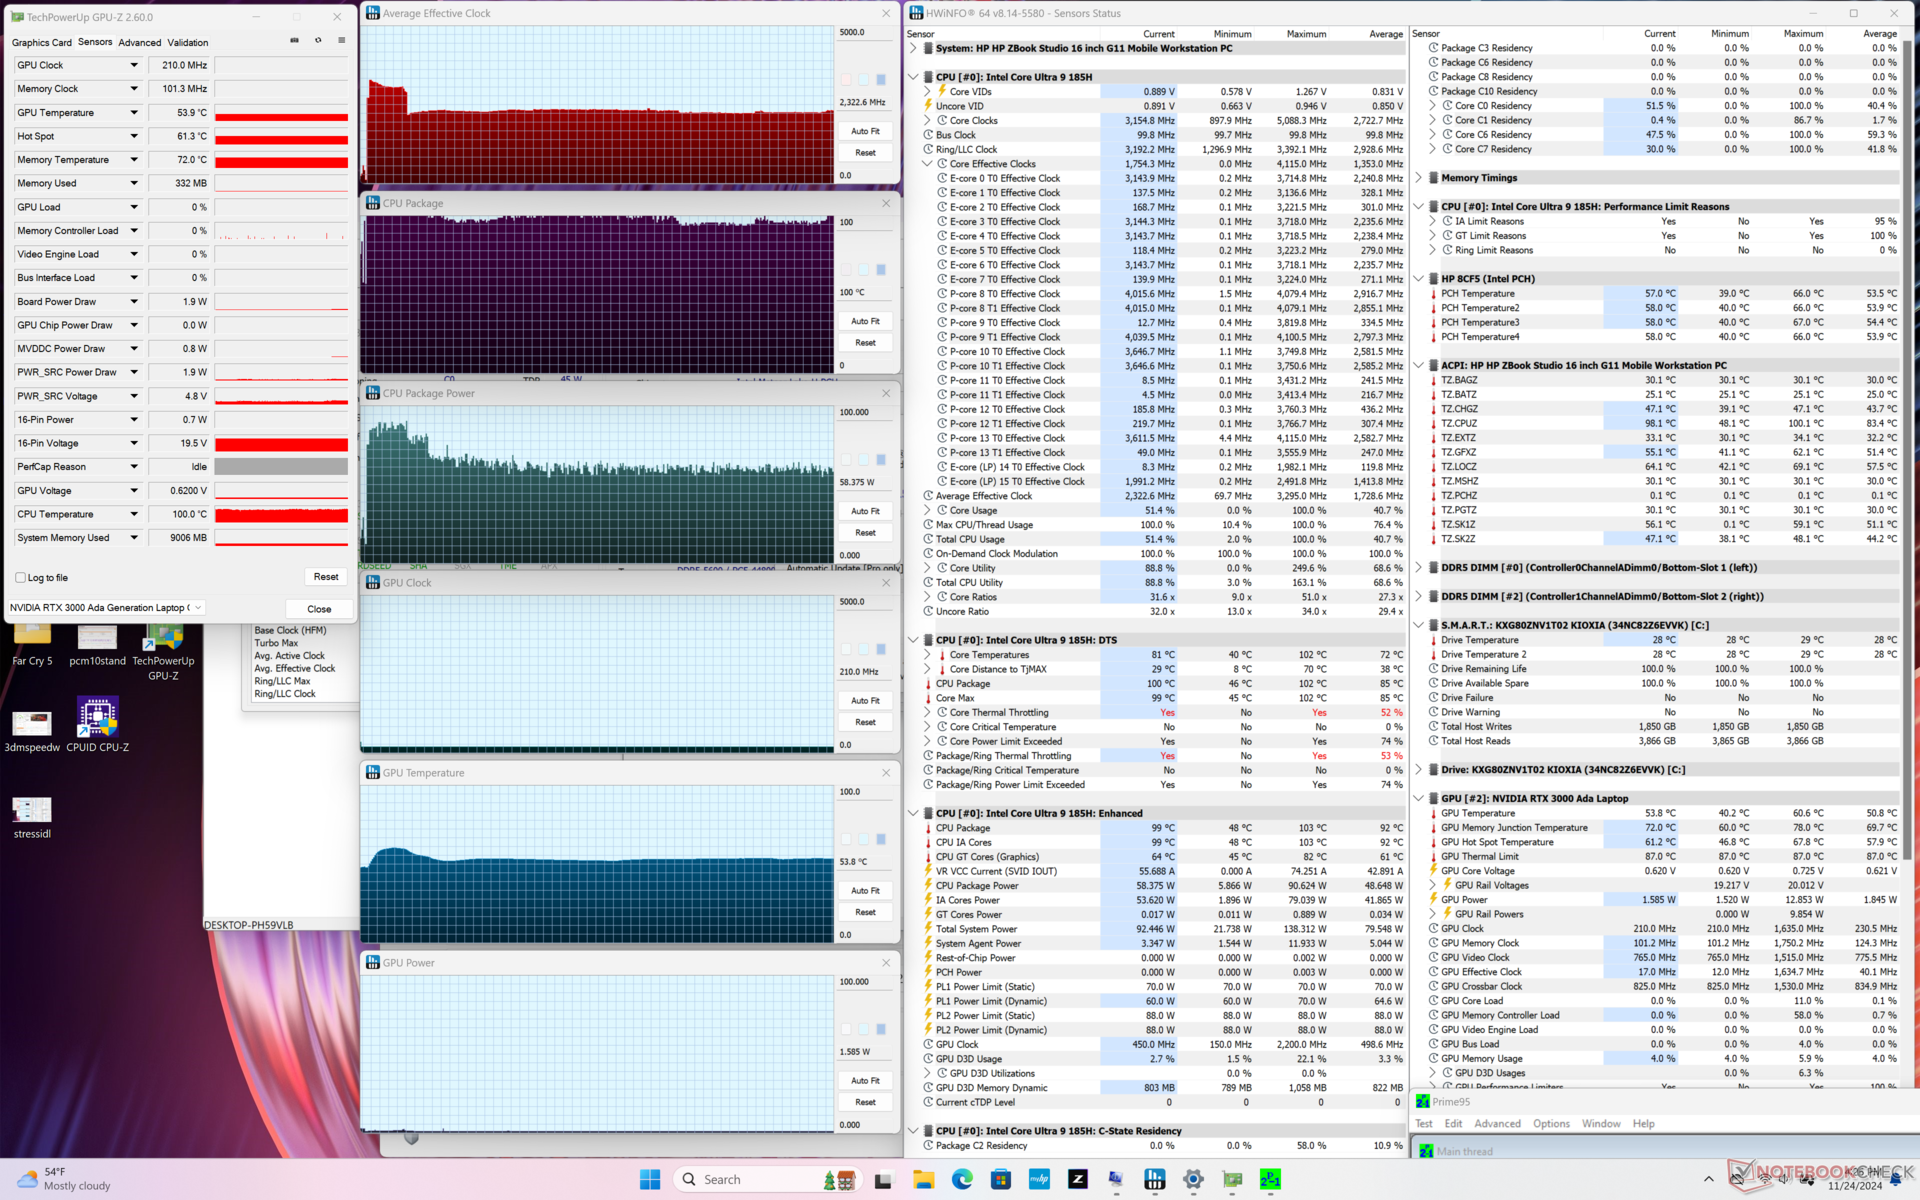
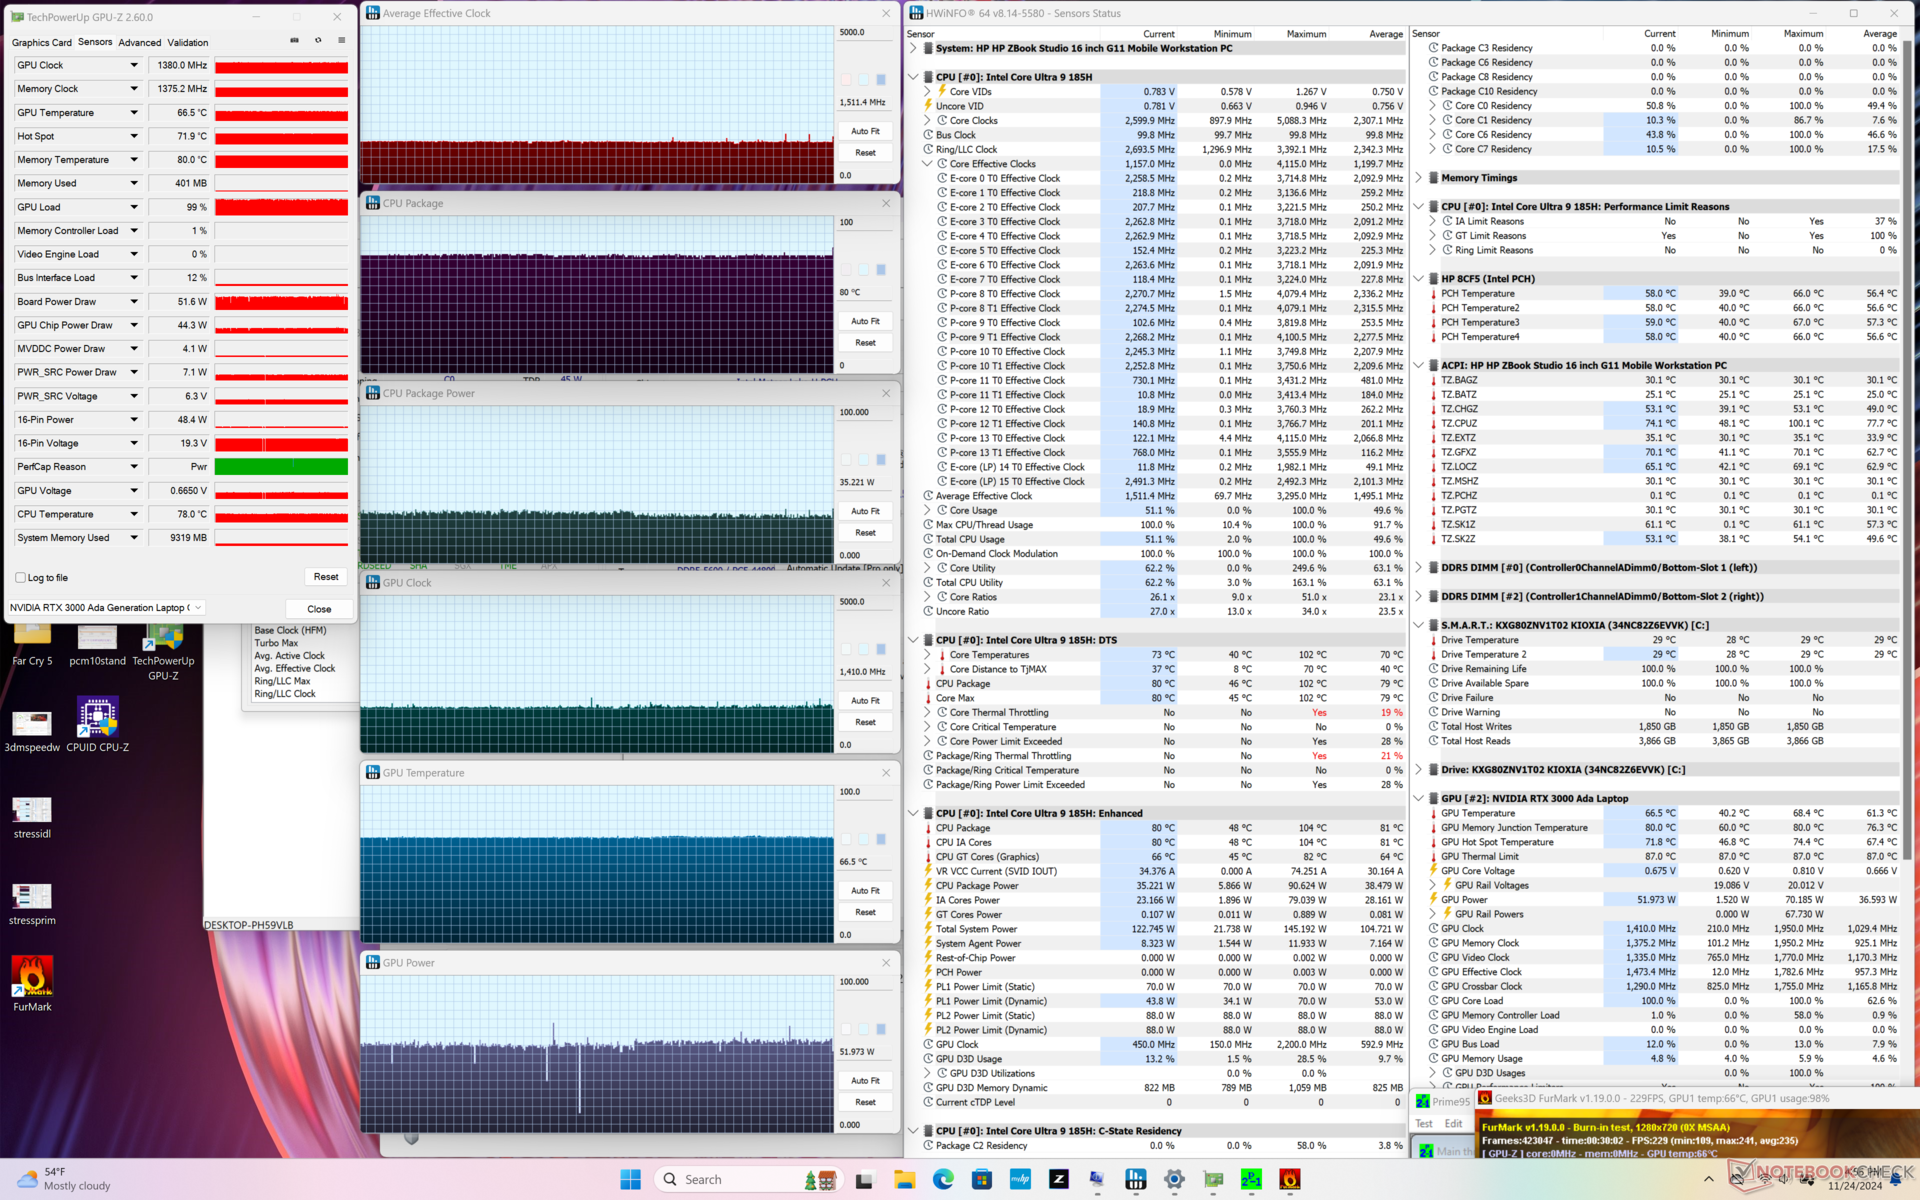
| Clock medio della CPU (GHz) | Clock della GPU (MHz) | Temperatura media della CPU (°C) | Temperatura media della GPU (°C) | |
| Sistema inattivo | -- | -- | 51 | 45 |
| Stress Prime95 | 2,3 | -- | 99 | 54 |
| Prime95 + FurMark Stress | 1,5 | 1410 | 80 | 67 |
| Cyberpunk 2077 Stress | 1.0 | 1950 | 68 | 70 |
Prestazioni del sistema
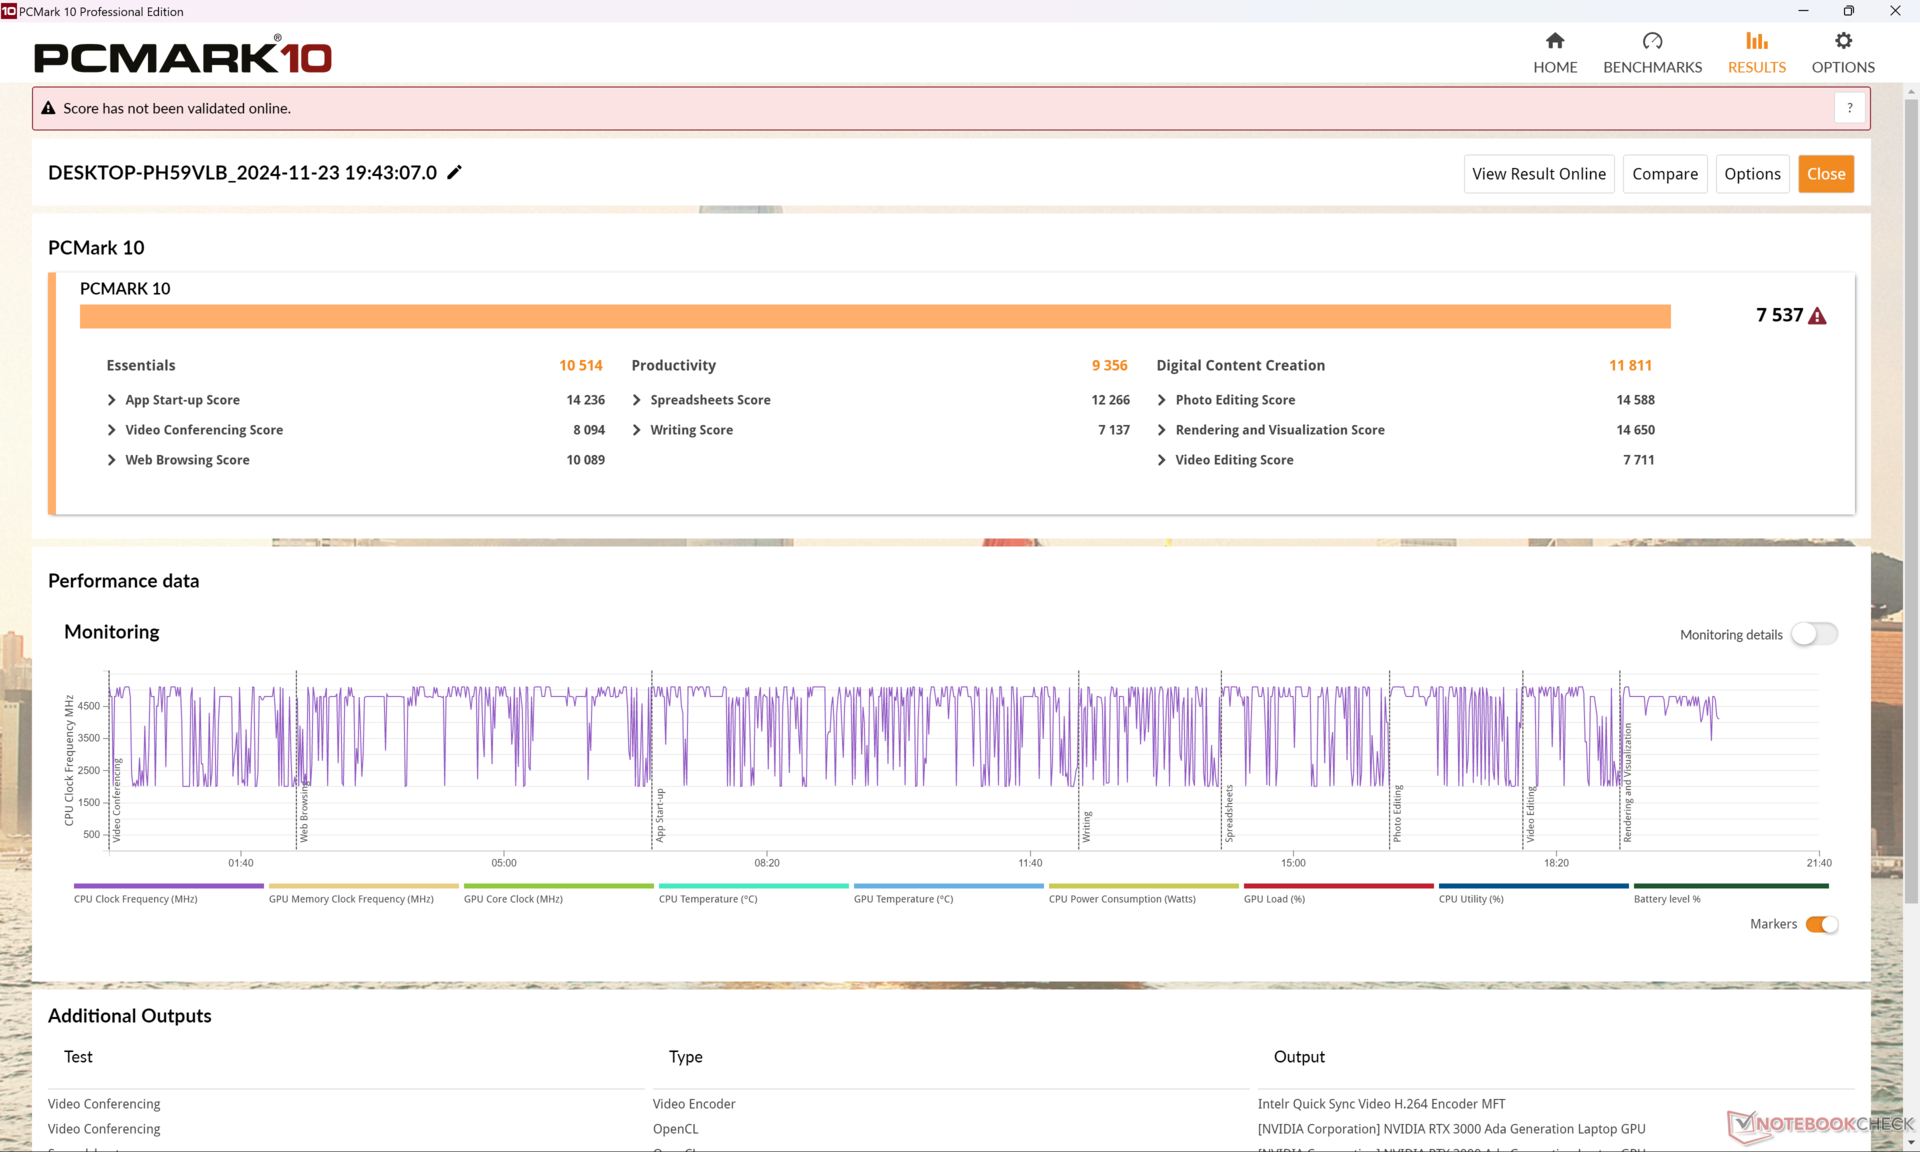
I punteggi PCMark sono costantemente superiori a quelli dell'uscente ZBook Studio 16 G9, grazie ai miglioramenti della CPU e della GPU. Tuttavia, vale la pena di notare che durante i test abbiamo riscontrato diversi blocchi e schermate nere che richiedevano ogni volta un riavvio.
CrossMark: Overall | Productivity | Creativity | Responsiveness
WebXPRT 3: Overall
WebXPRT 4: Overall
Mozilla Kraken 1.1: Total
| PCMark 10 / Score | |
| Lenovo ThinkPad P16 Gen 2 | |
| Dell Precision 5690 | |
| HP ZBook Studio 16 G11 | |
| Media Intel Core Ultra 9 185H, NVIDIA RTX 3000 Ada Generation Laptop (7383 - 7537, n=2) | |
| HP ZBook Power 16 G11 A | |
| Lenovo ThinkPad P1 Gen 7 21KV001SGE | |
| MSI CreatorPro Z16P B12UKST | |
| HP ZBook Studio 16 G9 62U04EA | |
| PCMark 10 / Essentials | |
| Lenovo ThinkPad P16 Gen 2 | |
| Dell Precision 5690 | |
| Media Intel Core Ultra 9 185H, NVIDIA RTX 3000 Ada Generation Laptop (10514 - 11137, n=2) | |
| MSI CreatorPro Z16P B12UKST | |
| HP ZBook Studio 16 G11 | |
| HP ZBook Power 16 G11 A | |
| Lenovo ThinkPad P1 Gen 7 21KV001SGE | |
| HP ZBook Studio 16 G9 62U04EA | |
| PCMark 10 / Productivity | |
| Dell Precision 5690 | |
| Lenovo ThinkPad P16 Gen 2 | |
| HP ZBook Power 16 G11 A | |
| HP ZBook Studio 16 G11 | |
| MSI CreatorPro Z16P B12UKST | |
| Media Intel Core Ultra 9 185H, NVIDIA RTX 3000 Ada Generation Laptop (9153 - 9356, n=2) | |
| Lenovo ThinkPad P1 Gen 7 21KV001SGE | |
| HP ZBook Studio 16 G9 62U04EA | |
| PCMark 10 / Digital Content Creation | |
| Lenovo ThinkPad P16 Gen 2 | |
| Dell Precision 5690 | |
| HP ZBook Studio 16 G11 | |
| Lenovo ThinkPad P1 Gen 7 21KV001SGE | |
| Media Intel Core Ultra 9 185H, NVIDIA RTX 3000 Ada Generation Laptop (10716 - 11811, n=2) | |
| HP ZBook Power 16 G11 A | |
| MSI CreatorPro Z16P B12UKST | |
| HP ZBook Studio 16 G9 62U04EA | |
| CrossMark / Overall | |
| Lenovo ThinkPad P16 Gen 2 | |
| MSI CreatorPro Z16P B12UKST | |
| HP ZBook Studio 16 G9 62U04EA | |
| Dell Precision 5690 | |
| HP ZBook Power 16 G11 A | |
| HP ZBook Studio 16 G11 | |
| Media Intel Core Ultra 9 185H, NVIDIA RTX 3000 Ada Generation Laptop (1754 - 1770, n=2) | |
| Lenovo ThinkPad P1 Gen 7 21KV001SGE | |
| CrossMark / Productivity | |
| Lenovo ThinkPad P16 Gen 2 | |
| MSI CreatorPro Z16P B12UKST | |
| Dell Precision 5690 | |
| HP ZBook Studio 16 G9 62U04EA | |
| HP ZBook Power 16 G11 A | |
| HP ZBook Studio 16 G11 | |
| Media Intel Core Ultra 9 185H, NVIDIA RTX 3000 Ada Generation Laptop (1643 - 1686, n=2) | |
| Lenovo ThinkPad P1 Gen 7 21KV001SGE | |
| CrossMark / Creativity | |
| Lenovo ThinkPad P16 Gen 2 | |
| HP ZBook Studio 16 G9 62U04EA | |
| MSI CreatorPro Z16P B12UKST | |
| HP ZBook Power 16 G11 A | |
| Dell Precision 5690 | |
| Media Intel Core Ultra 9 185H, NVIDIA RTX 3000 Ada Generation Laptop (1981 - 2001, n=2) | |
| HP ZBook Studio 16 G11 | |
| Lenovo ThinkPad P1 Gen 7 21KV001SGE | |
| CrossMark / Responsiveness | |
| MSI CreatorPro Z16P B12UKST | |
| Lenovo ThinkPad P16 Gen 2 | |
| HP ZBook Studio 16 G9 62U04EA | |
| Dell Precision 5690 | |
| HP ZBook Studio 16 G11 | |
| Media Intel Core Ultra 9 185H, NVIDIA RTX 3000 Ada Generation Laptop (1438 - 1458, n=2) | |
| HP ZBook Power 16 G11 A | |
| Lenovo ThinkPad P1 Gen 7 21KV001SGE | |
| WebXPRT 3 / Overall | |
| Lenovo ThinkPad P16 Gen 2 | |
| MSI CreatorPro Z16P B12UKST | |
| HP ZBook Power 16 G11 A | |
| HP ZBook Studio 16 G9 62U04EA | |
| HP ZBook Studio 16 G11 | |
| Dell Precision 5690 | |
| Media Intel Core Ultra 9 185H, NVIDIA RTX 3000 Ada Generation Laptop (286 - 295, n=2) | |
| Lenovo ThinkPad P1 Gen 7 21KV001SGE | |
| WebXPRT 4 / Overall | |
| Lenovo ThinkPad P16 Gen 2 | |
| Dell Precision 5690 | |
| MSI CreatorPro Z16P B12UKST | |
| HP ZBook Studio 16 G9 62U04EA | |
| Media Intel Core Ultra 9 185H, NVIDIA RTX 3000 Ada Generation Laptop (261 - 268, n=2) | |
| HP ZBook Studio 16 G11 | |
| Lenovo ThinkPad P1 Gen 7 21KV001SGE | |
| HP ZBook Power 16 G11 A | |
| Mozilla Kraken 1.1 / Total | |
| HP ZBook Power 16 G11 A | |
| Lenovo ThinkPad P1 Gen 7 21KV001SGE | |
| MSI CreatorPro Z16P B12UKST | |
| Media Intel Core Ultra 9 185H, NVIDIA RTX 3000 Ada Generation Laptop (515 - 522, n=2) | |
| HP ZBook Studio 16 G11 | |
| HP ZBook Studio 16 G9 62U04EA | |
| Dell Precision 5690 | |
| Lenovo ThinkPad P16 Gen 2 | |
* ... Meglio usare valori piccoli
| PCMark 10 Score | 7537 punti | |
Aiuto | ||
| AIDA64 / Memory Copy | |
| Dell Precision 5690 | |
| Media Intel Core Ultra 9 185H (69929 - 95718, n=20) | |
| HP ZBook Studio 16 G11 | |
| Lenovo ThinkPad P1 Gen 7 21KV001SGE | |
| Lenovo ThinkPad P16 Gen 2 | |
| MSI CreatorPro Z16P B12UKST | |
| HP ZBook Studio 16 G9 62U04EA | |
| HP ZBook Power 16 G11 A | |
| AIDA64 / Memory Read | |
| Dell Precision 5690 | |
| HP ZBook Studio 16 G11 | |
| Media Intel Core Ultra 9 185H (64619 - 87768, n=20) | |
| Lenovo ThinkPad P16 Gen 2 | |
| MSI CreatorPro Z16P B12UKST | |
| HP ZBook Studio 16 G9 62U04EA | |
| Lenovo ThinkPad P1 Gen 7 21KV001SGE | |
| HP ZBook Power 16 G11 A | |
| AIDA64 / Memory Write | |
| HP ZBook Power 16 G11 A | |
| HP ZBook Studio 16 G11 | |
| Dell Precision 5690 | |
| Media Intel Core Ultra 9 185H (51114 - 93871, n=20) | |
| MSI CreatorPro Z16P B12UKST | |
| HP ZBook Studio 16 G9 62U04EA | |
| Lenovo ThinkPad P16 Gen 2 | |
| Lenovo ThinkPad P1 Gen 7 21KV001SGE | |
| AIDA64 / Memory Latency | |
| Media Intel Core Ultra 9 185H (121.4 - 259, n=20) | |
| Dell Precision 5690 | |
| Lenovo ThinkPad P1 Gen 7 21KV001SGE | |
| HP ZBook Studio 16 G11 | |
| HP ZBook Power 16 G11 A | |
| MSI CreatorPro Z16P B12UKST | |
| Lenovo ThinkPad P16 Gen 2 | |
| HP ZBook Studio 16 G9 62U04EA | |
* ... Meglio usare valori piccoli
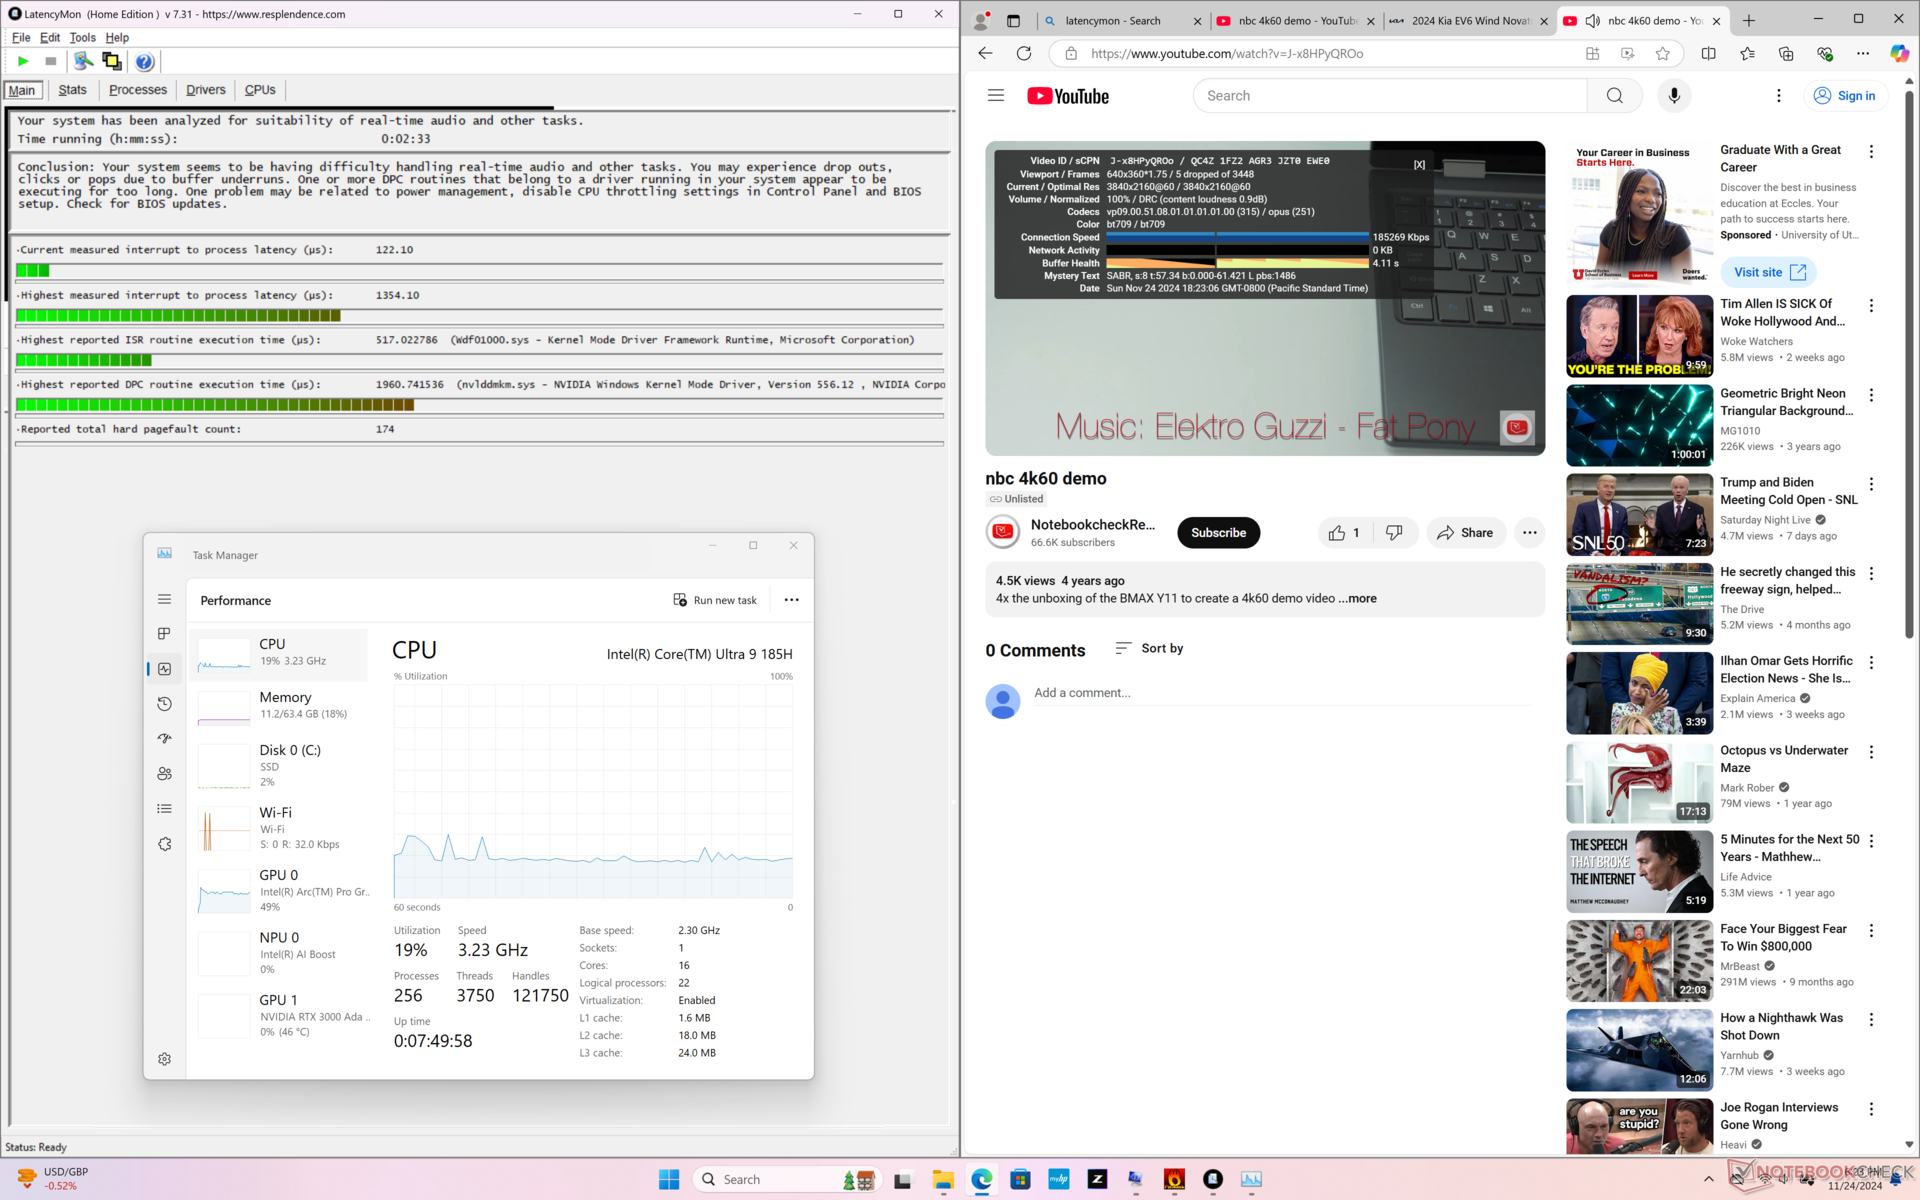
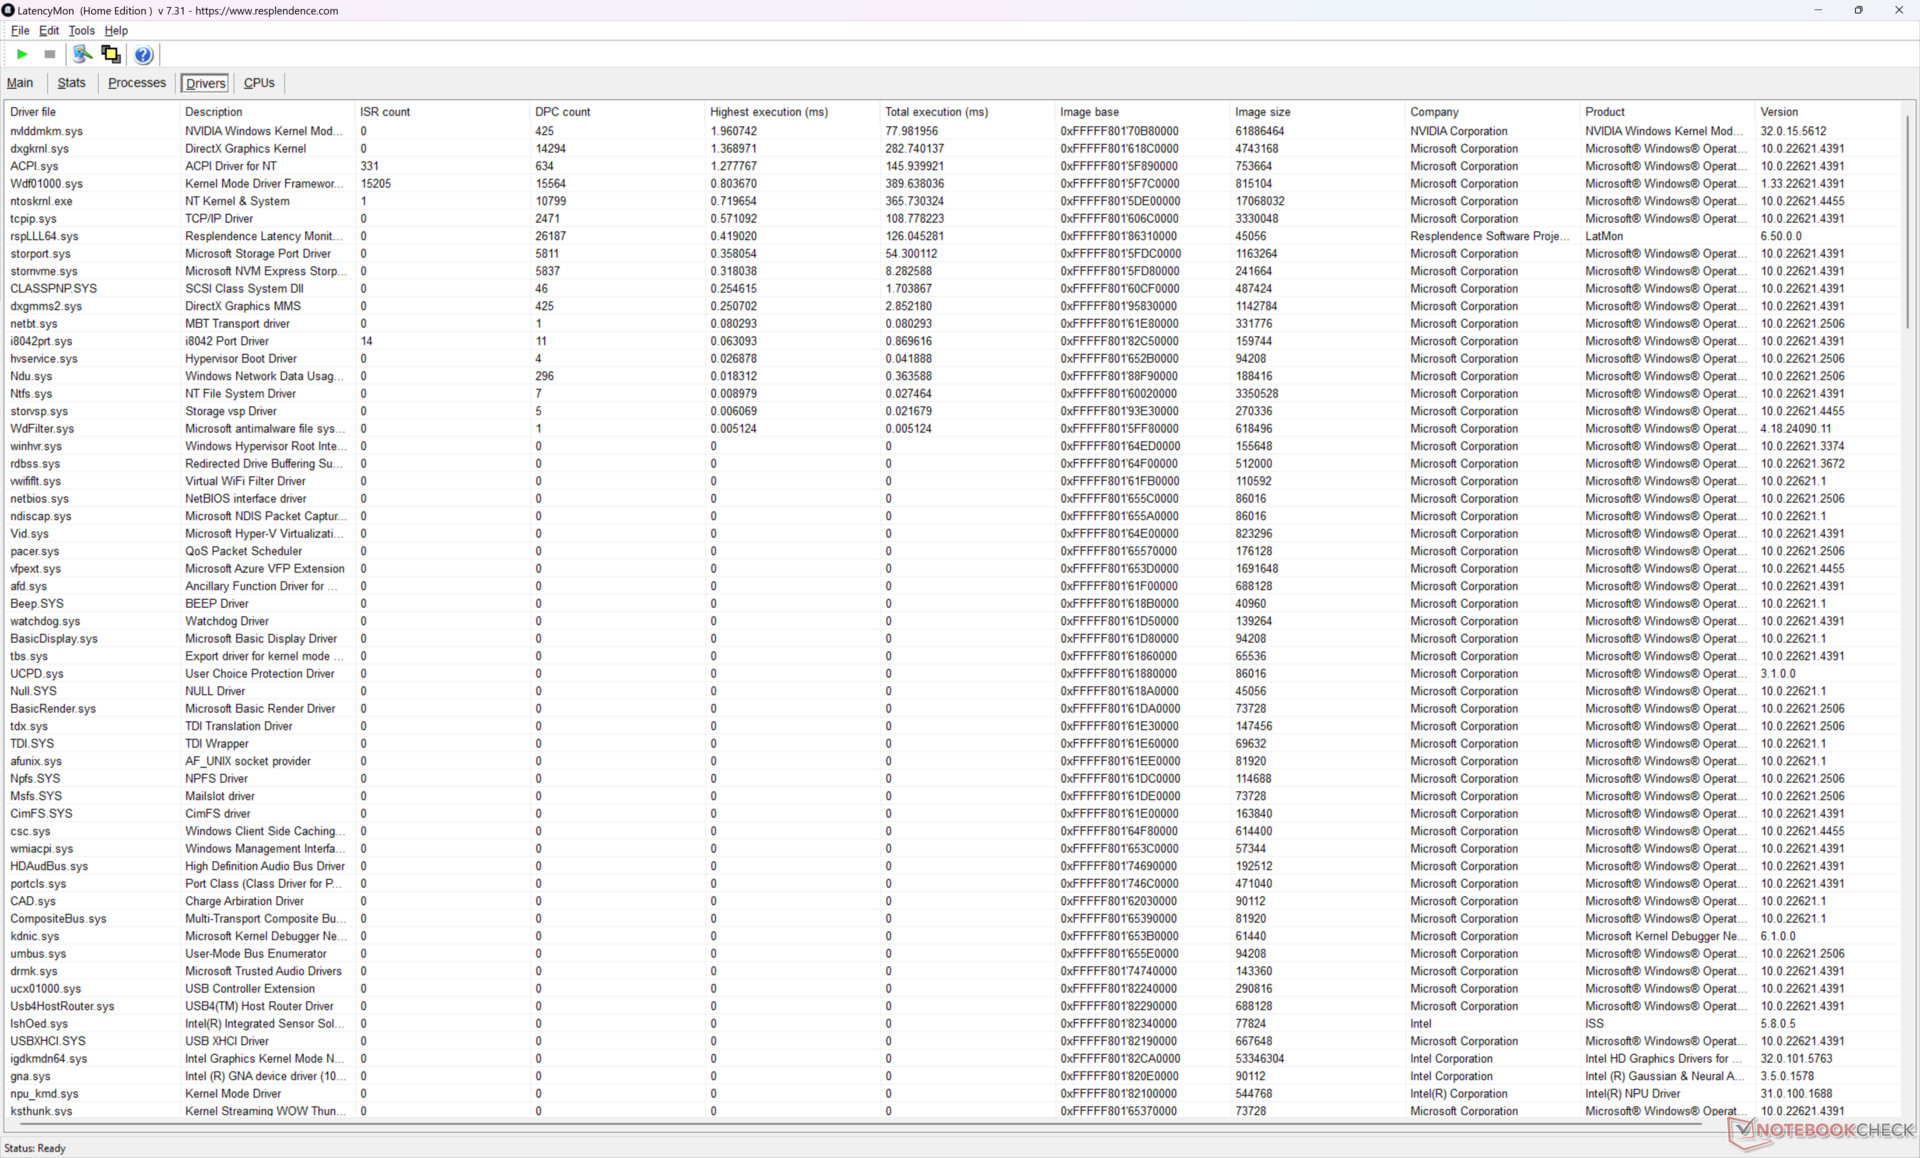
Latenza DPC
LatencyMon rivela problemi DPC minori quando si aprono più schede del browser della nostra homepage. anche la riproduzione di video 4K a 60 FPS presentava problemi minori, con 5 fotogrammi caduti registrati in una finestra di 60 secondi.
| DPC Latencies / LatencyMon - interrupt to process latency (max), Web, Youtube, Prime95 | |
| HP ZBook Power 16 G11 A | |
| Lenovo ThinkPad P1 Gen 7 21KV001SGE | |
| HP ZBook Studio 16 G11 | |
| HP ZBook Studio 16 G9 62U04EA | |
| Lenovo ThinkPad P16 Gen 2 | |
| MSI CreatorPro Z16P B12UKST | |
| Dell Precision 5690 | |
* ... Meglio usare valori piccoli
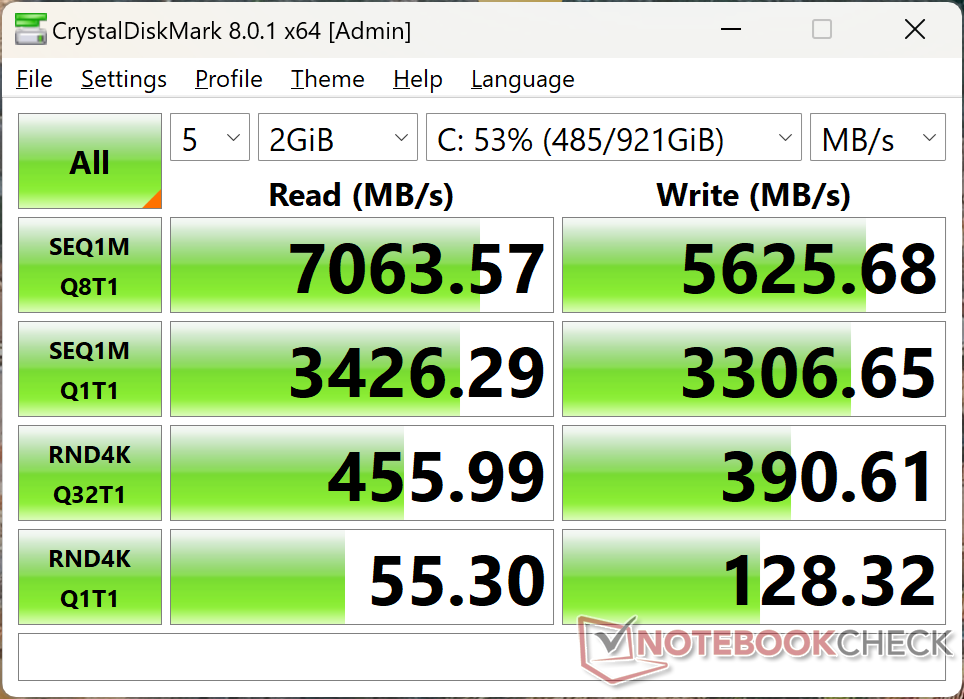
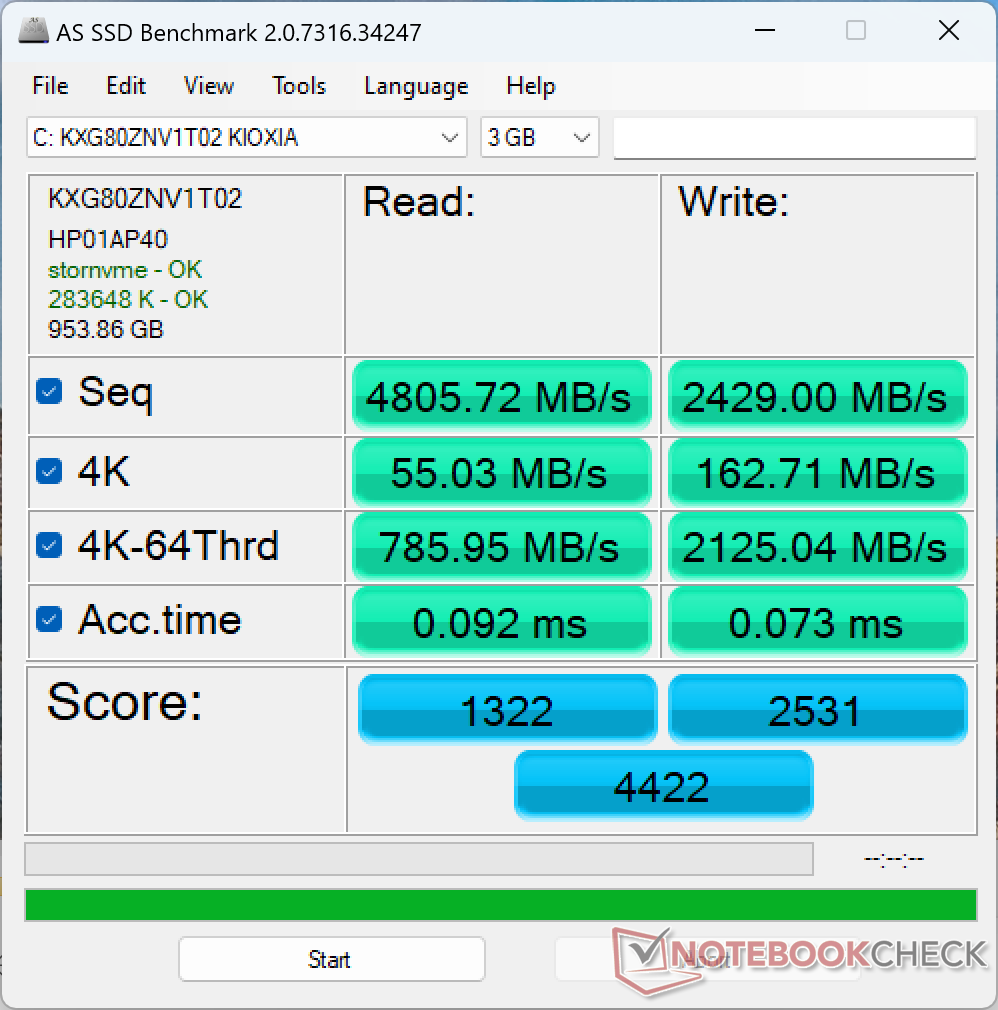
Dispositivi di archiviazione
Il nostro sistema viene fornito con un Kioxia XG8 PCIe4 NVMe al posto dell'unità Micron 3400 presente sul vecchio ZBook Studio 16 G9. Le prestazioni sono comunque eccellenti e non sono stati rilevati problemi di throttling.

* ... Meglio usare valori piccoli
Disk Throttling: DiskSpd Read Loop, Queue Depth 8
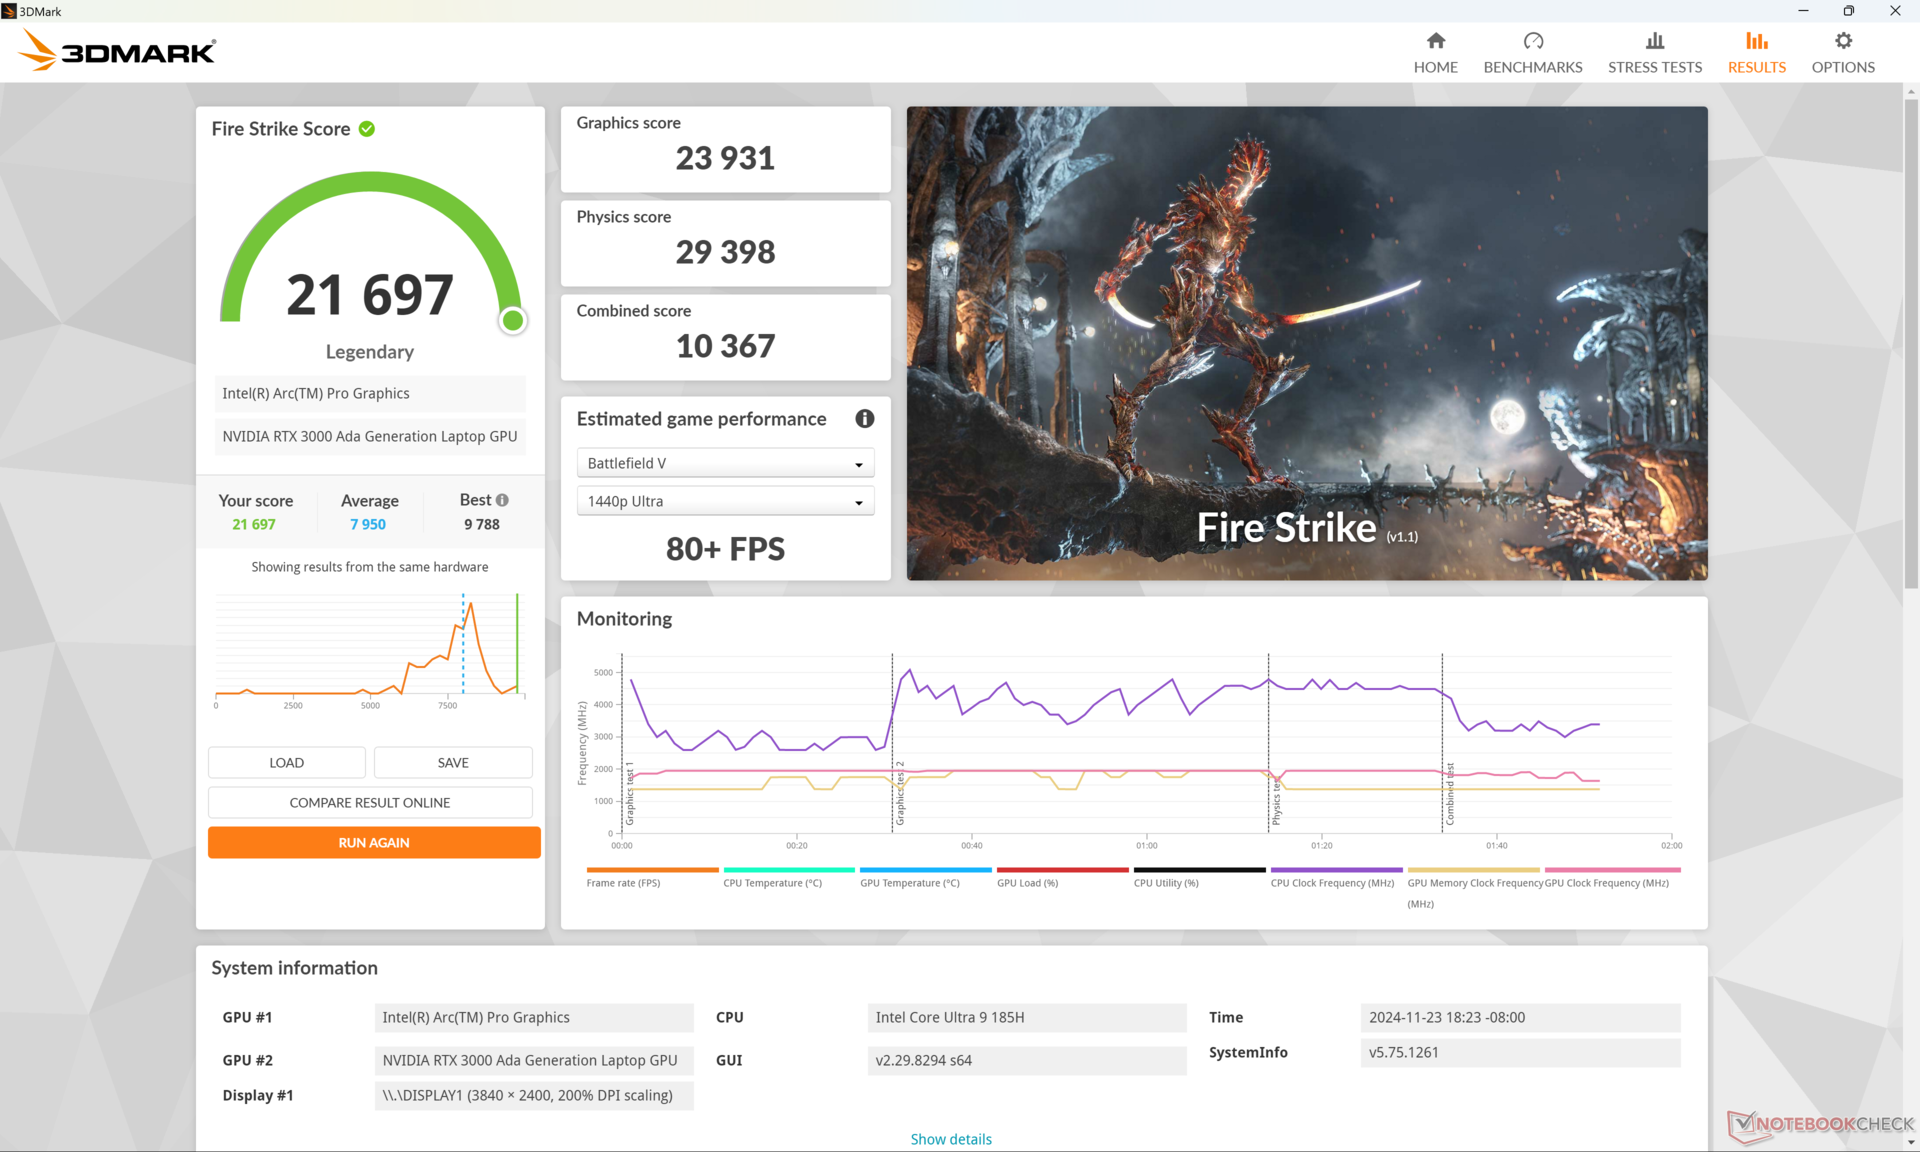
Prestazioni della GPU
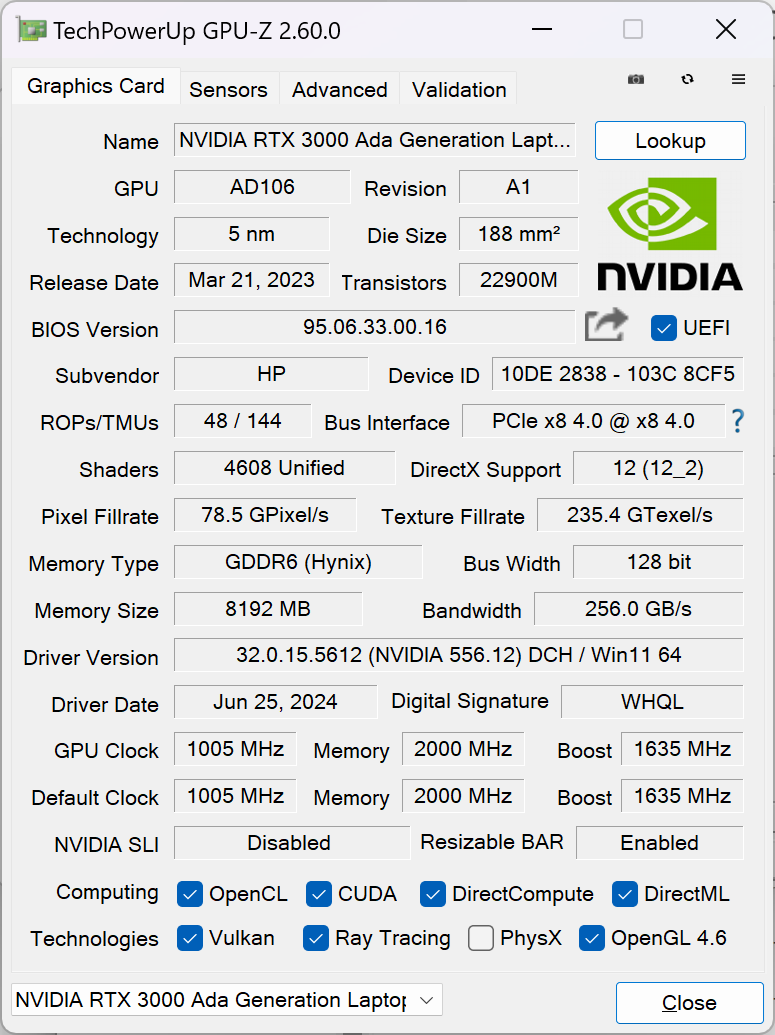
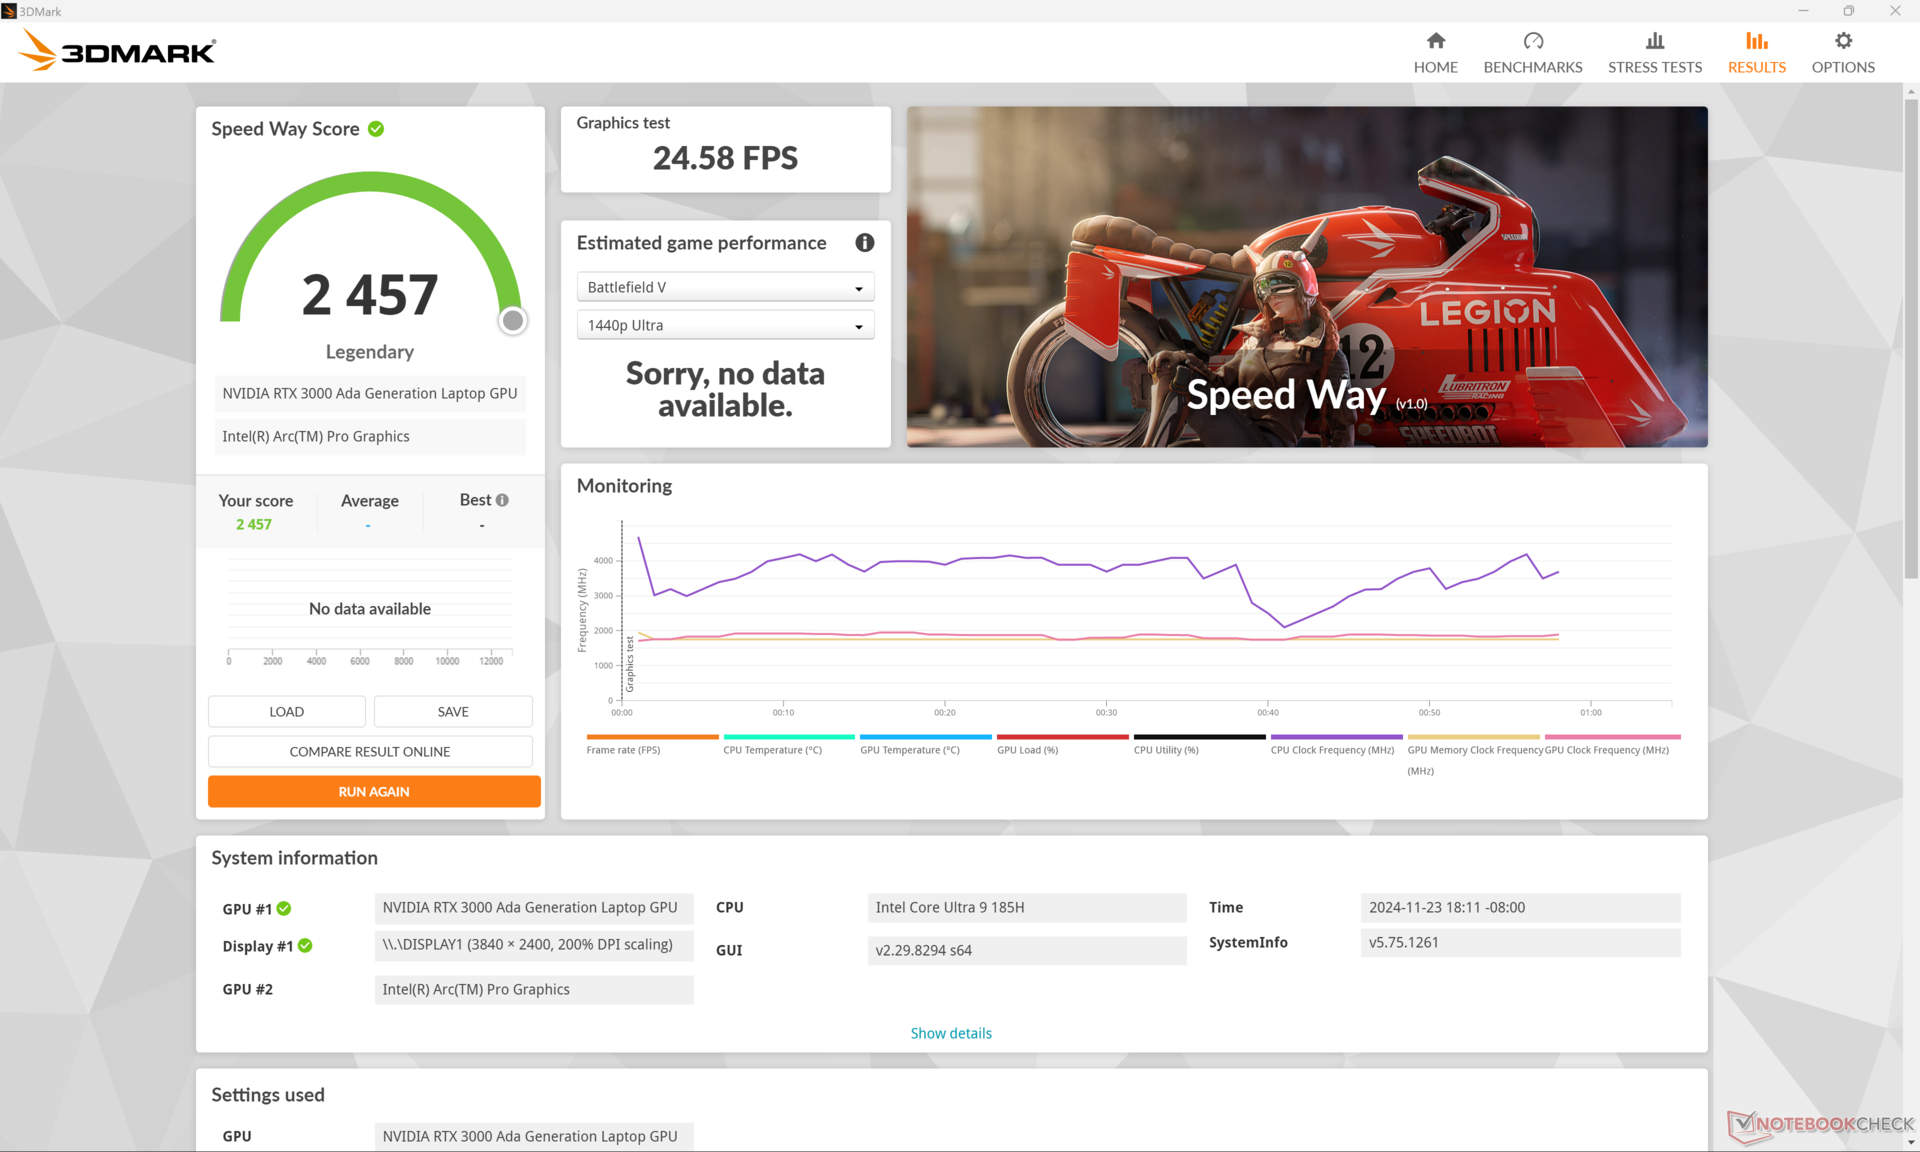
La nuova GPU è uno dei motivi principali per passare dallo ZBook Studio 16 G9 allo ZBook Studio 16 G11. Il nostro RTX 3000 Ada ha prestazioni quasi due volte più veloci rispetto alla RTX A2000 prima di tenere conto delle funzioni di accelerazione ray-tracing.
| Profilo di potenza | Punteggio grafico | Punteggio di fisica | Punteggio combinato |
| Modalità Prestazioni | 23931 | 29398 | 10367 |
| Modalità equilibrata | 21021 (-12%) | 27903 (-5%) | 8545 (-18%) |
| Alimentazione a batteria | 14313 (-40%) | 12099 (-59%) | 5174 (-50%) |
L'esecuzione in modalità Bilanciata influisce leggermente sulle prestazioni, come mostrano i risultati di Fire Strike qui sopra. La differenza diventa molto più marcata se invece si utilizza l'alimentazione a batteria.
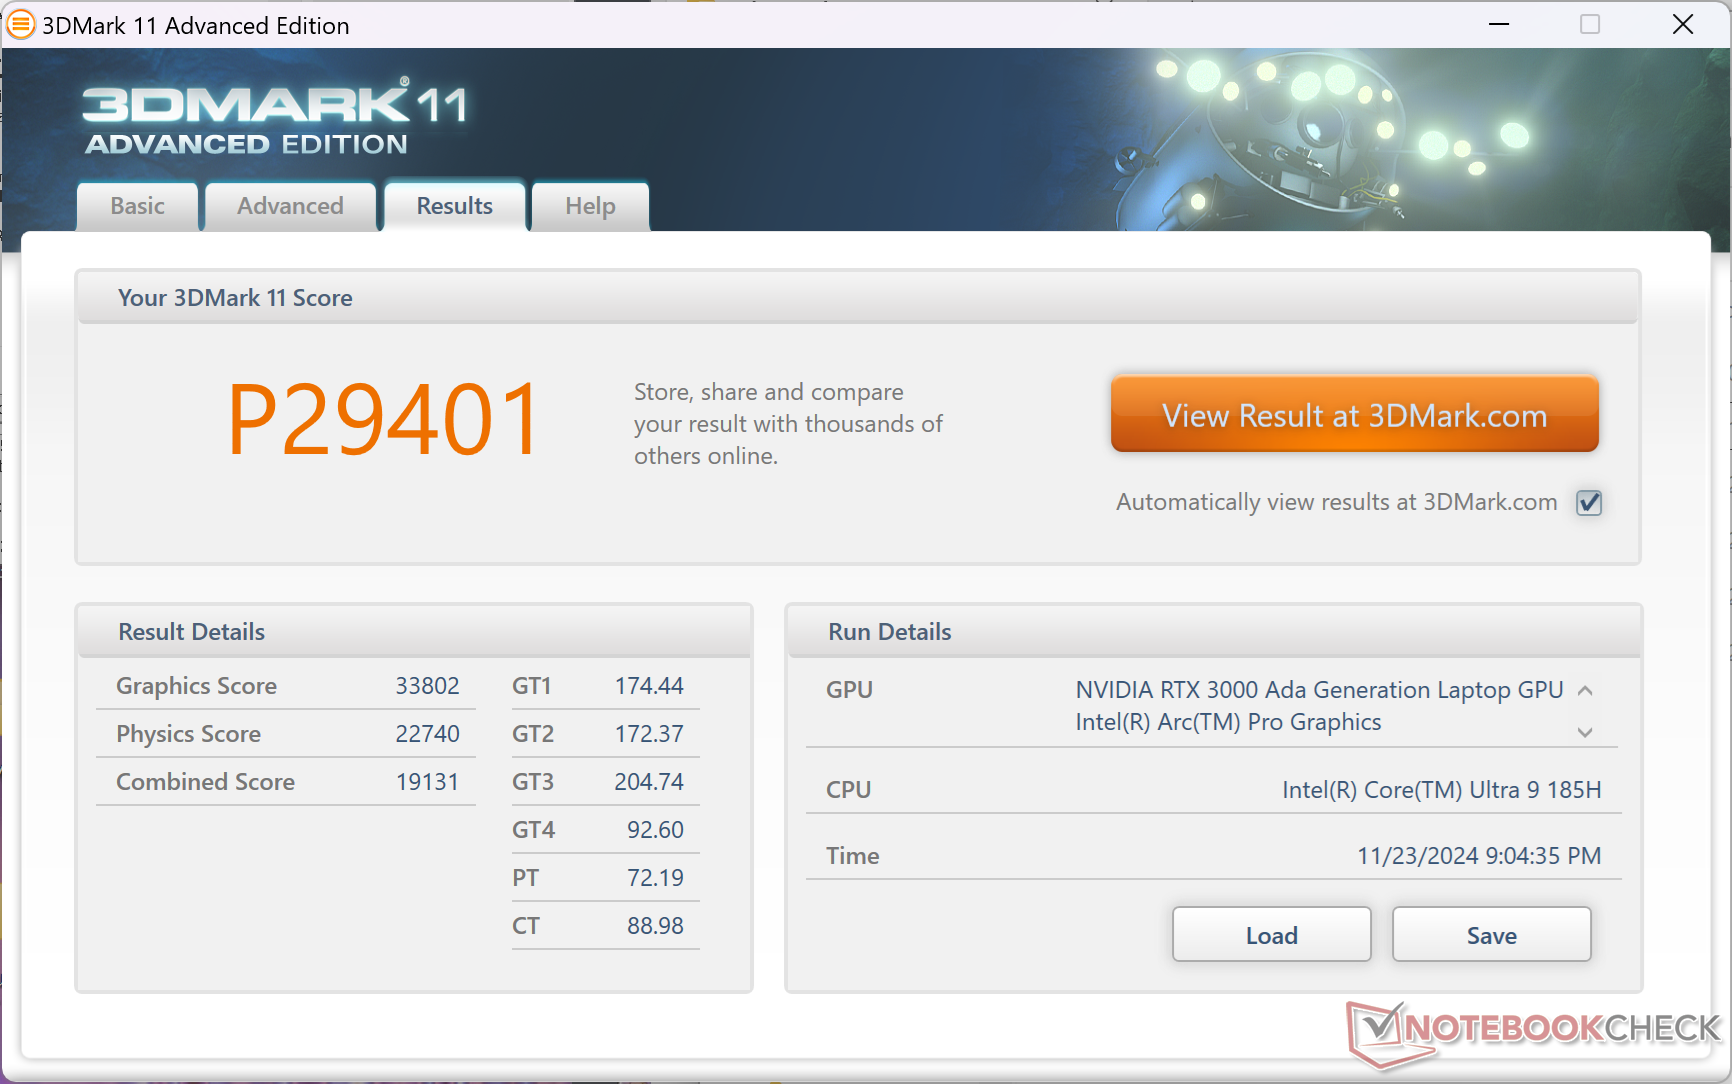
| 3DMark 11 Performance | 29401 punti | |
| 3DMark Cloud Gate Standard Score | 34703 punti | |
| 3DMark Fire Strike Score | 21697 punti | |
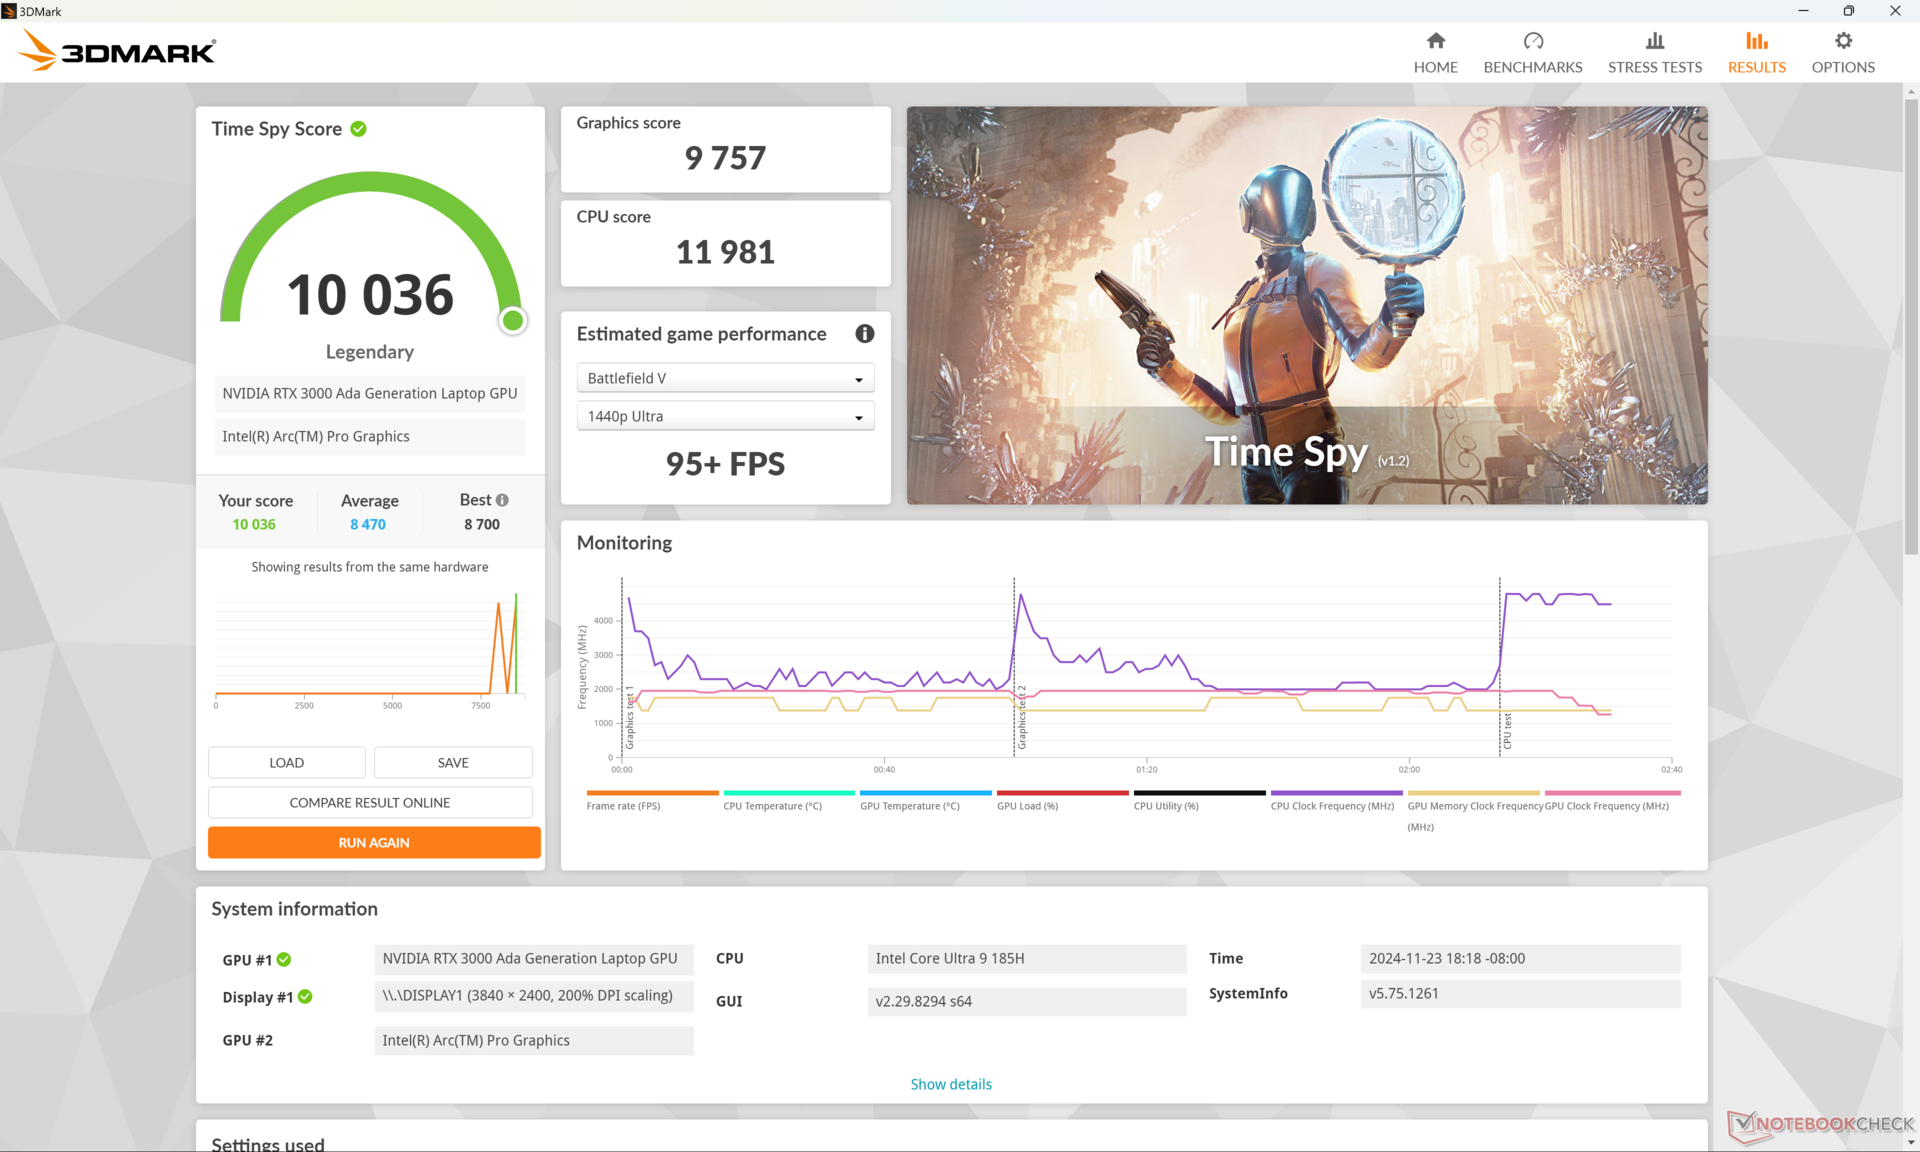
| 3DMark Time Spy Score | 10036 punti | |
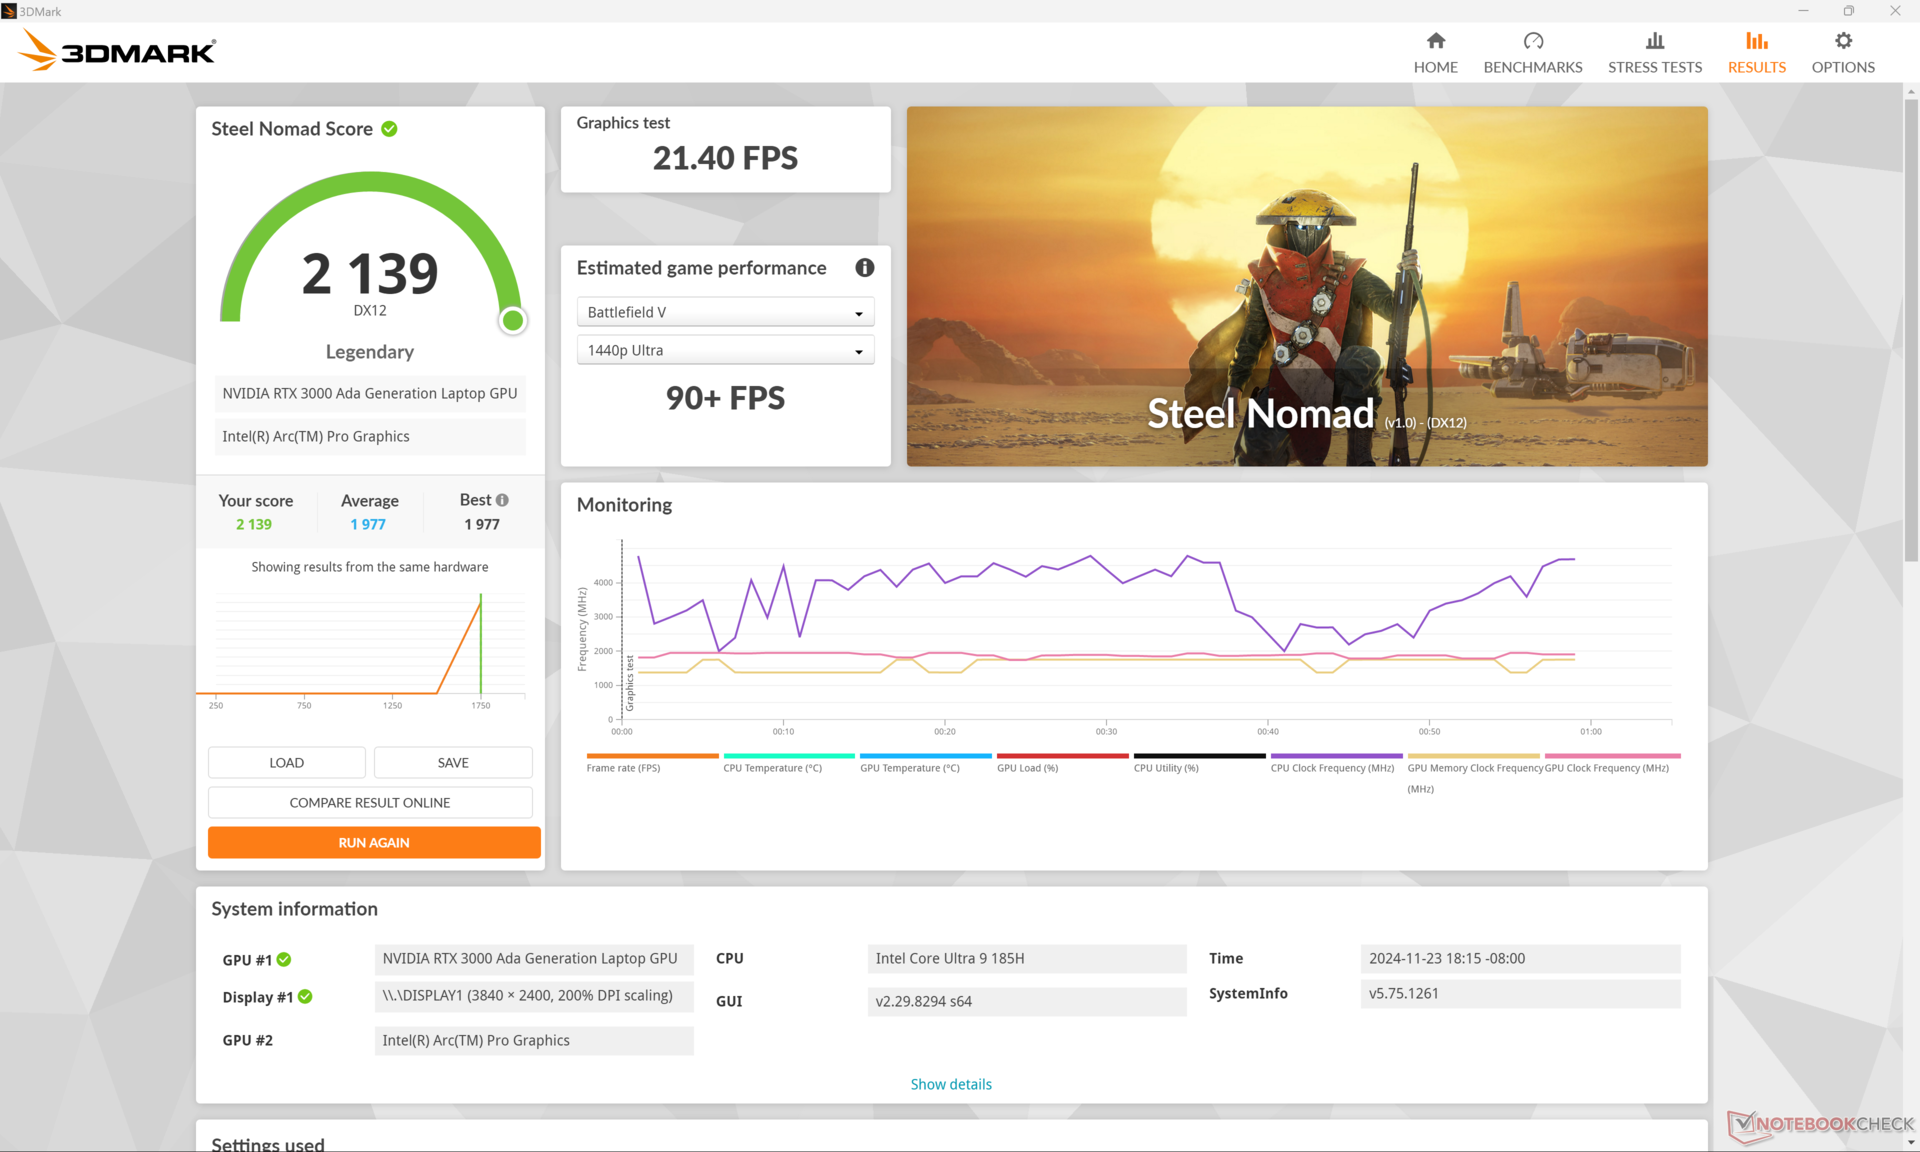
| 3DMark Steel Nomad Score | 2139 punti | |
Aiuto | ||
* ... Meglio usare valori piccoli
| Performance rating - Percent | |
| Lenovo ThinkPad P16 Gen 2 | |
| Dell Precision 5690 -1! | |
| HP ZBook Studio 16 G11 | |
| MSI CreatorPro Z16P B12UKST -2! | |
| HP ZBook Studio 16 G9 62U04EA -2! | |
| HP ZBook Power 16 G11 A | |
| Cyberpunk 2077 - 1920x1080 Ultra Preset (FSR off) | |
| Dell Precision 5690 | |
| Lenovo ThinkPad P16 Gen 2 | |
| HP ZBook Studio 16 G11 | |
| HP ZBook Power 16 G11 A | |
| Baldur's Gate 3 - 1920x1080 Ultra Preset AA:T | |
| Lenovo ThinkPad P16 Gen 2 | |
| Dell Precision 5690 | |
| HP ZBook Studio 16 G11 | |
| HP ZBook Power 16 G11 A | |
| GTA V - 1920x1080 Highest AA:4xMSAA + FX AF:16x | |
| Lenovo ThinkPad P16 Gen 2 | |
| HP ZBook Studio 16 G11 | |
| MSI CreatorPro Z16P B12UKST | |
| HP ZBook Power 16 G11 A | |
| HP ZBook Studio 16 G9 62U04EA | |
| Final Fantasy XV Benchmark - 1920x1080 High Quality | |
| Lenovo ThinkPad P16 Gen 2 | |
| Dell Precision 5690 | |
| HP ZBook Studio 16 G11 | |
| HP ZBook Power 16 G11 A | |
| MSI CreatorPro Z16P B12UKST | |
| HP ZBook Studio 16 G9 62U04EA | |
| Strange Brigade - 1920x1080 ultra AA:ultra AF:16 | |
| Lenovo ThinkPad P16 Gen 2 | |
| Dell Precision 5690 | |
| HP ZBook Studio 16 G11 | |
| HP ZBook Power 16 G11 A | |
| MSI CreatorPro Z16P B12UKST | |
| HP ZBook Studio 16 G9 62U04EA | |
| Dota 2 Reborn - 1920x1080 ultra (3/3) best looking | |
| Lenovo ThinkPad P16 Gen 2 | |
| HP ZBook Studio 16 G9 62U04EA | |
| MSI CreatorPro Z16P B12UKST | |
| HP ZBook Studio 16 G11 | |
| Dell Precision 5690 | |
| HP ZBook Power 16 G11 A | |
| X-Plane 11.11 - 1920x1080 high (fps_test=3) | |
| Lenovo ThinkPad P16 Gen 2 | |
| MSI CreatorPro Z16P B12UKST | |
| HP ZBook Studio 16 G9 62U04EA | |
| Dell Precision 5690 | |
| HP ZBook Studio 16 G11 | |
| HP ZBook Power 16 G11 A | |
Le frequenze dei fotogrammi sono leggermente instabili quando sono al minimo su Cyberpunk 2077, anche dopo aver ripetuto i test.
Cyberpunk 2077 ultra FPS Chart
| basso | medio | alto | ultra | QHD | |
|---|---|---|---|---|---|
| GTA V (2015) | 182.2 | 176 | 163.2 | 96.6 | 76.1 |
| Dota 2 Reborn (2015) | 176.2 | 159.9 | 148.2 | 143.3 | |
| Final Fantasy XV Benchmark (2018) | 189.4 | 128.7 | 97 | 71.3 | |
| X-Plane 11.11 (2018) | 131.3 | 109.7 | 87.1 | ||
| Far Cry 5 (2018) | 154 | 133 | 130 | 118 | 93 |
| Strange Brigade (2018) | 415 | 246 | 192.8 | 172.6 | 118.6 |
| Tiny Tina's Wonderlands (2022) | 194 | 157.7 | 110 | 87.9 | 60.5 |
| F1 22 (2022) | 226 | 212 | 161.1 | 62.8 | 40.7 |
| Baldur's Gate 3 (2023) | 130.6 | 111.8 | 98.4 | 96.7 | 68.7 |
| Cyberpunk 2077 (2023) | 104.6 | 87.9 | 74.2 | 64.3 | 39.6 |
Emissioni
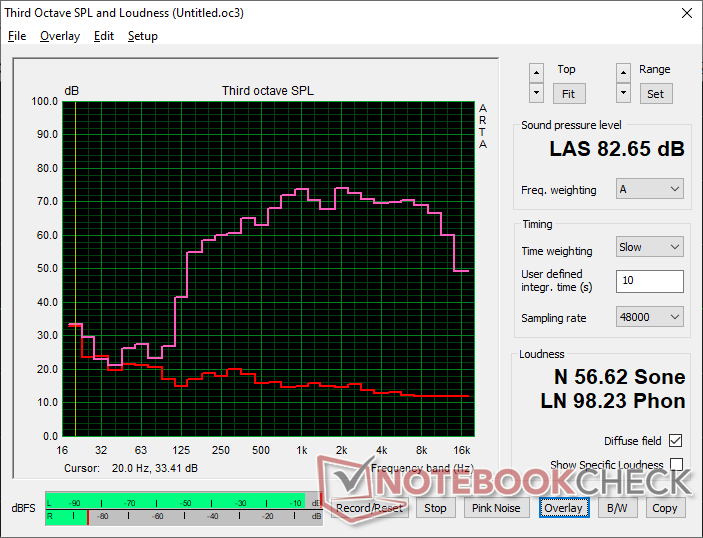
Rumore del sistema
Il rumore e il comportamento della ventola non sono cambiati in modo significativo rispetto al vecchio ZBook Studio 16 G9. Quando si eseguono carichi pesanti come i giochi, ad esempio, il rumore della ventola si stabilizza a circa 46-48 dB(A). Tuttavia, siamo in grado di registrare un massimo di 53 dB(A) sul modello G11 più recente, se la CPU e la GPU sono ugualmente sollecitate.
Rumorosità
| Idle |
| 23.8 / 26.4 / 26.4 dB(A) |
| Sotto carico |
| 33.7 / 53.2 dB(A) |
 | ||
30 dB silenzioso 40 dB(A) udibile 50 dB(A) rumoroso |
||
min: | ||
| HP ZBook Studio 16 G11 RTX 3000 Ada Generation Laptop, Ultra 9 185H, Kioxia XG8 KXG80ZNV1T02 | HP ZBook Studio 16 G9 62U04EA RTX A2000 Laptop GPU, i7-12800H, Micron 3400 1TB MTFDKBA1T0TFH | HP ZBook Power 16 G11 A RTX 2000 Ada Generation Laptop, R7 8845HS, Samsung PM9A1 MZVL22T0HBLB | Lenovo ThinkPad P16 Gen 2 RTX 4000 Ada Generation Laptop, i7-14700HX, SK hynix PC801 HFS001TEJ9X162N | Dell Precision 5690 RTX 5000 Ada Generation Laptop, Ultra 9 185H, 2x Samsung PM9A1 1TB (RAID 0) | MSI CreatorPro Z16P B12UKST RTX A3000 Laptop GPU, i7-12700H, Samsung PM9A1 MZVL21T0HCLR | Lenovo ThinkPad P1 Gen 7 21KV001SGE GeForce RTX 4060 Laptop GPU, Ultra 7 155H, Kioxia XG8 KXG8AZNV1T02 | |
|---|---|---|---|---|---|---|---|
| Noise | -3% | 9% | -11% | -4% | -6% | -6% | |
| off /ambiente * (dB) | 23.8 | 24 -1% | 23.5 1% | 23.9 -0% | 23.4 2% | 24.1 -1% | 24.7 -4% |
| Idle Minimum * (dB) | 23.8 | 24 -1% | 23.8 -0% | 29.1 -22% | 23.6 1% | 27.1 -14% | 24.7 -4% |
| Idle Average * (dB) | 26.4 | 27.7 -5% | 24.2 8% | 29.1 -10% | 24.9 6% | 27.1 -3% | 24.7 6% |
| Idle Maximum * (dB) | 26.4 | 27.7 -5% | 24.2 8% | 29.1 -10% | 30.9 -17% | 27.1 -3% | 24.7 6% |
| Load Average * (dB) | 33.7 | 39.8 -18% | 25.4 25% | 41 -22% | 40.4 -20% | 42.9 -27% | 43.7 -30% |
| Cyberpunk 2077 ultra * (dB) | 46.1 | 43 7% | 52.8 -15% | 53.2 -15% | |||
| Load Maximum * (dB) | 53.2 | 47.7 10% | 45 15% | 52.9 1% | 51.9 2% | 47 12% | 53.3 -0% |
| Witcher 3 ultra * (dB) | 44.3 | 48.3 | 44 |
* ... Meglio usare valori piccoli
Temperatura
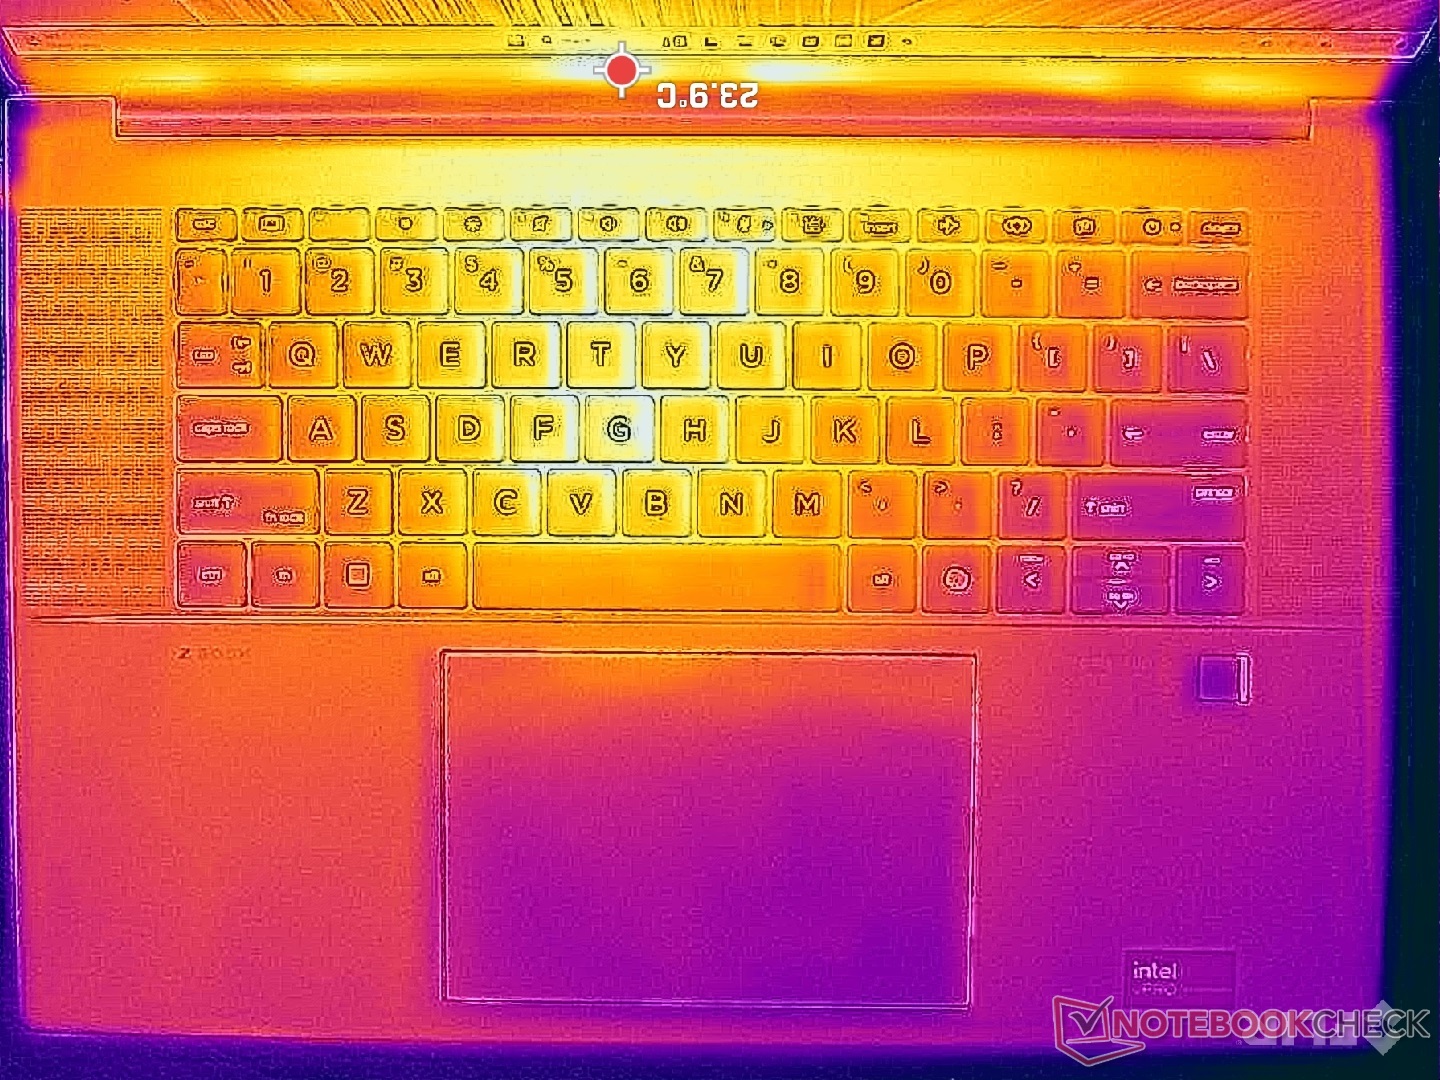
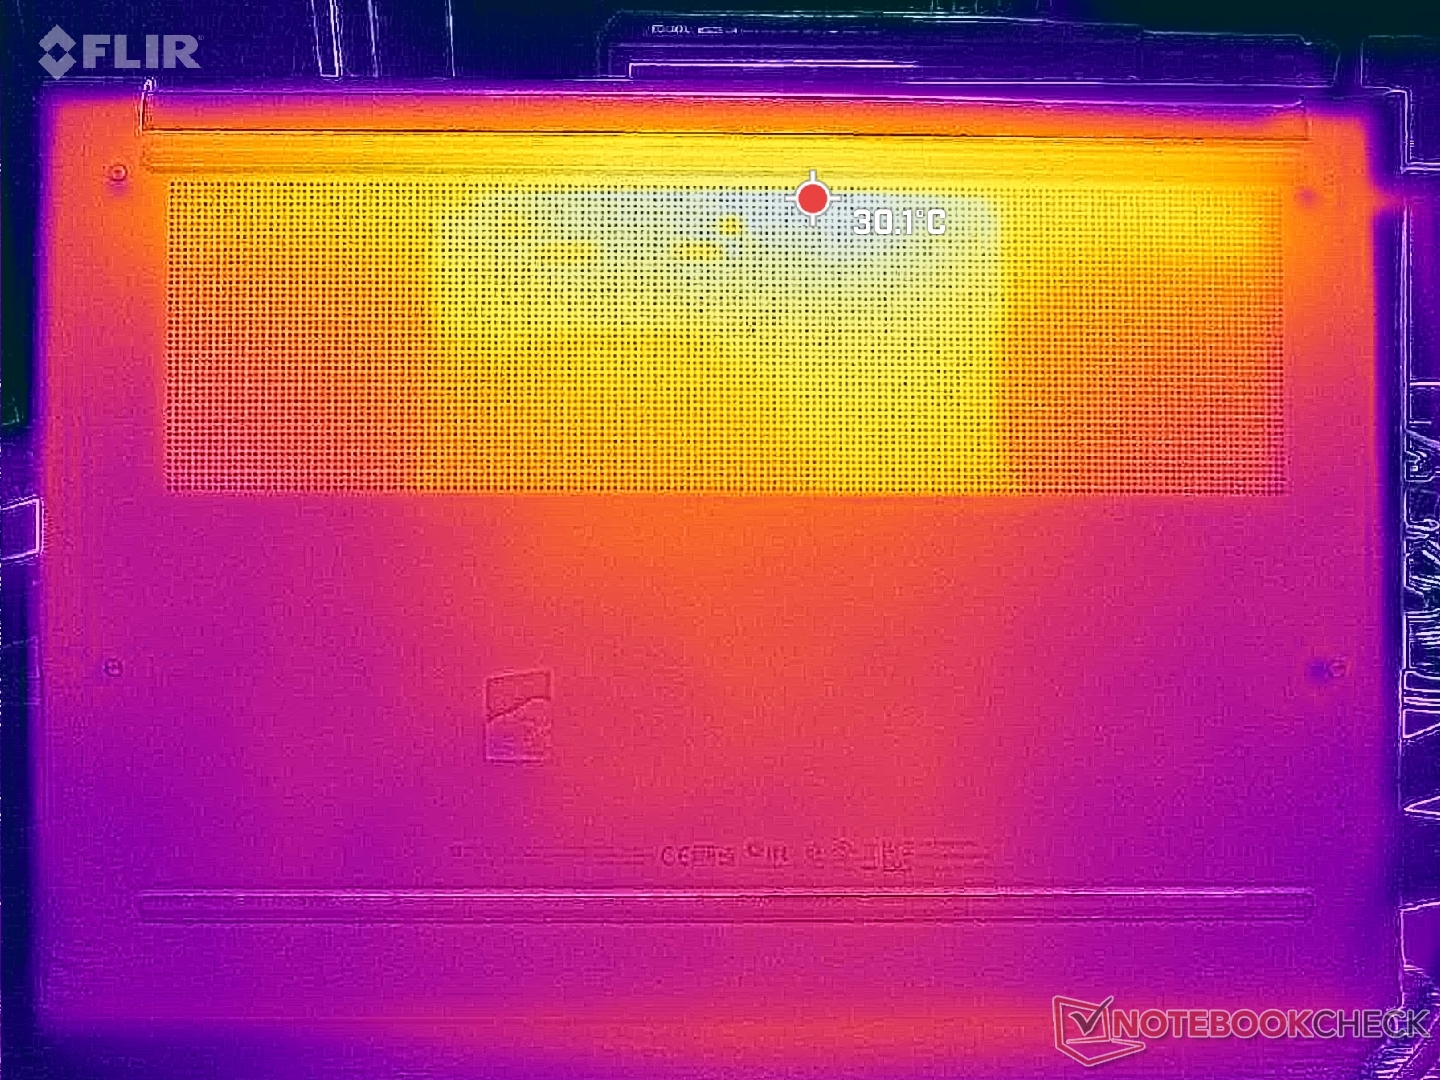
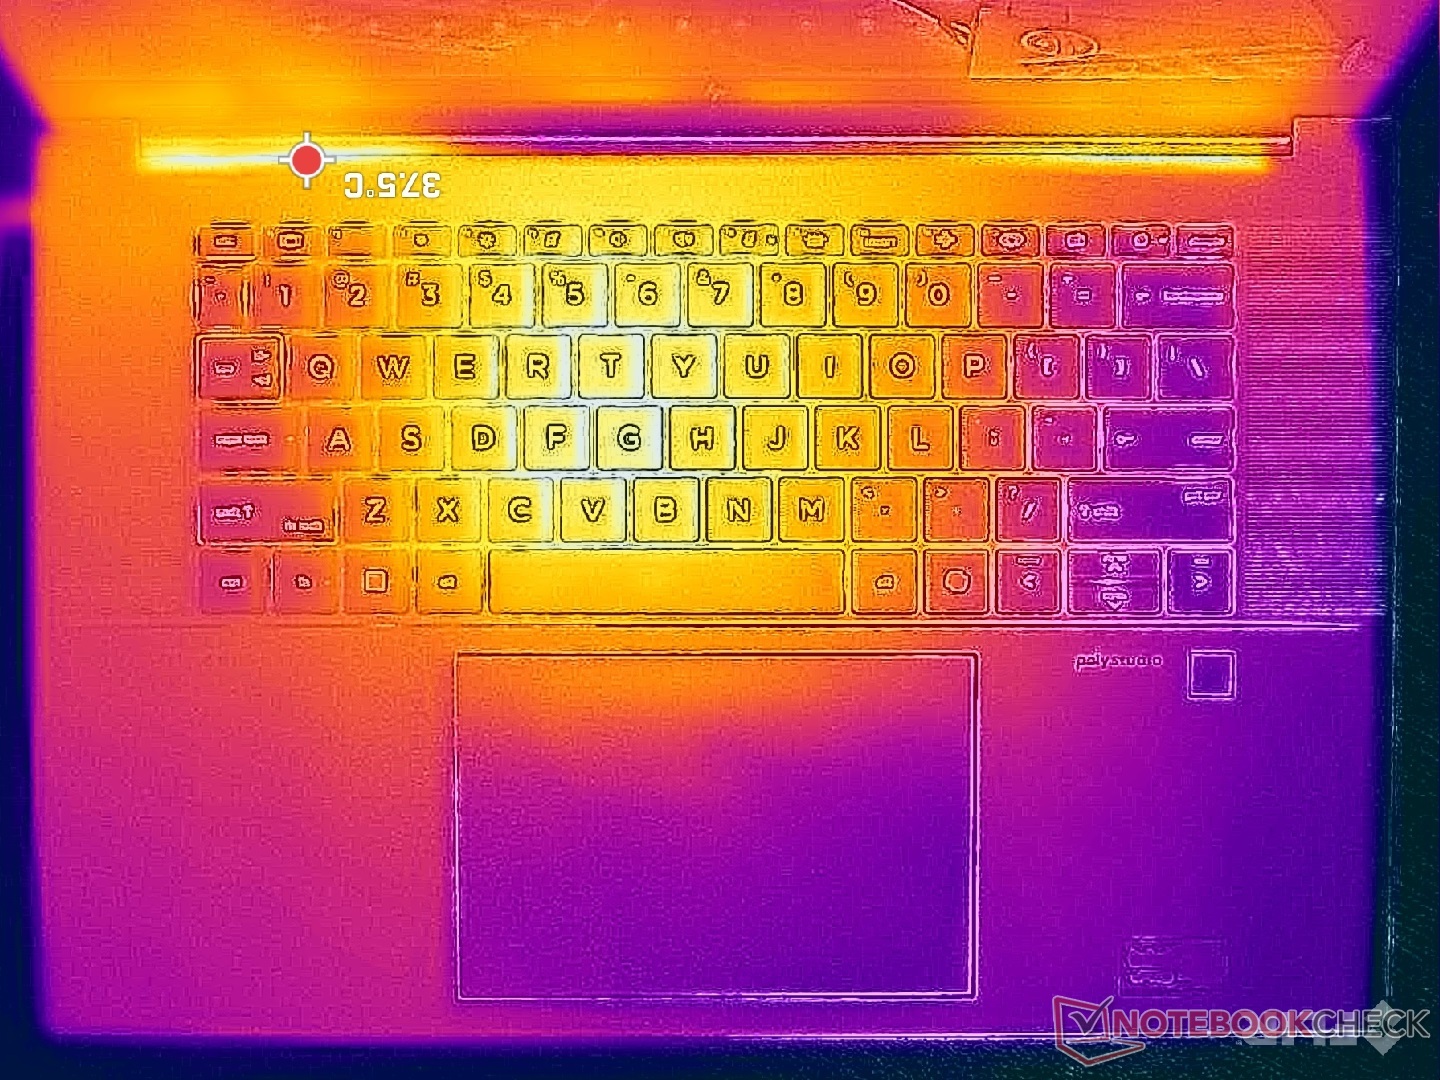
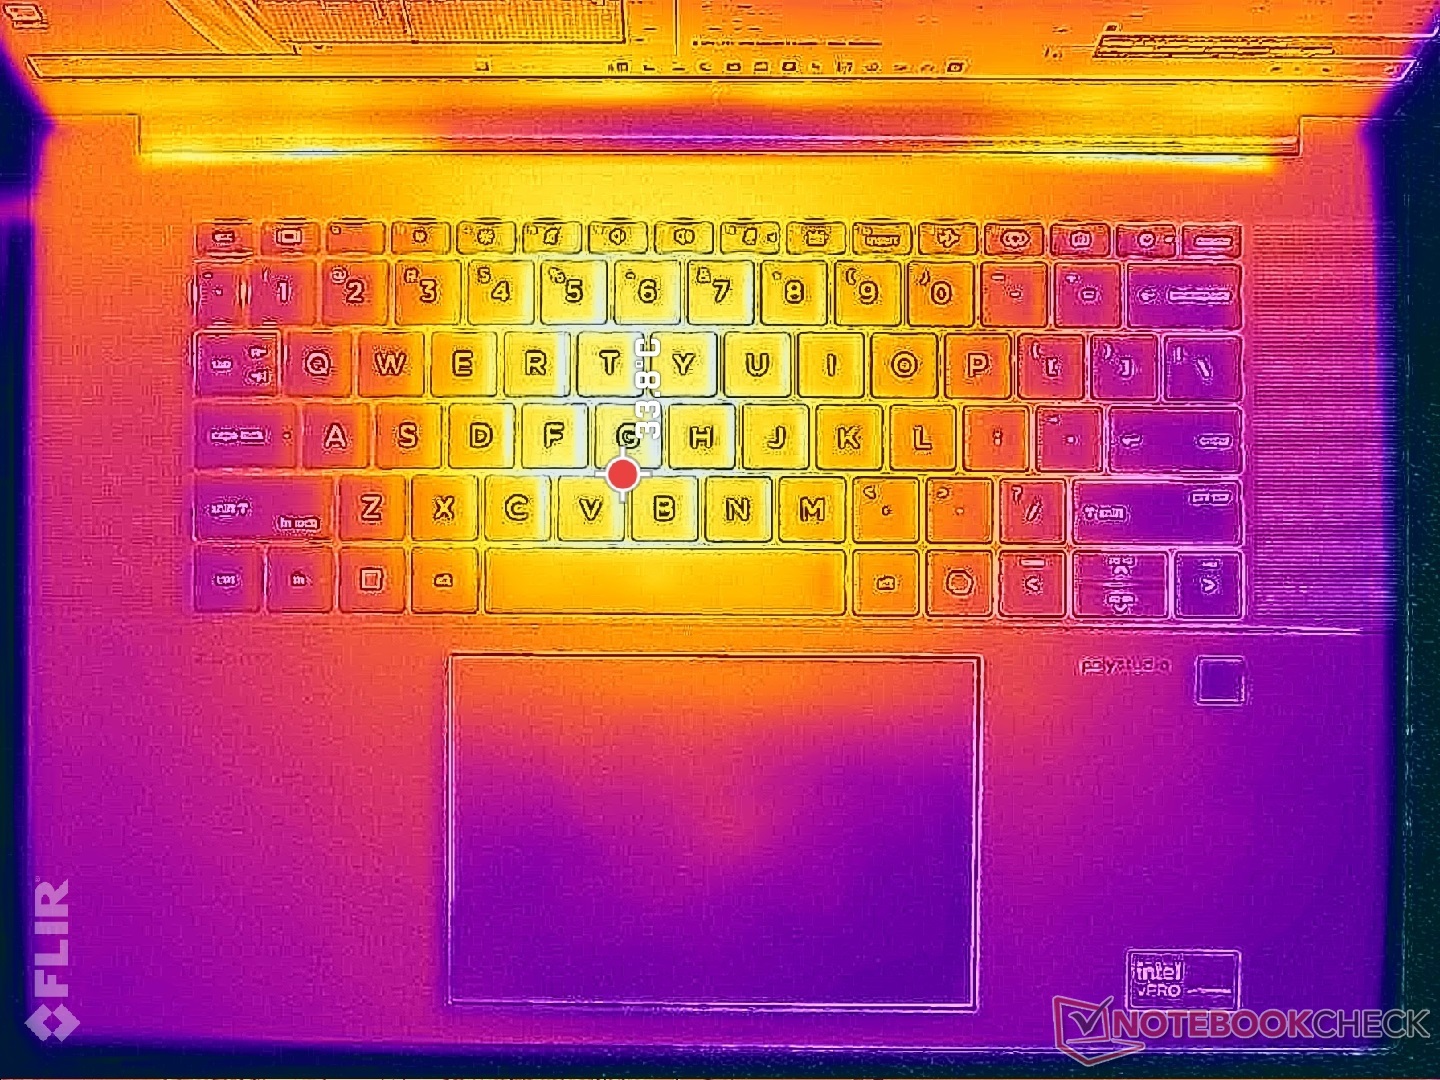
Le temperature superficiali sono più calde vicino alla parte posteriore inferiore dell'unità, dove i punti caldi possono raggiungere oltre 48 C. Fortunatamente, la tastiera e i poggiapolsi rimangono molto più freschi e tollerabili, fino a 38 C al centro.
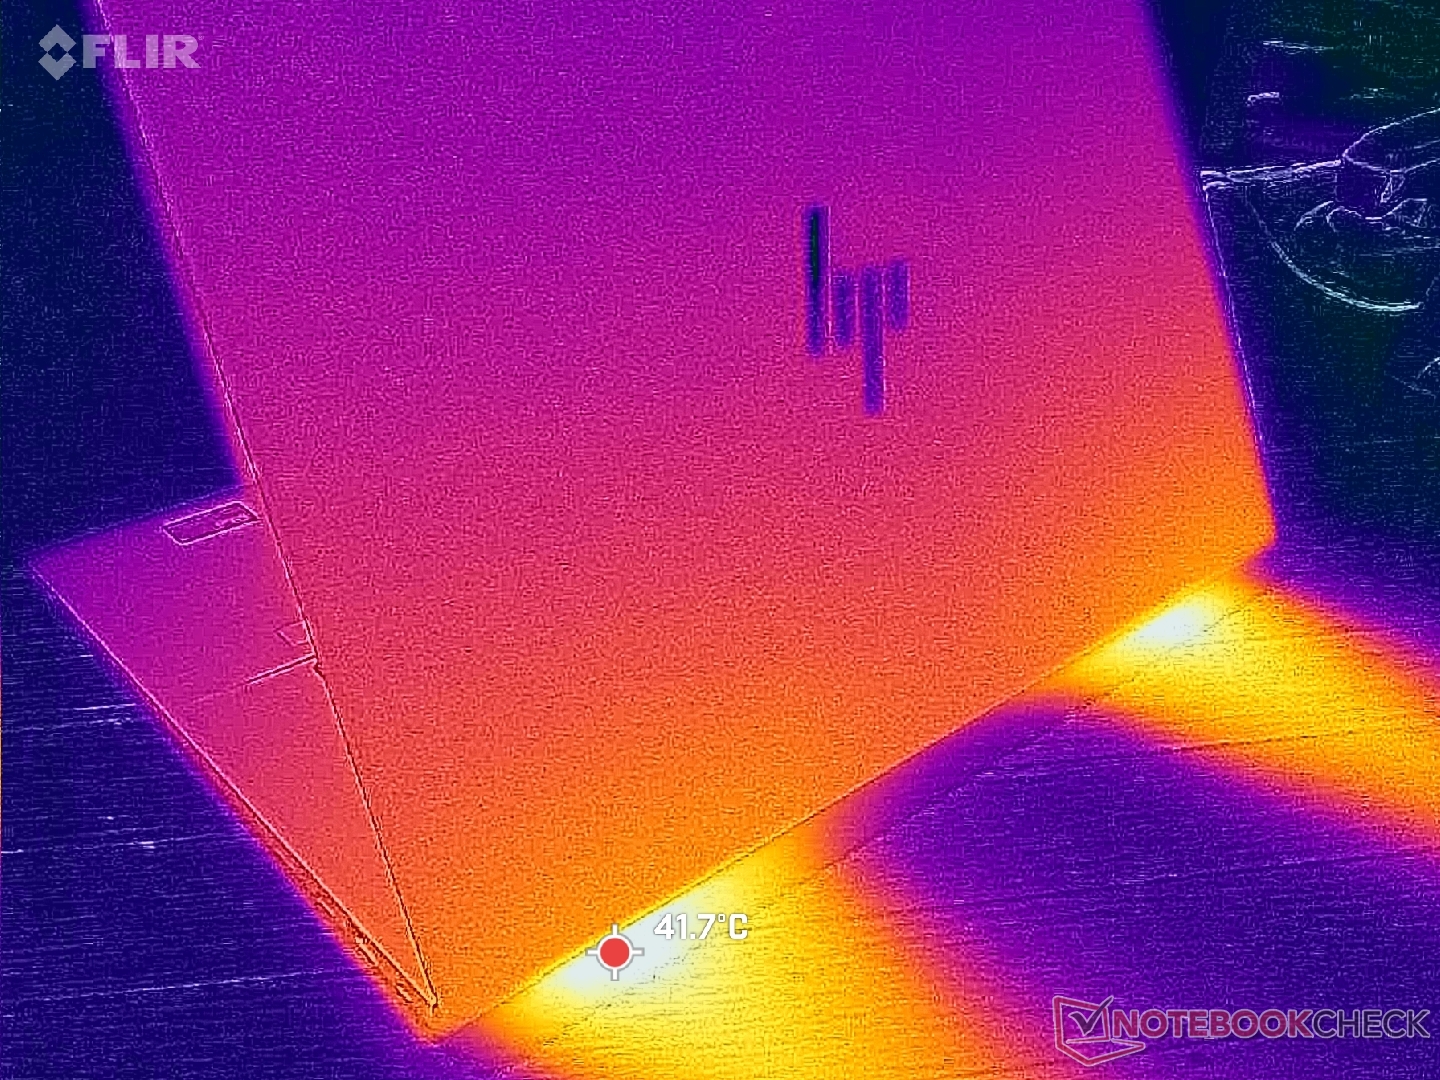
(+) La temperatura massima sul lato superiore è di 36.6 °C / 98 F, rispetto alla media di 38.2 °C / 101 F, che varia da 22.2 a 69.8 °C per questa classe Workstation.
(-) Il lato inferiore si riscalda fino ad un massimo di 47.8 °C / 118 F, rispetto alla media di 41.1 °C / 106 F
(+) In idle, la temperatura media del lato superiore è di 27.2 °C / 81 F, rispetto alla media deld ispositivo di 32 °C / 90 F.
(+) 3: The average temperature for the upper side is 30.3 °C / 87 F, compared to the average of 32 °C / 90 F for the class Workstation.
(+) I poggiapolsi e il touchpad sono piu' freddi della temperatura della pelle con un massimo di 27.4 °C / 81.3 F e sono quindi freddi al tatto.
(±) La temperatura media della zona del palmo della mano di dispositivi simili e'stata di 27.8 °C / 82 F (+0.4 °C / 0.7 F).

| HP ZBook Studio 16 G11 Intel Core Ultra 9 185H, NVIDIA RTX 3000 Ada Generation Laptop | HP ZBook Studio 16 G9 62U04EA Intel Core i7-12800H, NVIDIA RTX A2000 Laptop GPU | HP ZBook Power 16 G11 A AMD Ryzen 7 8845HS, NVIDIA RTX 2000 Ada Generation Laptop | Lenovo ThinkPad P16 Gen 2 Intel Core i7-14700HX, NVIDIA RTX 4000 Ada Generation Laptop | Dell Precision 5690 Intel Core Ultra 9 185H, NVIDIA RTX 5000 Ada Generation Laptop | MSI CreatorPro Z16P B12UKST Intel Core i7-12700H, NVIDIA RTX A3000 Laptop GPU | Lenovo ThinkPad P1 Gen 7 21KV001SGE Intel Core Ultra 7 155H, NVIDIA GeForce RTX 4060 Laptop GPU | |
|---|---|---|---|---|---|---|---|
| Heat | 2% | 12% | 4% | 5% | -13% | 4% | |
| Maximum Upper Side * (°C) | 36.6 | 38.7 -6% | 40.6 -11% | 46.6 -27% | 46.6 -27% | 56.3 -54% | 50.3 -37% |
| Maximum Bottom * (°C) | 47.8 | 53.4 -12% | 40.6 15% | 51 -7% | 33 31% | 68.3 -43% | 38 21% |
| Idle Upper Side * (°C) | 31.4 | 27.3 13% | 26 17% | 24.8 21% | 32.4 -3% | 25.2 20% | 28.3 10% |
| Idle Bottom * (°C) | 35.6 | 31.6 11% | 26.6 25% | 25.6 28% | 29.4 17% | 25.9 27% | 27.3 23% |
* ... Meglio usare valori piccoli
Altoparlanti
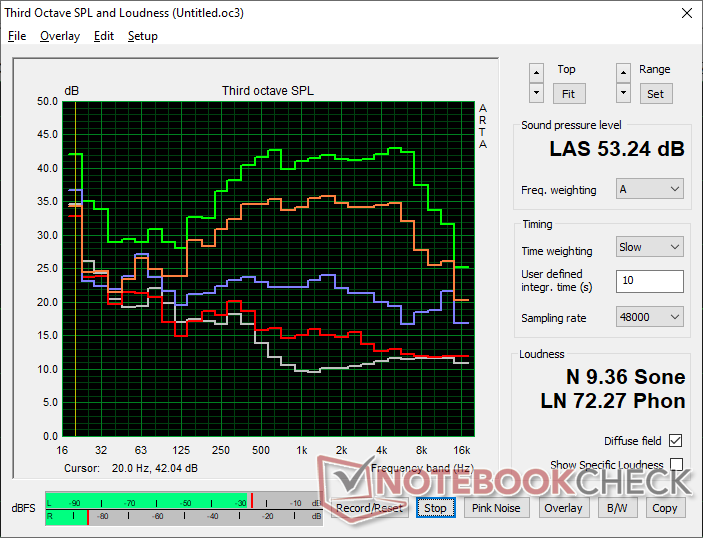
HP ZBook Studio 16 G11 analisi audio
(+) | gli altoparlanti sono relativamente potenti (82.7 dB)
Bassi 100 - 315 Hz
(-) | quasi nessun basso - in media 17.4% inferiori alla media
(±) | la linearità dei bassi è media (11.8% delta rispetto alla precedente frequenza)
Medi 400 - 2000 Hz
(+) | medi bilanciati - solo only 3.4% rispetto alla media
(±) | linearità dei medi adeguata (7% delta rispetto alla precedente frequenza)
Alti 2 - 16 kHz
(+) | Alti bilanciati - appena 2.4% dalla media
(+) | alti lineari (2.6% delta rispetto alla precedente frequenza)
Nel complesso 100 - 16.000 Hz
(±) | la linearità complessiva del suono è media (15.2% di differenza rispetto alla media
Rispetto alla stessa classe
» 33% di tutti i dispositivi testati in questa classe è stato migliore, 10% simile, 57% peggiore
» Il migliore ha avuto un delta di 7%, medio di 17%, peggiore di 35%
Rispetto a tutti i dispositivi testati
» 21% di tutti i dispositivi testati in questa classe è stato migliore, 4% similare, 74% peggiore
» Il migliore ha avuto un delta di 4%, medio di 24%, peggiore di 134%
Apple MacBook Pro 16 2021 M1 Pro analisi audio
(+) | gli altoparlanti sono relativamente potenti (84.7 dB)
Bassi 100 - 315 Hz
(+) | bassi buoni - solo 3.8% dalla media
(+) | bassi in lineaa (5.2% delta rispetto alla precedente frequenza)
Medi 400 - 2000 Hz
(+) | medi bilanciati - solo only 1.3% rispetto alla media
(+) | medi lineari (2.1% delta rispetto alla precedente frequenza)
Alti 2 - 16 kHz
(+) | Alti bilanciati - appena 1.9% dalla media
(+) | alti lineari (2.7% delta rispetto alla precedente frequenza)
Nel complesso 100 - 16.000 Hz
(+) | suono nel complesso lineare (4.6% differenza dalla media)
Rispetto alla stessa classe
» 0% di tutti i dispositivi testati in questa classe è stato migliore, 0% simile, 100% peggiore
» Il migliore ha avuto un delta di 5%, medio di 17%, peggiore di 45%
Rispetto a tutti i dispositivi testati
» 0% di tutti i dispositivi testati in questa classe è stato migliore, 0% similare, 100% peggiore
» Il migliore ha avuto un delta di 4%, medio di 24%, peggiore di 134%
Gestione dell'energia
Consumo di energia
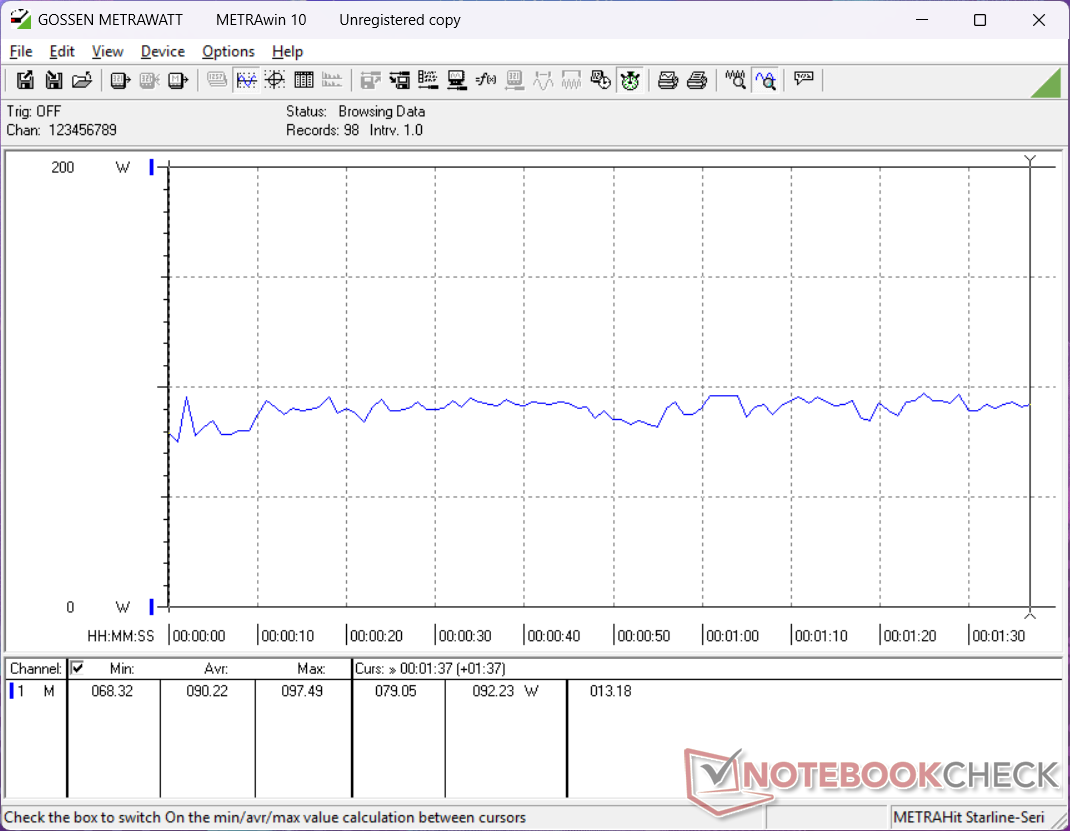
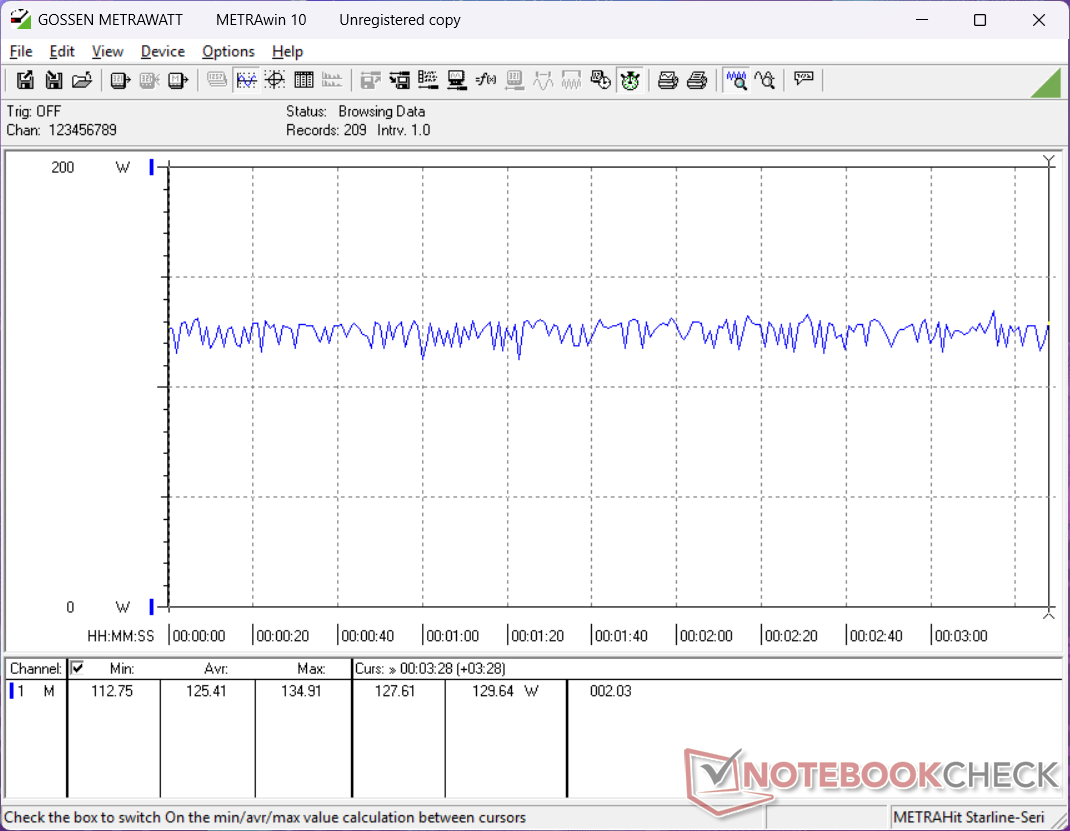
Il modello è leggermente più esigente del più vecchio e più lento ZBook Studio 16 G9. Tuttavia, le prestazioni per watt sono ancora significativamente più elevate, il che fa sì che il consumo maggiore valga la pena per i cacciatori di prestazioni.
| Off / Standby | |
| Idle | |
| Sotto carico |
|
Leggenda:
min: | |
| HP ZBook Studio 16 G11 Ultra 9 185H, RTX 3000 Ada Generation Laptop, Kioxia XG8 KXG80ZNV1T02, IPS, 3840x2400, 16" | HP ZBook Studio 16 G9 62U04EA i7-12800H, RTX A2000 Laptop GPU, Micron 3400 1TB MTFDKBA1T0TFH, IPS, 3840x2400, 16" | HP ZBook Power 16 G11 A R7 8845HS, RTX 2000 Ada Generation Laptop, Samsung PM9A1 MZVL22T0HBLB, IPS, 2560x1600, 16" | Lenovo ThinkPad P16 Gen 2 i7-14700HX, RTX 4000 Ada Generation Laptop, SK hynix PC801 HFS001TEJ9X162N, IPS, 2560x1600, 16" | Dell Precision 5690 Ultra 9 185H, RTX 5000 Ada Generation Laptop, 2x Samsung PM9A1 1TB (RAID 0), OLED, 3840x2400, 16" | MSI CreatorPro Z16P B12UKST i7-12700H, RTX A3000 Laptop GPU, Samsung PM9A1 MZVL21T0HCLR, IPS, 2560x1600, 16" | Lenovo ThinkPad P1 Gen 7 21KV001SGE Ultra 7 155H, GeForce RTX 4060 Laptop GPU, Kioxia XG8 KXG8AZNV1T02, IPS LED, 2560x1600, 16" | |
|---|---|---|---|---|---|---|---|
| Power Consumption | 8% | 36% | -26% | 9% | 7% | 17% | |
| Idle Minimum * (Watt) | 14 | 7.2 49% | 4.6 67% | 7.9 44% | 7.9 44% | 10.8 23% | 7.3 48% |
| Idle Average * (Watt) | 22.4 | 18.1 19% | 10 55% | 13.1 42% | 12 46% | 16.3 27% | 12.3 45% |
| Idle Maximum * (Watt) | 25.7 | 18.5 28% | 10.6 59% | 24.2 6% | 28.6 -11% | 16.9 34% | 17.9 30% |
| Load Average * (Watt) | 90.2 | 112.8 -25% | 60.9 32% | 127.4 -41% | 98.8 -10% | 111.7 -24% | 78.2 13% |
| Cyberpunk 2077 ultra external monitor * (Watt) | 120.3 | 92.8 23% | 219 -82% | 117.7 2% | |||
| Cyberpunk 2077 ultra * (Watt) | 125.4 | 96.8 23% | 225 -79% | 123.5 2% | |||
| Load Maximum * (Watt) | 142 | 186 -31% | 154.8 -9% | 248.5 -75% | 174.8 -23% | 177.4 -25% | 167.5 -18% |
| Witcher 3 ultra * (Watt) | 106.7 | 144.5 | 152.1 |
* ... Meglio usare valori piccoli
Power Consumption Cyberpunk / Stress Test
Power Consumption external Monitor
Durata della batteria
I tempi di esecuzione non sono migliorati e potrebbero addirittura essere più brevi di prima.
| HP ZBook Studio 16 G11 Ultra 9 185H, RTX 3000 Ada Generation Laptop, 86 Wh | HP ZBook Studio 16 G9 62U04EA i7-12800H, RTX A2000 Laptop GPU, 86 Wh | HP ZBook Power 16 G11 A R7 8845HS, RTX 2000 Ada Generation Laptop, 83 Wh | Lenovo ThinkPad P16 Gen 2 i7-14700HX, RTX 4000 Ada Generation Laptop, 94 Wh | Dell Precision 5690 Ultra 9 185H, RTX 5000 Ada Generation Laptop, 98 Wh | MSI CreatorPro Z16P B12UKST i7-12700H, RTX A3000 Laptop GPU, 90 Wh | Lenovo ThinkPad P1 Gen 7 21KV001SGE Ultra 7 155H, GeForce RTX 4060 Laptop GPU, 90 Wh | |
|---|---|---|---|---|---|---|---|
| Autonomia della batteria | 31% | 102% | -48% | 92% | 21% | 106% | |
| WiFi v1.3 (h) | 4.8 | 6.3 31% | 9.7 102% | 2.5 -48% | 9.2 92% | 5.8 21% | 9.9 106% |
| H.264 (h) | 8.5 | ||||||
| Load (h) | 1.1 | 1.7 | 1.9 | ||||
| Reader / Idle (h) | 26.1 |
Valutazione Notebookcheck
HP ZBook Studio 16 G11
- 11/30/2024 v8
Allen Ngo
 Total Sustainability Score:
 Transparency
La selezione dei dispositivi da recensire viene effettuata dalla nostra redazione. Il campione di prova è stato fornito all'autore come prestito dal produttore o dal rivenditore ai fini di questa recensione. L'istituto di credito non ha avuto alcuna influenza su questa recensione, né il produttore ne ha ricevuto una copia prima della pubblicazione. Non vi era alcun obbligo di pubblicare questa recensione. In quanto società mediatica indipendente, Notebookcheck non è soggetta all'autorità di produttori, rivenditori o editori.
Ecco come Notebookcheck esegue i test
Ogni anno, Notebookcheck esamina in modo indipendente centinaia di laptop e smartphone utilizzando procedure standardizzate per garantire che tutti i risultati siano comparabili. Da circa 20 anni sviluppiamo continuamente i nostri metodi di prova e nel frattempo stabiliamo gli standard di settore. Nei nostri laboratori di prova, tecnici ed editori esperti utilizzano apparecchiature di misurazione di alta qualità. Questi test comportano un processo di validazione in più fasi. Il nostro complesso sistema di valutazione si basa su centinaia di misurazioni e parametri di riferimento ben fondati, che mantengono l'obiettività.
