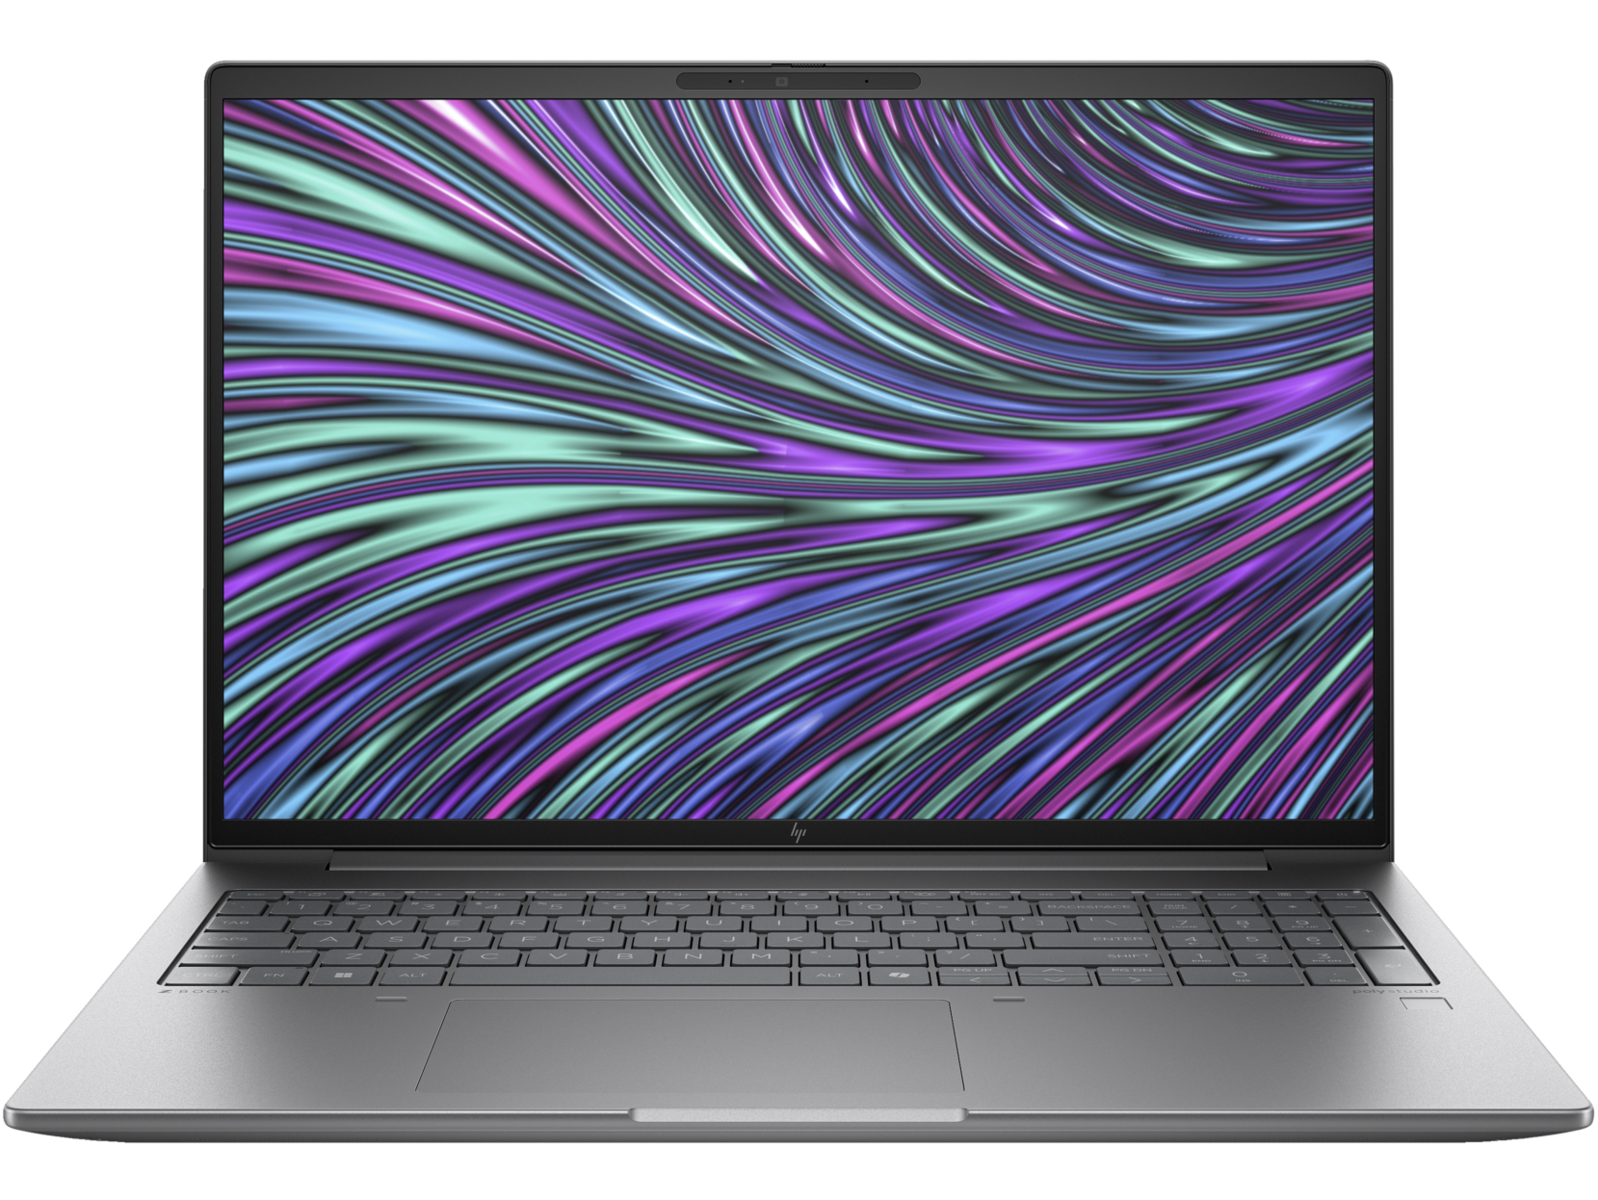
Recensione dell'HP ZBook Power 16 G11 A: Potente workstation con AMD Zen 4

Lo ZBook Power 16 G11 succede al vecchio ZBook Power 15 G10 con nuovi processori interni e nuove modifiche esterne. Come suggerisce il nome, lo ZBook Power 16 G11 modernizza la serie abbandonando il vecchio fattore di forma da 15,6 pollici per un design da 16 pollici. Si colloca tra lo ZBook Firefly di fascia bassa e lo ZBook Fury di fascia alta in termini di prestazioni. Gli utenti possono configurare con CPU Meteor Lake Intel Core Ultra o CPU AMD Ryzen Zen 4 e grafica Nvidia RTX.
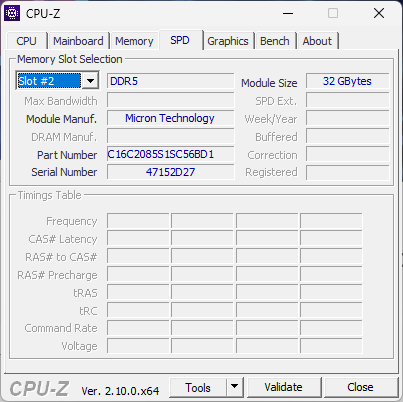
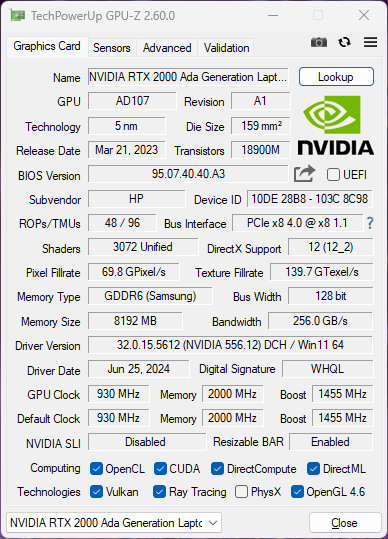
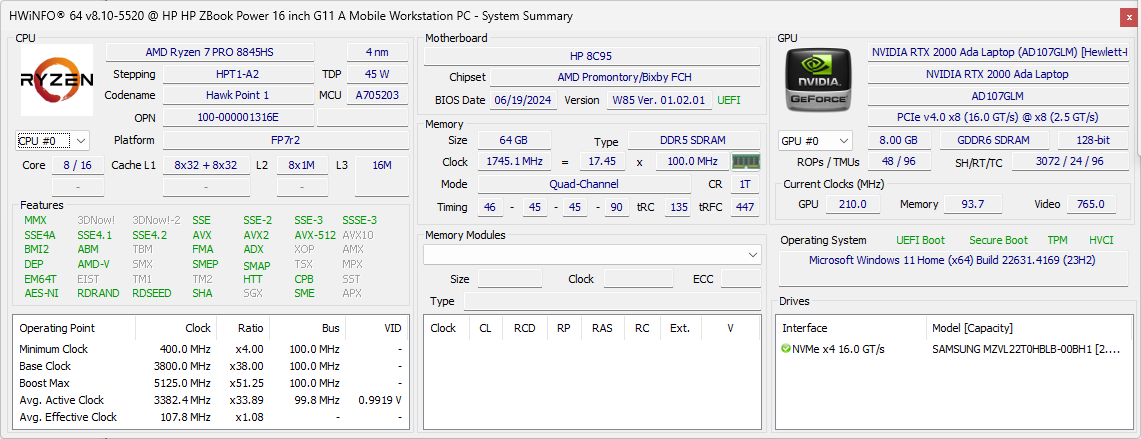
La nostra unità in prova è una configurazione AMD di fascia alta (ZBook Power 16 G11 A) con CPU Ryzen 7 8845HS, GPU RTX 2000 Ada e display IPS a 120 Hz 2560 x 1600p per circa 2100 dollari. Le opzioni sono molto ampie e vanno dal Ryzen 5 8645HS fino al Ryzen 9 8945HS con display a 1200p e grafica RTX 1000, RTX 2000 o RTX 3000. Gli utenti possono anche optare per l'assenza di grafica discreta.
I concorrenti in questo spazio includono altre workstation da 16 pollici come il modello Dell Precision 5690, MSI CreatorPro Z16Po il Lenovo ThinkPad P16s G2.
Altre recensioni HP:
Potenziali concorrenti a confrontos
Punteggio | Versione | Data | Modello | Peso | Altezza | Dimensione | Risoluzione | Prezzo |
|---|---|---|---|---|---|---|---|---|
| 85.4 % | v8 | 10/2024 | HP ZBook Power 16 G11 A R7 8845HS, RTX 2000 Ada Generation Laptop | 2.2 kg | 22.9 mm | 16.00" | 2560x1600 | |
| 88.9 % v7 (old) | v7 (old) | 12/2023 | HP ZBook Power 15 G10 R7 PRO 7840HS, RTX 2000 Ada Generation Laptop | 2 kg | 22.9 mm | 15.60" | 2560x1440 | |
| 85.9 % | v8 | 08/2024 | HP ZBook Fury 16 G11 i9-14900HX, RTX 3500 Ada Generation Laptop | 2.6 kg | 28.5 mm | 16.00" | 3840x2400 | |
| 83.5 % | v8 | 10/2024 | Lenovo ThinkPad P1 Gen 7 21KV001SGE Ultra 7 155H, GeForce RTX 4060 Laptop GPU | 2 kg | 20.5 mm | 16.00" | 2560x1600 | |
| 88.6 % v7 (old) | v7 (old) | 01/2024 | Lenovo ThinkPad P16s G2 21K9000CGE R7 PRO 7840U, Radeon 780M | 1.8 kg | 24.4 mm | 16.00" | 3840x2400 | |
| 88.3 % v7 (old) | v7 (old) | 05/2024 | Dell Precision 5690 Ultra 9 185H, RTX 5000 Ada Generation Laptop | 2.3 kg | 22.17 mm | 16.00" | 3840x2400 |
Nota: abbiamo recentemente aggiornato il nostro sistema di valutazione e i risultati della versione 8 non sono paragonabili ai risultati della versione 7. Ulteriori informazioni sono disponibili qui .
Custodia - Certificata MIL-STD 810
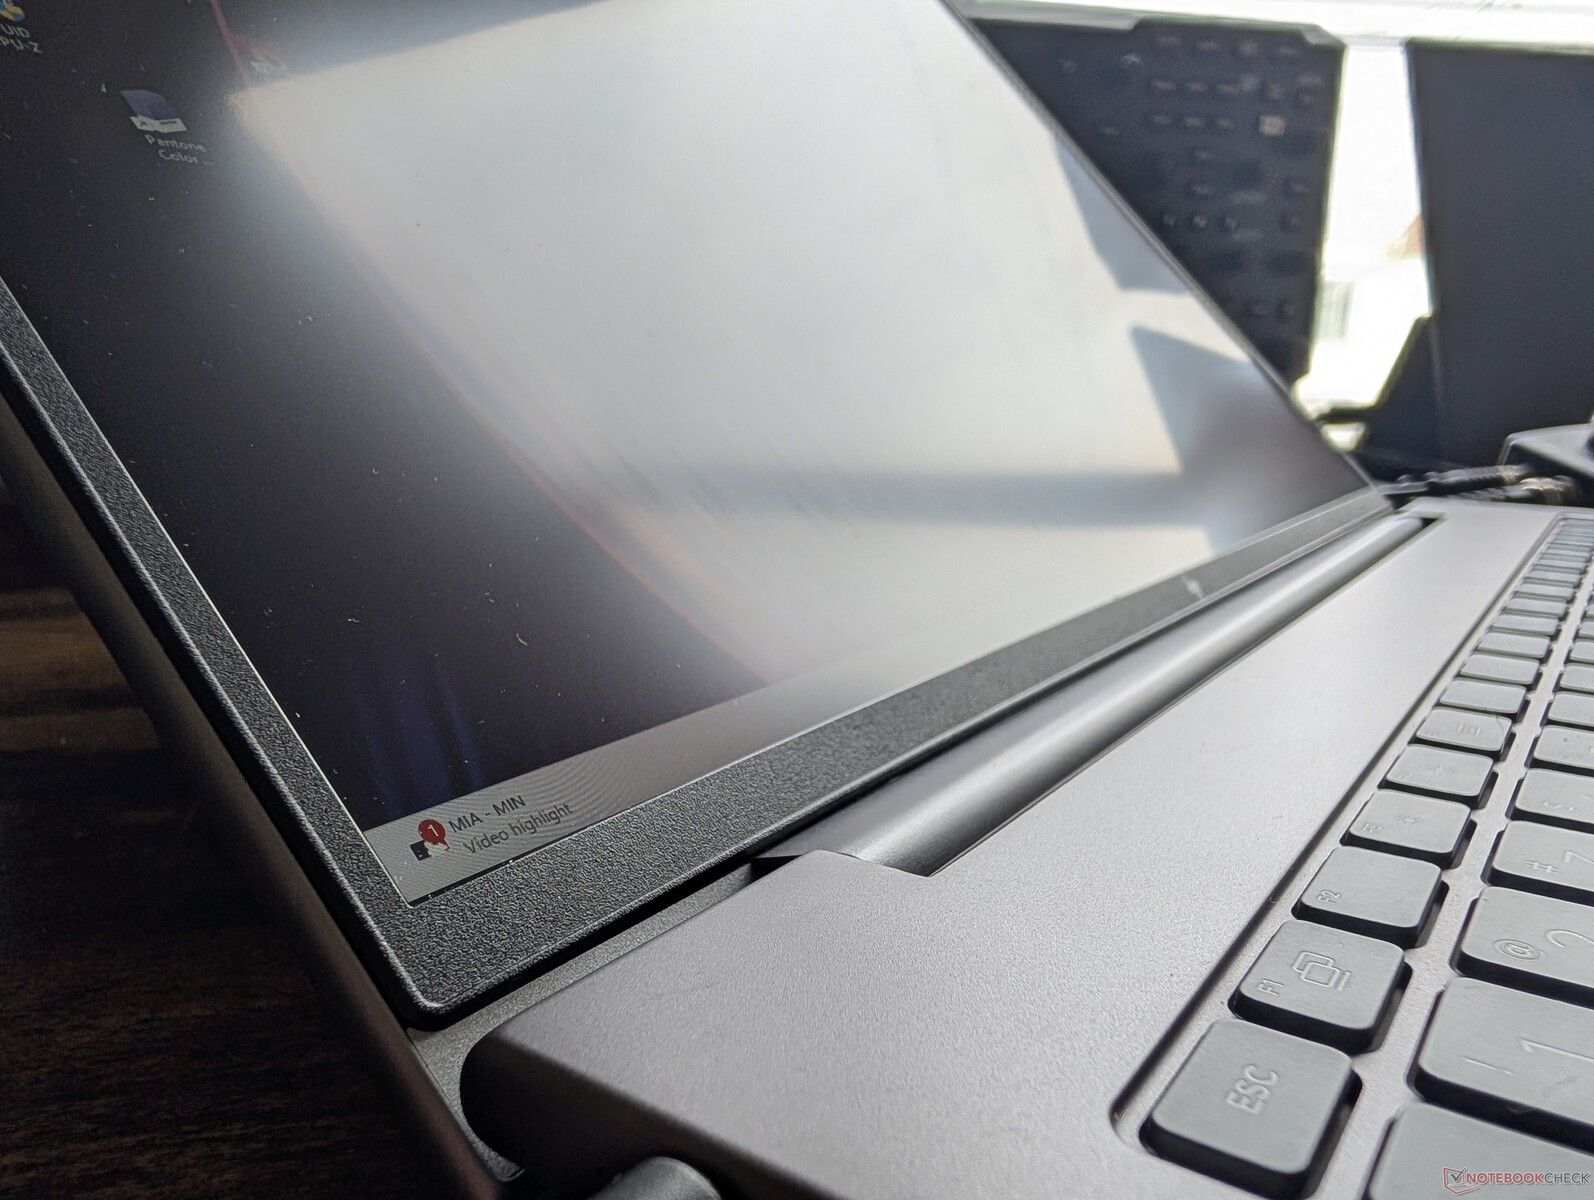
HP utilizza materiali simili in lega di alluminio grigio per quasi tutti i suoi modelli ZBook, per un senso di coerenza all'interno della famiglia. In questo caso, lo ZBook Power 16 G11 presenta la stessa struttura metallica liscia e opaca dello ZBook Power 15 G10, ma con modifiche superficiali ai bordi della tastiera, al rivestimento esterno del coperchio e al pannello inferiore.
La rigidità del telaio è eccellente, con flessioni e avvallamenti minimi quando si cerca di ruotare la base. Tuttavia, le cerniere e il coperchio avrebbero potuto essere più rigidi, soprattutto perché il coperchio può aprirsi quasi completamente a 180 gradi, a differenza di quanto accade con lo ZBook 5690 Precision 5690.
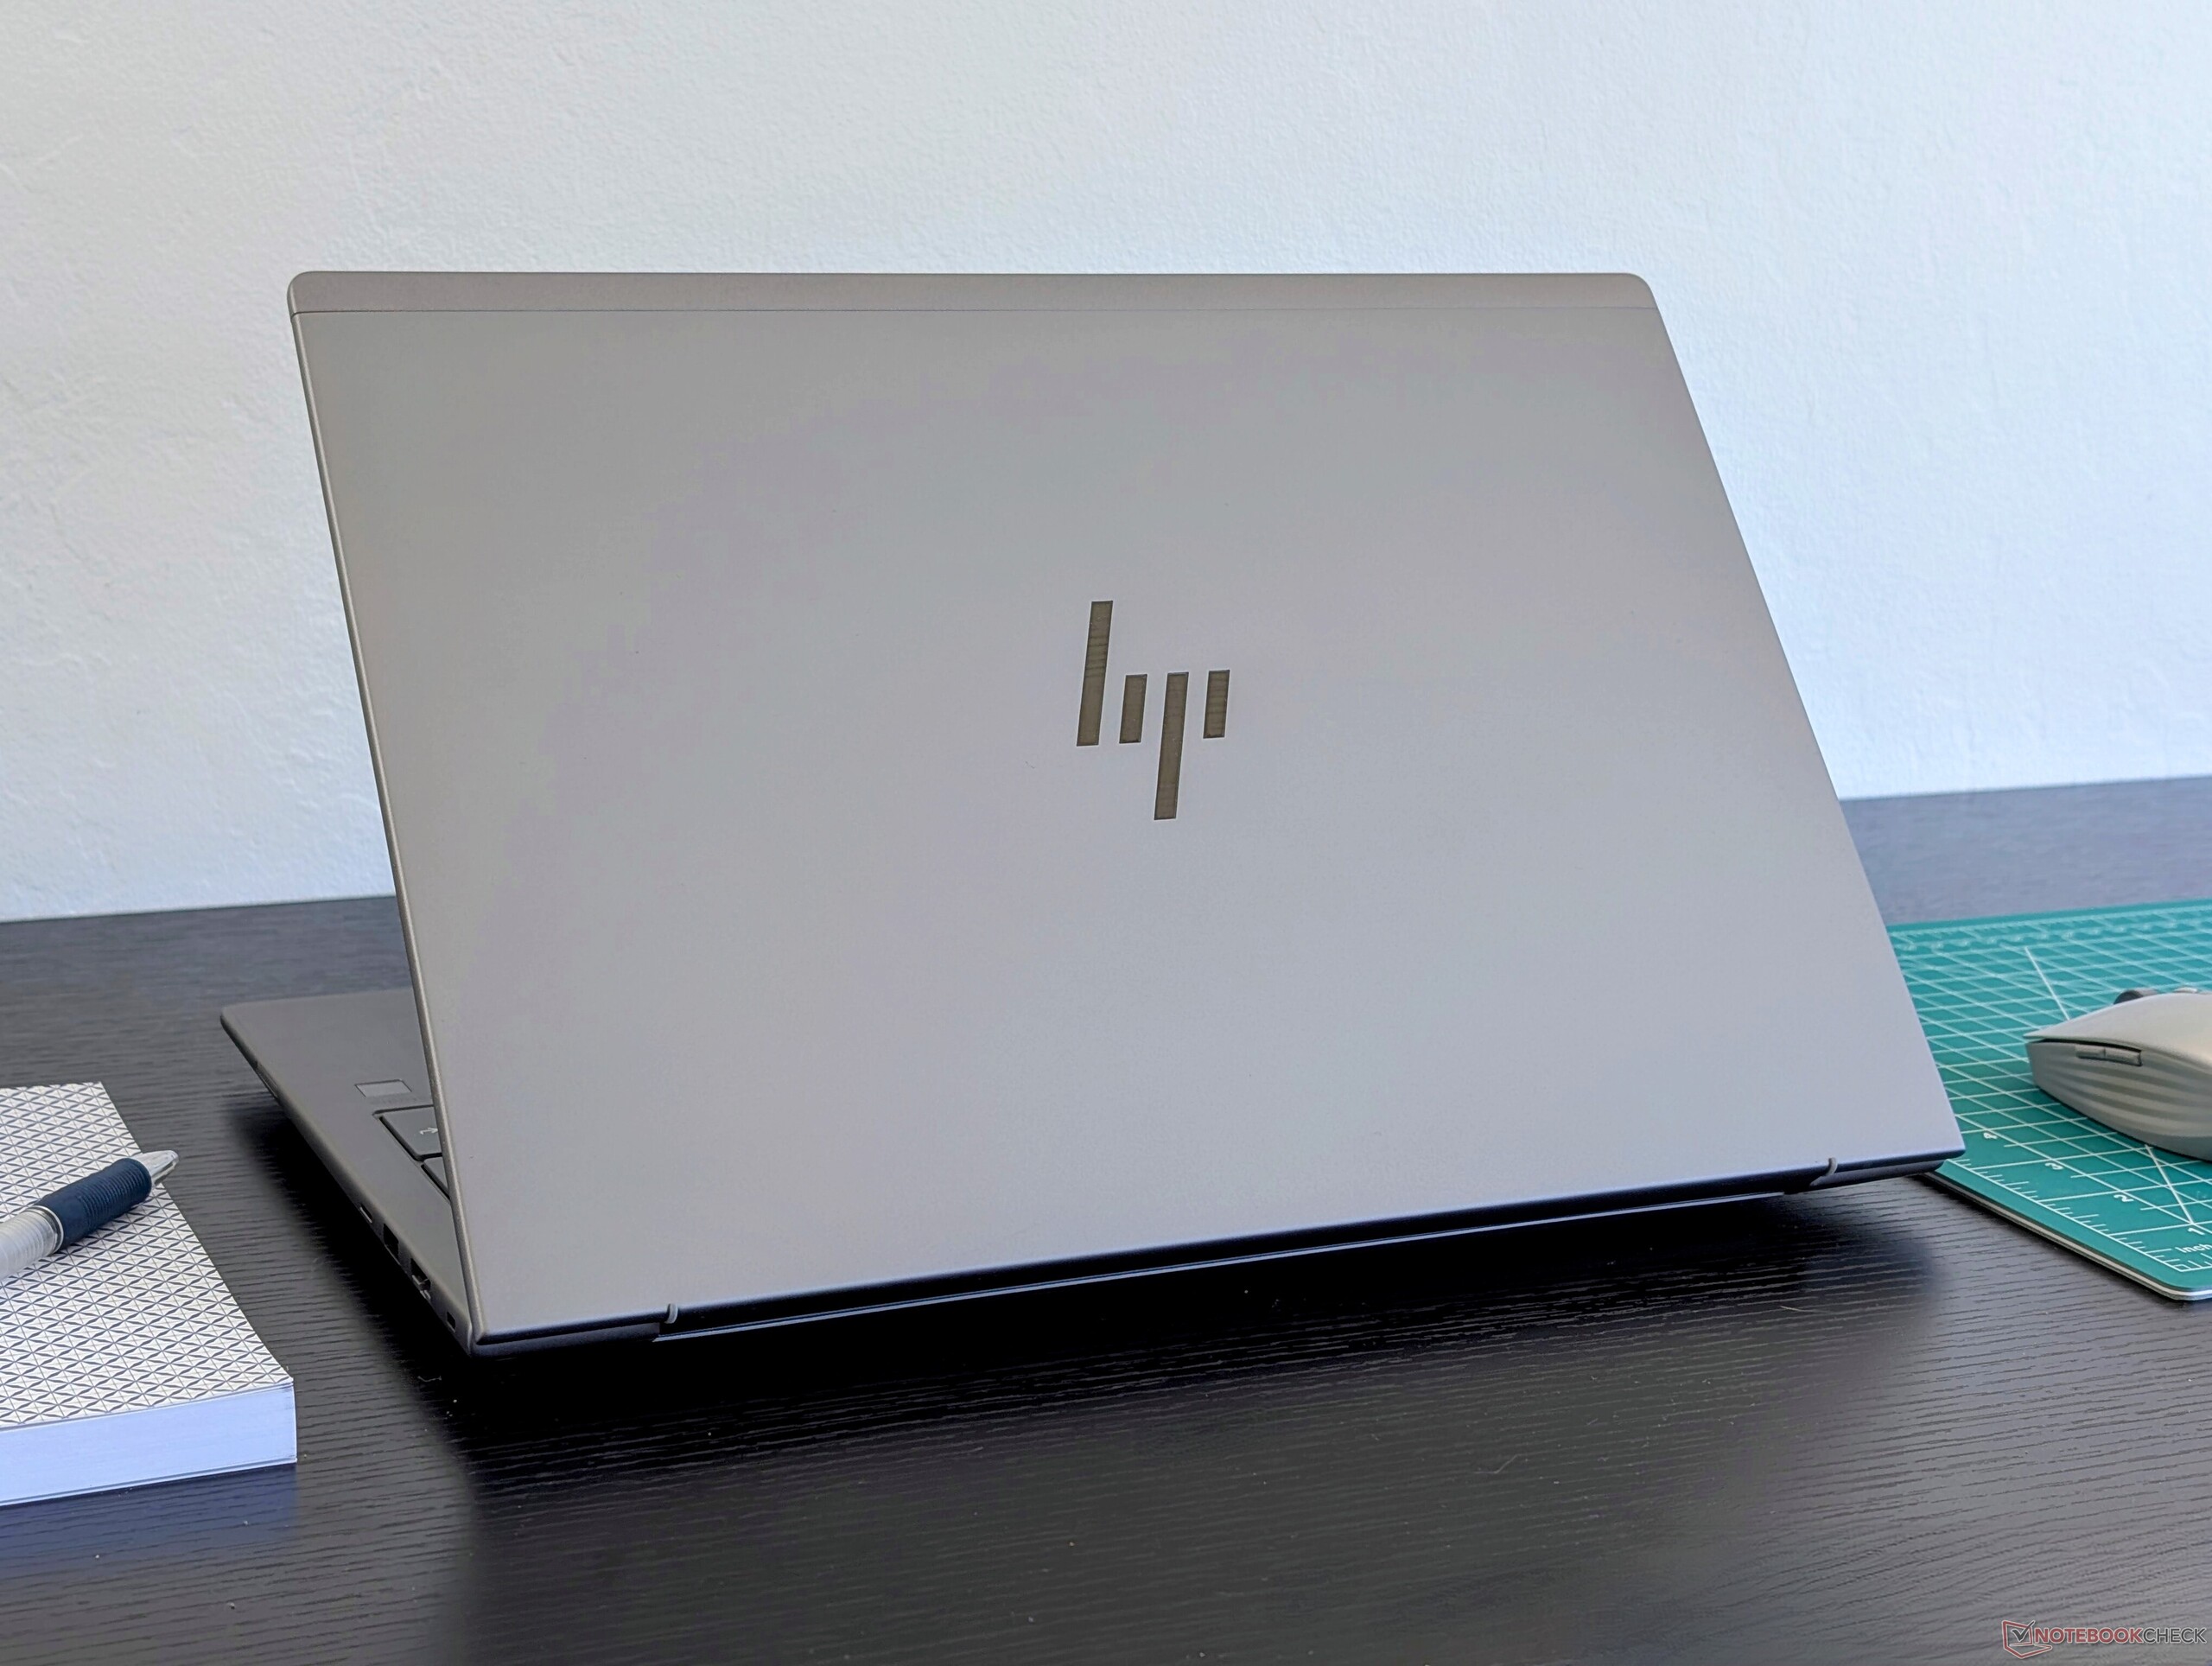
Il nuovo design da 16 pollici è circa il 10% più pesante e il 7% più grande del modello uscente da 15 pollici. In particolare, non è più sottile, il che è un peccato, in quanto è già più spesso di alcuni concorrenti come il ThinkPad P1 Gen 7. Lo ZBook Fury 16 G11 è ancora più pesante e più spesso, ma con opzioni di CPU e GPU più veloci per compensare. HP offre il più sottile ZBook Firefly 16 se gli utenti desiderano un'opzione più portatile.
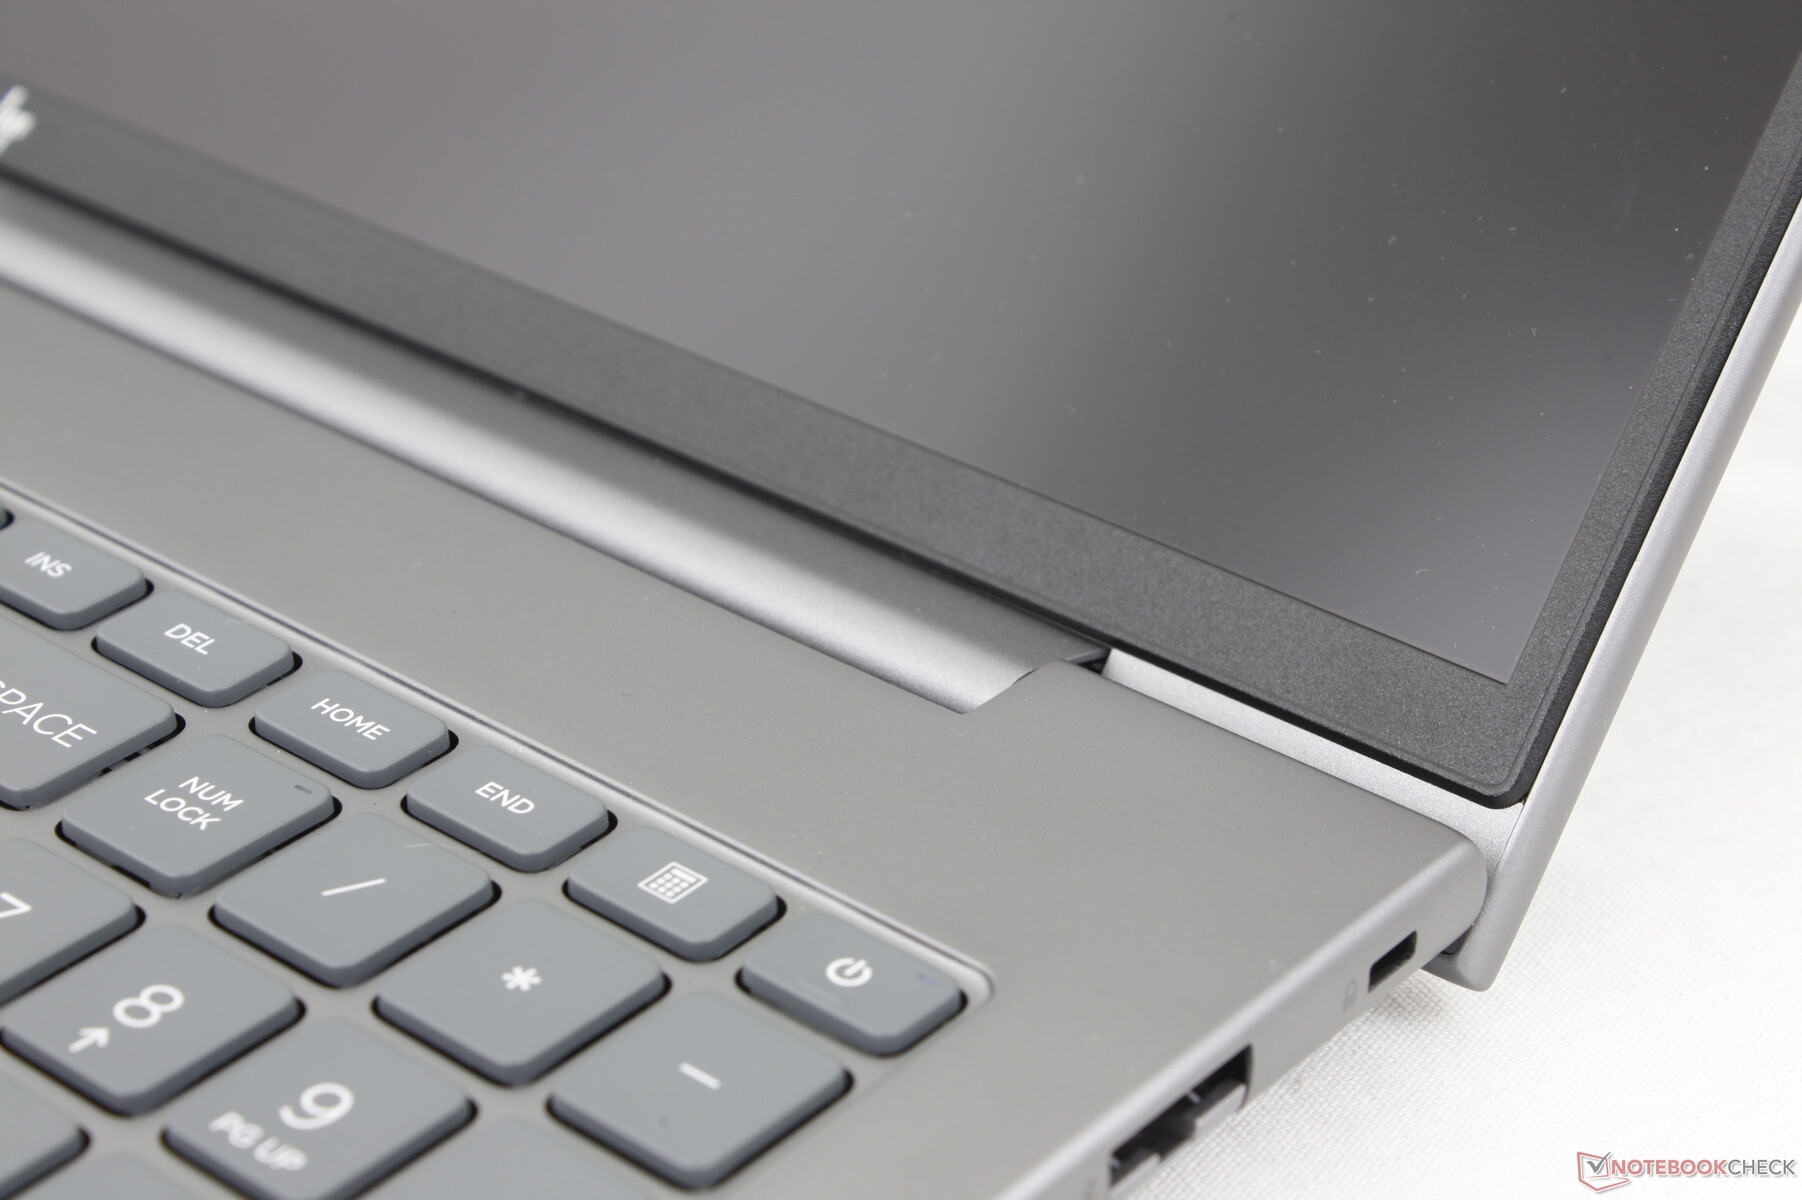
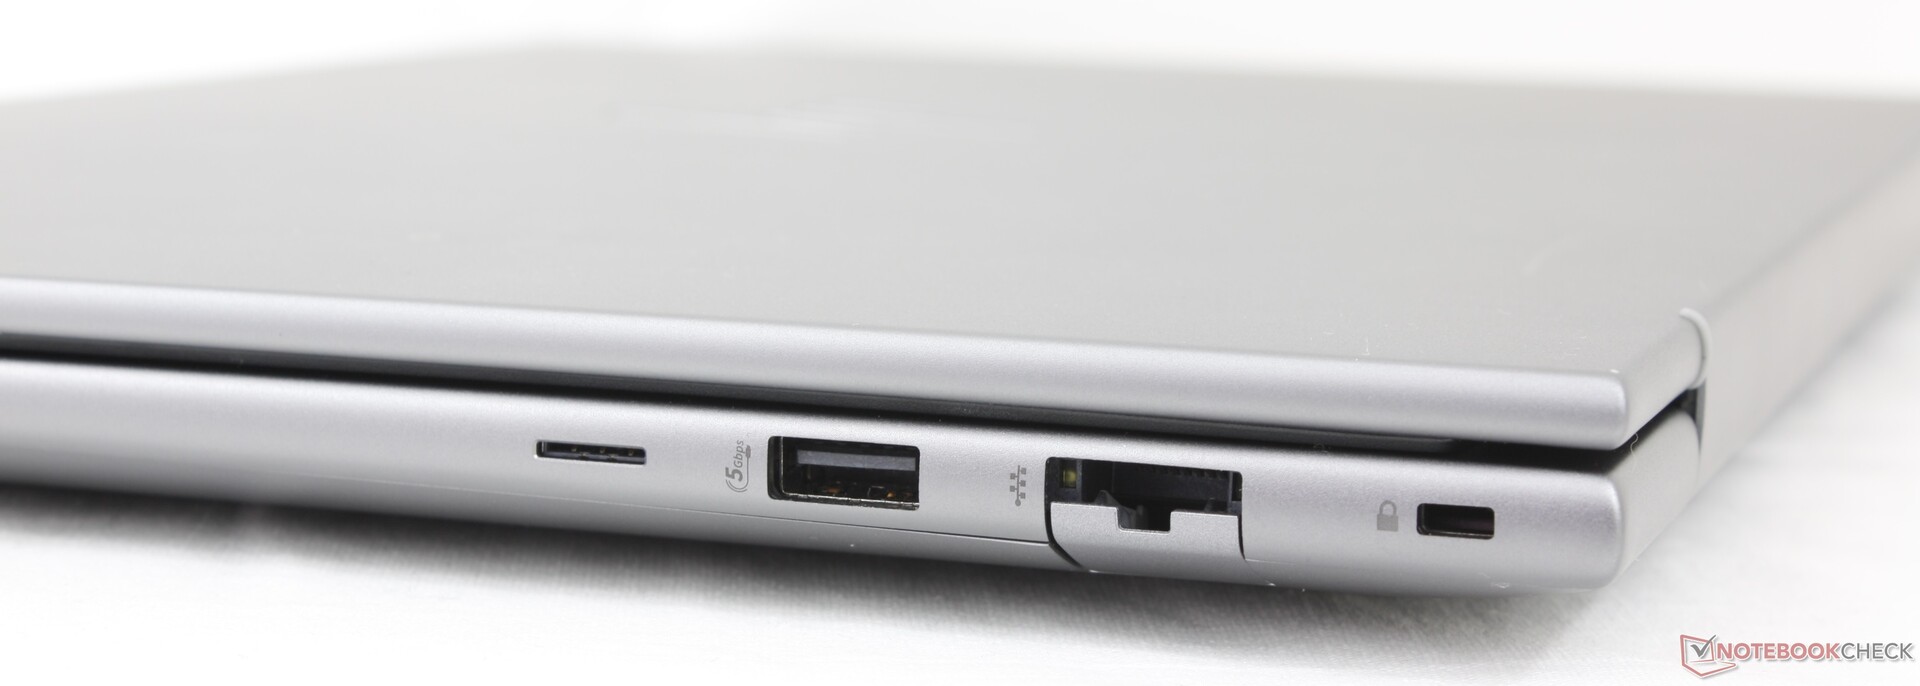
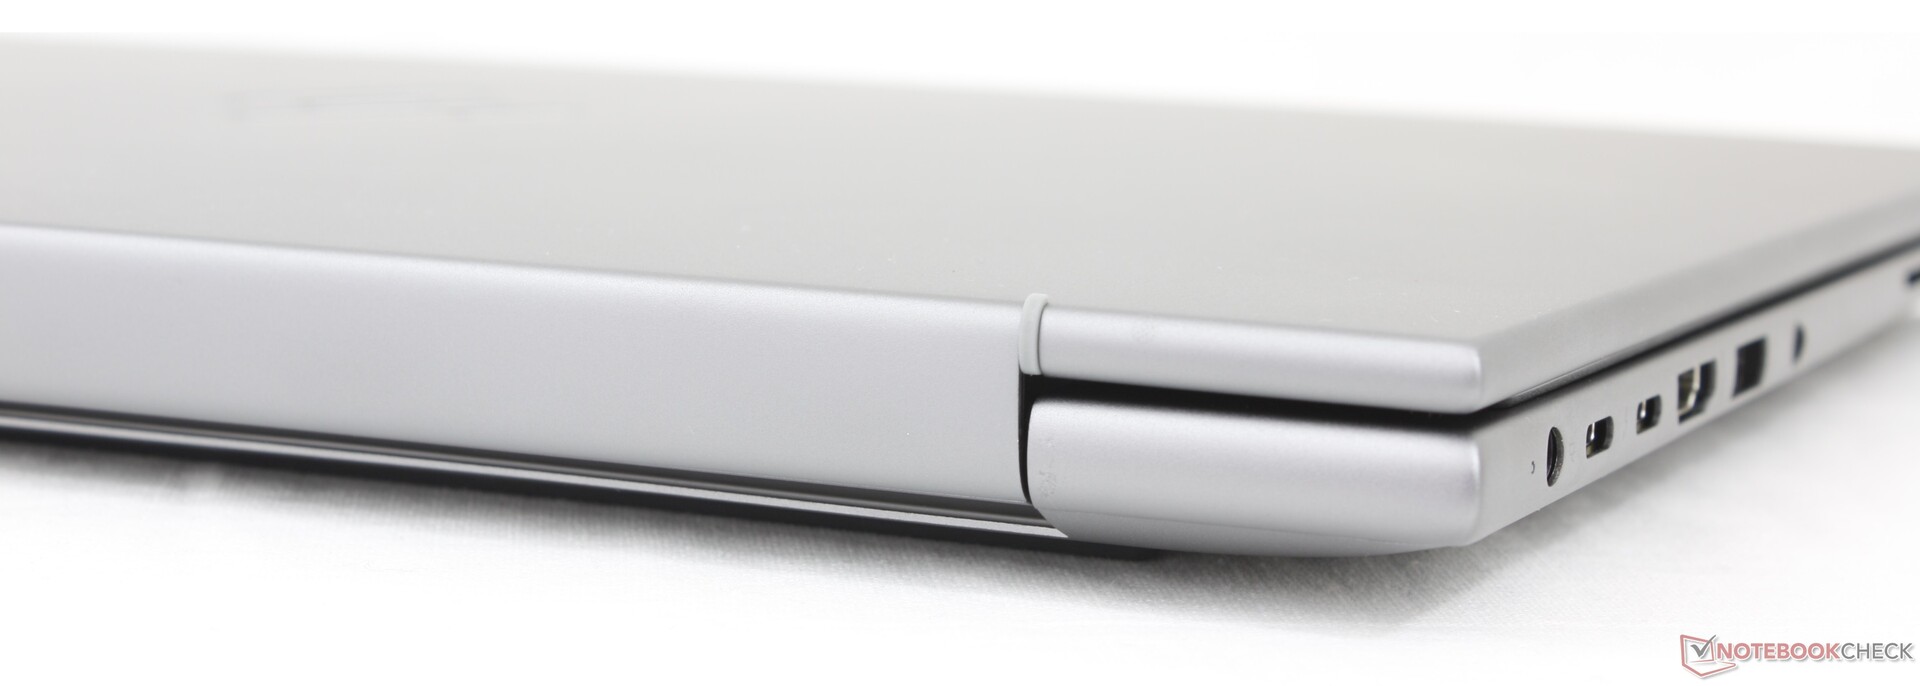
Connettività - Porte Thunderbolt 4
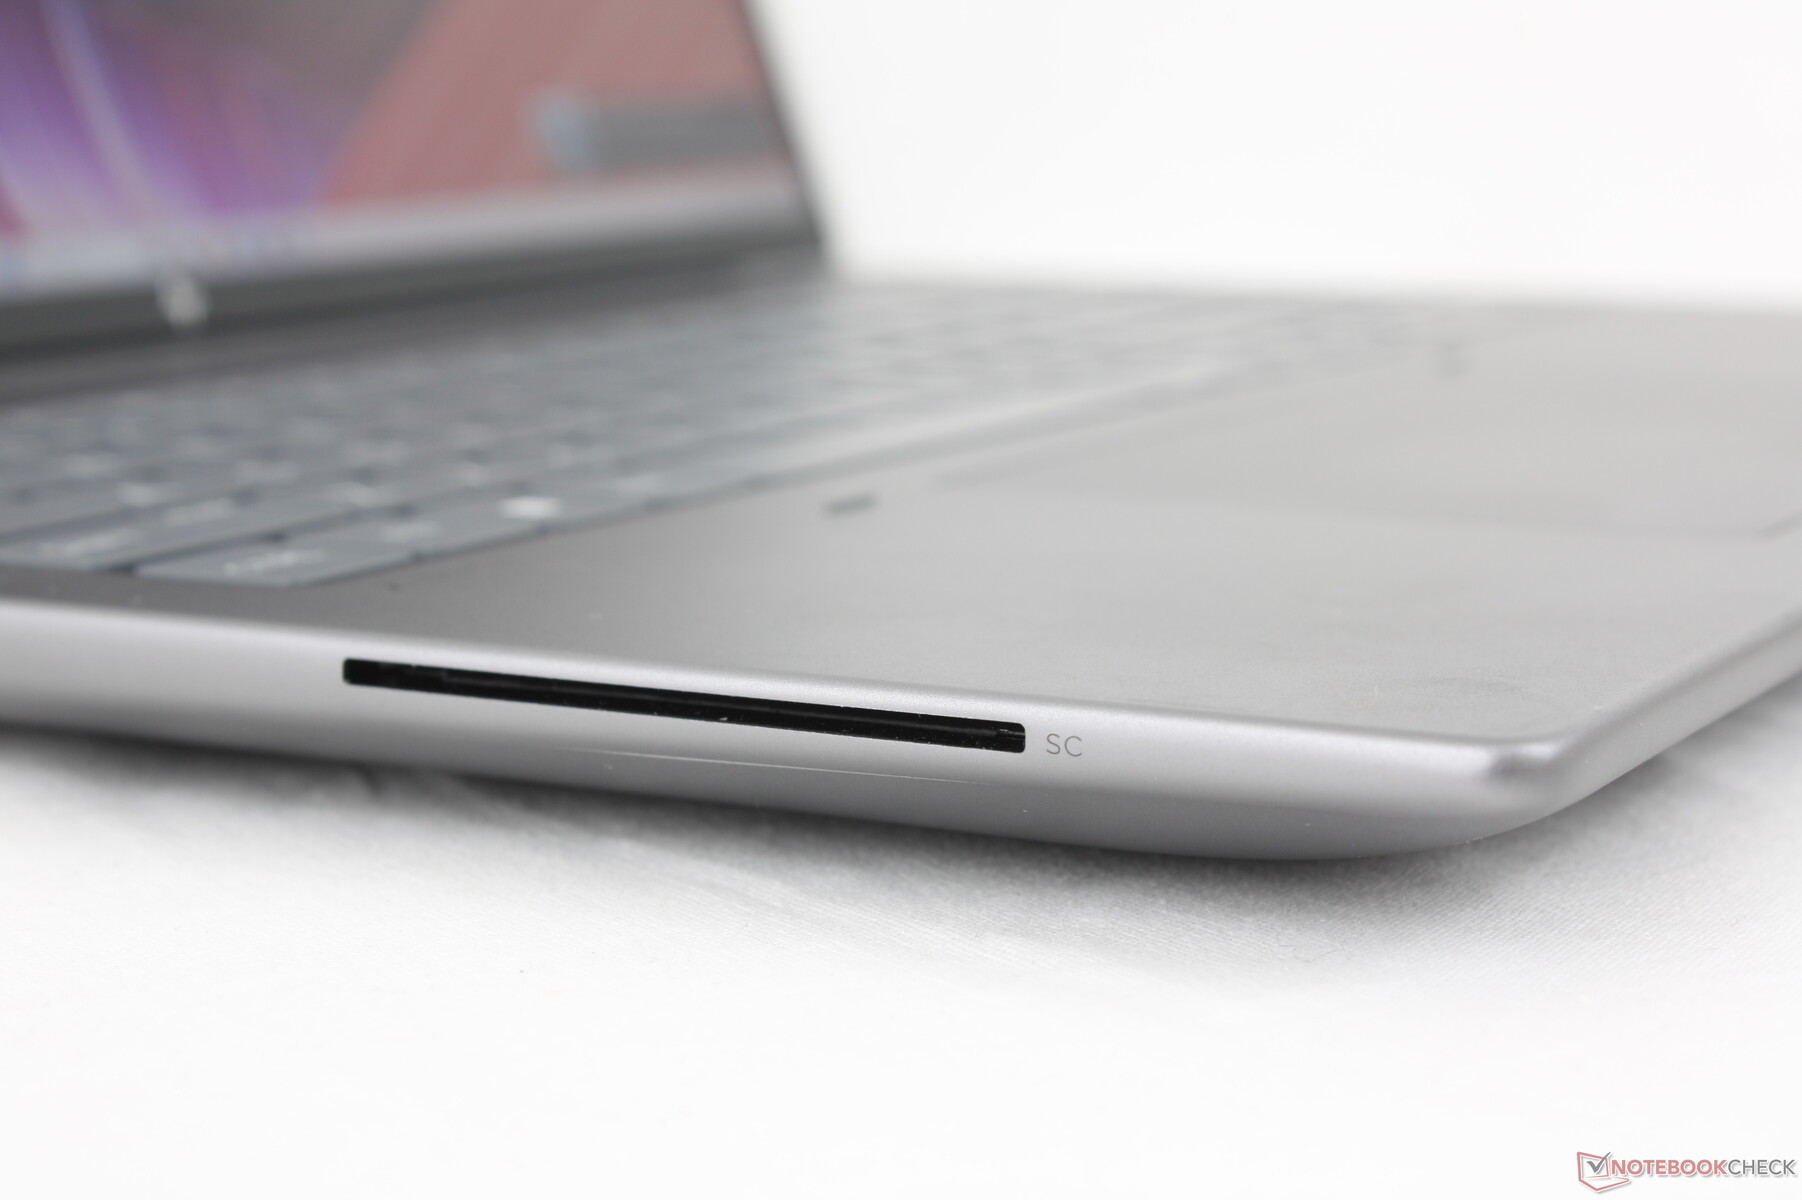
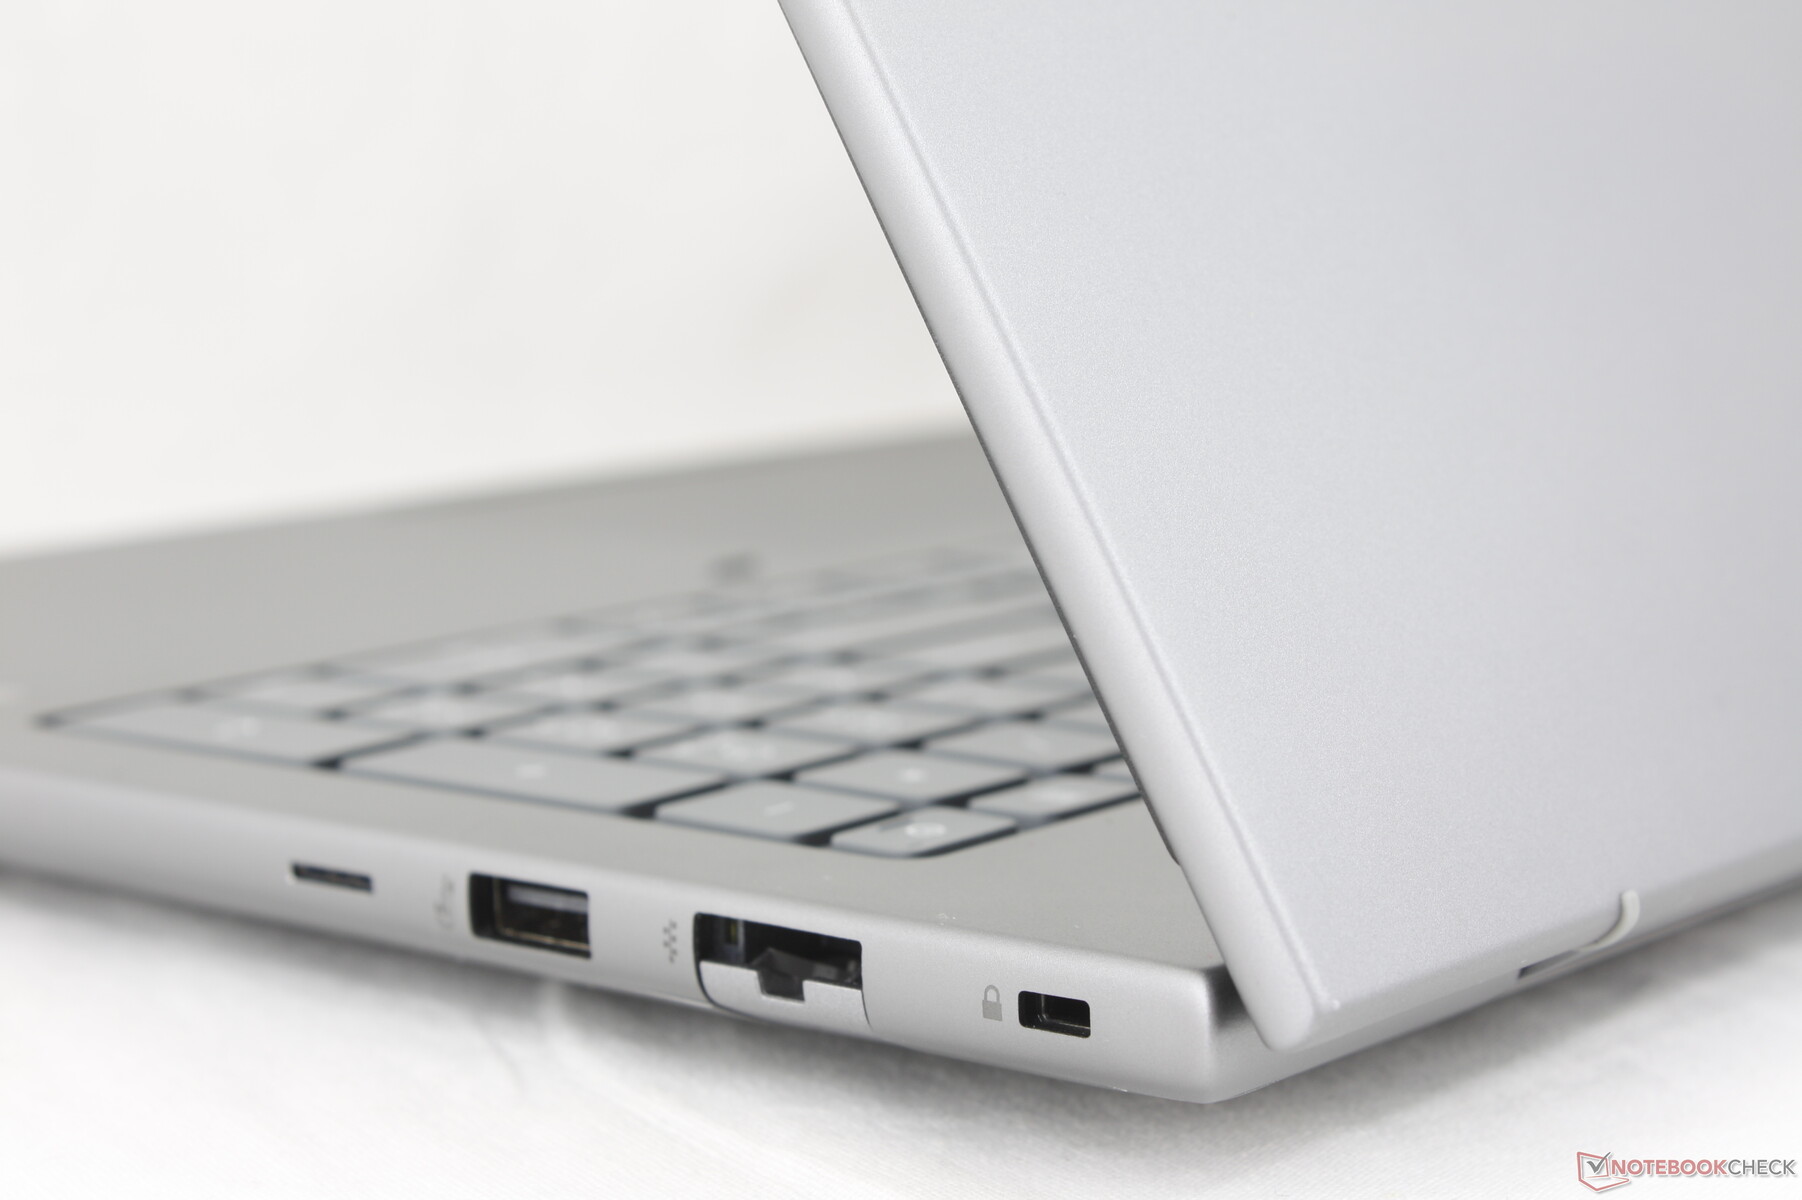
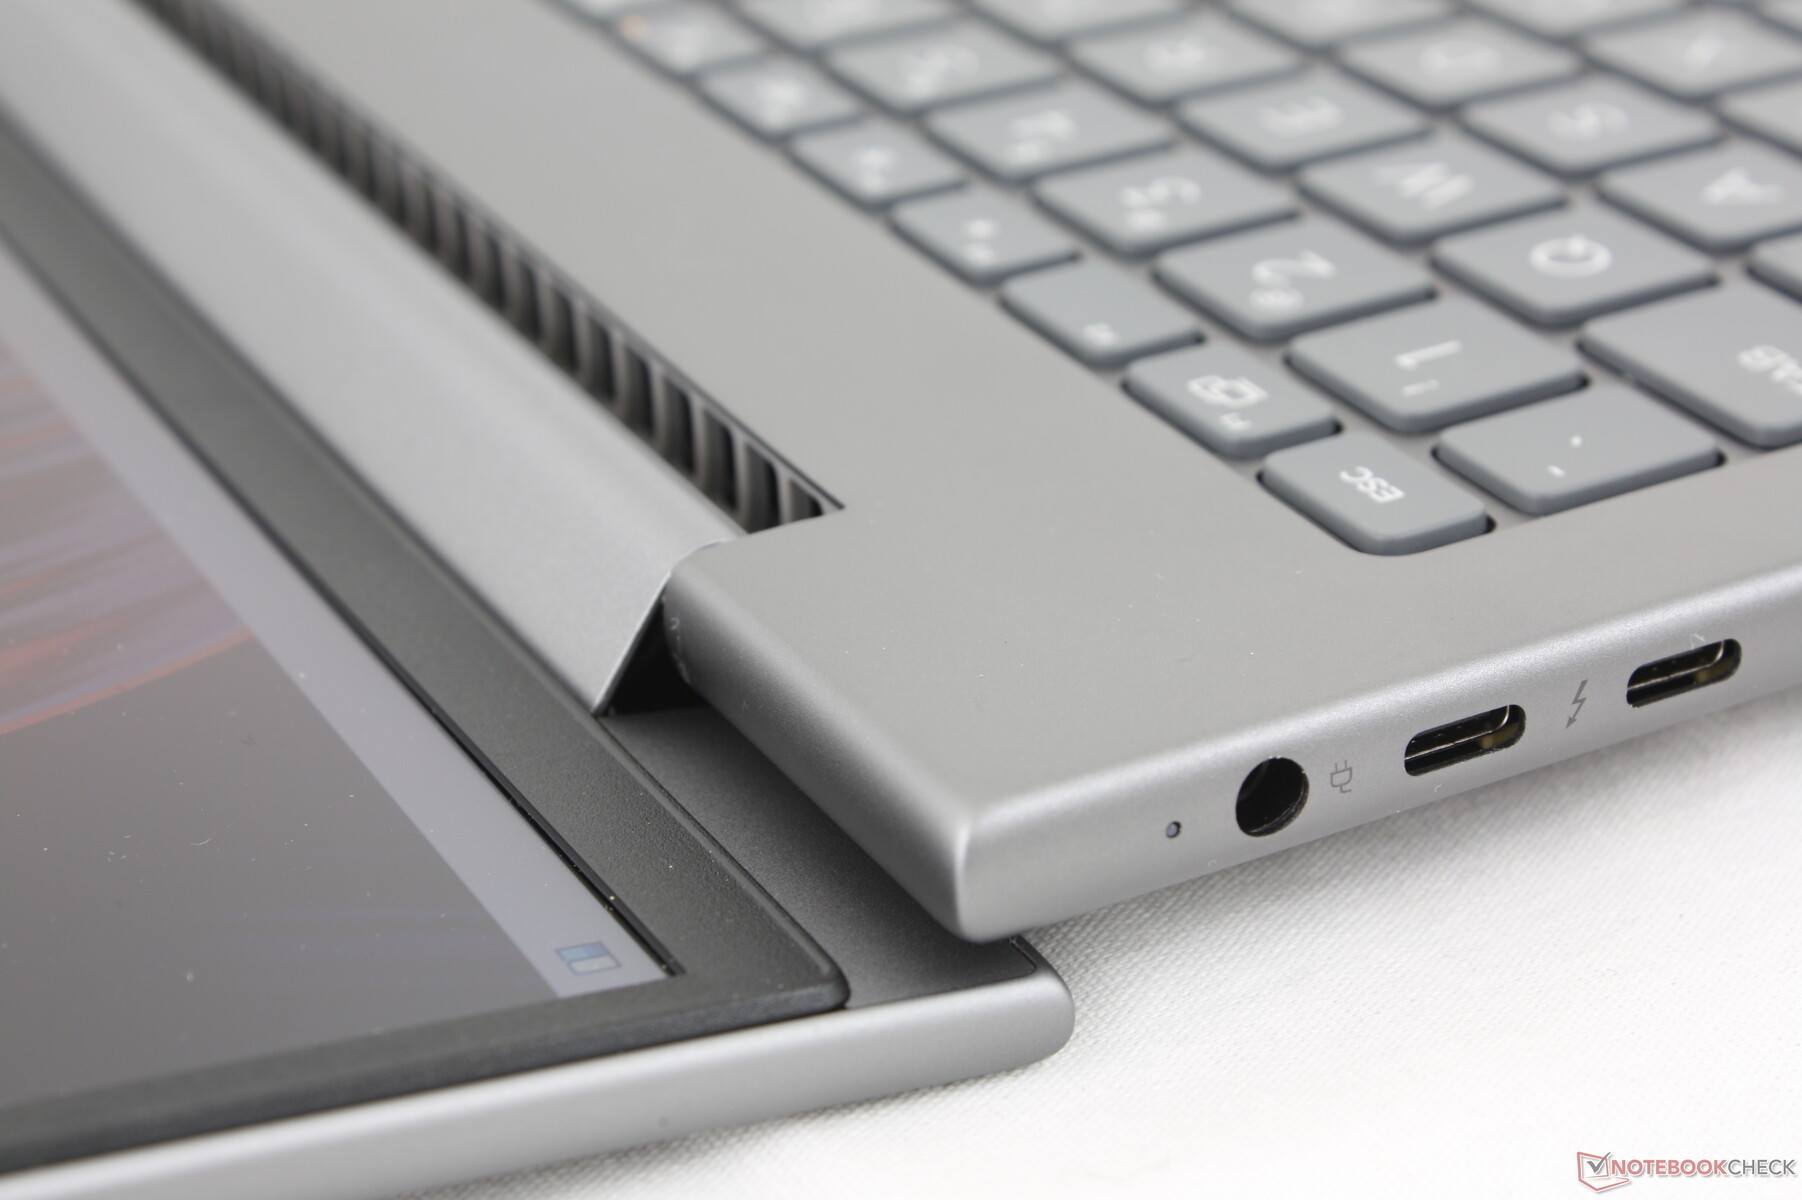
Il modello include meno porte USB-A rispetto allo ZBook Power 15 G10 dello scorso anno. Tutto il resto è tornato, compreso il lettore di Smart Card e le doppie porte USB-C Thunderbolt 4, anche se riorganizzate. Le porte lungo il bordo sinistro, in particolare, sono troppo affollate e avrebbero potuto essere distribuite un po' di più.
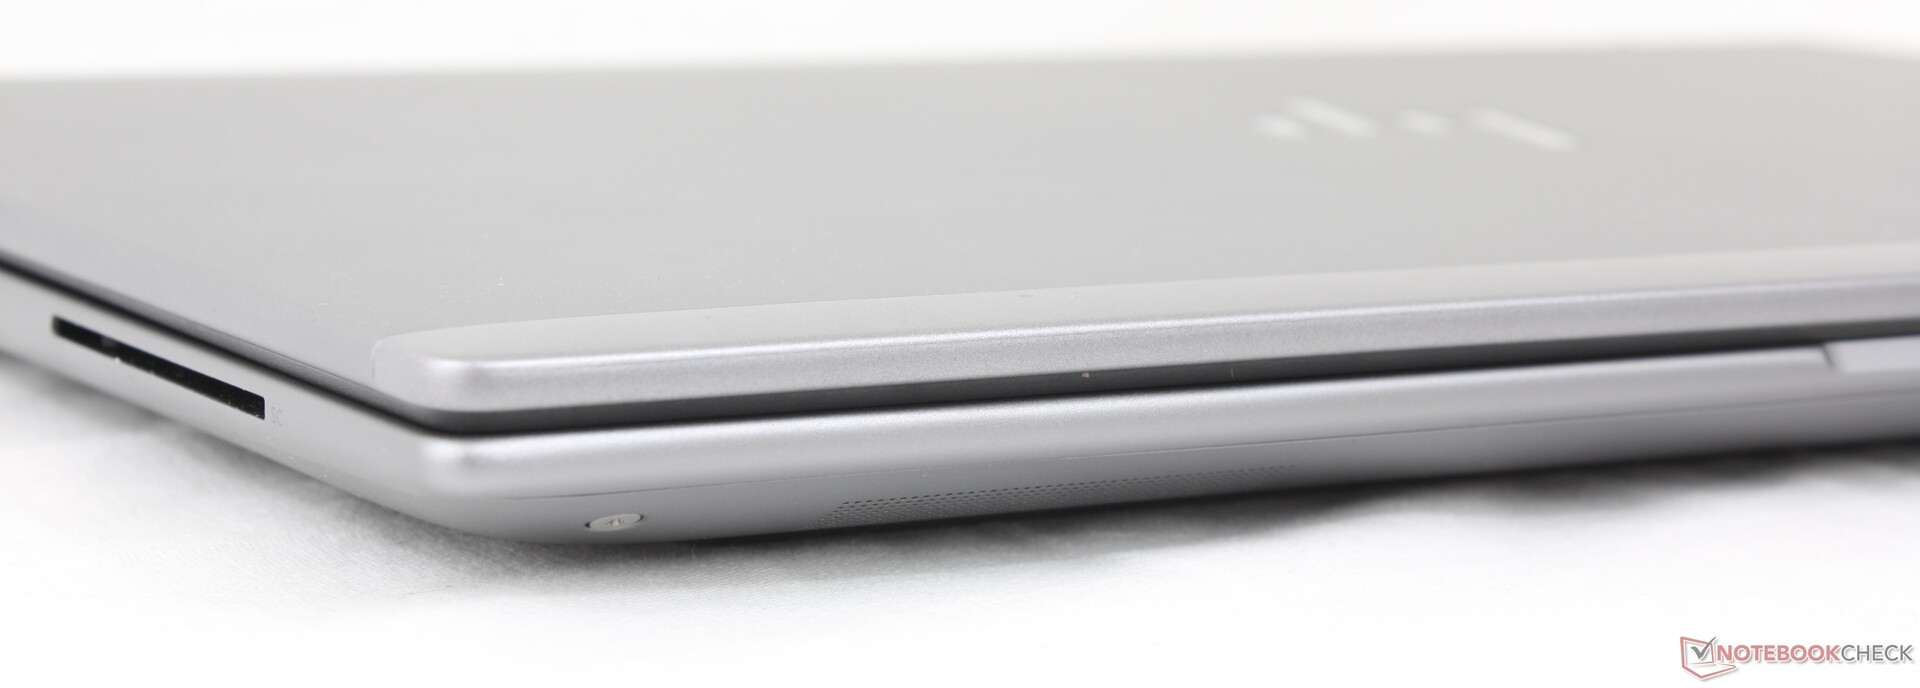

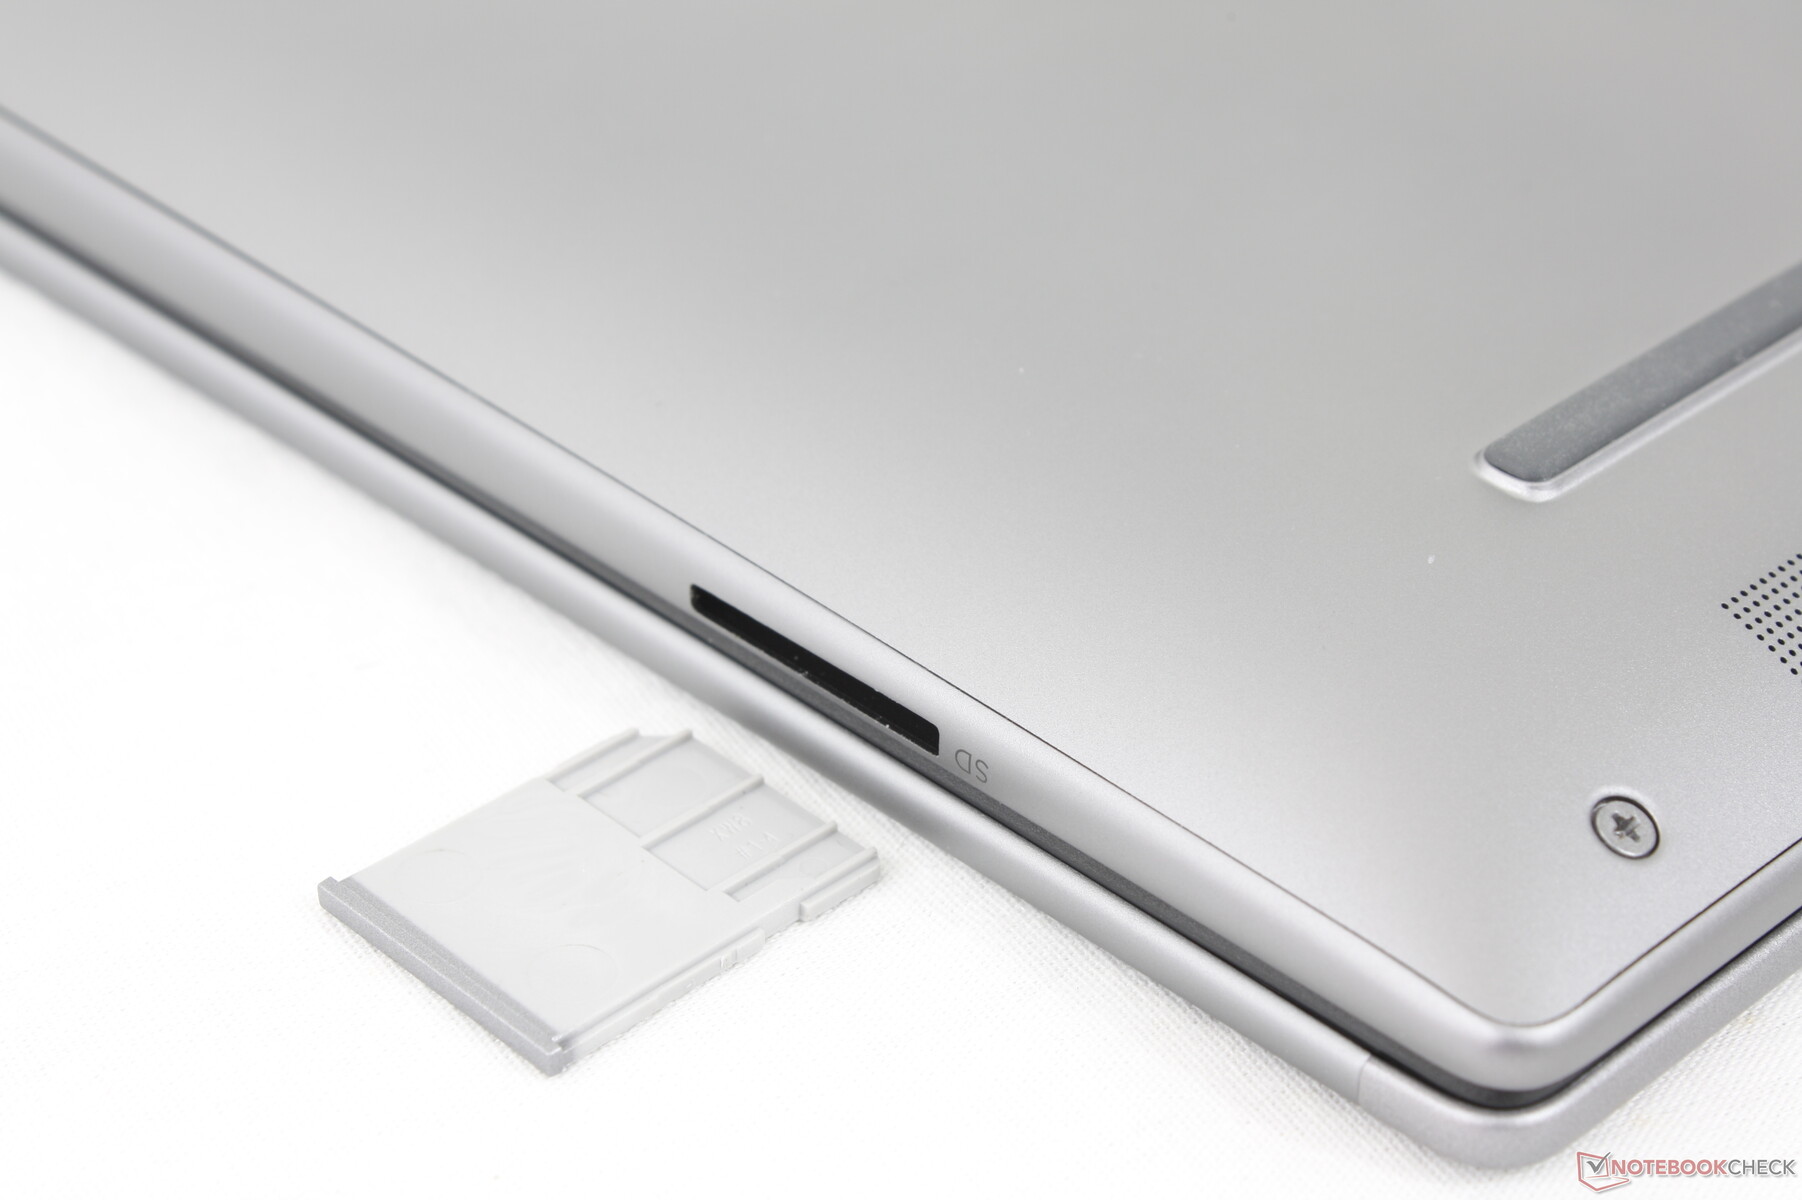
Lettore di schede SD
Il modello integra un lettore di schede MicroSD, mentre questa funzione mancava sullo ZBook Power 15 G10. Le velocità di trasferimento sono molto rapide; lo spostamento di 1 GB di immagini dalla nostra scheda di prova UHS-II richiede meno di 6 secondi, rispetto ai 12 secondi dello ZBook Fury 16 G11 o del ThinkPad P1 Gen 7.
| SD Card Reader | |
| average JPG Copy Test (av. of 3 runs) | |
| HP ZBook Power 16 G11 A (Toshiba Exceria Pro SDXC 64 GB UHS-II) | |
| HP ZBook Fury 16 G11 (Toshiba Exceria Pro SDXC 64 GB UHS-II) | |
| Lenovo ThinkPad P1 Gen 7 21KV001SGE (AV Pro V60) | |
| maximum AS SSD Seq Read Test (1GB) | |
| HP ZBook Power 16 G11 A (Toshiba Exceria Pro SDXC 64 GB UHS-II) | |
| HP ZBook Fury 16 G11 (Toshiba Exceria Pro SDXC 64 GB UHS-II) | |
| Lenovo ThinkPad P1 Gen 7 21KV001SGE (AV Pro V60) | |
Comunicazione
Il MediaTek MT7922 è standard per la connettività Wi-Fi 6E e Bluetooth 5.2. Sono disponibili anche opzioni Realtek e HP 4000 o Qualcomm 9205 per la connettività WAN.
Webcam
Una webcam da 5 MP è di serie, insieme a IR e a un cursore fisico per l'otturatore simile a quello del ThinkPad P16s G2. Il Precision 5690 è dotato di una webcam da 2 MP a risoluzione molto più bassa.


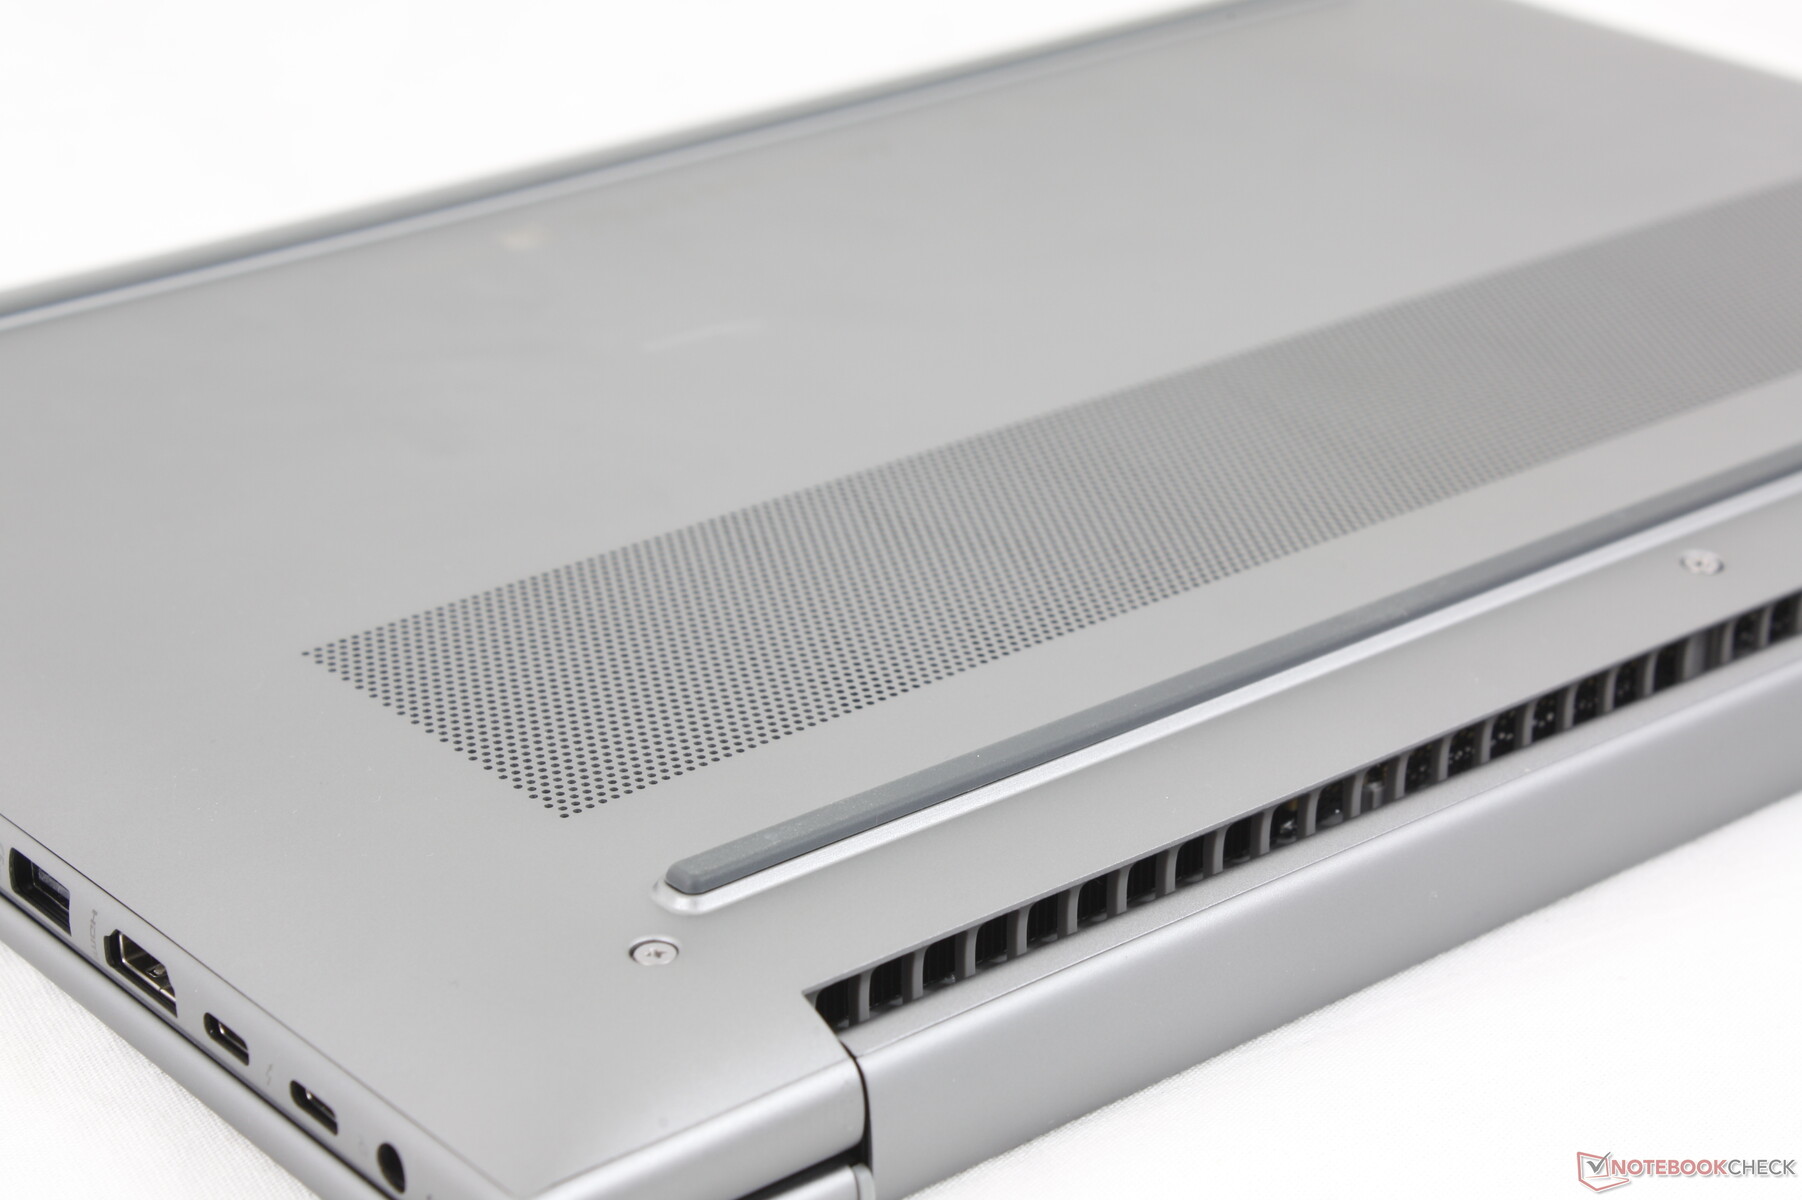
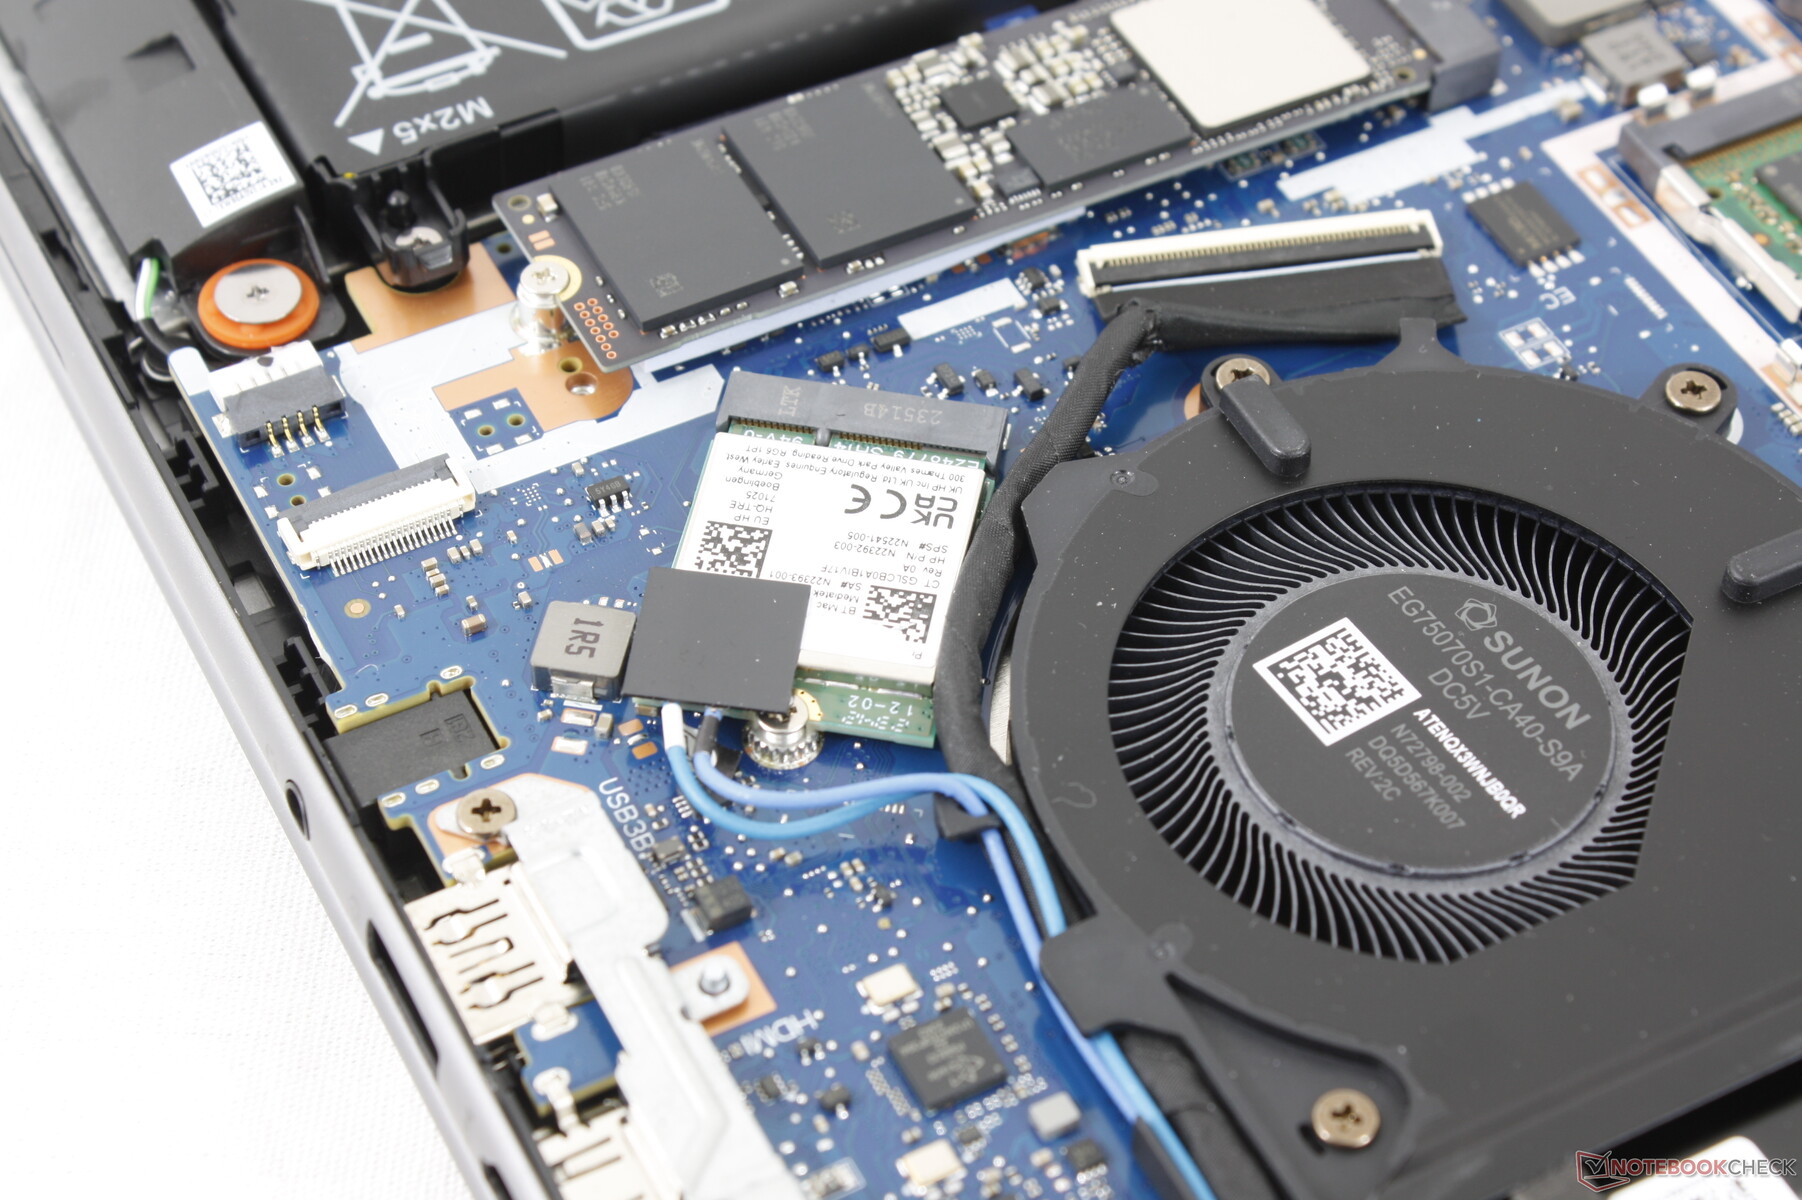
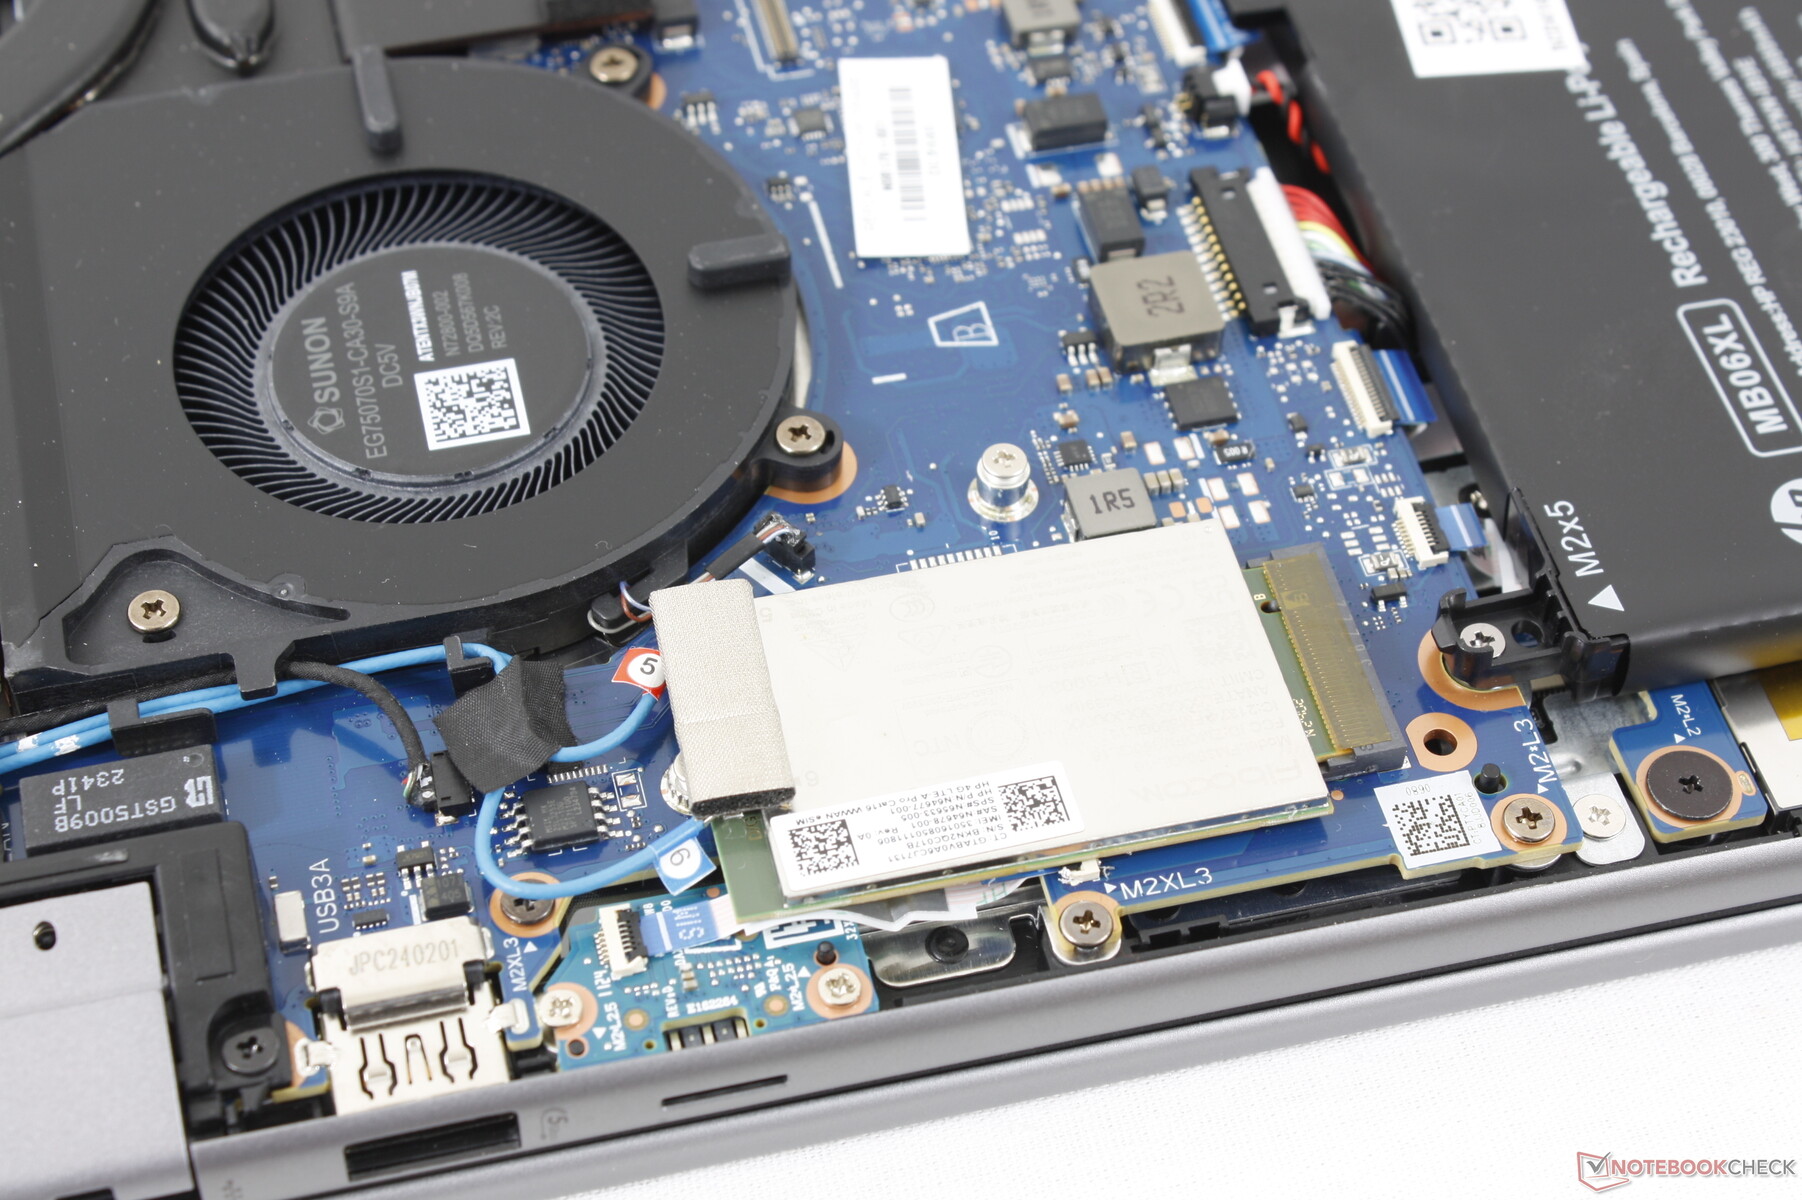
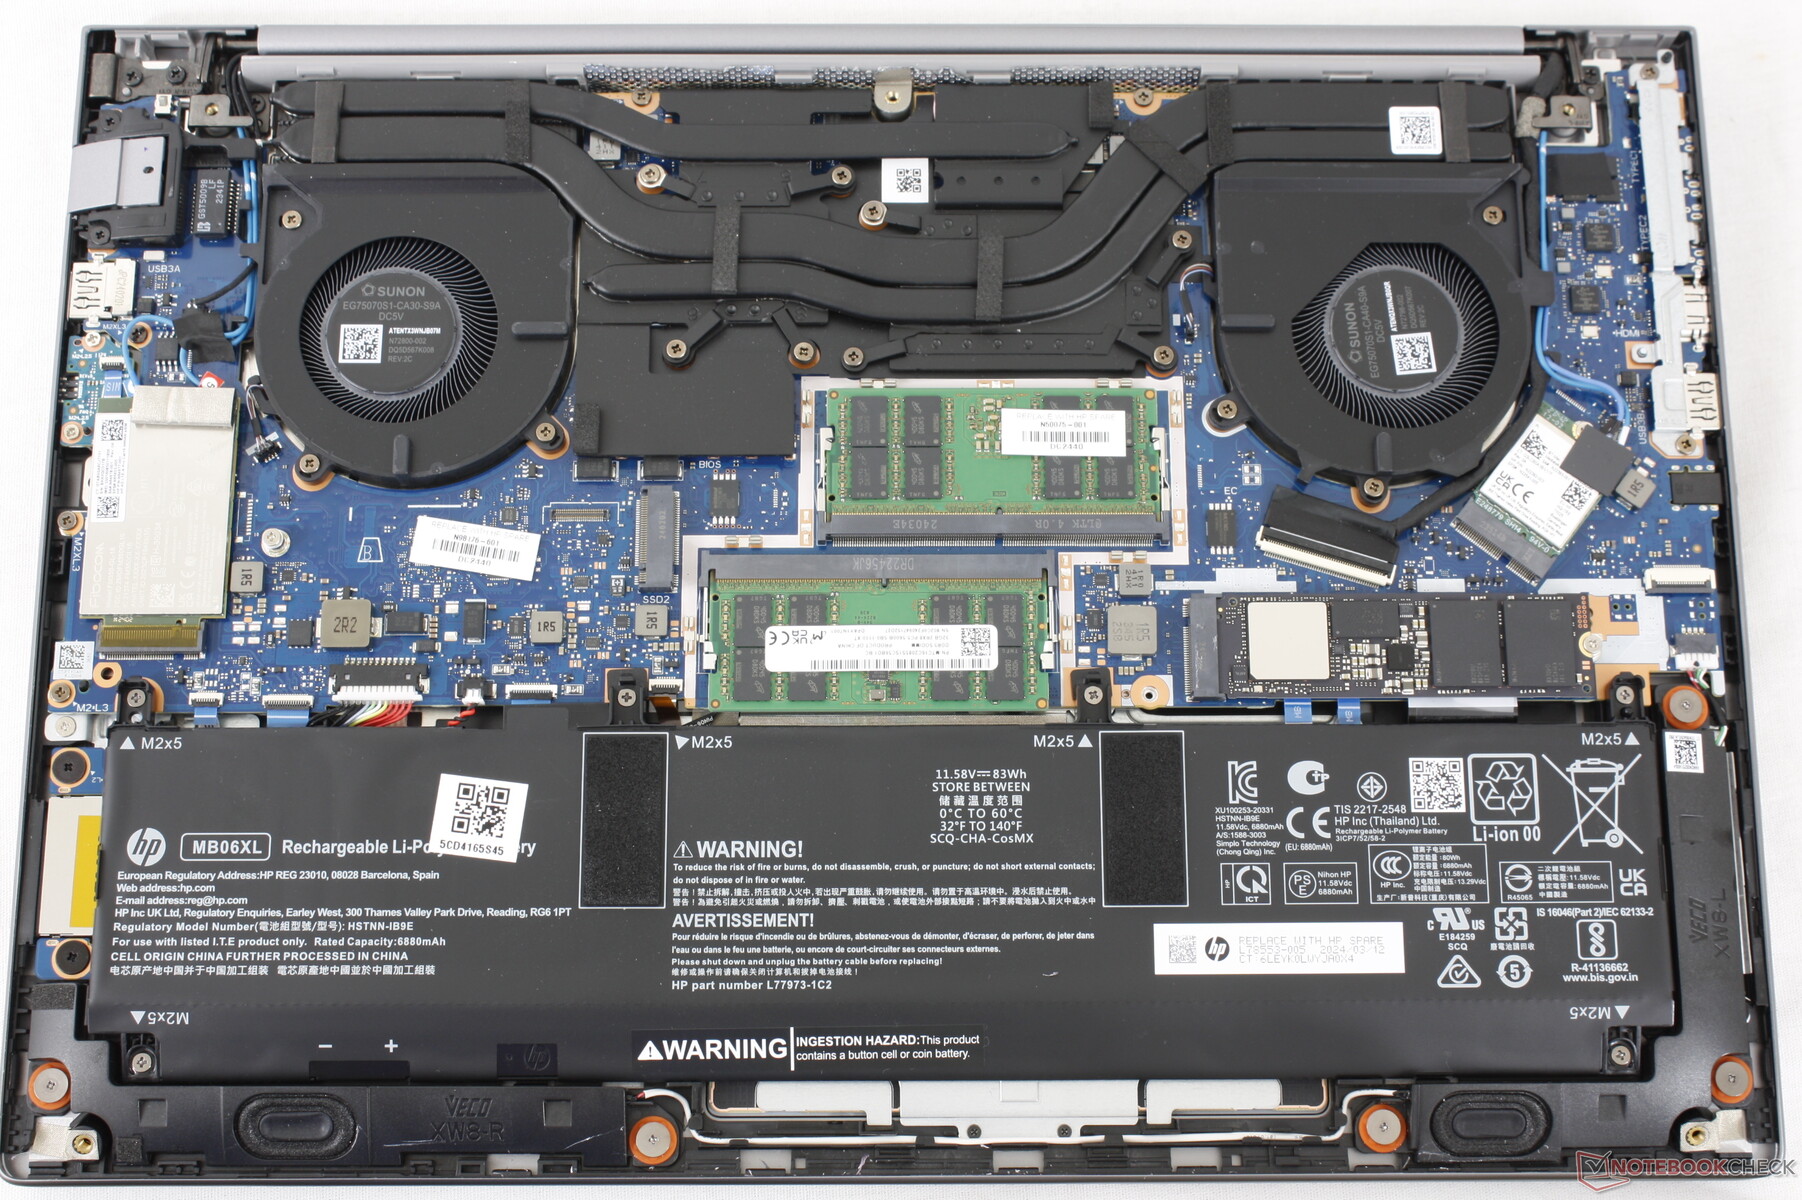
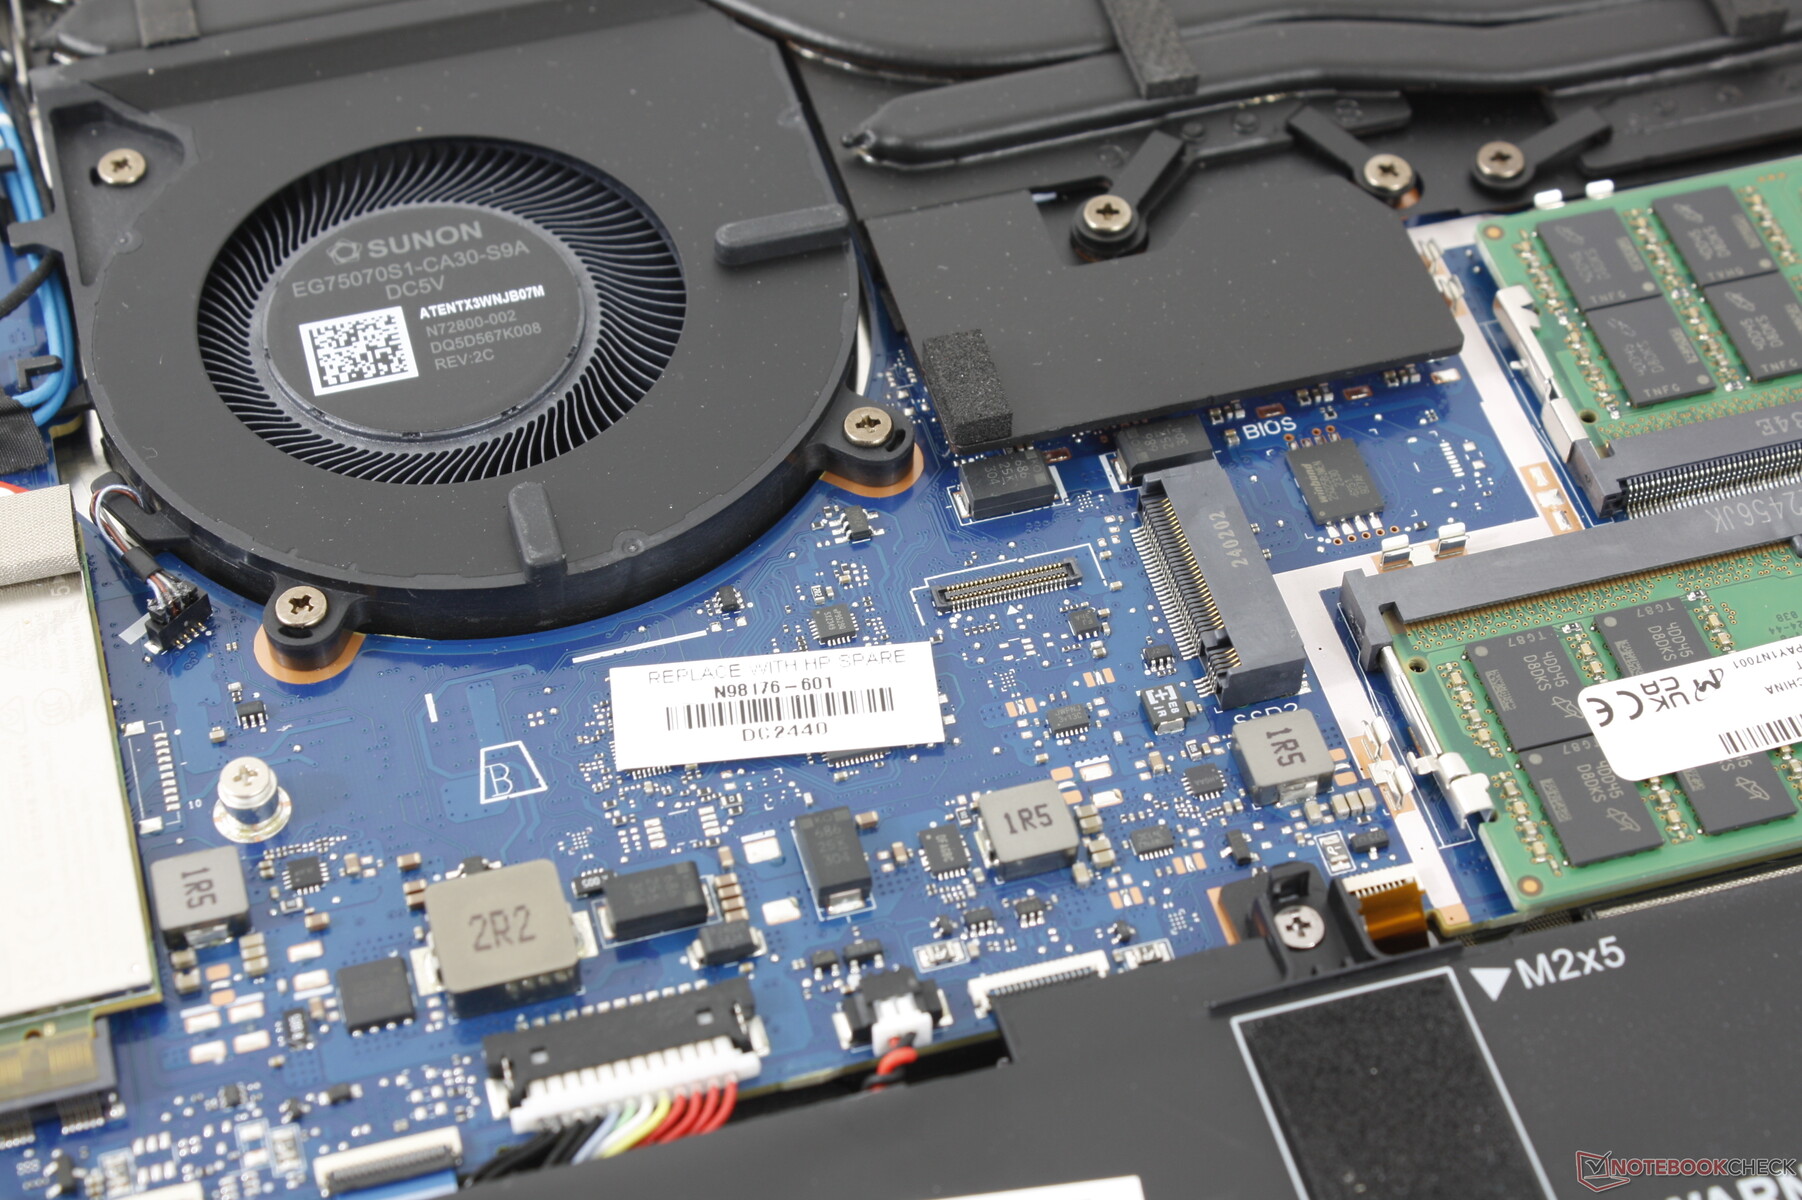
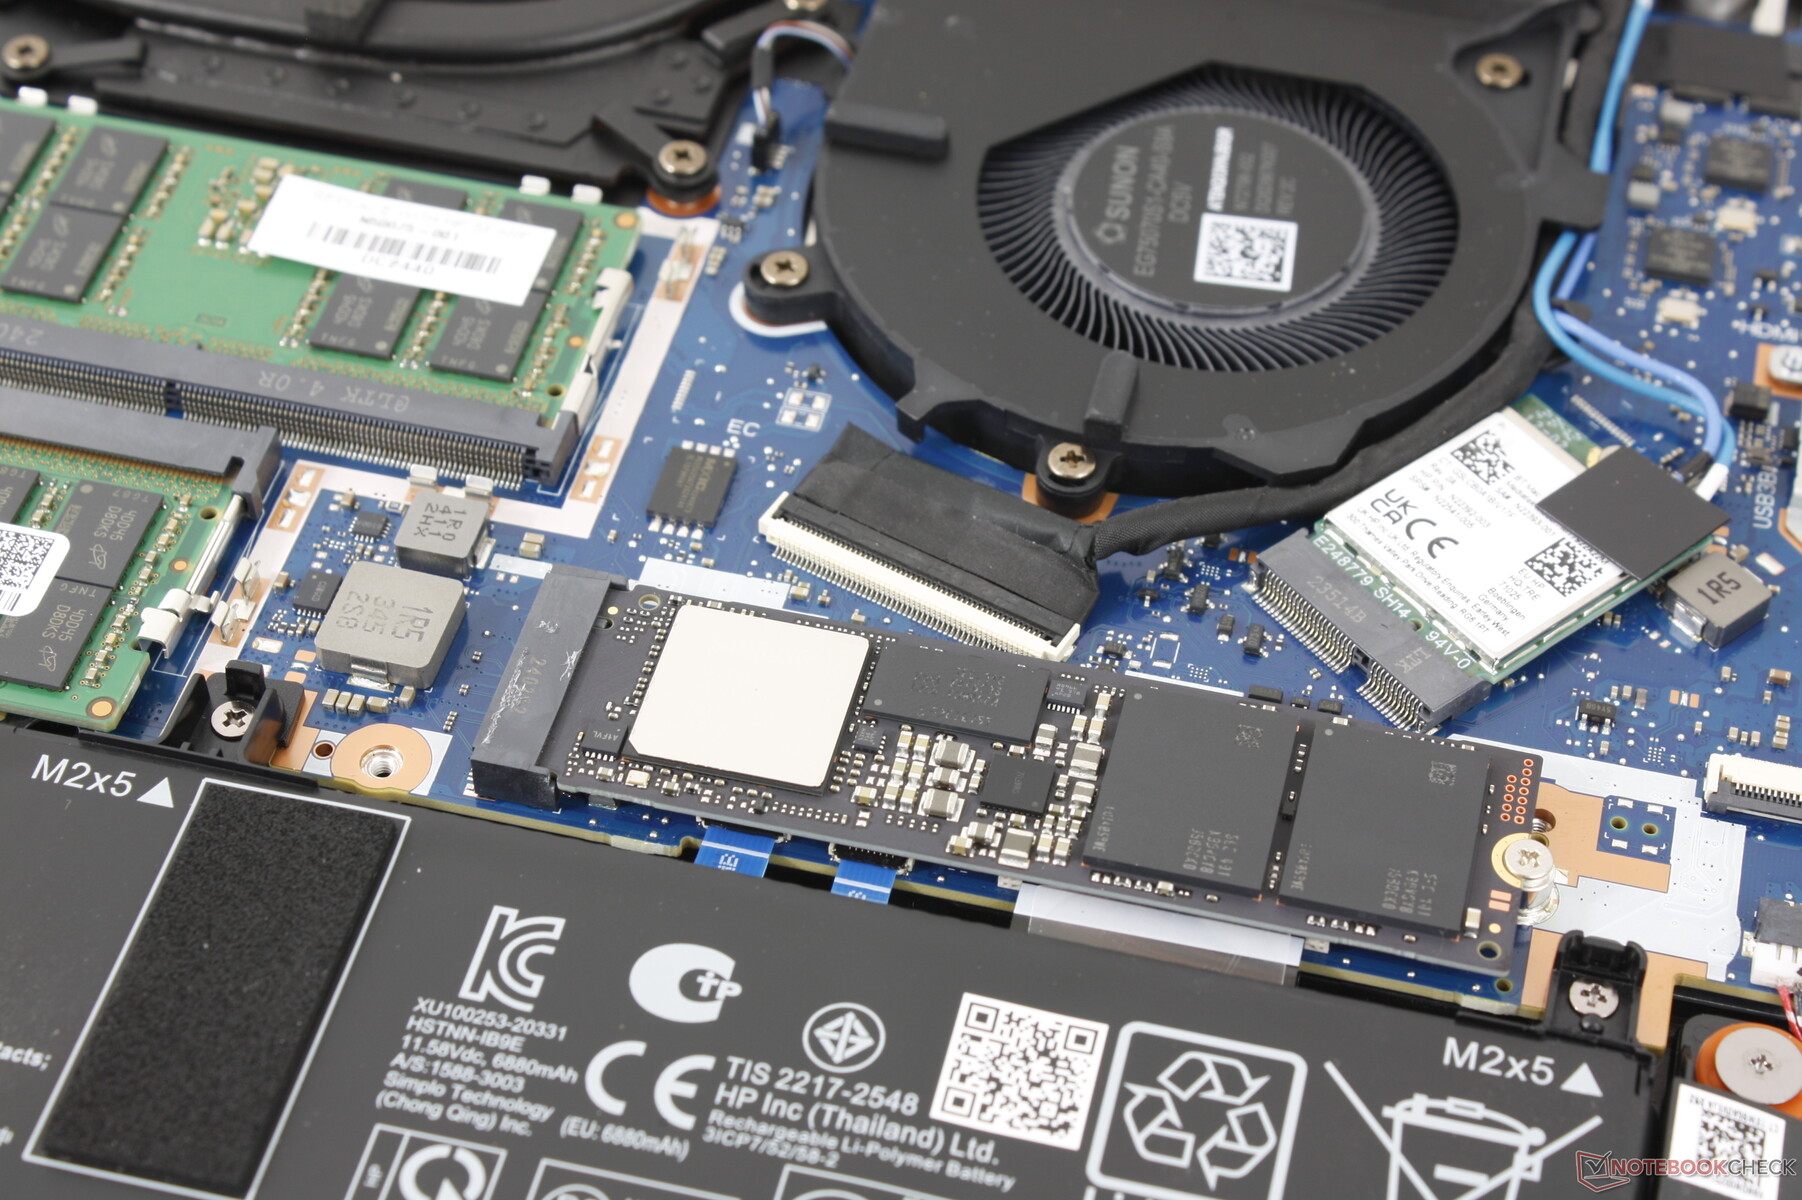
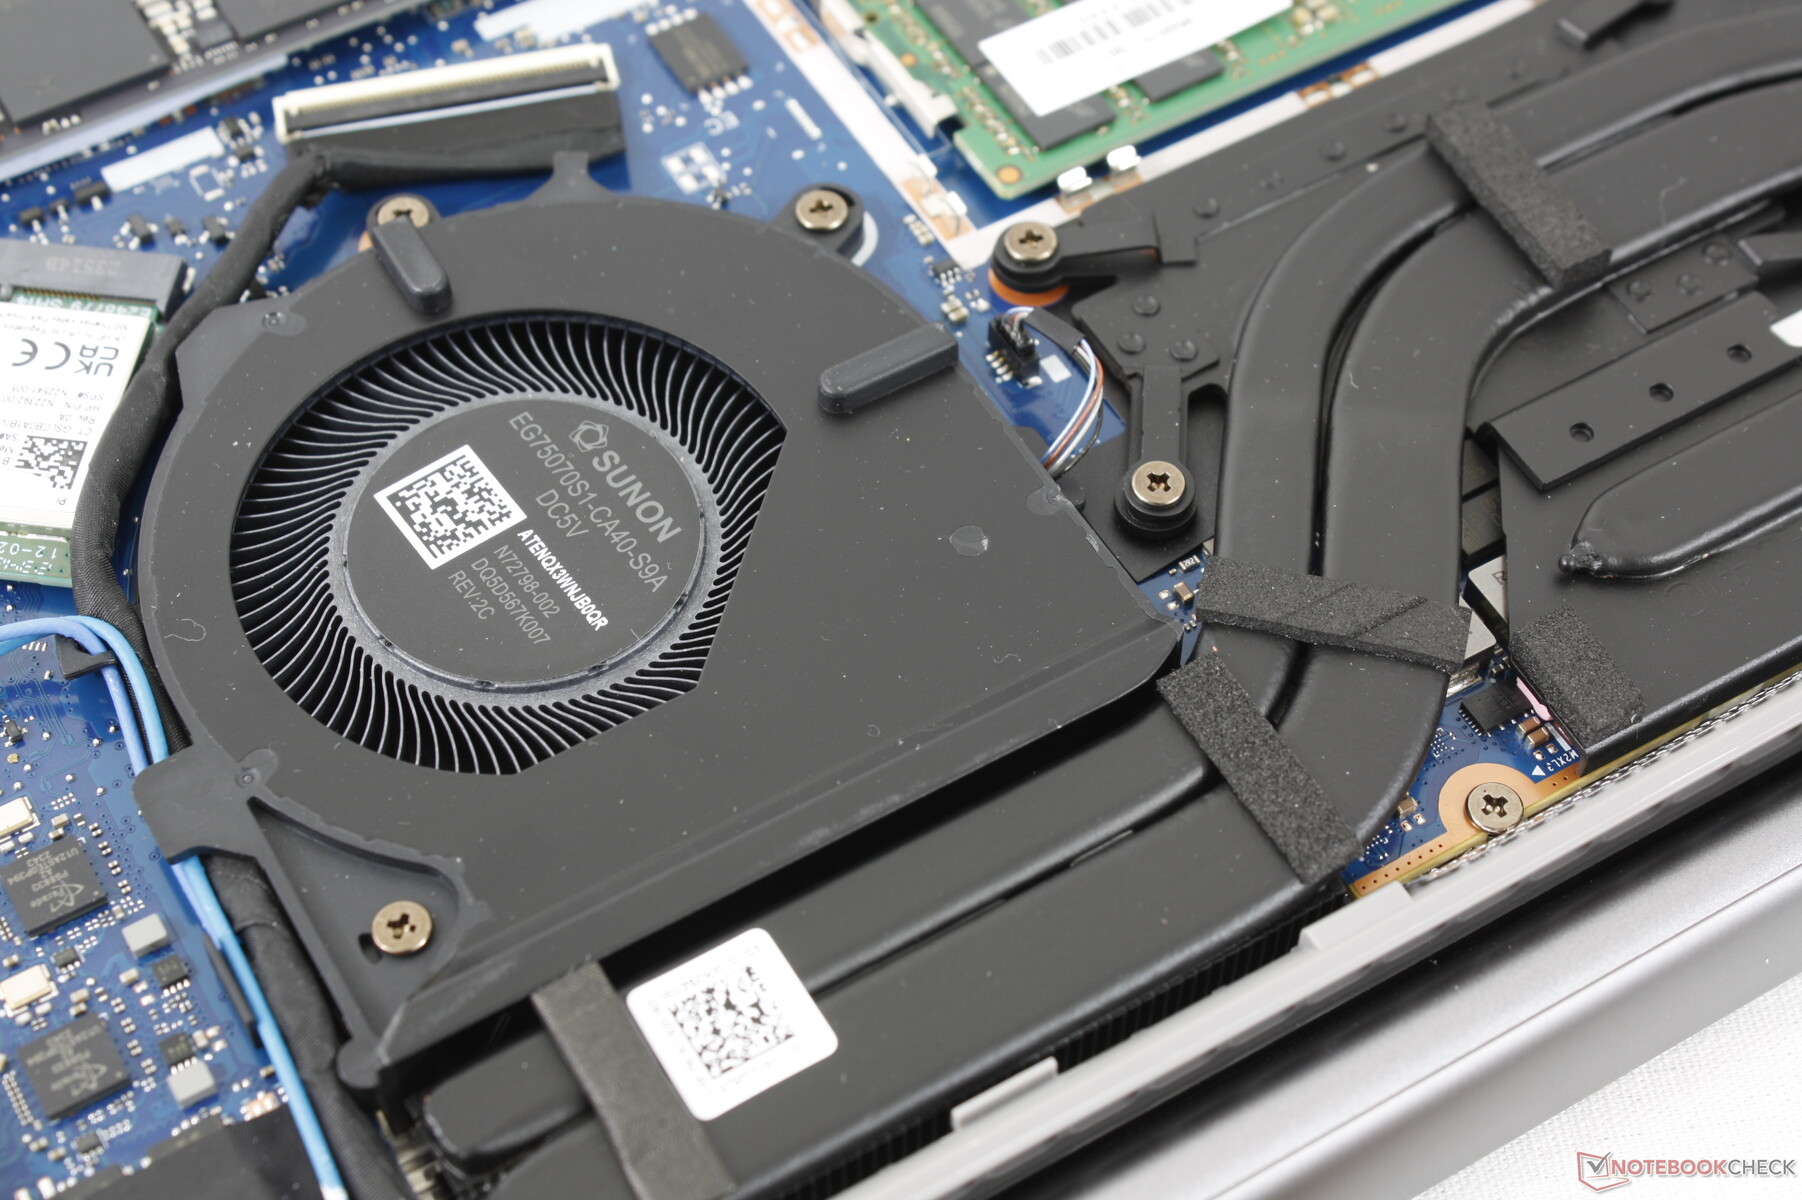
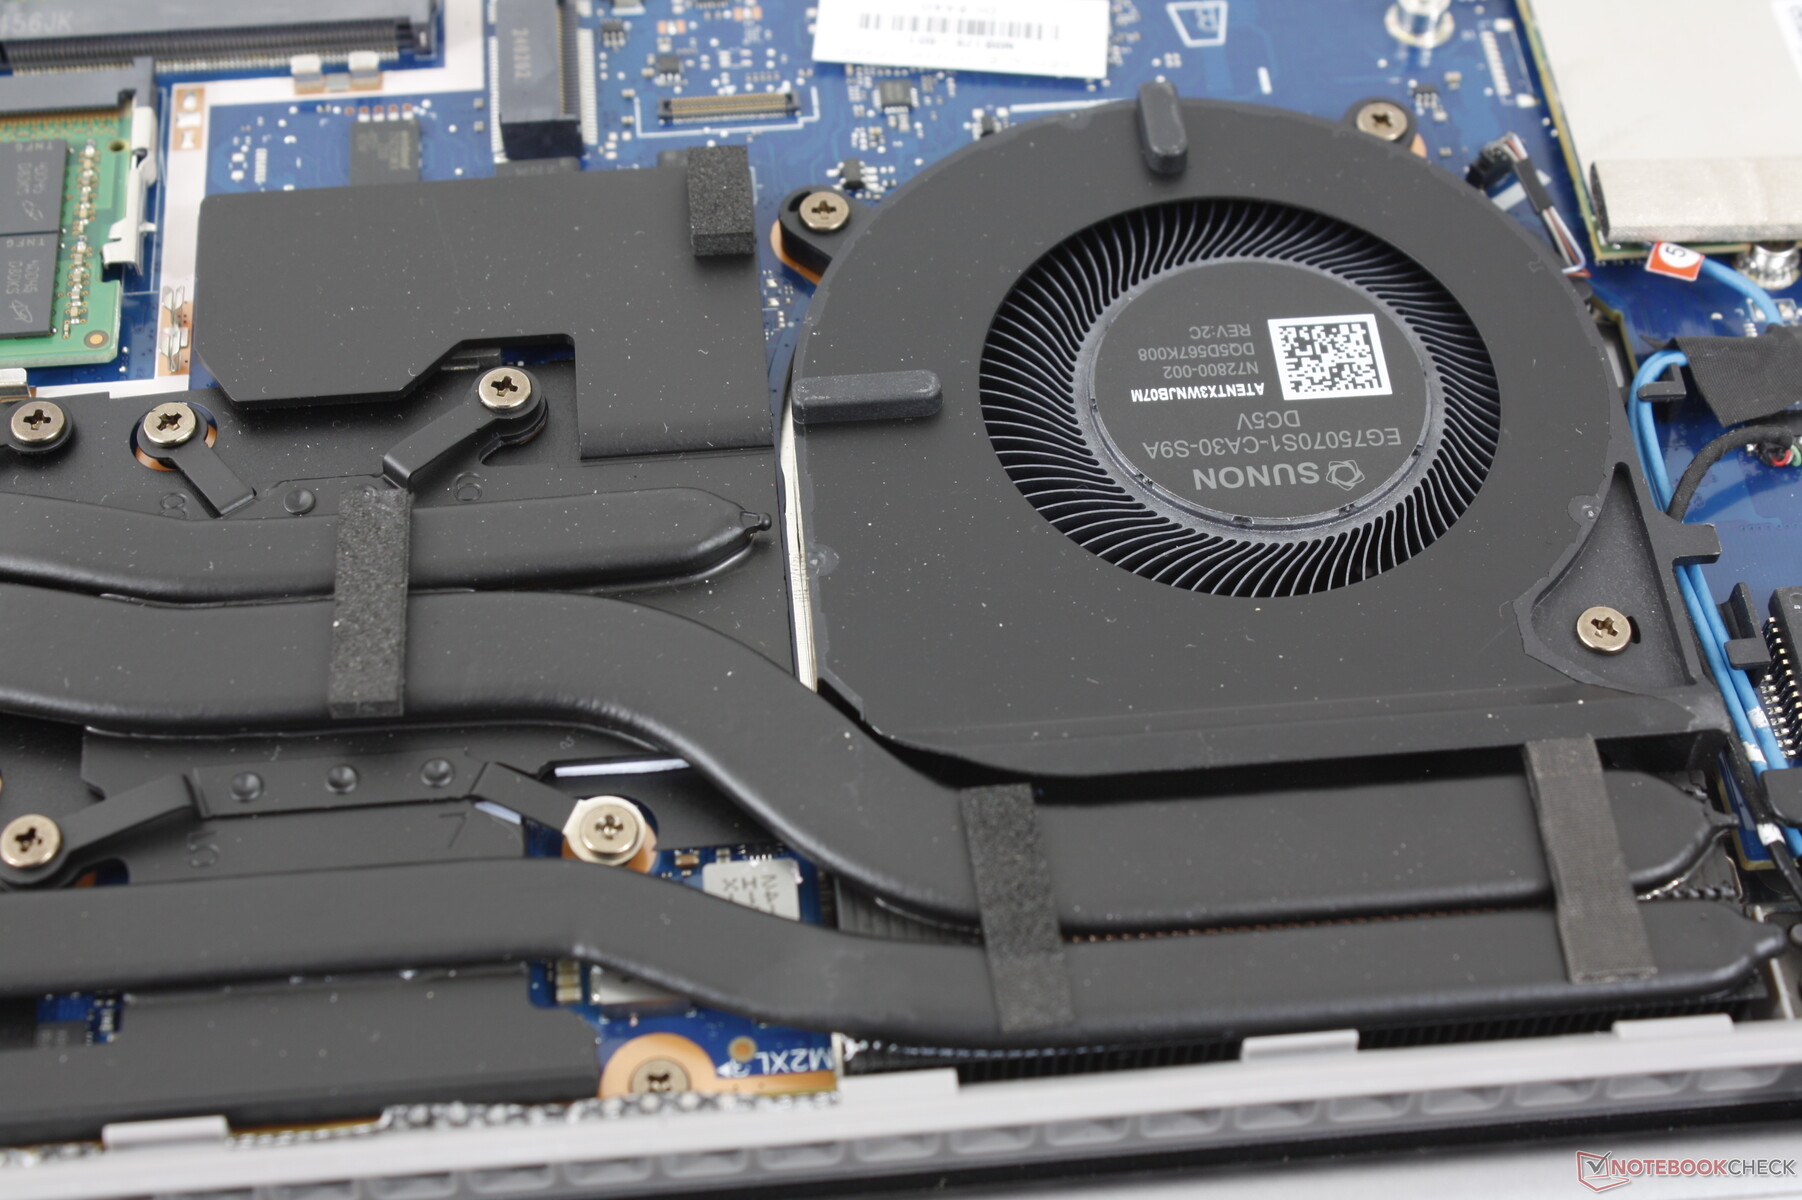
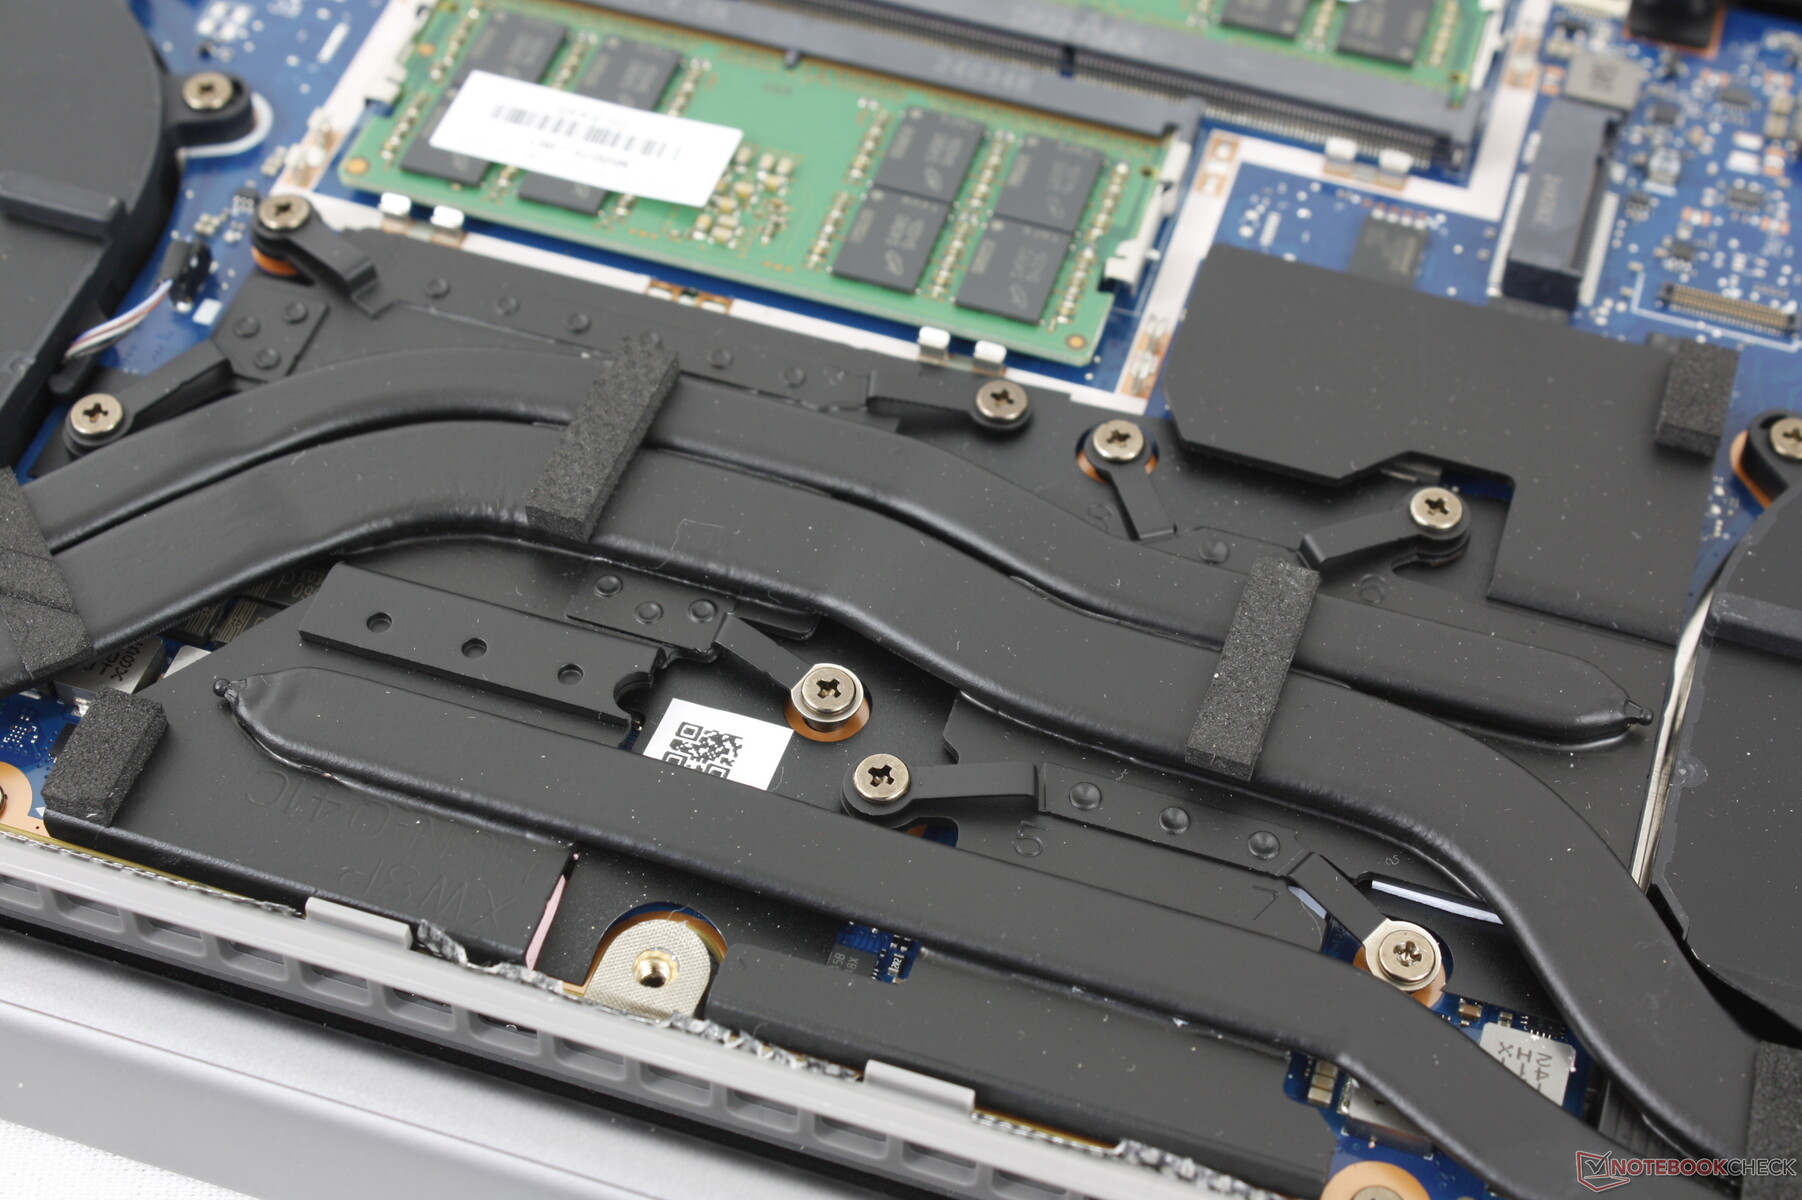
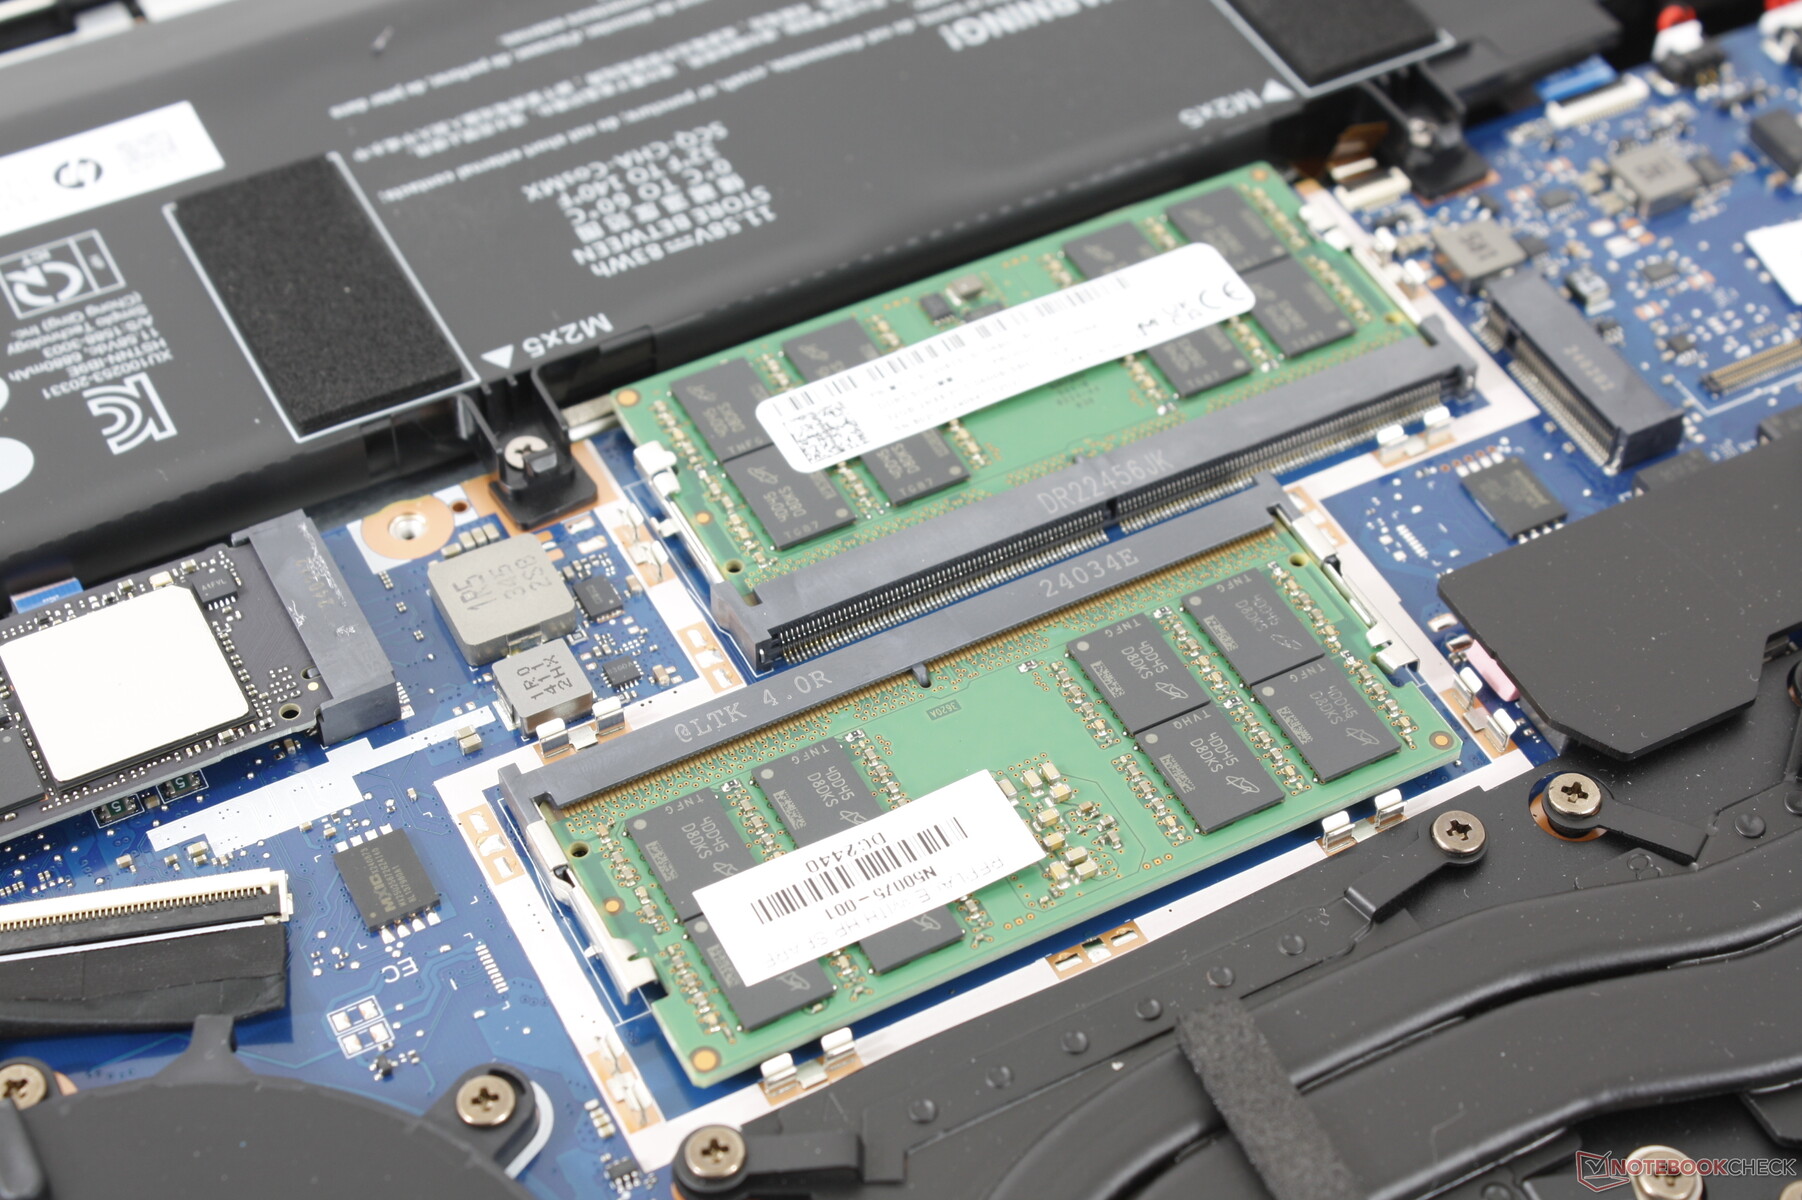
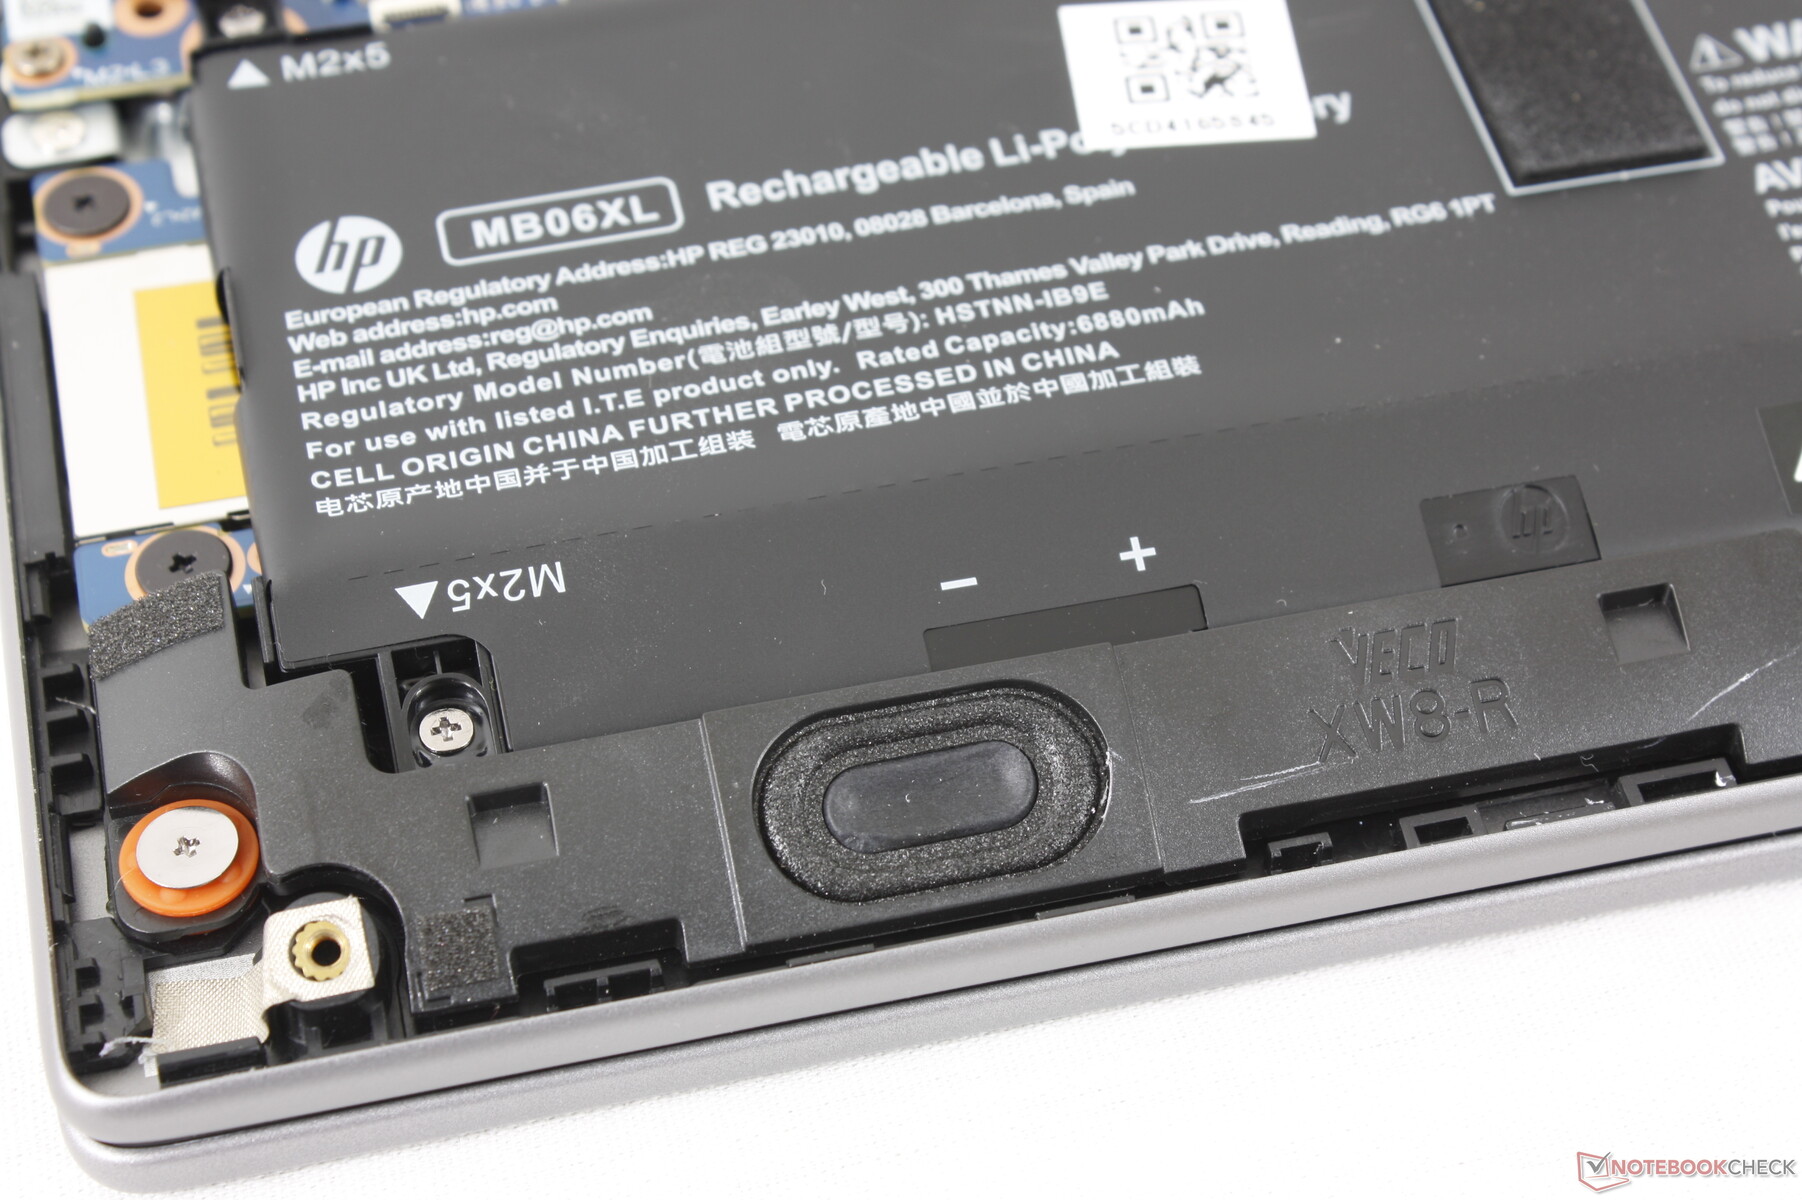
Manutenzione
Il pannello inferiore si stacca con relativa facilità con un cacciavite Phillips e un bordo affilato. Gli interni sono stati completamente ridisegnati rispetto allo ZBook Power 15 G10, pur mantenendo le stesse opzioni aggiornabili come gli slot 2x SODIMM, 2x slot SSD PCIe4 x4 NVMe e il modulo WLAN rimovibile. La WAN è un'opzione aggiunta questa volta.
Sostenibilità
La produzione utilizza un basso contenuto di alogeni, mentre l'imballaggio è costituito da polpa di carta stampata e plastica riciclata proveniente da fonti sostenibili al 100 per cento e da fonti post-consumo al 60 per cento, rispettivamente.
Accessori e garanzia
Nella confezione non ci sono extra, oltre all'adattatore CA e alla documentazione cartacea. Purtroppo, la garanzia limitata standard è di un solo anno se acquistata negli Stati Uniti, mentre lo ZBook Fury ha tre anni di serie.
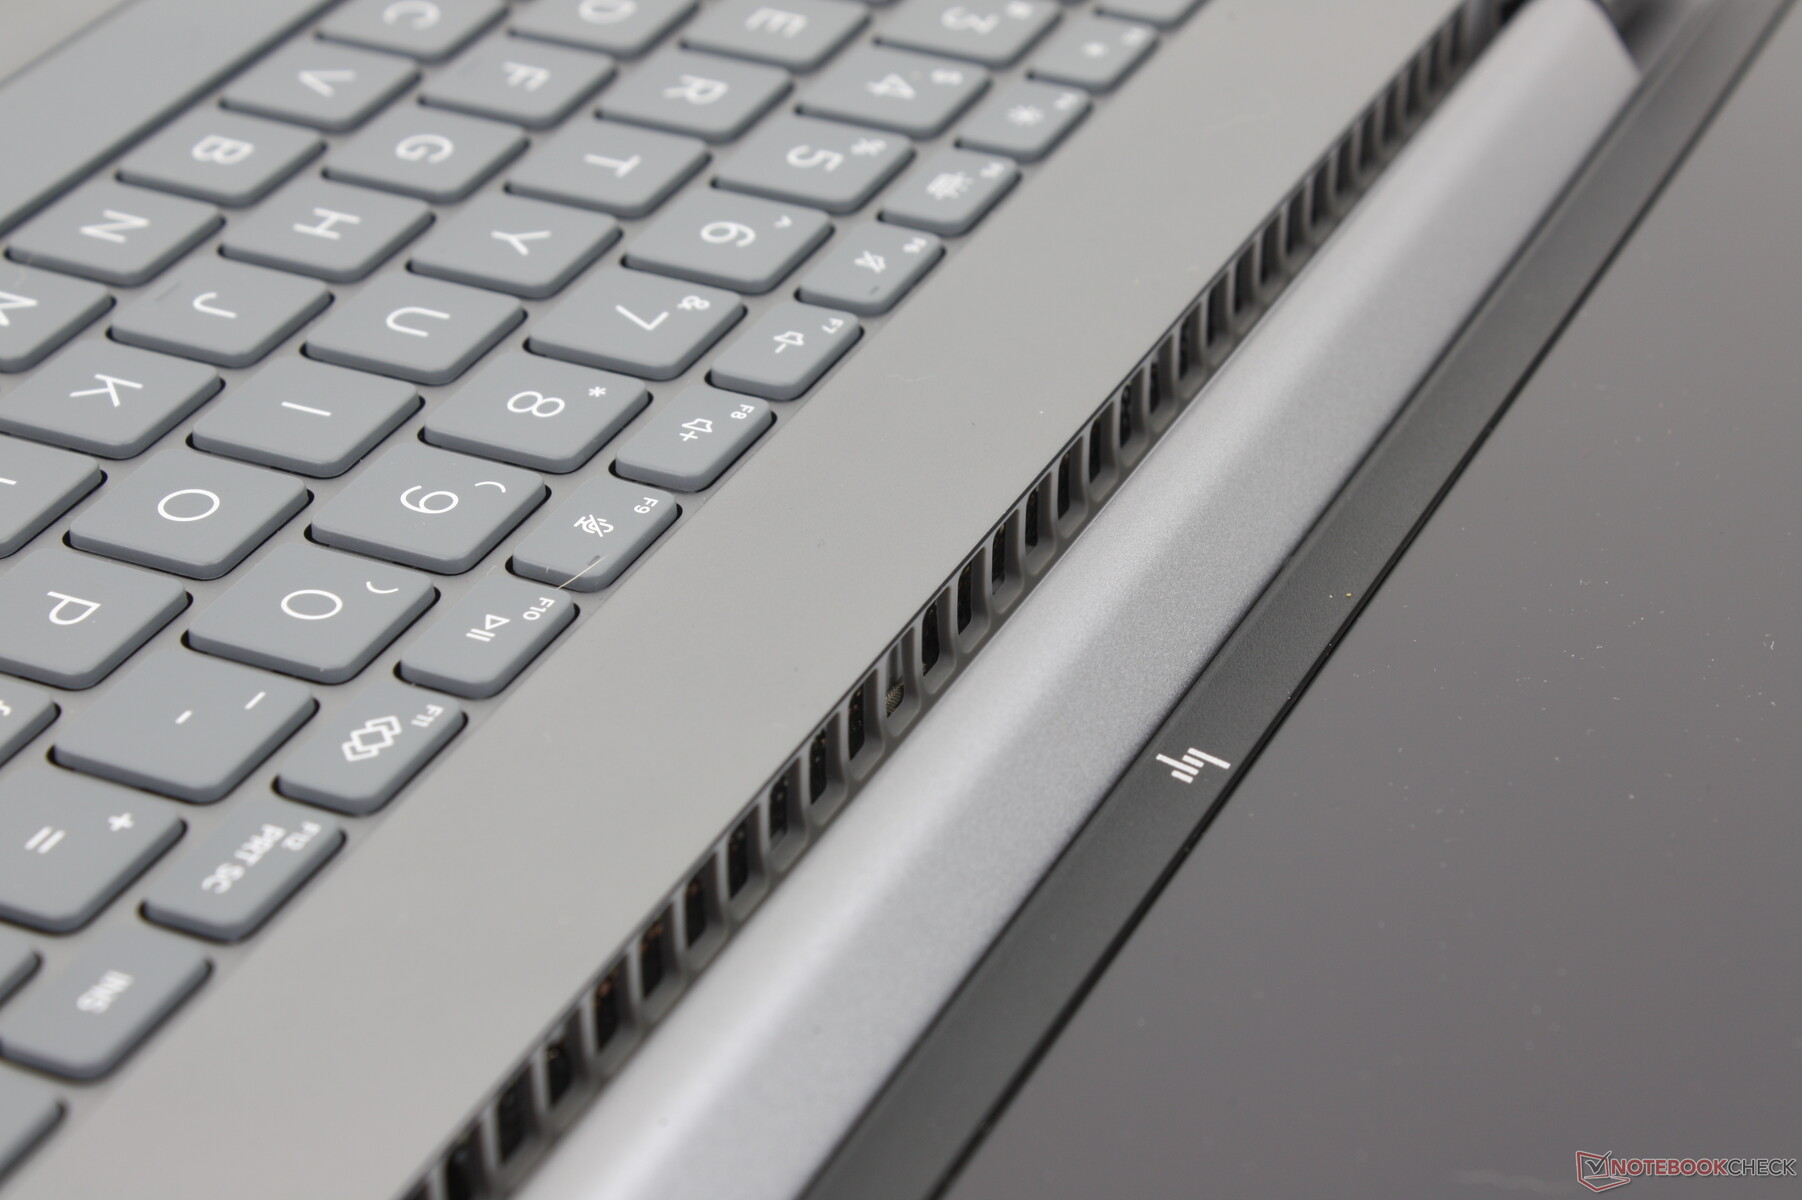
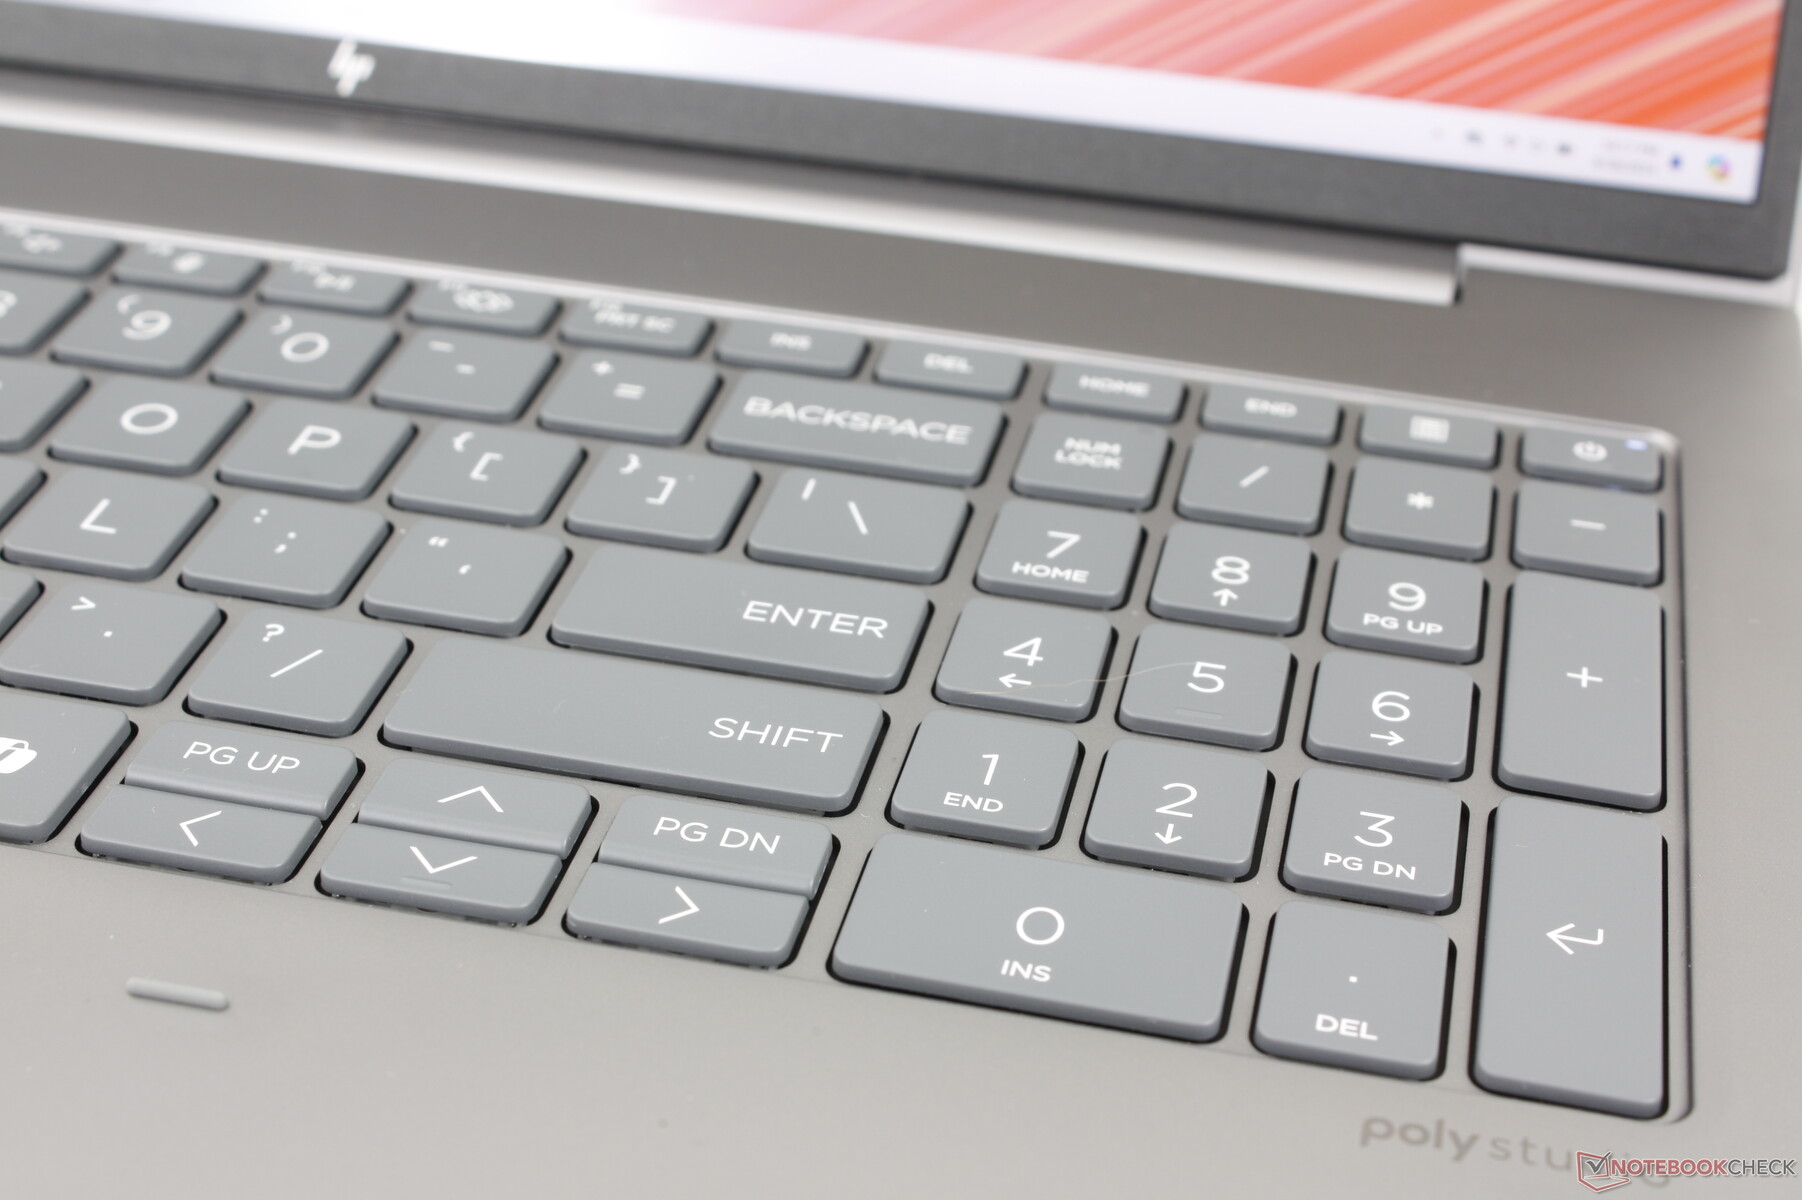
Dispositivi di input - Tasti spaziosi
Tastiera
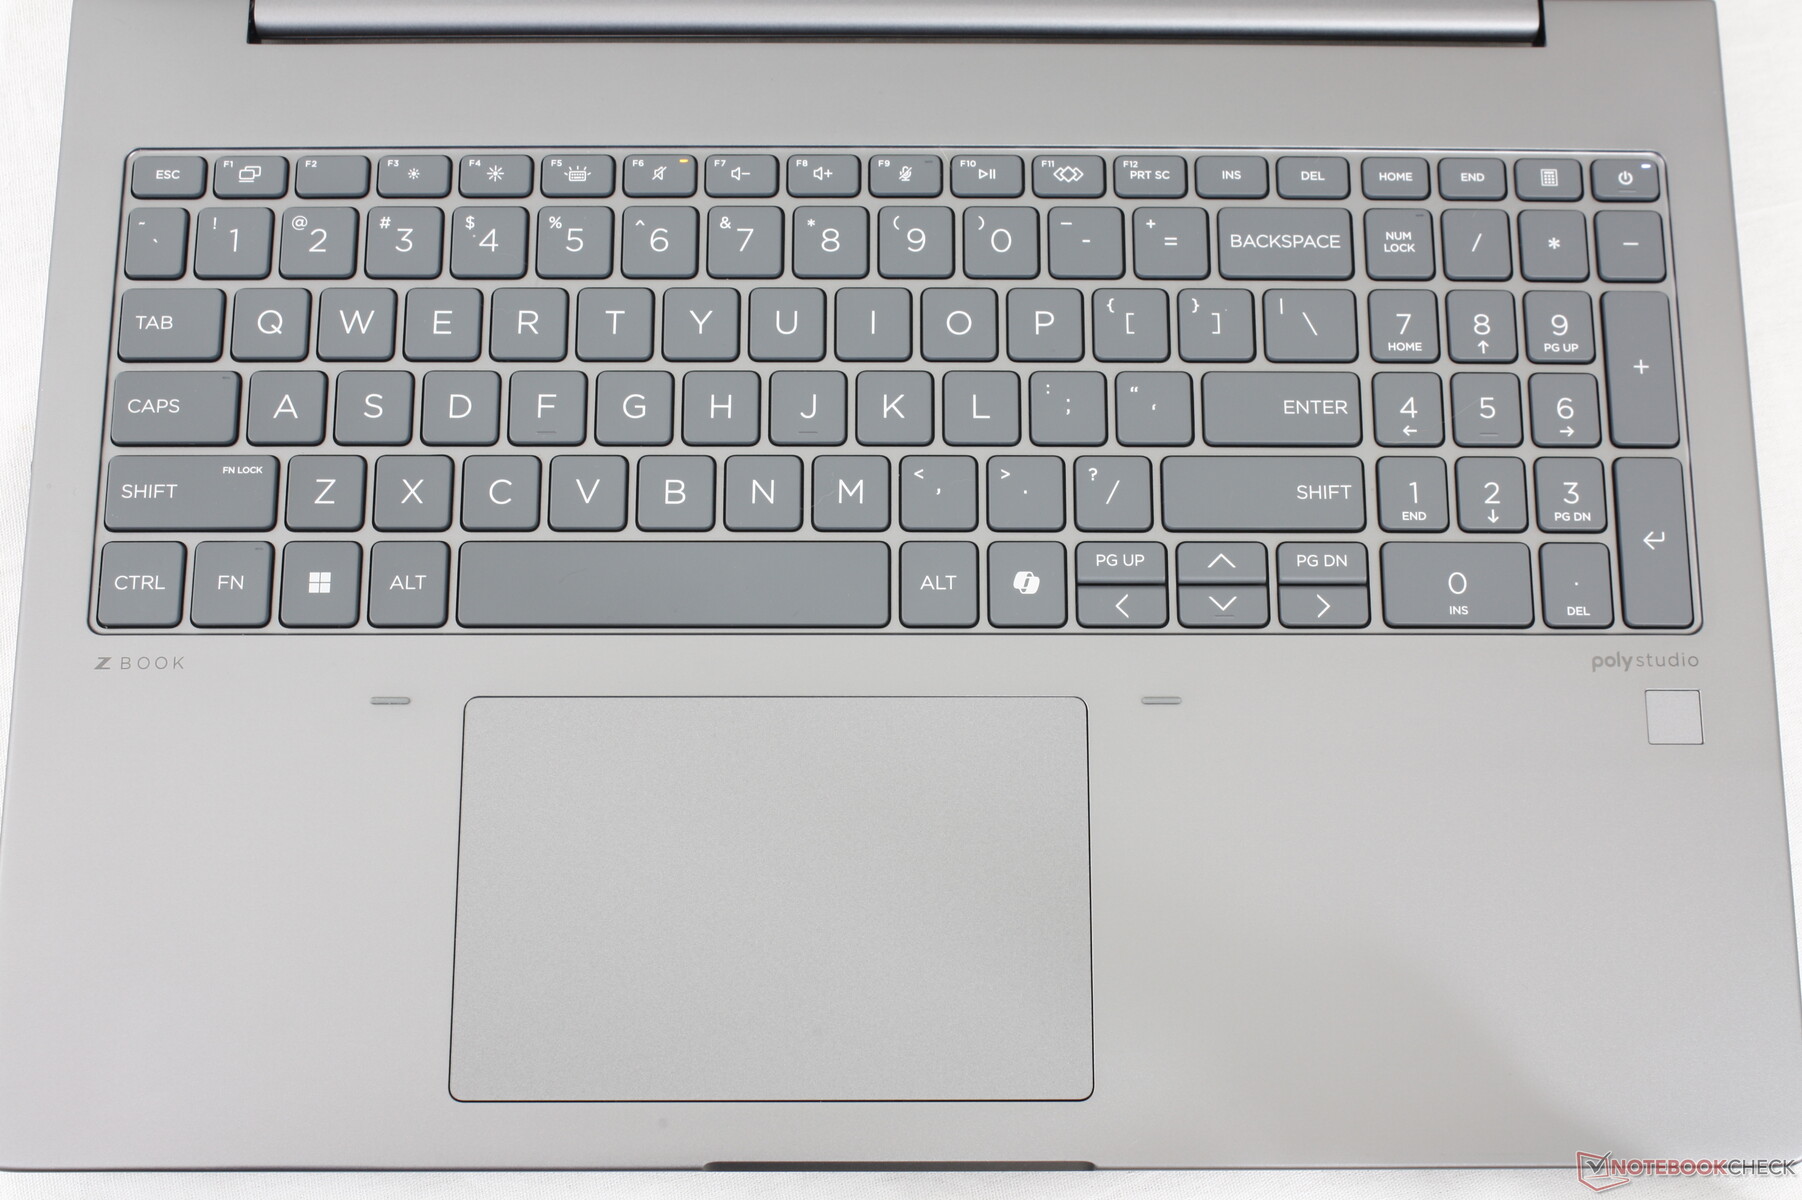
L'esperienza di digitazione è simile a quella di un Spectre x360 16 in quanto i tasti sono solidi con un feedback relativamente nitido per essere comodi per la digitazione. In particolare, la corsa dei tasti è più profonda rispetto alla maggior parte degli Ultrabook, per evitare il tipico feedback superficiale o spugnoso.
Il tastierino numerico è tornato, mentre manca sul concorrente Precision 5690. Tuttavia, i suoi tasti sono leggermente più stretti rispetto ai tasti QWERTY principali e quindi il feedback è sensibilmente più morbido quando vengono premuti.
Touchpad
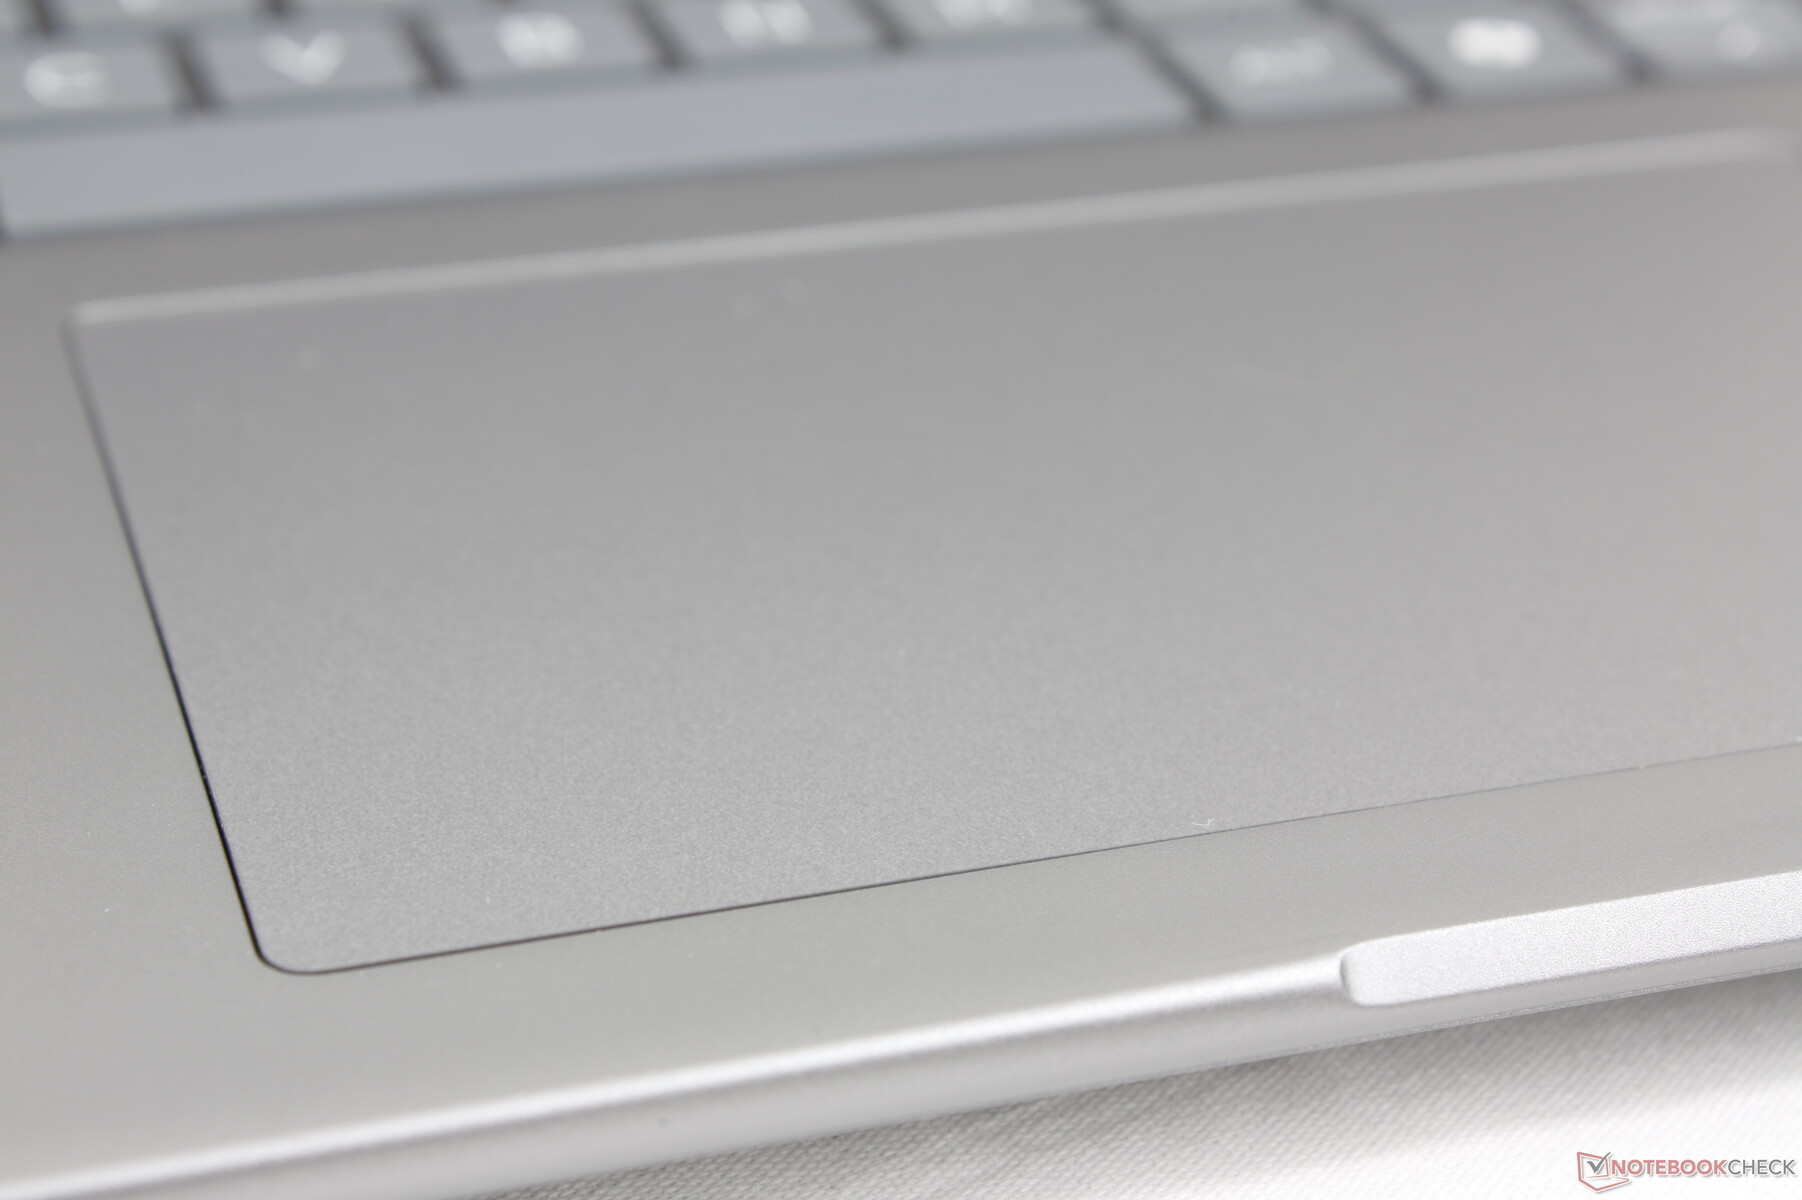
Il clickpad è più grande di prima (12,5 x 8 cm contro 11,5 × 7 cm) per sfruttare il fattore di forma più grande da 16 pollici. Mancano ancora i tasti dedicati, disponibili invece sulla serie ZBook Fury, più costosa. La trazione e il feedback sono comunque morbidi e scattanti, rispettivamente, per essere più affidabili rispetto ai clickpad normalmente più spugnosi della maggior parte dei computer portatili consumer.

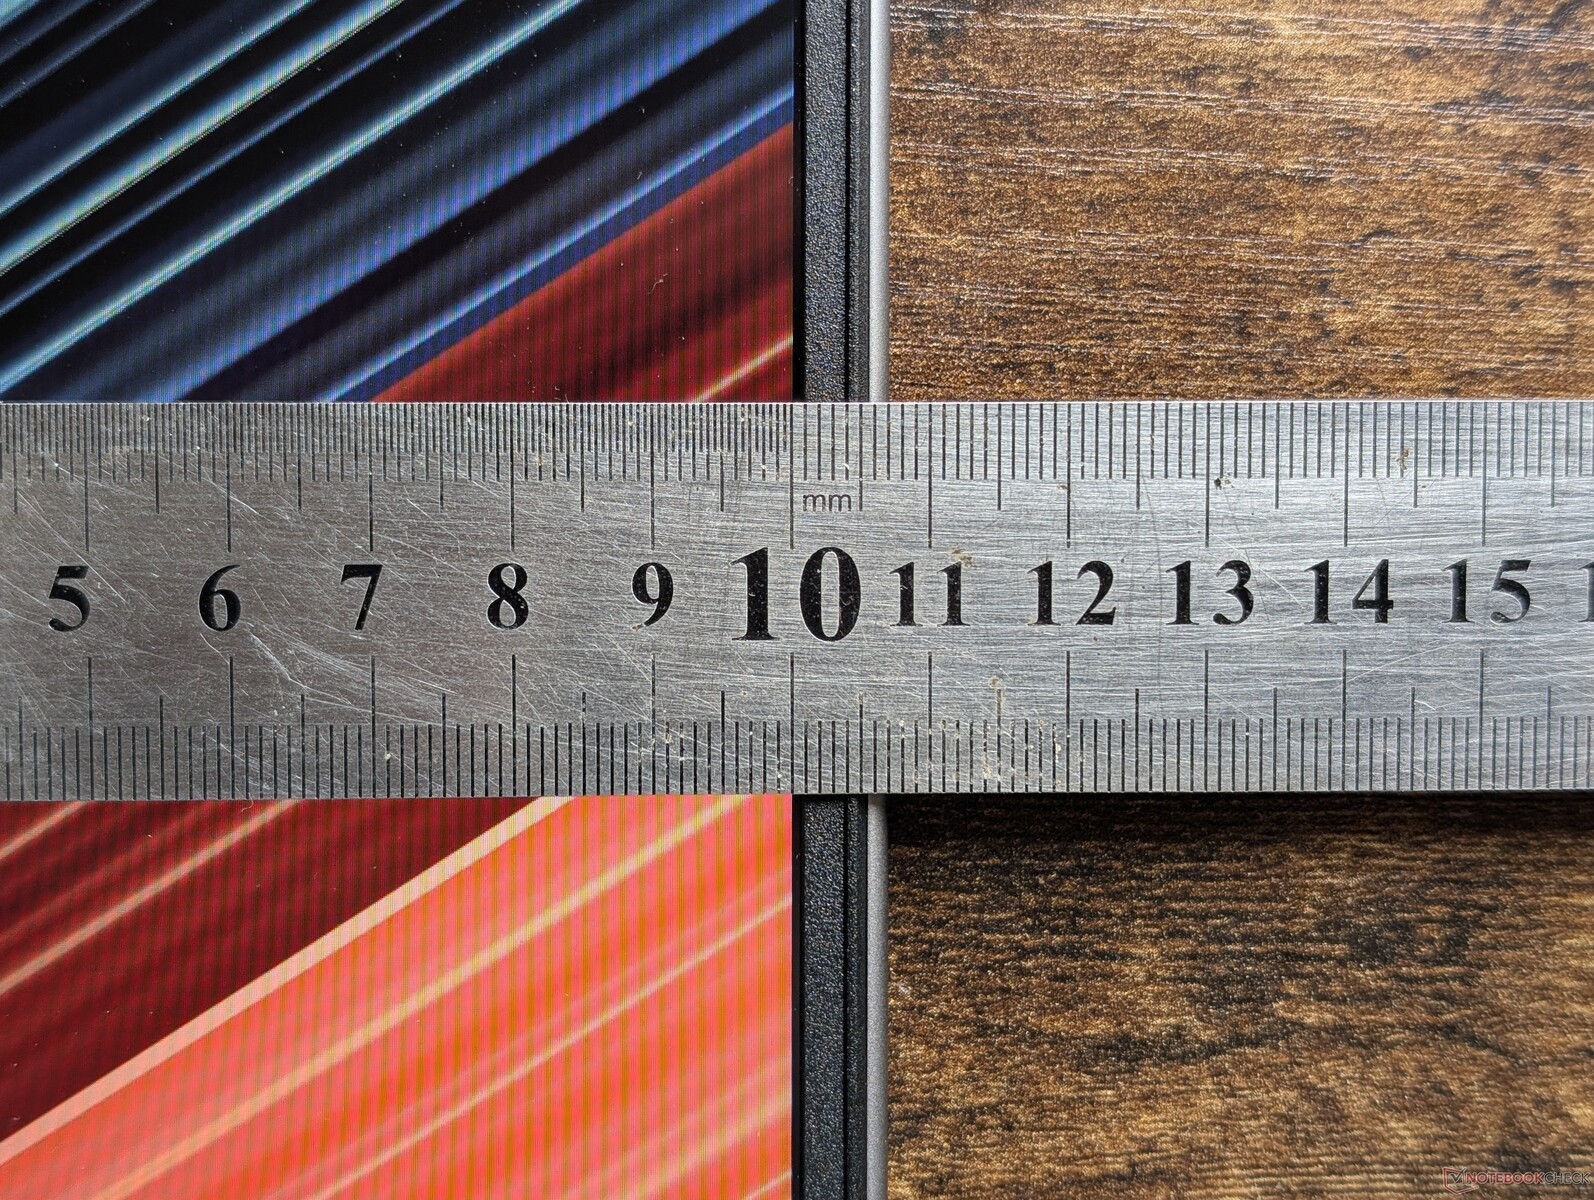
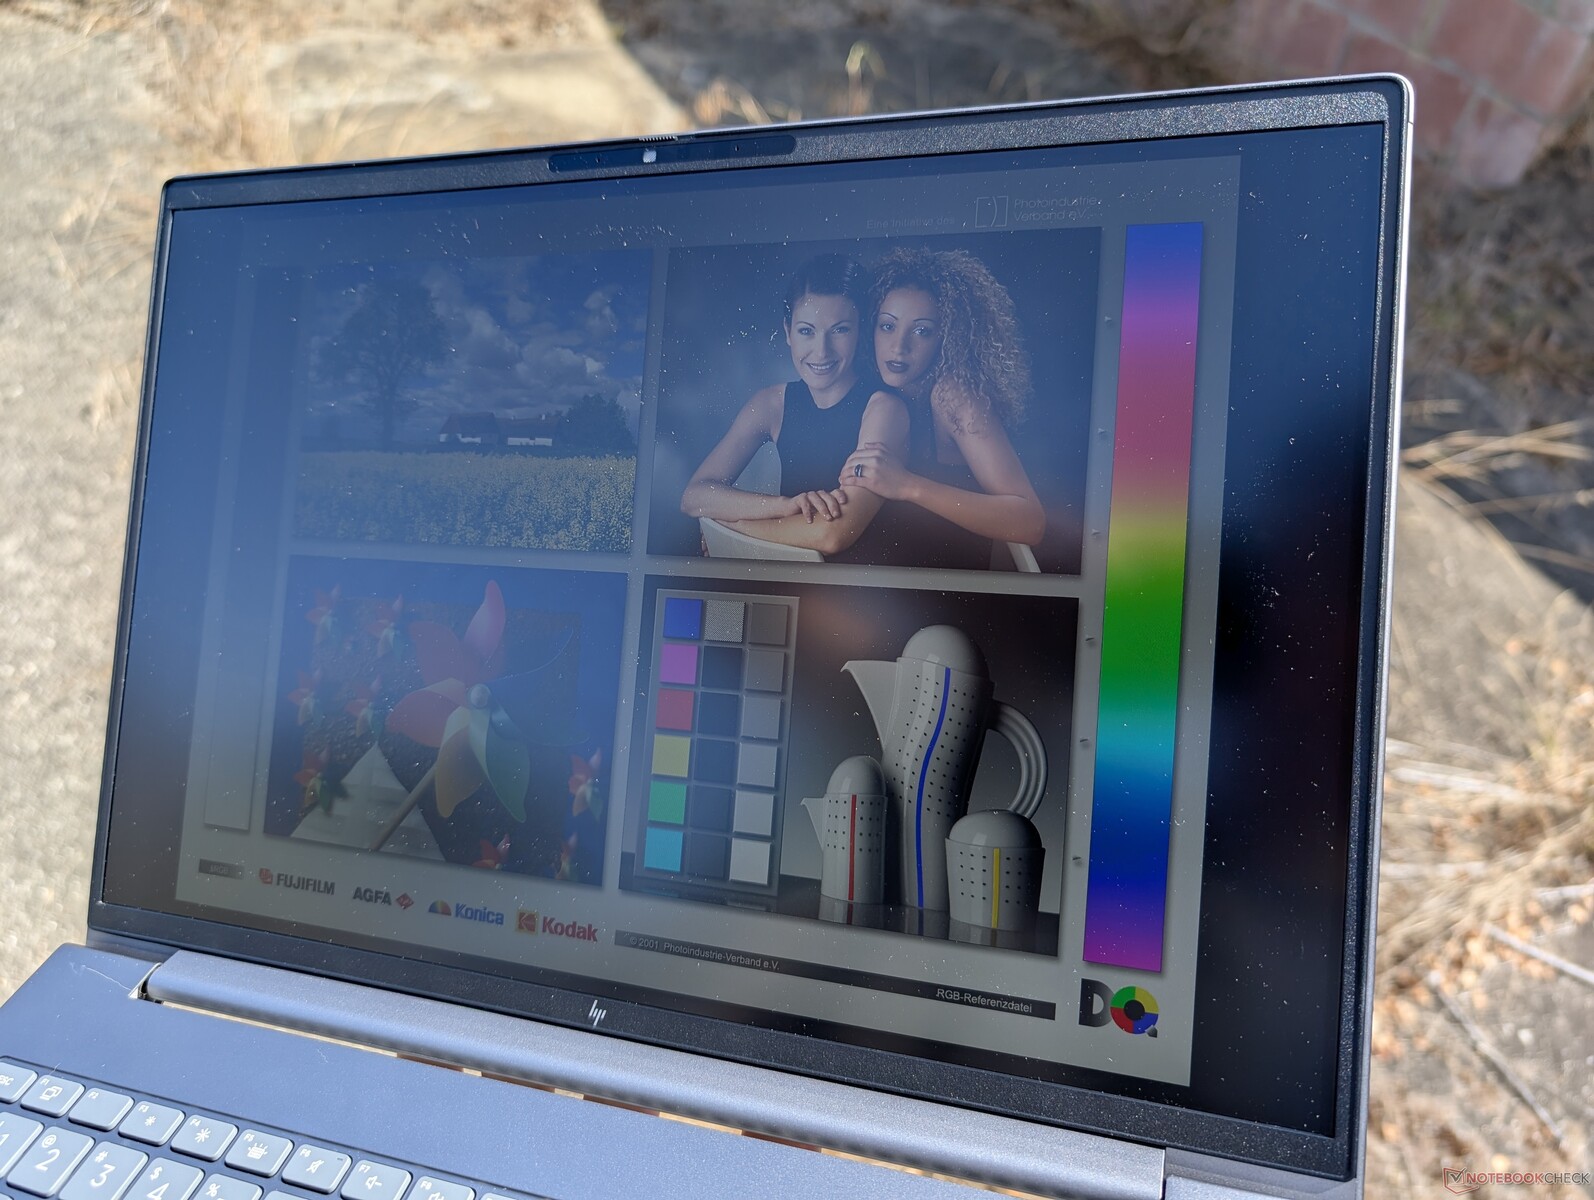
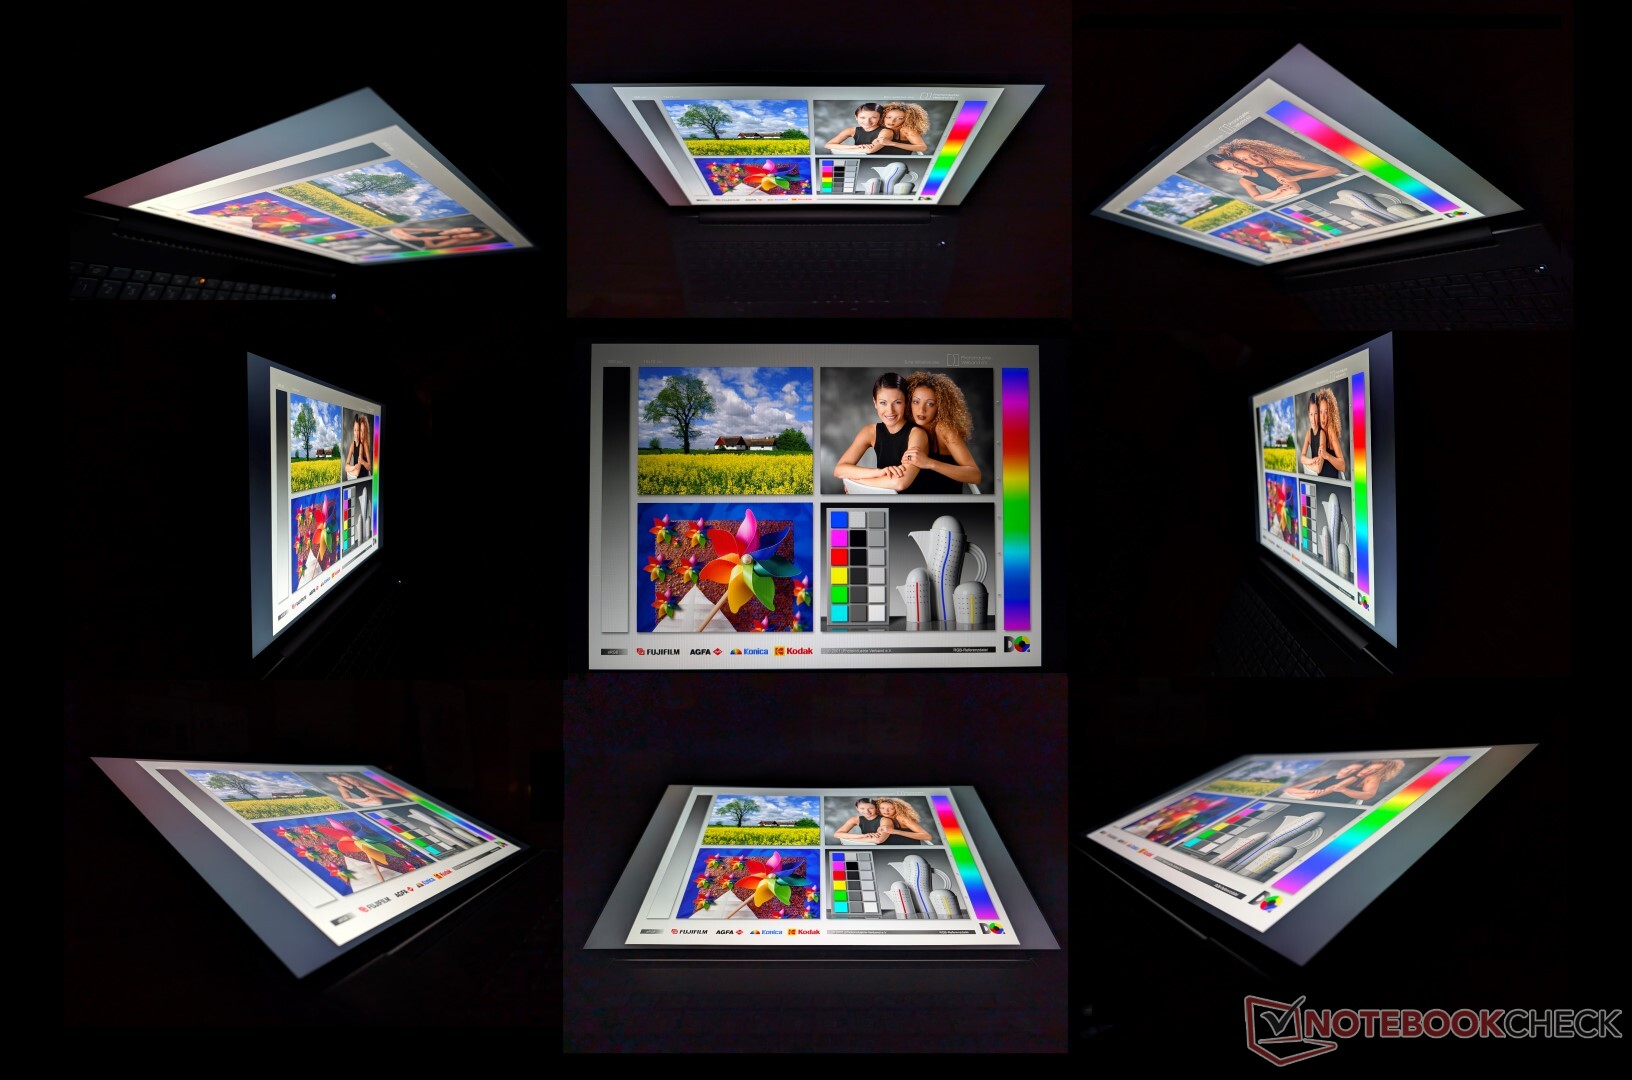
Display - IPS su tutta la linea
In totale sono disponibili cinque opzioni di display, tutte solo IPS. La nostra configurazione viene fornita con l'opzione in grassetto.
- 1920 x 1200, non touch, opaco, 250 nits, 45 percento NTSC, 60 Hz
- 1920 x 1200, touch, opaco, 250 nits, 45 percento NTSC, 60 Hz
- 1920 x 1200, non touch, opaco, 400 nits, 100 percento sRGB, 60 Hz
- 1920 x 1200, non touch, opaco, 1000 nits, 100 percento sRGB, HP Sure View, 60 Hz
- 2560 x 1600, non touch, opaco, 400 nits, 100 percento sRGB, 120 Hz
Se la qualità dell'immagine è un problema, gli utenti dovrebbero evitare le prime due opzioni di fascia bassa, poiché la copertura del colore sarebbe solo il 60 percento circa di sRGB. Il pannello super-luminoso da 1000 nit è degno di nota, poiché molte altre workstation non offrono questa caratteristica, ma l'opzione è purtroppo legata a Sure View, che limita fortemente gli angoli di visione per una maggiore privacy. Non ci sono opzioni OLED, HDR o P3, il che è un po' deludente per una workstation ad alte prestazioni. Gli utenti dovrebbero passare all'HP ZBook Fury 16 G11 o prendere in considerazione il ThinkPad P16s G2 per queste caratteristiche.

| |||||||||||||||||||||||||
Distribuzione della luminosità: 88 %
Al centro con la batteria: 470.7 cd/m²
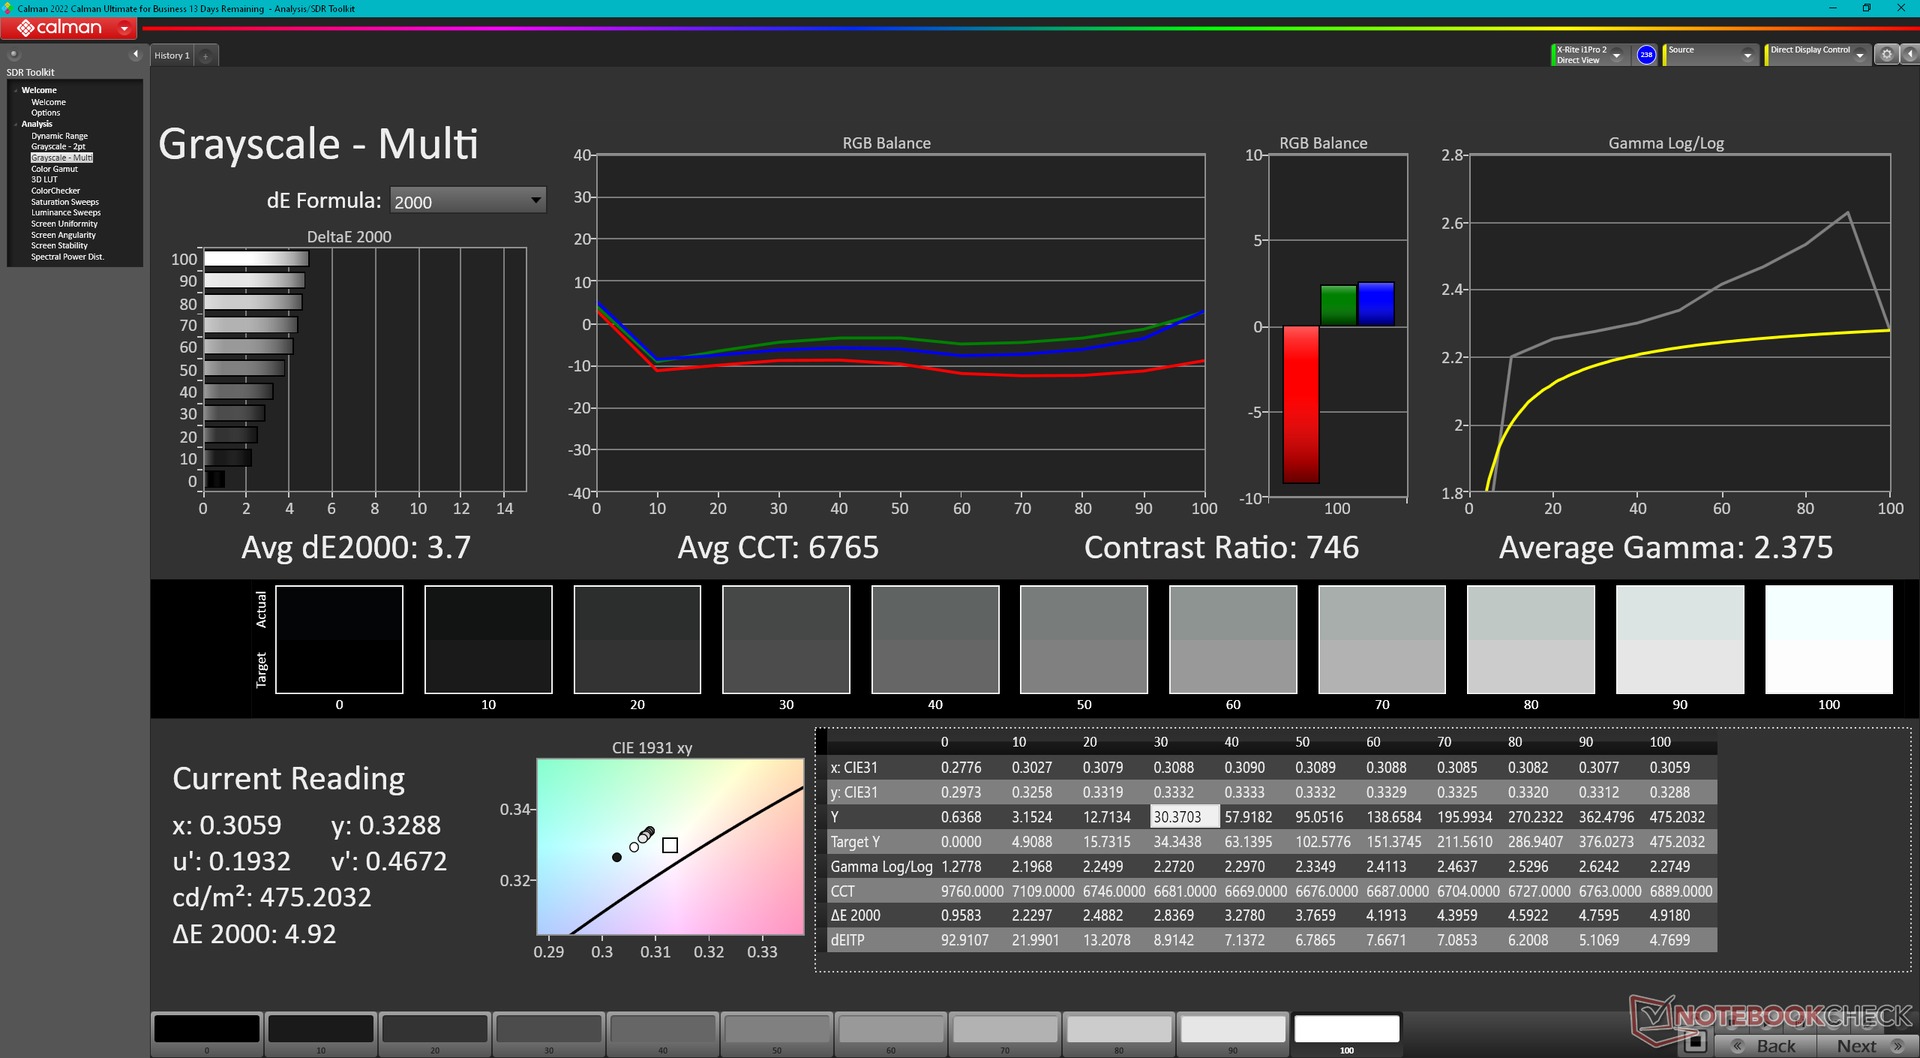
Contrasto: 826:1 (Nero: 0.57 cd/m²)
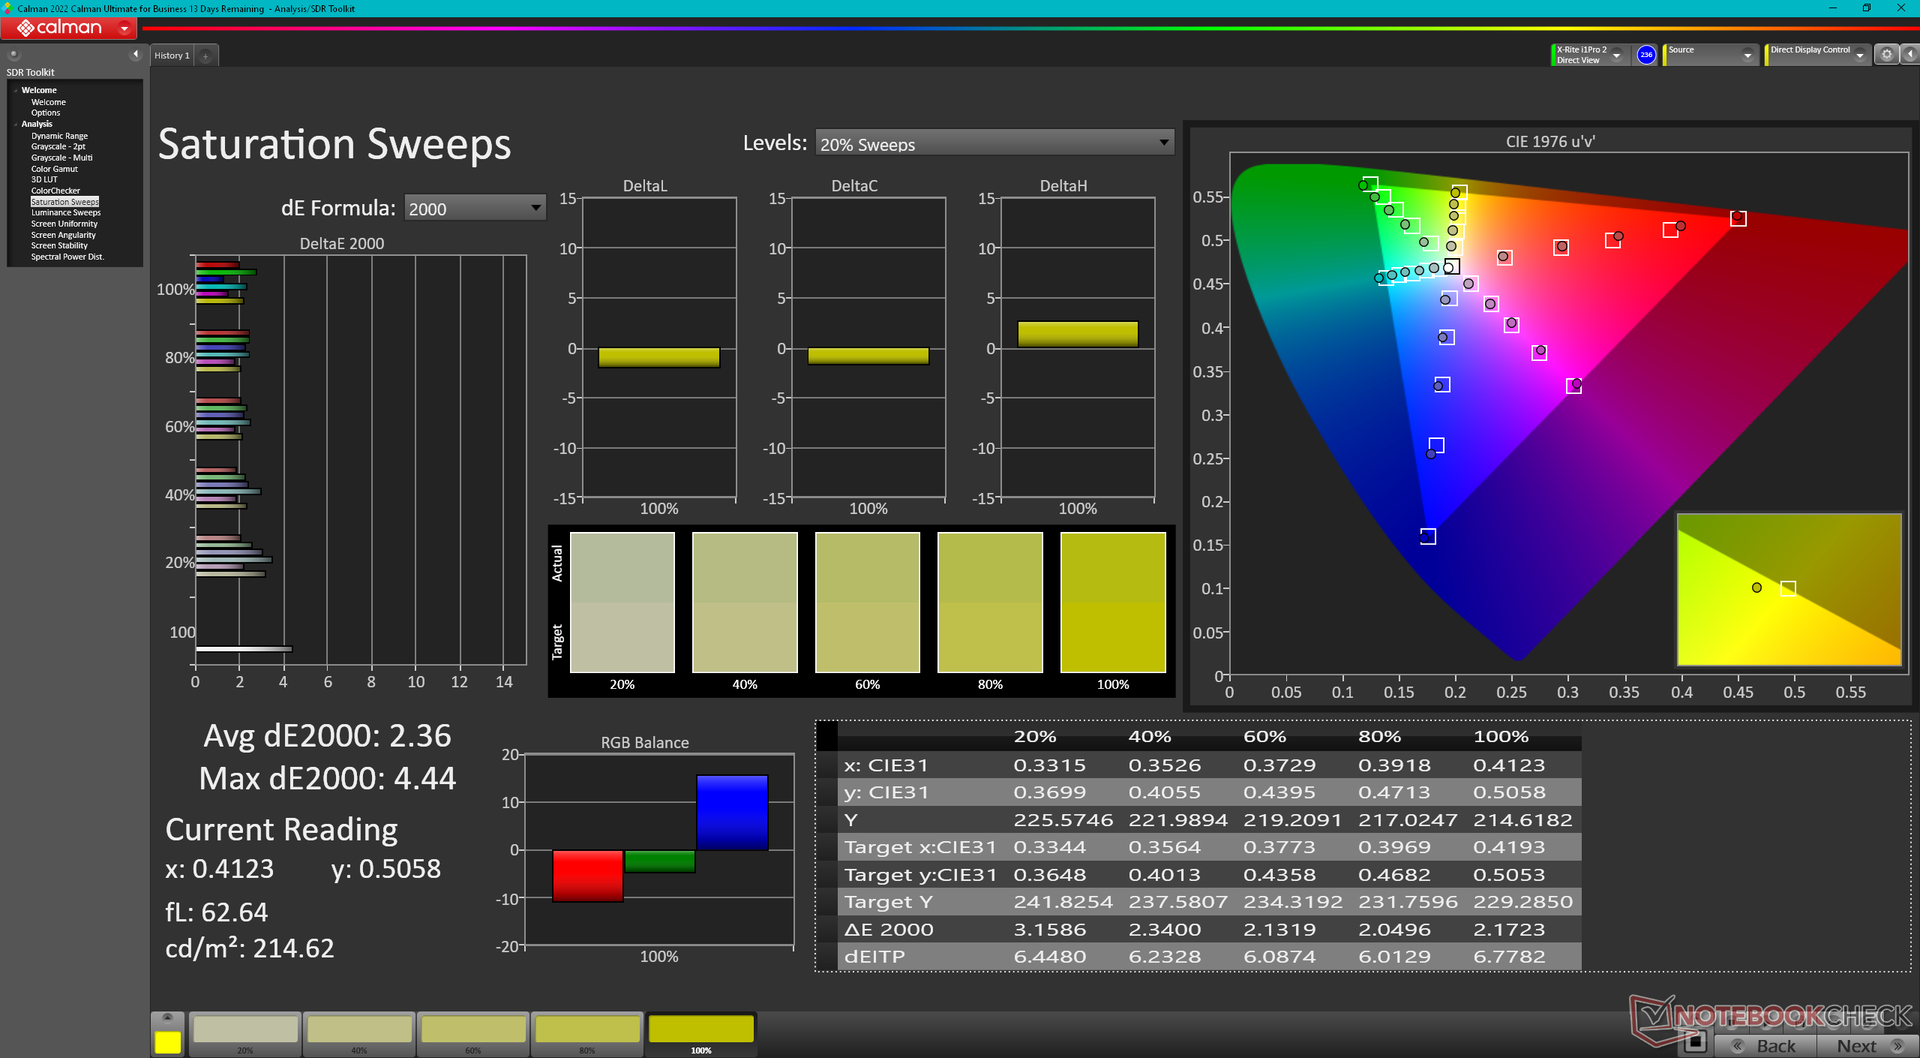
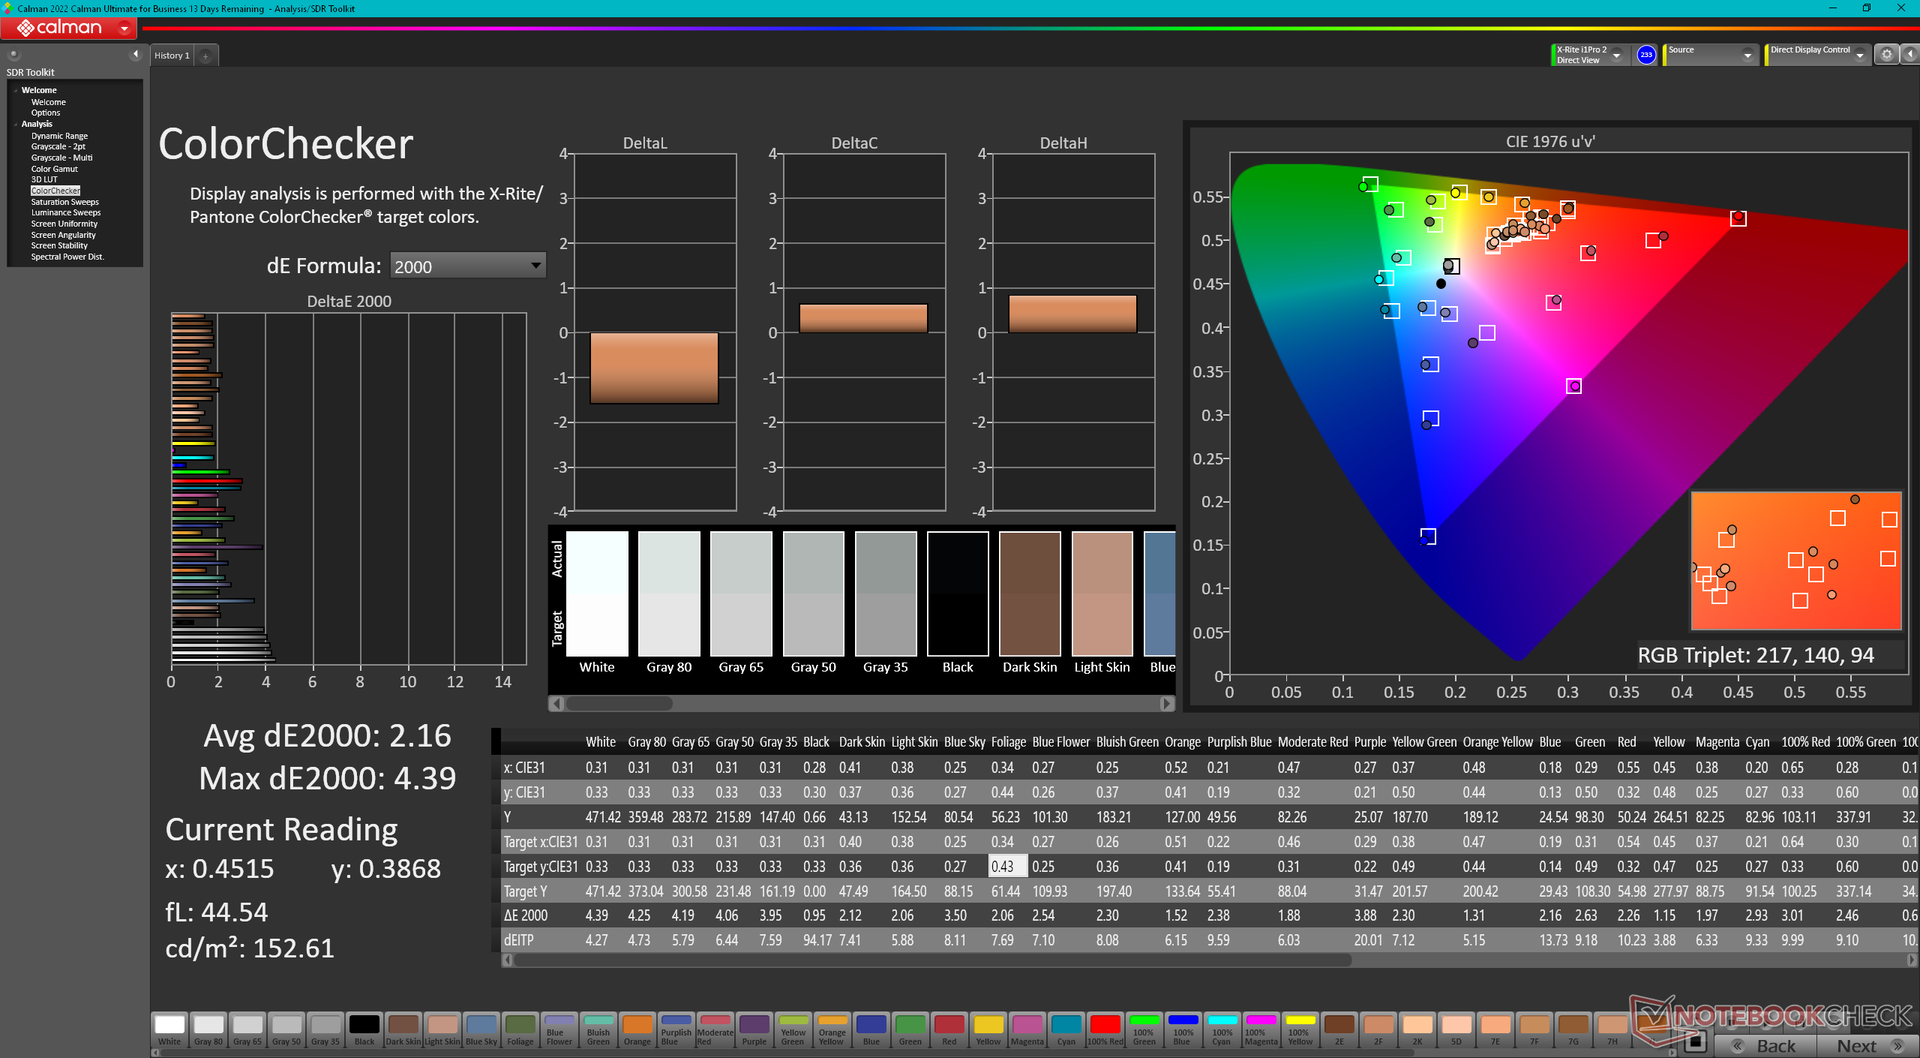
ΔE ColorChecker Calman: 2.16 | ∀{0.5-29.43 Ø4.72}
calibrated: 1.37
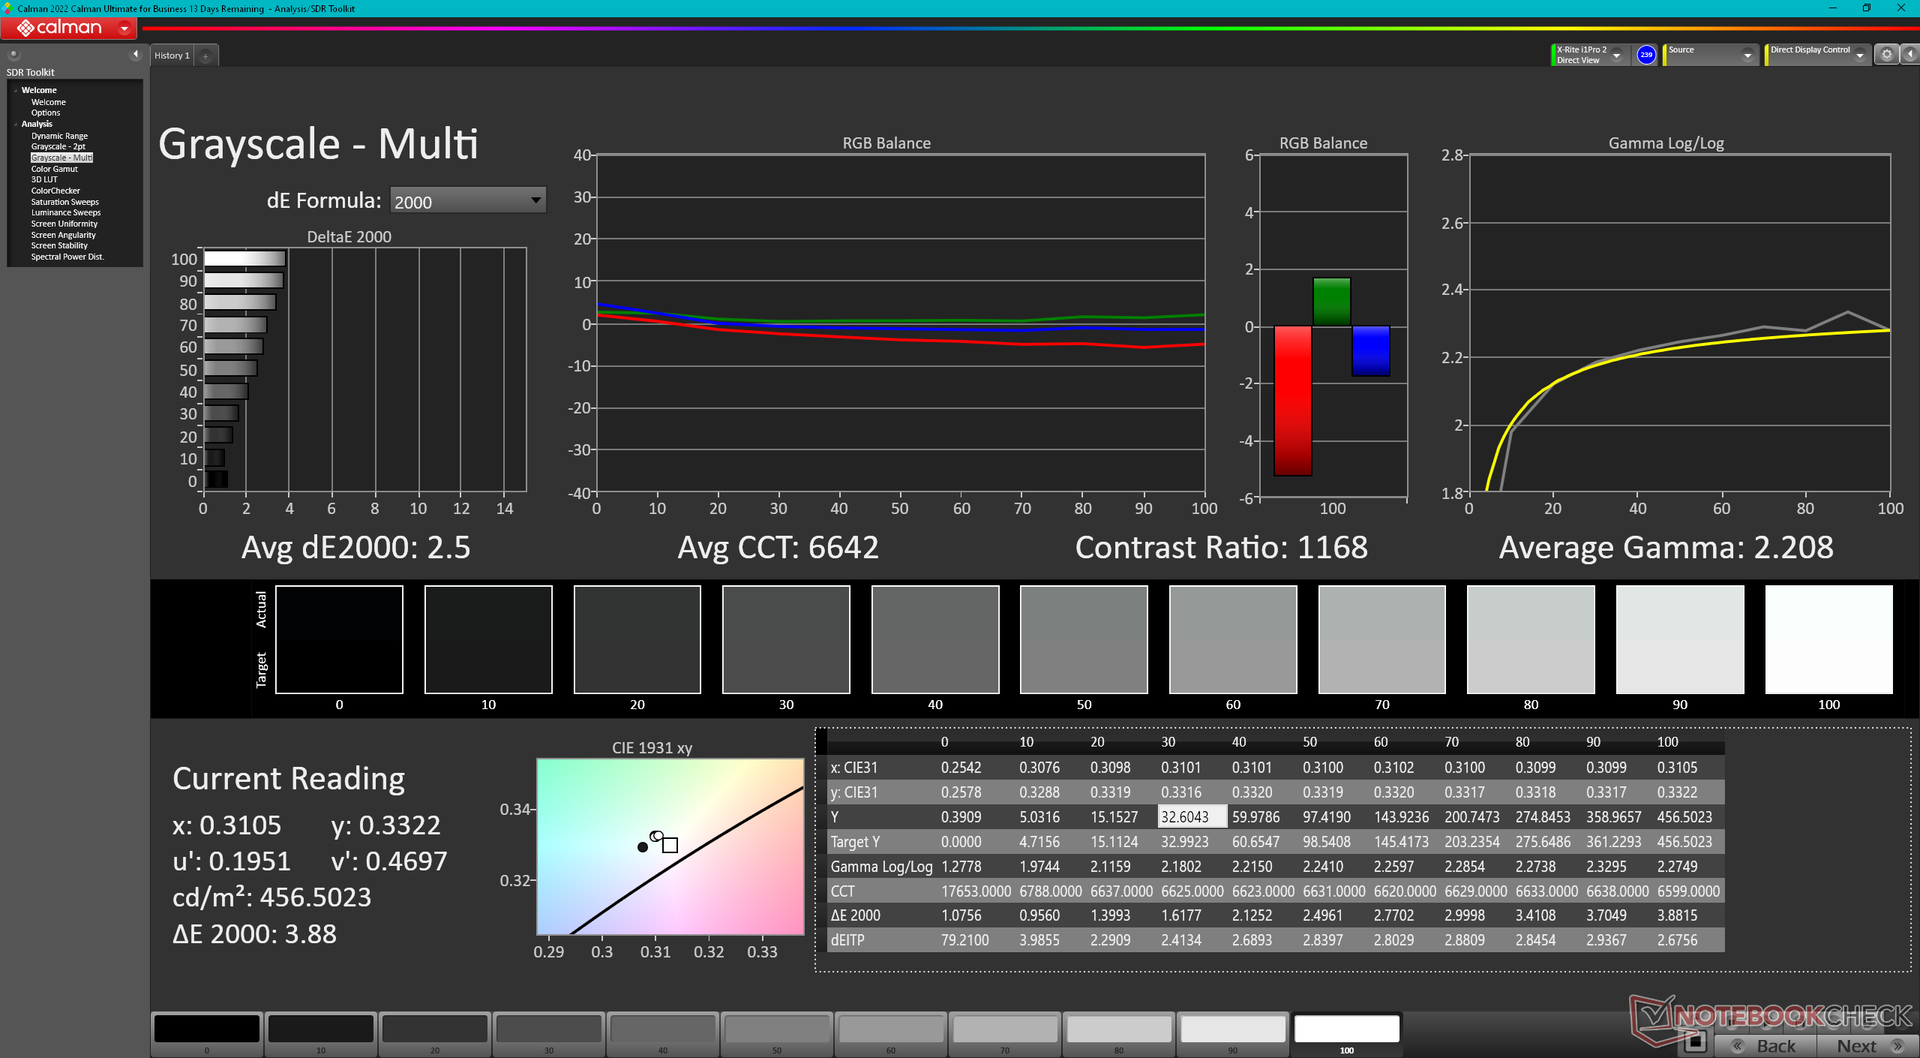
ΔE Greyscale Calman: 3.7 | ∀{0.09-98 Ø4.97}
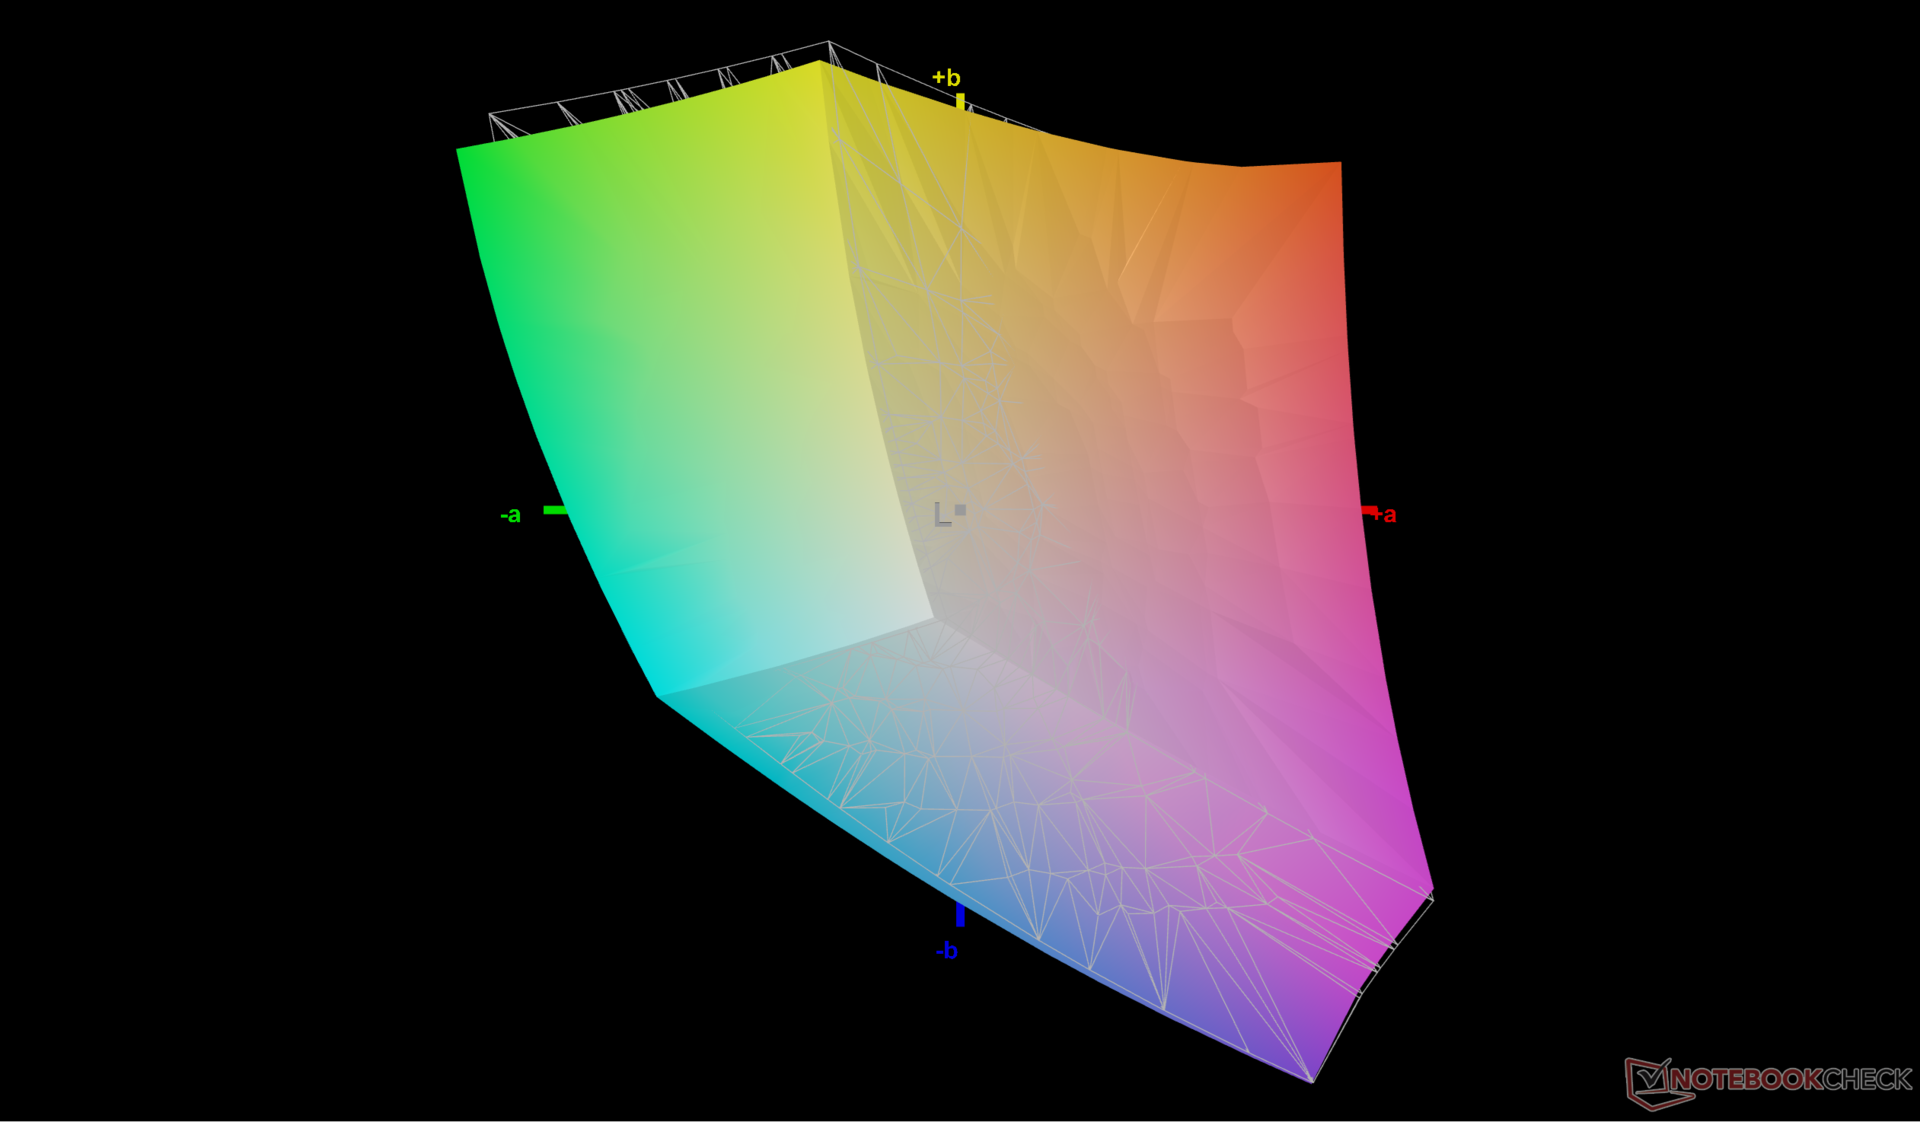
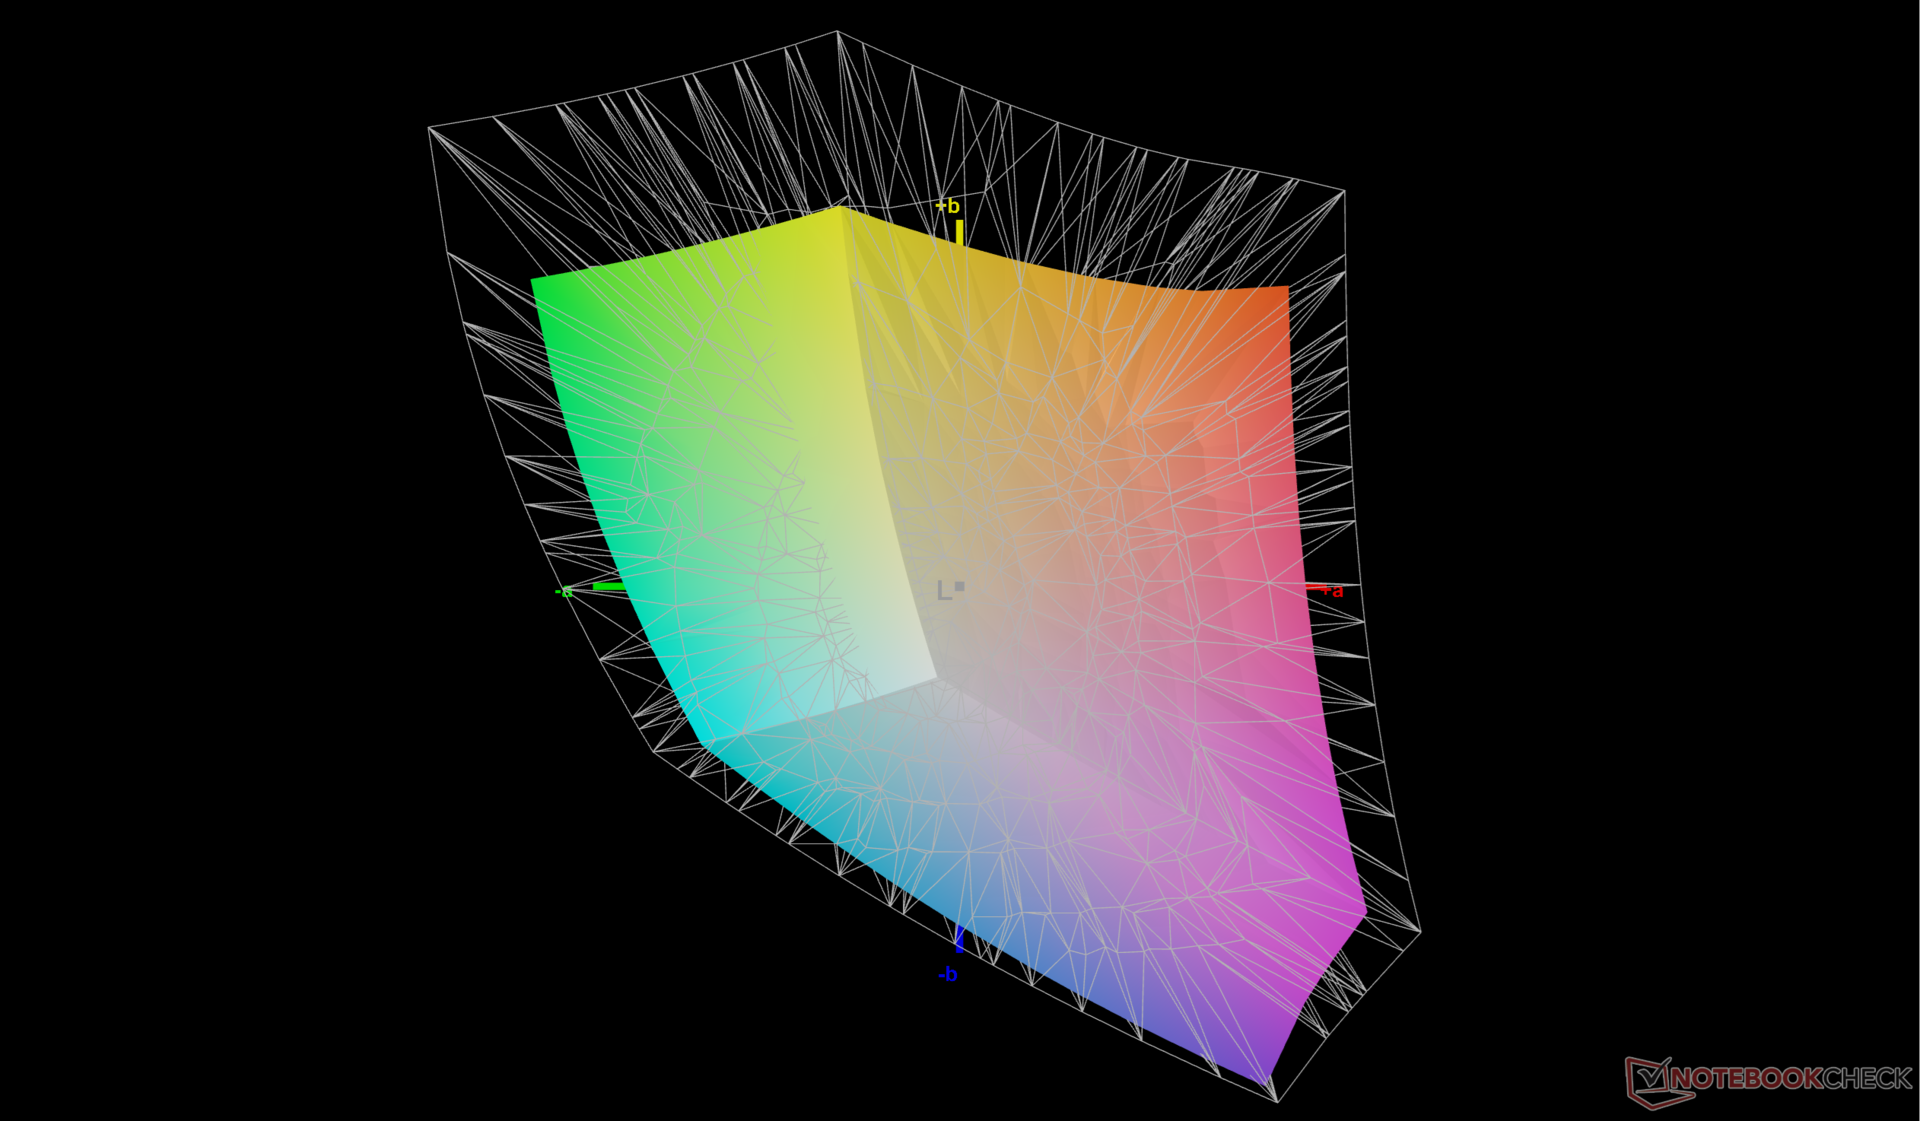
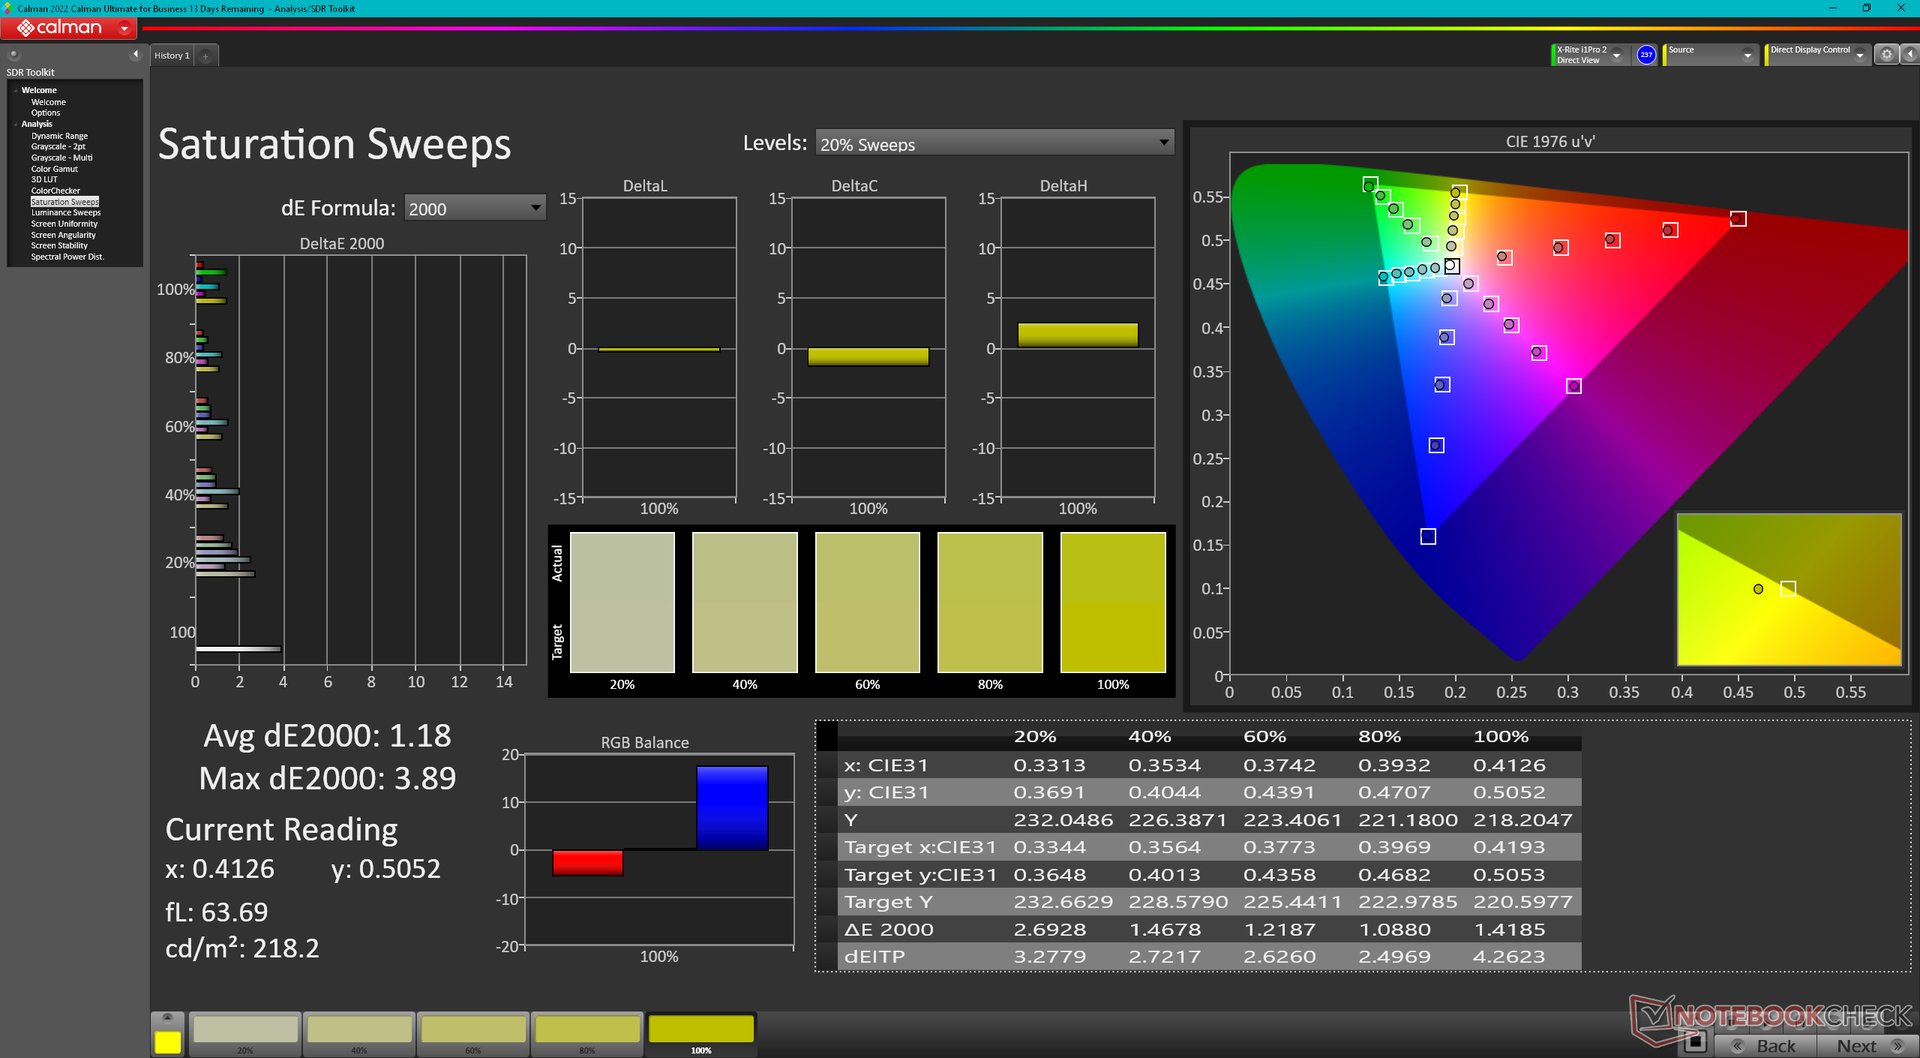
71% AdobeRGB 1998 (Argyll 3D)
97.7% sRGB (Argyll 3D)
69.1% Display P3 (Argyll 3D)
Gamma: 2.38
CCT: 6765 K
| HP ZBook Power 16 G11 A AUOA0A9, IPS, 2560x1600, 16", 120 Hz | HP ZBook Power 15 G10 BOE0B6A, IPS, 2560x1440, 15.6", 120 Hz | HP ZBook Fury 16 G11 AUO87A8, IPS, 3840x2400, 16", 120 Hz | Lenovo ThinkPad P1 Gen 7 21KV001SGE MNG007DA1-9 , IPS LED, 2560x1600, 16", 165 Hz | Lenovo ThinkPad P16s G2 21K9000CGE ATNA60YV04-0, OLED, 3840x2400, 16", 60 Hz | Dell Precision 5690 Samsung 160YV03, OLED, 3840x2400, 16", 60 Hz | |
|---|---|---|---|---|---|---|
| Display | -1% | 22% | 0% | 28% | 27% | |
| Display P3 Coverage (%) | 69.1 | 68.2 -1% | 98.4 42% | 69.4 0% | 99.9 45% | 99.8 44% |
| sRGB Coverage (%) | 97.7 | 95.6 -2% | 99.9 2% | 97.6 0% | 100 2% | 100 2% |
| AdobeRGB 1998 Coverage (%) | 71 | 70.5 -1% | 86 21% | 71.8 1% | 96.9 36% | 96.6 36% |
| Response Times | -10% | 8% | -4% | 87% | 84% | |
| Response Time Grey 50% / Grey 80% * (ms) | 13.6 ? | 13 ? 4% | 11.4 ? 16% | 11.2 ? 18% | 1.5 ? 89% | 1.7 ? 87% |
| Response Time Black / White * (ms) | 8.4 ? | 10.4 ? -24% | 8.4 ? -0% | 10.6 ? -26% | 1.3 ? 85% | 1.7 ? 80% |
| PWM Frequency (Hz) | 60 | 60 ? | ||||
| Screen | -13% | 5% | -10% | 2% | -14% | |
| Brightness middle (cd/m²) | 470.7 | 313.8 -33% | 457.6 -3% | 516 10% | 416 -12% | 348.1 -26% |
| Brightness (cd/m²) | 431 | 302 -30% | 466 8% | 505 17% | 421 -2% | 351 -19% |
| Brightness Distribution (%) | 88 | 83 -6% | 83 -6% | 89 1% | 98 11% | 97 10% |
| Black Level * (cd/m²) | 0.57 | 0.29 49% | 0.43 25% | 0.41 28% | ||
| Contrast (:1) | 826 | 1082 31% | 1064 29% | 1259 52% | ||
| Colorchecker dE 2000 * | 2.16 | 3.27 -51% | 2.78 -29% | 3.5 -62% | 1.3 40% | 4.18 -94% |
| Colorchecker dE 2000 max. * | 4.39 | 7.81 -78% | 5.53 -26% | 8.8 -100% | 2.8 36% | 6.68 -52% |
| Colorchecker dE 2000 calibrated * | 1.37 | 0.56 59% | 1.37 -0% | 1.2 12% | 2.9 -112% | 0.97 29% |
| Greyscale dE 2000 * | 3.7 | 5.9 -59% | 2 46% | 5.6 -51% | 1.8 51% | 1.7 54% |
| Gamma | 2.38 92% | 2.18 101% | 2.28 96% | 2.27 97% | 2.25 98% | 2.2 100% |
| CCT | 6765 96% | 6323 103% | 6806 96% | 6071 107% | 6574 99% | 6198 105% |
| Media totale (Programma / Settaggio) | -8% /
-10% | 12% /
9% | -5% /
-7% | 39% /
22% | 32% /
13% |
* ... Meglio usare valori piccoli
Il display è calibrato decentemente fuori dalla scatola rispetto allo standard sRGB. La calibrazione del pannello con il nostro colorimetro X-Rite migliorerebbe ulteriormente i valori deltaE medi della scala di grigi e del colore, da 3,7 e 2,16 a soli 2,5 e 1,37, rispettivamente. Il nostro profilo ICM calibrato è disponibile gratuitamente per il download qui sopra.

Tempi di risposta del Display
| ↔ Tempi di risposta dal Nero al Bianco | ||
|---|---|---|
| 8.4 ms ... aumenta ↗ e diminuisce ↘ combinato | ↗ 4.5 ms Incremento | 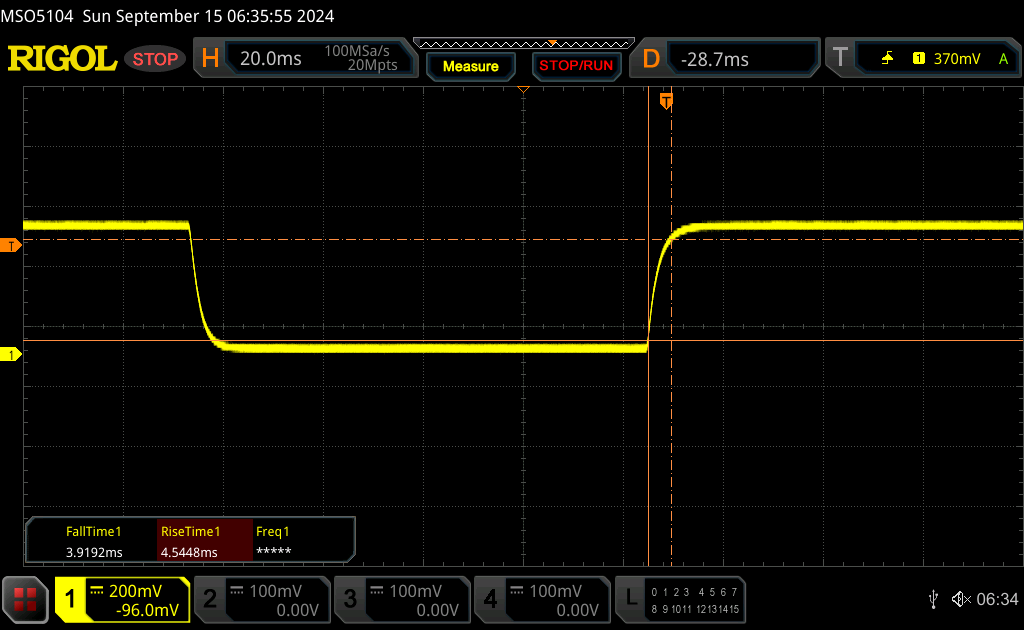 |
| ↘ 3.9 ms Calo | ||
| Lo schermo mostra veloci tempi di risposta durante i nostri tests e dovrebbe esere adatto al gaming In confronto, tutti i dispositivi di test variano da 0.1 (minimo) a 240 (massimo) ms. » 24 % di tutti i dispositivi è migliore. Questo significa che i tempi di risposta rilevati sono migliori rispettto alla media di tutti i dispositivi testati (19.8 ms). | ||
| ↔ Tempo di risposta dal 50% Grigio all'80% Grigio | ||
| 13.6 ms ... aumenta ↗ e diminuisce ↘ combinato | ↗ 7.2 ms Incremento | 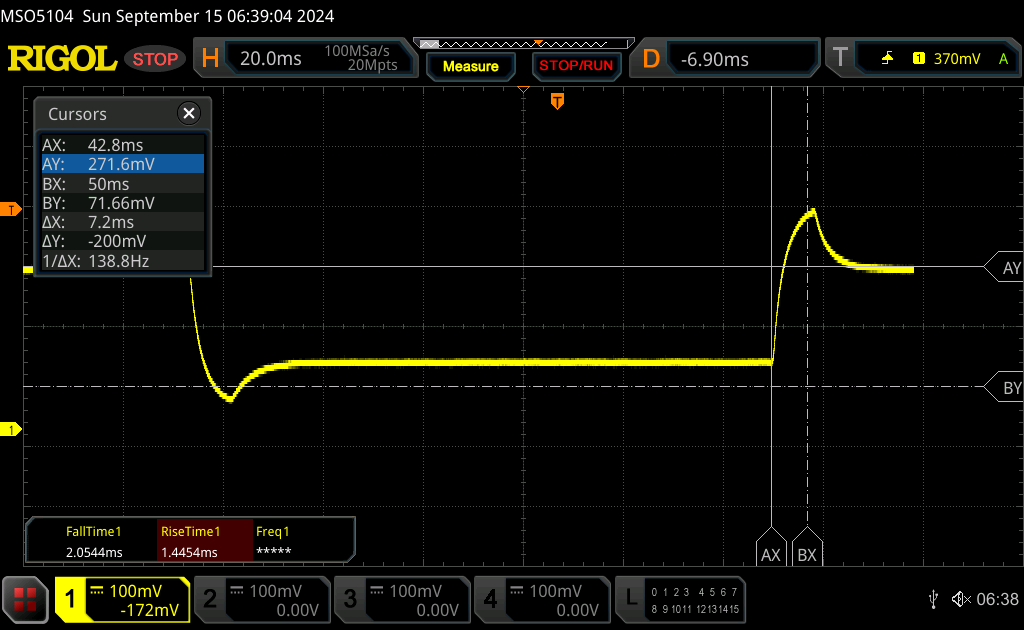 |
| ↘ 6.4 ms Calo | ||
| Lo schermo mostra buoni tempi di risposta durante i nostri tests, ma potrebbe essere troppo lento per i gamers competitivi. In confronto, tutti i dispositivi di test variano da 0.165 (minimo) a 636 (massimo) ms. » 27 % di tutti i dispositivi è migliore. Questo significa che i tempi di risposta rilevati sono migliori rispettto alla media di tutti i dispositivi testati (31 ms). | ||
Sfarfallio dello schermo / PWM (Pulse-Width Modulation)
| flickering dello schermo / PWM non rilevato | 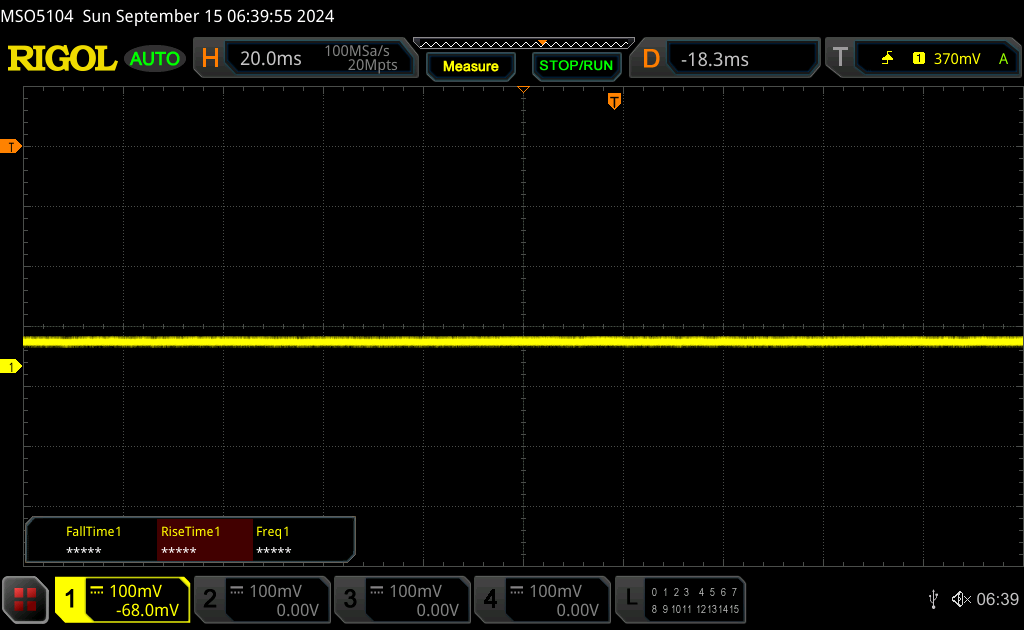 | ||
In confronto: 52 % di tutti i dispositivi testati non utilizza PWM per ridurre la luminosita' del display. Se è rilevato PWM, una media di 7772 (minimo: 5 - massimo: 343500) Hz è stata rilevata. | |||
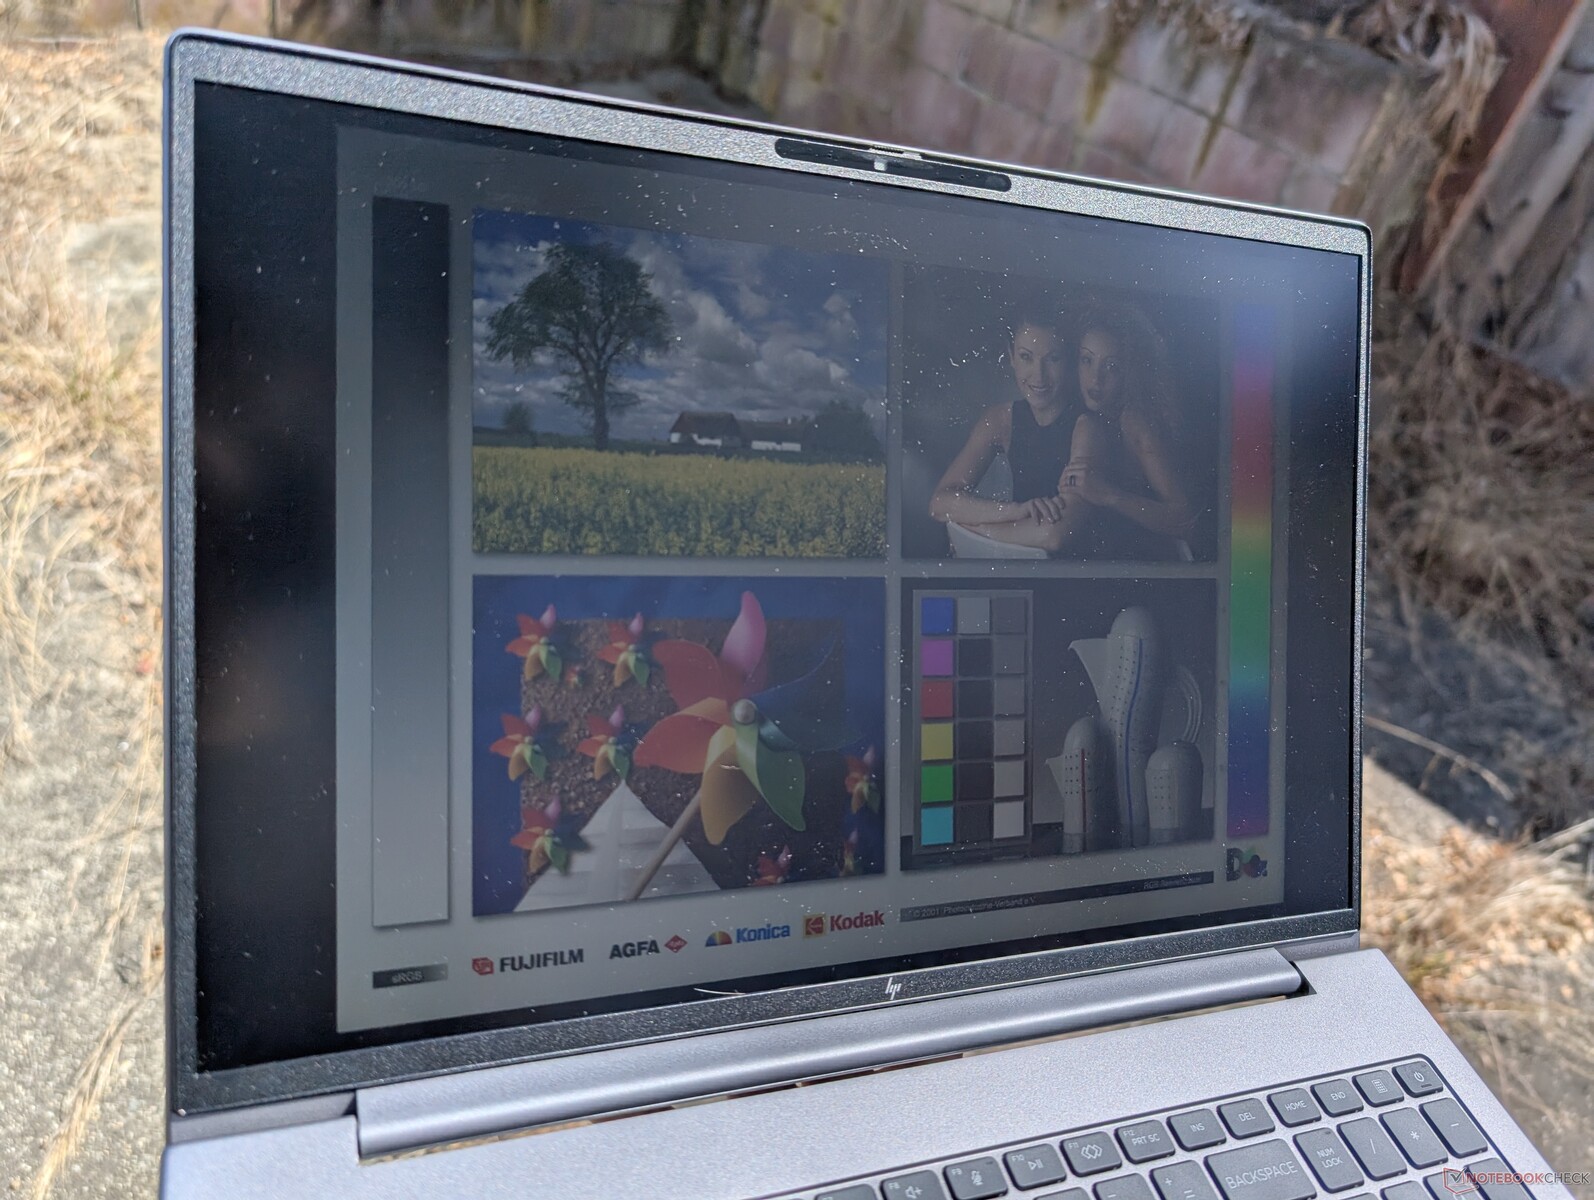
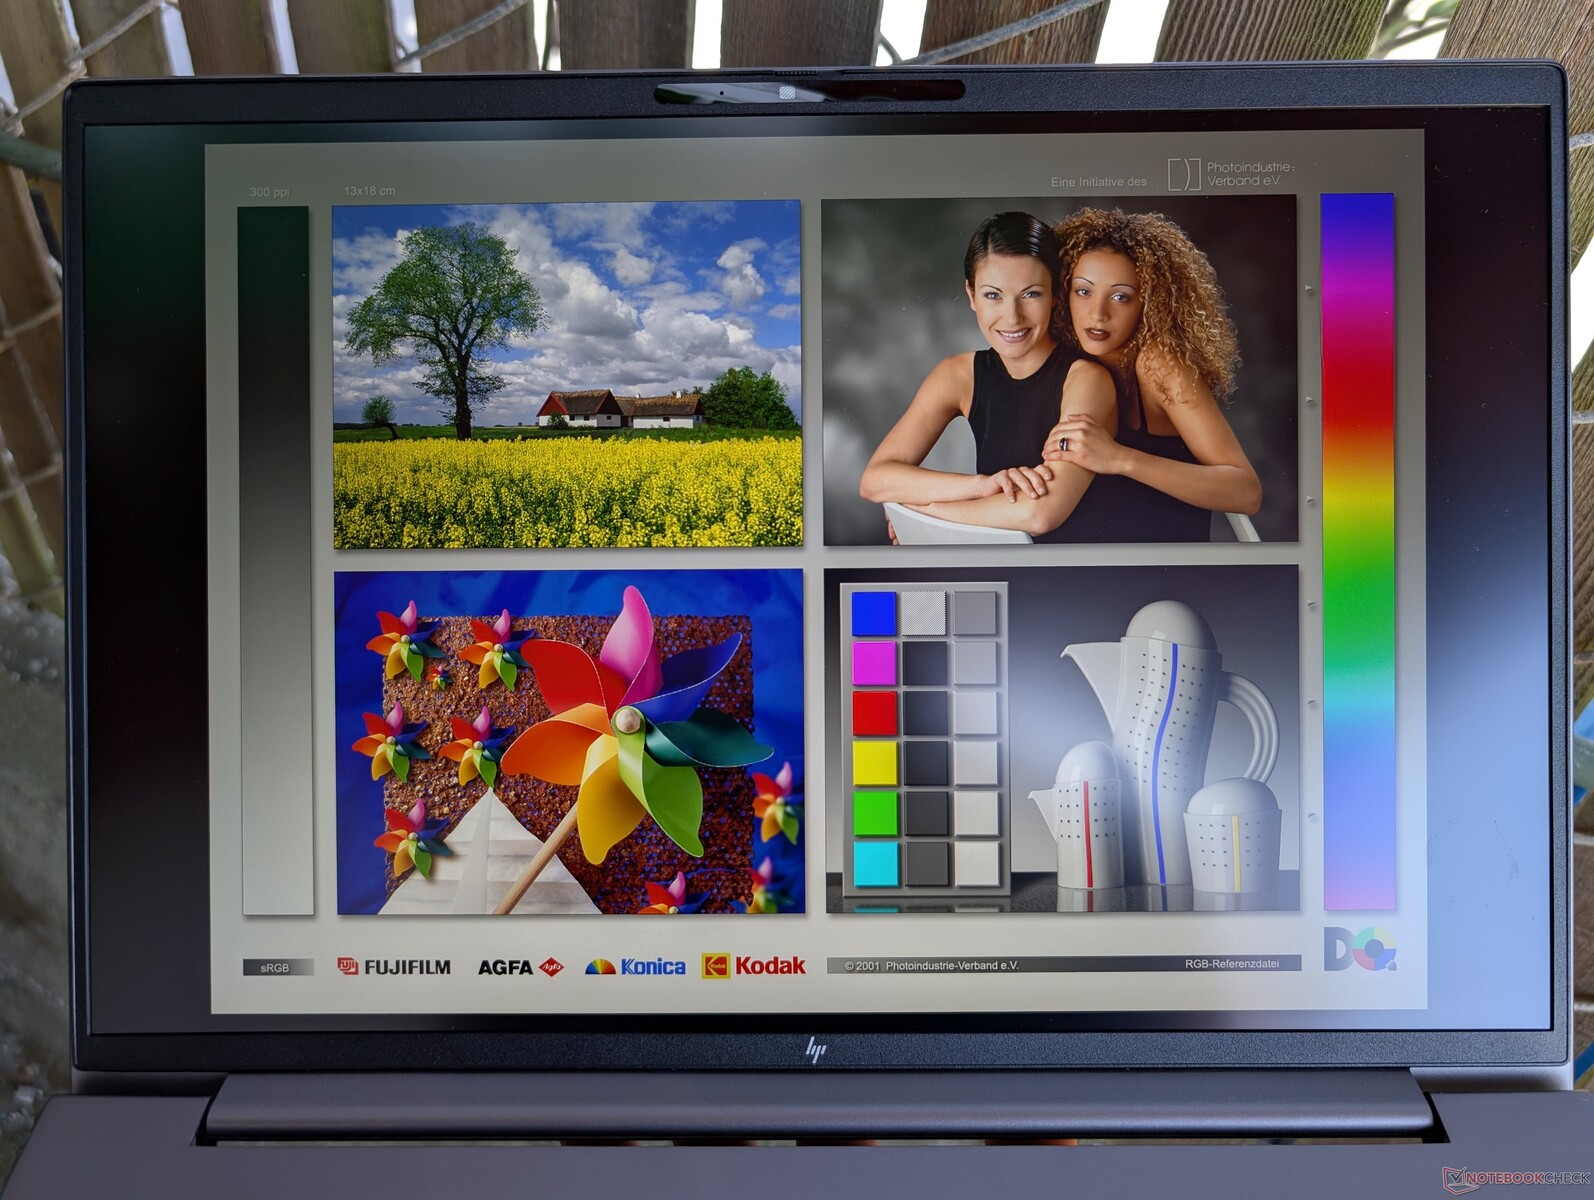
La visibilità all'aperto è discreta quando si trova all'ombra con il nostro pannello da 1600p, ma le opzioni di fascia bassa saranno più deboli e più inclini all'abbagliamento. L'opzione a 1000 nit dovrebbe essere presa in considerazione se si trova spesso all'aperto.
Prestazioni - Nuovo Zen 4, stesse prestazioni dello Zen 4

Condizioni del test
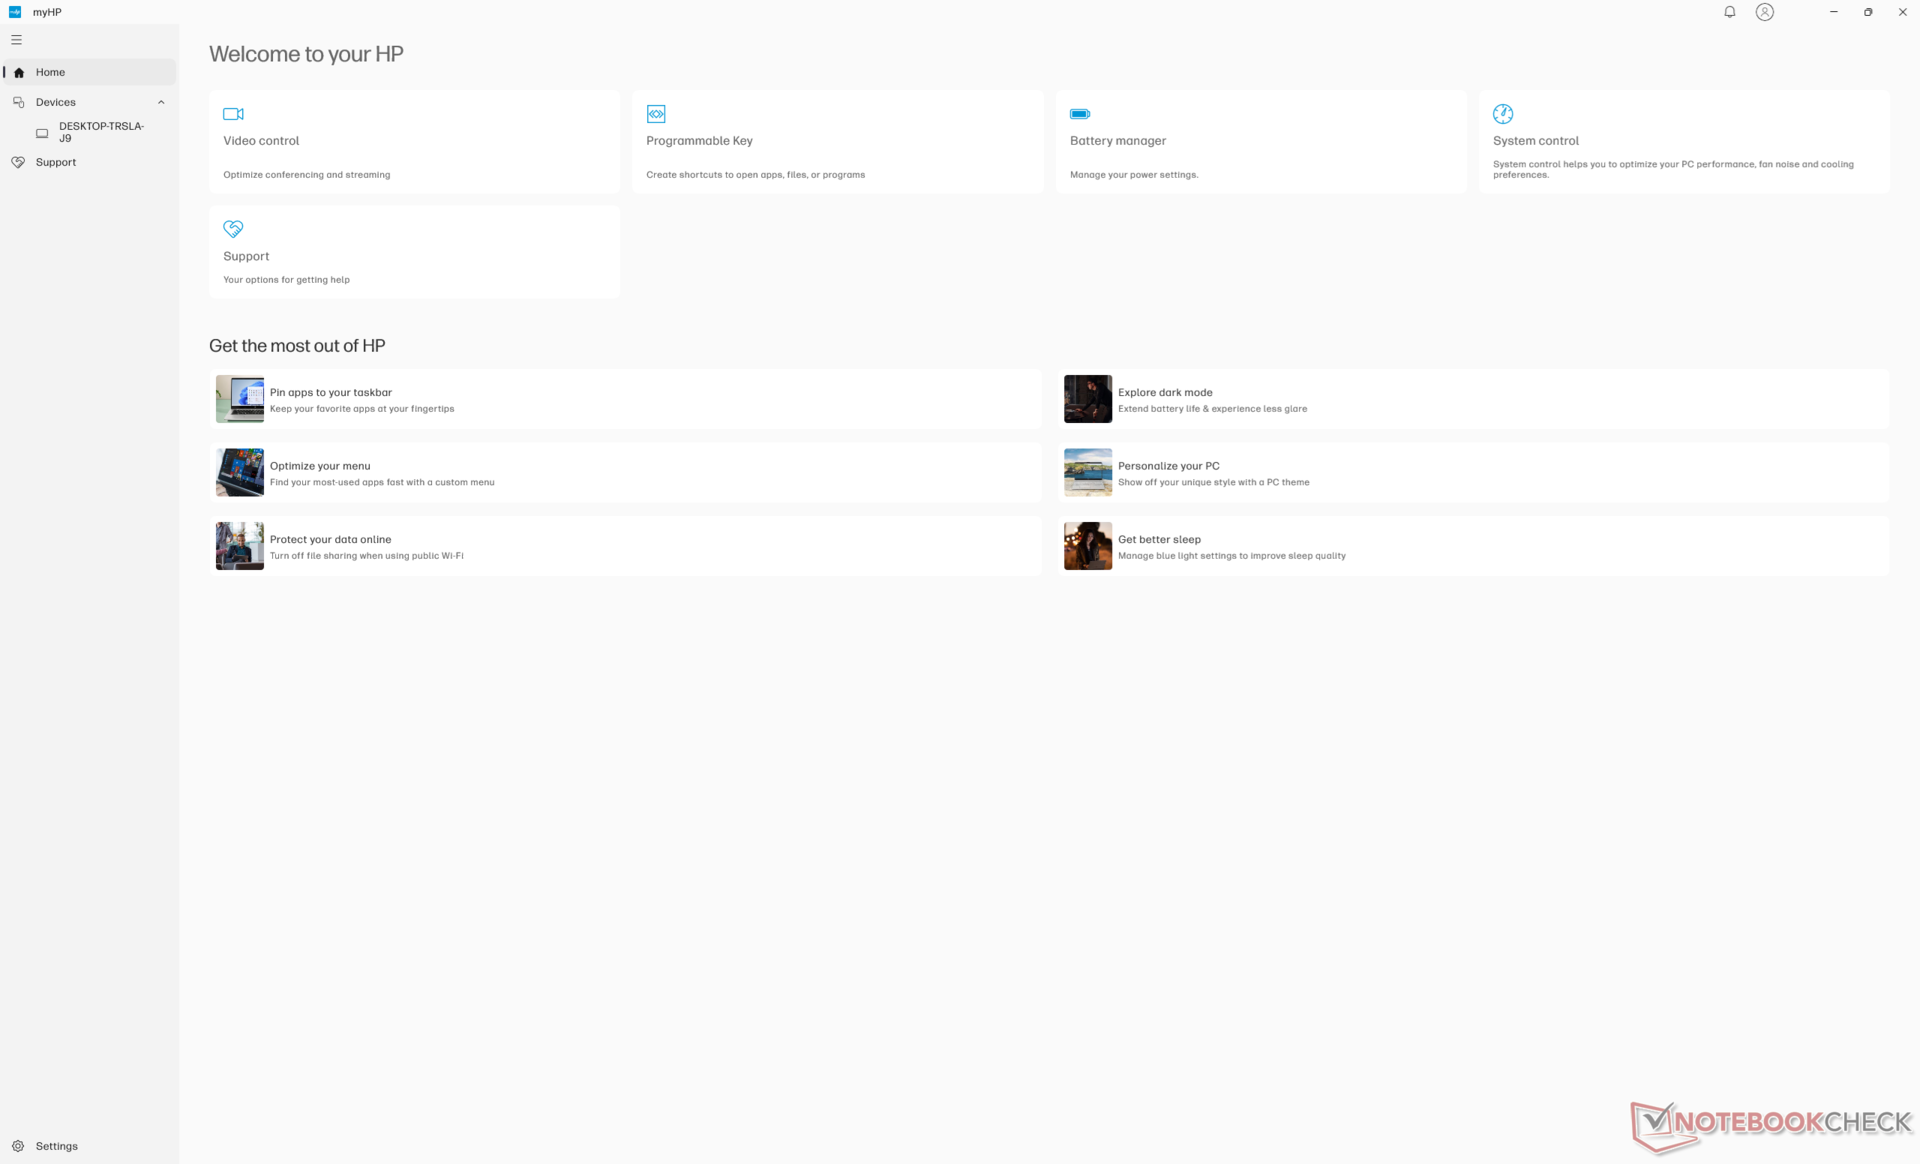
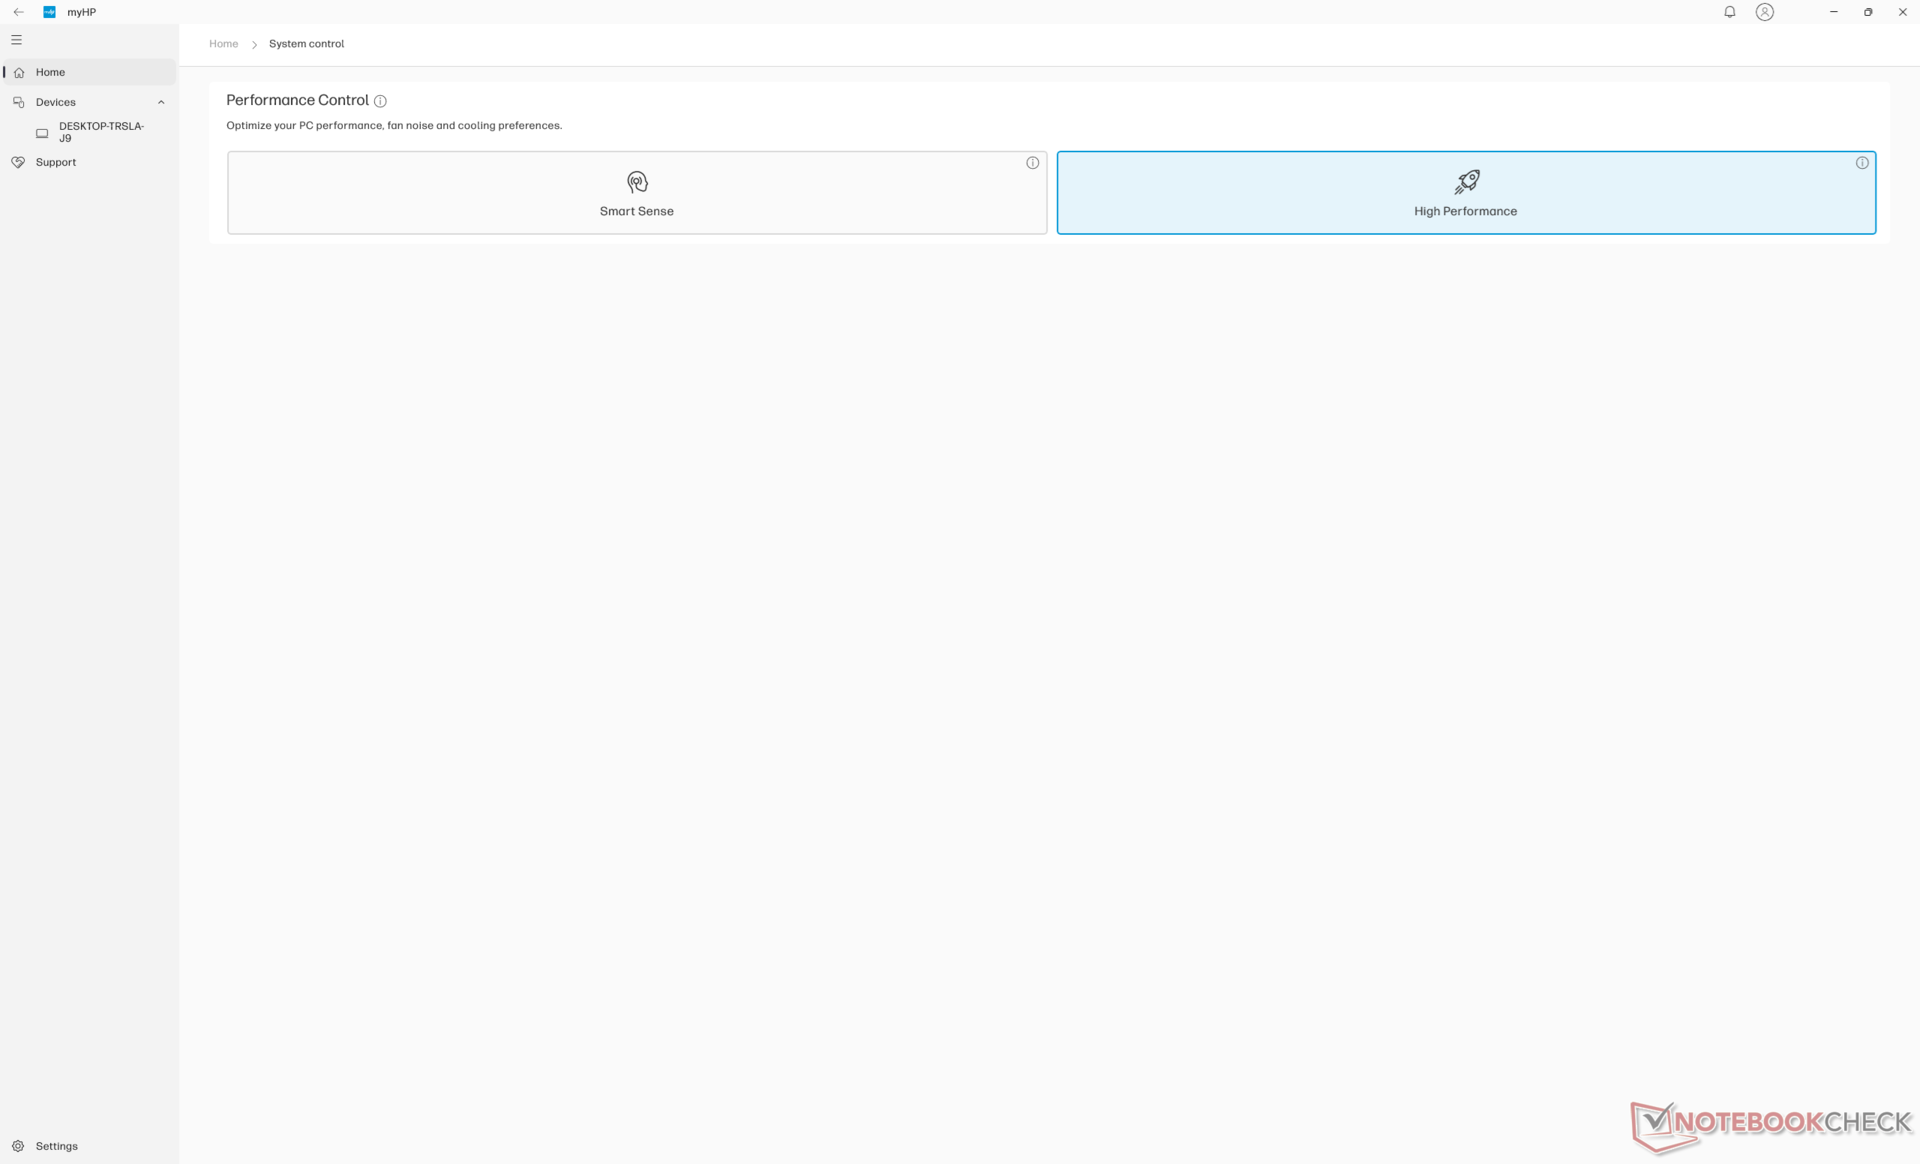
Abbiamo impostato sia Windows che MyHP sulla modalità Prestazioni prima di eseguire i benchmark qui sotto. Optimus 1.0 è supportato.
Processore
Il Ryzen 7 8845HS non offre molto rispetto al Ryzen 7 7840HS che sostituisce nello ZBook Power 15 G10. In effetti, i benchmark mettono entrambi i processori a stretto contatto, con pochi punti percentuali, per essere sostanzialmente identici. Questo potrebbe deludere gli utenti power che si aspettavano un miglioramento delle prestazioni più significativo nel passaggio da 15 a 16 pollici. Le opzioni Raptor Lake-HX più veloci sono disponibili solo sulla serie ZBook Fury più spessa di HP.
Il vantaggio principale di Ryzen 7 8845HS rispetto a Ryzen 7 7840HS è l'accelerazione AI grazie alla NPU integrata. Tuttavia, Co-Pilot+ è incompatibile con le CPU Hawk Point e quindi la praticità della NPU è molto limitata su questa macchina.
Il downgrade al Ryzen 5 8645HS dovrebbe ridurre le prestazioni del 25-30 percento, mentre l'aggiornamento al modello Ryzen 9 8945HS dovrebbe migliorare le prestazioni di appena il 5 percento.
Cinebench R15 Multi Loop
Cinebench R23: Multi Core | Single Core
Cinebench R20: CPU (Multi Core) | CPU (Single Core)
Cinebench R15: CPU Multi 64Bit | CPU Single 64Bit
Blender: v2.79 BMW27 CPU
7-Zip 18.03: 7z b 4 | 7z b 4 -mmt1
Geekbench 6.7: Multi-Core | Single-Core
Geekbench 5.5: Multi-Core | Single-Core
HWBOT x265 Benchmark v2.2: 4k Preset
LibreOffice : 20 Documents To PDF
R Benchmark 2.5: Overall mean
| CPU Performance rating | |
| HP ZBook Fury 16 G11 | |
| Asus ExpertBook B6 Flip B6602FC2 -2! | |
| Dell Precision 5690 | |
| HP ZBook Fury 16 G9 -2! | |
| HP ZBook Power 15 G10 | |
| Media AMD Ryzen 7 8845HS | |
| HP ZBook Power 16 G11 A | |
| Dell Precision 5000 5490 | |
| MSI CreatorPro Z16P B12UKST -2! | |
| Lenovo ThinkPad P16v G1 AMD | |
| Lenovo ThinkPad P16s G2 21K9000CGE | |
| Lenovo ThinkPad P1 G4-20Y4Z9DVUS -2! | |
| HP ZBook Firefly 16 G9-6B897EA -2! | |
| Cinebench R23 / Multi Core | |
| HP ZBook Fury 16 G11 | |
| Asus ExpertBook B6 Flip B6602FC2 | |
| Dell Precision 5690 | |
| HP ZBook Fury 16 G9 | |
| MSI CreatorPro Z16P B12UKST | |
| Dell Precision 5000 5490 | |
| Media AMD Ryzen 7 8845HS (14895 - 18037, n=13) | |
| HP ZBook Power 16 G11 A | |
| HP ZBook Power 15 G10 | |
| Lenovo ThinkPad P16s G2 21K9000CGE | |
| Lenovo ThinkPad P16v G1 AMD | |
| Lenovo ThinkPad P1 G4-20Y4Z9DVUS | |
| HP ZBook Firefly 16 G9-6B897EA | |
| Cinebench R23 / Single Core | |
| HP ZBook Fury 16 G11 | |
| HP ZBook Fury 16 G9 | |
| Asus ExpertBook B6 Flip B6602FC2 | |
| Dell Precision 5690 | |
| HP ZBook Power 15 G10 | |
| Dell Precision 5000 5490 | |
| HP ZBook Power 16 G11 A | |
| Media AMD Ryzen 7 8845HS (1623 - 1783, n=13) | |
| MSI CreatorPro Z16P B12UKST | |
| Lenovo ThinkPad P16s G2 21K9000CGE | |
| Lenovo ThinkPad P16v G1 AMD | |
| Lenovo ThinkPad P1 G4-20Y4Z9DVUS | |
| HP ZBook Firefly 16 G9-6B897EA | |
| Cinebench R20 / CPU (Multi Core) | |
| HP ZBook Fury 16 G11 | |
| Asus ExpertBook B6 Flip B6602FC2 | |
| Dell Precision 5690 | |
| HP ZBook Fury 16 G9 | |
| MSI CreatorPro Z16P B12UKST | |
| Dell Precision 5000 5490 | |
| HP ZBook Power 16 G11 A | |
| Media AMD Ryzen 7 8845HS (5808 - 7026, n=13) | |
| HP ZBook Power 15 G10 | |
| Lenovo ThinkPad P16s G2 21K9000CGE | |
| Lenovo ThinkPad P16v G1 AMD | |
| Lenovo ThinkPad P1 G4-20Y4Z9DVUS | |
| HP ZBook Firefly 16 G9-6B897EA | |
| Cinebench R20 / CPU (Single Core) | |
| HP ZBook Fury 16 G11 | |
| HP ZBook Fury 16 G9 | |
| Asus ExpertBook B6 Flip B6602FC2 | |
| Dell Precision 5690 | |
| HP ZBook Power 15 G10 | |
| Media AMD Ryzen 7 8845HS (673 - 698, n=13) | |
| HP ZBook Power 16 G11 A | |
| Dell Precision 5000 5490 | |
| MSI CreatorPro Z16P B12UKST | |
| Lenovo ThinkPad P16s G2 21K9000CGE | |
| Lenovo ThinkPad P16v G1 AMD | |
| Lenovo ThinkPad P1 G4-20Y4Z9DVUS | |
| HP ZBook Firefly 16 G9-6B897EA | |
| Cinebench R15 / CPU Multi 64Bit | |
| HP ZBook Fury 16 G11 | |
| Asus ExpertBook B6 Flip B6602FC2 | |
| Dell Precision 5690 | |
| Dell Precision 5000 5490 | |
| HP ZBook Power 16 G11 A | |
| Media AMD Ryzen 7 8845HS (2342 - 2908, n=13) | |
| HP ZBook Power 15 G10 | |
| HP ZBook Fury 16 G9 | |
| Lenovo ThinkPad P16s G2 21K9000CGE | |
| Lenovo ThinkPad P16v G1 AMD | |
| MSI CreatorPro Z16P B12UKST | |
| Lenovo ThinkPad P1 G4-20Y4Z9DVUS | |
| HP ZBook Firefly 16 G9-6B897EA | |
| Cinebench R15 / CPU Single 64Bit | |
| HP ZBook Fury 16 G11 | |
| HP ZBook Power 15 G10 | |
| Media AMD Ryzen 7 8845HS (269 - 283, n=13) | |
| HP ZBook Power 16 G11 A | |
| Asus ExpertBook B6 Flip B6602FC2 | |
| Dell Precision 5690 | |
| Lenovo ThinkPad P16s G2 21K9000CGE | |
| Lenovo ThinkPad P16v G1 AMD | |
| Dell Precision 5000 5490 | |
| MSI CreatorPro Z16P B12UKST | |
| Lenovo ThinkPad P1 G4-20Y4Z9DVUS | |
| HP ZBook Firefly 16 G9-6B897EA | |
| HP ZBook Fury 16 G9 | |
| Blender / v2.79 BMW27 CPU | |
| HP ZBook Firefly 16 G9-6B897EA | |
| Lenovo ThinkPad P1 G4-20Y4Z9DVUS | |
| Lenovo ThinkPad P16s G2 21K9000CGE | |
| Dell Precision 5690 | |
| HP ZBook Power 16 G11 A | |
| Lenovo ThinkPad P16v G1 AMD | |
| Dell Precision 5000 5490 | |
| MSI CreatorPro Z16P B12UKST | |
| HP ZBook Power 15 G10 | |
| Media AMD Ryzen 7 8845HS (179 - 216, n=13) | |
| Asus ExpertBook B6 Flip B6602FC2 | |
| HP ZBook Fury 16 G9 | |
| HP ZBook Fury 16 G11 | |
| 7-Zip 18.03 / 7z b 4 | |
| HP ZBook Fury 16 G11 | |
| HP ZBook Fury 16 G9 | |
| Dell Precision 5690 | |
| Asus ExpertBook B6 Flip B6602FC2 | |
| HP ZBook Power 15 G10 | |
| Media AMD Ryzen 7 8845HS (62669 - 74664, n=13) | |
| Dell Precision 5000 5490 | |
| HP ZBook Power 16 G11 A | |
| MSI CreatorPro Z16P B12UKST | |
| Lenovo ThinkPad P16v G1 AMD | |
| Lenovo ThinkPad P16s G2 21K9000CGE | |
| Lenovo ThinkPad P1 G4-20Y4Z9DVUS | |
| HP ZBook Firefly 16 G9-6B897EA | |
| 7-Zip 18.03 / 7z b 4 -mmt1 | |
| HP ZBook Fury 16 G11 | |
| Lenovo ThinkPad P16v G1 AMD | |
| HP ZBook Power 15 G10 | |
| Media AMD Ryzen 7 8845HS (5197 - 6714, n=13) | |
| HP ZBook Power 16 G11 A | |
| Asus ExpertBook B6 Flip B6602FC2 | |
| HP ZBook Fury 16 G9 | |
| Lenovo ThinkPad P16s G2 21K9000CGE | |
| MSI CreatorPro Z16P B12UKST | |
| Lenovo ThinkPad P1 G4-20Y4Z9DVUS | |
| Dell Precision 5000 5490 | |
| Dell Precision 5690 | |
| HP ZBook Firefly 16 G9-6B897EA | |
| Geekbench 6.7 / Multi-Core | |
| HP ZBook Fury 16 G11 | |
| Dell Precision 5690 | |
| Dell Precision 5000 5490 | |
| HP ZBook Power 15 G10 | |
| Media AMD Ryzen 7 8845HS (11073 - 14014, n=18) | |
| HP ZBook Power 16 G11 A | |
| Lenovo ThinkPad P16s G2 21K9000CGE | |
| Lenovo ThinkPad P16v G1 AMD | |
| Geekbench 6.7 / Single-Core | |
| HP ZBook Fury 16 G11 | |
| HP ZBook Power 15 G10 | |
| Media AMD Ryzen 7 8845HS (2510 - 2698, n=16) | |
| HP ZBook Power 16 G11 A | |
| Lenovo ThinkPad P16v G1 AMD | |
| Dell Precision 5690 | |
| Lenovo ThinkPad P16s G2 21K9000CGE | |
| Dell Precision 5000 5490 | |
| Geekbench 5.5 / Multi-Core | |
| HP ZBook Fury 16 G11 | |
| Asus ExpertBook B6 Flip B6602FC2 | |
| Dell Precision 5690 | |
| HP ZBook Fury 16 G9 | |
| Dell Precision 5000 5490 | |
| MSI CreatorPro Z16P B12UKST | |
| HP ZBook Power 15 G10 | |
| Media AMD Ryzen 7 8845HS (11256 - 12726, n=15) | |
| HP ZBook Power 16 G11 A | |
| Lenovo ThinkPad P16s G2 21K9000CGE | |
| Lenovo ThinkPad P16v G1 AMD | |
| Lenovo ThinkPad P1 G4-20Y4Z9DVUS | |
| HP ZBook Firefly 16 G9-6B897EA | |
| Geekbench 5.5 / Single-Core | |
| HP ZBook Fury 16 G11 | |
| HP ZBook Power 15 G10 | |
| HP ZBook Fury 16 G9 | |
| Media AMD Ryzen 7 8845HS (1765 - 2004, n=15) | |
| HP ZBook Power 16 G11 A | |
| Asus ExpertBook B6 Flip B6602FC2 | |
| Dell Precision 5690 | |
| Lenovo ThinkPad P16v G1 AMD | |
| HP ZBook Firefly 16 G9-6B897EA | |
| MSI CreatorPro Z16P B12UKST | |
| Dell Precision 5000 5490 | |
| Lenovo ThinkPad P16s G2 21K9000CGE | |
| Lenovo ThinkPad P1 G4-20Y4Z9DVUS | |
| HWBOT x265 Benchmark v2.2 / 4k Preset | |
| HP ZBook Fury 16 G11 | |
| Dell Precision 5690 | |
| Asus ExpertBook B6 Flip B6602FC2 | |
| Media AMD Ryzen 7 8845HS (18.6 - 22.7, n=13) | |
| HP ZBook Power 15 G10 | |
| HP ZBook Fury 16 G9 | |
| HP ZBook Power 16 G11 A | |
| MSI CreatorPro Z16P B12UKST | |
| Lenovo ThinkPad P16v G1 AMD | |
| Lenovo ThinkPad P16s G2 21K9000CGE | |
| Dell Precision 5000 5490 | |
| Lenovo ThinkPad P1 G4-20Y4Z9DVUS | |
| HP ZBook Firefly 16 G9-6B897EA | |
| LibreOffice / 20 Documents To PDF | |
| HP ZBook Power 15 G10 | |
| HP ZBook Firefly 16 G9-6B897EA | |
| Lenovo ThinkPad P16s G2 21K9000CGE | |
| HP ZBook Power 16 G11 A | |
| Media AMD Ryzen 7 8845HS (44.4 - 77, n=13) | |
| Lenovo ThinkPad P1 G4-20Y4Z9DVUS | |
| HP ZBook Fury 16 G11 | |
| Lenovo ThinkPad P16v G1 AMD | |
| Dell Precision 5000 5490 | |
| Asus ExpertBook B6 Flip B6602FC2 | |
| Dell Precision 5690 | |
| MSI CreatorPro Z16P B12UKST | |
| HP ZBook Fury 16 G9 | |
| R Benchmark 2.5 / Overall mean | |
| Lenovo ThinkPad P1 G4-20Y4Z9DVUS | |
| HP ZBook Firefly 16 G9-6B897EA | |
| Dell Precision 5000 5490 | |
| Lenovo ThinkPad P16s G2 21K9000CGE | |
| Dell Precision 5690 | |
| MSI CreatorPro Z16P B12UKST | |
| Asus ExpertBook B6 Flip B6602FC2 | |
| Media AMD Ryzen 7 8845HS (0.4304 - 0.4935, n=13) | |
| HP ZBook Power 15 G10 | |
| HP ZBook Power 16 G11 A | |
| Lenovo ThinkPad P16v G1 AMD | |
| HP ZBook Fury 16 G9 | |
| HP ZBook Fury 16 G11 | |
Cinebench R23: Multi Core | Single Core
Cinebench R20: CPU (Multi Core) | CPU (Single Core)
Cinebench R15: CPU Multi 64Bit | CPU Single 64Bit
Blender: v2.79 BMW27 CPU
7-Zip 18.03: 7z b 4 | 7z b 4 -mmt1
Geekbench 6.7: Multi-Core | Single-Core
Geekbench 5.5: Multi-Core | Single-Core
HWBOT x265 Benchmark v2.2: 4k Preset
LibreOffice : 20 Documents To PDF
R Benchmark 2.5: Overall mean
* ... Meglio usare valori piccoli
AIDA64: FP32 Ray-Trace | FPU Julia | CPU SHA3 | CPU Queen | FPU SinJulia | FPU Mandel | CPU AES | CPU ZLib | FP64 Ray-Trace | CPU PhotoWorxx
| Performance rating | |
| Media AMD Ryzen 7 8845HS | |
| HP ZBook Power 15 G10 | |
| HP ZBook Power 16 G11 A | |
| HP ZBook Fury 16 G11 | |
| Lenovo ThinkPad P16s G2 21K9000CGE | |
| Dell Precision 5690 | |
| Lenovo ThinkPad P1 Gen 7 21KV001SGE | |
| AIDA64 / FP32 Ray-Trace | |
| Media AMD Ryzen 7 8845HS (23708 - 29544, n=13) | |
| HP ZBook Power 15 G10 | |
| HP ZBook Power 16 G11 A | |
| Lenovo ThinkPad P16s G2 21K9000CGE | |
| HP ZBook Fury 16 G11 | |
| Dell Precision 5690 | |
| Lenovo ThinkPad P1 Gen 7 21KV001SGE | |
| AIDA64 / FPU Julia | |
| HP ZBook Power 16 G11 A | |
| Media AMD Ryzen 7 8845HS (99659 - 125873, n=13) | |
| HP ZBook Power 15 G10 | |
| HP ZBook Fury 16 G11 | |
| Lenovo ThinkPad P16s G2 21K9000CGE | |
| Dell Precision 5690 | |
| Lenovo ThinkPad P1 Gen 7 21KV001SGE | |
| AIDA64 / CPU SHA3 | |
| HP ZBook Fury 16 G11 | |
| HP ZBook Power 16 G11 A | |
| Media AMD Ryzen 7 8845HS (4332 - 5180, n=13) | |
| HP ZBook Power 15 G10 | |
| Lenovo ThinkPad P16s G2 21K9000CGE | |
| Dell Precision 5690 | |
| Lenovo ThinkPad P1 Gen 7 21KV001SGE | |
| AIDA64 / CPU Queen | |
| HP ZBook Fury 16 G11 | |
| HP ZBook Power 16 G11 A | |
| Media AMD Ryzen 7 8845HS (109458 - 124695, n=13) | |
| HP ZBook Power 15 G10 | |
| Lenovo ThinkPad P16s G2 21K9000CGE | |
| Dell Precision 5690 | |
| Lenovo ThinkPad P1 Gen 7 21KV001SGE | |
| AIDA64 / FPU SinJulia | |
| Media AMD Ryzen 7 8845HS (14062 - 15519, n=13) | |
| HP ZBook Power 15 G10 | |
| HP ZBook Power 16 G11 A | |
| Lenovo ThinkPad P16s G2 21K9000CGE | |
| HP ZBook Fury 16 G11 | |
| Dell Precision 5690 | |
| Lenovo ThinkPad P1 Gen 7 21KV001SGE | |
| AIDA64 / FPU Mandel | |
| Media AMD Ryzen 7 8845HS (53436 - 67367, n=13) | |
| HP ZBook Power 15 G10 | |
| HP ZBook Power 16 G11 A | |
| Lenovo ThinkPad P16s G2 21K9000CGE | |
| HP ZBook Fury 16 G11 | |
| Dell Precision 5690 | |
| Lenovo ThinkPad P1 Gen 7 21KV001SGE | |
| AIDA64 / CPU AES | |
| HP ZBook Fury 16 G11 | |
| Media AMD Ryzen 7 8845HS (64515 - 172642, n=13) | |
| Dell Precision 5690 | |
| HP ZBook Power 15 G10 | |
| Lenovo ThinkPad P1 Gen 7 21KV001SGE | |
| HP ZBook Power 16 G11 A | |
| Lenovo ThinkPad P16s G2 21K9000CGE | |
| AIDA64 / CPU ZLib | |
| HP ZBook Fury 16 G11 | |
| Dell Precision 5690 | |
| Lenovo ThinkPad P1 Gen 7 21KV001SGE | |
| HP ZBook Power 16 G11 A | |
| HP ZBook Power 15 G10 | |
| Lenovo ThinkPad P16s G2 21K9000CGE | |
| Media AMD Ryzen 7 8845HS (627 - 1080, n=13) | |
| AIDA64 / FP64 Ray-Trace | |
| HP ZBook Power 15 G10 | |
| Media AMD Ryzen 7 8845HS (12361 - 15911, n=13) | |
| HP ZBook Power 16 G11 A | |
| Lenovo ThinkPad P16s G2 21K9000CGE | |
| HP ZBook Fury 16 G11 | |
| Dell Precision 5690 | |
| Lenovo ThinkPad P1 Gen 7 21KV001SGE | |
| AIDA64 / CPU PhotoWorxx | |
| Dell Precision 5690 | |
| HP ZBook Power 15 G10 | |
| Lenovo ThinkPad P1 Gen 7 21KV001SGE | |
| HP ZBook Power 16 G11 A | |
| Media AMD Ryzen 7 8845HS (33192 - 41668, n=13) | |
| Lenovo ThinkPad P16s G2 21K9000CGE | |
| HP ZBook Fury 16 G11 | |
Test da sforzo
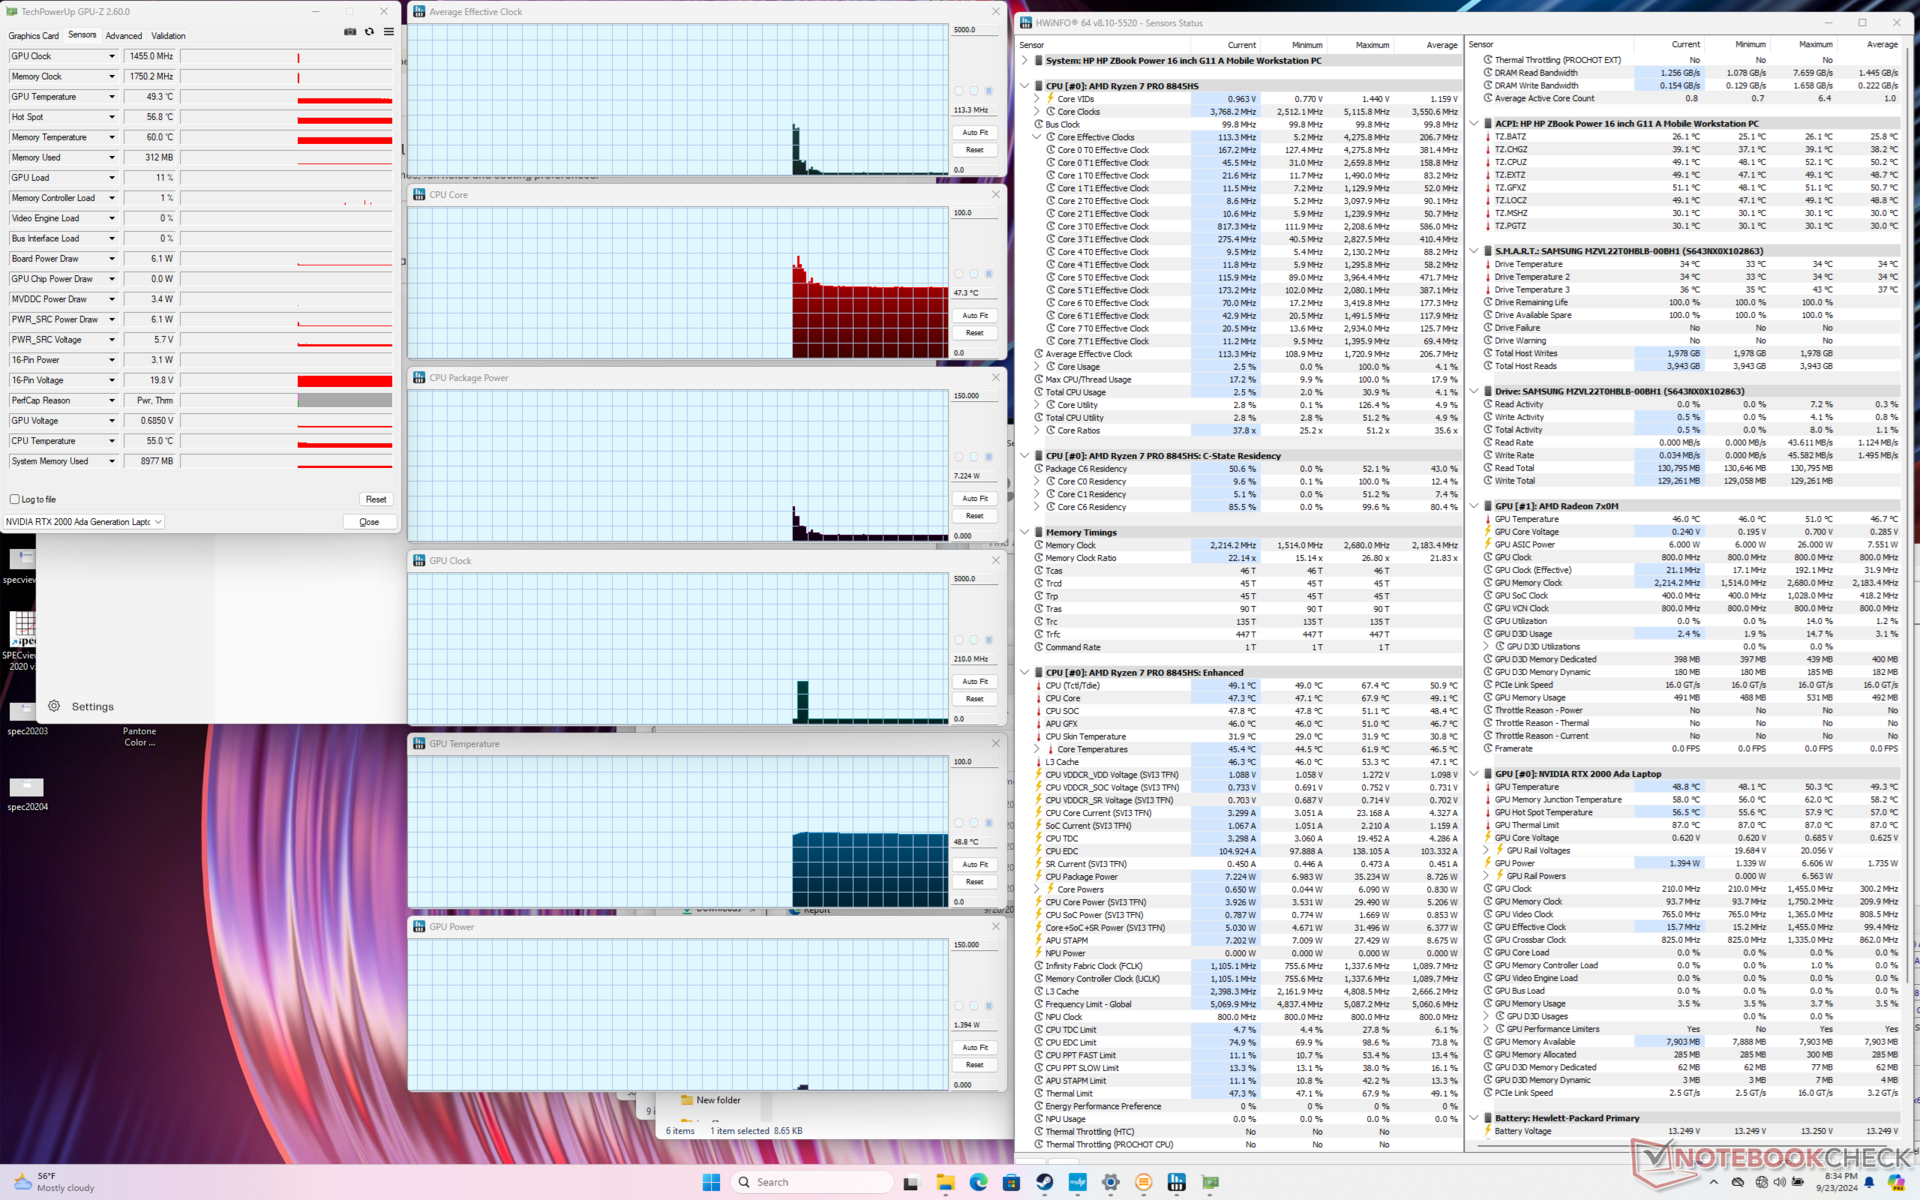
La CPU saliva a 4,3 GHz, 65 W e 90 C quando si avviava lo stress Prime95, prima di scendere rapidamente e stabilizzarsi a 3,8 GHz e 50 W per evitare temperature più elevate del nucleo. I risultati sono vicini a quelli osservati sullo ZBook Power 15 G10, se non leggermente più caldi di qualche grado.
È interessante notare che la CPU si riduce a soli 2,8 GHz quando si eseguono contemporaneamente Prime95 e FurMark, invece di 3,8 GHz come nel modello dello scorso anno. Questo cambiamento è stato fatto probabilmente per migliorare le temperature del core; la CPU ora si stabilizza a 66 C, più confortevoli, invece dei 99 C dello ZBook Power 15 G10.
L'esecuzione di Cyberpunk 2077 in modalità Bilanciata invece che in modalità Prestazioni si traduce in temperature dei core leggermente più fredde e in velocità di clock medie leggermente più basse, come mostrato di seguito. Anche l'assorbimento di potenza della scheda GPU scende da 35 W a 30 W, contro il massimo di 50 W pubblicizzato.
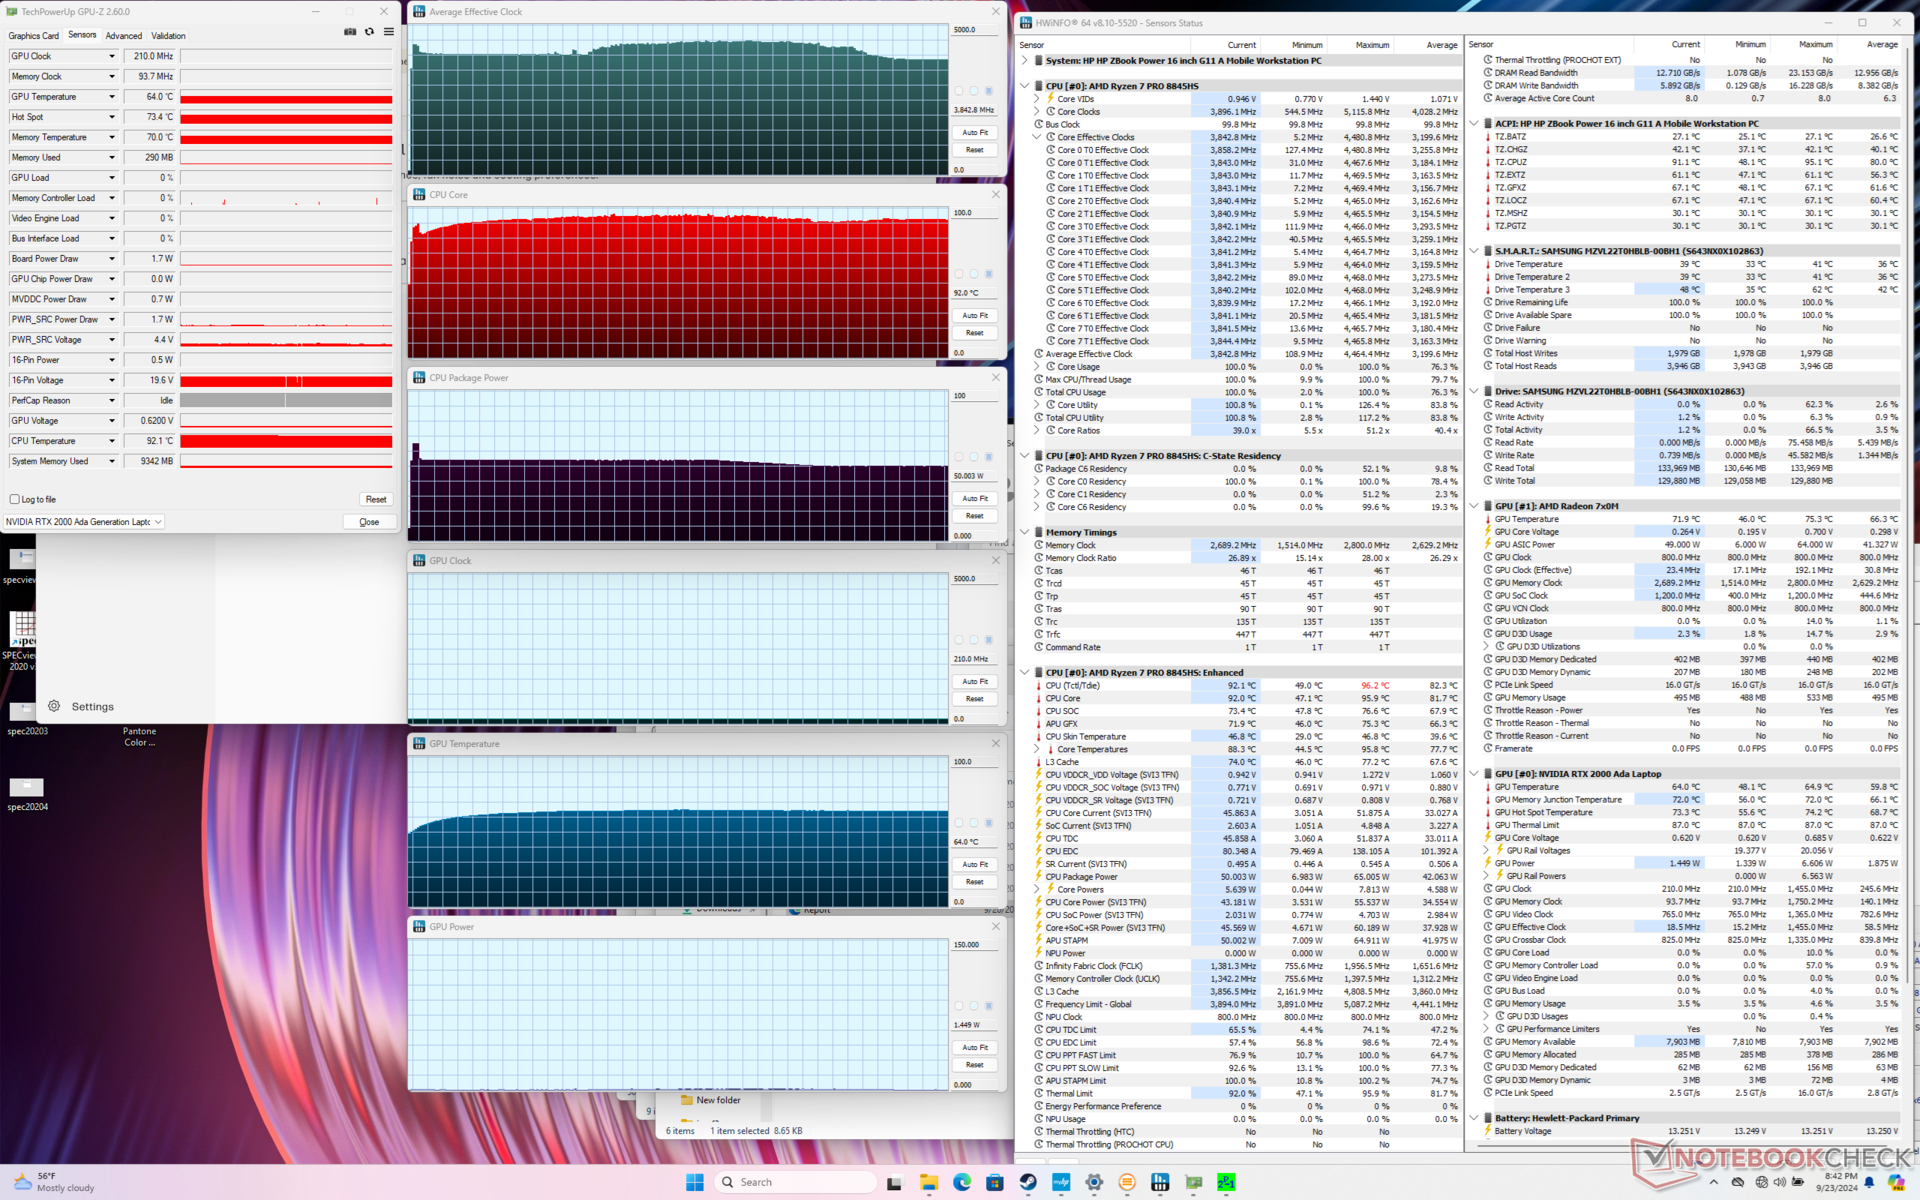
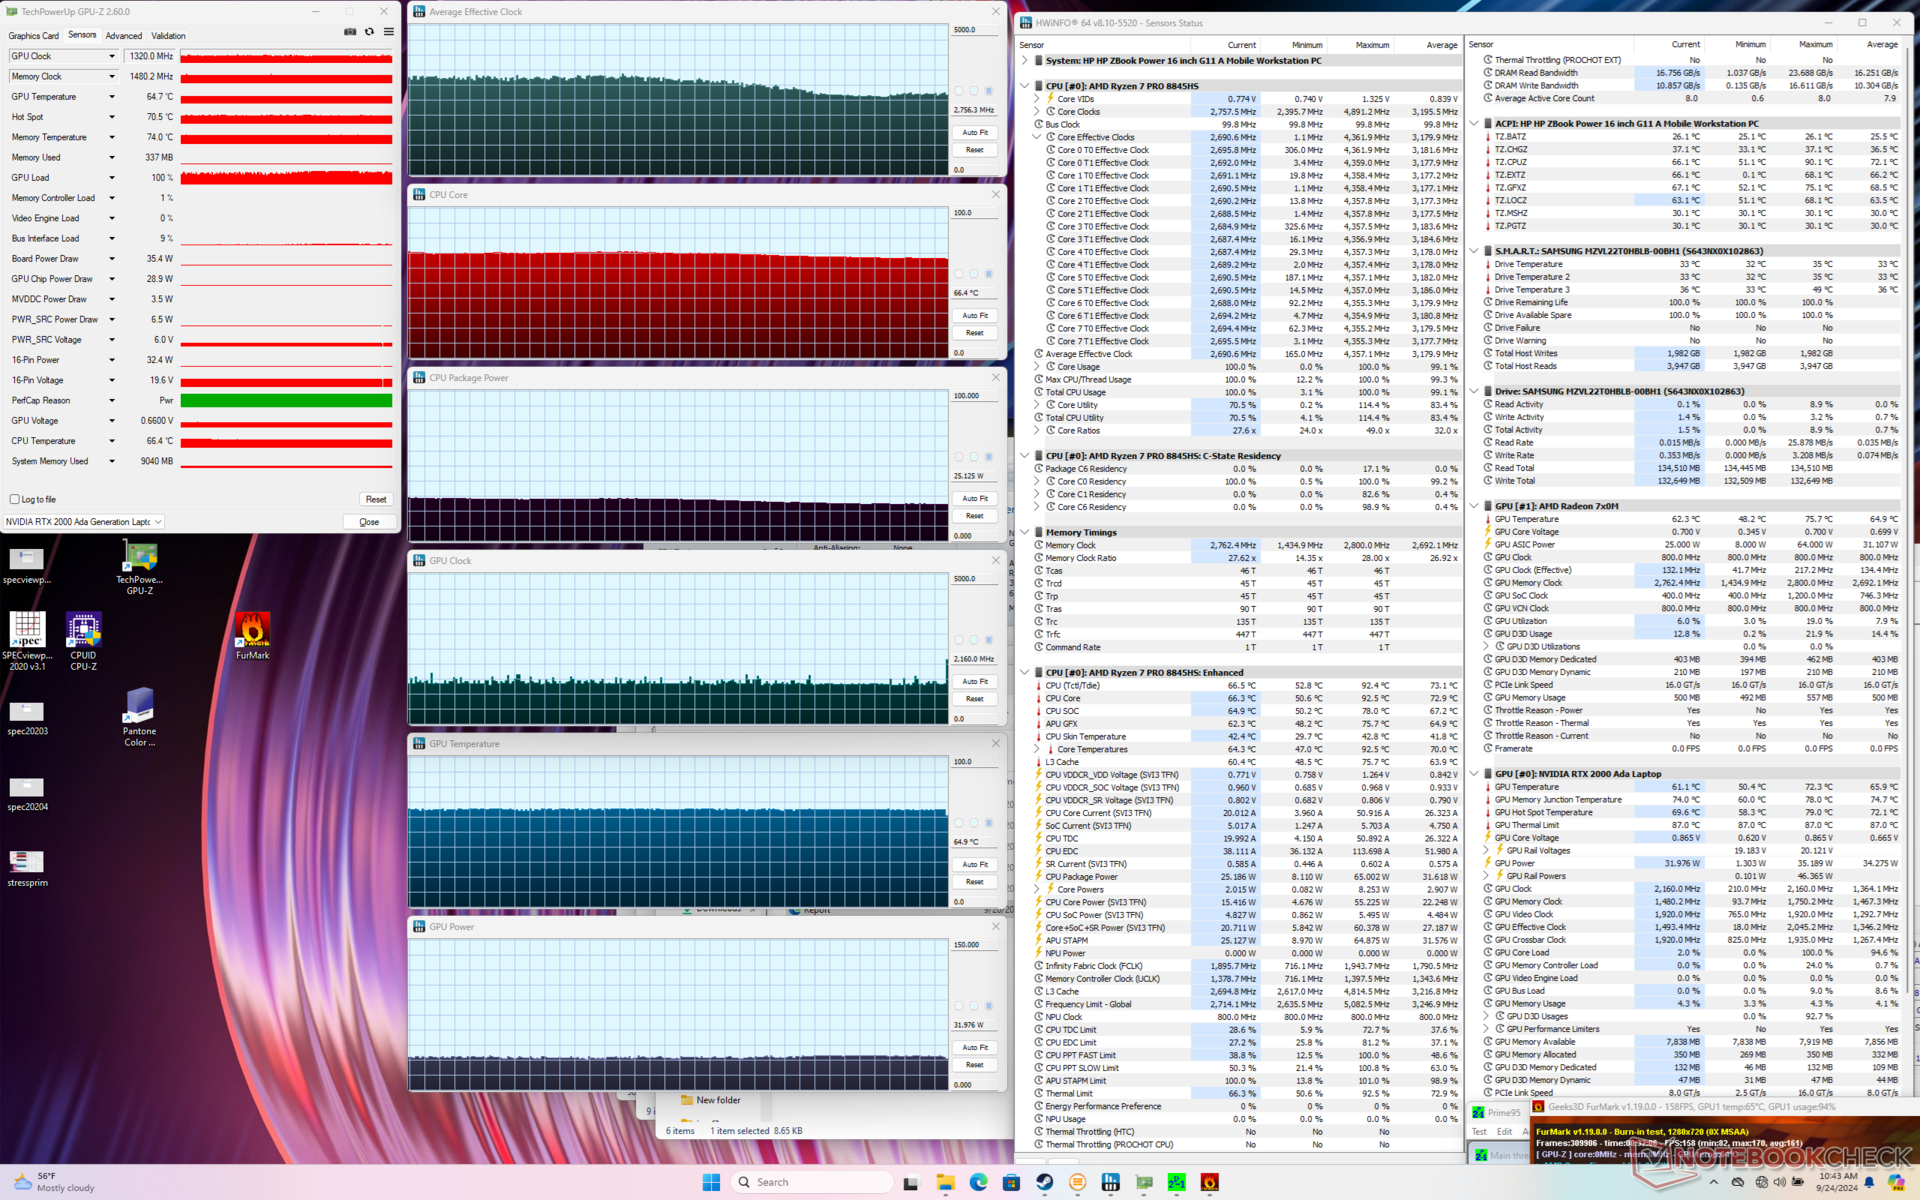
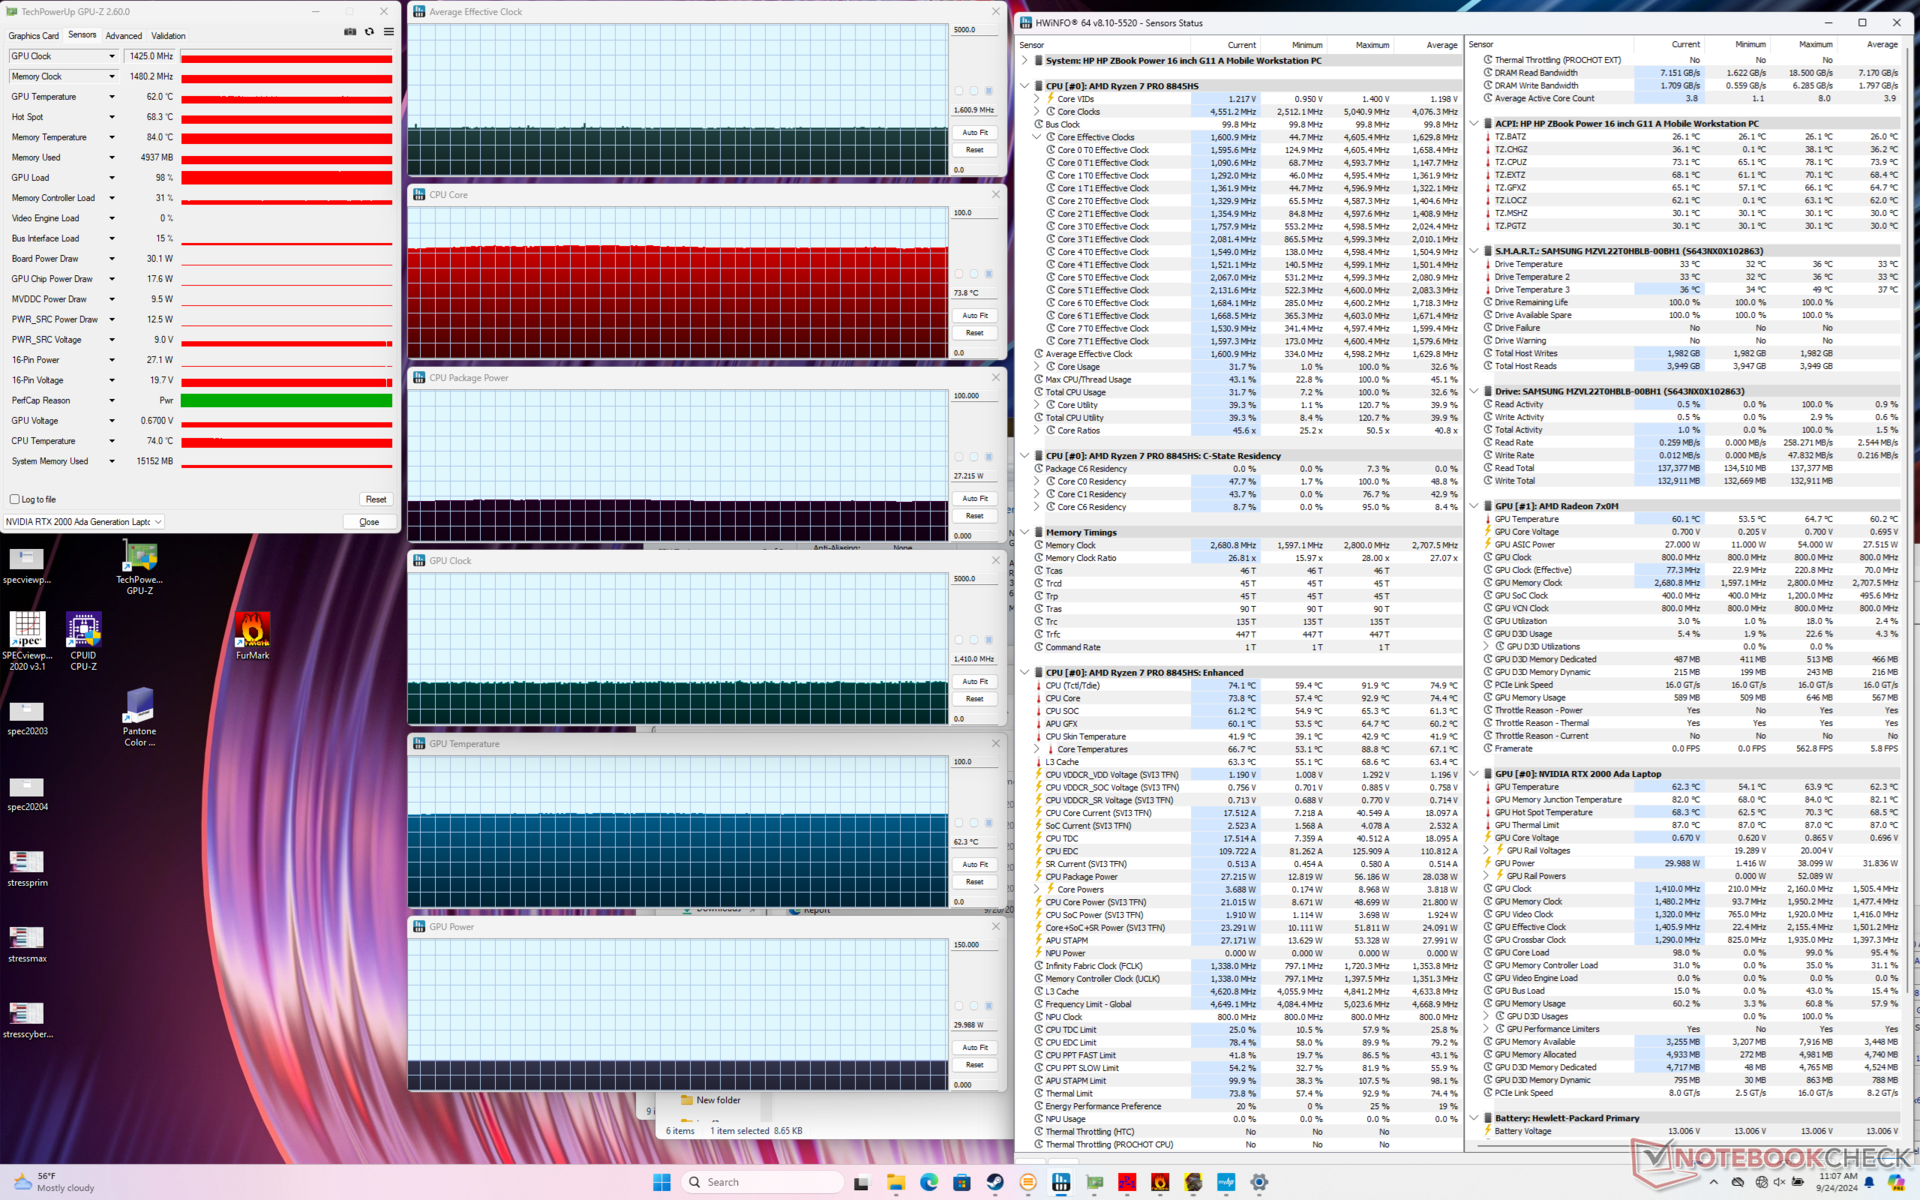
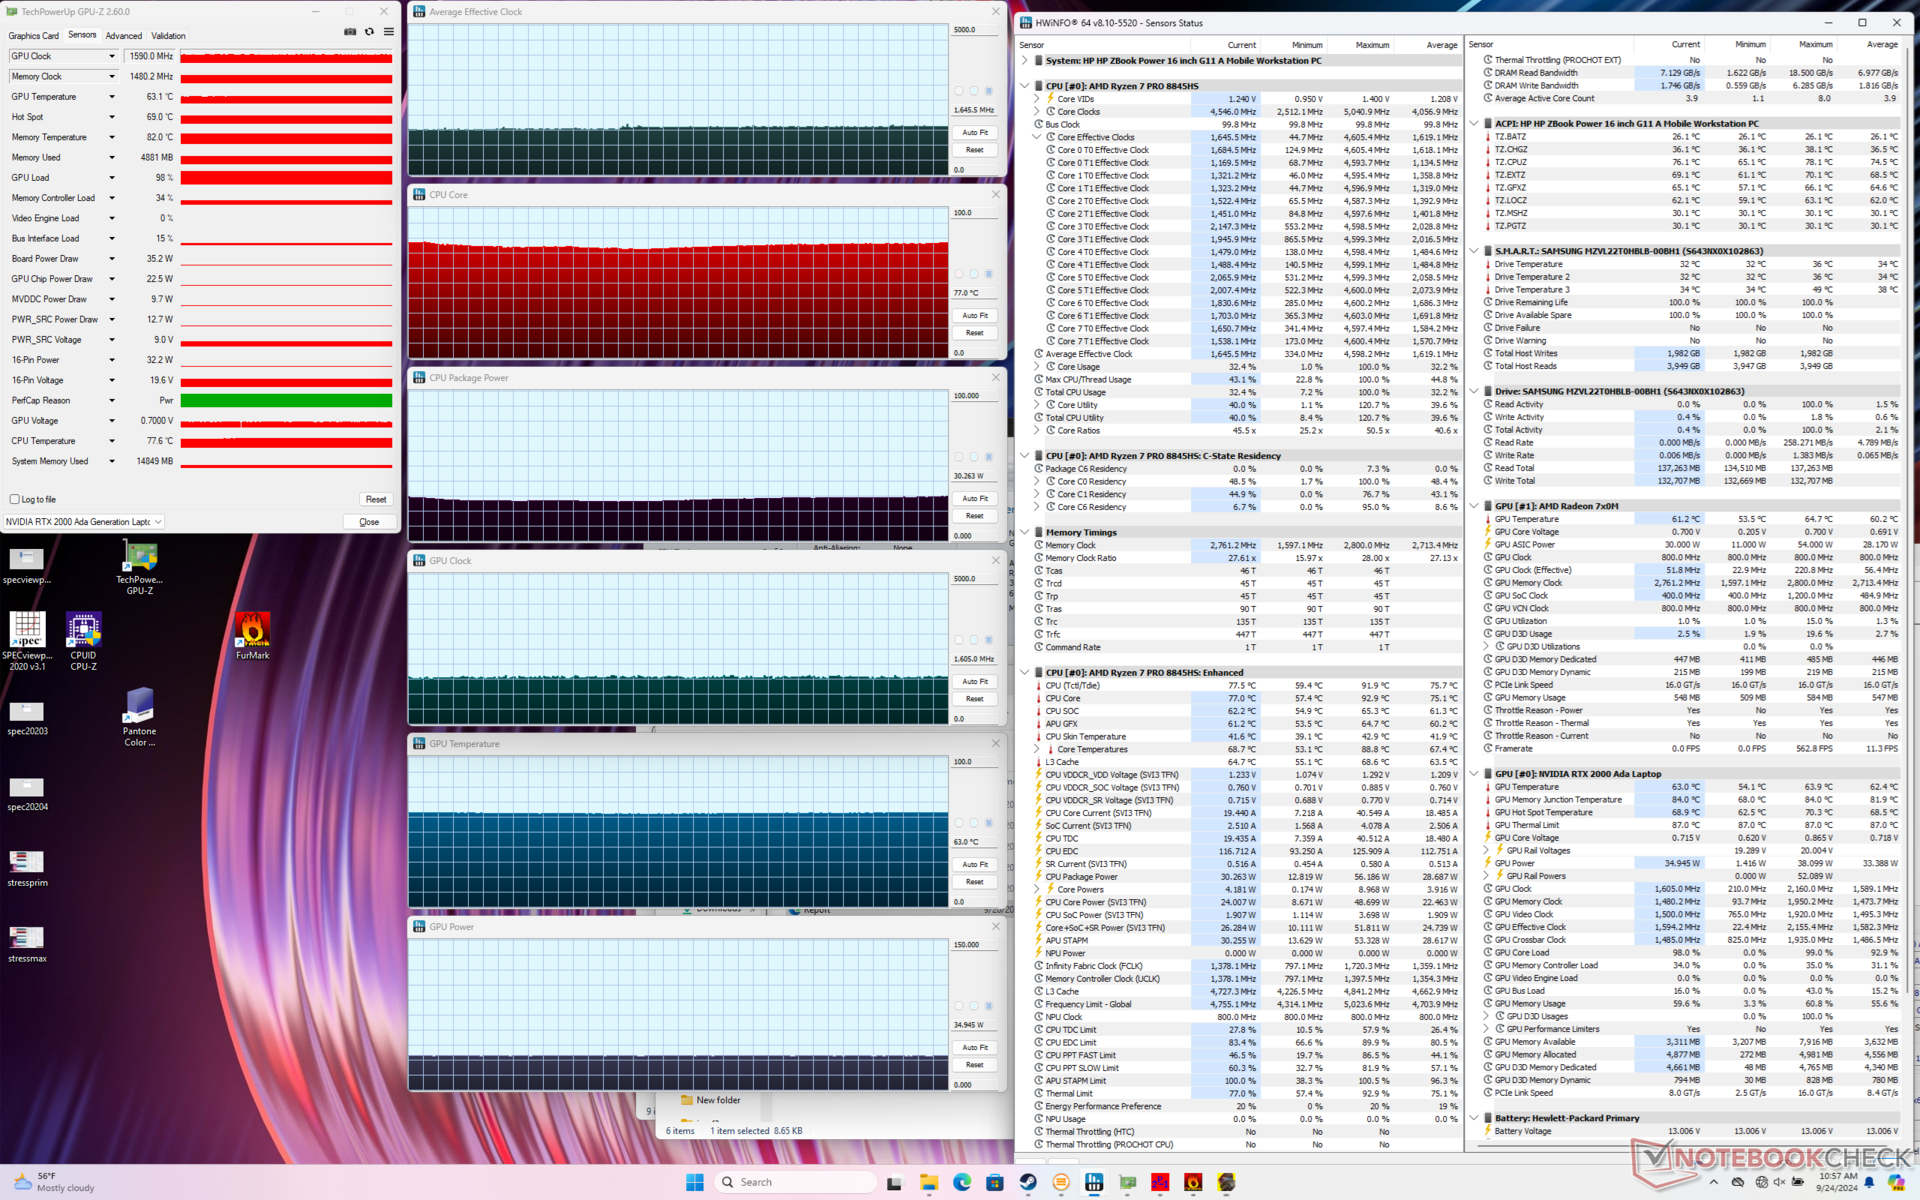
| Clock medio della CPU (GHz) | Clock della GPU (MHz) | Temperatura media della CPU (°C) | Temperatura media della GPU (°C) | |
| Sistema inattivo | -- | -- | 47 | 49 |
| Stress Prime95 | 3,9 | -- | 92 | 64 |
| Prime95 + FurMark Stress | 2,8 | 1320 | 66 | 65 |
| Cyberpunk 2077 Stress (modalità Bilanciata) | 1,6 | 1425 | 74 | 62 |
| Cyberpunk 2077 Stress (modalità Performance) | 1,7 | 1590 | 77 | 63 |
Prestazioni del sistema
I risultati di PCMark sono quasi identici a quelli che abbiamo registrato sullo ZBook Power 15 G10 dello scorso anno. Ciò significa che i carichi quotidiani tradizionali, come la navigazione o l'editing, non sono sensibilmente più veloci sul nostro modello più recente. Anche le prestazioni della RAM non sono migliorate.
Abbiamo riscontrato un problema di risveglio dal sonno, per il quale era necessario uno spegnimento brusco per tornare a Windows. Non siamo stati in grado di replicare in modo affidabile il problema, ma il fatto che si sia verificato su una workstation mobile è comunque degno di nota.

CrossMark: Overall | Productivity | Creativity | Responsiveness
WebXPRT 3: Overall
WebXPRT 4: Overall
Mozilla Kraken 1.1: Total
| PCMark 10 / Score | |
| Dell Precision 5690 | |
| HP ZBook Fury 16 G11 | |
| HP ZBook Power 15 G10 | |
| HP ZBook Power 16 G11 A | |
| Media AMD Ryzen 7 8845HS, NVIDIA RTX 2000 Ada Generation Laptop (n=1) | |
| Lenovo ThinkPad P1 Gen 7 21KV001SGE | |
| Lenovo ThinkPad P16s G2 21K9000CGE | |
| PCMark 10 / Essentials | |
| Dell Precision 5690 | |
| HP ZBook Power 15 G10 | |
| HP ZBook Power 16 G11 A | |
| Media AMD Ryzen 7 8845HS, NVIDIA RTX 2000 Ada Generation Laptop (n=1) | |
| Lenovo ThinkPad P1 Gen 7 21KV001SGE | |
| Lenovo ThinkPad P16s G2 21K9000CGE | |
| HP ZBook Fury 16 G11 | |
| PCMark 10 / Productivity | |
| Dell Precision 5690 | |
| HP ZBook Power 15 G10 | |
| HP ZBook Power 16 G11 A | |
| Media AMD Ryzen 7 8845HS, NVIDIA RTX 2000 Ada Generation Laptop (n=1) | |
| HP ZBook Fury 16 G11 | |
| Lenovo ThinkPad P1 Gen 7 21KV001SGE | |
| Lenovo ThinkPad P16s G2 21K9000CGE | |
| PCMark 10 / Digital Content Creation | |
| HP ZBook Fury 16 G11 | |
| Dell Precision 5690 | |
| Lenovo ThinkPad P1 Gen 7 21KV001SGE | |
| HP ZBook Power 15 G10 | |
| HP ZBook Power 16 G11 A | |
| Media AMD Ryzen 7 8845HS, NVIDIA RTX 2000 Ada Generation Laptop (n=1) | |
| Lenovo ThinkPad P16s G2 21K9000CGE | |
| CrossMark / Overall | |
| HP ZBook Fury 16 G11 | |
| Dell Precision 5690 | |
| HP ZBook Power 16 G11 A | |
| Media AMD Ryzen 7 8845HS, NVIDIA RTX 2000 Ada Generation Laptop (n=1) | |
| Lenovo ThinkPad P1 Gen 7 21KV001SGE | |
| HP ZBook Power 15 G10 | |
| Lenovo ThinkPad P16s G2 21K9000CGE | |
| CrossMark / Productivity | |
| HP ZBook Fury 16 G11 | |
| Dell Precision 5690 | |
| HP ZBook Power 16 G11 A | |
| Media AMD Ryzen 7 8845HS, NVIDIA RTX 2000 Ada Generation Laptop (n=1) | |
| Lenovo ThinkPad P1 Gen 7 21KV001SGE | |
| HP ZBook Power 15 G10 | |
| Lenovo ThinkPad P16s G2 21K9000CGE | |
| CrossMark / Creativity | |
| HP ZBook Fury 16 G11 | |
| HP ZBook Power 16 G11 A | |
| Media AMD Ryzen 7 8845HS, NVIDIA RTX 2000 Ada Generation Laptop (n=1) | |
| Dell Precision 5690 | |
| Lenovo ThinkPad P1 Gen 7 21KV001SGE | |
| HP ZBook Power 15 G10 | |
| Lenovo ThinkPad P16s G2 21K9000CGE | |
| CrossMark / Responsiveness | |
| HP ZBook Fury 16 G11 | |
| Dell Precision 5690 | |
| HP ZBook Power 16 G11 A | |
| Media AMD Ryzen 7 8845HS, NVIDIA RTX 2000 Ada Generation Laptop (n=1) | |
| Lenovo ThinkPad P1 Gen 7 21KV001SGE | |
| Lenovo ThinkPad P16s G2 21K9000CGE | |
| HP ZBook Power 15 G10 | |
| WebXPRT 3 / Overall | |
| HP ZBook Fury 16 G11 | |
| HP ZBook Power 15 G10 | |
| HP ZBook Power 16 G11 A | |
| Media AMD Ryzen 7 8845HS, NVIDIA RTX 2000 Ada Generation Laptop (n=1) | |
| Dell Precision 5690 | |
| Lenovo ThinkPad P1 Gen 7 21KV001SGE | |
| Lenovo ThinkPad P16s G2 21K9000CGE | |
| WebXPRT 4 / Overall | |
| HP ZBook Fury 16 G11 | |
| Dell Precision 5690 | |
| Lenovo ThinkPad P1 Gen 7 21KV001SGE | |
| HP ZBook Power 16 G11 A | |
| Media AMD Ryzen 7 8845HS, NVIDIA RTX 2000 Ada Generation Laptop (n=1) | |
| HP ZBook Power 15 G10 | |
| Mozilla Kraken 1.1 / Total | |
| Lenovo ThinkPad P16s G2 21K9000CGE | |
| HP ZBook Power 15 G10 | |
| HP ZBook Power 16 G11 A | |
| Media AMD Ryzen 7 8845HS, NVIDIA RTX 2000 Ada Generation Laptop (n=1) | |
| Lenovo ThinkPad P1 Gen 7 21KV001SGE | |
| Dell Precision 5690 | |
| HP ZBook Fury 16 G11 | |
* ... Meglio usare valori piccoli
| PCMark 10 Score | 7376 punti | |
Aiuto | ||
| AIDA64 / Memory Copy | |
| Dell Precision 5690 | |
| HP ZBook Power 15 G10 | |
| Media AMD Ryzen 7 8845HS (61459 - 71873, n=13) | |
| Lenovo ThinkPad P16s G2 21K9000CGE | |
| Lenovo ThinkPad P1 Gen 7 21KV001SGE | |
| HP ZBook Power 16 G11 A | |
| HP ZBook Fury 16 G11 | |
| AIDA64 / Memory Read | |
| Dell Precision 5690 | |
| Lenovo ThinkPad P1 Gen 7 21KV001SGE | |
| HP ZBook Power 15 G10 | |
| HP ZBook Power 16 G11 A | |
| HP ZBook Fury 16 G11 | |
| Media AMD Ryzen 7 8845HS (49866 - 61976, n=13) | |
| Lenovo ThinkPad P16s G2 21K9000CGE | |
| AIDA64 / Memory Write | |
| Lenovo ThinkPad P16s G2 21K9000CGE | |
| Media AMD Ryzen 7 8845HS (68425 - 93239, n=13) | |
| HP ZBook Power 15 G10 | |
| HP ZBook Power 16 G11 A | |
| Dell Precision 5690 | |
| Lenovo ThinkPad P1 Gen 7 21KV001SGE | |
| HP ZBook Fury 16 G11 | |
| AIDA64 / Memory Latency | |
| Dell Precision 5690 | |
| Lenovo ThinkPad P1 Gen 7 21KV001SGE | |
| Lenovo ThinkPad P16s G2 21K9000CGE | |
| HP ZBook Power 15 G10 | |
| HP ZBook Power 16 G11 A | |
| Media AMD Ryzen 7 8845HS (82.5 - 117, n=13) | |
| HP ZBook Fury 16 G11 | |
* ... Meglio usare valori piccoli
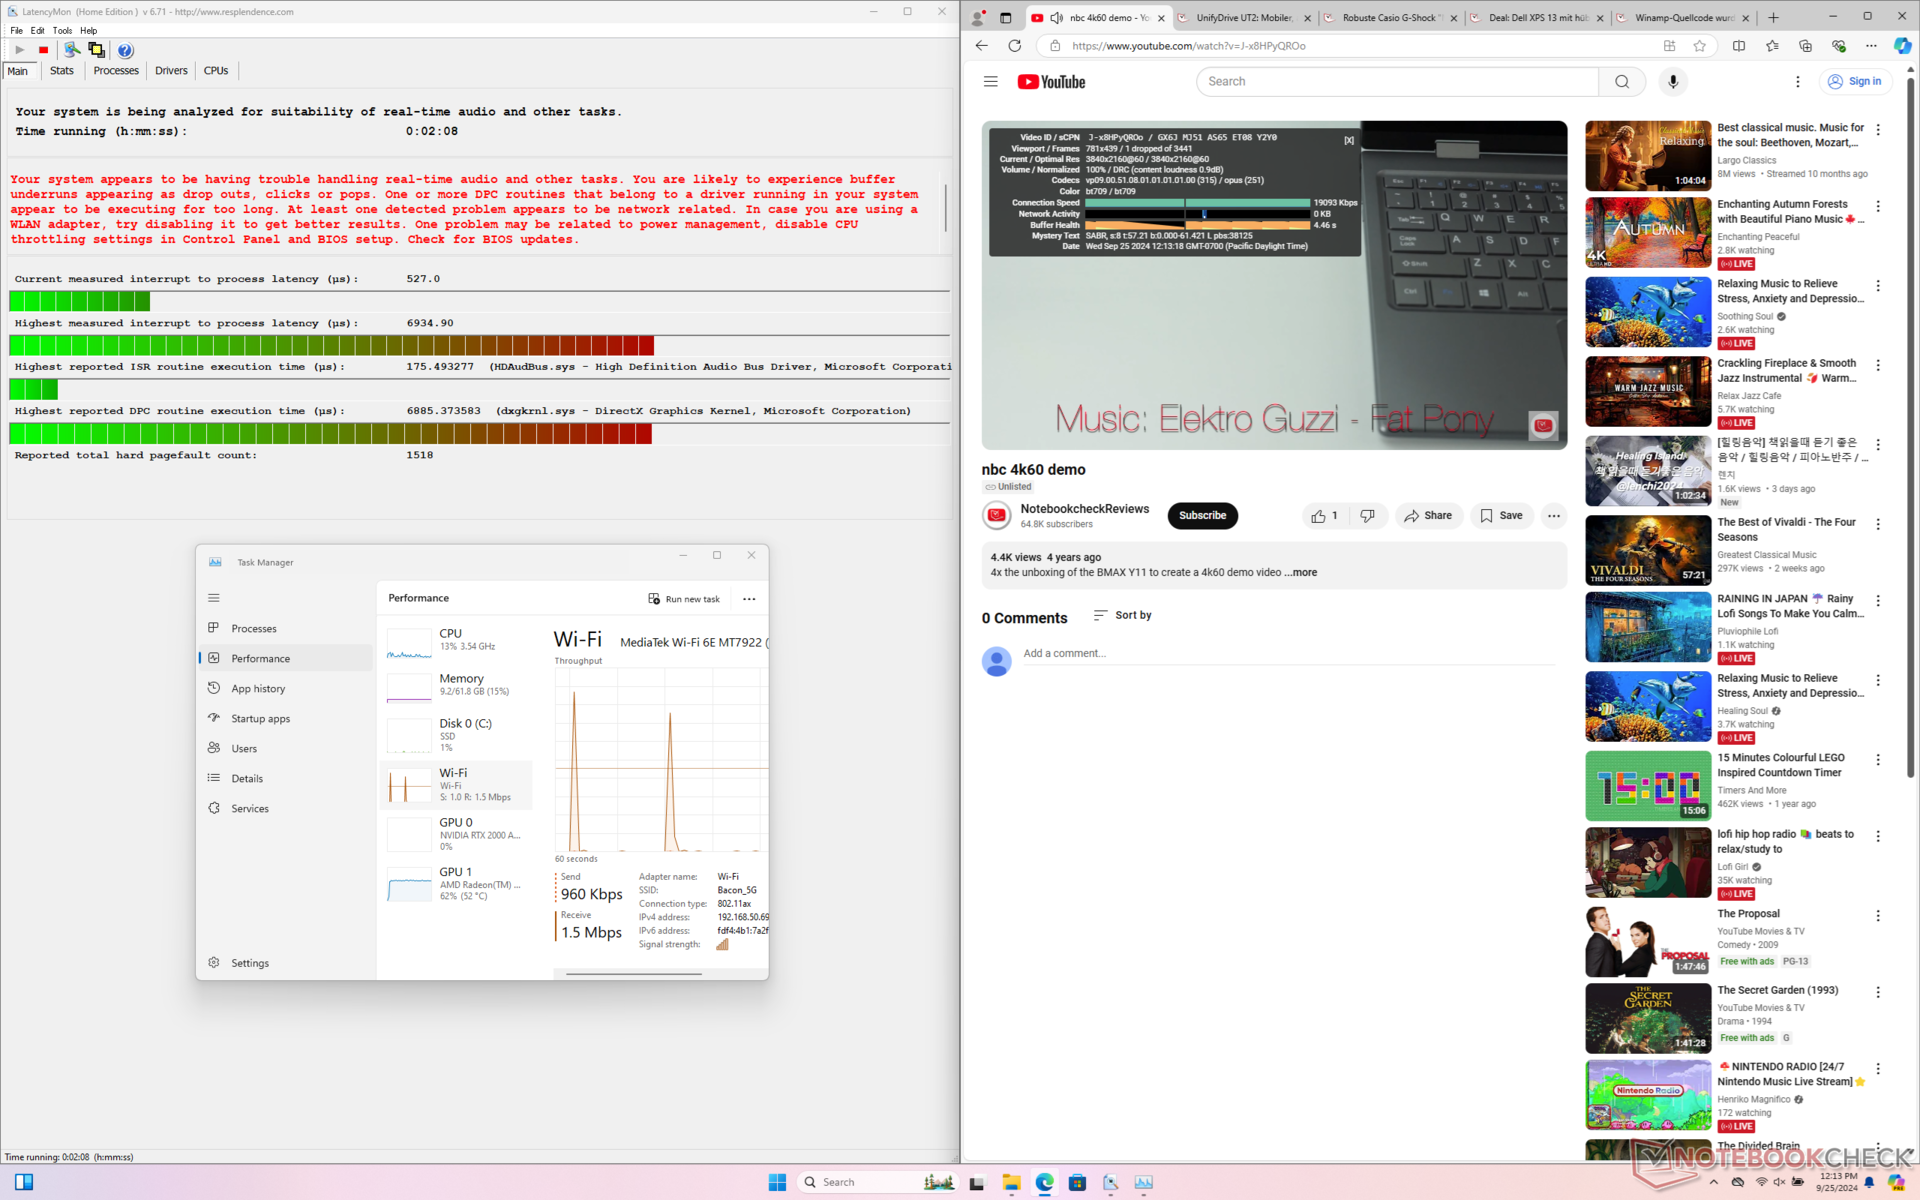
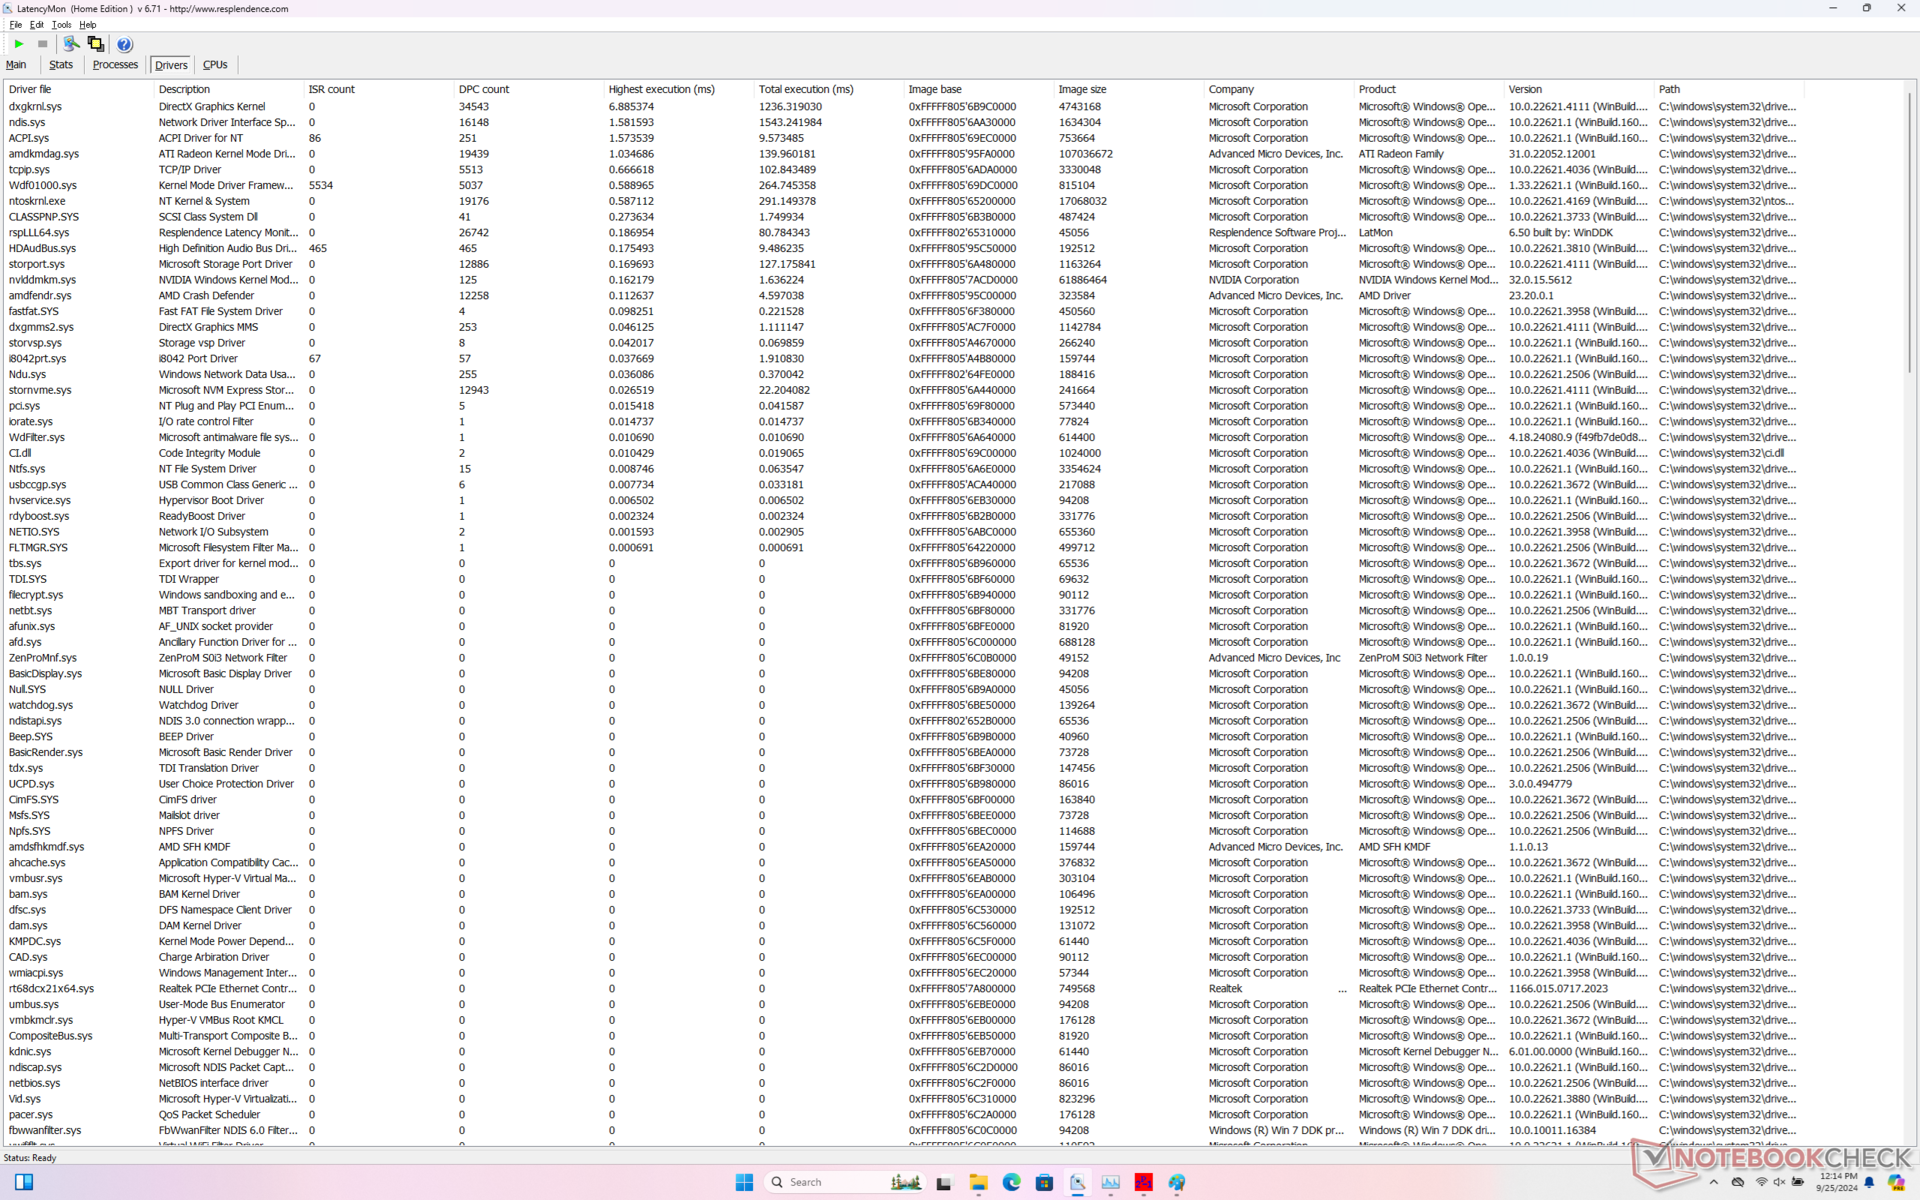
Latenza DPC
LatencyMon rivela problemi di DPC legati a HDAudBus.sys anche dopo diversi test. la riproduzione di video 4K a 60 FPS è invece eccellente, con un solo fotogramma perso registrato durante una finestra di 60 secondi.
| DPC Latencies / LatencyMon - interrupt to process latency (max), Web, Youtube, Prime95 | |
| HP ZBook Fury 16 G11 | |
| HP ZBook Power 16 G11 A | |
| HP ZBook Power 15 G10 | |
| Lenovo ThinkPad P1 Gen 7 21KV001SGE | |
| Lenovo ThinkPad P16s G2 21K9000CGE | |
| Dell Precision 5690 | |
* ... Meglio usare valori piccoli
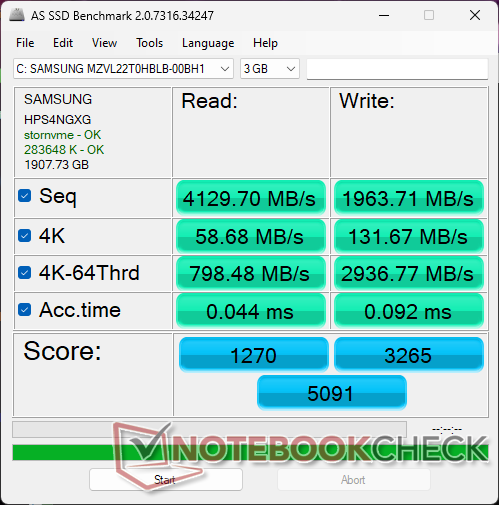
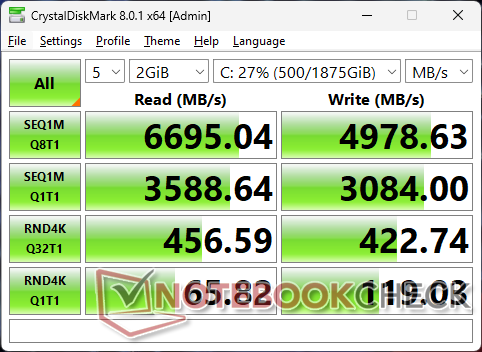
Dispositivi di archiviazione
La nostra unità di prova viene consegnata con un dispositivo da 2 TB Samsung PM9A1 SSD PCIe4 x4 NVMe per velocità di lettura sequenziale fino a 6700 MB/s. Sfortunatamente, l'unità si riduceva rapidamente alla fascia bassa dei 2000 MB/s dopo pochi minuti di stress, come mostrano i risultati del nostro test DiskSpd loop qui sotto. Abbiamo ripetuto il test e i risultati non sono migliorati. Questo è deludente, perché l'unità WD nel vecchio ZBook Power 15 G10 non presentava alcun problema di throttling. Un diffusore di calore avrebbe probabilmente migliorato le prestazioni.

| Drive Performance rating - Percent | |
| HP ZBook Fury 16 G11 | |
| Dell Precision 5690 | |
| Lenovo ThinkPad P16s G2 21K9000CGE | |
| HP ZBook Power 15 G10 | |
| HP ZBook Power 16 G11 A | |
| Lenovo ThinkPad P1 Gen 7 21KV001SGE | |
* ... Meglio usare valori piccoli
Disk Throttling: DiskSpd Read Loop, Queue Depth 8
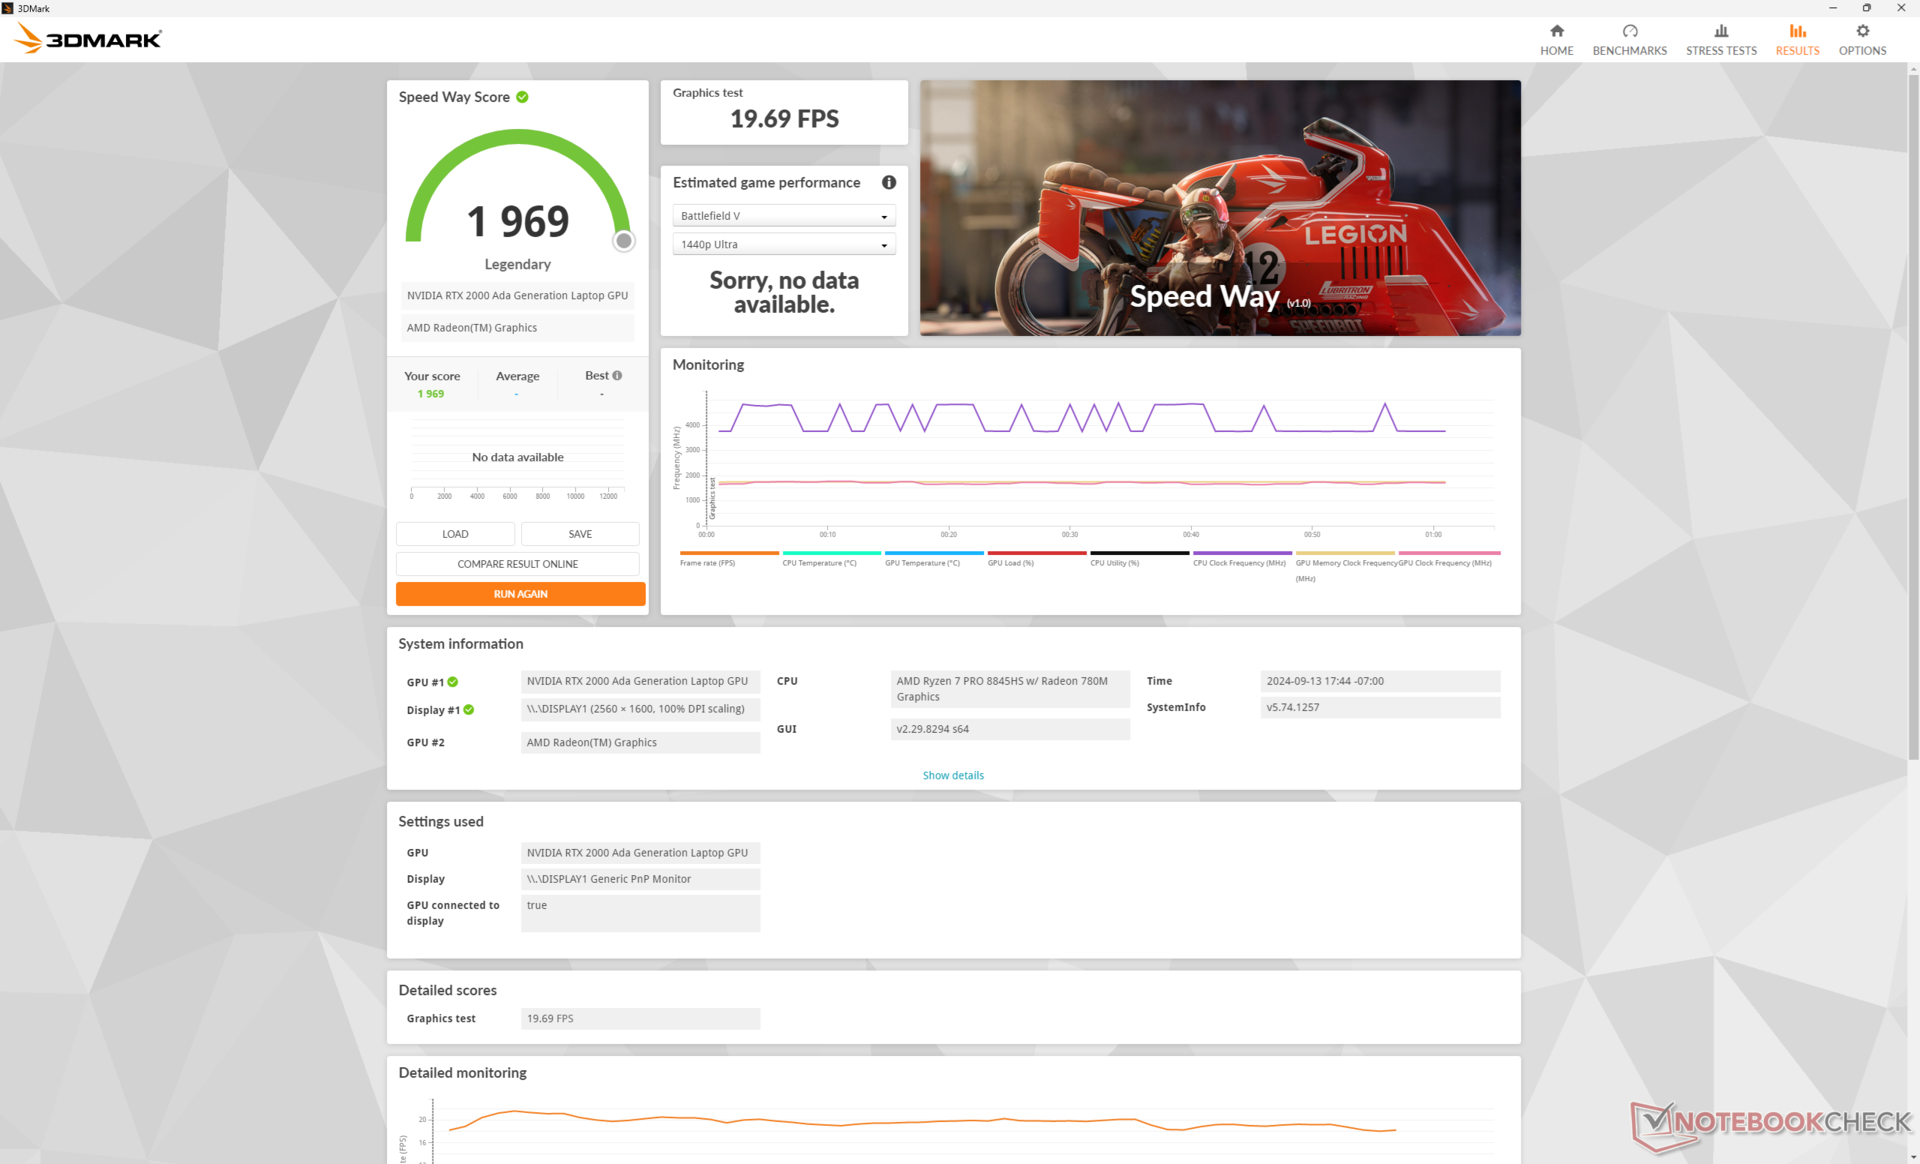
Prestazioni della GPU
Le opzioni di GPU discrete rimangono identiche a quelle dello ZBook Power 15 G10 da 15 pollici, poiché Nvidia non ha ancora lanciato un successore della serie mobile Ada Lovelace. Inoltre, la soluzione di raffreddamento non è migliorata di molto durante il passaggio a un fattore di forma da 16 pollici, il che significa che lo ZBook Power 16 G11 è ancora limitato allo stesso tetto TGP da 50 W e alla GPU RTX 1000 Ada, RTX 2000 Adae RTX 3000 Ada come prima. Gli utenti dovranno prendere in considerazione la serie ZBook Fury 16, più spessa, per le opzioni RTX Ada di fascia alta.
L'aggiornamento alla RTX 3000 Ada comporta al massimo un aumento marginale delle prestazioni, in base alla nostra esperienza con il modello Dell Precision 5490.
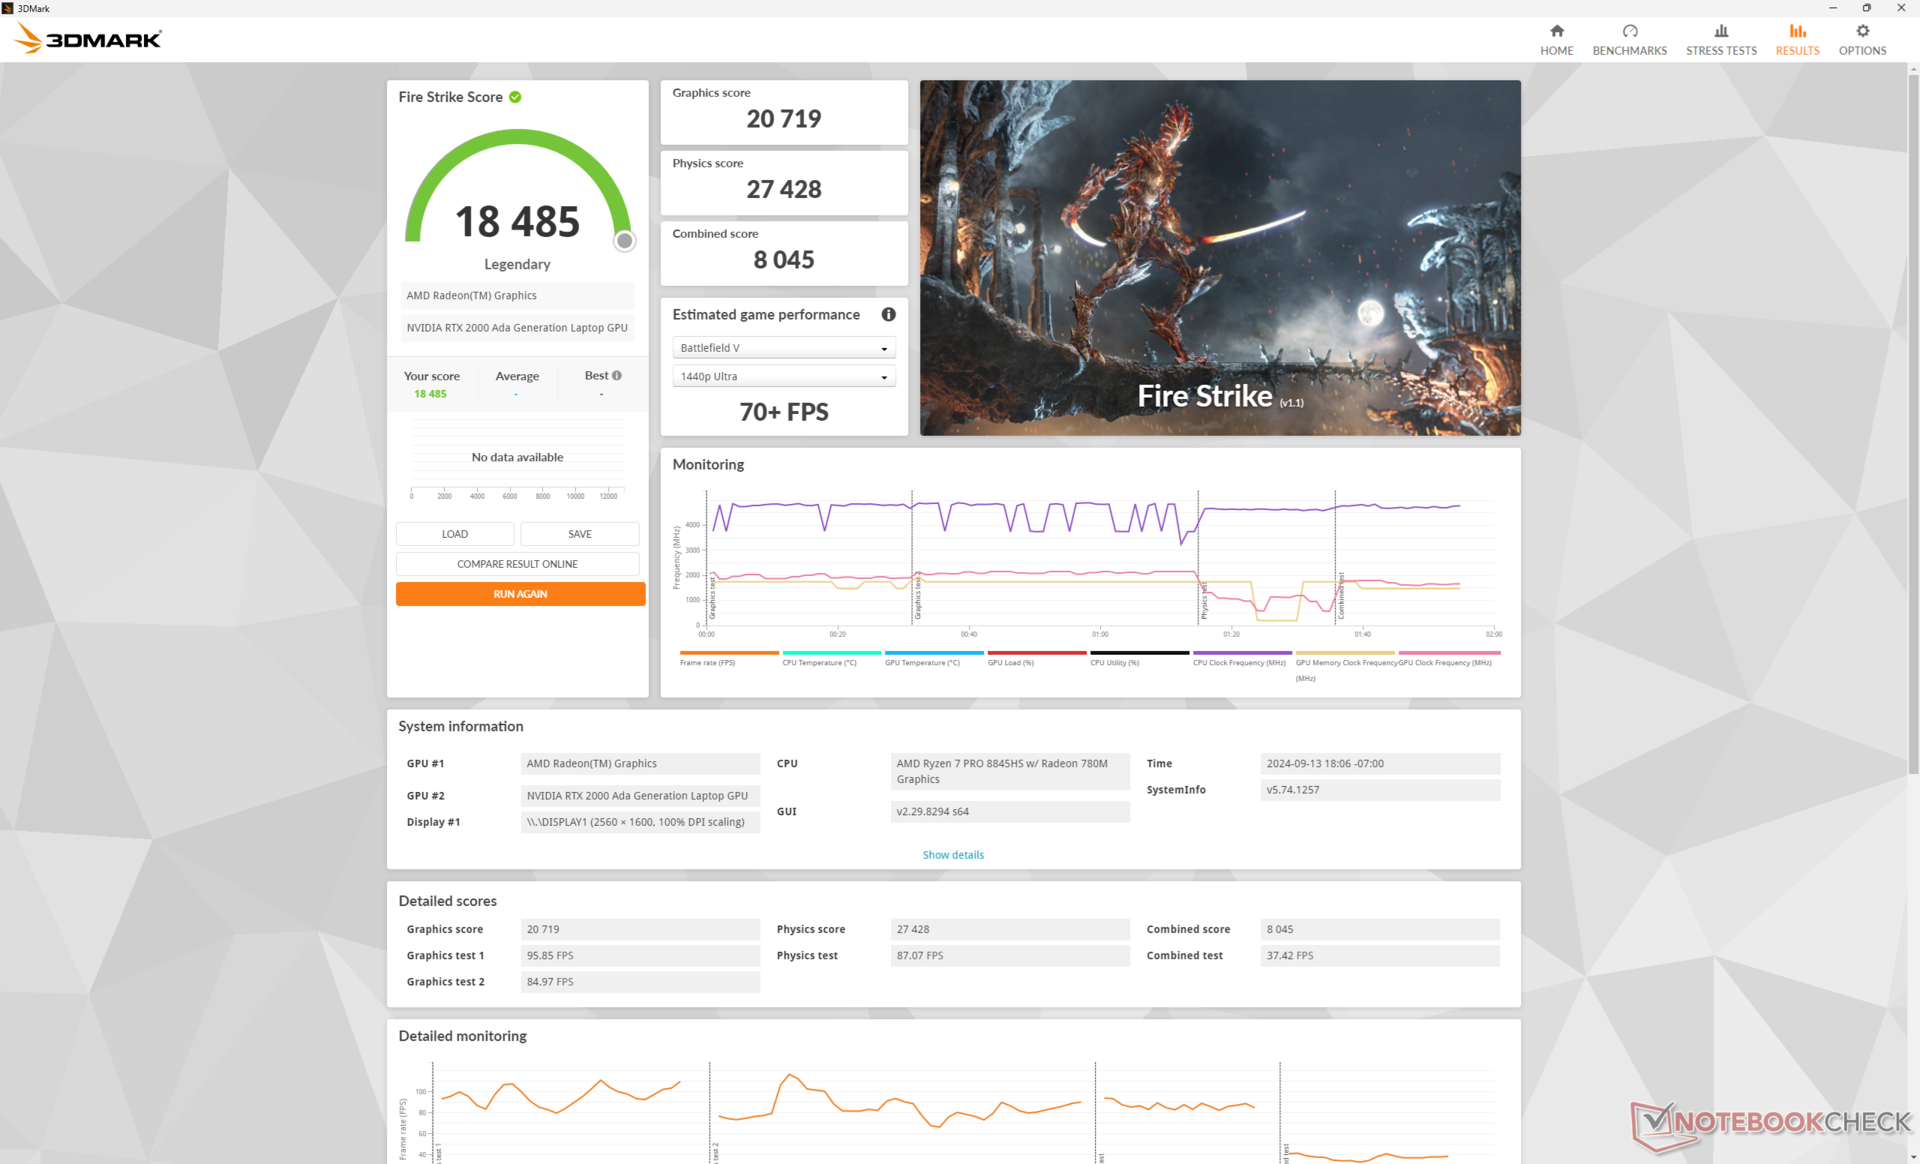
| Profilo di potenza | Punteggio grafico | Punteggio di fisica | Punteggio combinato |
| Modalità prestazioni | 20719 | 27428 | 8045 |
| Modalità equilibrata | 19961 (-4%) | 26363 (-4%) | 7633 (-5%) |
| Potenza della batteria | 8108 (-61%) | 6149 (-78%) | 1727 (-79%) |
L'esecuzione in modalità Bilanciata invece che in modalità Prestazioni ha un impatto leggero sulle prestazioni, come mostra la nostra tabella dei risultati di Fire Strike qui sopra. Tuttavia, le prestazioni sia della CPU che della GPU si riducono in modo significativo se si esegue a batteria.
| 3DMark Performance rating - Percent | |
| Dell Precision 5690 -3! | |
| HP ZBook Fury 16 G11 | |
| HP ZBook Fury 16 G9 -3! | |
| HP ZBook Power 16 G11 A | |
| Media NVIDIA RTX 2000 Ada Generation Laptop | |
| Dell Precision 5000 5490 -3! | |
| MSI CreatorPro Z16P B12UKST -19! | |
| HP ZBook Power 15 G10 -11! | |
| Asus ExpertBook B6 Flip B6602FC2 -19! | |
| Lenovo ThinkPad P16v G1 AMD -18! | |
| Lenovo ThinkPad P1 G4-20Y4Z9DVUS -19! | |
| Lenovo ThinkPad P16s G2 21K9000CGE -19! | |
| HP ZBook Firefly 16 G9-6B897EA -19! | |
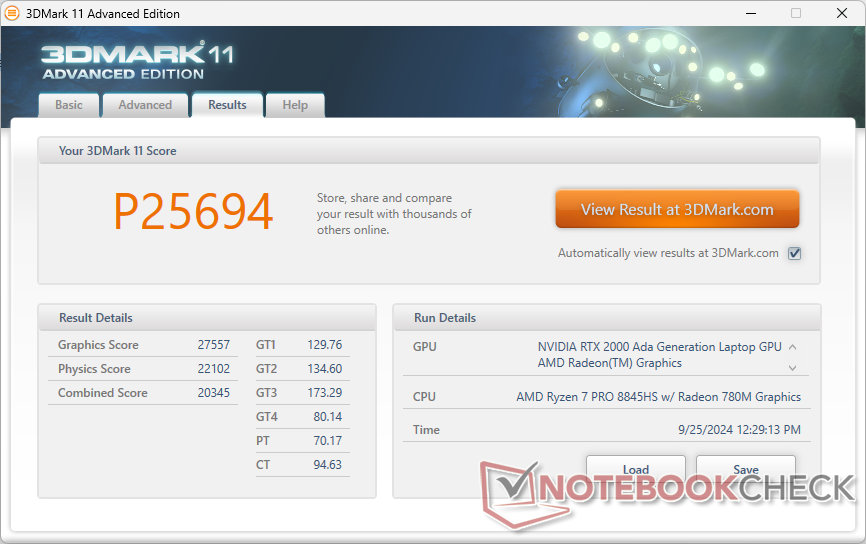
| 3DMark 11 Performance | 25694 punti | |
| 3DMark Cloud Gate Standard Score | 51846 punti | |
| 3DMark Fire Strike Score | 18485 punti | |
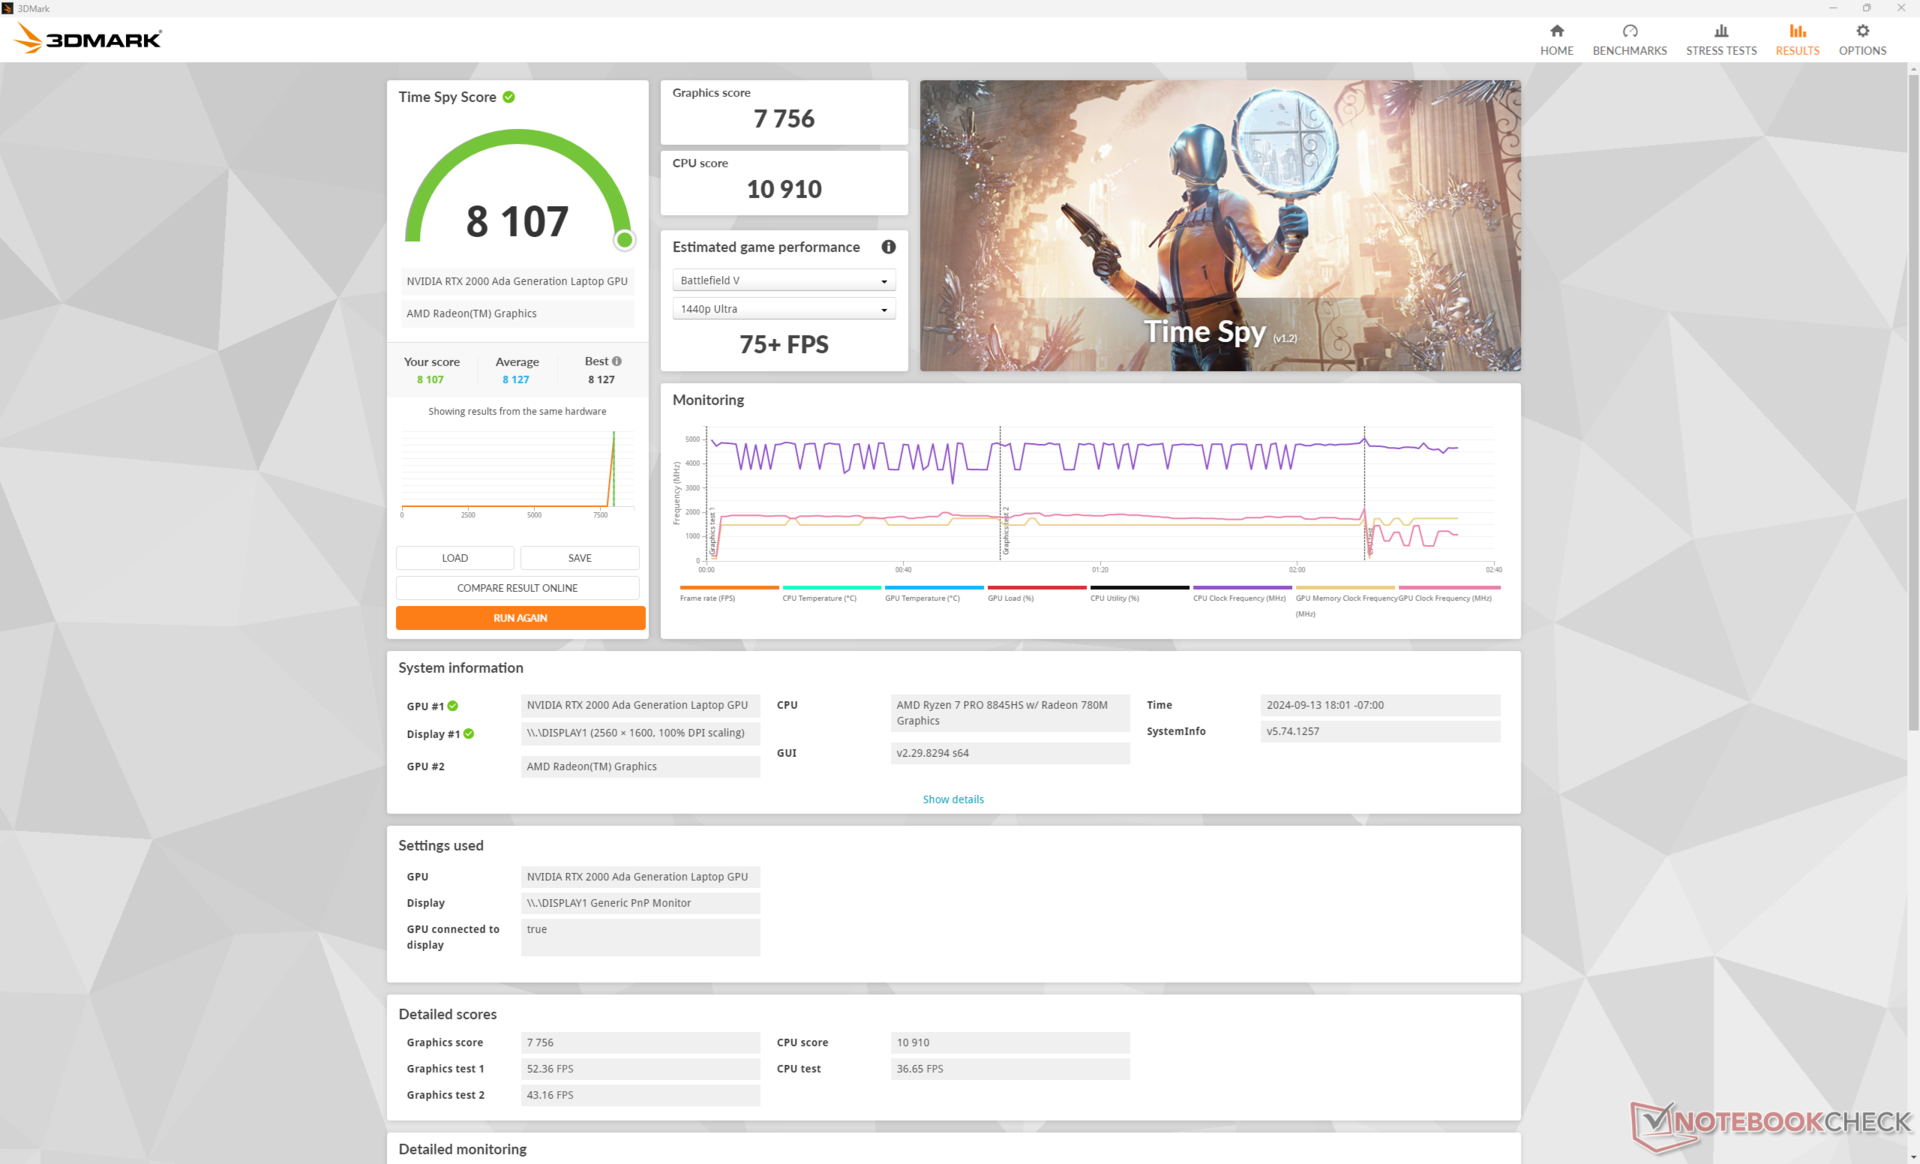
| 3DMark Time Spy Score | 8107 punti | |
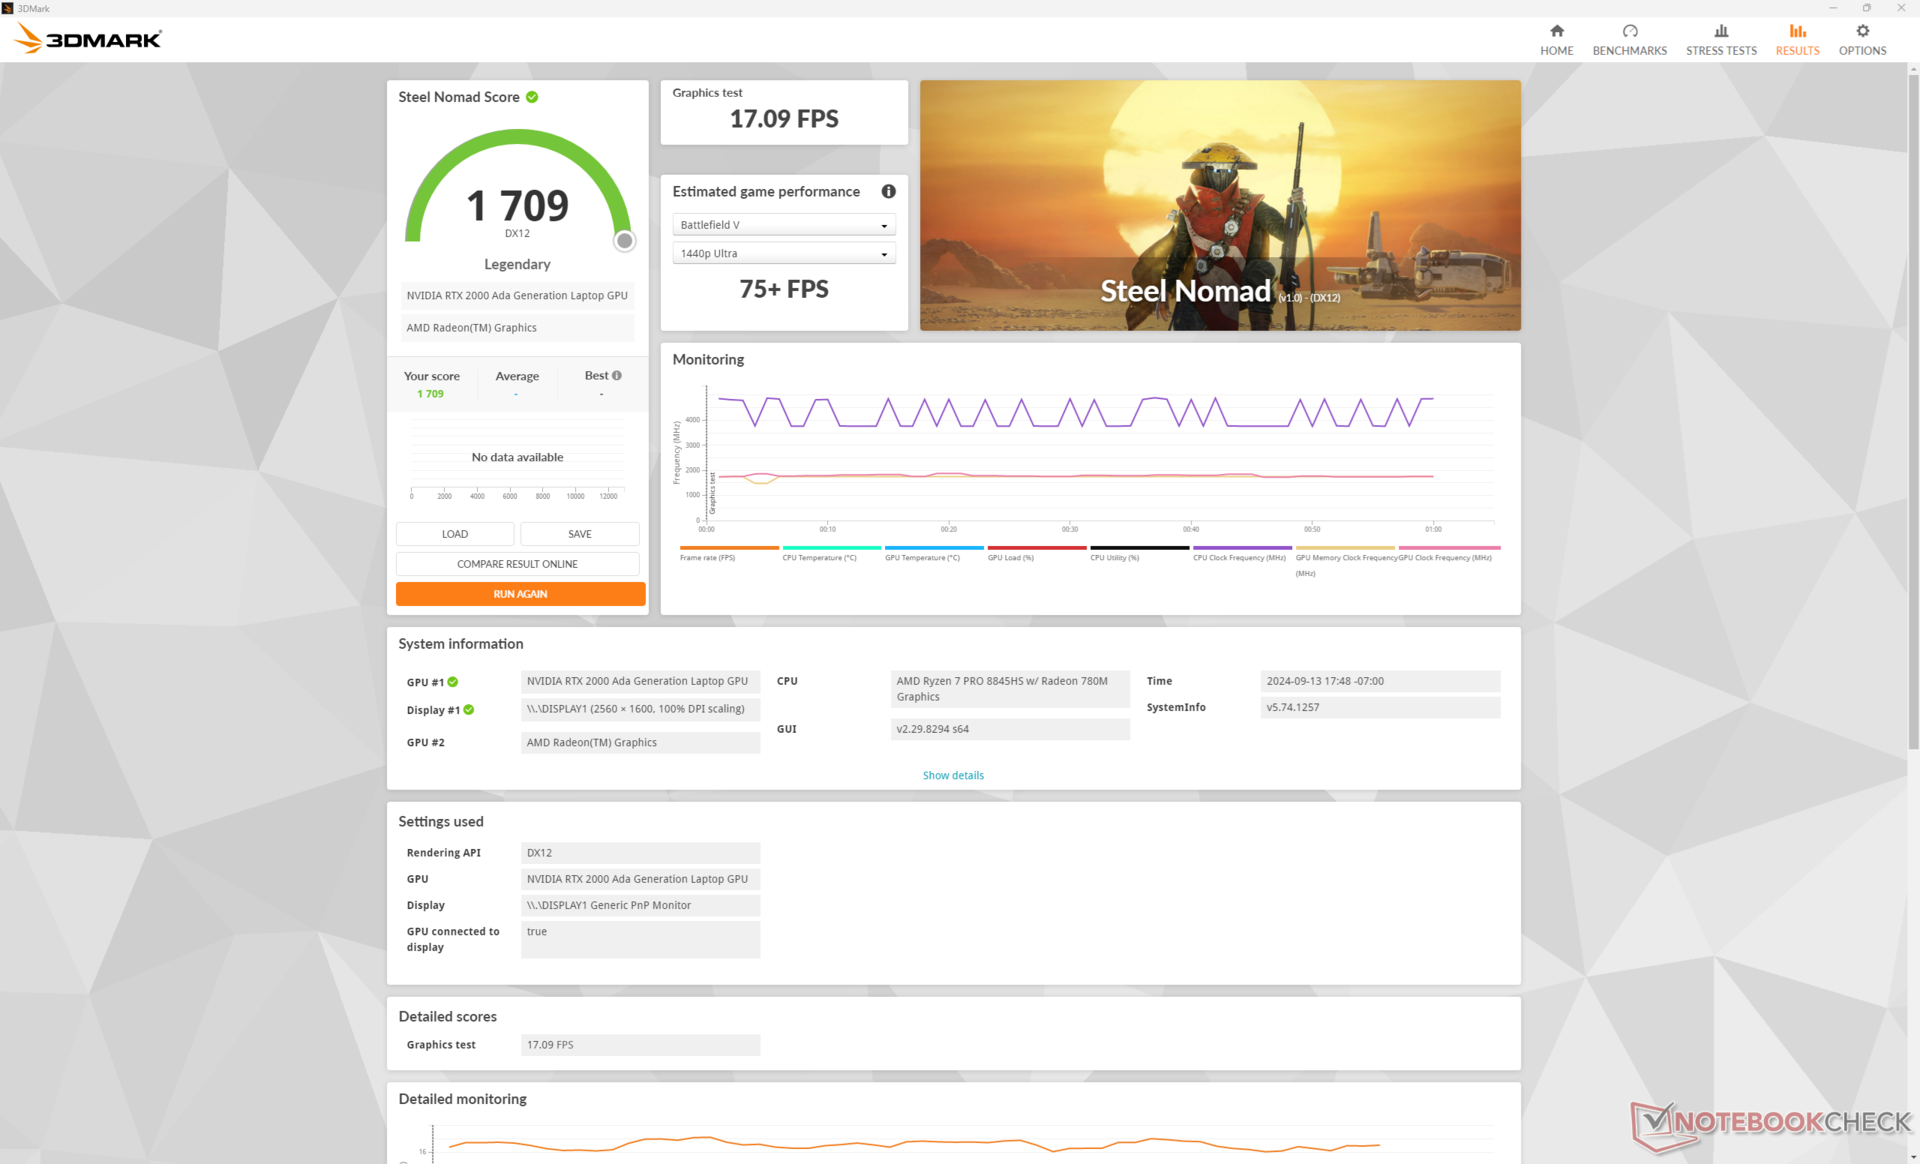
| 3DMark Steel Nomad Score | 1709 punti | |
Aiuto | ||
* ... Meglio usare valori piccoli
Prestazioni di gioco
Sebbene non sia ottimizzata per i giochi, la RTX 2000 Ada è più simile ai computer portatili che girano con la GeForce RTX 3060 o RTX 4060.
| Performance rating - Percent | |
| HP ZBook Fury 16 G11 | |
| Dell Precision 5690 -1! | |
| HP ZBook Fury 16 G9 -1! | |
| MSI CreatorPro Z16P B12UKST | |
| Asus ExpertBook B6 Flip B6602FC2 | |
| Dell Precision 5000 5490 -1! | |
| HP ZBook Power 16 G11 A | |
| HP ZBook Power 15 G10 | |
| Lenovo ThinkPad P1 G4-20Y4Z9DVUS -3! | |
| Lenovo ThinkPad P16v G1 AMD | |
| HP ZBook Firefly 16 G9-6B897EA | |
| Lenovo ThinkPad P16s G2 21K9000CGE | |
| Final Fantasy XV Benchmark - 1920x1080 High Quality | |
| Dell Precision 5690 | |
| HP ZBook Fury 16 G11 | |
| HP ZBook Fury 16 G9 | |
| Dell Precision 5000 5490 | |
| HP ZBook Power 15 G10 | |
| HP ZBook Power 16 G11 A | |
| MSI CreatorPro Z16P B12UKST | |
| Asus ExpertBook B6 Flip B6602FC2 | |
| Lenovo ThinkPad P16v G1 AMD | |
| Lenovo ThinkPad P1 G4-20Y4Z9DVUS | |
| Lenovo ThinkPad P16s G2 21K9000CGE | |
| HP ZBook Firefly 16 G9-6B897EA | |
| Dota 2 Reborn - 1920x1080 ultra (3/3) best looking | |
| HP ZBook Fury 16 G11 | |
| HP ZBook Fury 16 G9 | |
| MSI CreatorPro Z16P B12UKST | |
| Asus ExpertBook B6 Flip B6602FC2 | |
| Dell Precision 5690 | |
| HP ZBook Power 15 G10 | |
| Dell Precision 5000 5490 | |
| HP ZBook Power 16 G11 A | |
| Lenovo ThinkPad P16v G1 AMD | |
| Lenovo ThinkPad P1 G4-20Y4Z9DVUS | |
| HP ZBook Firefly 16 G9-6B897EA | |
| Lenovo ThinkPad P16s G2 21K9000CGE | |
| Baldur's Gate 3 | |
| 1920x1080 High Preset AA:T | |
| Dell Precision 5690 | |
| HP ZBook Fury 16 G11 | |
| Dell Precision 5000 5490 | |
| HP ZBook Power 16 G11 A | |
| Media NVIDIA RTX 2000 Ada Generation Laptop (n=1) | |
| 1920x1080 Ultra Preset AA:T | |
| Dell Precision 5690 | |
| HP ZBook Fury 16 G11 | |
| Dell Precision 5000 5490 | |
| HP ZBook Power 16 G11 A | |
| Media NVIDIA RTX 2000 Ada Generation Laptop (n=1) | |
| 2560x1440 Ultra Preset AA:T | |
| Dell Precision 5690 | |
| HP ZBook Fury 16 G11 | |
| HP ZBook Power 16 G11 A | |
| Media NVIDIA RTX 2000 Ada Generation Laptop (n=1) | |
Cyberpunk 2077 ultra FPS Chart
| basso | medio | alto | ultra | QHD | |
|---|---|---|---|---|---|
| GTA V (2015) | 180.6 | 162.7 | 90.3 | 63.4 | |
| Dota 2 Reborn (2015) | 145.2 | 142 | 126.1 | 119.9 | |
| Final Fantasy XV Benchmark (2018) | 166.1 | 89.3 | 66.3 | 49.4 | |
| X-Plane 11.11 (2018) | 83.2 | 72.1 | 60.6 | ||
| Far Cry 5 (2018) | 138 | 111 | 104 | 98 | 67 |
| Strange Brigade (2018) | 329 | 187.8 | 158.1 | 138.5 | 99.5 |
| Tiny Tina's Wonderlands (2022) | 139.1 | 115.1 | 80 | 64.4 | 46.3 |
| F1 22 (2022) | 186.6 | 171.1 | 129.1 | 46.2 | 29.8 |
| Baldur's Gate 3 (2023) | 87.1 | 75.7 | 67.6 | 66.1 | 45.6 |
| Cyberpunk 2077 (2023) | 81.1 | 61.4 | 51.7 | 44.8 | 29.7 |
Emissioni
Rumore del sistema
I livelli di rumore e il comportamento della ventola sono simili a quelli osservati sul modello dello scorso anno. Il sistema rimane silenzioso con appena 25,4 dB(A) anche dopo aver eseguito la prima scena di benchmark di 3DMark 06, che è molto più silenziosa rispetto a modelli concorrenti come il ThinkPad P16s G2 o Precision 5690 in condizioni simili.
Tenga presente che il rumore della ventola è notevolmente più silenzioso in modalità Bilanciata; l'esecuzione di Cyberpunk 2077 in modalità Prestazioni può raggiungere i 43 dB(A), rispetto ai soli 37,5 dB(A) della modalità Bilanciata.
Rumorosità
| Idle |
| 23.8 / 24.2 / 24.2 dB(A) |
| Sotto carico |
| 25.4 / 45 dB(A) |
 | ||
30 dB silenzioso 40 dB(A) udibile 50 dB(A) rumoroso |
||
min: | ||
| HP ZBook Power 16 G11 A RTX 2000 Ada Generation Laptop, R7 8845HS, Samsung PM9A1 MZVL22T0HBLB | HP ZBook Power 15 G10 RTX 2000 Ada Generation Laptop, R7 PRO 7840HS, WDC PC SN810 2TB | HP ZBook Fury 16 G11 RTX 3500 Ada Generation Laptop, i9-14900HX, SK hynix PC801 HFS001TEJ9X101N | Lenovo ThinkPad P1 Gen 7 21KV001SGE GeForce RTX 4060 Laptop GPU, Ultra 7 155H, Kioxia XG8 KXG8AZNV1T02 | Lenovo ThinkPad P16s G2 21K9000CGE Radeon 780M, R7 PRO 7840U, SK hynix PC801 HFS001TEJ9X162N | Dell Precision 5690 RTX 5000 Ada Generation Laptop, Ultra 9 185H, 2x Samsung PM9A1 1TB (RAID 0) | |
|---|---|---|---|---|---|---|
| Noise | -3% | -15% | -18% | -3% | -17% | |
| off /ambiente * (dB) | 23.5 | 24.2 -3% | 23.2 1% | 24.7 -5% | 22.6 4% | 23.4 -0% |
| Idle Minimum * (dB) | 23.8 | 24.4 -3% | 23.2 3% | 24.7 -4% | 22.6 5% | 23.6 1% |
| Idle Average * (dB) | 24.2 | 24.4 -1% | 23.2 4% | 24.7 -2% | 22.6 7% | 24.9 -3% |
| Idle Maximum * (dB) | 24.2 | 24.4 -1% | 29.5 -22% | 24.7 -2% | 22.6 7% | 30.9 -28% |
| Load Average * (dB) | 25.4 | 27.4 -8% | 43 -69% | 43.7 -72% | 37.8 -49% | 40.4 -59% |
| Cyberpunk 2077 ultra * (dB) | 43 | 48.2 -12% | 53.2 -24% | |||
| Load Maximum * (dB) | 45 | 46.8 -4% | 48.2 -7% | 53.3 -18% | 40.5 10% | 51.9 -15% |
| Witcher 3 ultra * (dB) | 43.3 | 40.3 | 48.3 |
* ... Meglio usare valori piccoli
Temperatura
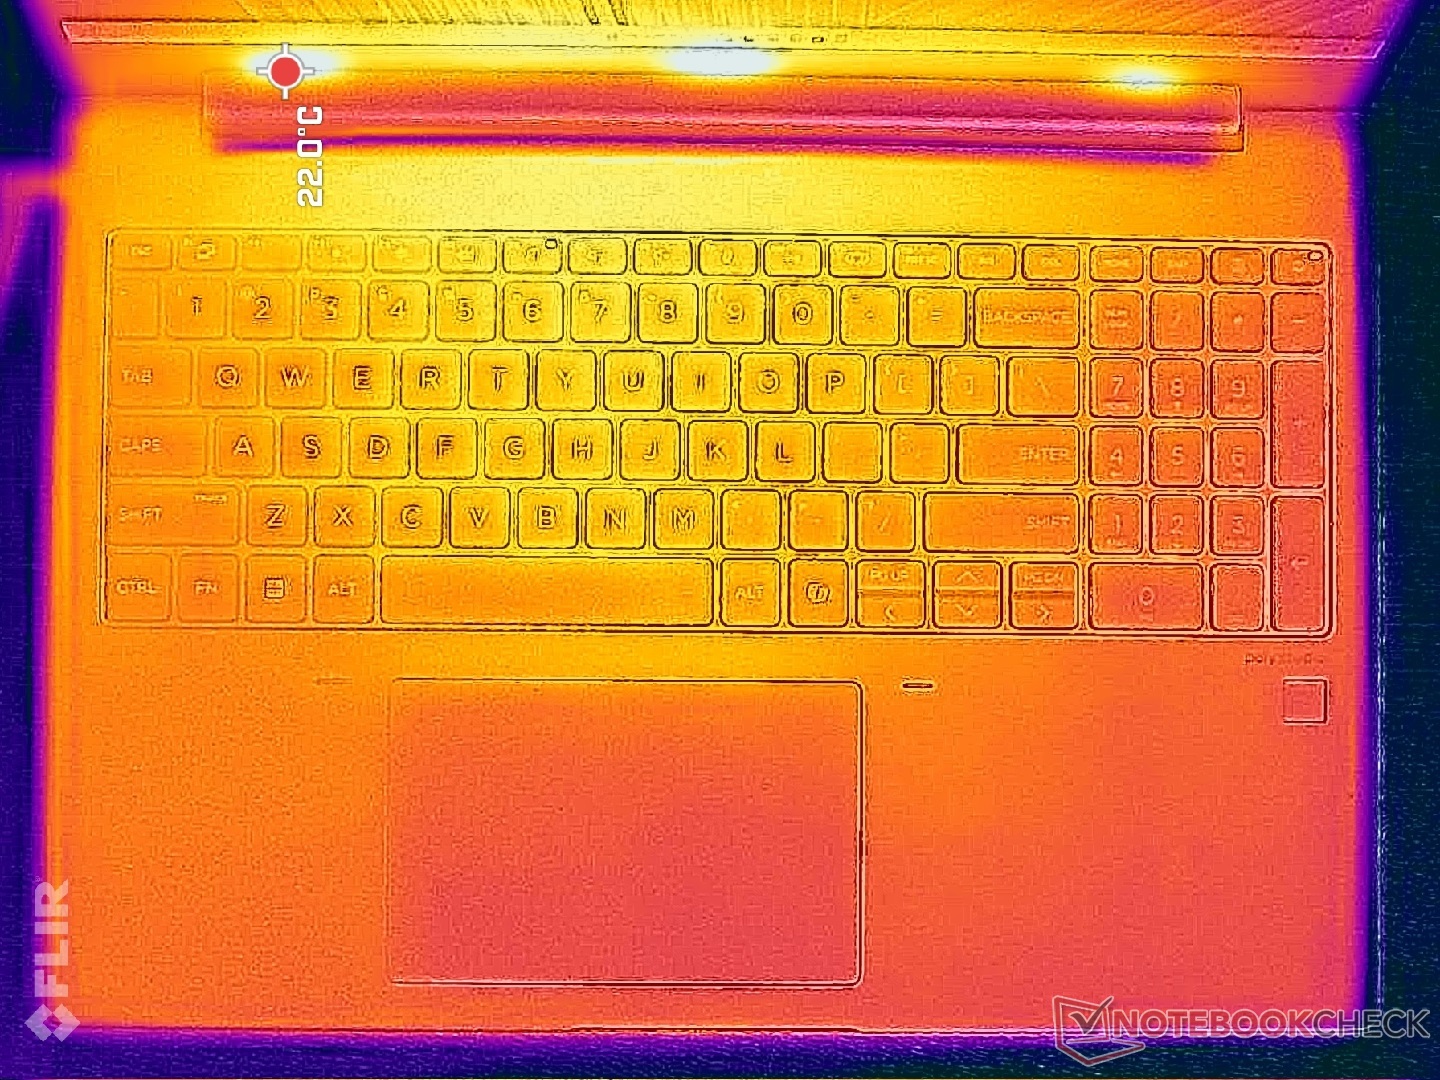
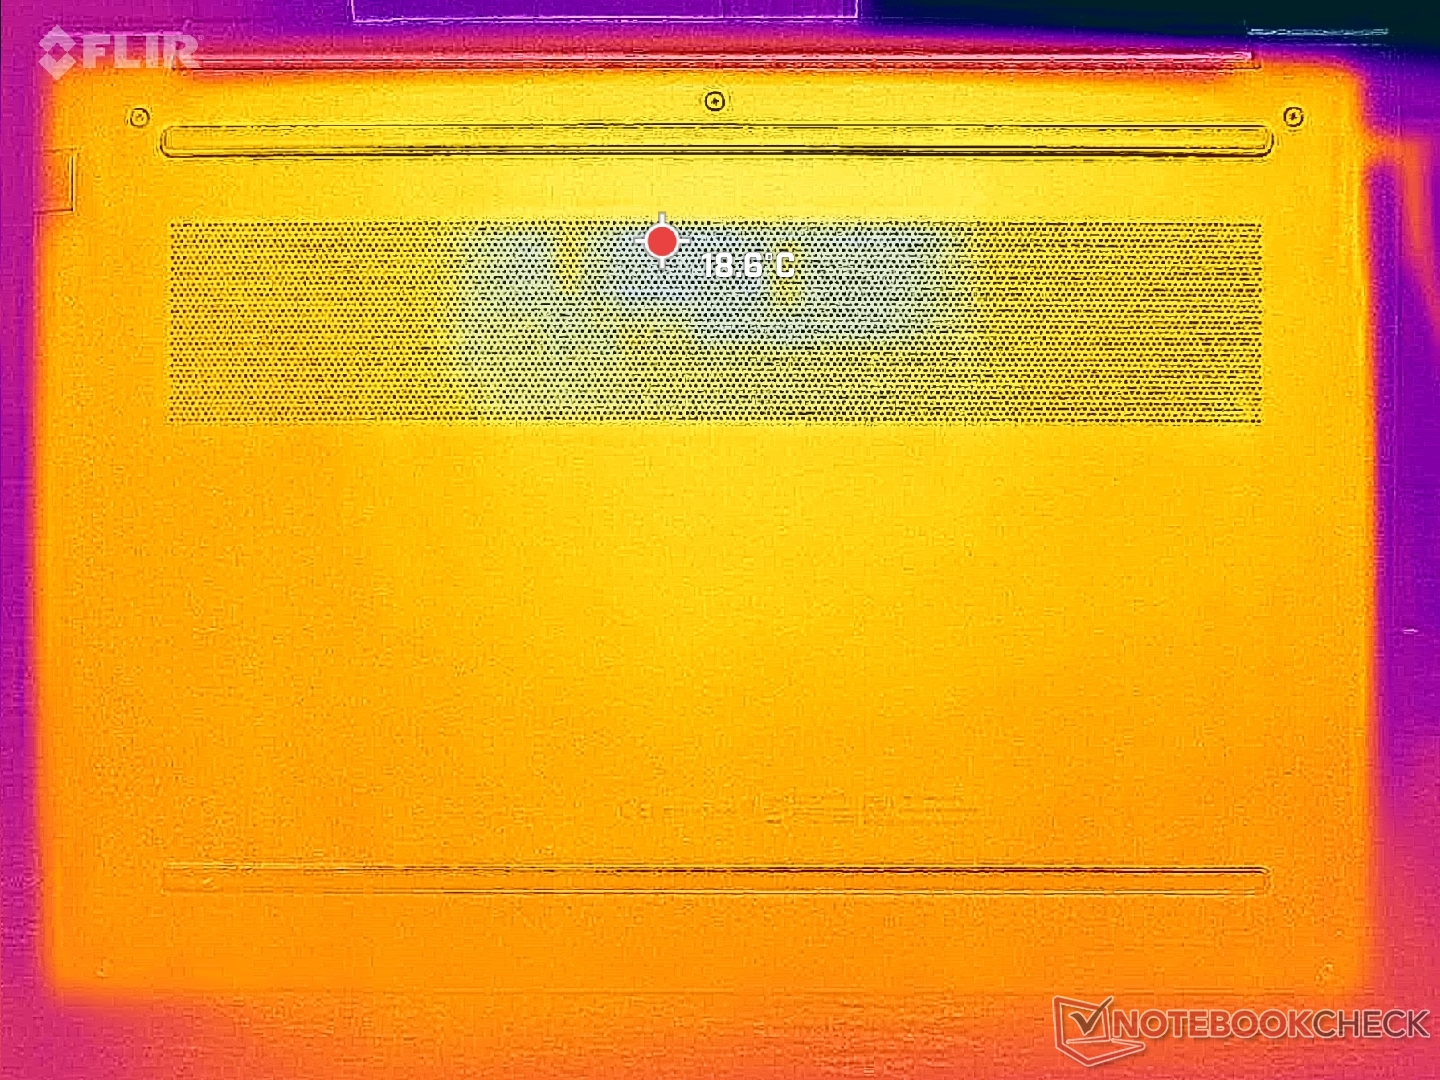
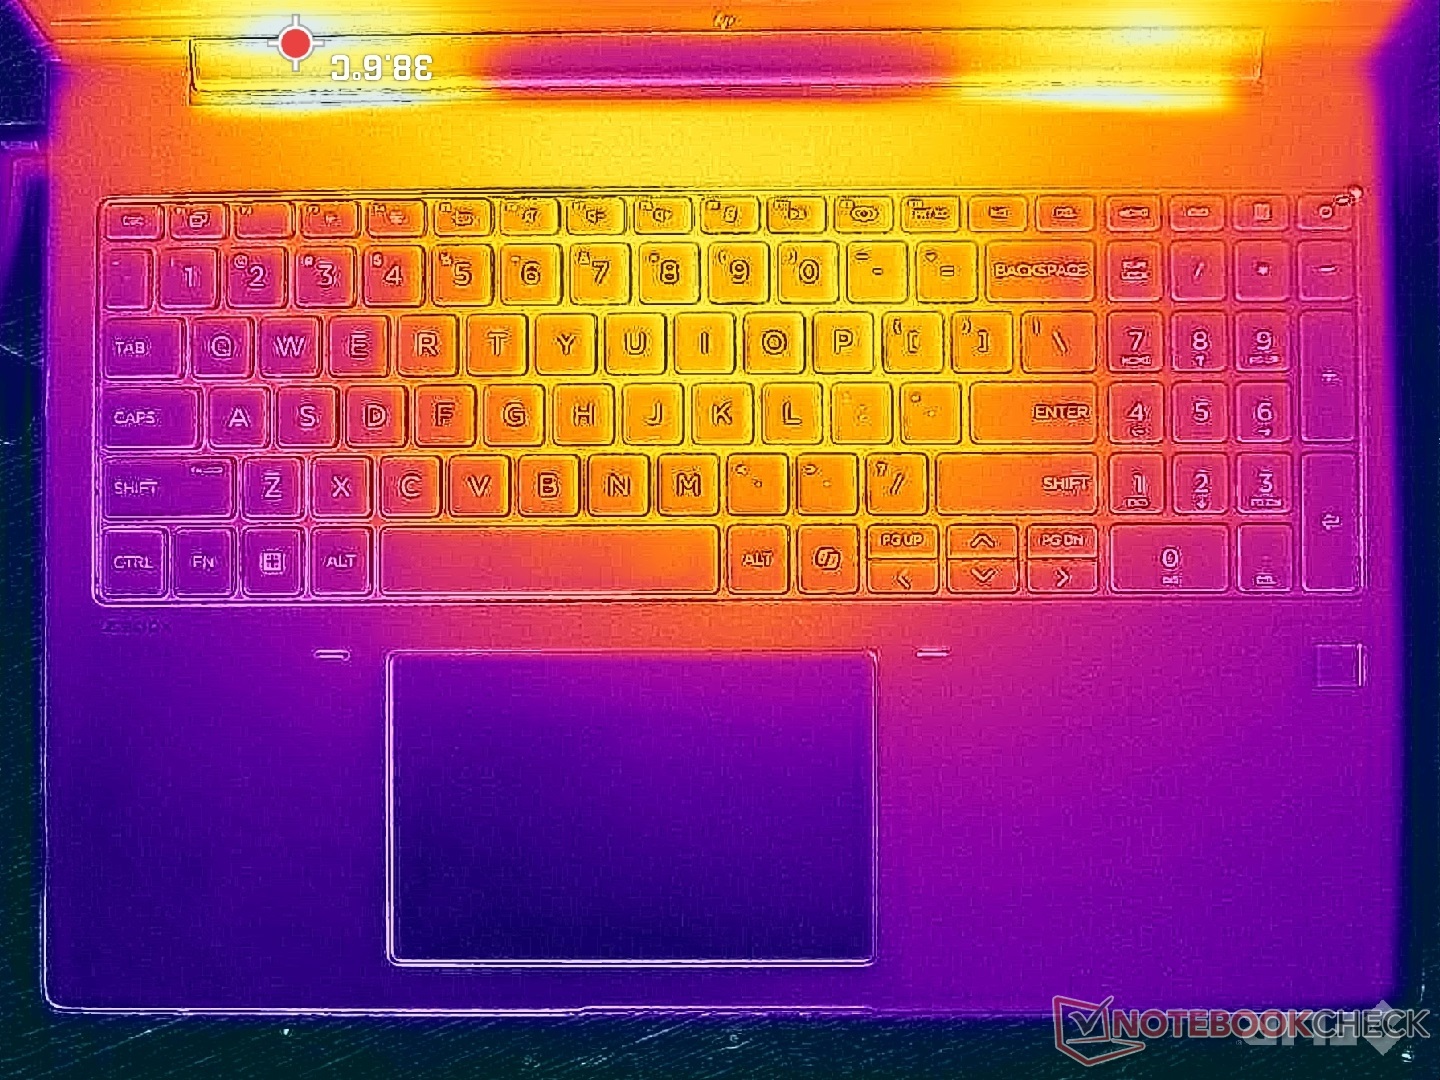
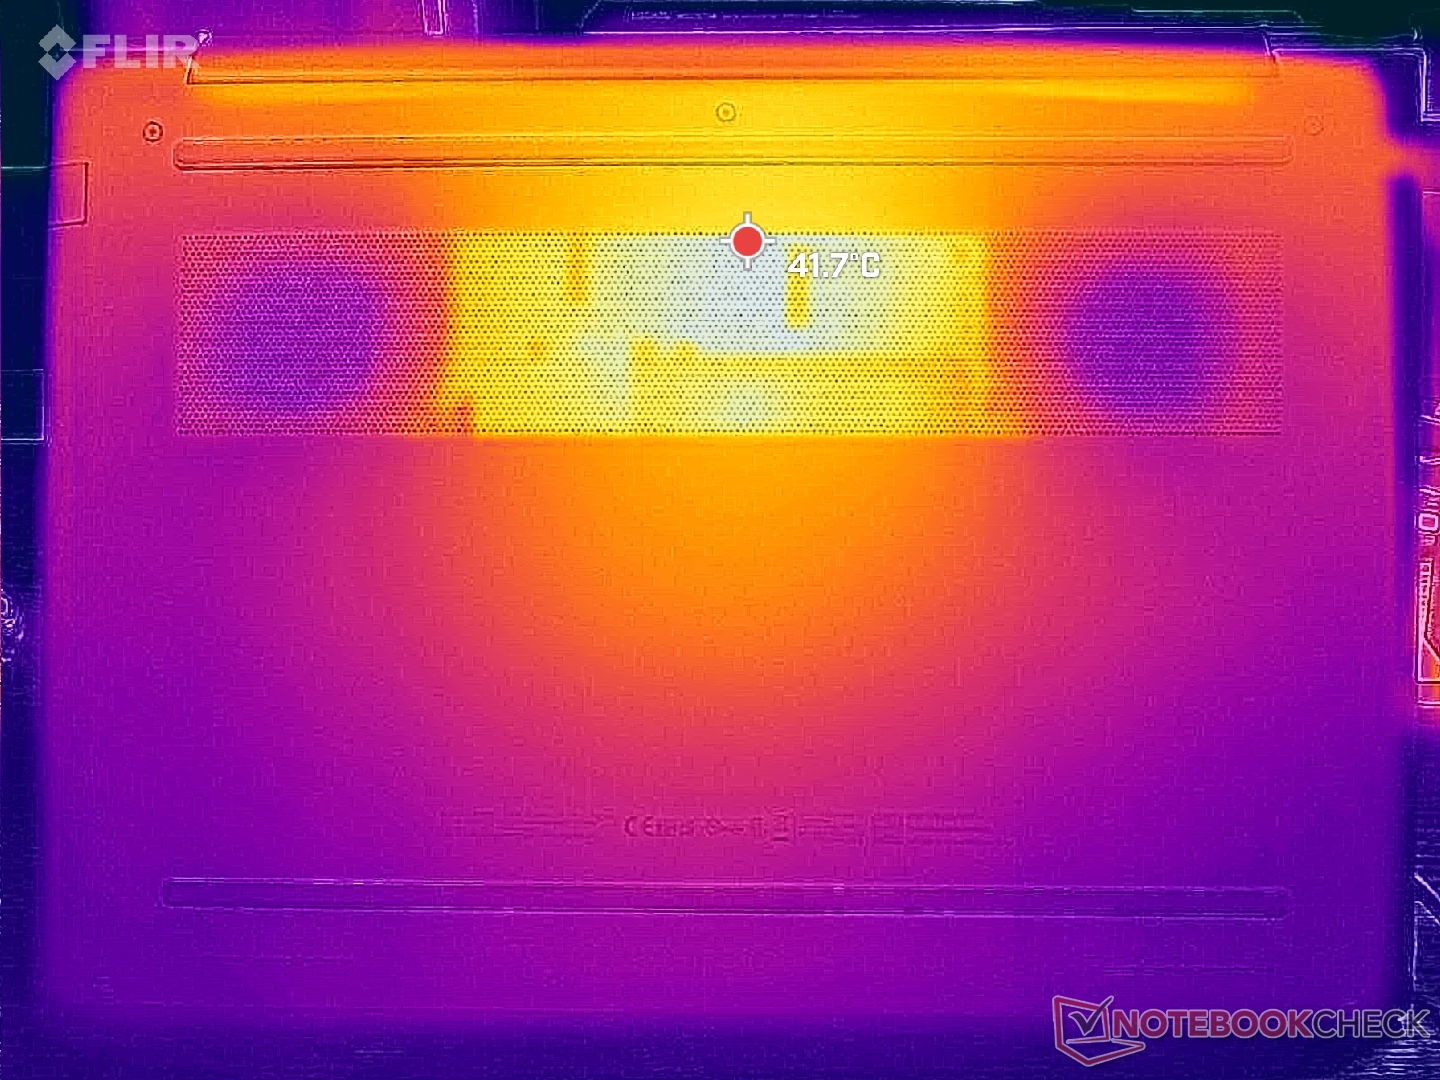
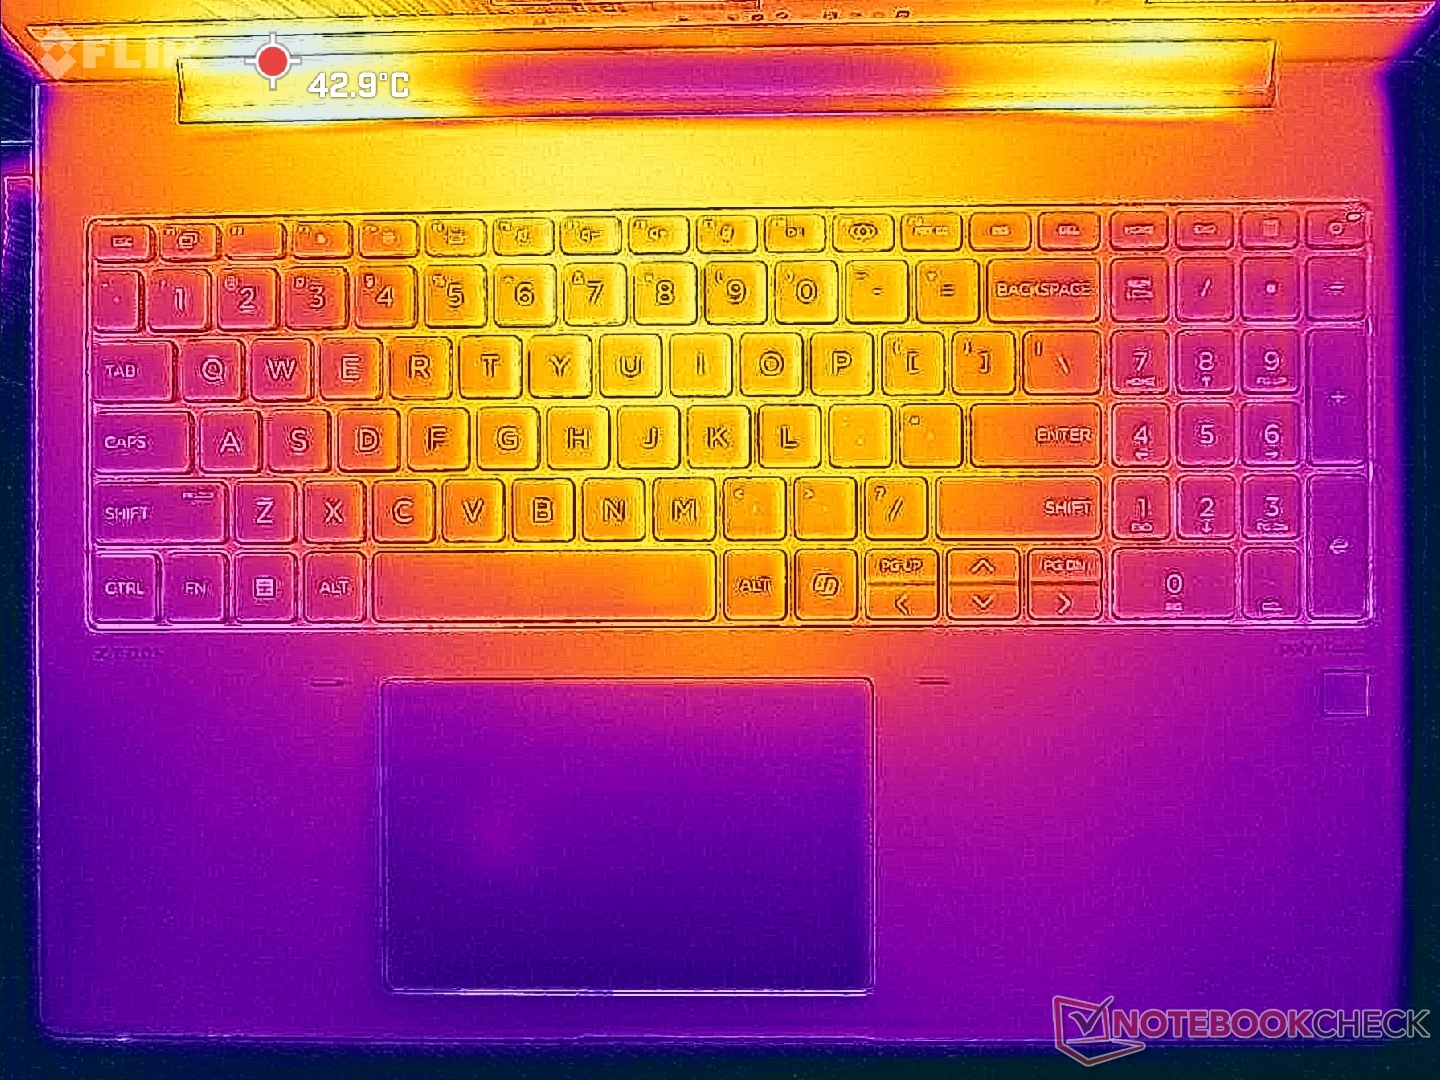
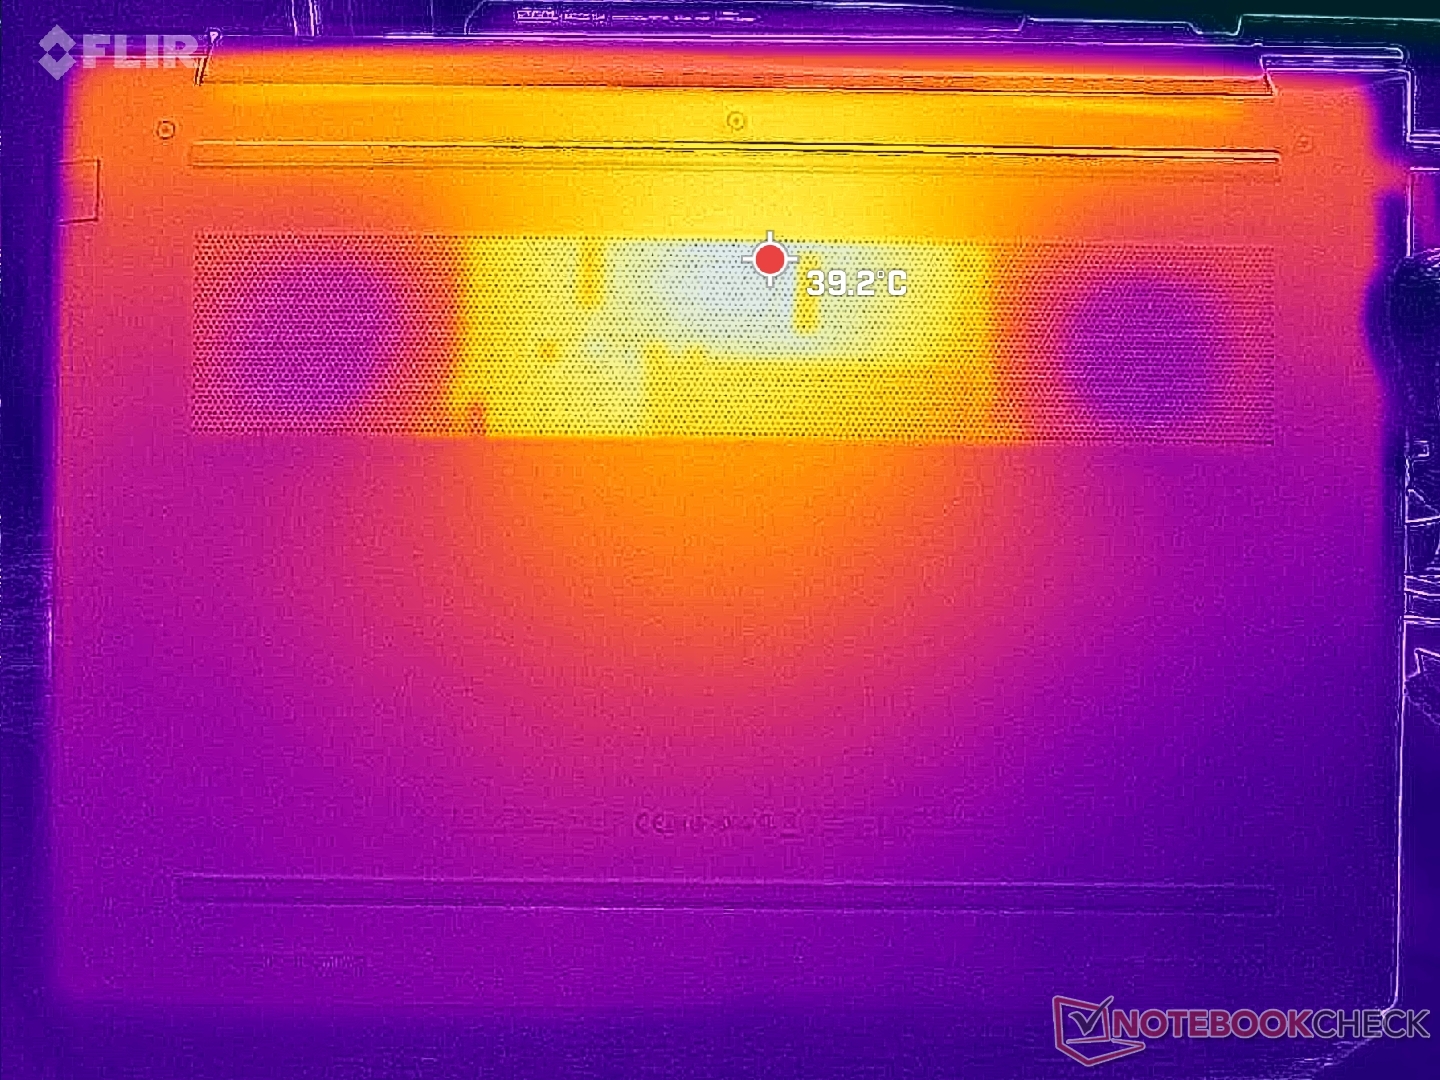
Le temperature di superficie sono generalmente più basse sul nostro nuovo fattore di forma da 16 pollici, soprattutto per quanto riguarda il coperchio inferiore. I punti caldi sul fondo raggiungono appena 41 C quando si eseguono carichi impegnativi, rispetto ai 48 C del vecchio ZBook Power 15 G10. Anche il punto caldo al centro della tastiera raggiunge i 41 C, mentre i poggiapolsi e i lati rimangono più freschi e confortevoli per i palmi e le dita.
Rispetto al più potente Precision 5690l'unità Dell è ancora più calda sulla tastiera, mentre è più fresca sulla superficie inferiore.
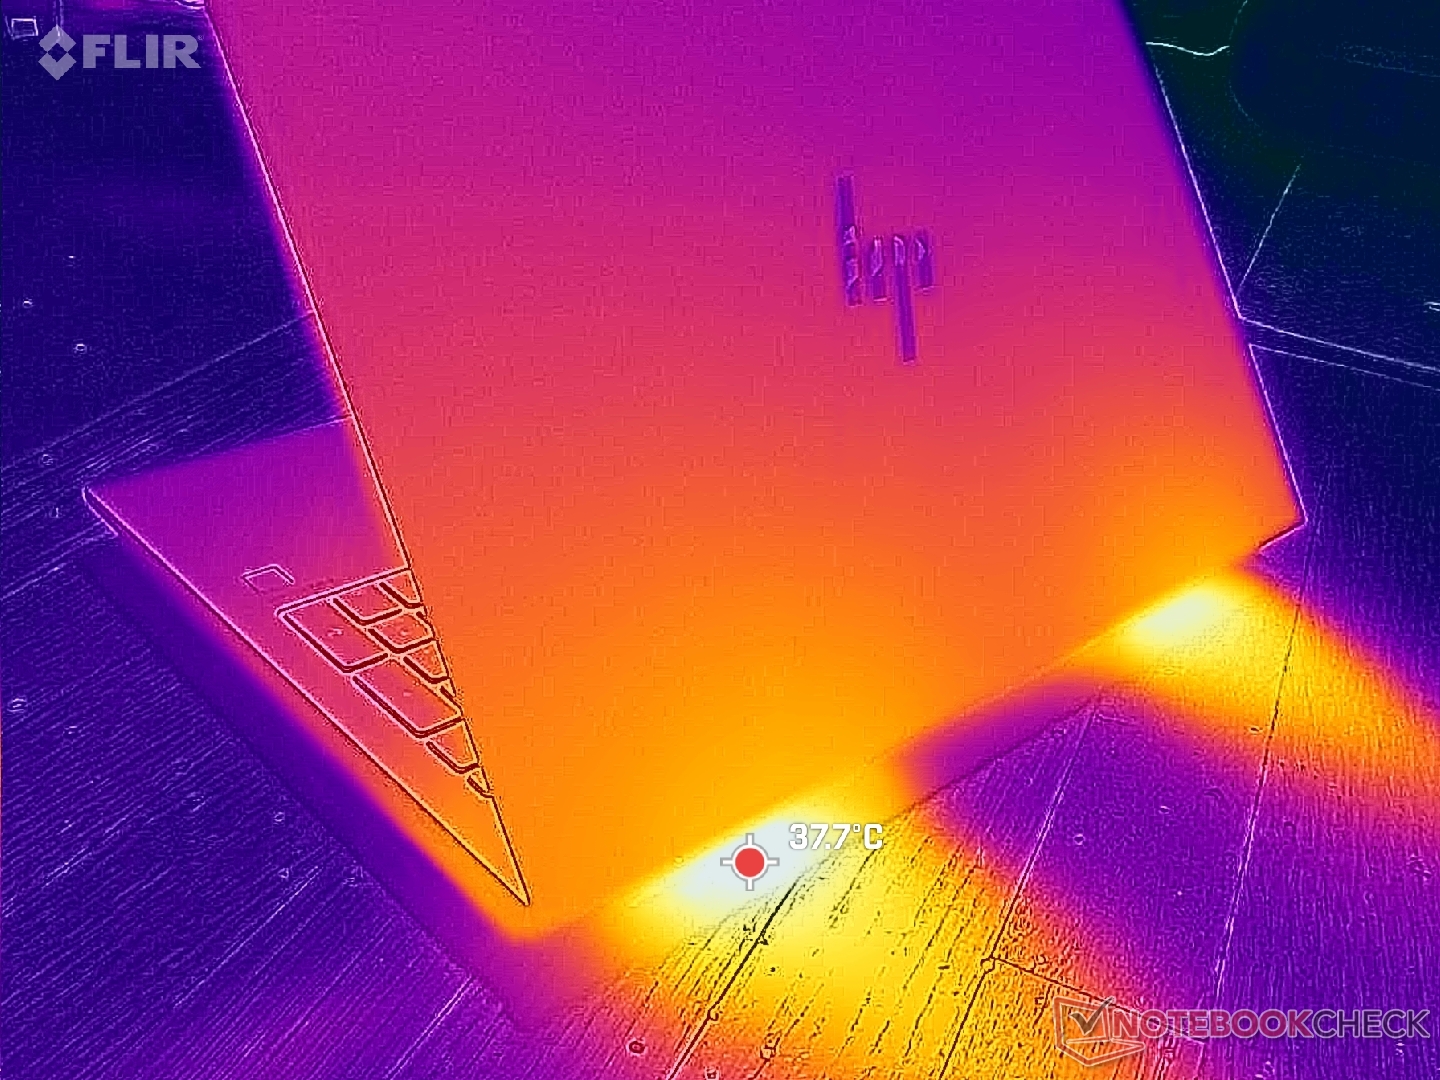
(±) La temperatura massima sul lato superiore è di 40.6 °C / 105 F, rispetto alla media di 38.2 °C / 101 F, che varia da 22.2 a 69.8 °C per questa classe Workstation.
(±) Il lato inferiore si riscalda fino ad un massimo di 40.6 °C / 105 F, rispetto alla media di 41.1 °C / 106 F
(+) In idle, la temperatura media del lato superiore è di 24.6 °C / 76 F, rispetto alla media deld ispositivo di 32 °C / 90 F.
(+) 3: The average temperature for the upper side is 30.1 °C / 86 F, compared to the average of 32 °C / 90 F for the class Workstation.
(+) I poggiapolsi e il touchpad sono piu' freddi della temperatura della pelle con un massimo di 27.2 °C / 81 F e sono quindi freddi al tatto.
(±) La temperatura media della zona del palmo della mano di dispositivi simili e'stata di 27.8 °C / 82 F (+0.6 °C / 1 F).
| HP ZBook Power 16 G11 A AMD Ryzen 7 8845HS, NVIDIA RTX 2000 Ada Generation Laptop | HP ZBook Power 15 G10 AMD Ryzen 7 PRO 7840HS, NVIDIA RTX 2000 Ada Generation Laptop | HP ZBook Fury 16 G11 Intel Core i9-14900HX, NVIDIA RTX 3500 Ada Generation Laptop | Lenovo ThinkPad P1 Gen 7 21KV001SGE Intel Core Ultra 7 155H, NVIDIA GeForce RTX 4060 Laptop GPU | Lenovo ThinkPad P16s G2 21K9000CGE AMD Ryzen 7 PRO 7840U, AMD Radeon 780M | Dell Precision 5690 Intel Core Ultra 9 185H, NVIDIA RTX 5000 Ada Generation Laptop | |
|---|---|---|---|---|---|---|
| Heat | -7% | -26% | -8% | -9% | -8% | |
| Maximum Upper Side * (°C) | 40.6 | 42.4 -4% | 42.2 -4% | 50.3 -24% | 42.7 -5% | 46.6 -15% |
| Maximum Bottom * (°C) | 40.6 | 47.8 -18% | 48 -18% | 38 6% | 47.2 -16% | 33 19% |
| Idle Upper Side * (°C) | 26 | 26.8 -3% | 37 -42% | 28.3 -9% | 27.8 -7% | 32.4 -25% |
| Idle Bottom * (°C) | 26.6 | 27.2 -2% | 36.8 -38% | 27.3 -3% | 28.4 -7% | 29.4 -11% |
* ... Meglio usare valori piccoli
Altoparlanti
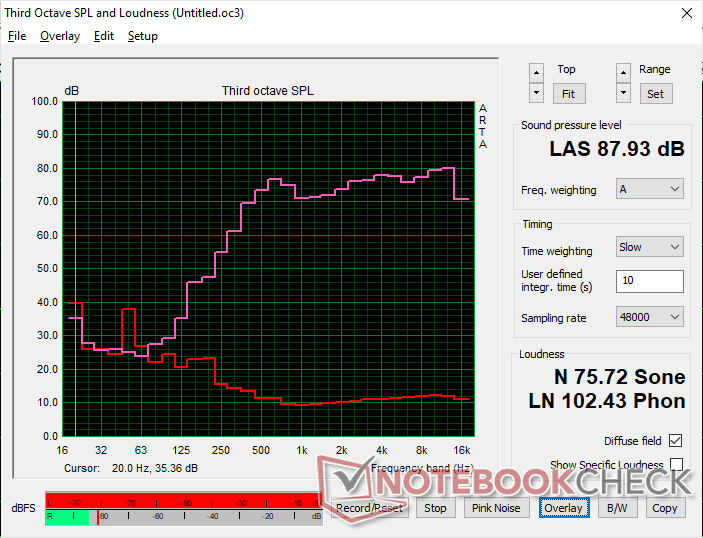
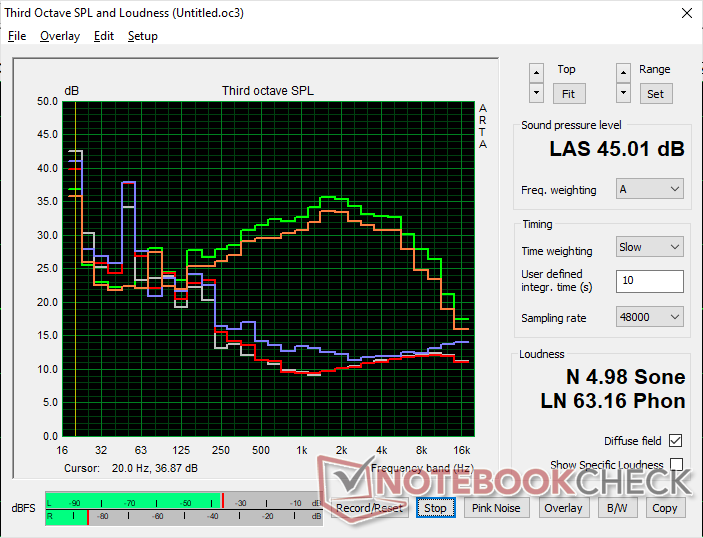
HP ZBook Power 16 G11 A analisi audio
(+) | gli altoparlanti sono relativamente potenti (87.9 dB)
Bassi 100 - 315 Hz
(-) | quasi nessun basso - in media 28.1% inferiori alla media
(±) | la linearità dei bassi è media (9% delta rispetto alla precedente frequenza)
Medi 400 - 2000 Hz
(+) | medi bilanciati - solo only 1.9% rispetto alla media
(+) | medi lineari (4.8% delta rispetto alla precedente frequenza)
Alti 2 - 16 kHz
(+) | Alti bilanciati - appena 3.6% dalla media
(+) | alti lineari (2.4% delta rispetto alla precedente frequenza)
Nel complesso 100 - 16.000 Hz
(±) | la linearità complessiva del suono è media (15.1% di differenza rispetto alla media
Rispetto alla stessa classe
» 33% di tutti i dispositivi testati in questa classe è stato migliore, 7% simile, 60% peggiore
» Il migliore ha avuto un delta di 7%, medio di 17%, peggiore di 35%
Rispetto a tutti i dispositivi testati
» 21% di tutti i dispositivi testati in questa classe è stato migliore, 4% similare, 75% peggiore
» Il migliore ha avuto un delta di 4%, medio di 24%, peggiore di 134%
Apple MacBook Pro 16 2021 M1 Pro analisi audio
(+) | gli altoparlanti sono relativamente potenti (84.7 dB)
Bassi 100 - 315 Hz
(+) | bassi buoni - solo 3.8% dalla media
(+) | bassi in lineaa (5.2% delta rispetto alla precedente frequenza)
Medi 400 - 2000 Hz
(+) | medi bilanciati - solo only 1.3% rispetto alla media
(+) | medi lineari (2.1% delta rispetto alla precedente frequenza)
Alti 2 - 16 kHz
(+) | Alti bilanciati - appena 1.9% dalla media
(+) | alti lineari (2.7% delta rispetto alla precedente frequenza)
Nel complesso 100 - 16.000 Hz
(+) | suono nel complesso lineare (4.6% differenza dalla media)
Rispetto alla stessa classe
» 0% di tutti i dispositivi testati in questa classe è stato migliore, 0% simile, 100% peggiore
» Il migliore ha avuto un delta di 5%, medio di 17%, peggiore di 45%
Rispetto a tutti i dispositivi testati
» 0% di tutti i dispositivi testati in questa classe è stato migliore, 0% similare, 100% peggiore
» Il migliore ha avuto un delta di 4%, medio di 24%, peggiore di 134%
Gestione dell'energia
Consumo di energia
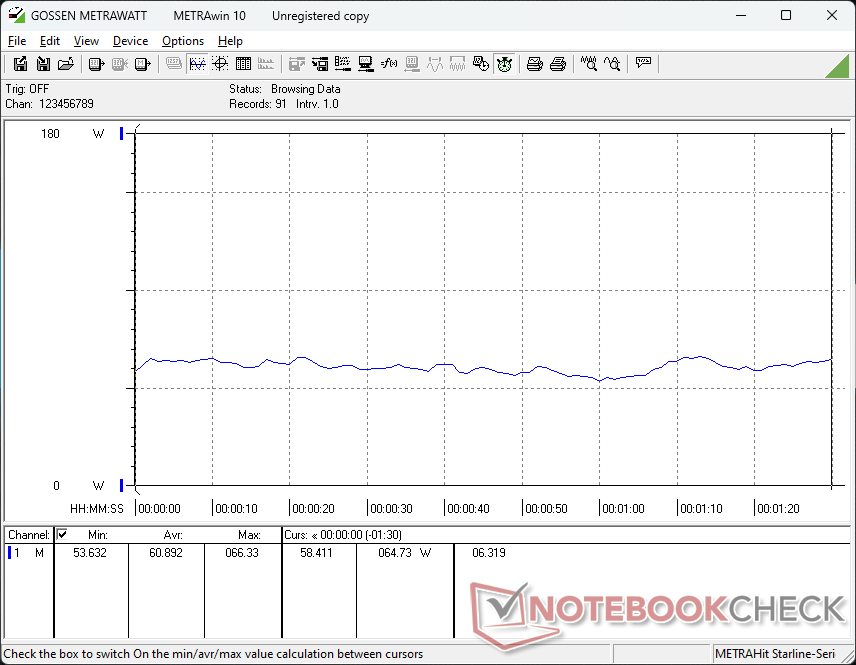
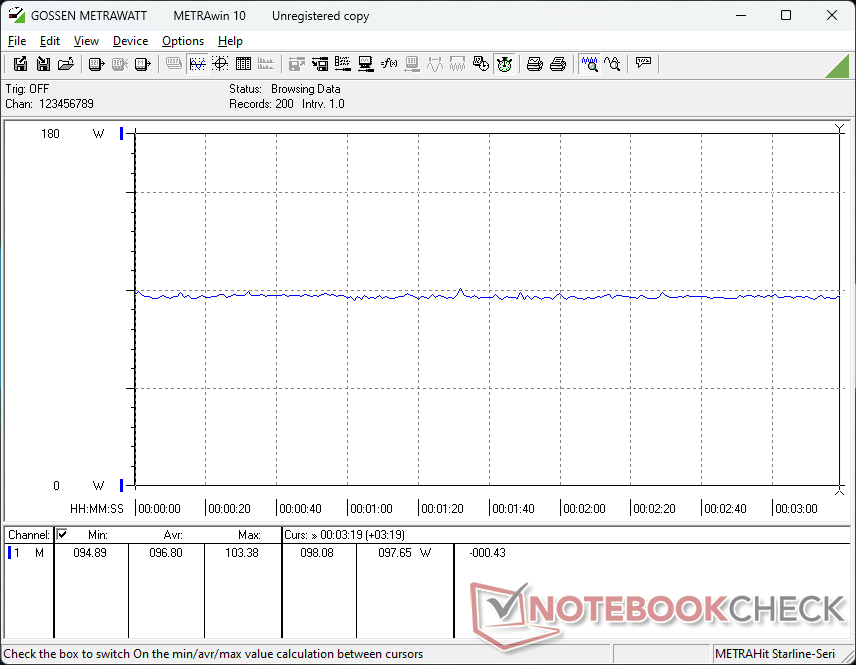
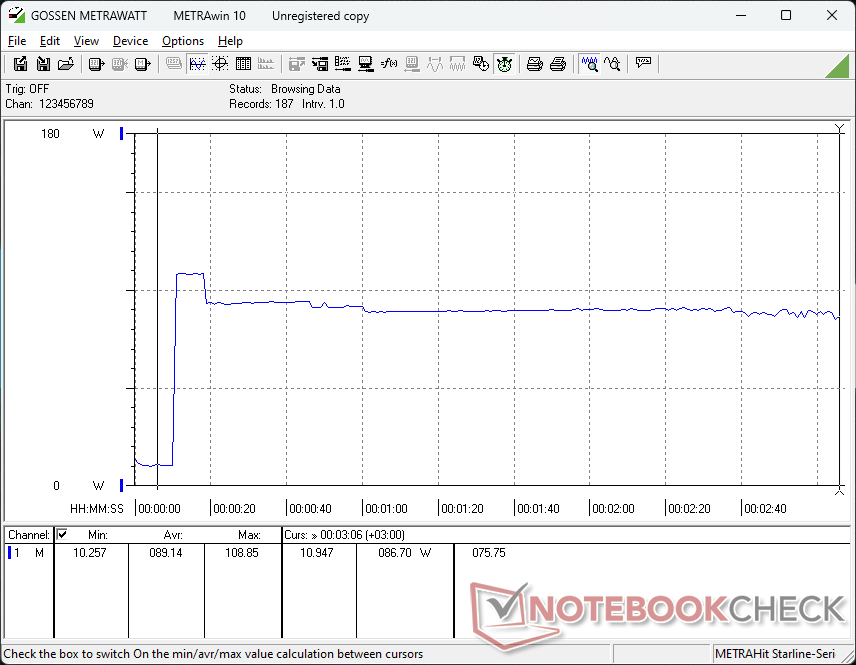
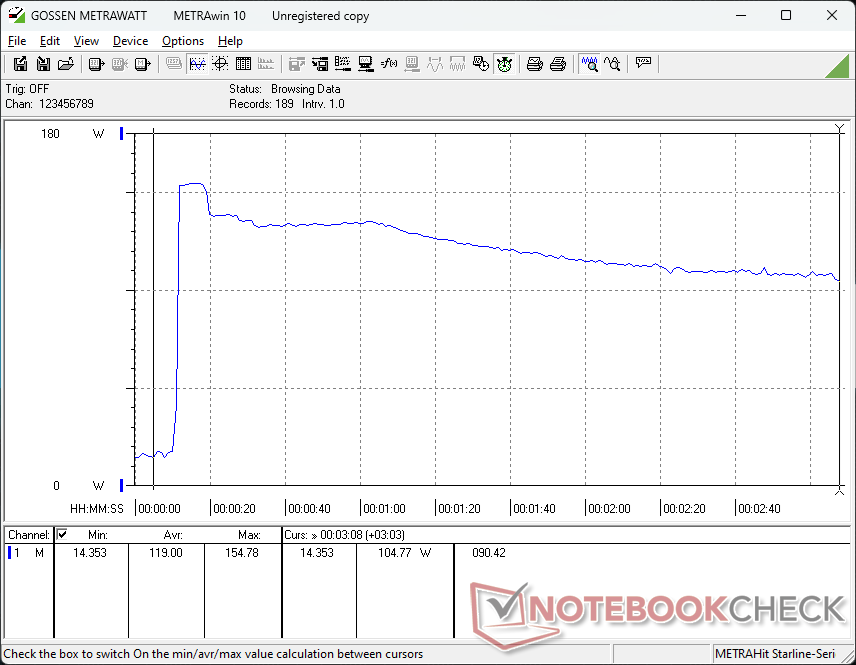
I livelli di consumo e il comportamento sono simili a quelli che abbiamo osservato sullo ZBook Power 15 G10, il che non sorprende, dato che l'inviluppo energetico rimane lo stesso tra i due. Forse la differenza più notevole riguarda il consumo inferiore di circa 25 W quando si eseguono Prime95 e FurMark contemporaneamente. Ciò può essere attribuito al throttling più pesante per il raffreddamento delle temperature del nucleo quando si eseguono tali carichi, come menzionato nella sezione Stress Test precedente.
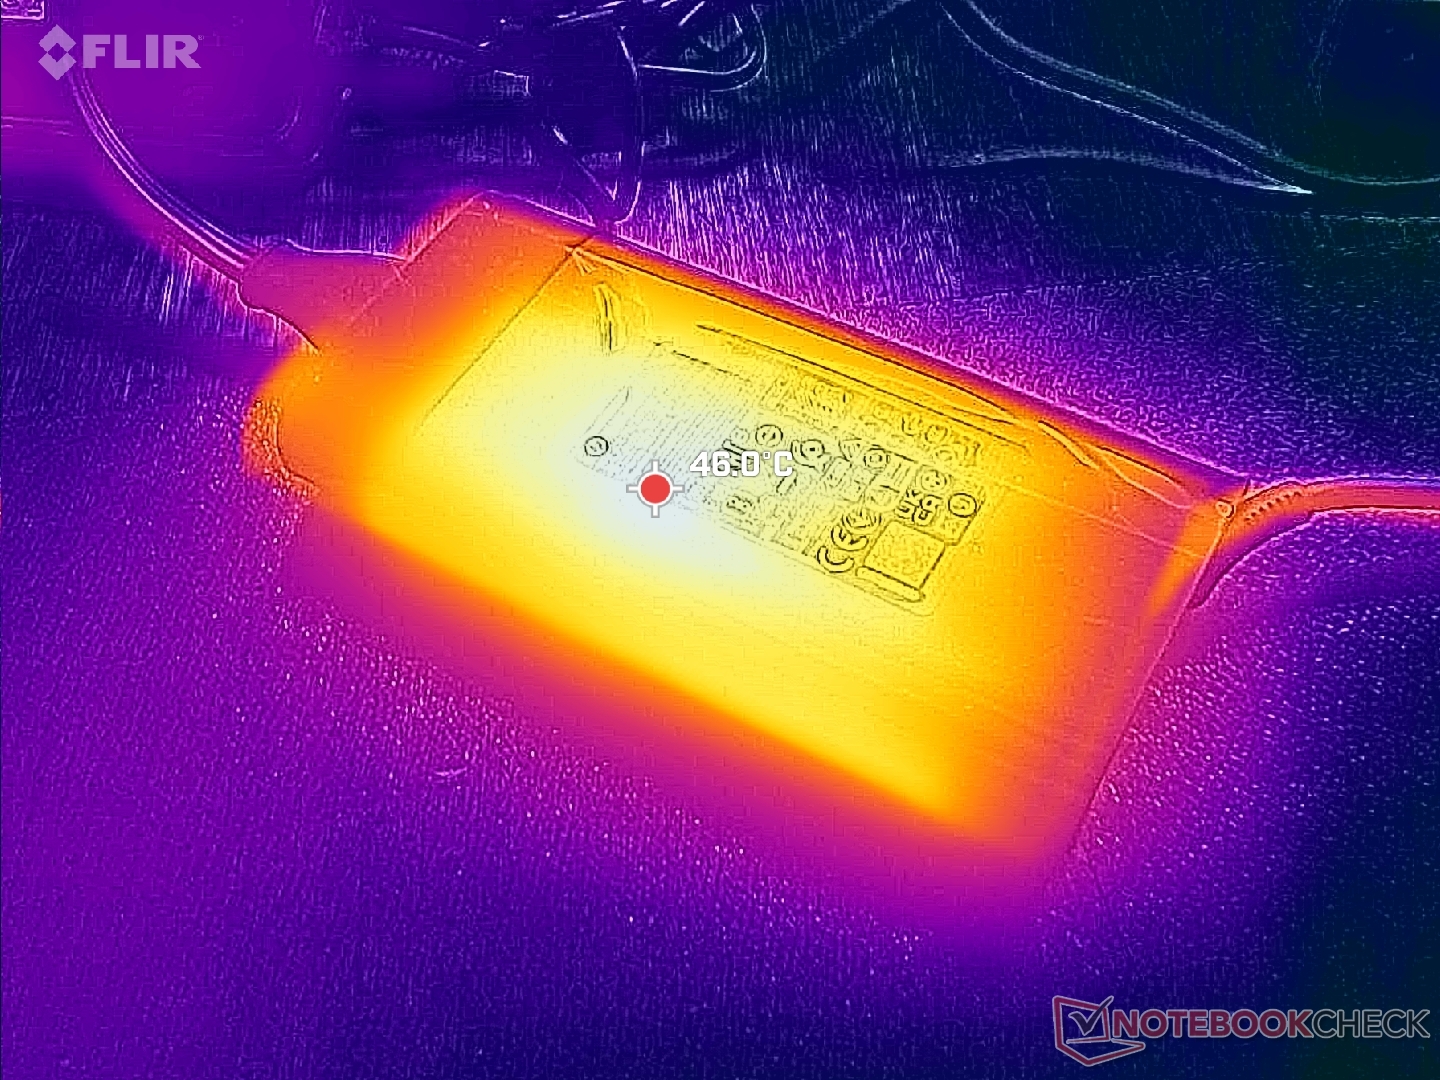
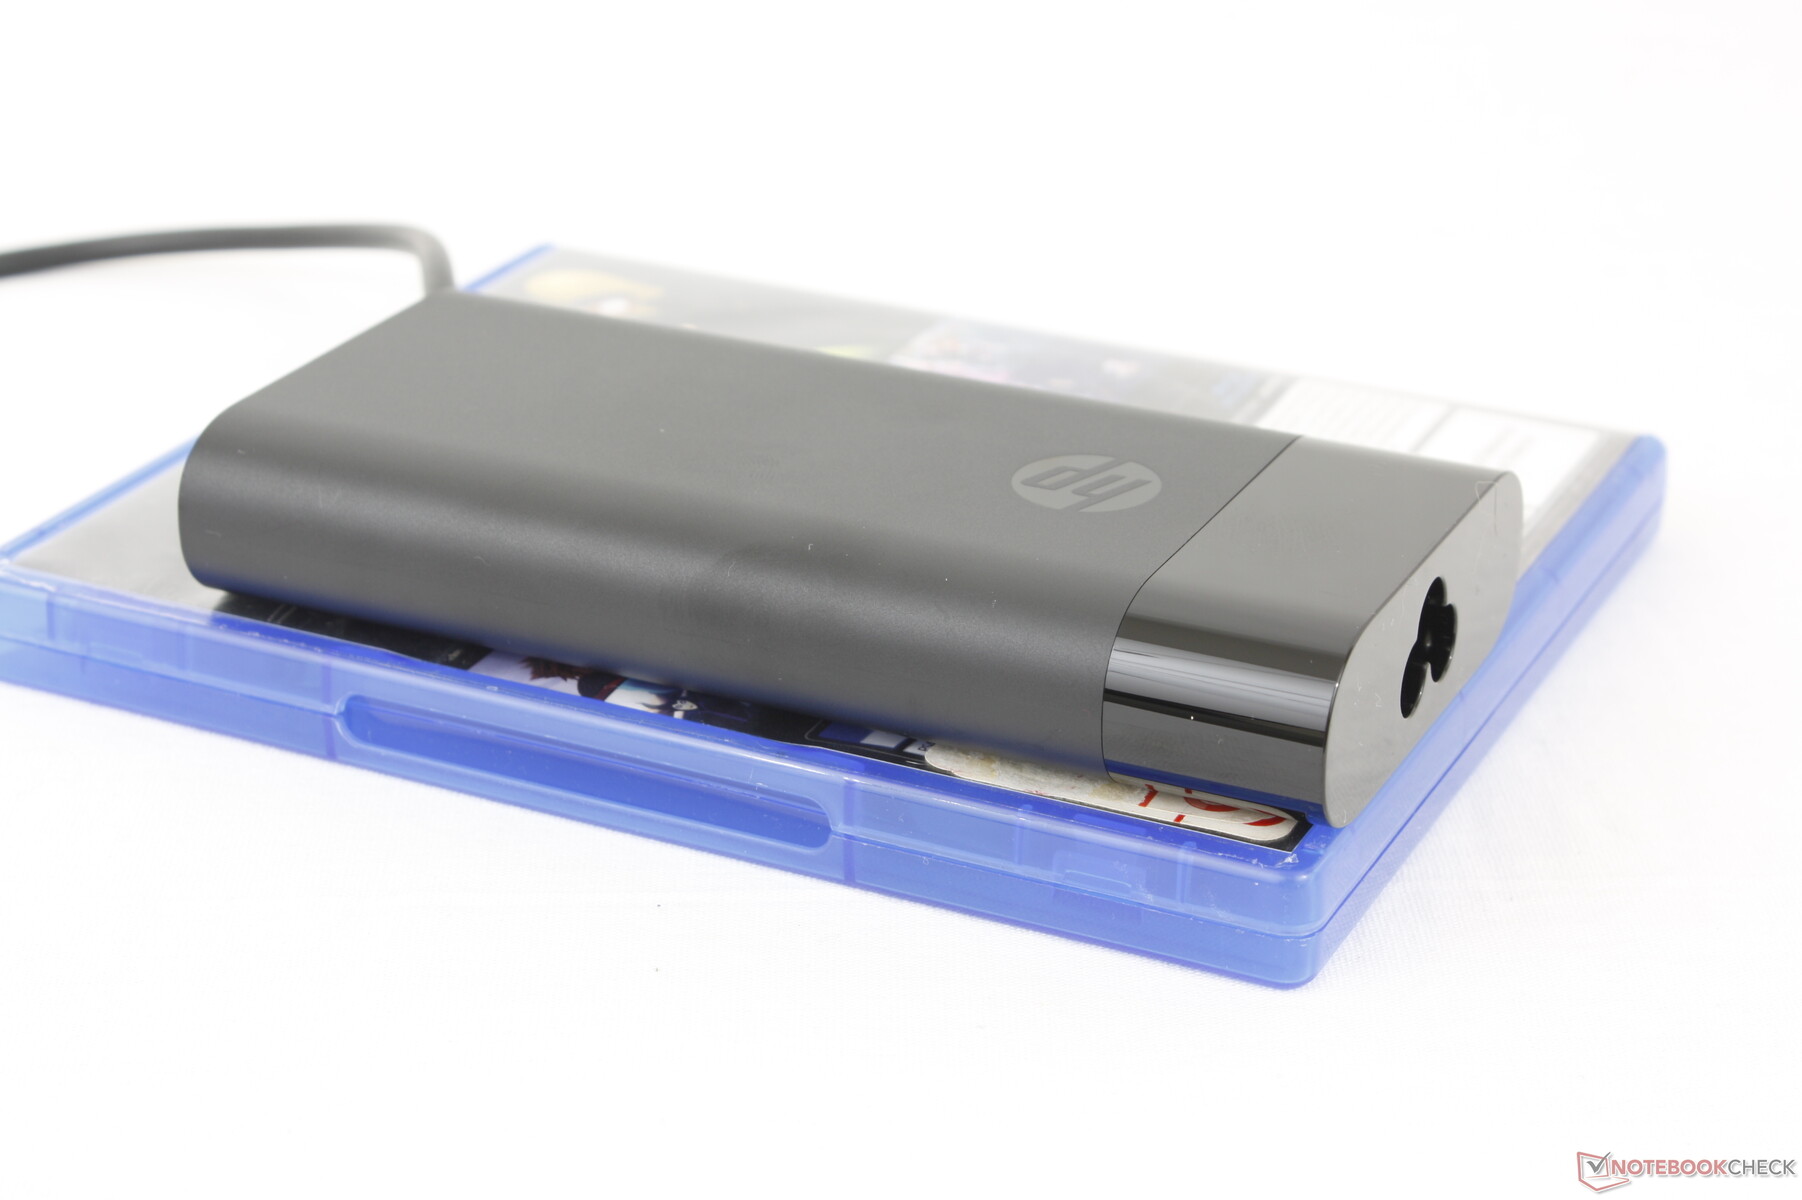
Siamo riusciti a registrare un consumo massimo temporaneo di 155 W dall'adattatore CA da 150 W di medie dimensioni (~13,8 x 6,5 x 2,2 cm).
| Off / Standby | |
| Idle | |
| Sotto carico |
|
Leggenda:
min: | |
| HP ZBook Power 16 G11 A R7 8845HS, RTX 2000 Ada Generation Laptop, Samsung PM9A1 MZVL22T0HBLB, IPS, 2560x1600, 16" | HP ZBook Power 15 G10 R7 PRO 7840HS, RTX 2000 Ada Generation Laptop, WDC PC SN810 2TB, IPS, 2560x1440, 15.6" | HP ZBook Fury 16 G11 i9-14900HX, RTX 3500 Ada Generation Laptop, SK hynix PC801 HFS001TEJ9X101N, IPS, 3840x2400, 16" | Lenovo ThinkPad P1 Gen 7 21KV001SGE Ultra 7 155H, GeForce RTX 4060 Laptop GPU, Kioxia XG8 KXG8AZNV1T02, IPS LED, 2560x1600, 16" | Lenovo ThinkPad P16s G2 21K9000CGE R7 PRO 7840U, Radeon 780M, SK hynix PC801 HFS001TEJ9X162N, OLED, 3840x2400, 16" | Dell Precision 5690 Ultra 9 185H, RTX 5000 Ada Generation Laptop, 2x Samsung PM9A1 1TB (RAID 0), OLED, 3840x2400, 16" | |
|---|---|---|---|---|---|---|
| Power Consumption | -13% | -80% | -35% | 20% | -67% | |
| Idle Minimum * (Watt) | 4.6 | 5.3 -15% | 8.6 -87% | 7.3 -59% | 6.1 -33% | 7.9 -72% |
| Idle Average * (Watt) | 10 | 9.9 1% | 14.8 -48% | 12.3 -23% | 6.5 35% | 12 -20% |
| Idle Maximum * (Watt) | 10.6 | 16.7 -58% | 15.7 -48% | 17.9 -69% | 7 34% | 28.6 -170% |
| Load Average * (Watt) | 60.9 | 61.3 -1% | 129.4 -112% | 78.2 -28% | 56.6 7% | 98.8 -62% |
| Cyberpunk 2077 ultra external monitor * (Watt) | 92.8 | 192.6 -108% | 117.7 -27% | |||
| Cyberpunk 2077 ultra * (Watt) | 96.8 | 199.4 -106% | 123.5 -28% | |||
| Load Maximum * (Watt) | 154.8 | 145.3 6% | 236.1 -53% | 167.5 -8% | 68.3 56% | 174.8 -13% |
| Witcher 3 ultra * (Watt) | 87.9 | 61.2 | 144.5 |
* ... Meglio usare valori piccoli
Power Consumption Cyberpunk / Stress Test
Power Consumption external Monitor
Durata della batteria
La capacità della batteria non è cambiata rispetto allo ZBook Power 15 G10 dello scorso anno, nonostante gli aggiornamenti del fattore di forma. Forse per coincidenza, i tempi di esecuzione rimangono quasi gli stessi, con poco più di 9,5 ore di navigazione WLAN nel mondo reale prima dello spegnimento automatico.
La ricarica da vuoto a pieno regime è relativamente veloce, con meno di 70 minuti. La ricarica tramite USB-C è supportata, anche se a velocità inferiori.
| HP ZBook Power 16 G11 A R7 8845HS, RTX 2000 Ada Generation Laptop, 83 Wh | HP ZBook Power 15 G10 R7 PRO 7840HS, RTX 2000 Ada Generation Laptop, 83 Wh | HP ZBook Fury 16 G11 i9-14900HX, RTX 3500 Ada Generation Laptop, 95 Wh | Lenovo ThinkPad P1 Gen 7 21KV001SGE Ultra 7 155H, GeForce RTX 4060 Laptop GPU, 90 Wh | Lenovo ThinkPad P16s G2 21K9000CGE R7 PRO 7840U, Radeon 780M, 84 Wh | Dell Precision 5690 Ultra 9 185H, RTX 5000 Ada Generation Laptop, 98 Wh | |
|---|---|---|---|---|---|---|
| Autonomia della batteria | 3% | -31% | 7% | -2% | -5% | |
| Reader / Idle (h) | 26.1 | |||||
| WiFi v1.3 (h) | 9.7 | 10 3% | 6.7 -31% | 9.9 2% | 10.6 9% | 9.2 -5% |
| Load (h) | 1.7 | 1.9 12% | 1.5 -12% | |||
| H.264 (h) | 13.3 |
Pro
Contro
Verdetto - Schermo più grande ma stesse prestazioni
ZBook Power 16 G11 sostituisce la serie ZBook Power 15 con un design da 16 pollici più grande e più pesante. Si potrebbe pensare che il fattore di forma più grande porti a prestazioni più veloci, ma purtroppo non è così. Le nuove CPU Hawk Point non offrono molto rispetto alle opzioni Phoenix dello scorso anno, mentre le opzioni GPU sono esattamente le stesse fino ai loro massimali TGP. La riprogettazione del telaio è stata l'occasione per HP di aggiornare la soluzione di raffreddamento e spremere più prestazioni dai processori, ma supponiamo che il produttore non volesse sconfinare troppo nel territorio dello ZBook Fury di fascia alta.
Anche le opzioni di visualizzazione sono un po' deludenti per una workstation. A parte l'esclusiva opzione a 1000 nit, non ci sono caratteristiche degne di nota come OLED, colori P3 o risoluzione 4K. Tali pannelli avrebbero reso la dimensione dello schermo più grande molto più interessante rispetto alla versione da 15,6 pollici. Invece, gli utenti sono limitati a 2K e IPS.
Lo ZBook Power 16 G11 non offre molto altro rispetto al suo predecessore, a parte le dimensioni maggiori dello schermo da 16 pollici. Le prestazioni e le caratteristiche sono quasi identiche tra i due modelli.
L'HP è ancora una solida workstation di fascia media, nonostante la mancanza di aggiornamenti delle prestazioni e di nuove funzionalità. Le prestazioni della CPU sono ancora notevolmente più veloci rispetto al ThinkPad P16s G2 che è limitato alle CPU della serie Ryzen-U, pur essendo meno costoso del popolare modello Dell Precision 5690 quando è configurato con la stessa GPU. Se possiede già uno ZBook Power 15 G10, tuttavia, la versione più pesante da 16 pollici può sembrare un passo indietro.
Prezzo e disponibilità
HP sta distribuendo lo ZBook Power 16 G11 A a partire da 1140 dollari con la configurazione base Ryzen 5 e iGPU. La nostra configurazione di recensione con CPU Ryzen 7, GPU RTX 2000 Ada e display 1600p viene venduta a circa 2000 dollari.
Nota: abbiamo recentemente aggiornato il nostro sistema di valutazione e i risultati della versione 8 non sono paragonabili ai risultati della versione 7. Ulteriori informazioni sono disponibili qui .
HP ZBook Power 16 G11 A
- 09/30/2024 v8
Allen Ngo
 Total Sustainability Score:
 Transparency
La selezione dei dispositivi da recensire viene effettuata dalla nostra redazione. Il campione di prova è stato fornito all'autore come prestito dal produttore o dal rivenditore ai fini di questa recensione. L'istituto di credito non ha avuto alcuna influenza su questa recensione, né il produttore ne ha ricevuto una copia prima della pubblicazione. Non vi era alcun obbligo di pubblicare questa recensione. In quanto società mediatica indipendente, Notebookcheck non è soggetta all'autorità di produttori, rivenditori o editori.
Ecco come Notebookcheck esegue i test
Ogni anno, Notebookcheck esamina in modo indipendente centinaia di laptop e smartphone utilizzando procedure standardizzate per garantire che tutti i risultati siano comparabili. Da circa 20 anni sviluppiamo continuamente i nostri metodi di prova e nel frattempo stabiliamo gli standard di settore. Nei nostri laboratori di prova, tecnici ed editori esperti utilizzano apparecchiature di misurazione di alta qualità. Questi test comportano un processo di validazione in più fasi. Il nostro complesso sistema di valutazione si basa su centinaia di misurazioni e parametri di riferimento ben fondati, che mantengono l'obiettività.Price comparison

