Recensione del Lenovo ThinkPad P16s G2 AMD: Potenza e OLED in questo portatile workstation

Mentre un chip di sicurezza aggiuntivo, l'opzione di eseguire la manutenzione remota e un lettore di SmartCard possono interessare solo i clienti aziendali, la potenza, le prestazioni grafiche, la lunga autonomia e il bel display del portatile dovrebbero suscitare l'interesse del grande pubblico. Il suo potente AMD Ryzen 7 Pro 7840U attira l'attenzione in particolare.
Questo rende il ThinkPad P16s G2 adatto per lavorare a casa, in viaggio, all'università o anche per i creativi. Inoltre, non è stato necessario installare un display OLED e la RAM e l'SSD offrono una buona gamma di opzioni di configurazione per quasi tutti i campi di utilizzo. A sua volta, la sua grafica potrebbe essere descritta come piuttosto conservativa, ma questo non deve essere un punto negativo.
Allo stesso tempo, concorrenti analoghi come il Microsoft Surface Laptop Studio 2 o il HP EliteBook 845 G10 hanno un design leggermente più coraggioso. La nostra recensione mostrerà se questi sono migliori o peggiori o semplicemente diversi, e se il ThinkPad P16s G2 ha ancora spazio per crescere.
Potenziali concorrenti a confrontos
Punteggio | Data | Modello | Peso | Altezza | Dimensione | Risoluzione | Prezzo |
|---|---|---|---|---|---|---|---|
| 88.6 % v7 (old) | 01/2024 | Lenovo ThinkPad P16s G2 21K9000CGE R7 PRO 7840U, Radeon 780M | 1.8 kg | 24.4 mm | 16.00" | 3840x2400 | |
| 90.1 % v7 (old) | 08/2023 | HP EliteBook 845 G10 818N0EA R9 PRO 7940HS, Radeon 780M | 1.5 kg | 17.9 mm | 14.00" | 2560x1600 | |
| 87.8 % v7 (old) | 01/2024 | Lenovo ThinkPad P14s G4 21K5000LGE R7 PRO 7840U, Radeon 780M | 1.3 kg | 21.8 mm | 14.00" | 1920x1200 | |
| 88.6 % v7 (old) | 08/2023 | Schenker Vision 16 PH6PRX1 i7-13700H, Iris Xe G7 96EUs | 1.5 kg | 17.1 mm | 16.00" | 2560x1600 | |
| 88.6 % v7 (old) | 10/2023 | Acer Swift Edge SFE16 Ryzen 7 7840U R7 7840U, Radeon 780M | 1.2 kg | 13 mm | 16.00" | 3200x2000 | |
| 86.2 % v7 (old) | 01/2024 | Lenovo ThinkPad P16v G1 AMD R7 PRO 7840HS, RTX A1000 Laptop GPU | 2.3 kg | 24.7 mm | 16.00" | 1920x1200 | |
| 85.5 % v7 (old) | 10/2023 | Microsoft Surface Laptop Studio 2 RTX 4060 i7-13700H, GeForce RTX 4060 Laptop GPU | 2 kg | 22 mm | 14.40" | 2400x1600 |
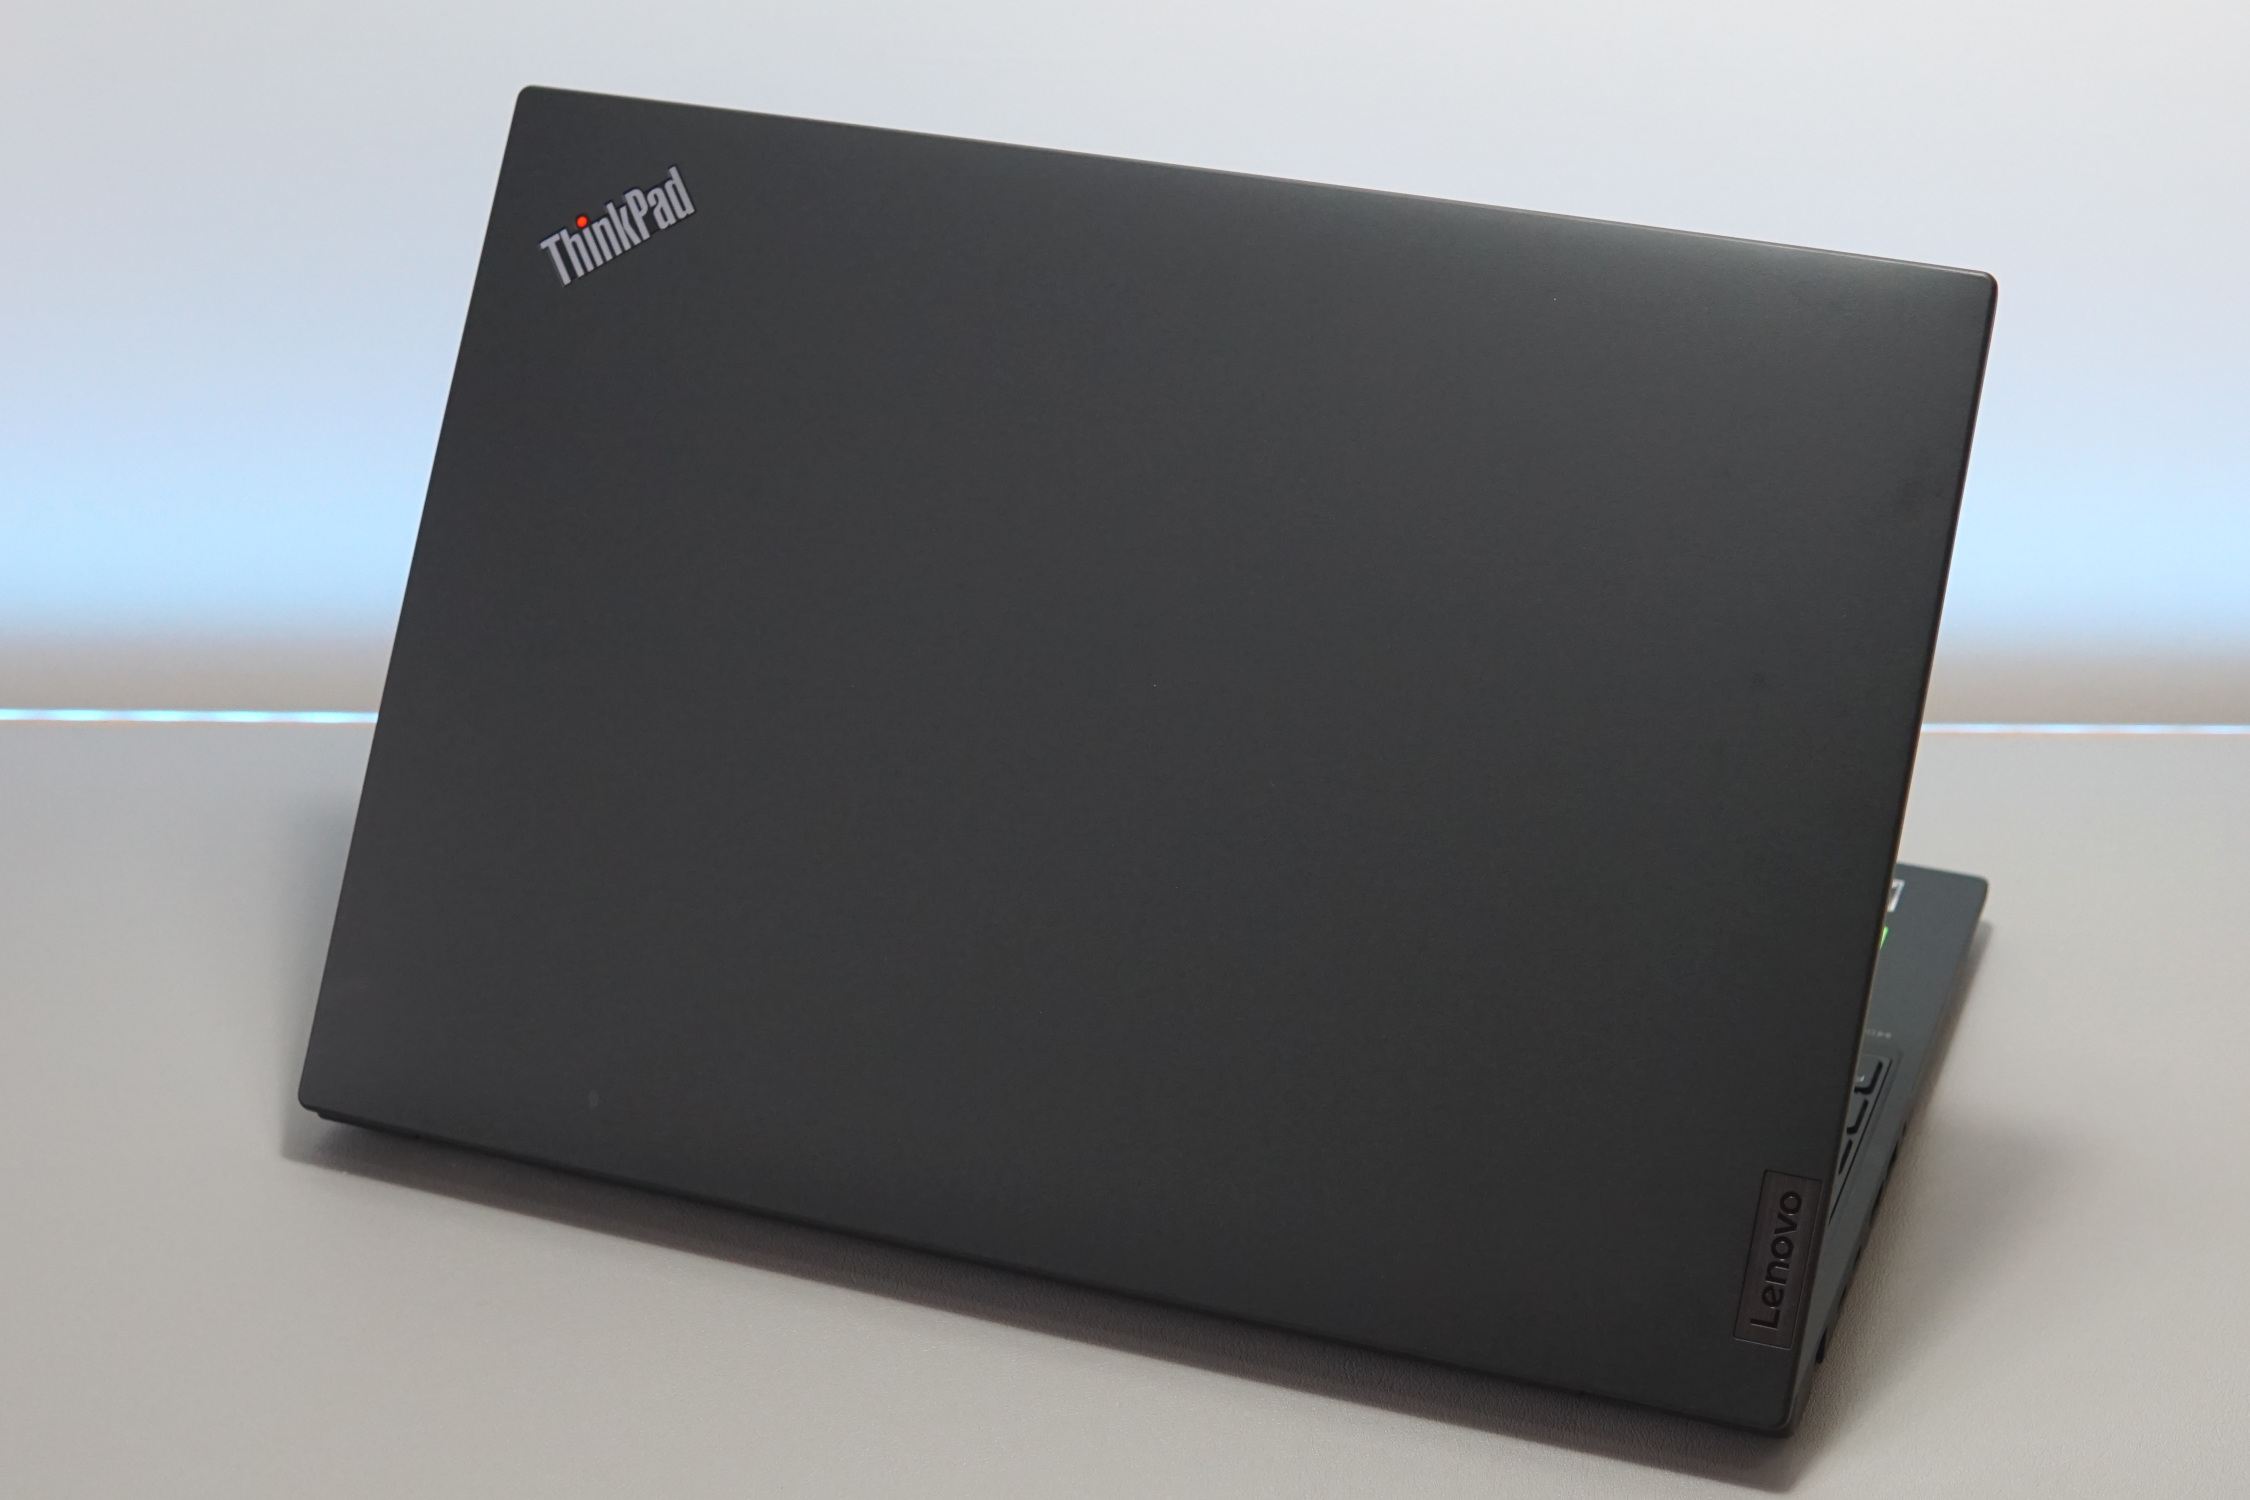
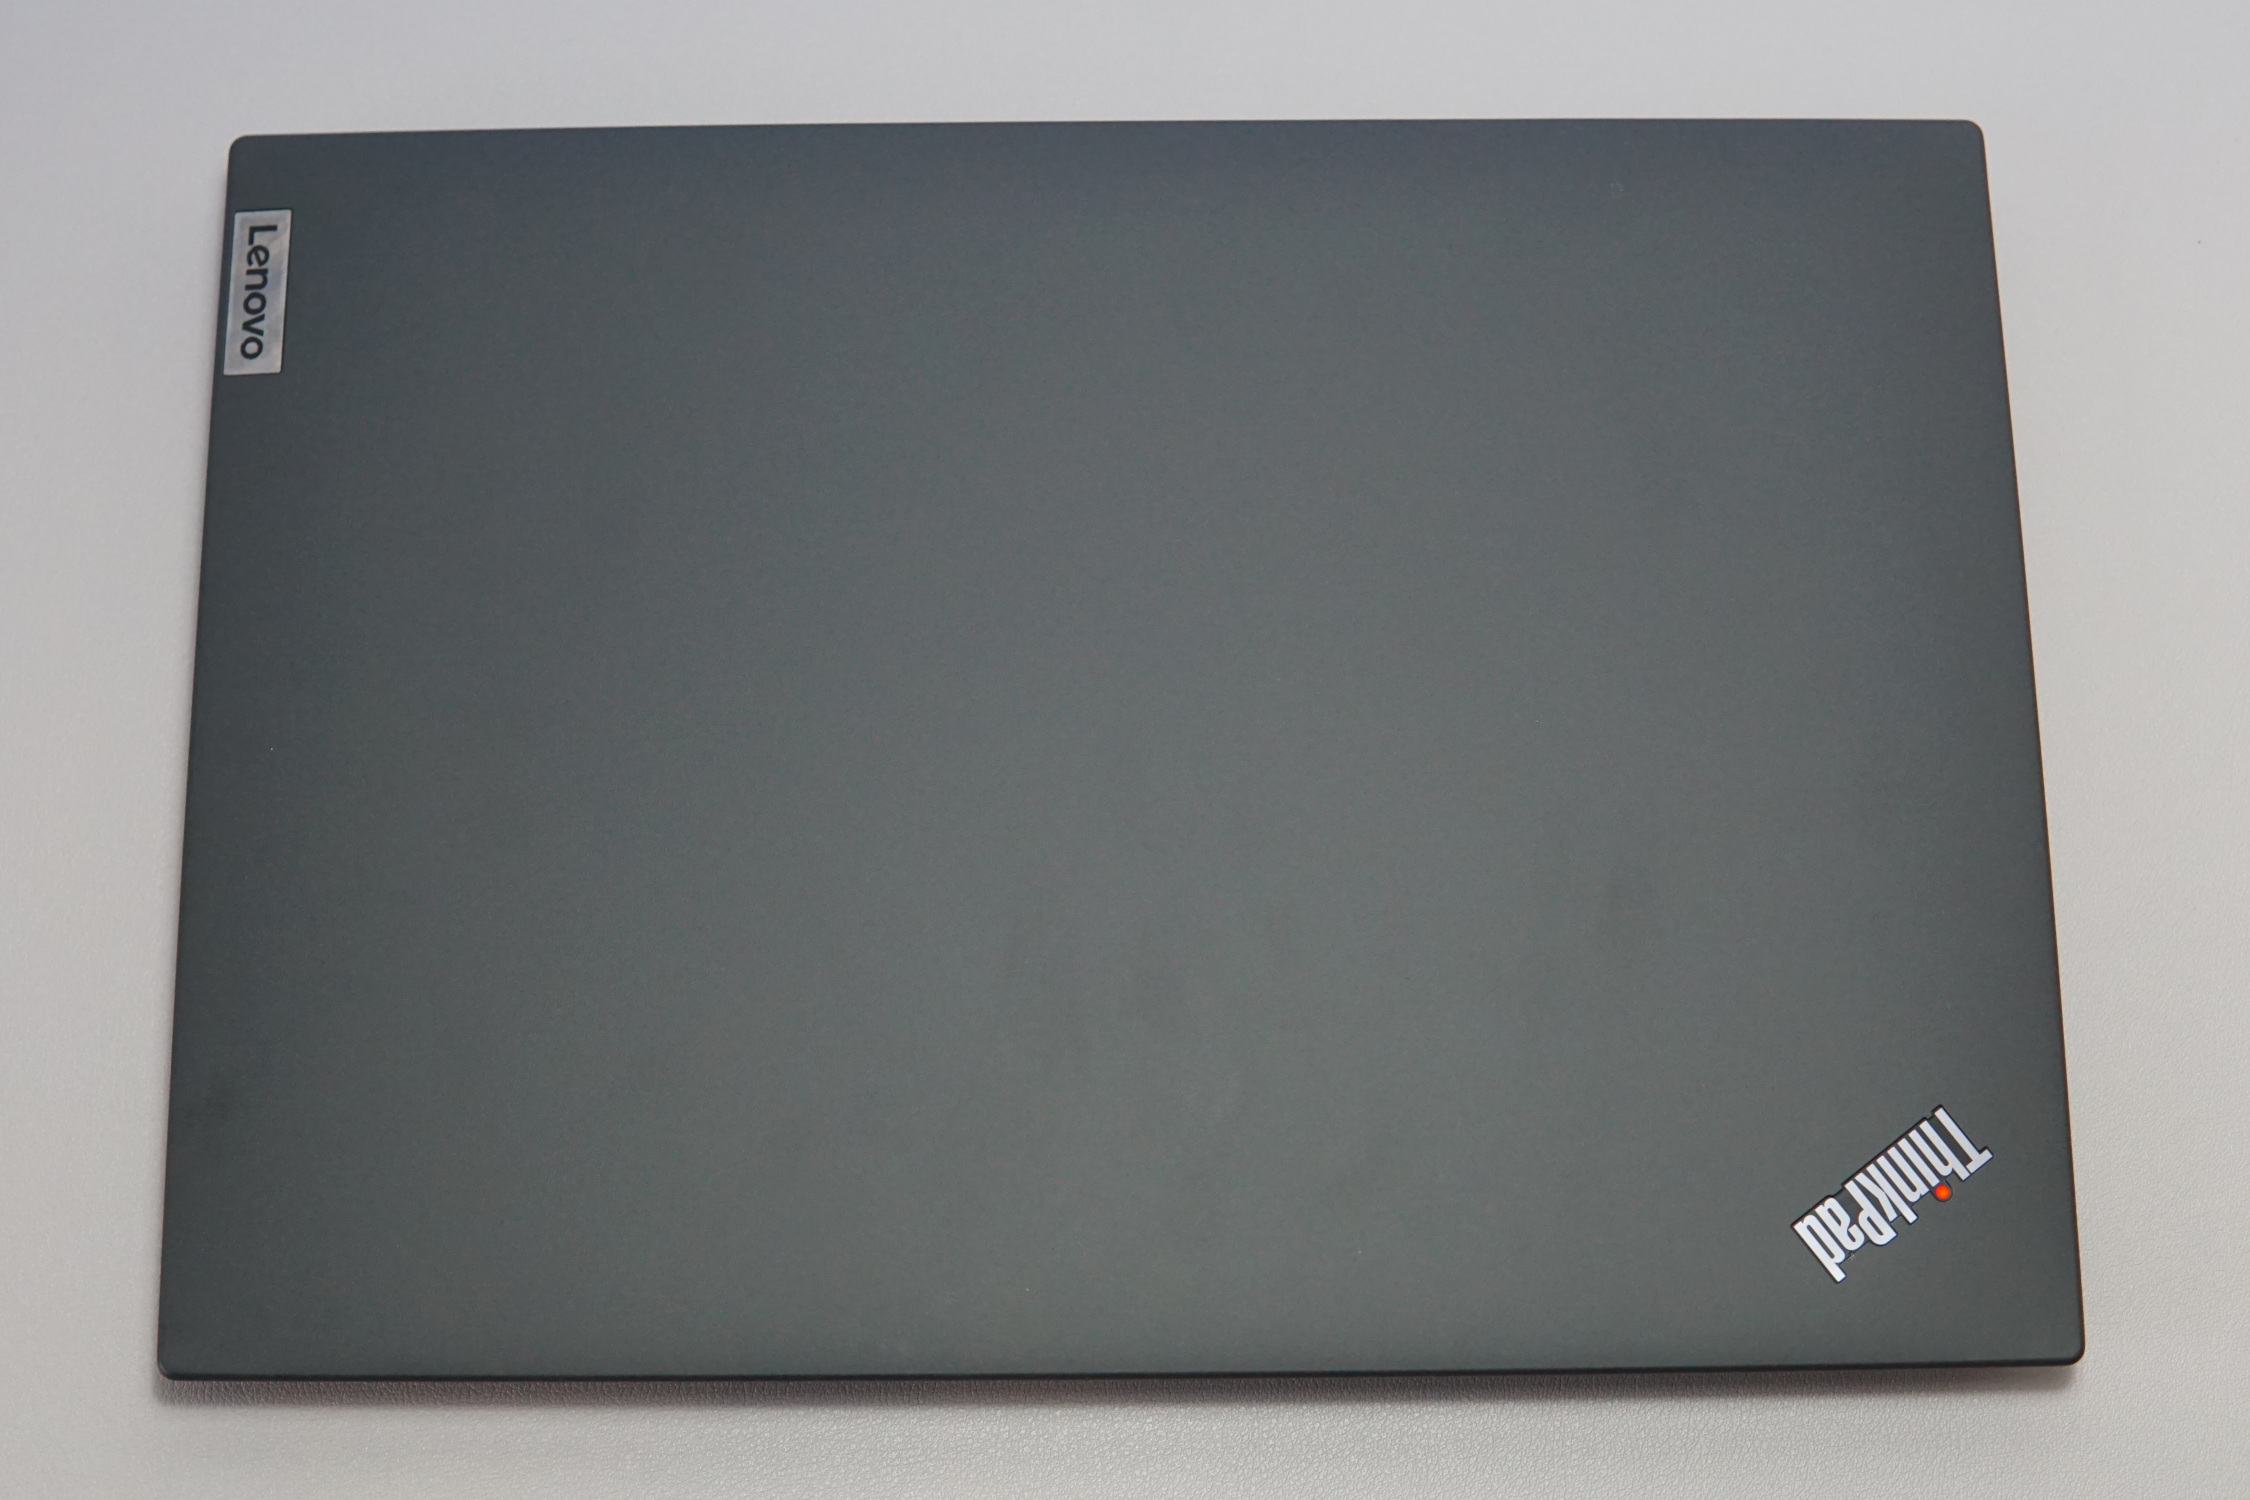
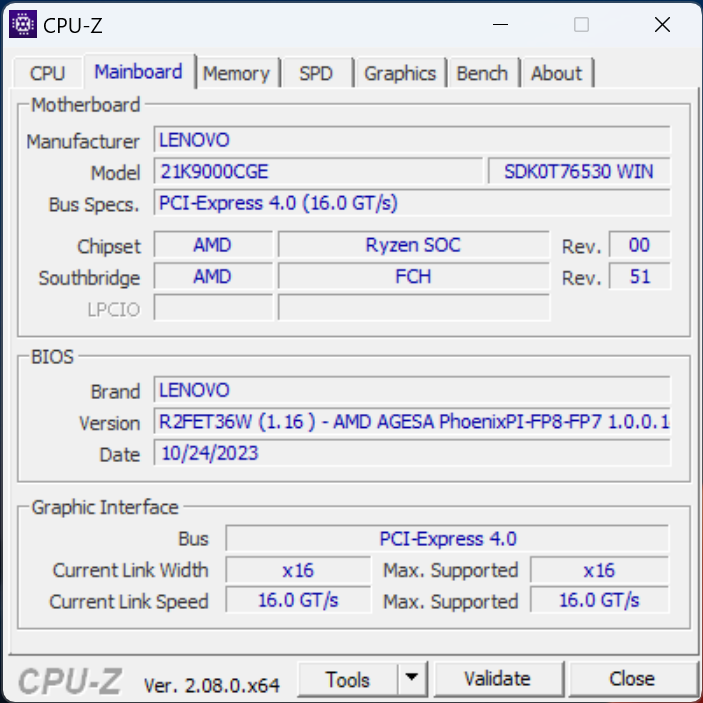
Custodia - Il ThinkPad grigio e robusto
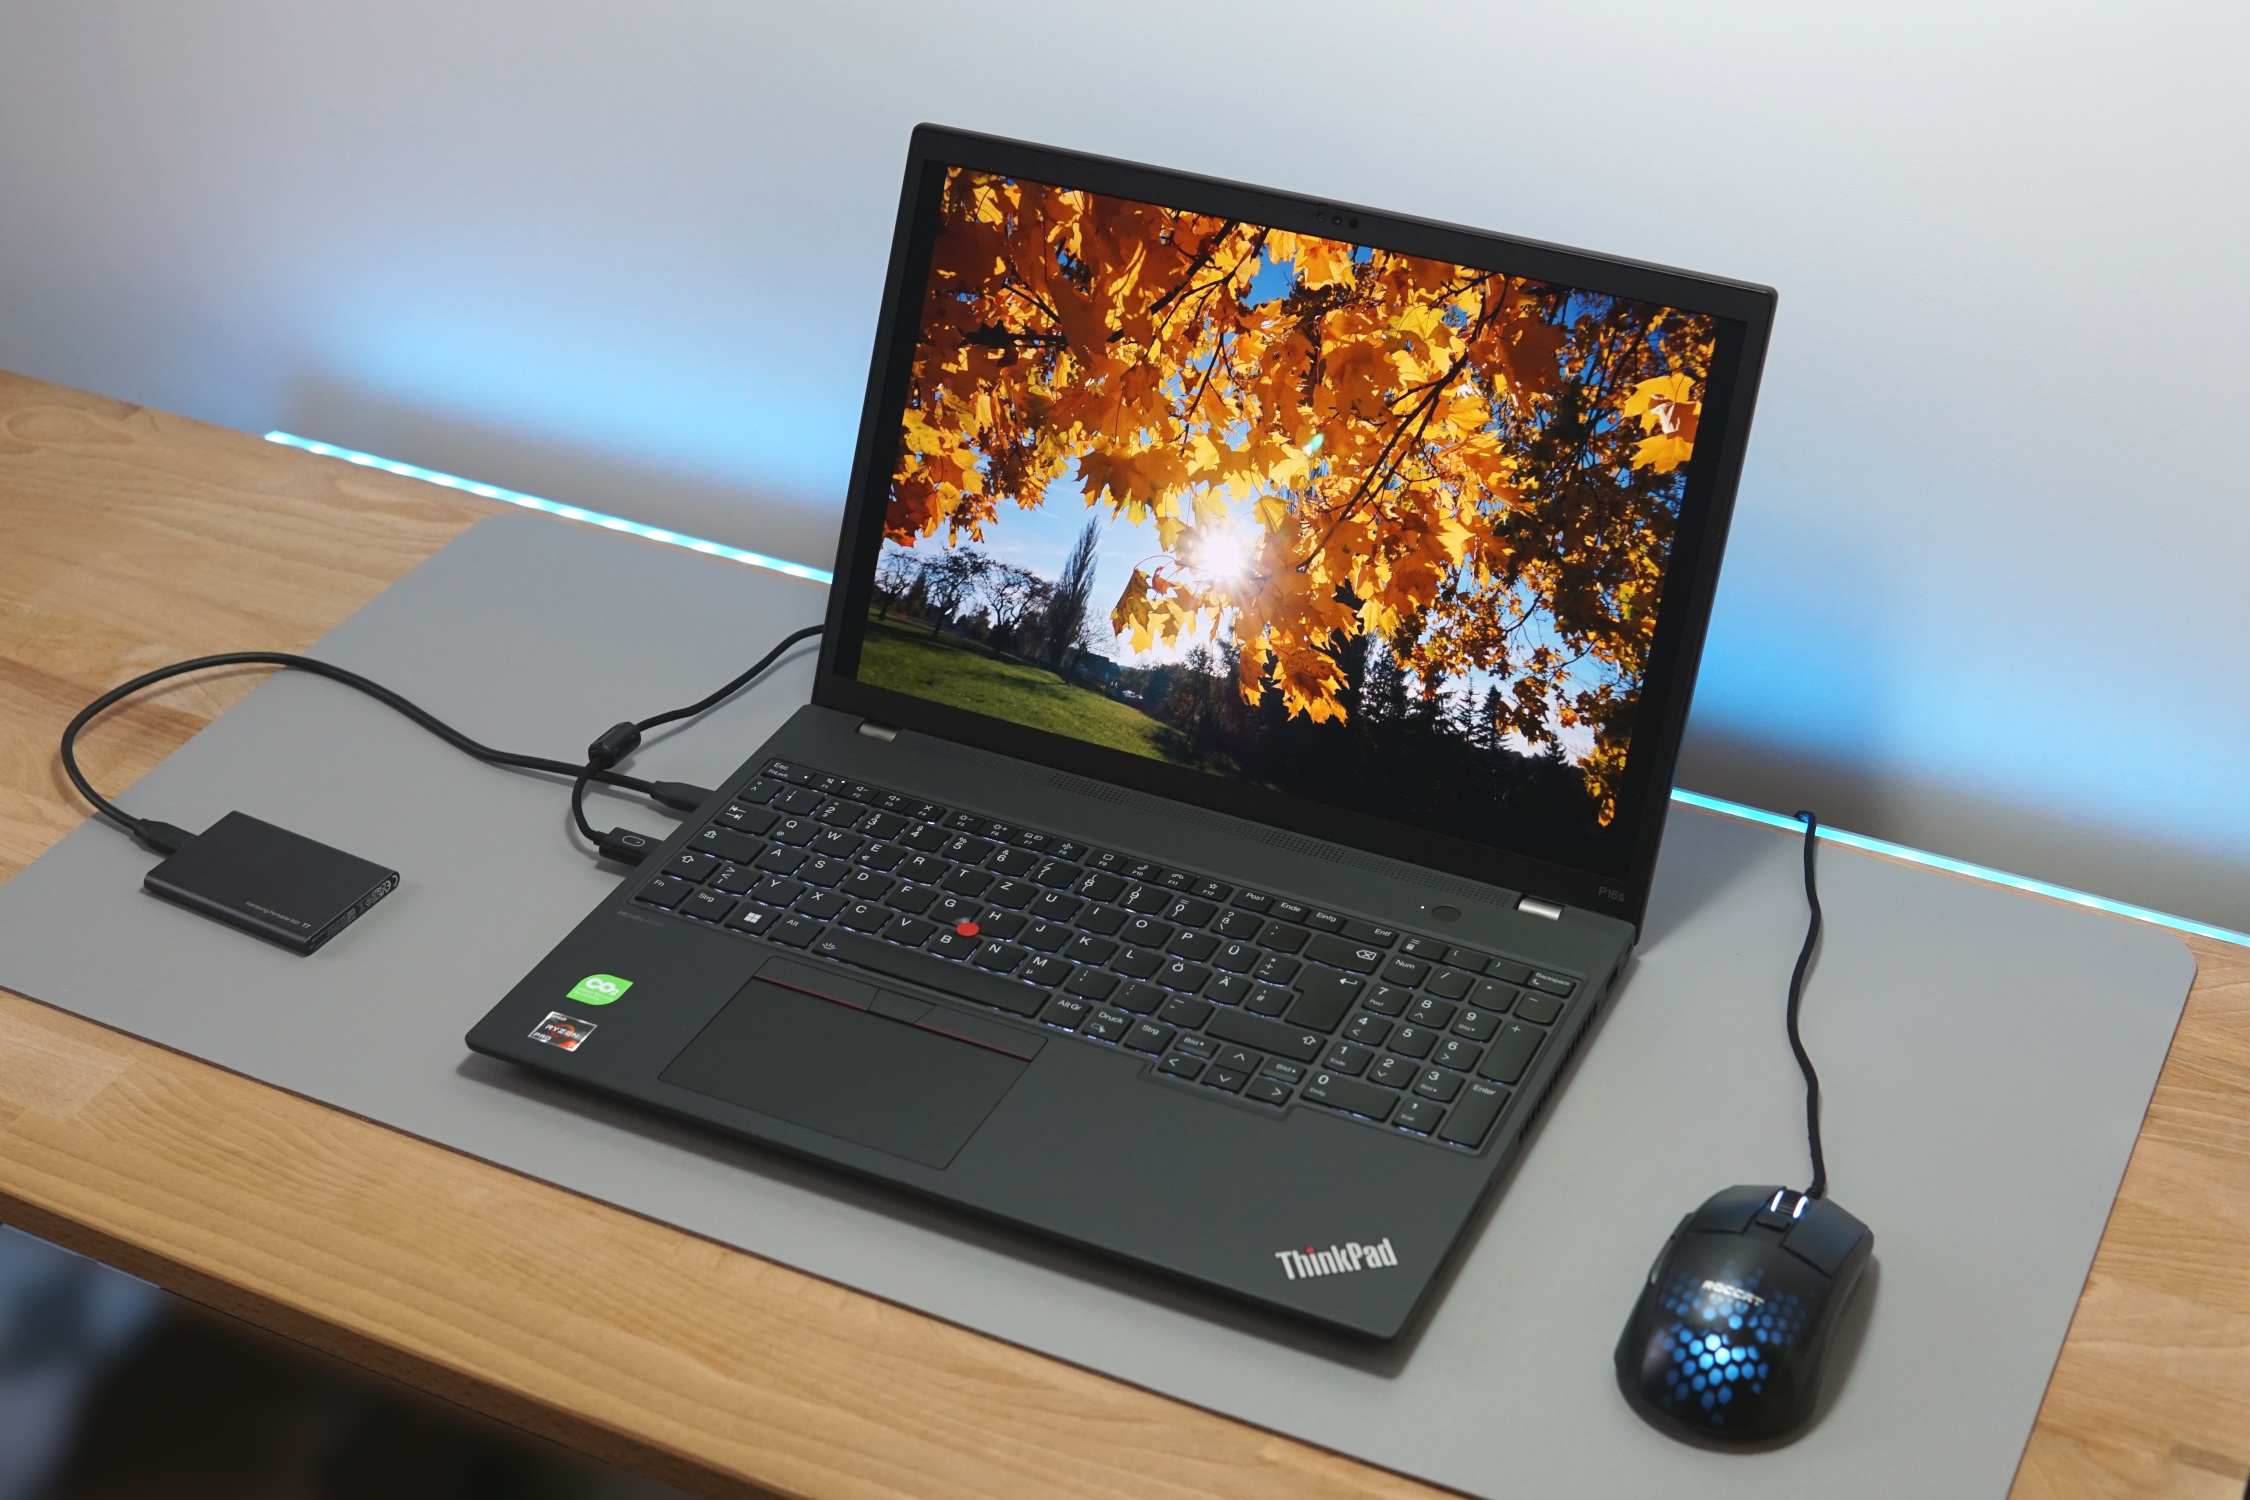
Superficie strutturata, cassa grigio scuro: La grafica del ThinkPad si riconosce da lontano. E come sempre, il punto sopra la "I" è illuminato. Non sembra elegante e non è affatto moderno. Al contrario, sembra robusto e durevole. Le cerniere strette che mantengono il display da 16 pollici in qualsiasi angolazione e il coperchio che si chiude quasi senza soluzione di continuità rafforzano ulteriormente questa impressione di alta qualità e stabilità, anche senza la presenza di componenti metallici sulla custodia esterna.
Naturalmente, il display relativamente grande può essere leggermente ruotato. La base, invece, rimane totalmente stabile in ogni situazione. Inoltre, non siamo riusciti a percepire alcun rumore dal case. Dopotutto, si tratta di un computer portatile da lavoro che non sarà sempre maneggiato con cura.
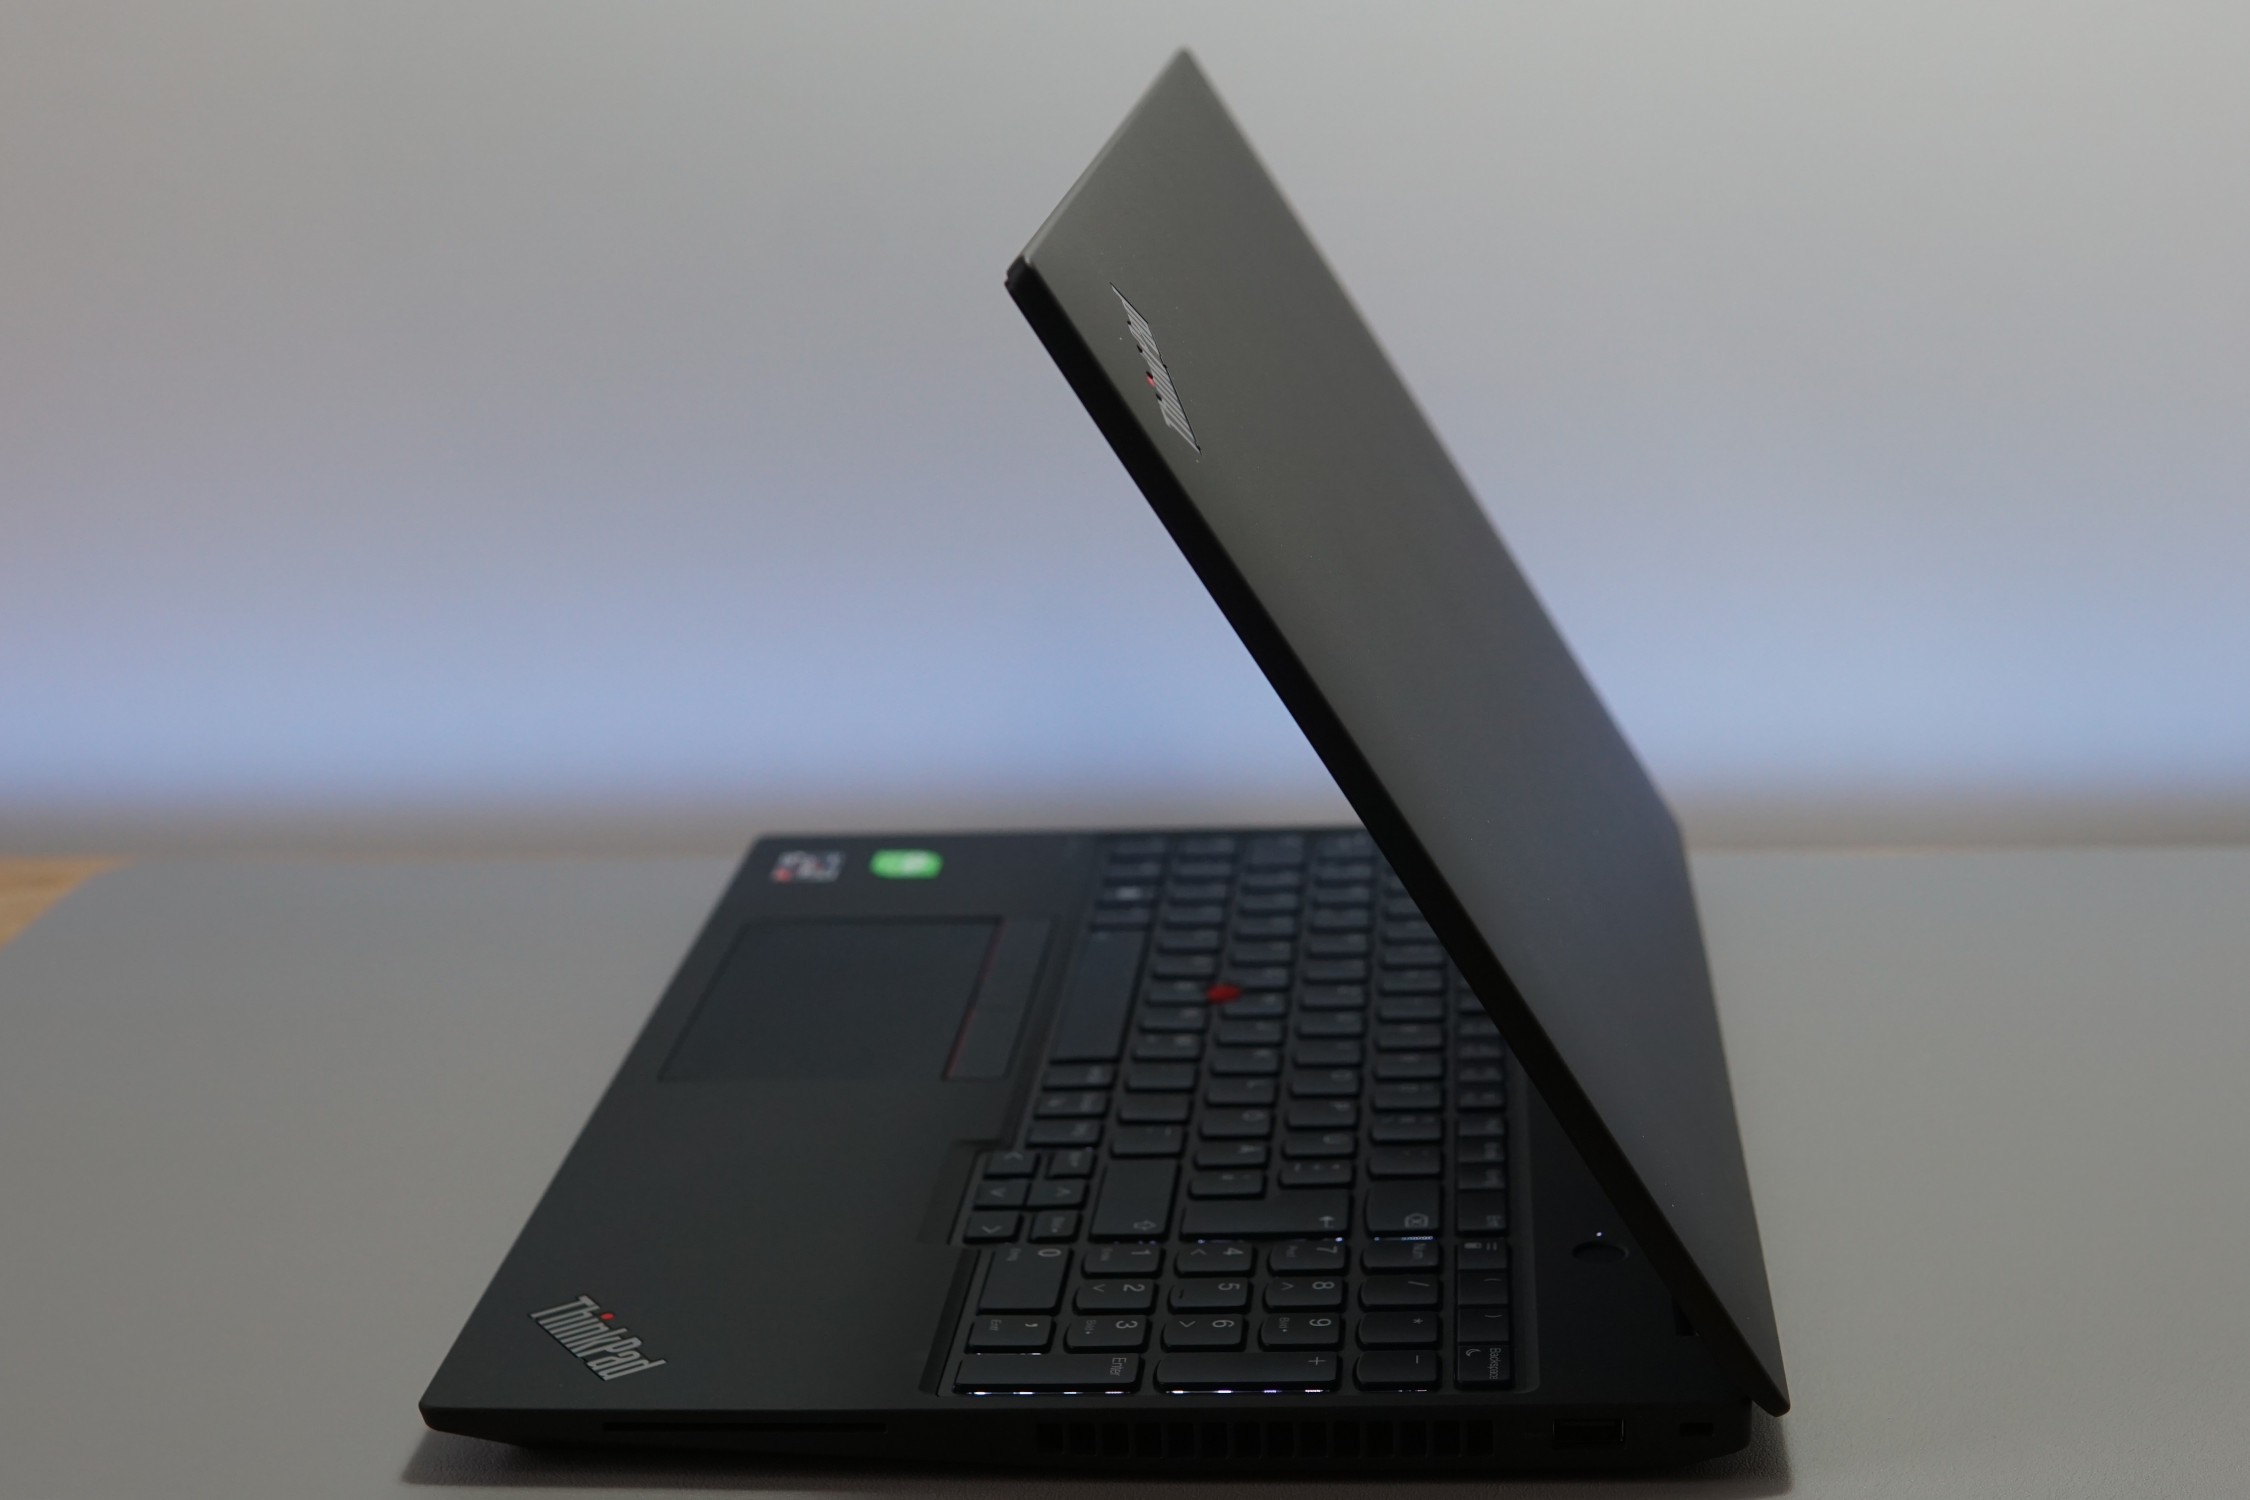
Le dimensioni e il peso del dispositivo mostrano da dove proviene la stabilità. Per un computer portatile senza scheda grafica dedicata e realizzato completamente in plastica, 1,8 kg sono certamente degni di nota. Lo è ancora di più lo spessore del telaio, che misura quasi 24 millimetri. Il modello con configurazione quasi identica Acer Swift Edge SFE16 è circa la metà dello spessore e pesa 500 grammi in meno. A sua volta, si sente un po' più fragile rispetto al ThinkPad P16.
Inoltre, un case spesso presenta alcuni vantaggi in più, di cui parleremo nella sezione "prestazioni".
Connettività - Luce e un po' di ombra sui P16
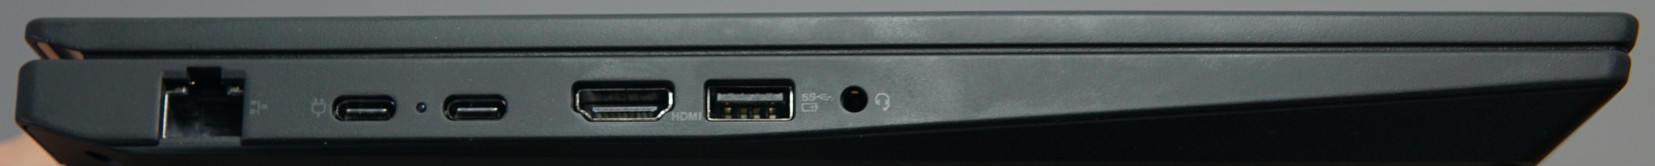
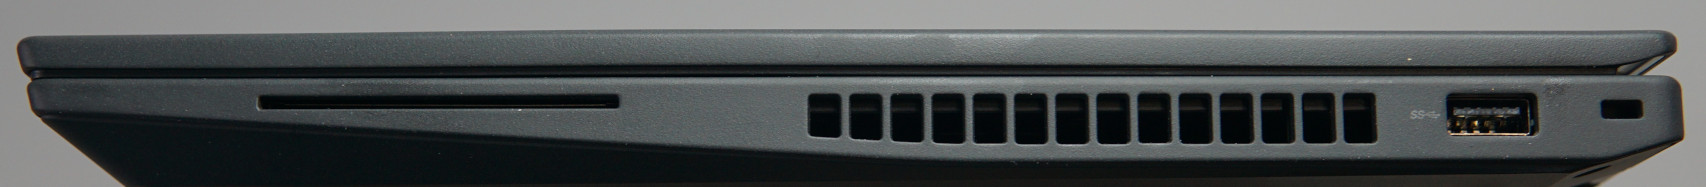
La selezione di opzioni di connettività del portatile sembra essere buona in generale. Dispone di una porta LAN di dimensioni standard senza sportello o adattatore. C'è una porta USB-4 veloce e un totale di quattro porte USB flessibili, che le permettono di avere molte opzioni per le periferiche. È presente anche una porta HMDI.
D'altra parte, una sola porta USB-4 non è ottimale. Di solito si deve collegare la docking station a questa per accedere alle prestazioni complete del portatile. La seconda porta USB-C supporta almeno la ricarica e la DisplayPort, ma solo a un quarto della velocità di trasferimento che l'USB 4 può raggiungere. Inoltre, anche le altre due porte USB potrebbero essere un po' più veloci. Entrambe sono collegate tramite USB 3.0, che molti SSD ora superano facilmente.
Collegato alla docking station mentre è seduto sulla scrivania, questi piccoli difetti non dovrebbero essere troppo evidenti. Ma molti dei portatili Intel di fascia alta offrono opzioni di connettività migliori. In genere includono due porte TB4. Tuttavia, le porte USB-A veloci non sono comuni nemmeno qui.
Comunicazione
Le velocità di trasferimento del dispositivo sono un po' deboli quando si tratta di inviare, sia a 5 GHz che a 6 GHz. Tuttavia, le velocità di ricezione sono quelle attese per il Wi-Fi 6E. È molto meglio di quanto possa offrire un semplice cavo LAN. Inoltre, grazie all'ampliamento della gamma di frequenze, dovrebbe essere in grado di ottenere un'elevata velocità di trasferimento con reti wireless sovrapposte.
Webcam
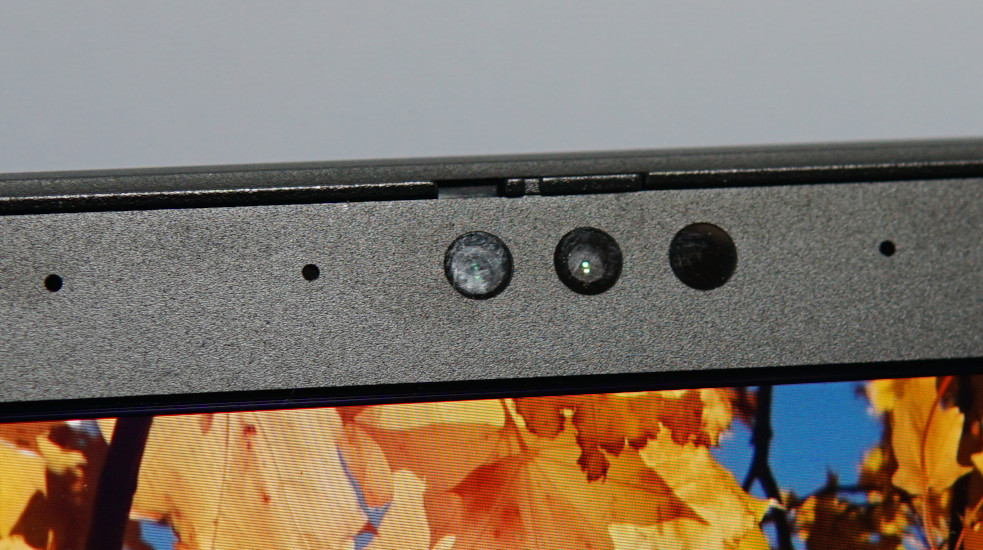
I suoi 5 MP da soli assicurano una buona qualità dell'immagine, il che significa che le persone all'altro capo della sua videochiamata su uno smartphone non saranno probabilmente in grado di capire che sta usando la webcam di un portatile, a differenza delle webcam HD che vengono spesso installate e che offrono una frazione della risoluzione.
Le deviazioni cromatiche molto elevate che abbiamo misurato derivano dal fatto che le immagini vengono schiarite automaticamente. E questo funziona molto bene. Anche in condizioni di scarsa luminosità, i volti rimangono riconoscibili. Allo stesso tempo, l'immagine diventa rapidamente piuttosto sgranata. Tuttavia, la fotocamera nella sua forma attuale è perfettamente adatta alle videoconferenze.
Ciò è dovuto anche all'ottimo microfono a doppio array, che registra le voci in modo molto accurato e con un volume costante, anche quando la distanza e la direzione del discorso variano durante la conversazione.
Un sensore IR rende possibile il riconoscimento facciale tramite Windows Hello e una copertura meccanica per bloccare l'obiettivo completa le caratteristiche della webcam.


Sicurezza
Non dovrebbe mancare nessuna funzione di sicurezza. Tutto è incluso, da una SmartCard a un lucchetto Kensington e alle funzioni di accesso biometrico. A tale scopo può utilizzare il sensore di impronte digitali o il riconoscimento facciale. A ciò si aggiungono extra come il BIOS auto-recuperante. Lenovo ha riassunto tutte queste funzioni sotto il termine "ThinkShield". Ulteriori informazioni sono disponibili su qui.
Accessori
Il portatile non viene fornito con adattatori aggiuntivi, una custodia o altro di questo tipo. Invece, è incluso solo un semplice alimentatore USB-C. Una nota positiva è che la confezione del ThinkPad è realizzata interamente in cartone riciclato.
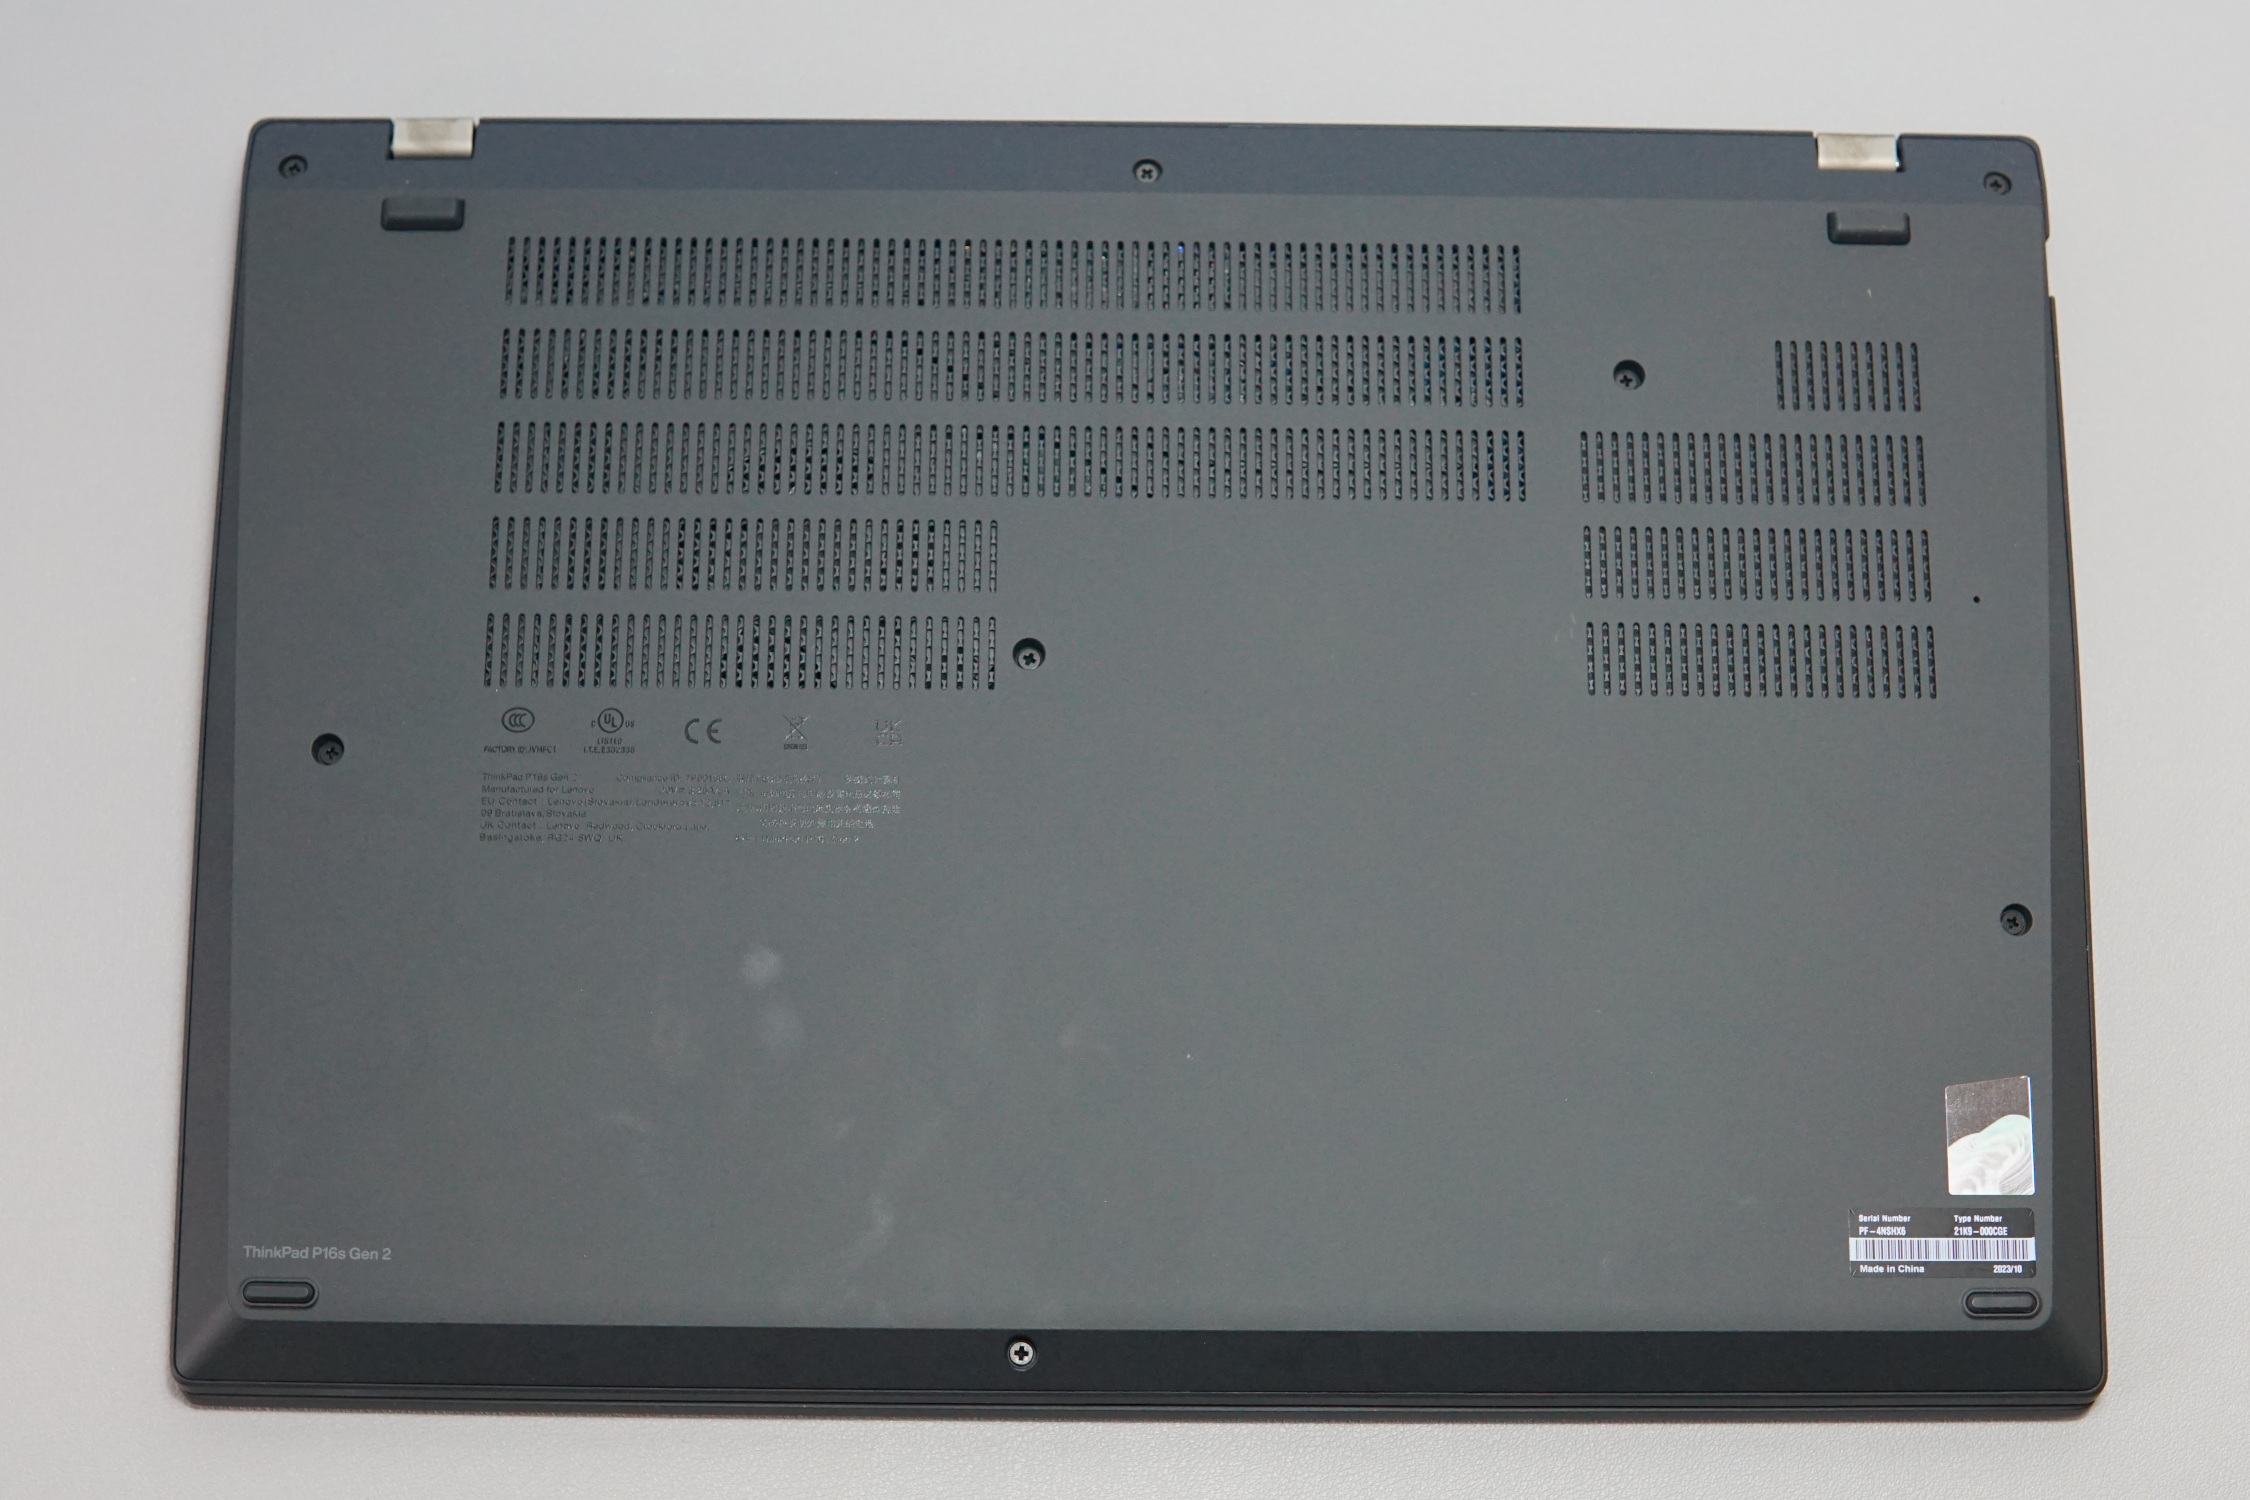
Manutenzione
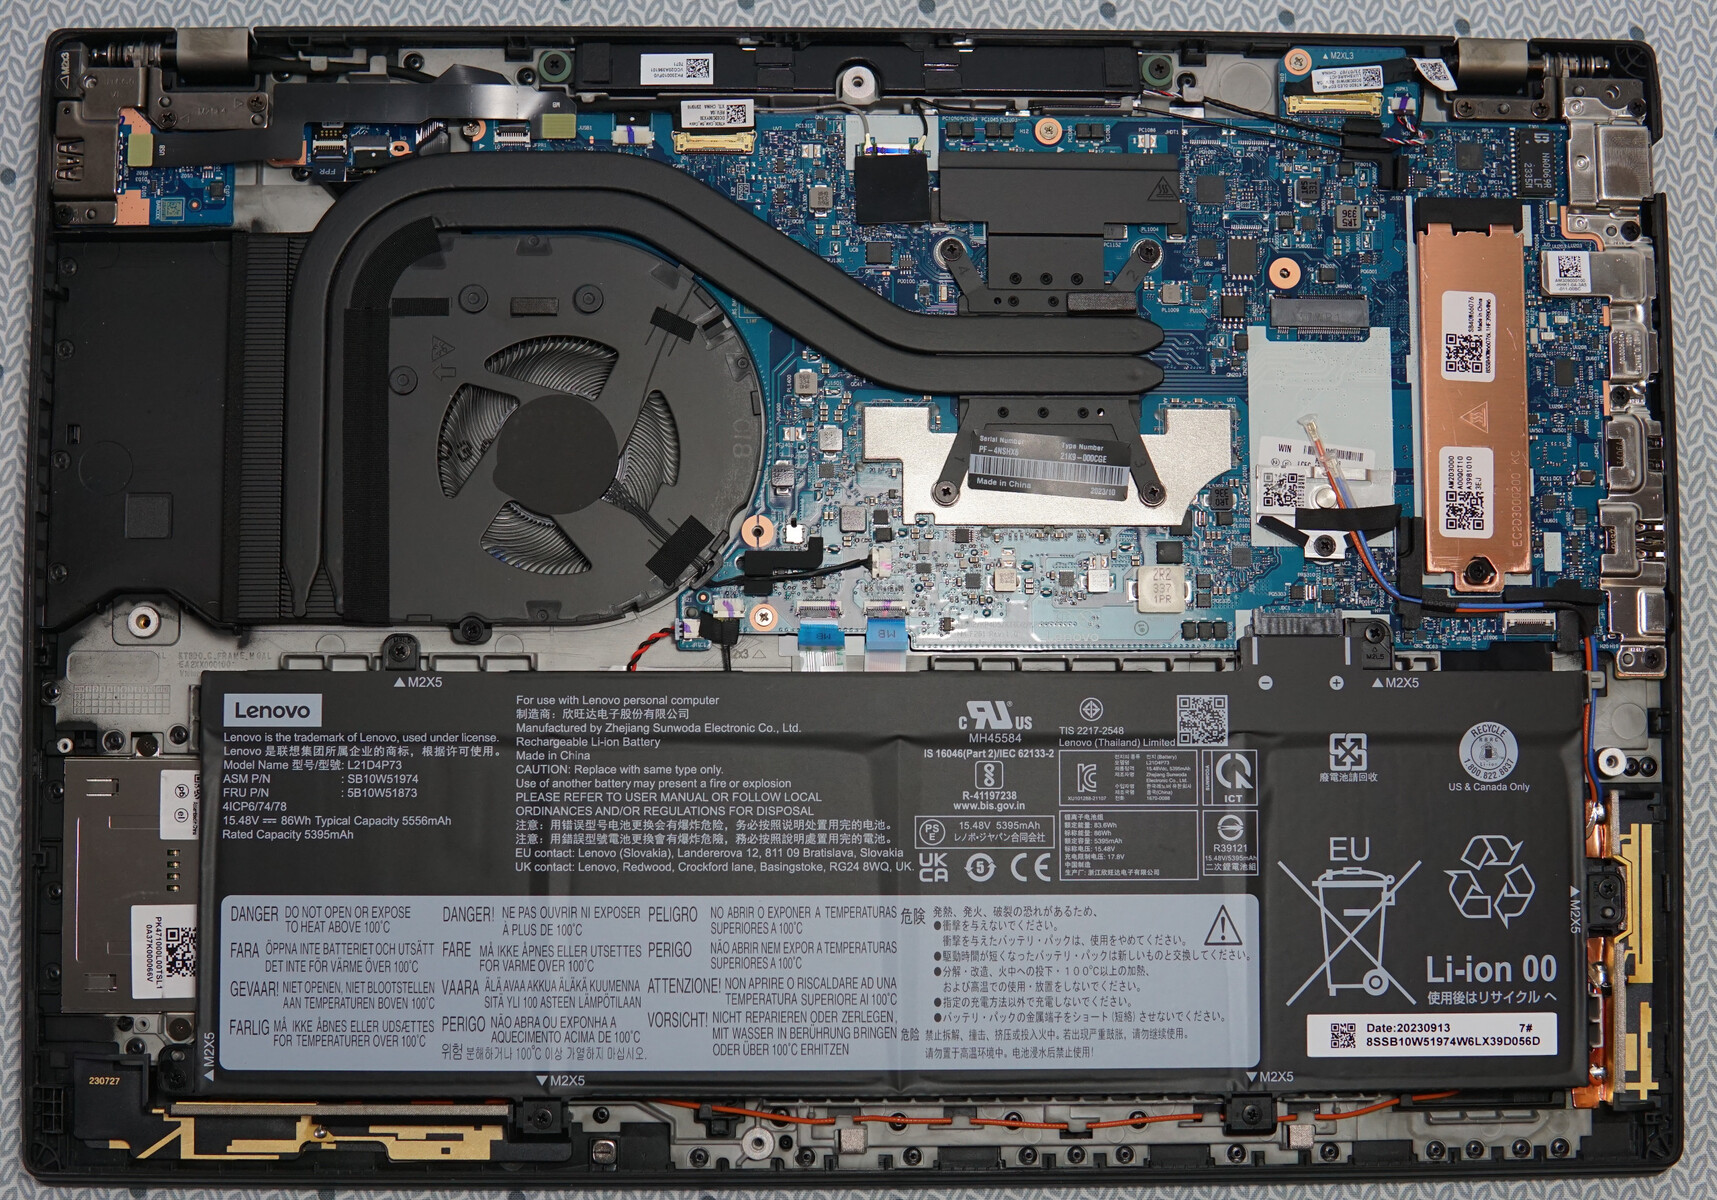
Come previsto, il ThinkPad P16s G2 AMD può essere aperto facilmente e senza problemi. Tutte le viti Phillips sono facilmente accessibili. Successivamente, è possibile rimuovere la parte inferiore del case con sufficiente pazienza e forza (ma senza doverla strattonare violentemente) - e idealmente con l'aiuto di un piccolo strumento di sollevamento.
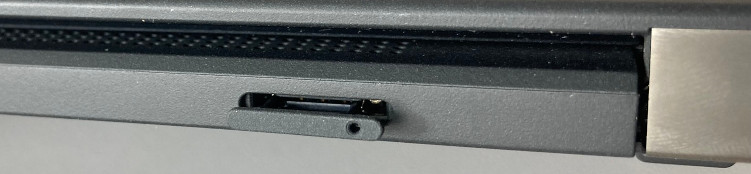
L'SSD NVMe-M.2 può essere sostituito. La batteria e le ventole sono accessibili senza problemi. Inoltre, è possibile installare un modulo 5G/LTE nel case. C'è spazio per questo, i cavi dell'antenna sono pronti per essere utilizzati e sul retro si trova uno slot per la scheda SIM.
Purtroppo, i moduli WLAN e RAM sono stati saldati. In particolare, in un laptop per workstation, si vorrebbe che la RAM fosse un po' più flessibile. Ciò significa che, al momento dell'acquisto, dovrebbe essere molto chiaro se desidera selezionare troppa RAM piuttosto che troppo poca.
Garanzia
Lenovo offre un anno di assistenza premium che copre anche le riparazioni in loco entro il giorno lavorativo successivo. Con un sovrapprezzo, è possibile estendere questa garanzia.
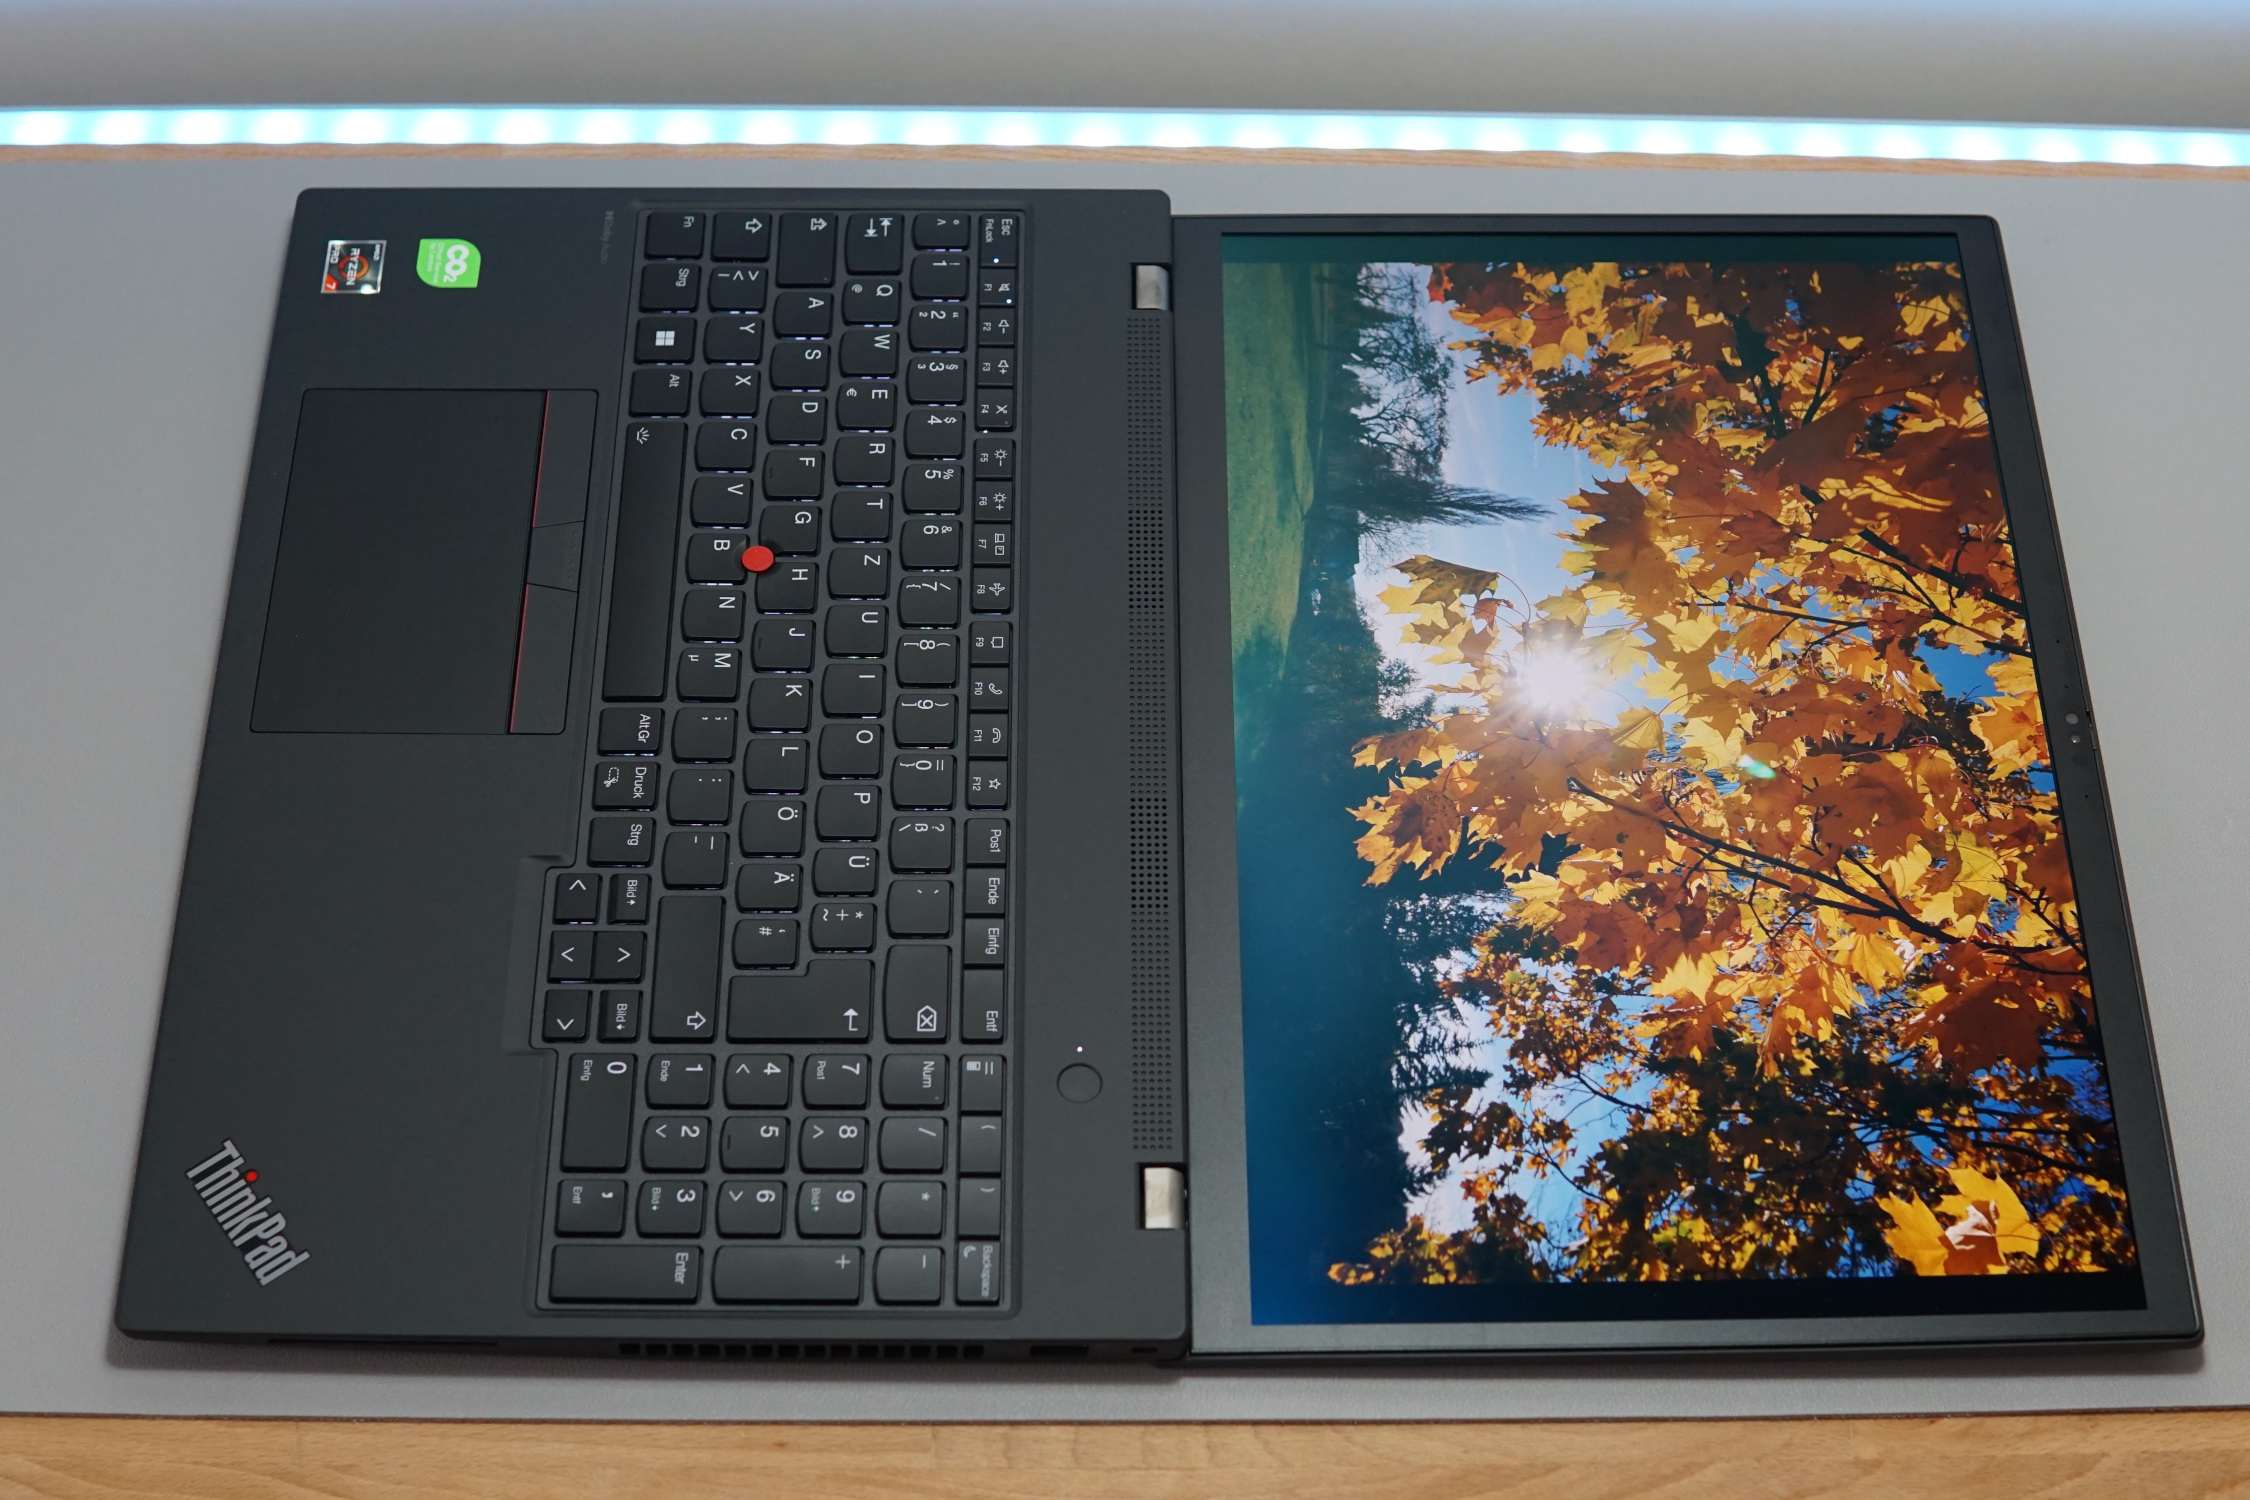
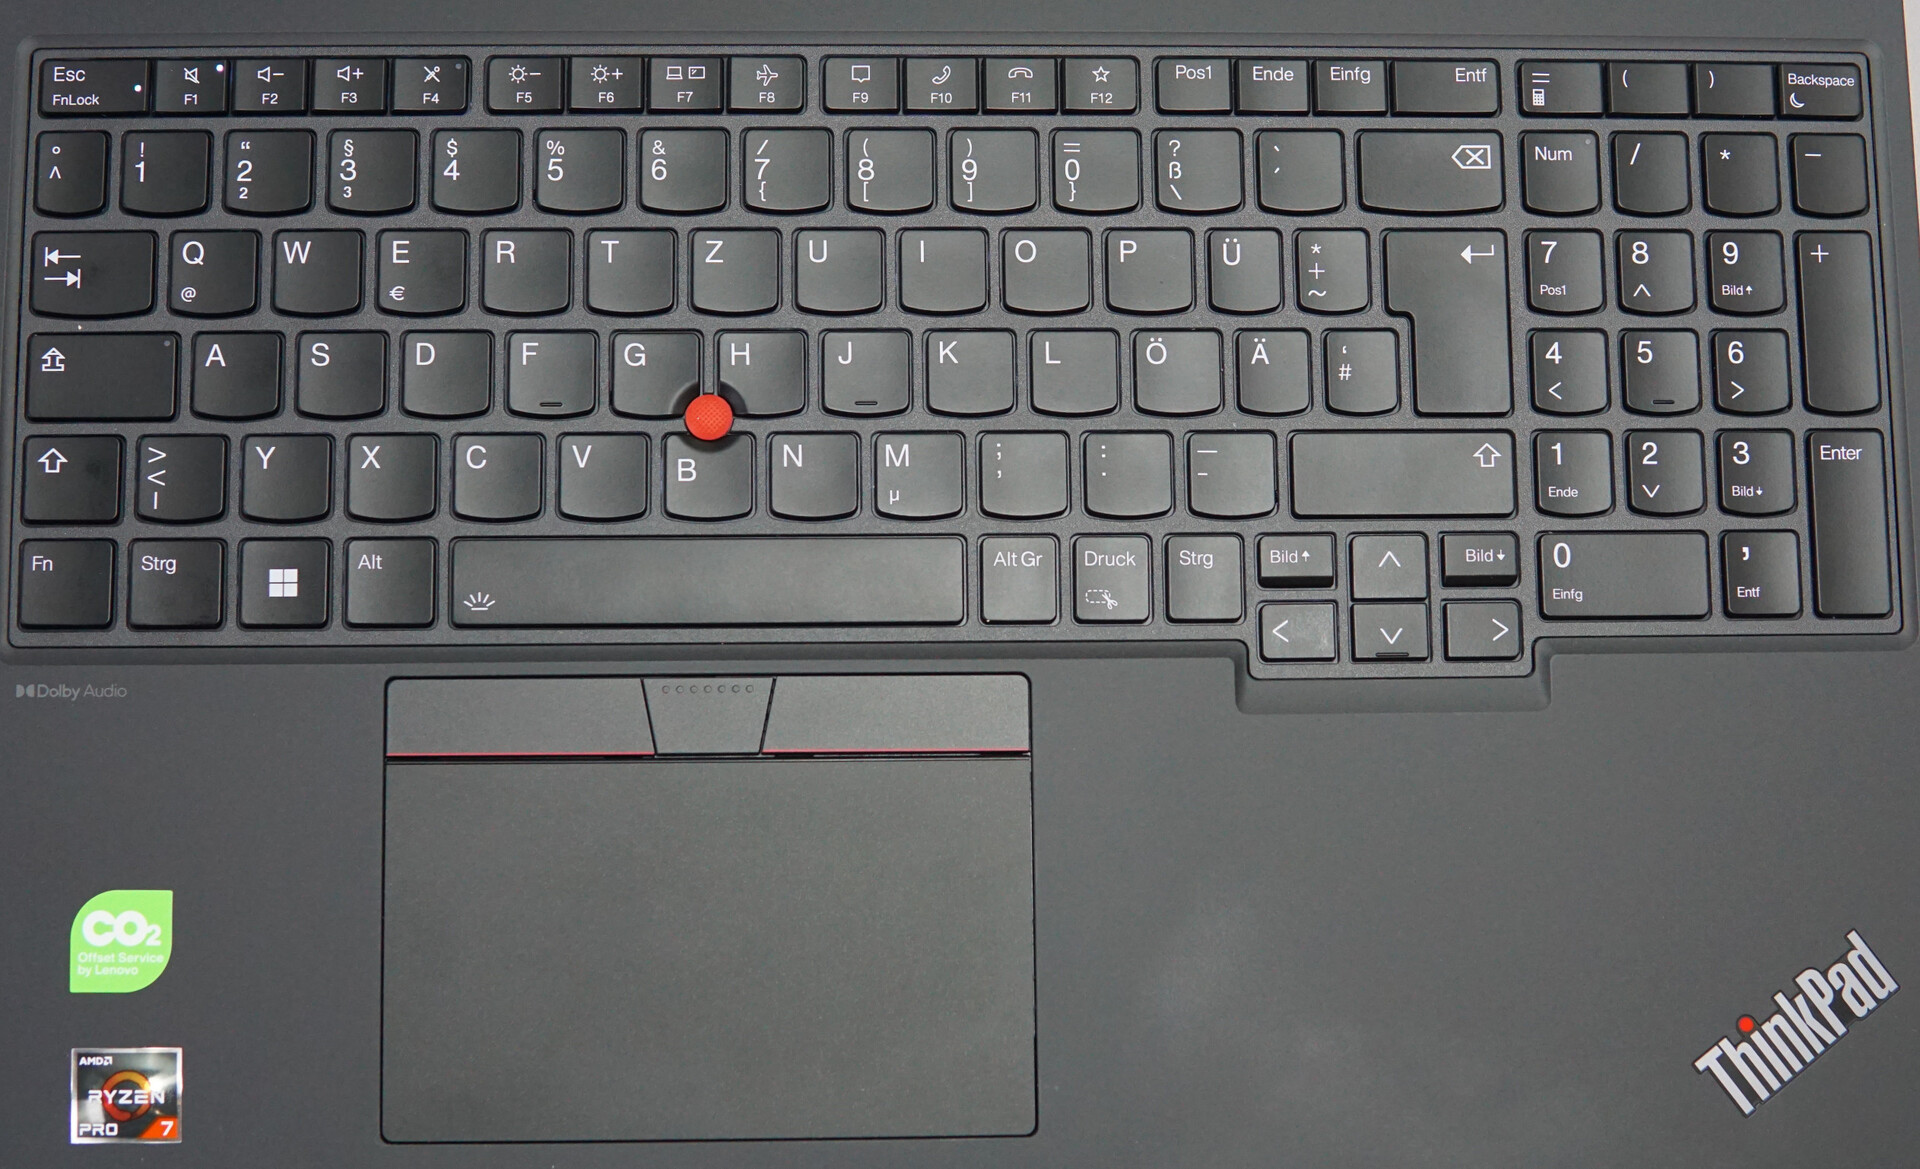
Dispositivi di input - Non è perfetta, ma è una tastiera solida per una workstation
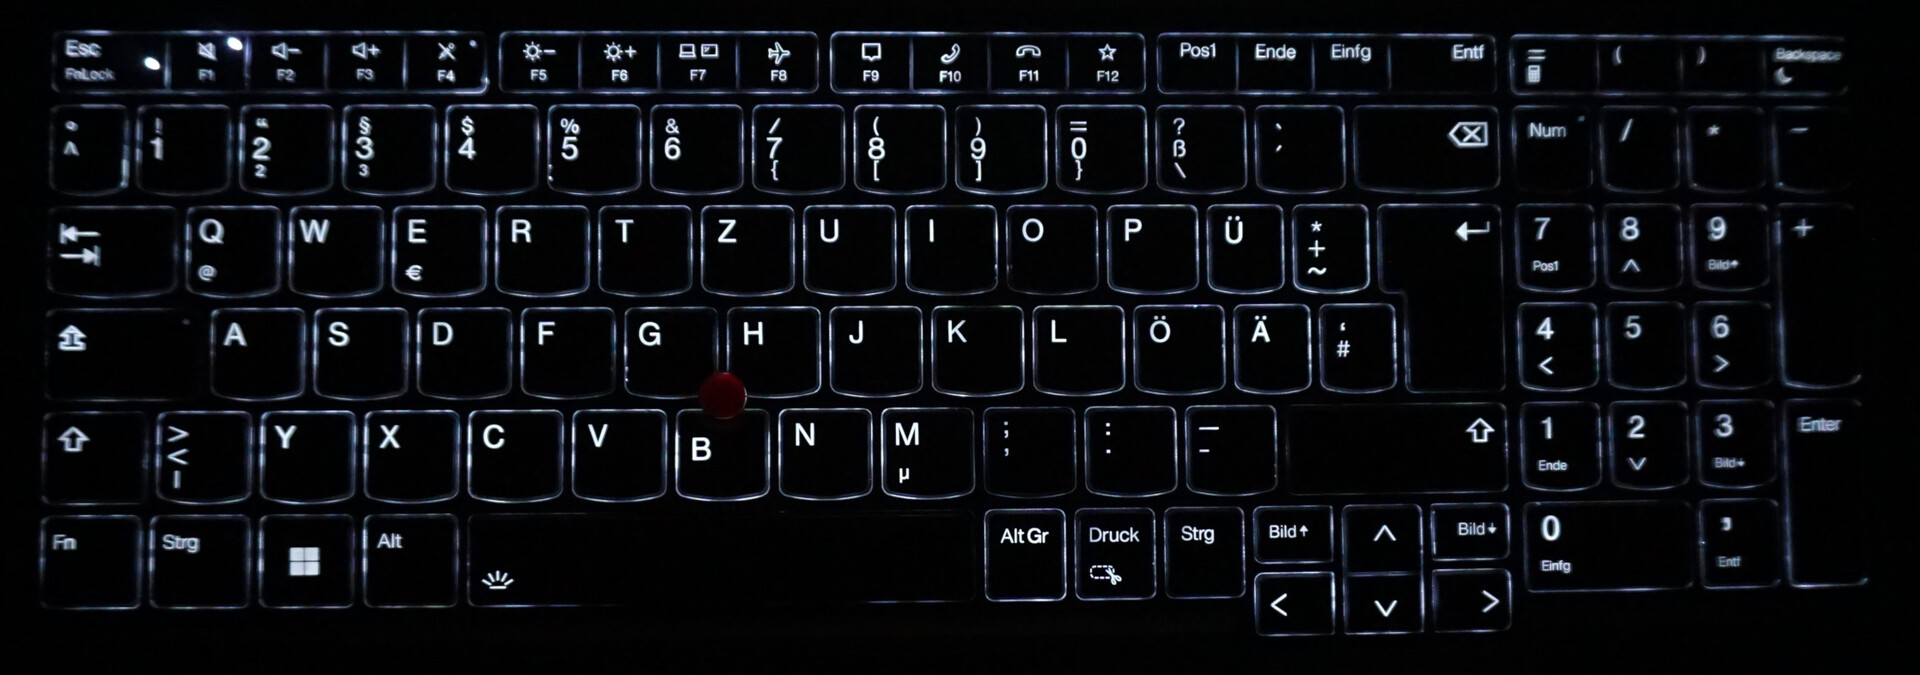
La tastiera, il touchpad e il trackpoint meritano un elogio. I punti di pressione soddisfacenti, la resistenza confortevole dei tasti e la precisione degli input rendono il funzionamento fluido e veloce. Probabilmente non dovrà fare i conti con l'affaticamento durante la digitazione o con la necessità di fare triplo clic per controllare il puntatore. Inoltre, la retroilluminazione della tastiera, che ha due livelli di luminosità, mantiene i tasti sempre leggibili.
Tuttavia, non può sfuggire a tutte le critiche. Il suo sollevamento di 1,5 mm (la nostra misurazione) non è molto grande e lo si nota sicuramente durante la digitazione se si è abituati a un sollevamento molto più elevato. Inoltre, il telaio della tastiera, che come tutti gli altri componenti del case è realizzato in plastica, ha un po' di cedimento. Lo si nota più sul lato destro che su quello sinistro. Tuttavia, ci si abitua e questi problemi non dovrebbero essere d'intralcio. Tuttavia, ciò significa che non possiamo darle il massimo dei voti.
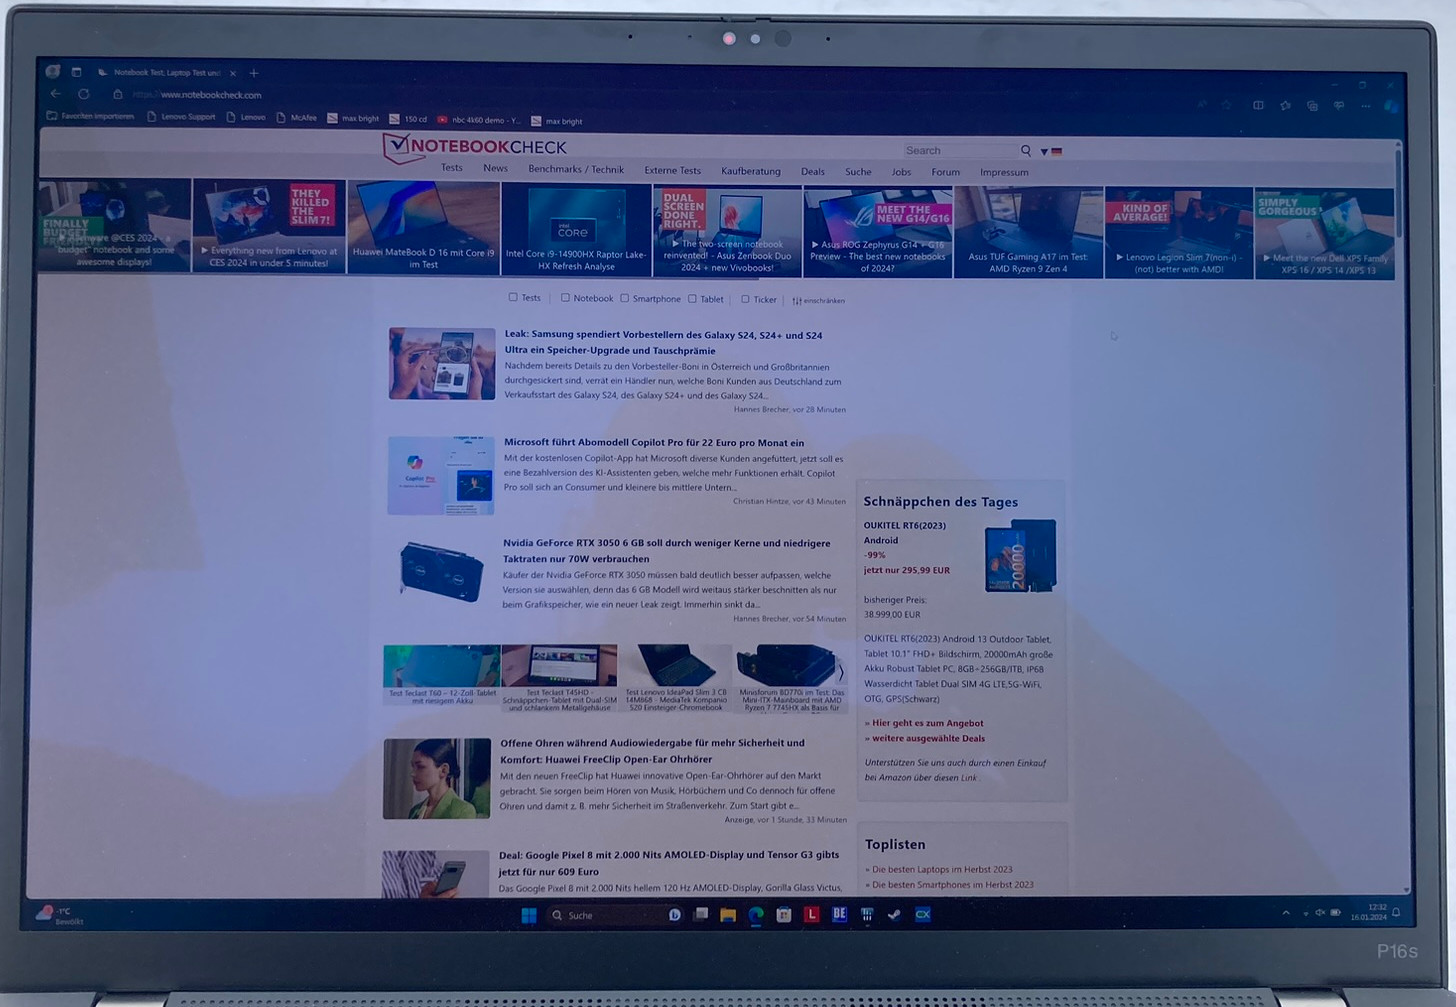
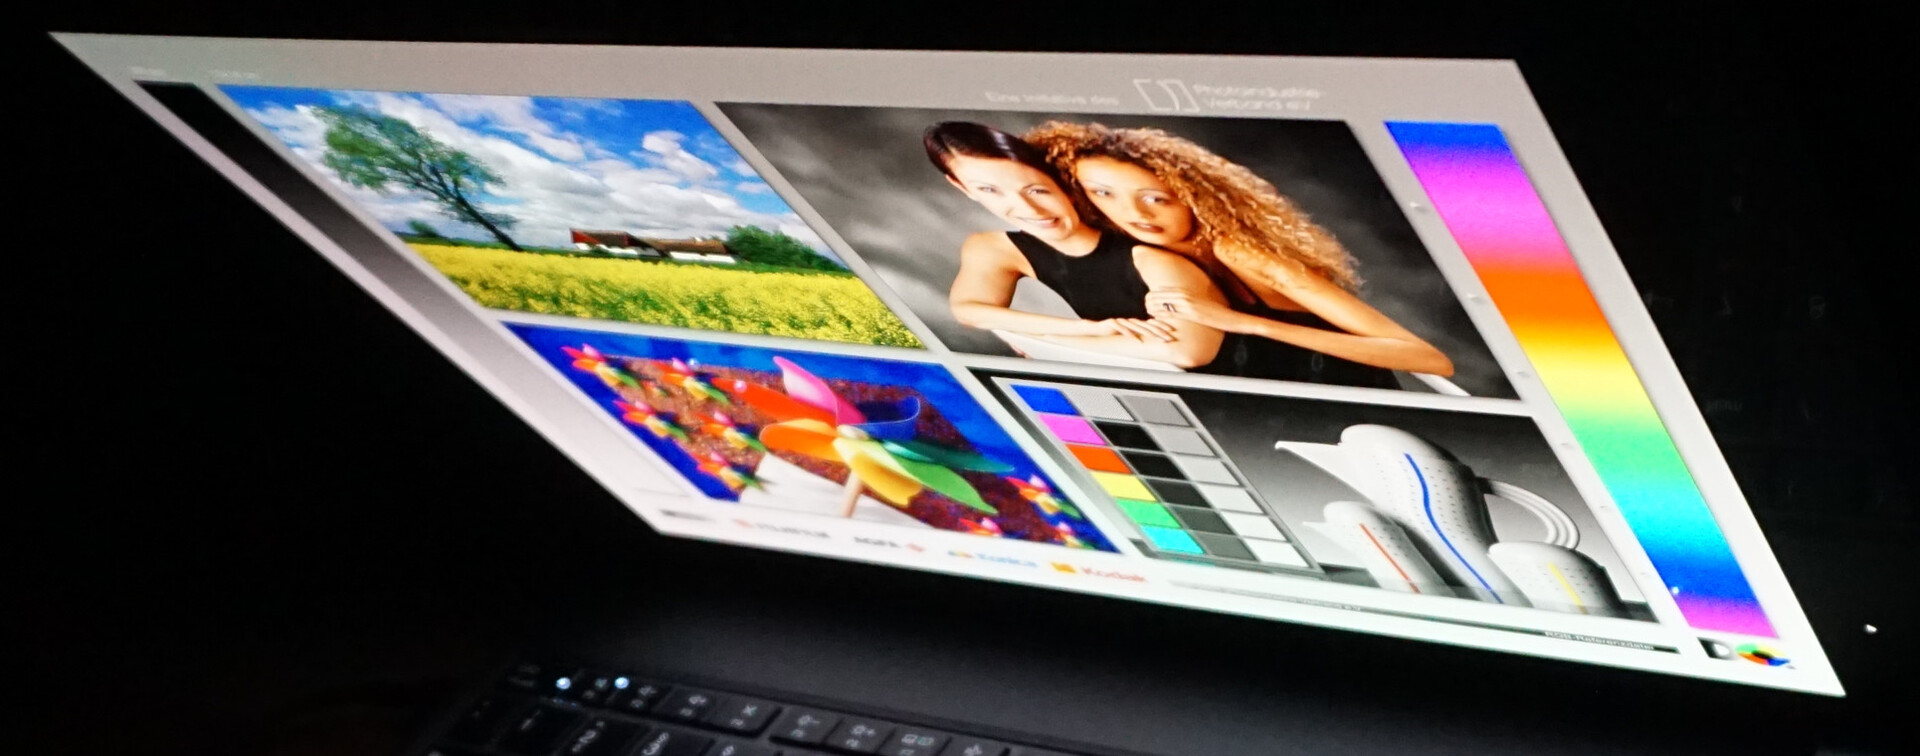
Display - Il P16s ha un display OLED vivido e luminoso
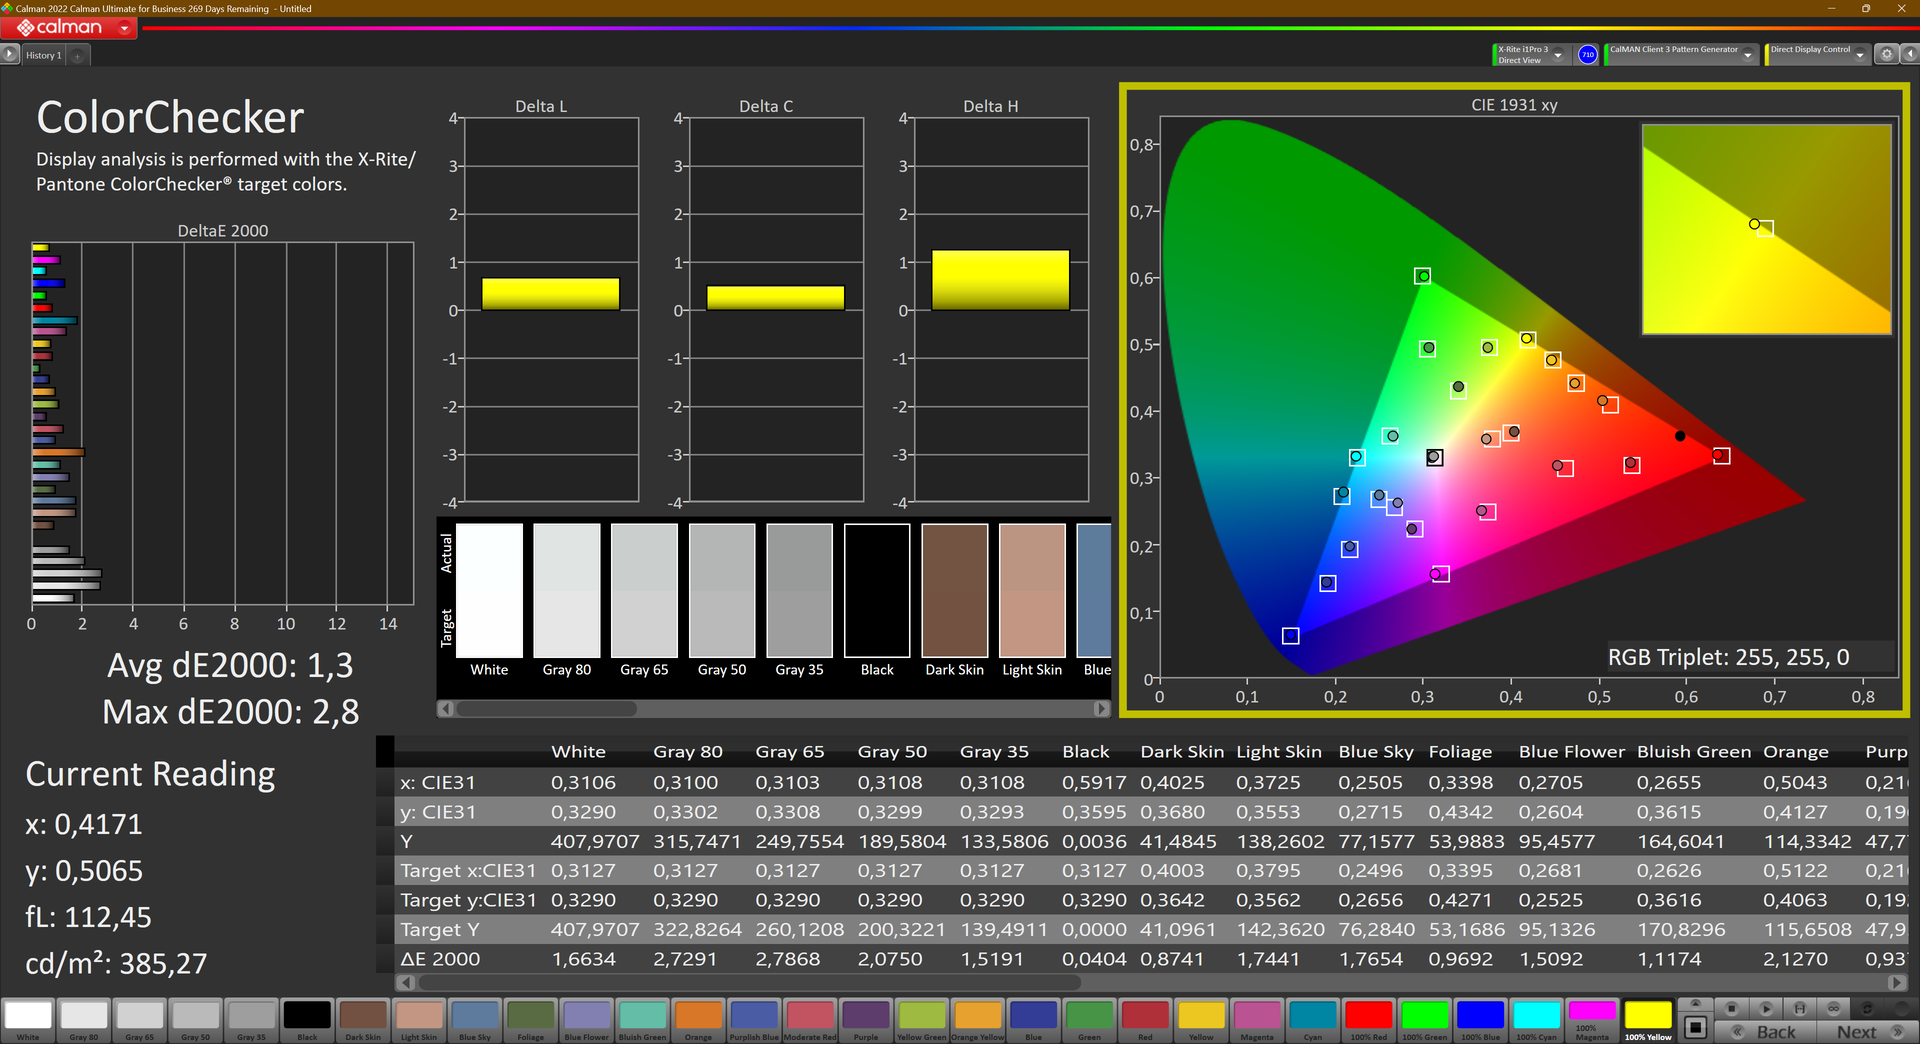
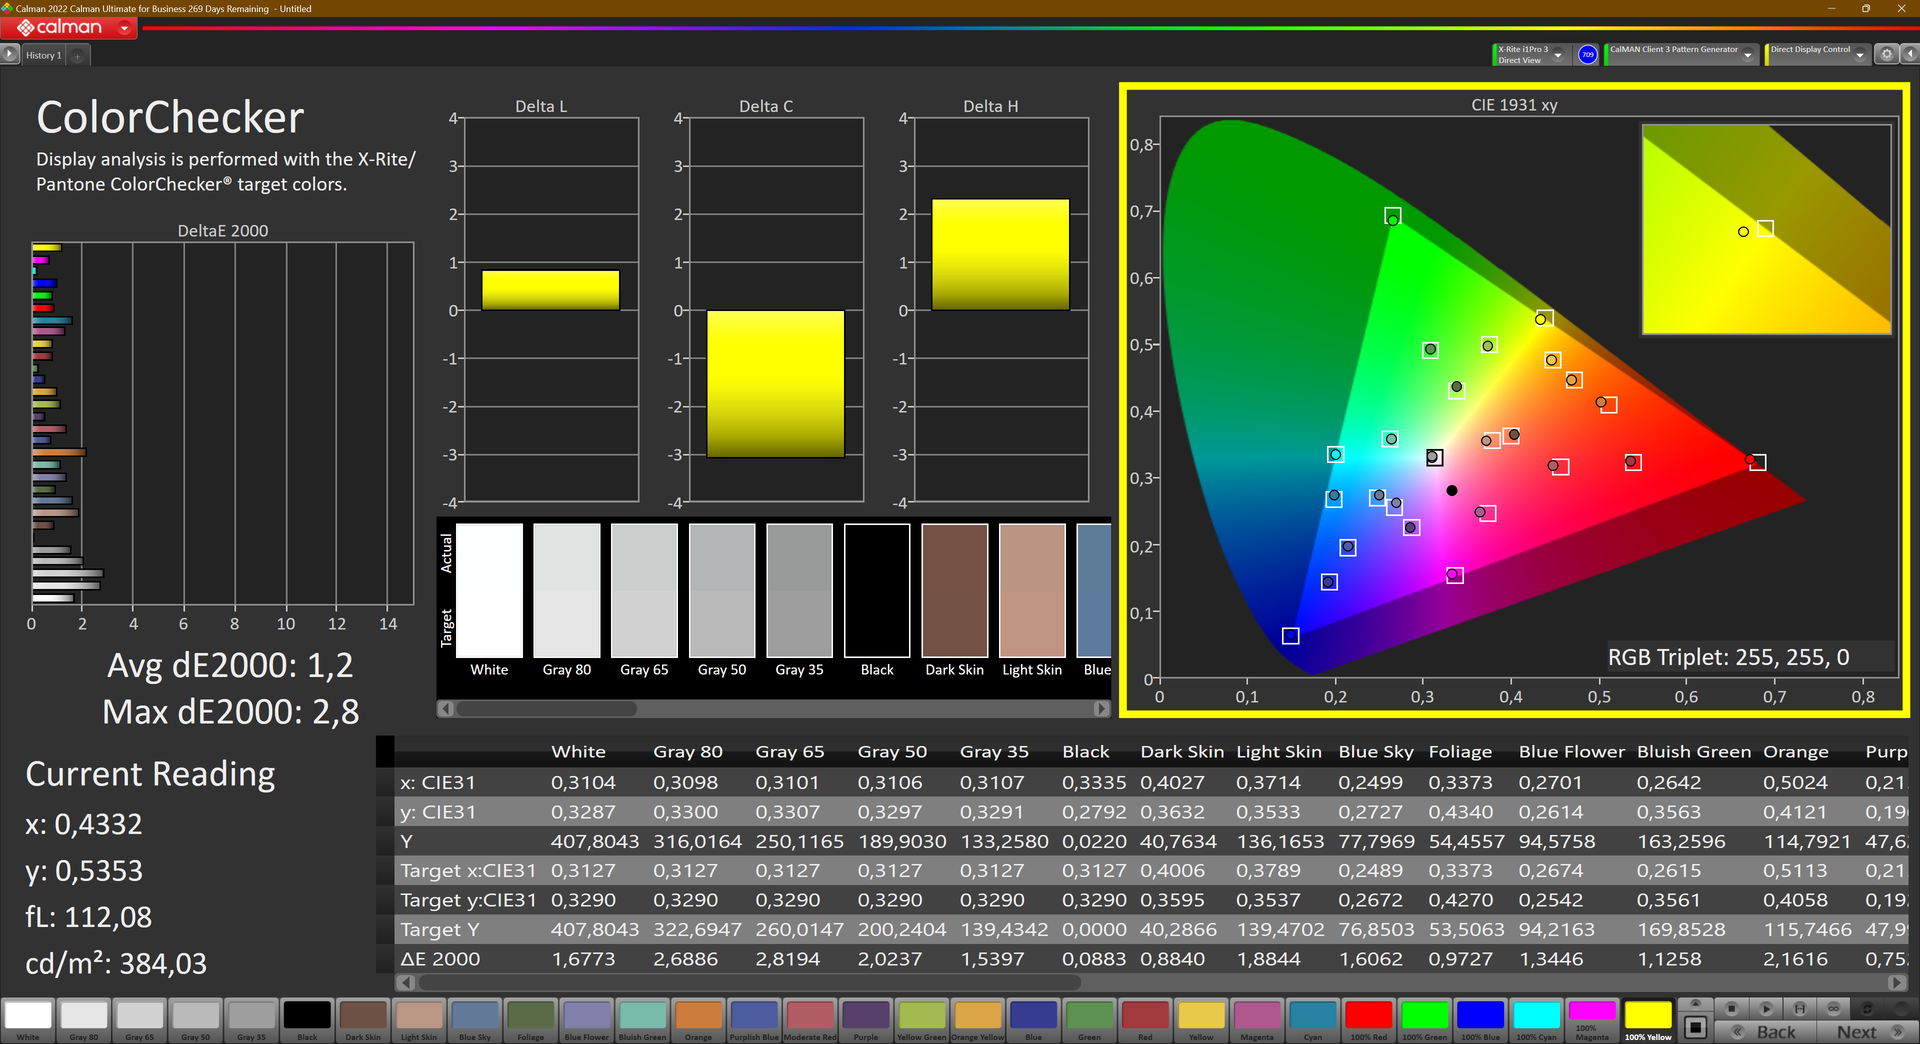
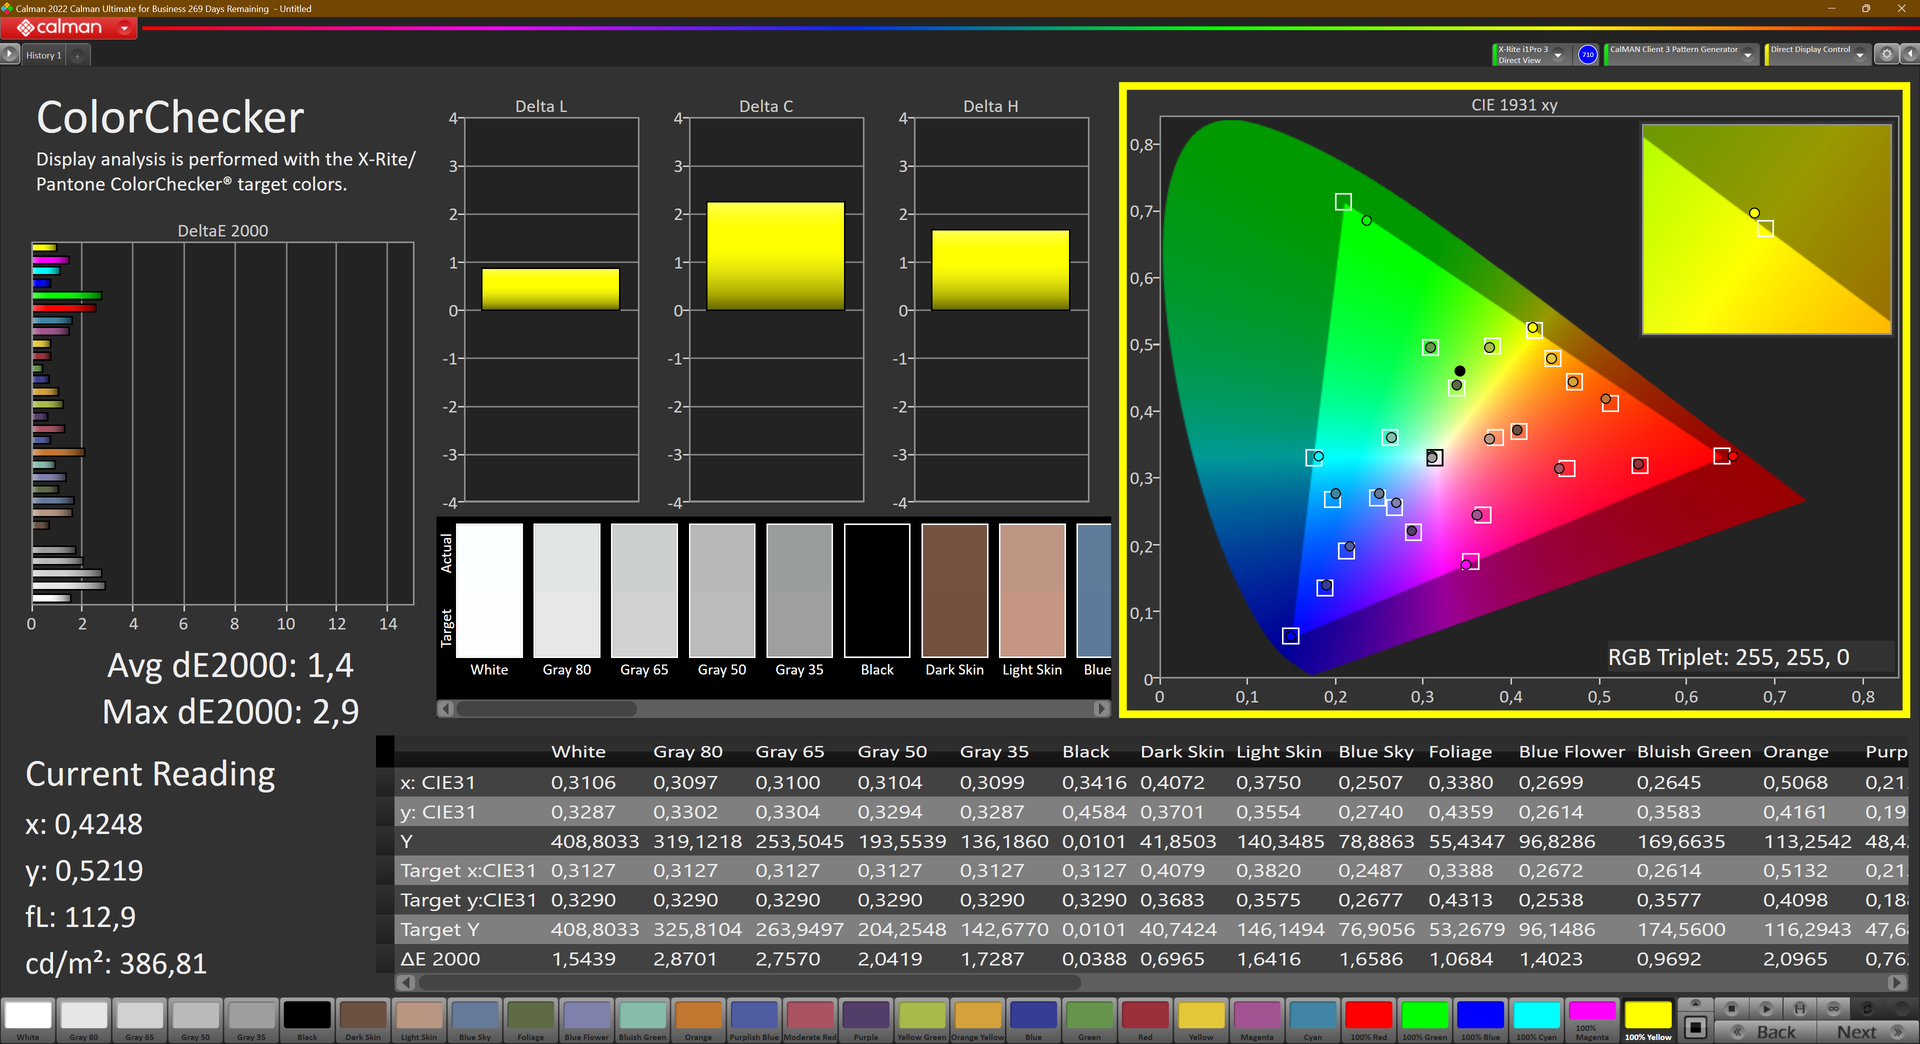
Il display OLED installato non dovrebbe essere interessante solo per i lavori creativi. Anche se la sua risoluzione 4K che, in teoria, copre lo spazio colore Display P3 nella sua interezza e assicura un forte contrasto e accuratezza del colore, è chiaramente un buon inizio per le applicazioni grafiche esigenti.
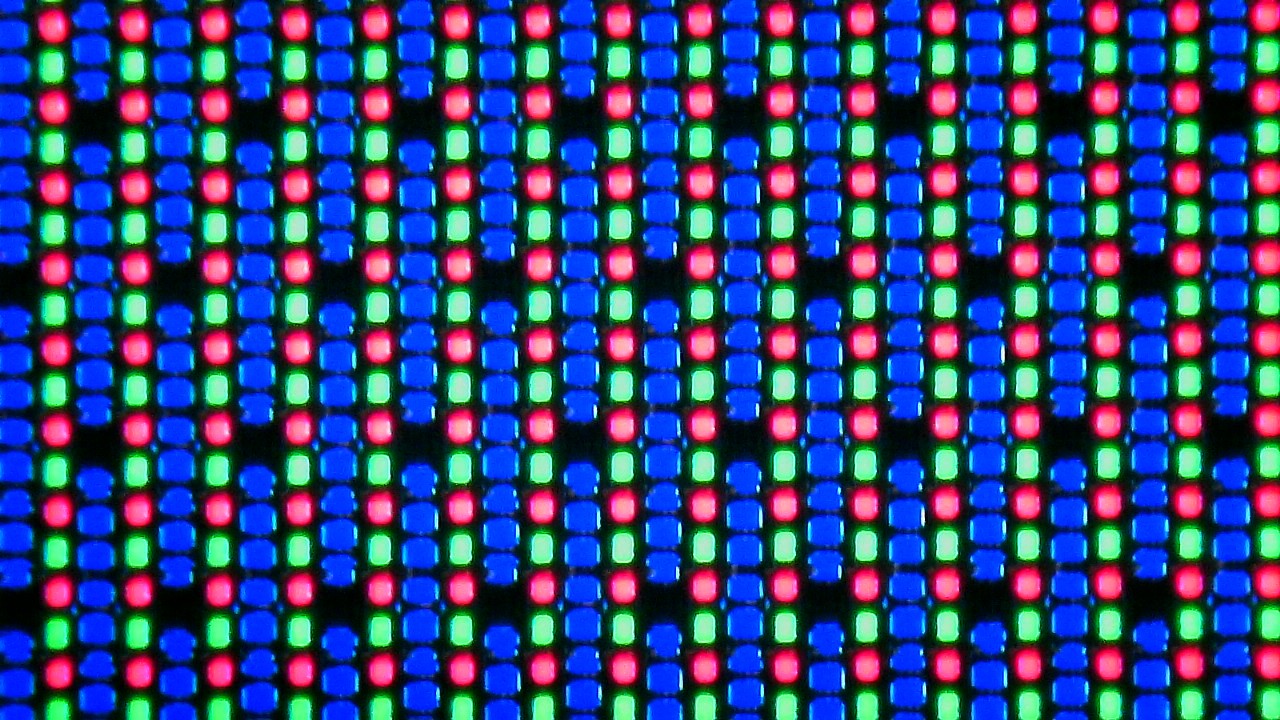
Anche solo in generale, i contenuti appaiono intensi e radiosi sullo schermo del portatile. Il testo, che a volte viene visualizzato in modo poco pulito, è compensato dalla risoluzione estremamente elevata. I subpixel non strutturati in modo uniforme a volte danno luogo a bordi sfocati. Ingrandendo il testo al valore consigliato del 175%, questo problema non si nota.
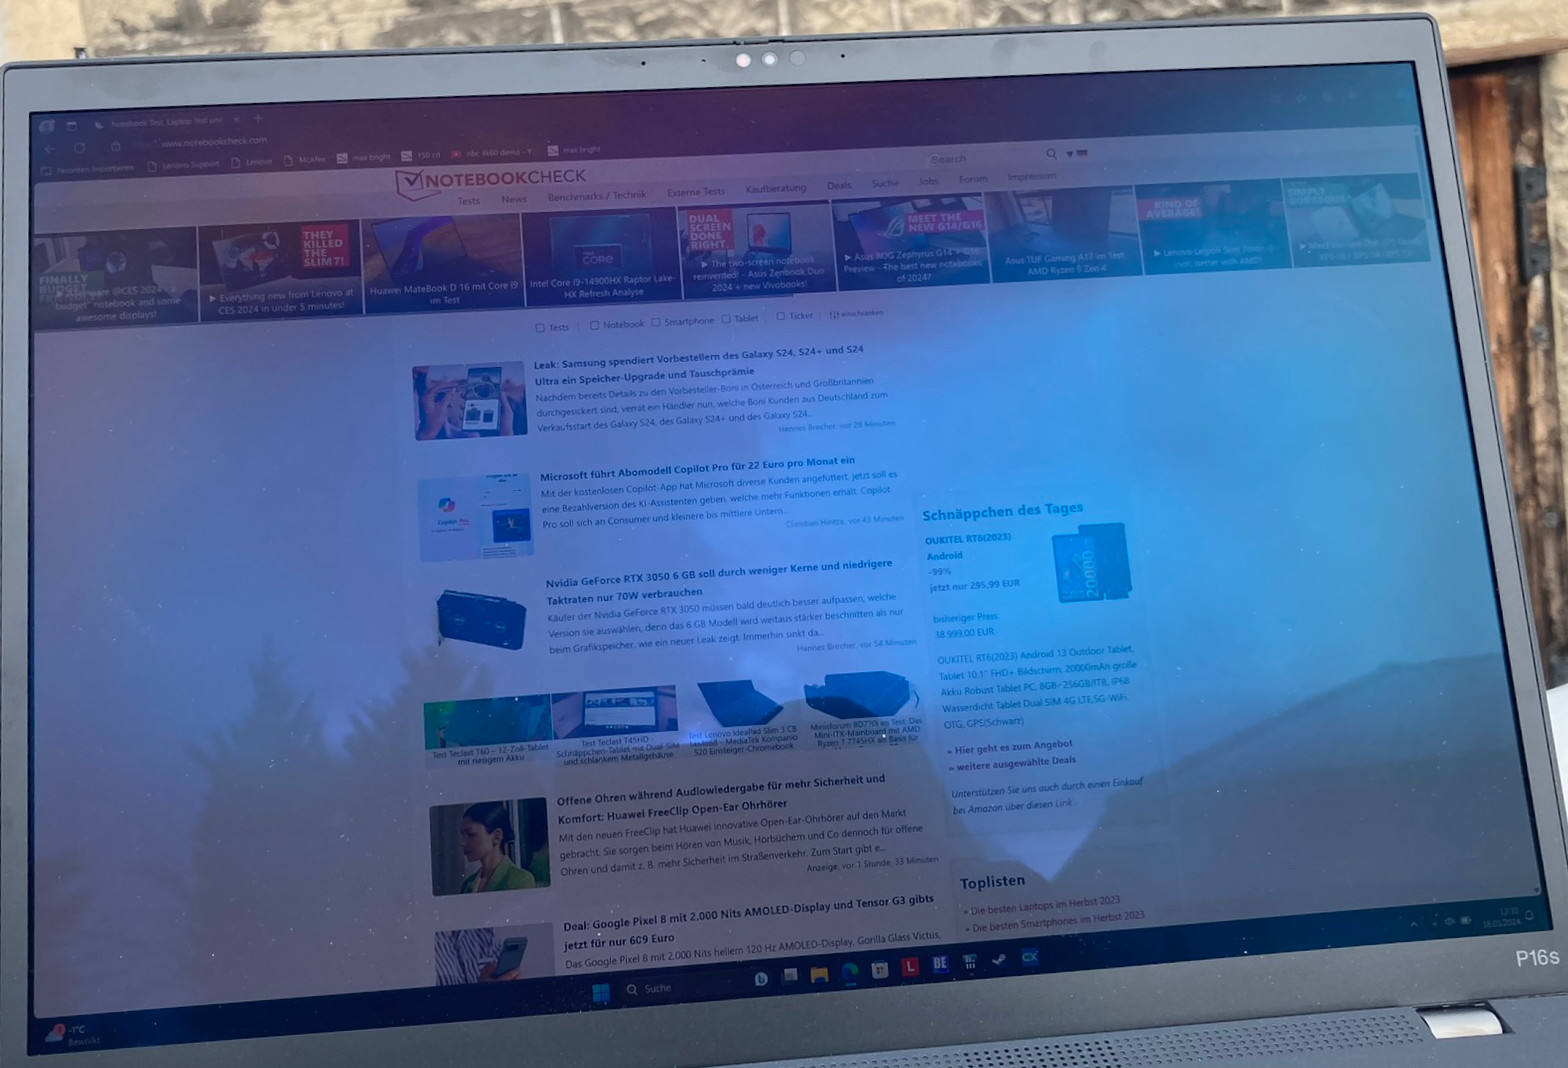
Per quanto riguarda la rappresentazione accurata dei colori del display, bisogna tenere conto della sua superficie riflettente: non è l'ideale quando si utilizza il dispositivo all'esterno. All'interno, i livelli di contrasto elevati dello schermo compensano questo problema.
Inoltre, il display OLED utilizza un tipo di modulazione di larghezza di impulso. Non è assolutamente aggressiva come quella di alcuni vecchi monitor LCD. Tuttavia, potrebbe notarla leggermente, dato che la frequenza che abbiamo misurato ad alta luminosità mostrava solo 60 Hz.
Per gli utenti sensibili, consigliamo una delle tante altre opzioni di display che utilizzano pannelli IPS e, a loro volta, non utilizzano il PWM:
- WUXGA (1920x1200), IPS, 300nits, Antiriflesso, 16:10, 800:1, 45% NTSC
- WUXGA (1920x1200), Multi-touch, IPS, 300 nit, Antiriflesso, 16:10, 800:1, 45% NTSC
- WUXGA (1920x1200), IPS, 400 nit, Antiriflesso, 16:10, 1000:1, 100% sRGB
- WUXGA (1920x1200), Multi-touch, IPS, 500 nits, Antiriflesso, 16:10, 1000:1, 100% sRGB
| |||||||||||||||||||||||||
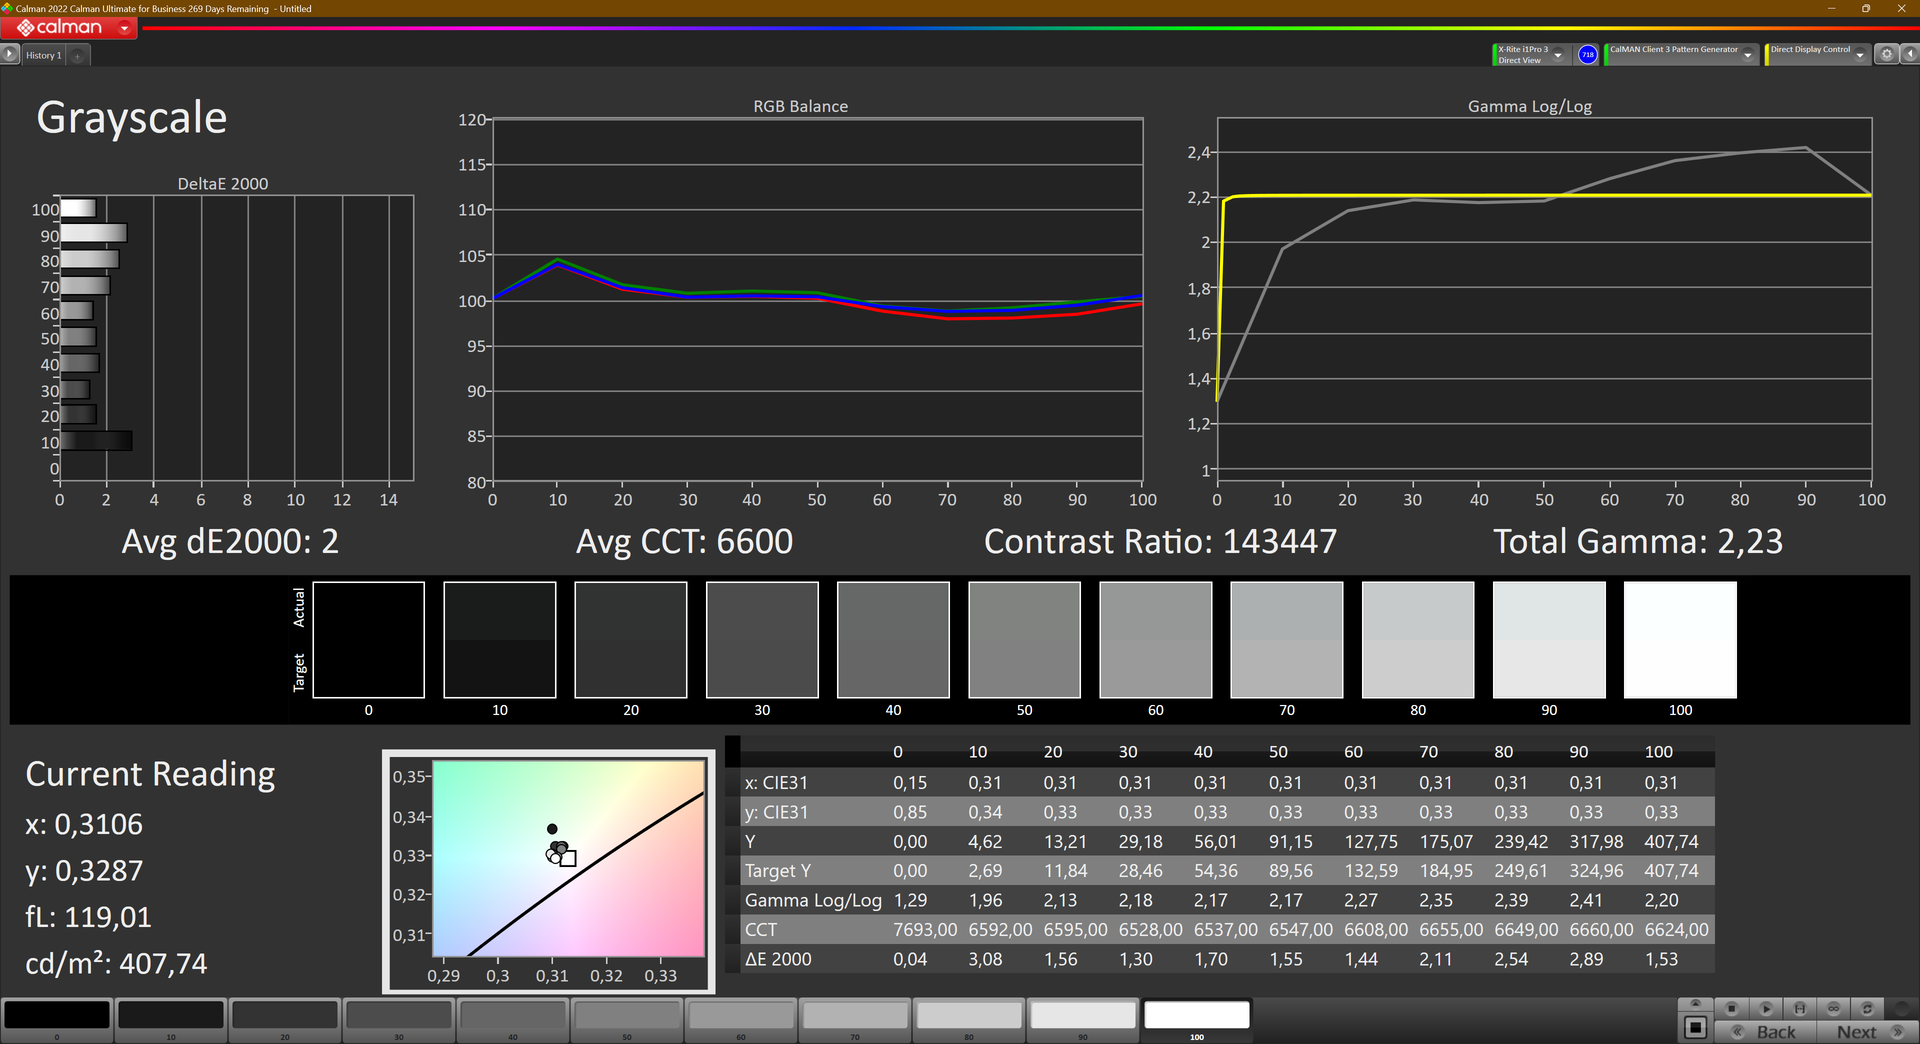
Distribuzione della luminosità: 98 %
Al centro con la batteria: 417 cd/m²
Contrasto: ∞:1 (Nero: 0 cd/m²)
ΔE ColorChecker Calman: 1.3 | ∀{0.5-29.43 Ø4.71}
calibrated: 2.9
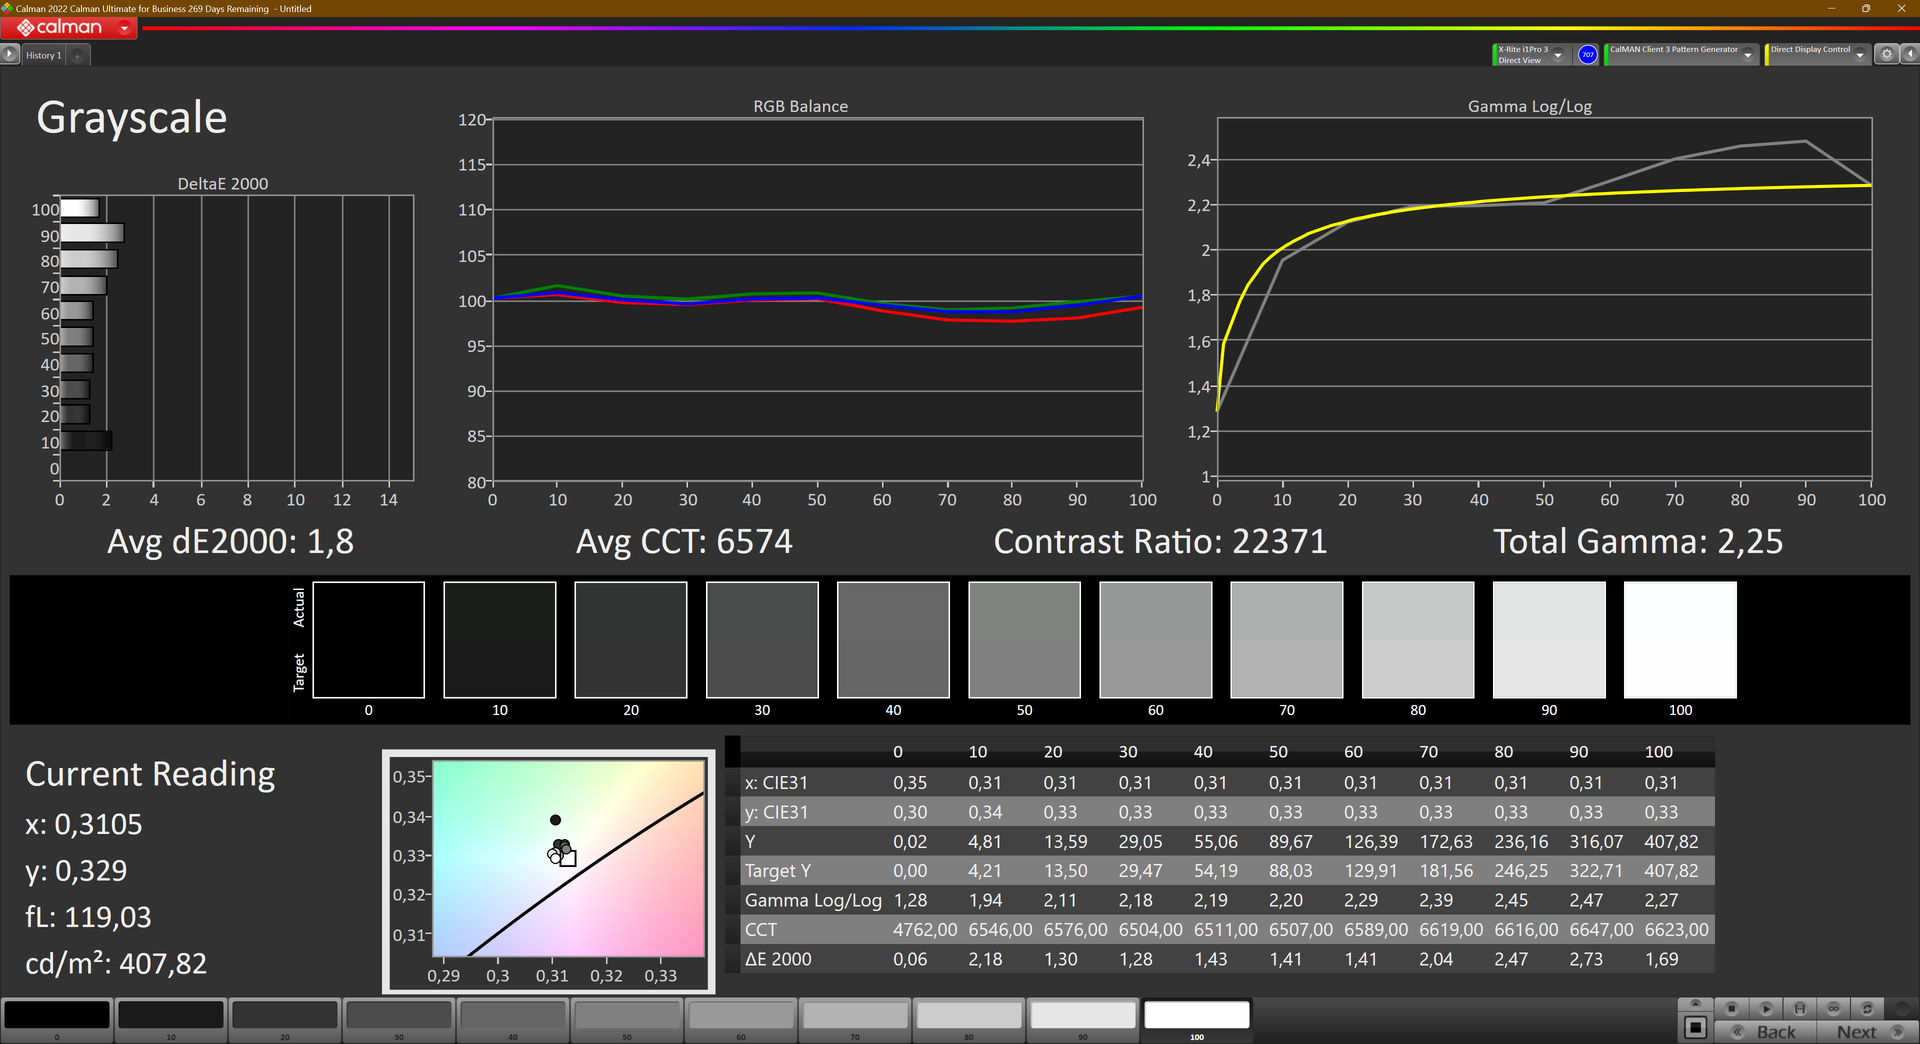
ΔE Greyscale Calman: 1.8 | ∀{0.09-98 Ø4.96}
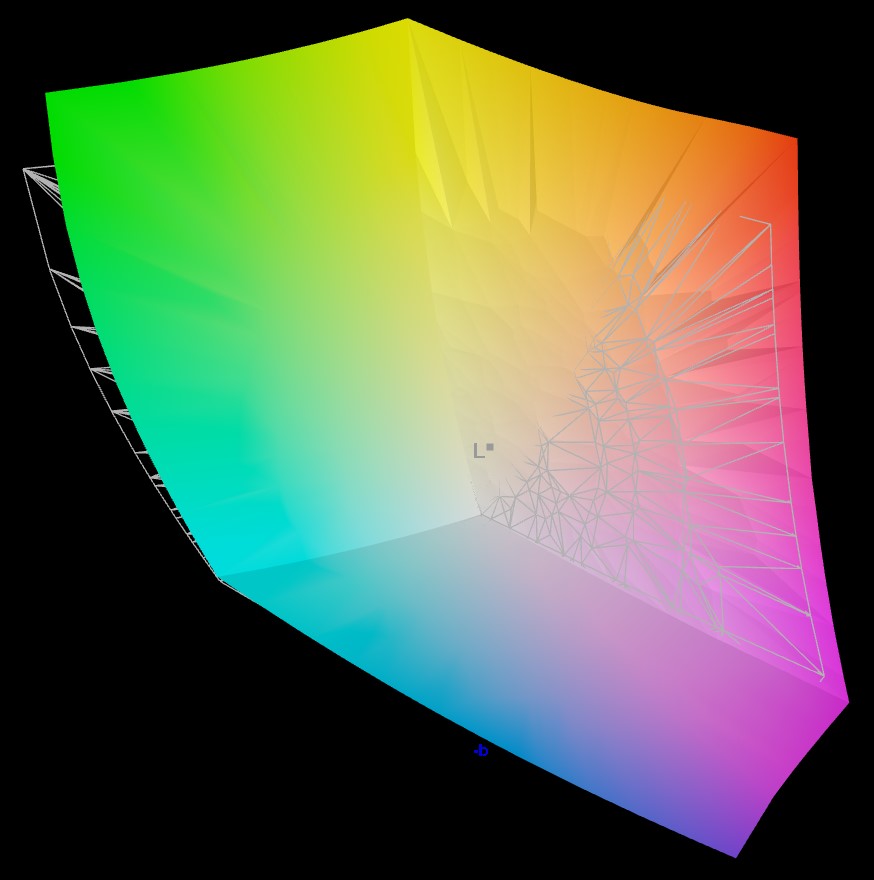
96.9% AdobeRGB 1998 (Argyll 3D)
100% sRGB (Argyll 3D)
99.9% Display P3 (Argyll 3D)
Gamma: 2.25
CCT: 6574 K
| Lenovo ThinkPad P16s G2 21K9000CGE ATNA60YV04-0, OLED, 3840x2400, 16" | HP EliteBook 845 G10 818N0EA AUO6DA8, IPS, 2560x1600, 14" | Lenovo ThinkPad P14s G4 21K5000LGE Lenovo MNE007JA1-1, IPS, 1920x1200, 14" | Schenker Vision 16 PH6PRX1 BOE CQ NE160QDM-NZ1 , IPS, 2560x1600, 16" | Acer Swift Edge SFE16 Ryzen 7 7840U Samsung ATNA60BX03-0, OLED, 3200x2000, 16" | Lenovo ThinkPad P16v G1 AMD NE160WUM-N64, IPS, 1920x1200, 16" | Microsoft Surface Laptop Studio 2 RTX 4060 LQ144P1JX01, IPS, 2400x1600, 14.4" | |
|---|---|---|---|---|---|---|---|
| Display | -4% | -19% | -19% | 1% | -21% | -21% | |
| Display P3 Coverage (%) | 99.9 | 98.3 -2% | 69.4 -31% | 70 -30% | 99.9 0% | 67.8 -32% | 66.7 -33% |
| sRGB Coverage (%) | 100 | 99.8 0% | 99.9 0% | 99.3 -1% | 100 0% | 97.7 -2% | 99 -1% |
| AdobeRGB 1998 Coverage (%) | 96.9 | 86.2 -11% | 71.4 -26% | 71.2 -27% | 100 3% | 69.8 -28% | 68.9 -29% |
| Response Times | -628% | -2611% | -574% | 43% | -2587% | -3806% | |
| Response Time Grey 50% / Grey 80% * (ms) | 1.5 ? | 12.7 ? -747% | 45.9 ? -2960% | 11 ? -633% | 0.57 ? 62% | 50.6 ? -3273% | 77.6 ? -5073% |
| Response Time Black / White * (ms) | 1.3 ? | 7.9 ? -508% | 30.7 ? -2262% | 8 ? -515% | 1 ? 23% | 26 ? -1900% | 34.3 ? -2538% |
| PWM Frequency (Hz) | 60 | 238.8 | 17600 ? | ||||
| Screen | 9% | -11% | 3% | -44% | -51% | 35% | |
| Brightness middle (cd/m²) | 416 | 546 31% | 414 0% | 356 -14% | 379.8 -9% | 355 -15% | 511 23% |
| Brightness (cd/m²) | 421 | 564 34% | 392 -7% | 349 -17% | 383 -9% | 344 -18% | 503 19% |
| Brightness Distribution (%) | 98 | 86 -12% | 89 -9% | 93 -5% | 98 0% | 92 -6% | 89 -9% |
| Black Level * (cd/m²) | 0.38 | 0.26 | 0.28 | 0.17 | 0.26 | ||
| Colorchecker dE 2000 * | 1.3 | 1.3 -0% | 1.9 -46% | 1.7 -31% | 4.7 -262% | 2.9 -123% | 0.5 62% |
| Colorchecker dE 2000 max. * | 2.8 | 5.3 -89% | 3.6 -29% | 3 -7% | 7.51 -168% | 5.6 -100% | 1.1 61% |
| Colorchecker dE 2000 calibrated * | 2.9 | 1.2 59% | 0.8 72% | 1 66% | 0.55 81% | 1 66% | |
| Greyscale dE 2000 * | 1.8 | 1.1 39% | 2.9 -61% | 1.3 28% | 0.8 56% | 4.7 -161% | 0.8 56% |
| Gamma | 2.25 98% | 2.27 97% | 2.26 97% | 2.1 105% | 2.22 99% | 2.12 104% | 2.19 100% |
| CCT | 6574 99% | 6463 101% | 6227 104% | 6625 98% | 6381 102% | 6356 102% | 6650 98% |
| Contrast (:1) | 1437 | 1592 | 1271 | 2088 | 1965 | ||
| Media totale (Programma / Settaggio) | -208% /
-101% | -880% /
-447% | -197% /
-99% | 0% /
-19% | -886% /
-466% | -1264% /
-678% |
* ... Meglio usare valori piccoli
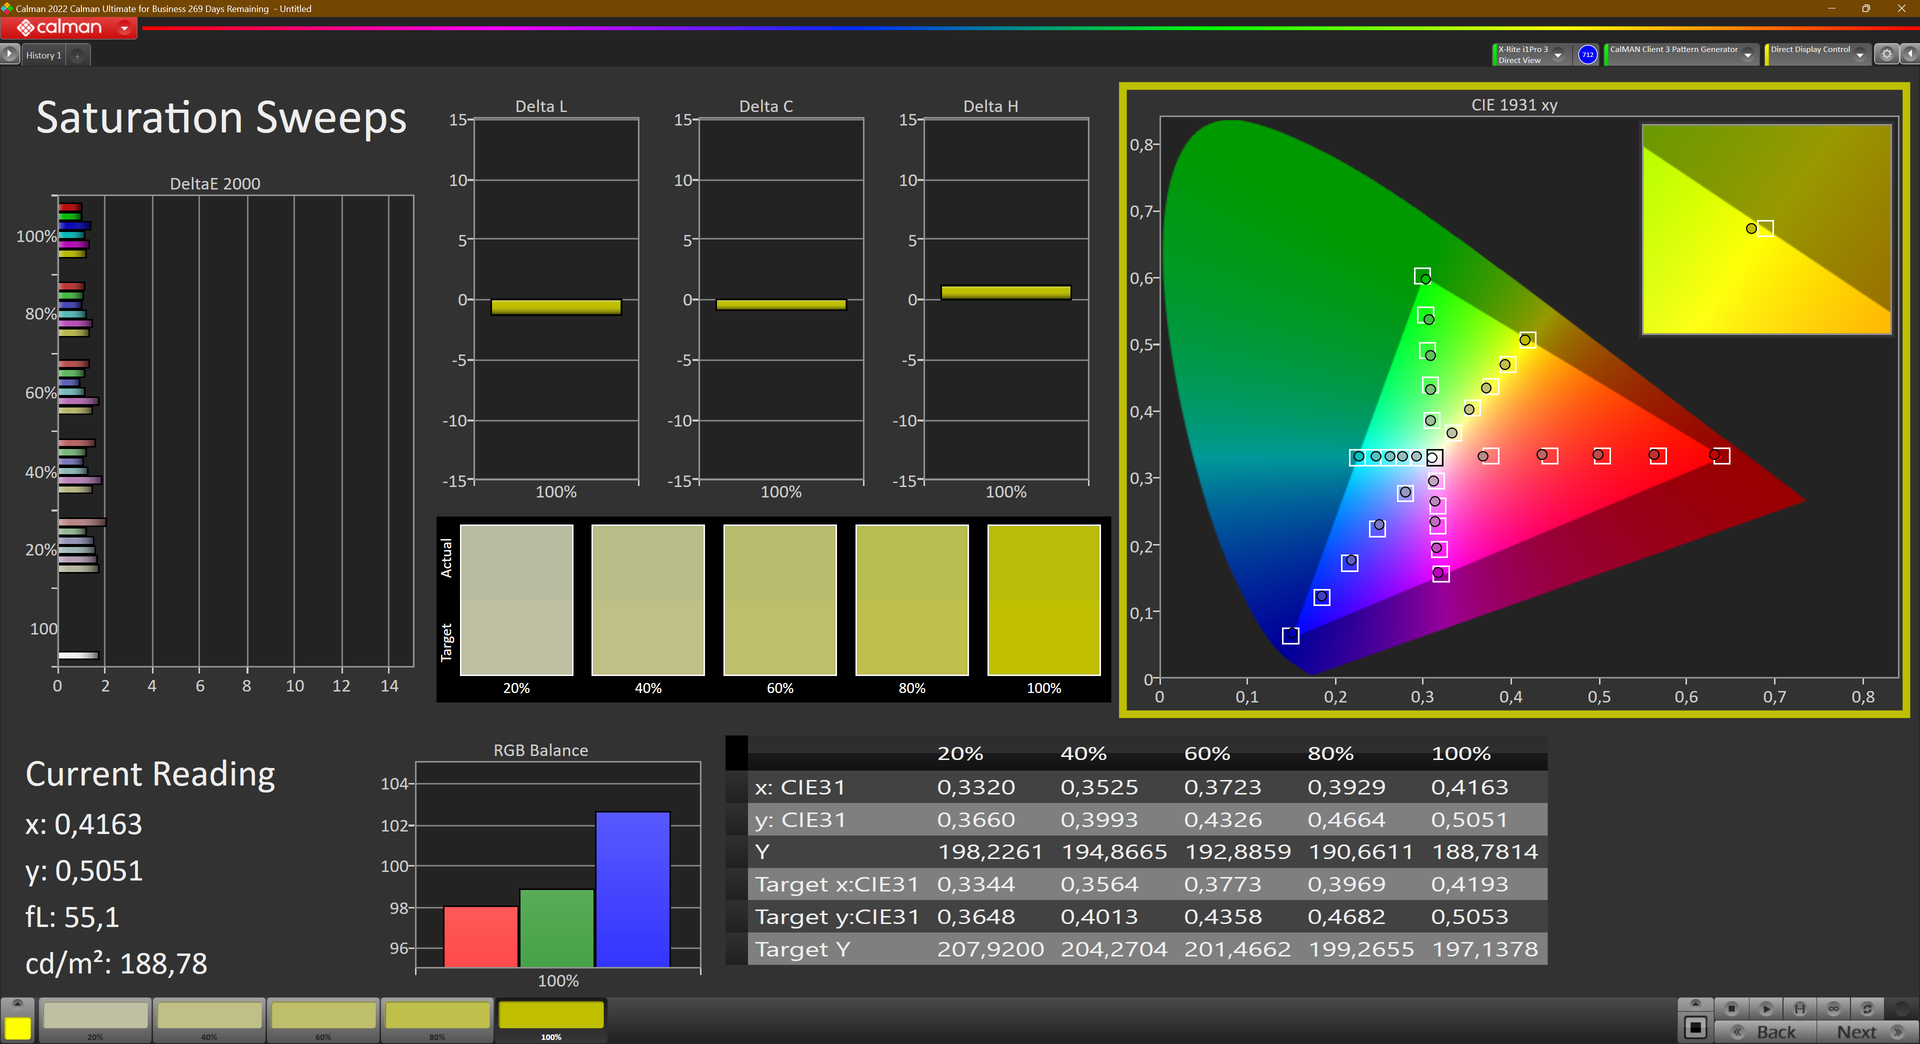
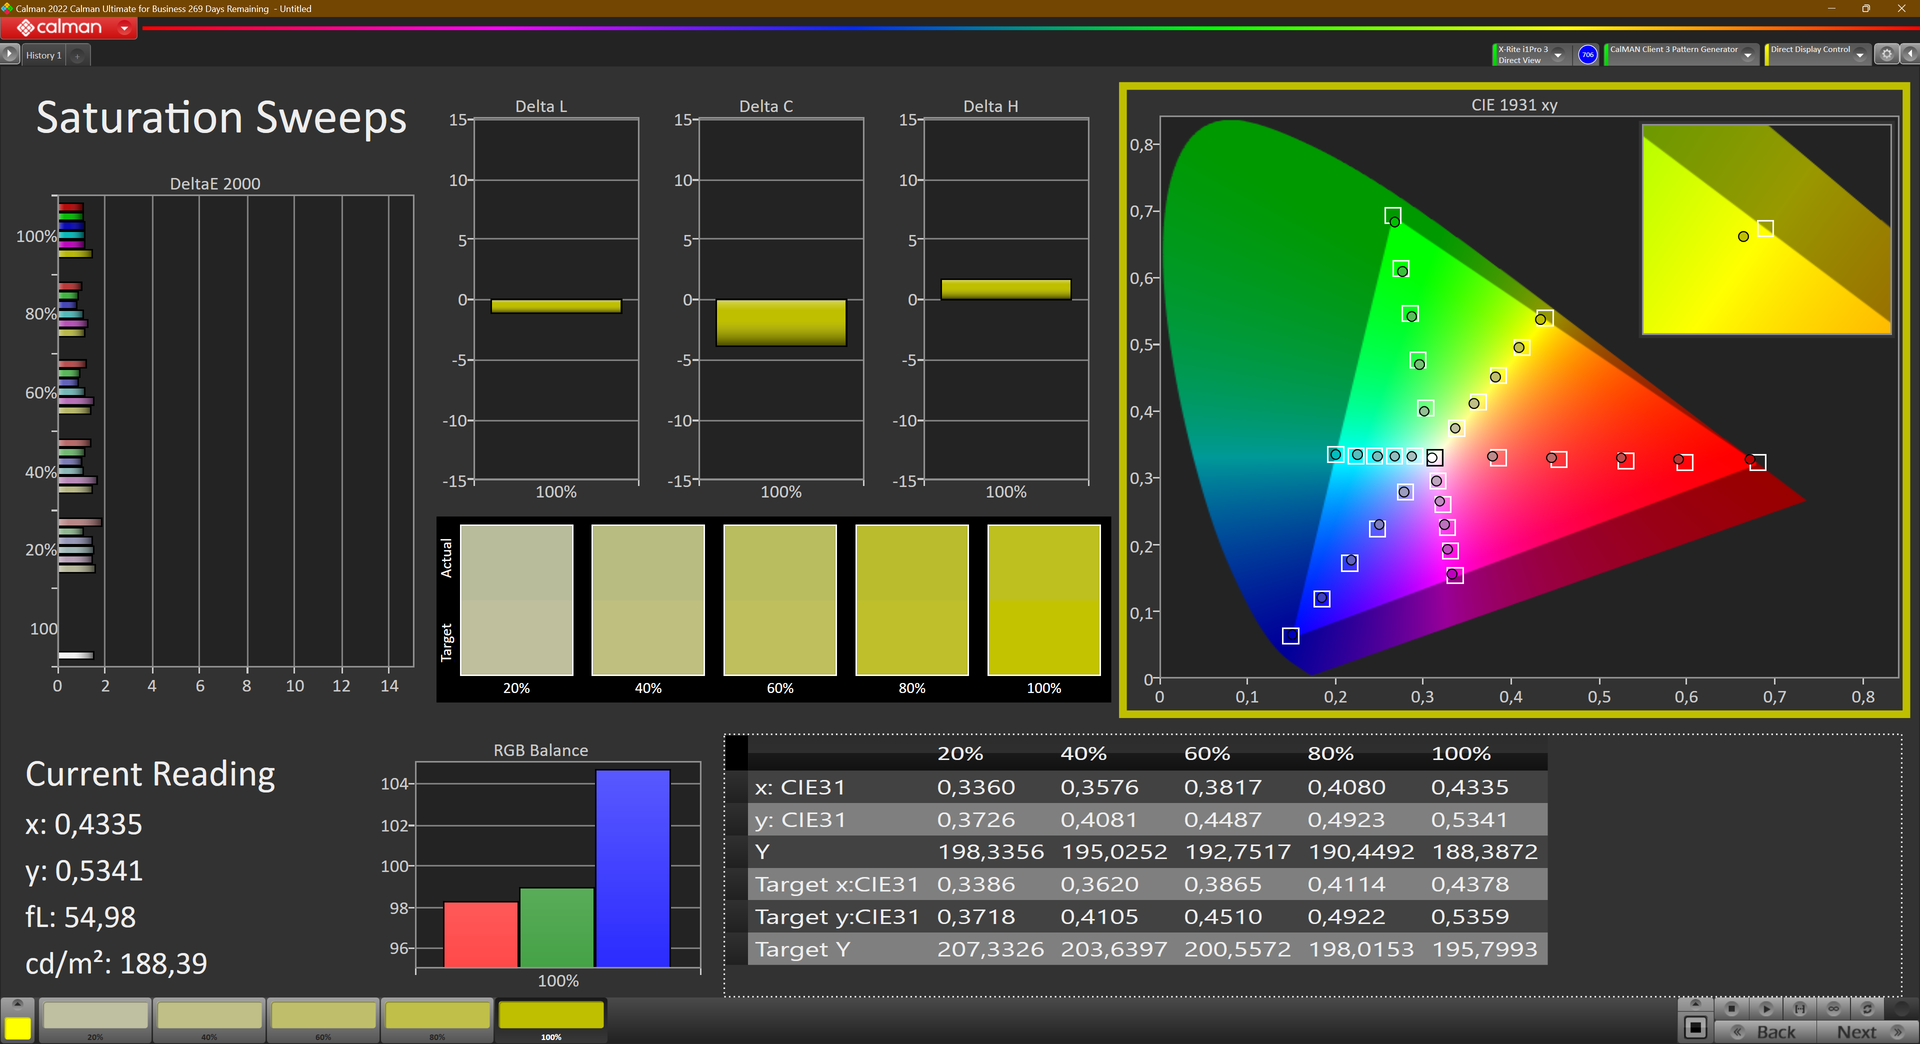
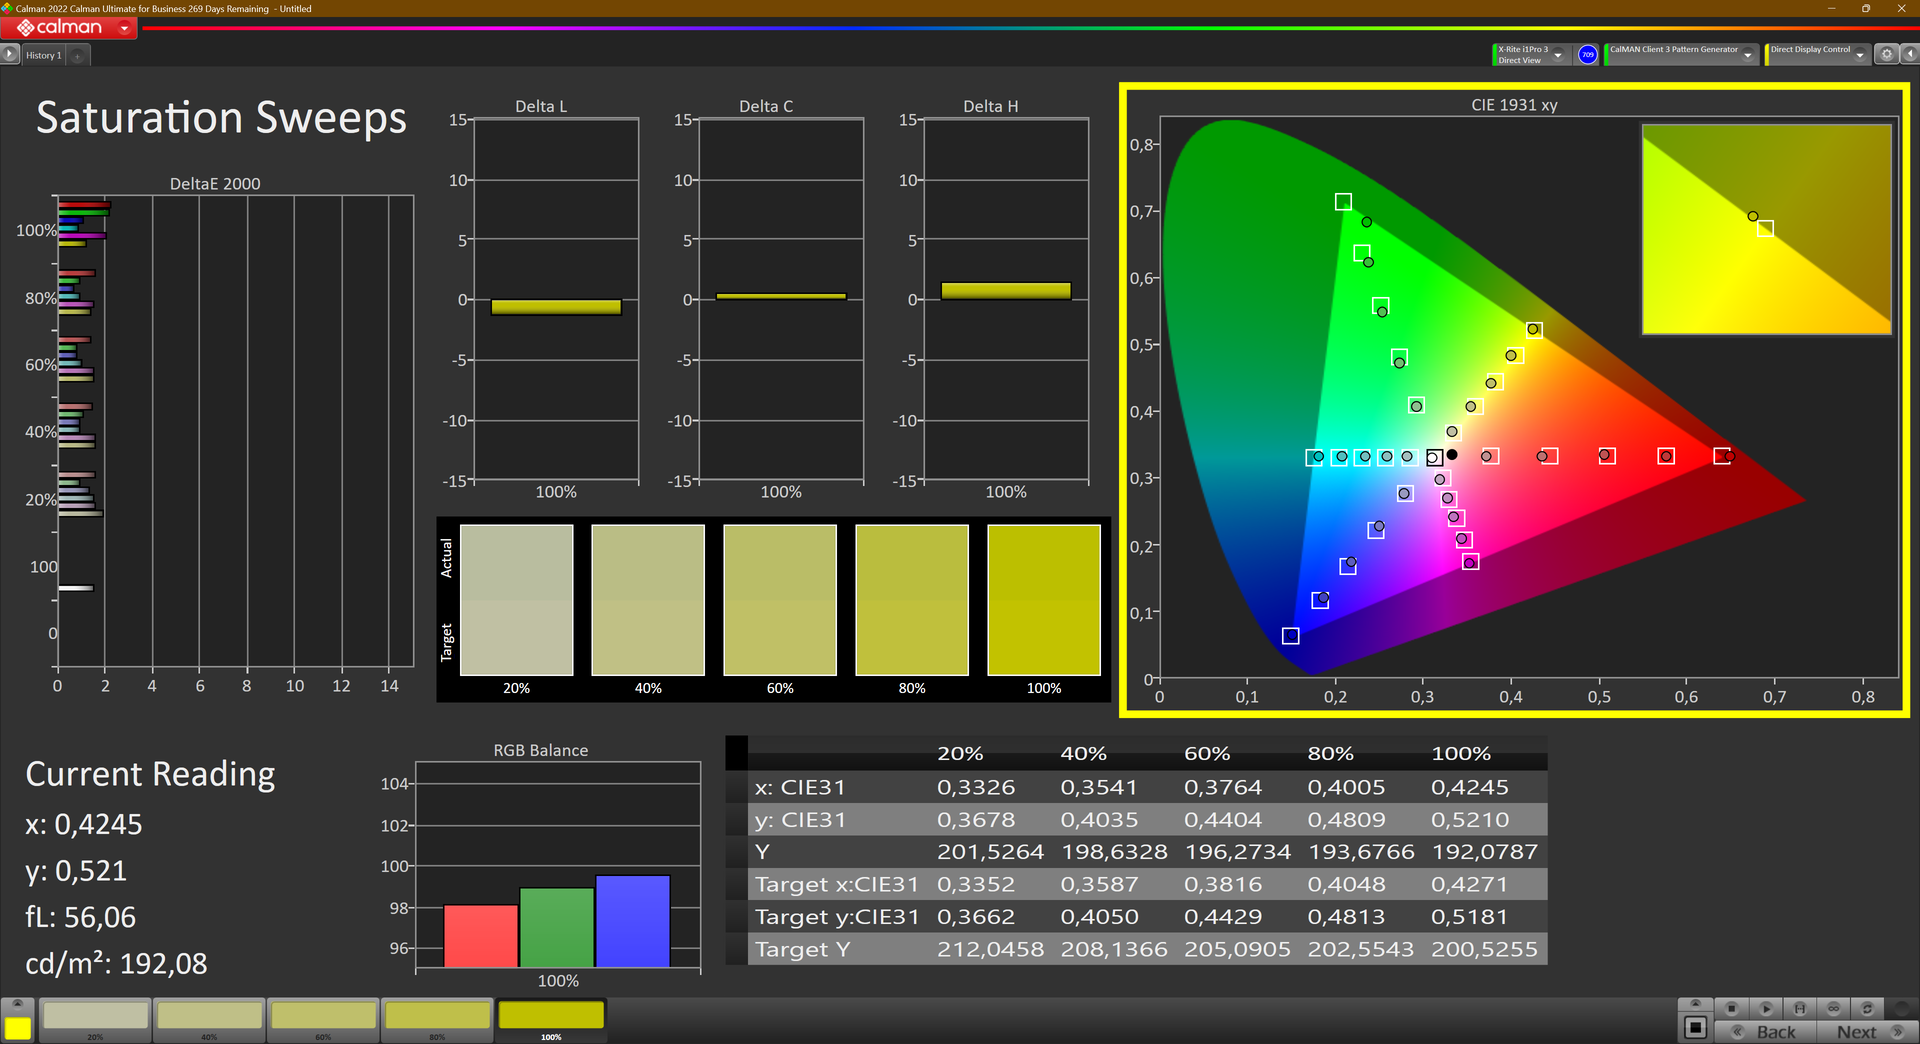
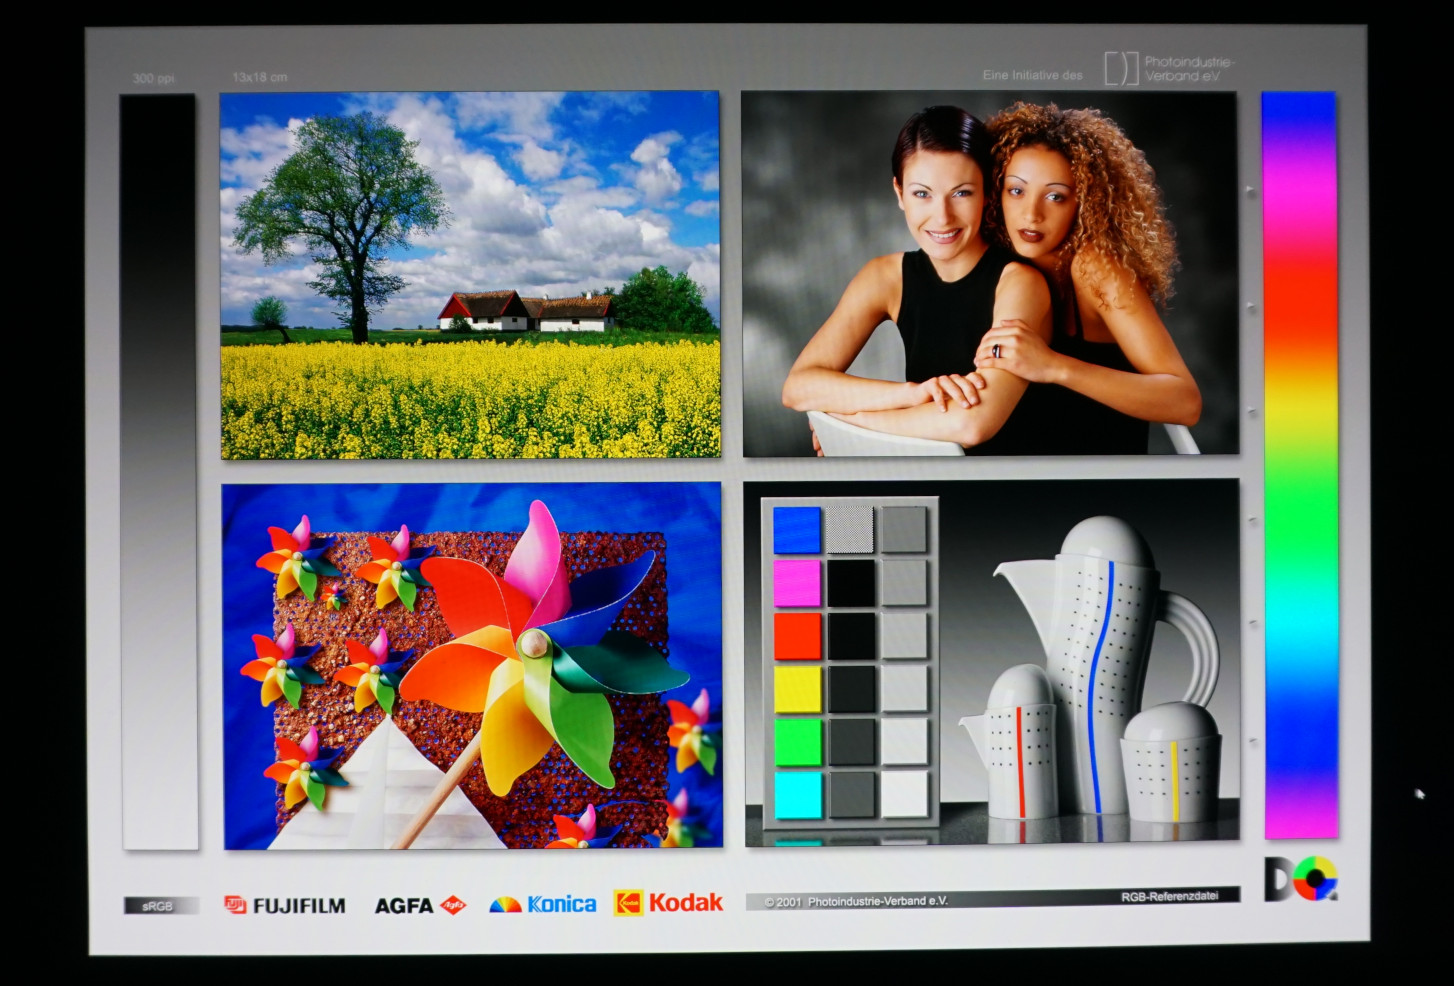
Il display OLED è generoso come ci si aspettava per quanto riguarda la rappresentazione dei colori. Copre completamente Display-P3, uno spazio colore utilizzato per le produzioni video professionali. Solo non copre completamente AdobeRGB.
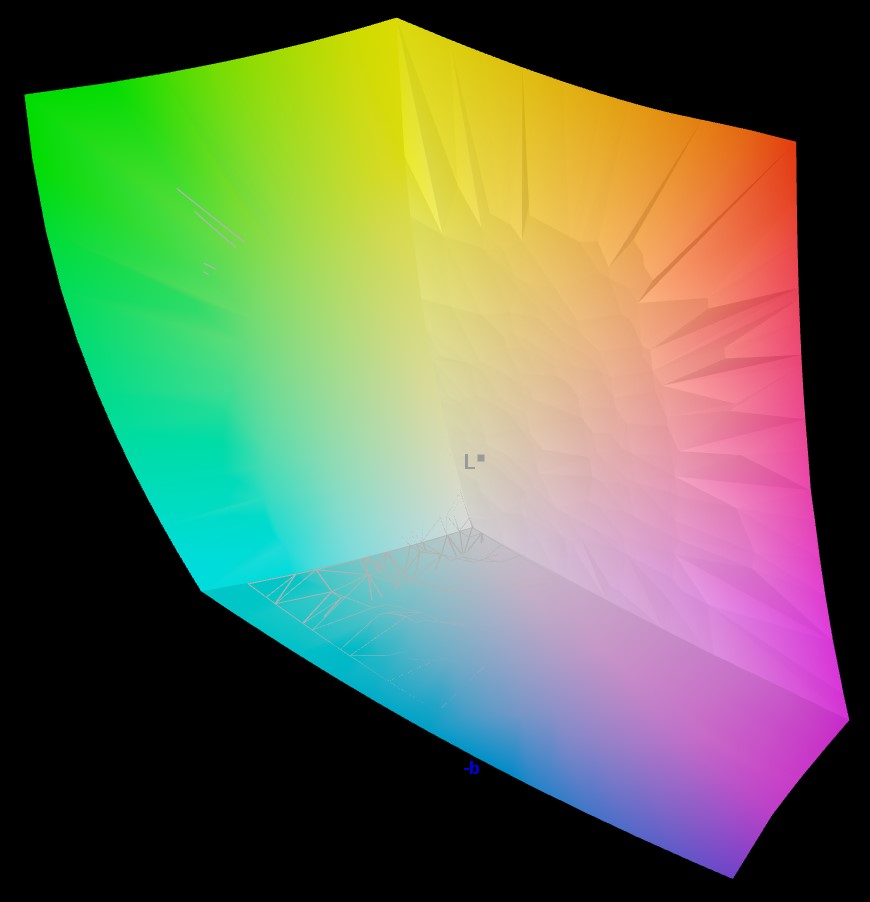
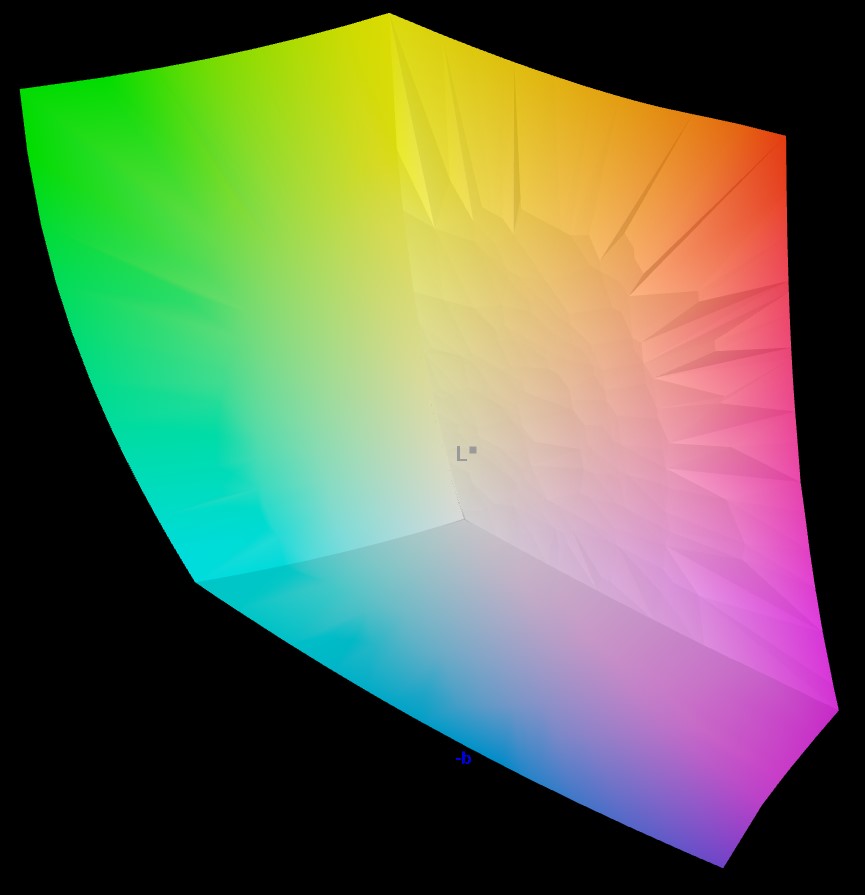
Quando abbiamo misurato la precisione del colore dello schermo, abbiamo notato valori inferiori a quelli percepibili a occhio nudo, anche quando si trattava delle deviazioni più elevate. In media, le deviazioni erano ancora più piccole. Ciò significa che i colori sono rappresentati con una precisione quasi perfetta.

Tempi di risposta del Display
| ↔ Tempi di risposta dal Nero al Bianco | ||
|---|---|---|
| 1.3 ms ... aumenta ↗ e diminuisce ↘ combinato | ↗ 0.7 ms Incremento | 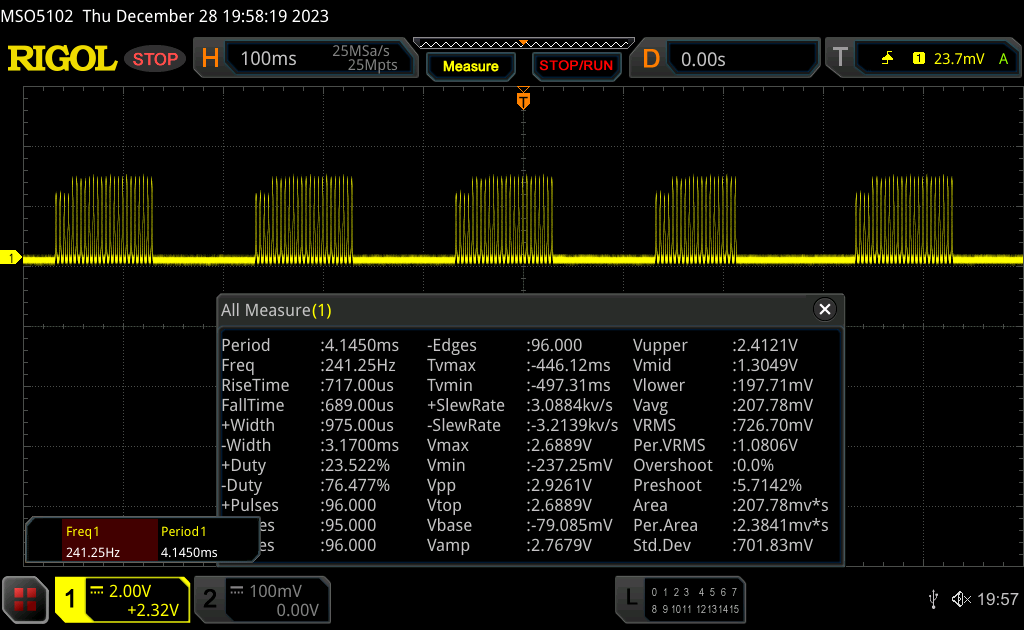 |
| ↘ 0.6 ms Calo | ||
| Lo schermo ha mostrato valori di risposta molto veloci nei nostri tests ed è molto adatto per i gaming veloce. In confronto, tutti i dispositivi di test variano da 0.1 (minimo) a 240 (massimo) ms. » 7 % di tutti i dispositivi è migliore. Questo significa che i tempi di risposta rilevati sono migliori rispettto alla media di tutti i dispositivi testati (19.8 ms). | ||
| ↔ Tempo di risposta dal 50% Grigio all'80% Grigio | ||
| 1.5 ms ... aumenta ↗ e diminuisce ↘ combinato | ↗ 0.8 ms Incremento |  |
| ↘ 0.7 ms Calo | ||
| Lo schermo ha mostrato valori di risposta molto veloci nei nostri tests ed è molto adatto per i gaming veloce. In confronto, tutti i dispositivi di test variano da 0.165 (minimo) a 636 (massimo) ms. » 7 % di tutti i dispositivi è migliore. Questo significa che i tempi di risposta rilevati sono migliori rispettto alla media di tutti i dispositivi testati (31 ms). | ||
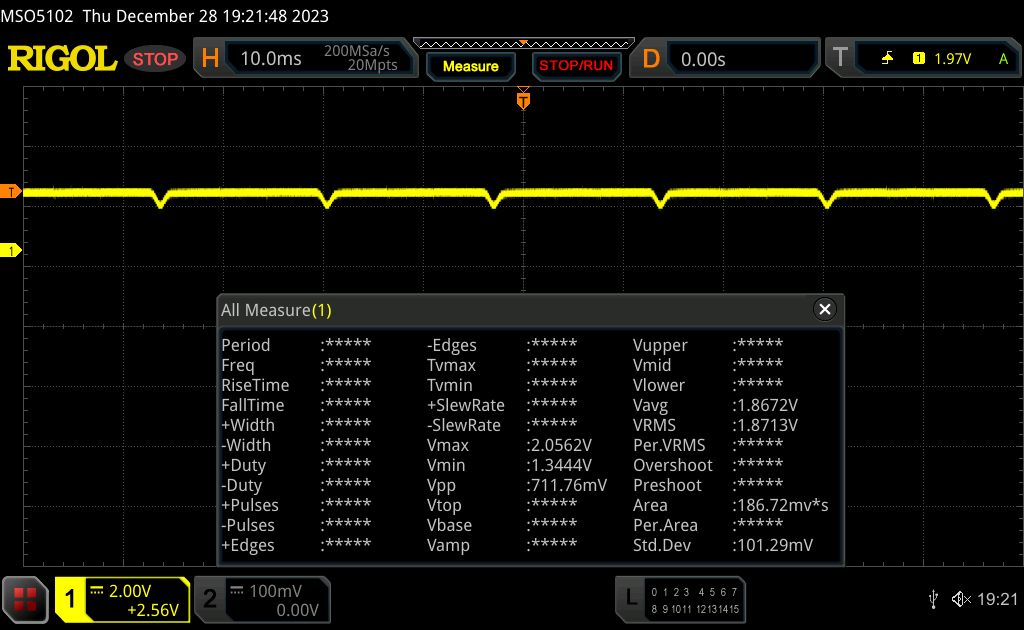
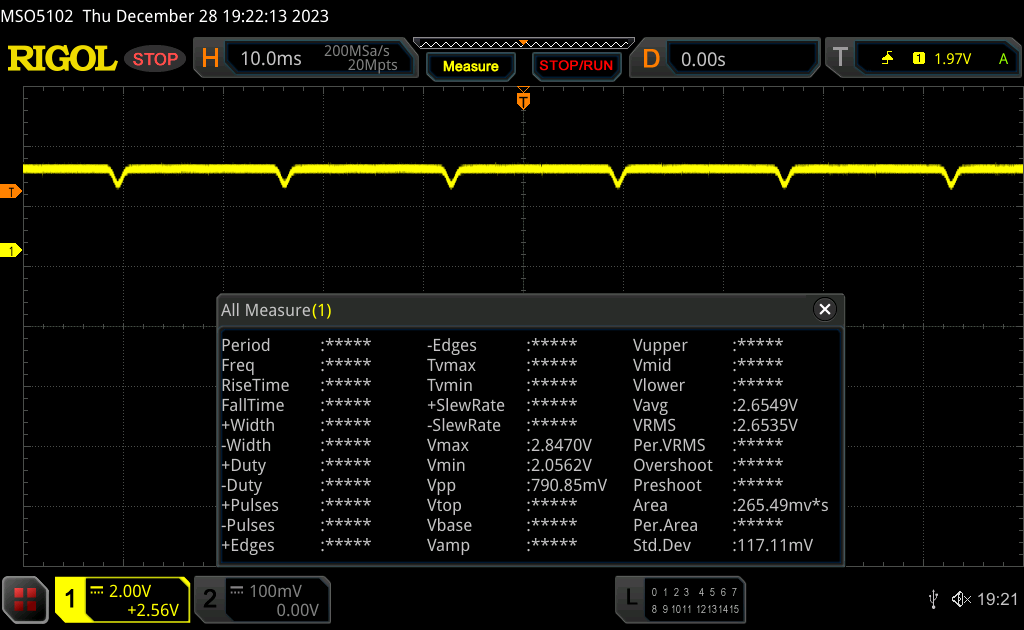
Sfarfallio dello schermo / PWM (Pulse-Width Modulation)
| flickering dello schermo / PWM rilevato | 60 Hz |  | |
Il display sfarfalla a 60 Hz (Probabilmente a causa dell'uso di PWM) . La frequenza di 60 Hz è molto bassa, quindi il flickering potrebbe causare stanchezza agli occhi e mal di testa con un utilizzo prolungato. In confronto: 52 % di tutti i dispositivi testati non utilizza PWM per ridurre la luminosita' del display. Se è rilevato PWM, una media di 7747 (minimo: 5 - massimo: 343500) Hz è stata rilevata. | |||

Gli elevati livelli di contrasto e la luminosità di oltre 400 cd/m² garantiscono la leggibilità dei contenuti anche all'aperto. Tuttavia, dovrebbe cercare un luogo ombreggiato, poiché i riflessi potrebbero ostacolare la lettura.
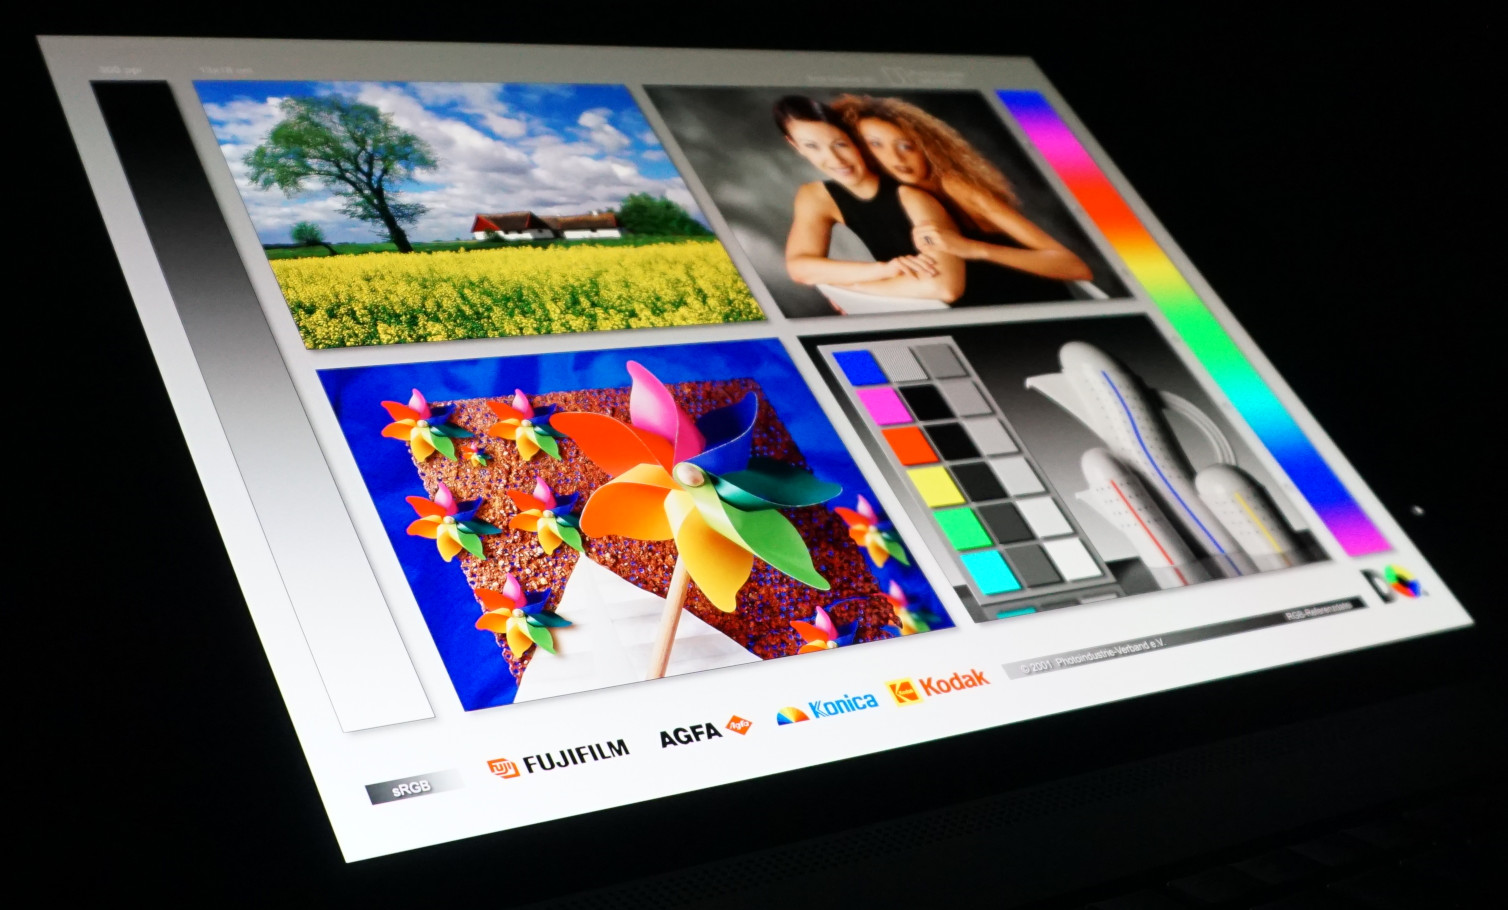
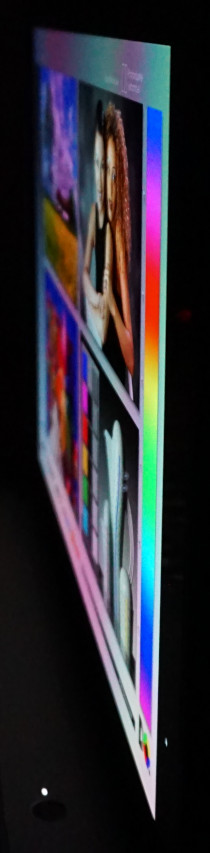
I colori e la luminosità rimangono sempre gli stessi, quasi indipendentemente dall'angolo di visione. Le distorsioni cromatiche tipiche dei display OLED si verificano solo a più di 80 gradi.
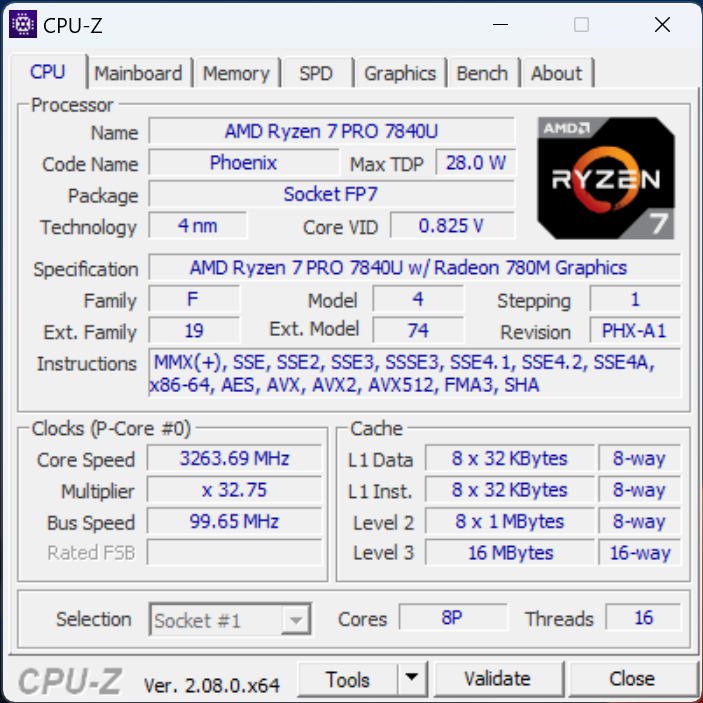
Prestazioni - Ryzen 7 sotto potenza
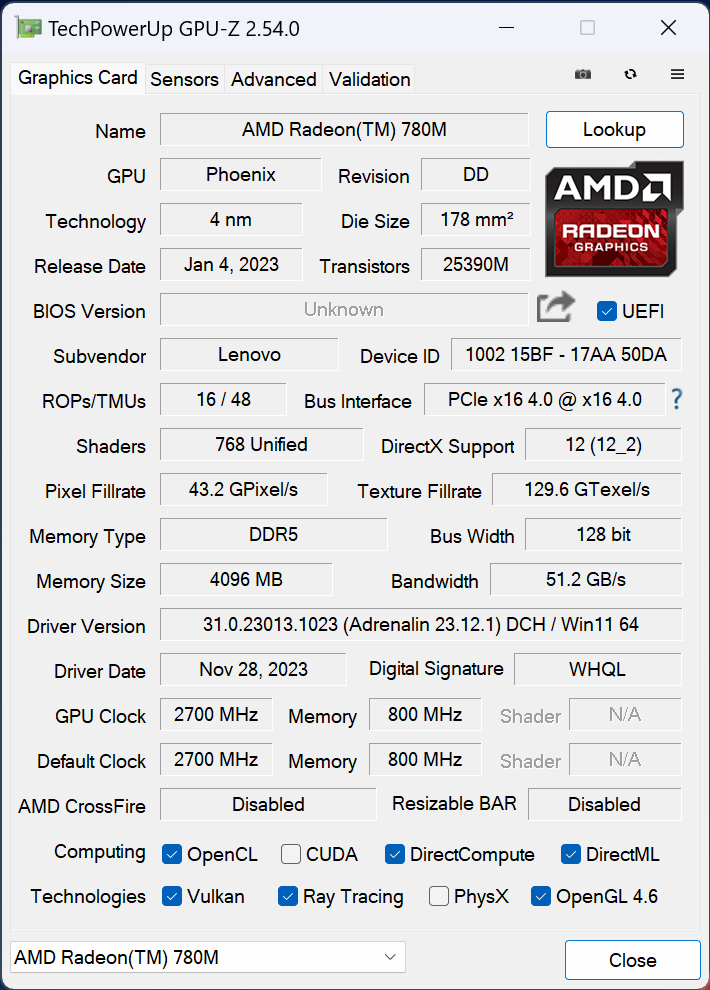
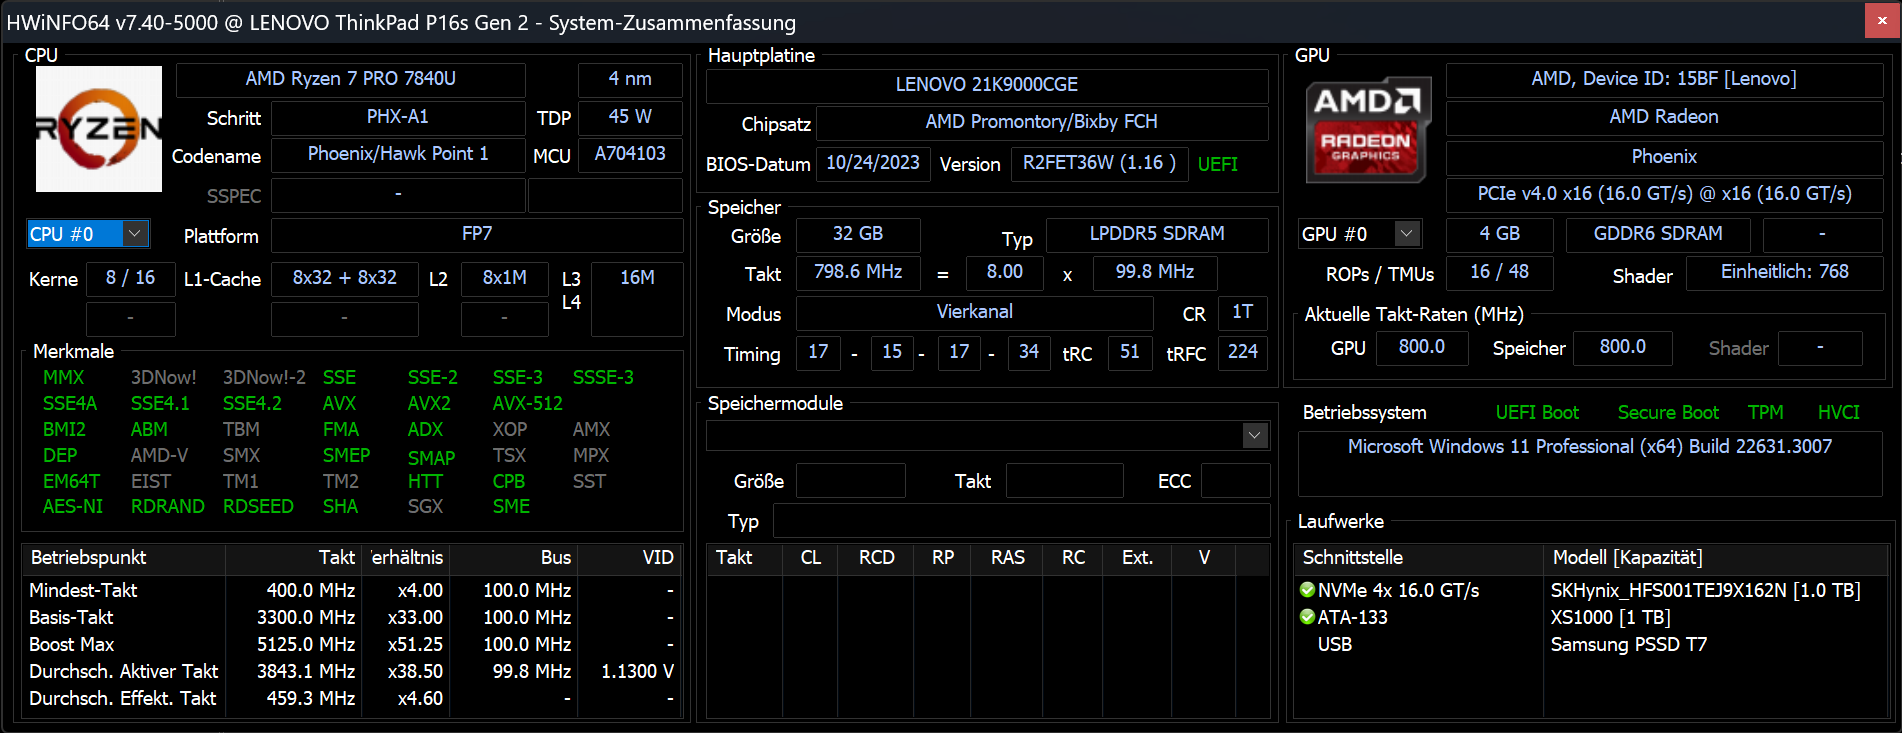
Il AMD Ryzen 7 Pro 7840U è la potenza dei ThinkPad P16s G2, insieme alla sua Radeon 780M iGPU. Questa combinazione non solo si traduce in una potenza di calcolo sbalorditiva, ma crea anche forti prestazioni grafiche, almeno per una GPU integrata. Anche l'efficienza del sistema non è da meno. Inoltre, ha anche la possibilità di selezionare il più piccolo AMD Ryzen 5 Pro 7540U con la Radeon 740M.
Oltre alle prestazioni elevate per un sistema mobile, la serie Pro dispone anche di un chip di sicurezza e di molte opzioni di manutenzione remota, particolarmente utili per l'utilizzo in flotta.
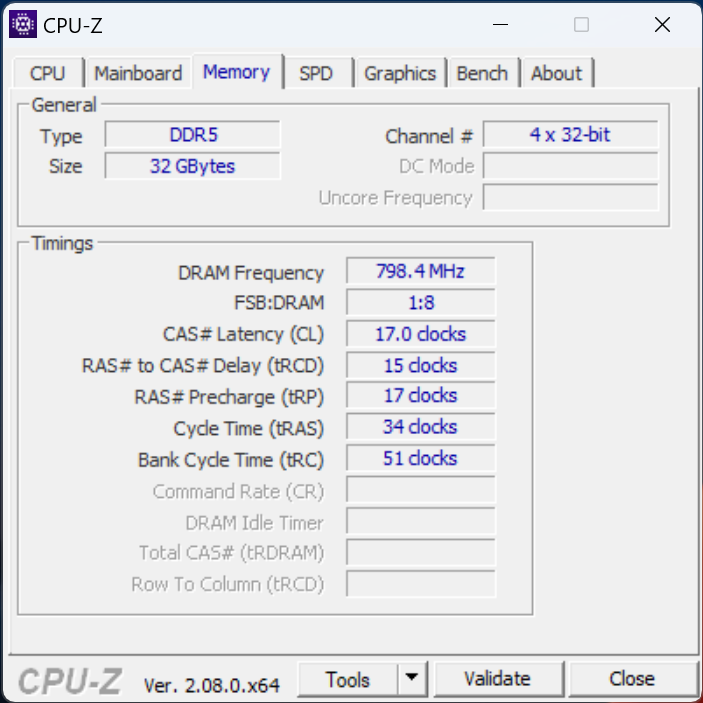
Inoltre, è possibile scegliere tra tre dimensioni di RAM, ossia 16, 32 o 64 GB a 6.400 MHz. Sono saldate, il che significa che non possono essere scambiate o espanse.
Condizioni di test
Sono disponibili le tre consuete modalità di prestazioni di Windows: massima prestazione, equilibrata e massimo risparmio energetico. Utilizzando il software in dotazione "Lenovo Commercial Vantage", le prestazioni sono sempre impostate sulla modalità più alta. Anche utilizzando l'impostazione bassa, il consumo energetico della CPU rimane piuttosto elevato. Abbiamo eseguito tutti i nostri test utilizzando la modalità con le prestazioni più elevate.
D'altra parte, se seleziona la modalità bilanciata, la potenza di calcolo del portatile si riduce leggermente. Tuttavia, non dovrebbe notarlo quando avvia le applicazioni, naviga sul web o durante la maggior parte delle attività quotidiane. A sua volta, il rumore della ventola diminuisce solo di poco, ma anche utilizzando la modalità a più alte prestazioni, non è mai veramente d'intralcio. Come previsto, le prestazioni diminuiscono ulteriormente utilizzando la modalità di risparmio energetico . Allo stesso tempo, la velocità di calcolo rimane abbastanza elevata, mentre l'avvio dei programmi comporta un leggero ritardo. Inoltre, le ventole rimangono notevolmente più silenziose con questa modalità selezionata.
Se si scollega il dispositivo dalla rete elettrica, le impostazioni passano a bilanciate. Tuttavia, possono essere riportate subito al massimo. Di conseguenza, ha accesso alle massime prestazioni del portatile anche in modalità batteria. La tabella seguente mostra come cambiano esattamente i limiti di potenza:
| PL2 | PL1 | |
|---|---|---|
| Massime prestazioni | 51 watt | 41 watt |
| Bilanciato | 40 watt | 36 watt |
| Risparmio energetico | 32 watt | 30 watt |
Processore
Come previsto, il AMD Ryzen 7 Pro 7840U che è stato ulteriormente perfezionato per l'efficienza, offre prestazioni molto elevate. È una delle CPU mobili più potenti. Con un totale di 16 thread e una frequenza di clock massima superiore a 5 GHz, ha sempre molte riserve per il multitasking e gli utilizzi complessi, come ci si aspetta da un portatile workstation.
La sua alimentazione massima di 51 watt è appropriata per un modello da 16 pollici e si stabilizza a 41 watt per un periodo di tempo più lungo. Il modello da 14 pollici ThinkPad P14s G4 con una CPU identica ha accesso al 20% di energia in meno, ad esempio, e ha fatto di conseguenza peggio nei benchmark della CPU.
Ma anche il AMD Ryzen 9 Pro 7940HS all'interno del HP EliteBook 845 G10che sulla carta è migliore, ha potuto solo tenere il passo. Il Intel Core i7-13700H si trova anch'esso a un livello simile, ma all'interno del Microsoft Surface Laptop Studio 2, ad esempio, ha fatto peggio sotto carico permanente. Inoltre, il consumo energetico dell'i7-13700H è molto più elevato.
Di conseguenza, il nostro dispositivo di prova ha fatto un'ottima impressione complessiva durante tutti i test, offrendo risultati superiori alla media con valori di consumo energetico moderati. La CPU di AMD si comporta molto bene all'interno del ThinkPad P16s G2.
Può trovare altri benchmark nel nostro elenco di benchmark della CPU di http://www.notebookcheck.com/Mobile-Prozessoren-Benchmarkliste.1809.0.html.
Cinebench R15 Multi continuous test
Cinebench R23: Multi Core | Single Core
Cinebench R20: CPU (Multi Core) | CPU (Single Core)
Cinebench R15: CPU Multi 64Bit | CPU Single 64Bit
Blender: v2.79 BMW27 CPU
7-Zip 18.03: 7z b 4 | 7z b 4 -mmt1
Geekbench 5.5: Multi-Core | Single-Core
HWBOT x265 Benchmark v2.2: 4k Preset
LibreOffice : 20 Documents To PDF
R Benchmark 2.5: Overall mean
| Cinebench R15 / CPU Multi 64Bit | |
| Media della classe Workstation (2489 - 5810, n=23, ultimi 2 anni) | |
| Microsoft Surface Laptop Studio 2 RTX 4060 | |
| Lenovo ThinkPad P16s G2 21K9000CGE | |
| MSI Prestige 16 B1MG-001US | |
| Lenovo ThinkPad P16v G1 AMD | |
| HP EliteBook 845 G10 818N0EA | |
| Lenovo ThinkPad P14s G4 21K5000LGE | |
| Media AMD Ryzen 7 PRO 7840U (1590 - 2418, n=5) | |
| Lenovo ThinkPad P15v G3 21EM001AGE | |
| Lenovo ThinkPad X1 Carbon G11 21HNS54T00 | |
| Acer Swift Edge SFE16 Ryzen 7 7840U | |
| Schenker Vision 16 PH6PRX1 | |
| Cinebench R15 / CPU Single 64Bit | |
| Media della classe Workstation (191.4 - 328, n=23, ultimi 2 anni) | |
| Microsoft Surface Laptop Studio 2 RTX 4060 | |
| Acer Swift Edge SFE16 Ryzen 7 7840U | |
| Schenker Vision 16 PH6PRX1 | |
| Lenovo ThinkPad P14s G4 21K5000LGE | |
| Lenovo ThinkPad P16s G2 21K9000CGE | |
| Media AMD Ryzen 7 PRO 7840U (247 - 273, n=5) | |
| Lenovo ThinkPad P16v G1 AMD | |
| Lenovo ThinkPad X1 Carbon G11 21HNS54T00 | |
| MSI Prestige 16 B1MG-001US | |
| HP EliteBook 845 G10 818N0EA | |
| Lenovo ThinkPad P15v G3 21EM001AGE | |
| HWBOT x265 Benchmark v2.2 / 4k Preset | |
| Media della classe Workstation (17.8 - 40.5, n=23, ultimi 2 anni) | |
| Lenovo ThinkPad P16v G1 AMD | |
| Lenovo ThinkPad P16s G2 21K9000CGE | |
| Microsoft Surface Laptop Studio 2 RTX 4060 | |
| HP EliteBook 845 G10 818N0EA | |
| MSI Prestige 16 B1MG-001US | |
| Lenovo ThinkPad P14s G4 21K5000LGE | |
| Media AMD Ryzen 7 PRO 7840U (13.6 - 17.8, n=5) | |
| Acer Swift Edge SFE16 Ryzen 7 7840U | |
| Schenker Vision 16 PH6PRX1 | |
| Lenovo ThinkPad P15v G3 21EM001AGE | |
| Lenovo ThinkPad X1 Carbon G11 21HNS54T00 | |
| LibreOffice / 20 Documents To PDF | |
| Lenovo ThinkPad P15v G3 21EM001AGE | |
| Lenovo ThinkPad P16s G2 21K9000CGE | |
| Lenovo ThinkPad P14s G4 21K5000LGE | |
| HP EliteBook 845 G10 818N0EA | |
| Media AMD Ryzen 7 PRO 7840U (45.8 - 52, n=5) | |
| Media della classe Workstation (37.1 - 74.7, n=23, ultimi 2 anni) | |
| MSI Prestige 16 B1MG-001US | |
| Lenovo ThinkPad P16v G1 AMD | |
| Lenovo ThinkPad X1 Carbon G11 21HNS54T00 | |
| Microsoft Surface Laptop Studio 2 RTX 4060 | |
| Acer Swift Edge SFE16 Ryzen 7 7840U | |
| Schenker Vision 16 PH6PRX1 | |
* ... Meglio usare valori piccoli
AIDA64: FP32 Ray-Trace | FPU Julia | CPU SHA3 | CPU Queen | FPU SinJulia | FPU Mandel | CPU AES | CPU ZLib | FP64 Ray-Trace | CPU PhotoWorxx
* ... Meglio usare valori piccoli
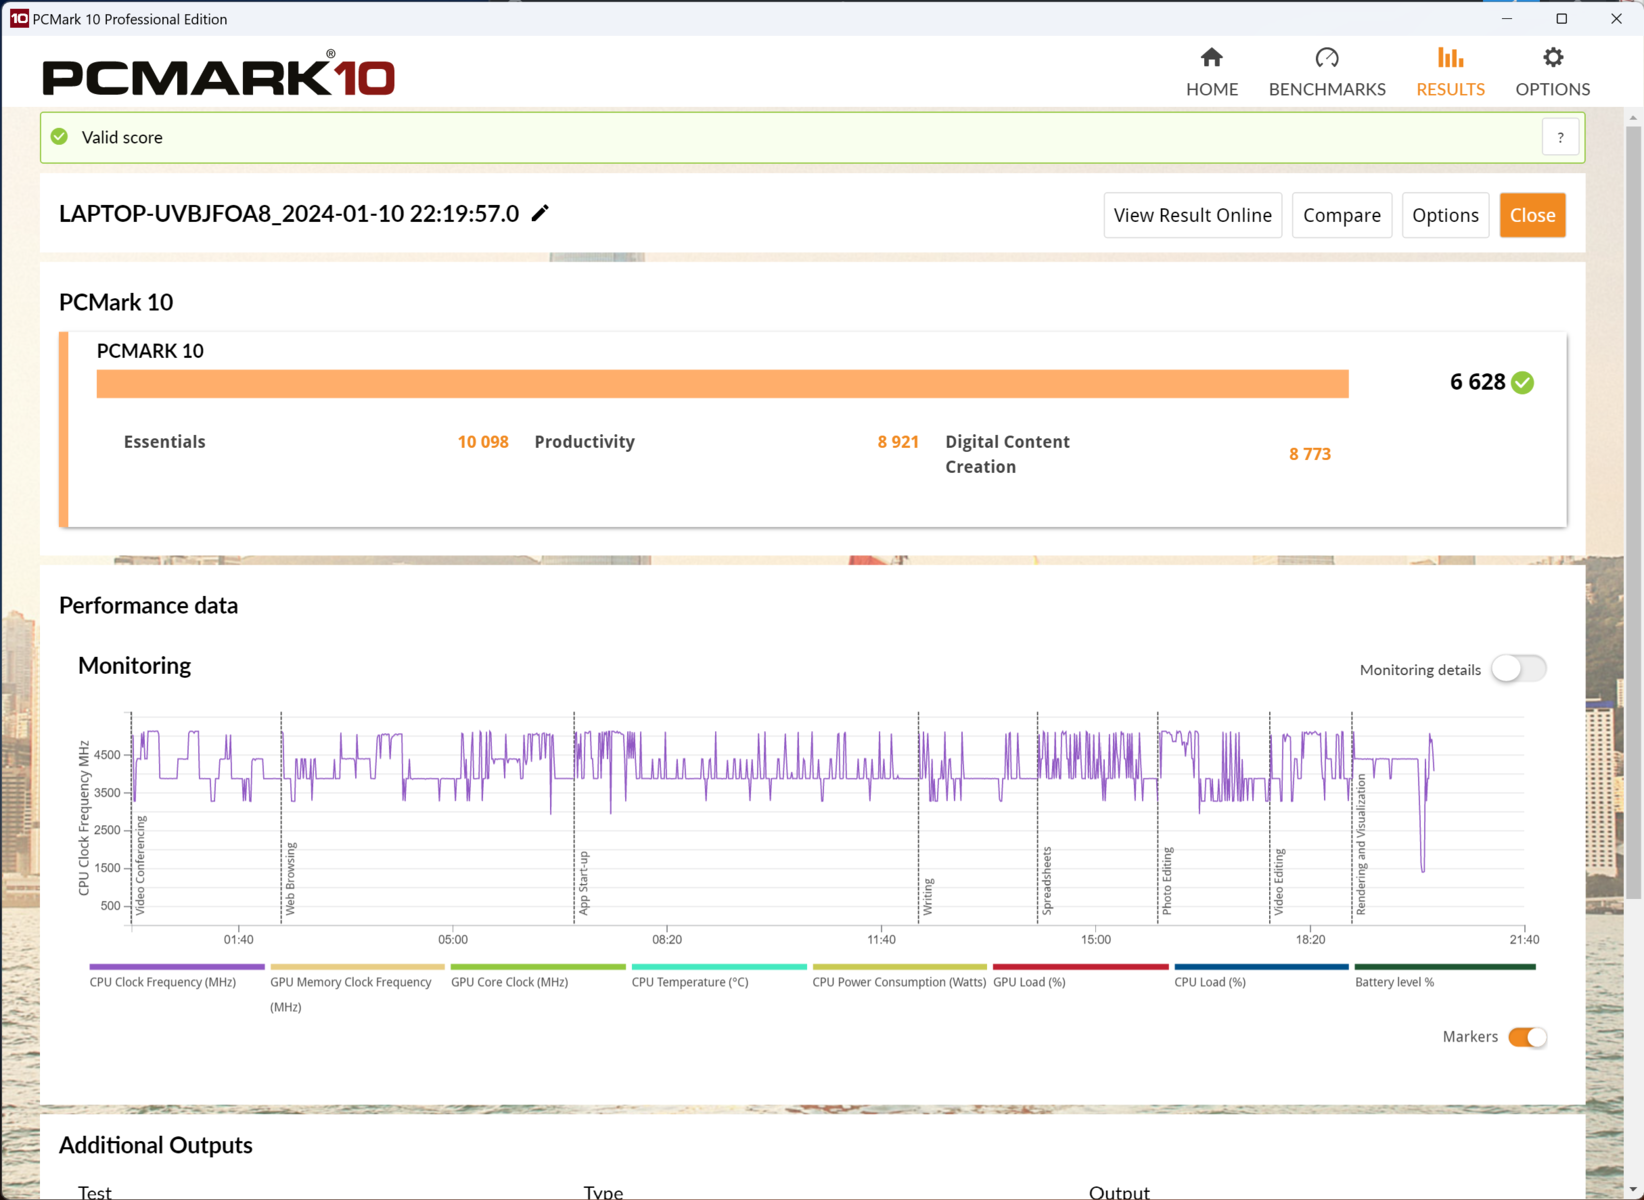
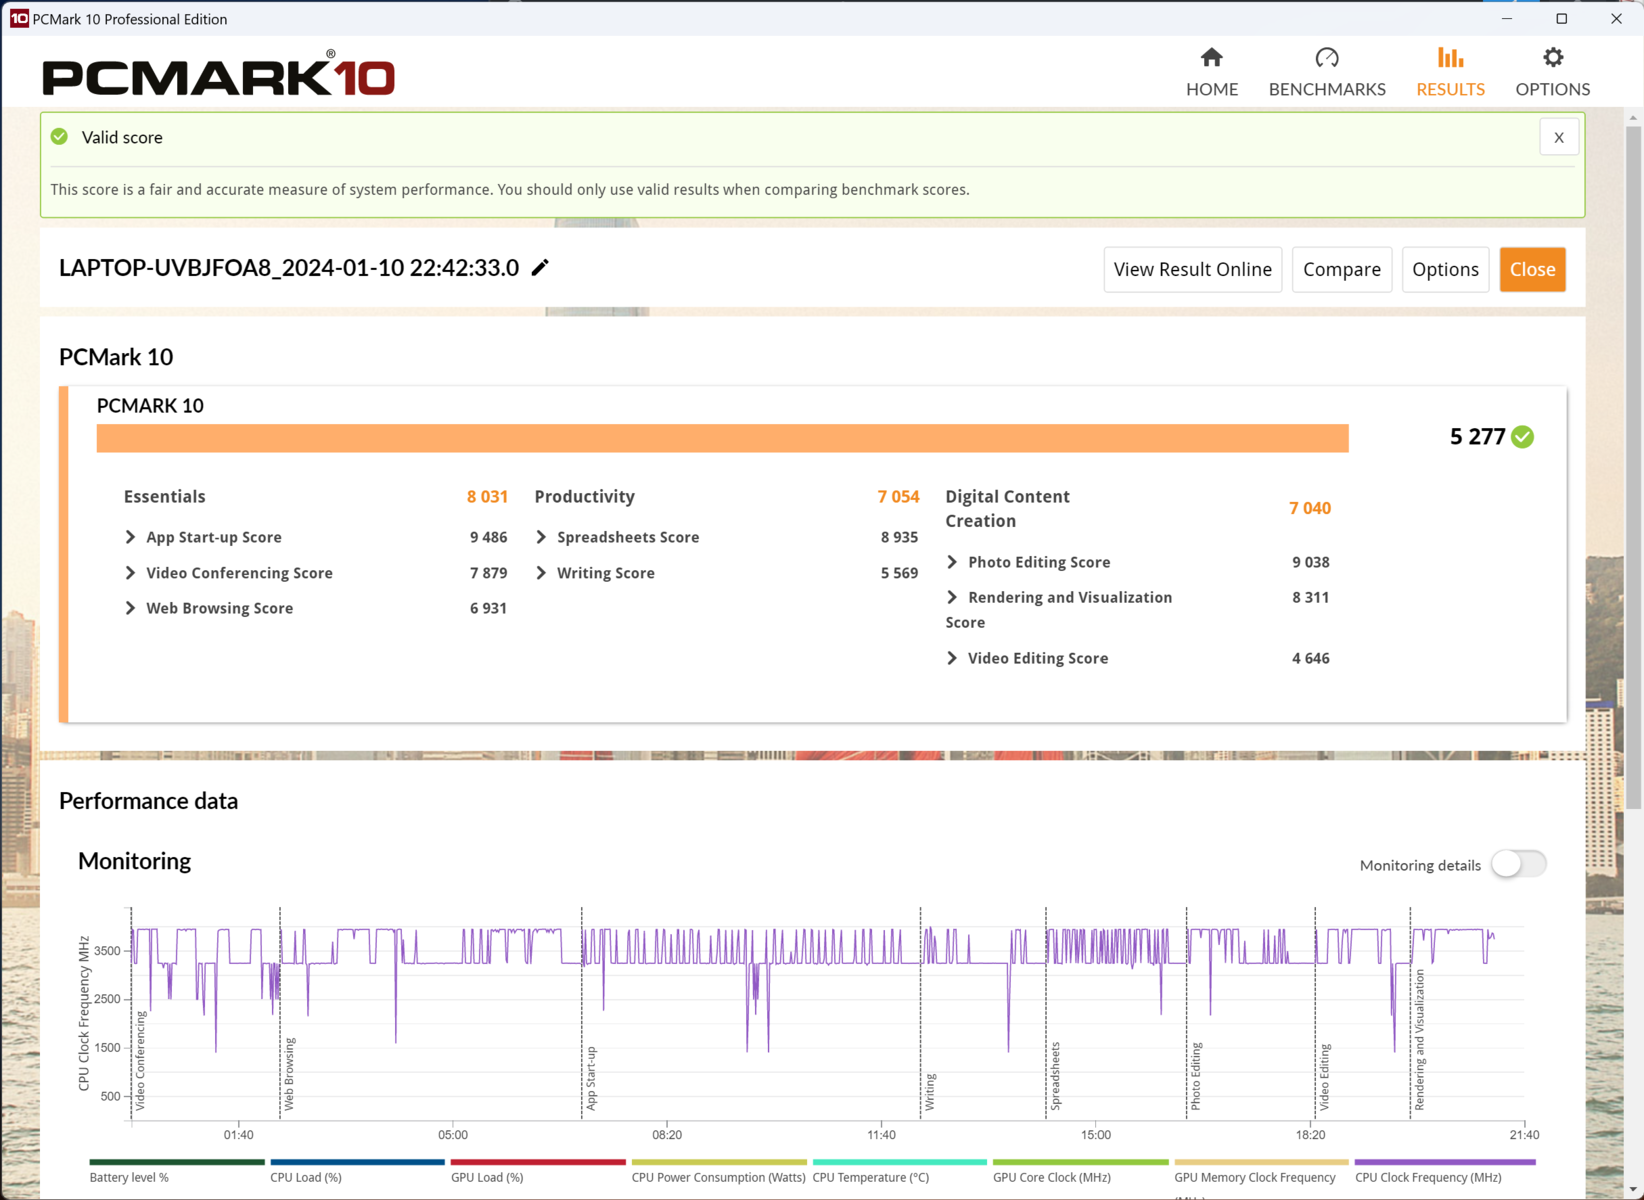
Prestazioni del sistema
Le prestazioni generali del sistema del ThinkPad P16s G2 sono di livello molto alto. Ha chiaramente superato il Schenker Vision 16 con un i7-13700Hper esempio. E anche una configurazione migliore Lenovo ThinkPad P16v con una scheda grafica dedicata era in vantaggio solo di pochi punti percentuali.
Ciò significa che la gestione del P16s G2 AMD è di conseguenza fluida, quasi indipendente dal carico corrente. Anche con i benchmark in esecuzione in background, il portatile può essere utilizzato bene e reagisce rapidamente. È possibile utilizzare diversi programmi contemporaneamente e i processi di installazione o le attività complesse possono essere completate in pochissimo tempo.
CrossMark: Overall | Productivity | Creativity | Responsiveness
WebXPRT 3: Overall
WebXPRT 4: Overall
Mozilla Kraken 1.1: Total
| PCMark 10 / Score | |
| Media della classe Workstation (6563 - 10409, n=19, ultimi 2 anni) | |
| Microsoft Surface Laptop Studio 2 RTX 4060 | |
| MSI Prestige 16 B1MG-001US | |
| Lenovo ThinkPad P16v G1 AMD | |
| Acer Swift Edge SFE16 Ryzen 7 7840U | |
| Media AMD Ryzen 7 PRO 7840U, AMD Radeon 780M (6541 - 7012, n=5) | |
| Lenovo ThinkPad P14s G4 21K5000LGE | |
| Lenovo ThinkPad P16s G2 21K9000CGE | |
| HP EliteBook 845 G10 818N0EA | |
| Lenovo ThinkPad P15v G3 21EM001AGE | |
| Schenker Vision 16 PH6PRX1 | |
| Lenovo ThinkPad X1 Carbon G11 21HNS54T00 | |
| PCMark 10 / Essentials | |
| MSI Prestige 16 B1MG-001US | |
| Acer Swift Edge SFE16 Ryzen 7 7840U | |
| Microsoft Surface Laptop Studio 2 RTX 4060 | |
| Lenovo ThinkPad X1 Carbon G11 21HNS54T00 | |
| Media della classe Workstation (9622 - 11157, n=19, ultimi 2 anni) | |
| Media AMD Ryzen 7 PRO 7840U, AMD Radeon 780M (10055 - 10934, n=5) | |
| Lenovo ThinkPad P16v G1 AMD | |
| Lenovo ThinkPad P16s G2 21K9000CGE | |
| Lenovo ThinkPad P14s G4 21K5000LGE | |
| Schenker Vision 16 PH6PRX1 | |
| Lenovo ThinkPad P15v G3 21EM001AGE | |
| HP EliteBook 845 G10 818N0EA | |
| PCMark 10 / Productivity | |
| Media della classe Workstation (8789 - 20616, n=19, ultimi 2 anni) | |
| Acer Swift Edge SFE16 Ryzen 7 7840U | |
| Lenovo ThinkPad P16v G1 AMD | |
| Media AMD Ryzen 7 PRO 7840U, AMD Radeon 780M (8921 - 9933, n=5) | |
| Microsoft Surface Laptop Studio 2 RTX 4060 | |
| Lenovo ThinkPad P14s G4 21K5000LGE | |
| HP EliteBook 845 G10 818N0EA | |
| Lenovo ThinkPad P16s G2 21K9000CGE | |
| MSI Prestige 16 B1MG-001US | |
| Lenovo ThinkPad P15v G3 21EM001AGE | |
| Lenovo ThinkPad X1 Carbon G11 21HNS54T00 | |
| Schenker Vision 16 PH6PRX1 | |
| PCMark 10 / Digital Content Creation | |
| Media della classe Workstation (8108 - 15631, n=19, ultimi 2 anni) | |
| Microsoft Surface Laptop Studio 2 RTX 4060 | |
| MSI Prestige 16 B1MG-001US | |
| Lenovo ThinkPad P16v G1 AMD | |
| Lenovo ThinkPad P16s G2 21K9000CGE | |
| Lenovo ThinkPad P14s G4 21K5000LGE | |
| Lenovo ThinkPad P15v G3 21EM001AGE | |
| Media AMD Ryzen 7 PRO 7840U, AMD Radeon 780M (7806 - 8874, n=5) | |
| Acer Swift Edge SFE16 Ryzen 7 7840U | |
| HP EliteBook 845 G10 818N0EA | |
| Schenker Vision 16 PH6PRX1 | |
| Lenovo ThinkPad X1 Carbon G11 21HNS54T00 | |
| CrossMark / Overall | |
| Media della classe Workstation (1307 - 2267, n=22, ultimi 2 anni) | |
| Lenovo ThinkPad X1 Carbon G11 21HNS54T00 | |
| Acer Swift Edge SFE16 Ryzen 7 7840U | |
| MSI Prestige 16 B1MG-001US | |
| Microsoft Surface Laptop Studio 2 RTX 4060 | |
| Schenker Vision 16 PH6PRX1 | |
| Media AMD Ryzen 7 PRO 7840U, AMD Radeon 780M (1533 - 1669, n=5) | |
| Lenovo ThinkPad P16s G2 21K9000CGE | |
| Lenovo ThinkPad P14s G4 21K5000LGE | |
| Lenovo ThinkPad P16v G1 AMD | |
| HP EliteBook 845 G10 818N0EA | |
| Lenovo ThinkPad P15v G3 21EM001AGE | |
| CrossMark / Productivity | |
| Acer Swift Edge SFE16 Ryzen 7 7840U | |
| Media della classe Workstation (1130 - 2122, n=22, ultimi 2 anni) | |
| Lenovo ThinkPad X1 Carbon G11 21HNS54T00 | |
| MSI Prestige 16 B1MG-001US | |
| Schenker Vision 16 PH6PRX1 | |
| Microsoft Surface Laptop Studio 2 RTX 4060 | |
| Lenovo ThinkPad P16v G1 AMD | |
| Media AMD Ryzen 7 PRO 7840U, AMD Radeon 780M (1461 - 1624, n=5) | |
| Lenovo ThinkPad P16s G2 21K9000CGE | |
| Lenovo ThinkPad P14s G4 21K5000LGE | |
| Lenovo ThinkPad P15v G3 21EM001AGE | |
| HP EliteBook 845 G10 818N0EA | |
| CrossMark / Creativity | |
| Media della classe Workstation (1657 - 2725, n=22, ultimi 2 anni) | |
| Lenovo ThinkPad X1 Carbon G11 21HNS54T00 | |
| Microsoft Surface Laptop Studio 2 RTX 4060 | |
| MSI Prestige 16 B1MG-001US | |
| Acer Swift Edge SFE16 Ryzen 7 7840U | |
| Media AMD Ryzen 7 PRO 7840U, AMD Radeon 780M (1697 - 1824, n=5) | |
| Lenovo ThinkPad P16s G2 21K9000CGE | |
| Schenker Vision 16 PH6PRX1 | |
| Lenovo ThinkPad P14s G4 21K5000LGE | |
| Lenovo ThinkPad P16v G1 AMD | |
| HP EliteBook 845 G10 818N0EA | |
| Lenovo ThinkPad P15v G3 21EM001AGE | |
| CrossMark / Responsiveness | |
| Acer Swift Edge SFE16 Ryzen 7 7840U | |
| Schenker Vision 16 PH6PRX1 | |
| Media della classe Workstation (993 - 2096, n=22, ultimi 2 anni) | |
| MSI Prestige 16 B1MG-001US | |
| Lenovo ThinkPad X1 Carbon G11 21HNS54T00 | |
| Microsoft Surface Laptop Studio 2 RTX 4060 | |
| Lenovo ThinkPad P14s G4 21K5000LGE | |
| Lenovo ThinkPad P16v G1 AMD | |
| Lenovo ThinkPad P16s G2 21K9000CGE | |
| Media AMD Ryzen 7 PRO 7840U, AMD Radeon 780M (1049 - 1499, n=5) | |
| Lenovo ThinkPad P15v G3 21EM001AGE | |
| HP EliteBook 845 G10 818N0EA | |
| WebXPRT 3 / Overall | |
| Lenovo ThinkPad P16v G1 AMD | |
| Media della classe Workstation (260 - 360, n=23, ultimi 2 anni) | |
| Acer Swift Edge SFE16 Ryzen 7 7840U | |
| Microsoft Surface Laptop Studio 2 RTX 4060 | |
| MSI Prestige 16 B1MG-001US | |
| Lenovo ThinkPad X1 Carbon G11 21HNS54T00 | |
| Lenovo ThinkPad X1 Carbon G11 21HNS54T00 | |
| Media AMD Ryzen 7 PRO 7840U, AMD Radeon 780M (259 - 317, n=5) | |
| HP EliteBook 845 G10 818N0EA | |
| Lenovo ThinkPad P14s G4 21K5000LGE | |
| Lenovo ThinkPad P16s G2 21K9000CGE | |
| Lenovo ThinkPad P15v G3 21EM001AGE | |
| WebXPRT 4 / Overall | |
| Media della classe Workstation (189.2 - 326, n=23, ultimi 2 anni) | |
| Microsoft Surface Laptop Studio 2 RTX 4060 | |
| MSI Prestige 16 B1MG-001US | |
| Lenovo ThinkPad P16v G1 AMD | |
| Acer Swift Edge SFE16 Ryzen 7 7840U | |
| Media AMD Ryzen 7 PRO 7840U, AMD Radeon 780M (234 - 245, n=2) | |
| HP EliteBook 845 G10 818N0EA | |
| Lenovo ThinkPad P15v G3 21EM001AGE | |
| Mozilla Kraken 1.1 / Total | |
| Lenovo ThinkPad P15v G3 21EM001AGE | |
| Lenovo ThinkPad P14s G4 21K5000LGE | |
| HP EliteBook 845 G10 818N0EA | |
| Lenovo ThinkPad P16s G2 21K9000CGE | |
| Media AMD Ryzen 7 PRO 7840U, AMD Radeon 780M (523 - 571, n=5) | |
| Lenovo ThinkPad P16v G1 AMD | |
| MSI Prestige 16 B1MG-001US | |
| Acer Swift Edge SFE16 Ryzen 7 7840U | |
| Microsoft Surface Laptop Studio 2 RTX 4060 | |
| Lenovo ThinkPad X1 Carbon G11 21HNS54T00 | |
| Lenovo ThinkPad X1 Carbon G11 21HNS54T00 | |
| Media della classe Workstation (411 - 538, n=23, ultimi 2 anni) | |
* ... Meglio usare valori piccoli
| PCMark 10 Score | 6628 punti | |
Aiuto | ||
| AIDA64 / Memory Copy | |
| Media della classe Workstation (56003 - 164795, n=23, ultimi 2 anni) | |
| Acer Swift Edge SFE16 Ryzen 7 7840U | |
| Lenovo ThinkPad P14s G4 21K5000LGE | |
| Media AMD Ryzen 7 PRO 7840U (66487 - 67856, n=5) | |
| Lenovo ThinkPad P16s G2 21K9000CGE | |
| Microsoft Surface Laptop Studio 2 RTX 4060 | |
| Schenker Vision 16 PH6PRX1 | |
| HP EliteBook 845 G10 818N0EA | |
| Lenovo ThinkPad P16v G1 AMD | |
| AIDA64 / Memory Read | |
| Media della classe Workstation (55795 - 121563, n=23, ultimi 2 anni) | |
| Schenker Vision 16 PH6PRX1 | |
| Microsoft Surface Laptop Studio 2 RTX 4060 | |
| Lenovo ThinkPad P16s G2 21K9000CGE | |
| Acer Swift Edge SFE16 Ryzen 7 7840U | |
| Media AMD Ryzen 7 PRO 7840U (47725 - 50543, n=5) | |
| Lenovo ThinkPad P14s G4 21K5000LGE | |
| Lenovo ThinkPad P16v G1 AMD | |
| HP EliteBook 845 G10 818N0EA | |
| AIDA64 / Memory Write | |
| Lenovo ThinkPad P14s G4 21K5000LGE | |
| Media AMD Ryzen 7 PRO 7840U (89477 - 94965, n=5) | |
| Acer Swift Edge SFE16 Ryzen 7 7840U | |
| Lenovo ThinkPad P16s G2 21K9000CGE | |
| Media della classe Workstation (55663 - 214520, n=23, ultimi 2 anni) | |
| Microsoft Surface Laptop Studio 2 RTX 4060 | |
| Schenker Vision 16 PH6PRX1 | |
| HP EliteBook 845 G10 818N0EA | |
| Lenovo ThinkPad P16v G1 AMD | |
| AIDA64 / Memory Latency | |
| Lenovo ThinkPad P14s G4 21K5000LGE | |
| Media AMD Ryzen 7 PRO 7840U (128.6 - 138.9, n=5) | |
| Lenovo ThinkPad P16s G2 21K9000CGE | |
| Media della classe Workstation (84.5 - 165.2, n=23, ultimi 2 anni) | |
| Acer Swift Edge SFE16 Ryzen 7 7840U | |
| HP EliteBook 845 G10 818N0EA | |
| Lenovo ThinkPad P16v G1 AMD | |
| Microsoft Surface Laptop Studio 2 RTX 4060 | |
| Schenker Vision 16 PH6PRX1 | |
* ... Meglio usare valori piccoli
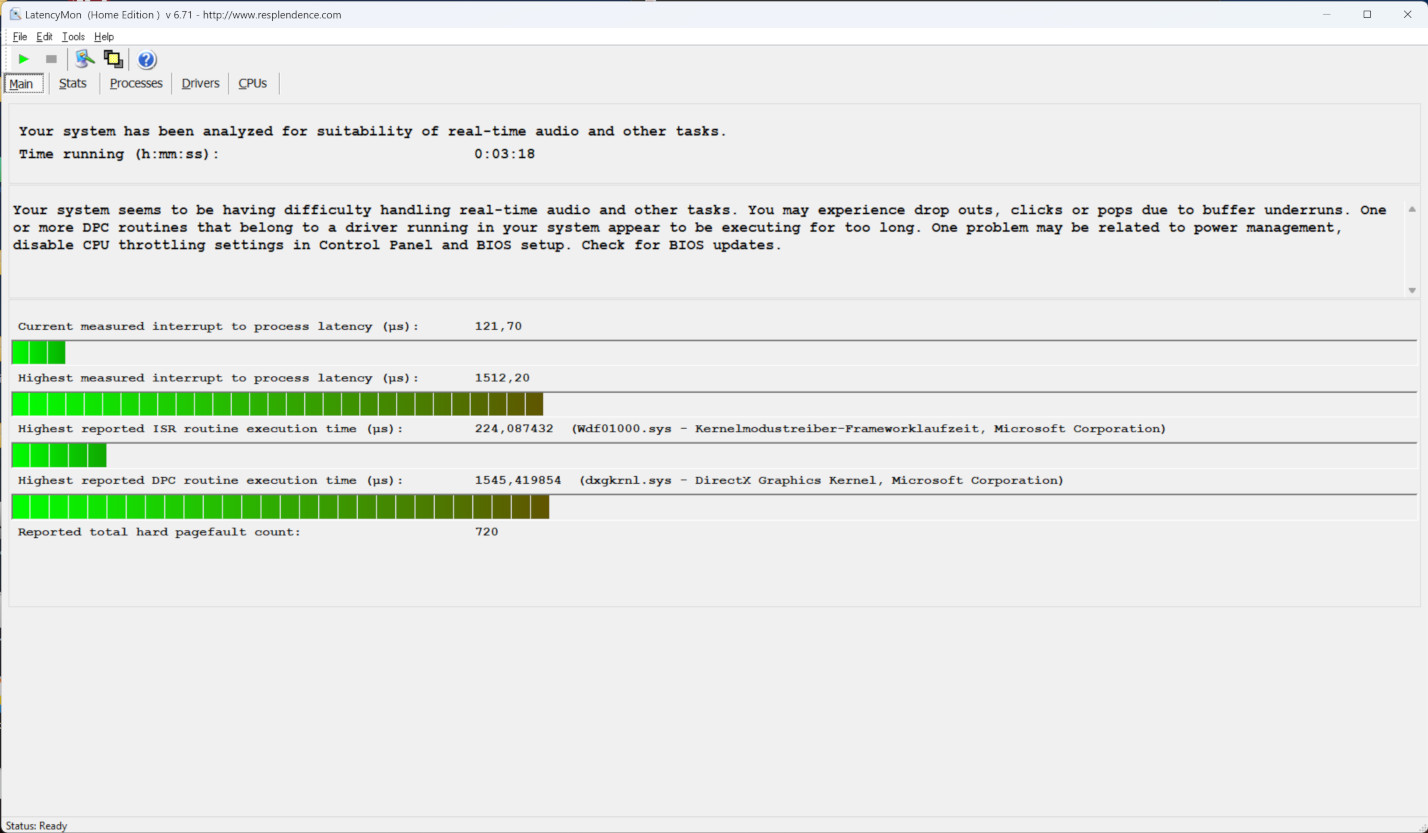
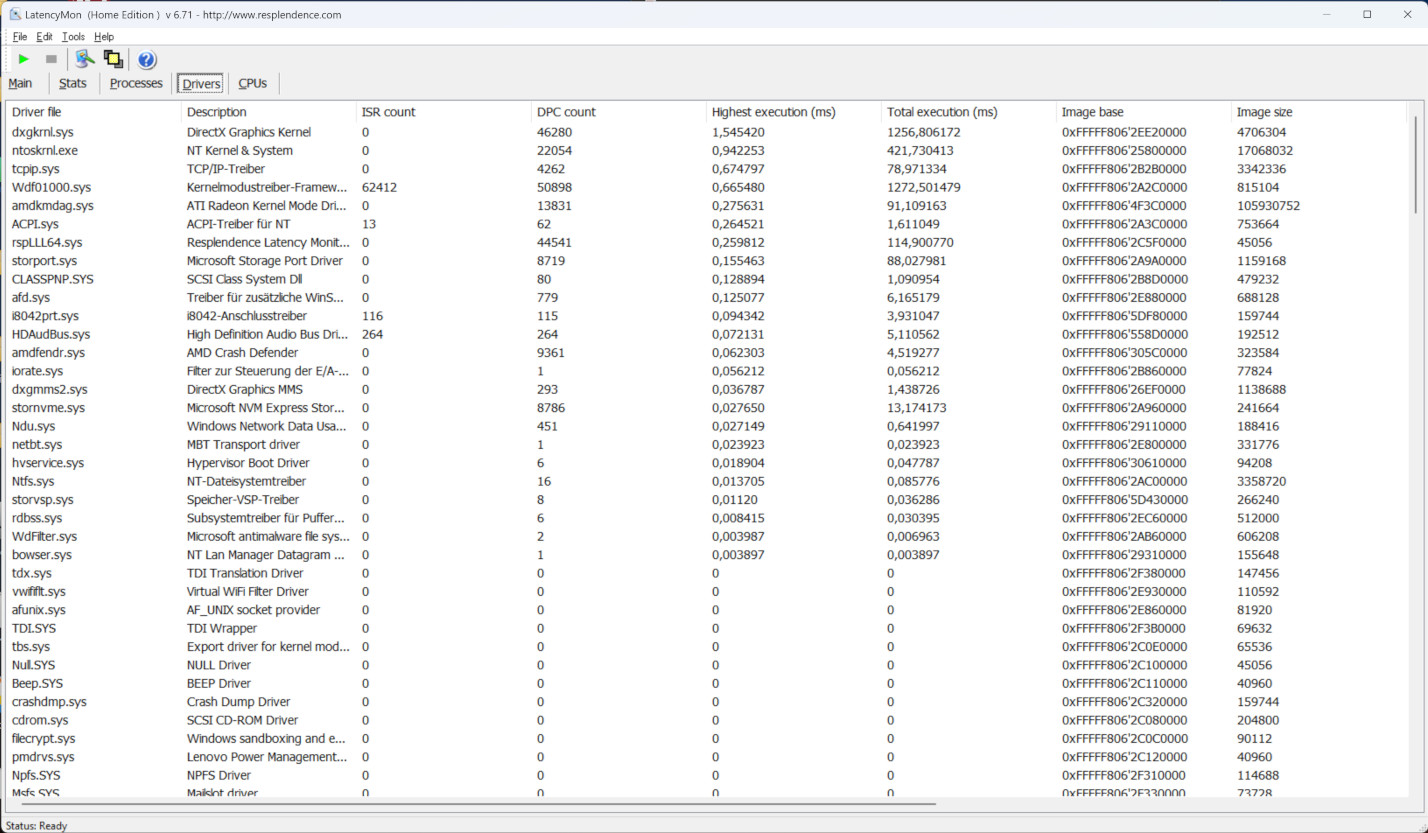
Latenza DPC
I risultati di LatencyMon non erano del tutto all'altezza. Almeno l'editing audio in tempo reale potrebbe porre qualche problema al dispositivo. È interessante notare che i programmi del driver DirectX in particolare hanno causato alcuni problemi. Un aggiornamento potrebbe risolvere alcuni di questi problemi. In generale, i risultati potrebbero essere facilmente modificati in entrambe le direzioni attraverso driver aggiornati o nuovi software.
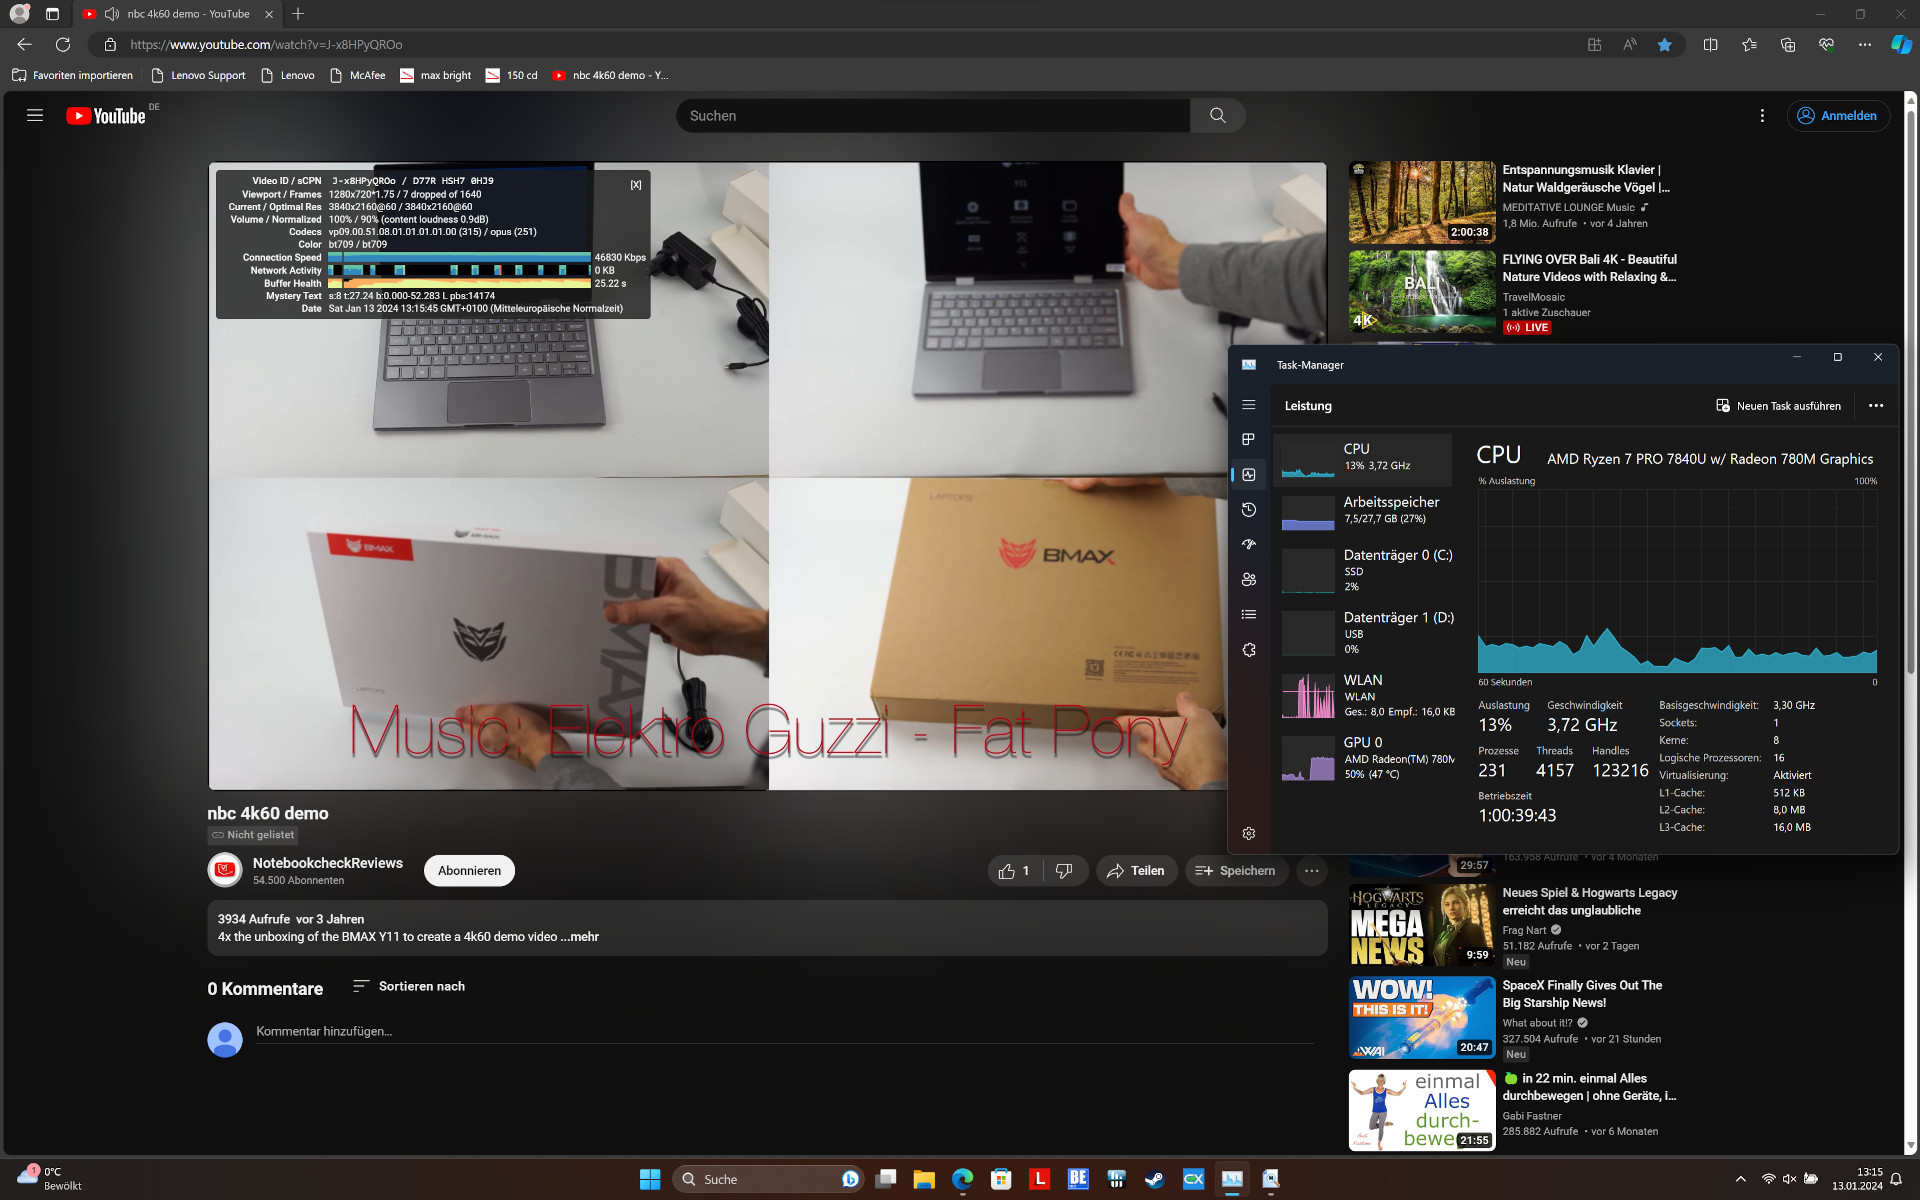
I risultati del video-streaming lasciano un margine di miglioramento simile. I 15 fotogrammi caduti sono semplicemente troppi e un carico della GPU del 50% dimostra che il driver grafico non è stato ancora messo a punto in modo ideale (durante il nostro test, lo stato attuale del driver era del 01/2024).
| DPC Latencies / LatencyMon - interrupt to process latency (max), Web, Youtube, Prime95 | |
| Microsoft Surface Laptop Studio 2 RTX 4060 | |
| Schenker Vision 16 PH6PRX1 | |
| Lenovo ThinkPad P16s G2 21K9000CGE | |
| Lenovo ThinkPad P14s G4 21K5000LGE | |
| HP EliteBook 845 G10 818N0EA | |
| Lenovo ThinkPad P16v G1 AMD | |
| Acer Swift Edge SFE16 Ryzen 7 7840U | |
* ... Meglio usare valori piccoli
Dispositivi di archiviazione
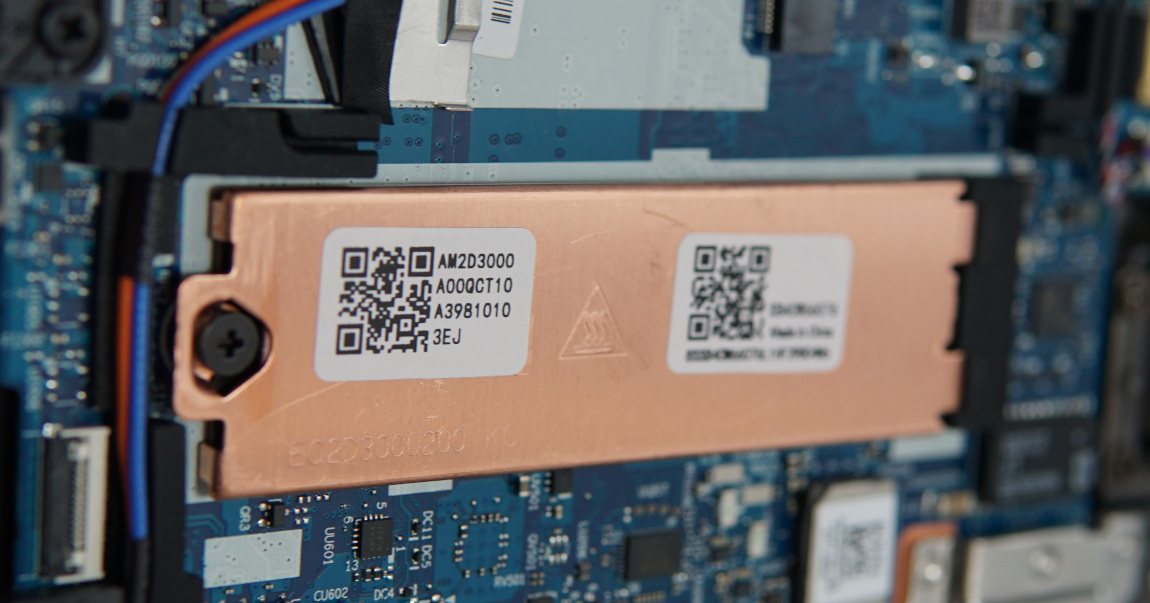
L'elaborato raffreddamento del portatile con una grande piastra di rame ha dato i suoi frutti durante il nostro test continuo. Le sue prestazioni di scrittura sequenziale sono rimaste completamente stabili ed elevate per un lungo periodo di tempo.
L'M.2-SSD di SK Hynix non è in grado di gestire bene grandi quantità di piccoli file con molti accessi paralleli. Tuttavia, questo dovrebbe avere solo un piccolo effetto negativo all'avvio. Nell'uso normale, questo non dovrebbe avere un impatto notevole.

* ... Meglio usare valori piccoli
Reading continuous performance: DiskSpd Read Loop, Queue Depth 8
Scheda grafica
Naturalmente, non ci si deve aspettare troppo da una iGPU, anche se la AMD Radeon 780M si è comportata generalmente bene. Anche senza la propria RAM e con un hardware e un'alimentazione limitati, è stata circa allo stesso livello di una RTX 2050 Mobile. La sua distanza dalla Nvidia RTX A1000 o alla RTX 3050 non era troppo grande.
Il ThinkPad P16s G2 AMD si è comportato di conseguenza bene nel benchmark SPECviewperf, che ci dà un'idea di come si comporta utilizzando un software grafico professionale. Qui, la Nvidia T550 poteva chiaramente essere tenuto a distanza. E sebbene la RTX A1000 sia in vantaggio di circa il 50 %, richiede molta più potenza, più spazio e i computer portatili workstation come un Dell Precision 5470 sono anche molto più costosi.
Altre iGPU come la Intel Iris Xe Graphics G7 96EUs sono molto più deboli e il suo predecessore, la Radeon 680Mè rimasto molto indietro per quanto riguarda le prestazioni grafiche.
Ulteriori misurazioni, test e valutazioni sono disponibili nel nostro elenco di benchmark delle GPU http://www.notebookcheck.com/Mobile-Grafikkarten-Benchmarkliste.735.0.html.
| 3DMark 11 Performance | 12655 punti | |
| 3DMark Cloud Gate Standard Score | 35205 punti | |
| 3DMark Fire Strike Score | 7524 punti | |
| 3DMark Time Spy Score | 3126 punti | |
Aiuto | ||
| SPECviewperf Performance rating - Percent | |
| Media della classe Workstation | |
| HP ZBook Power 15 G10 | |
| Lenovo ThinkPad P16v G1 AMD | |
| Dell Precision 5000 5470 | |
| Lenovo ThinkPad P16s G2 21K9000CGE | |
| Media AMD Radeon 780M | |
| HP ZBook Firefly 14 G9-6B8A2EA | |
| Lenovo ThinkPad T14 G3-21CF004NGE | |
Prestazioni di gioco
Il gioco non è affatto uno dei punti di forza del P16. Tuttavia, il ThinkPad ha dimostrato di essere in grado di giocare bene alla maggior parte dei giochi grazie alla sua unità grafica integrata. Anche il relativamente attuale F1 23 può essere eseguito in Full HD e con dettagli elevati.
I giochi complessi come Starfield e in generale le risoluzioni elevate e i dettagli massimi mostrano rapidamente i limiti dell'iGPU. In particolare, la memoria video esterna non è più sufficiente.
| Starfield | |
| 1920x1080 High Preset | |
| Media AMD Radeon 780M (19 - 21.3, n=3) | |
| Lenovo ThinkPad P16s G2 21K9000CGE | |
| Lenovo ThinkPad P14s G4 21K5000LGE | |
| 1920x1080 Ultra Preset | |
| Media AMD Radeon 780M (15 - 19.1, n=3) | |
| Lenovo ThinkPad P14s G4 21K5000LGE | |
| Lenovo ThinkPad P16s G2 21K9000CGE | |
Utilizzando l'impostazione di dettaglio più alta, il test continuo con The Witcher 3 si è svolto in modo completamente fluido e senza brutte sorprese. Ciò significa che le sue buone prestazioni grafiche rimangono disponibili anche per periodi di tempo più lunghi.
Witcher 3 FPS diagram
| basso | medio | alto | ultra | QHD | 4K | |
|---|---|---|---|---|---|---|
| GTA V (2015) | 140 | 128.7 | 64.5 | 27.3 | 19.1 | 20.7 |
| The Witcher 3 (2015) | 138 | 94 | 47 | 30 | 20 | 15 |
| Dota 2 Reborn (2015) | 117.5 | 89.9 | 82.1 | 69.5 | 31.2 | |
| Final Fantasy XV Benchmark (2018) | 74.9 | 34.3 | 25.2 | 17.7 | 11.2 | |
| X-Plane 11.11 (2018) | 47.1 | 33.2 | 28.1 | 19.2 | ||
| Far Cry 5 (2018) | 69 | 46 | 42 | 40 | 27 | 12 |
| Strange Brigade (2018) | 157.4 | 65.5 | 56.1 | 46.9 | 31.7 | 16.3 |
| F1 23 (2023) | 81.6 | 72.3 | 51.3 | 11.9 | 7.36 | 3.24 |
| Starfield (2023) | 27 | 23 | 19 | 15 | 12 | 7 |
Emissioni - Il ThinkPad P16s è sempre riservato
Emissioni di rumore
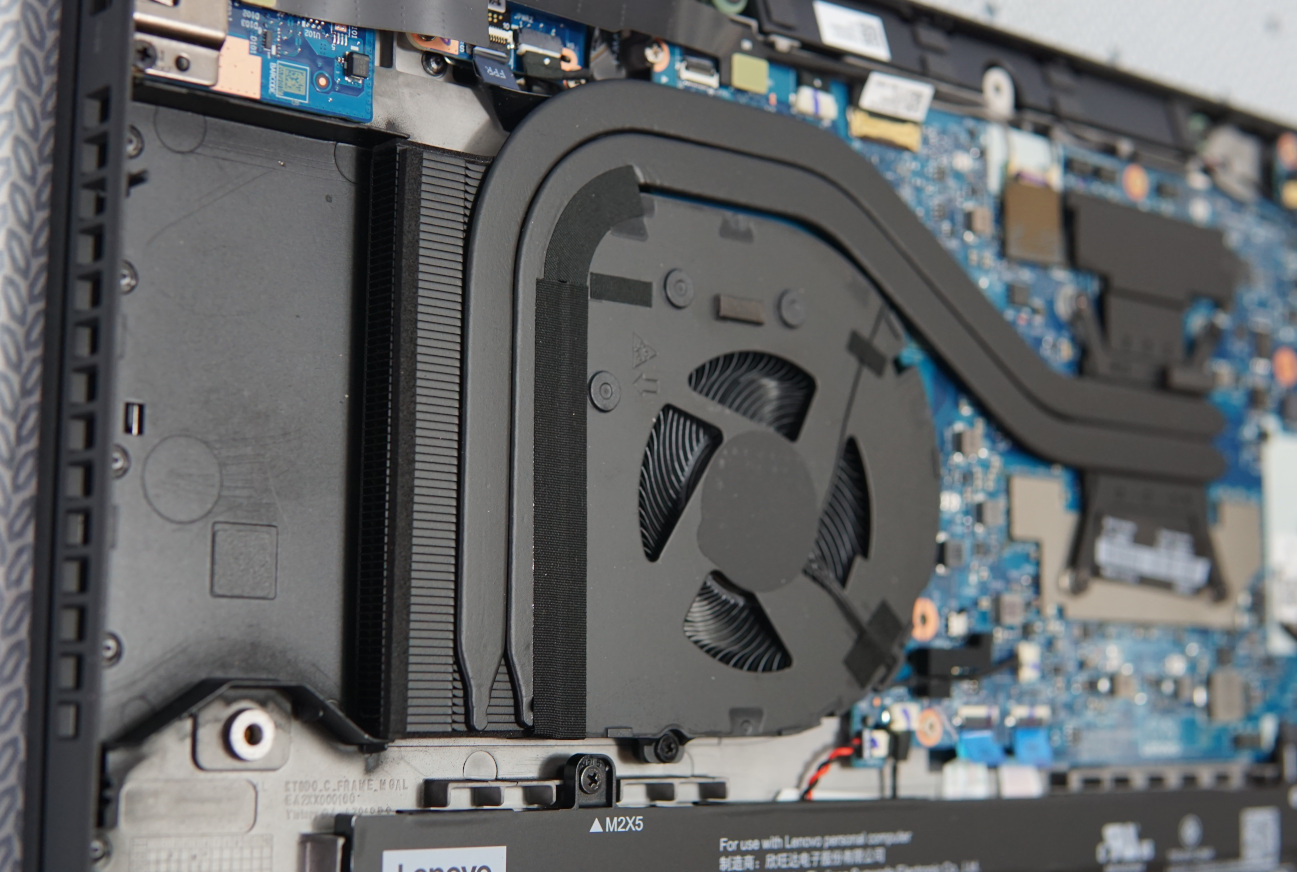
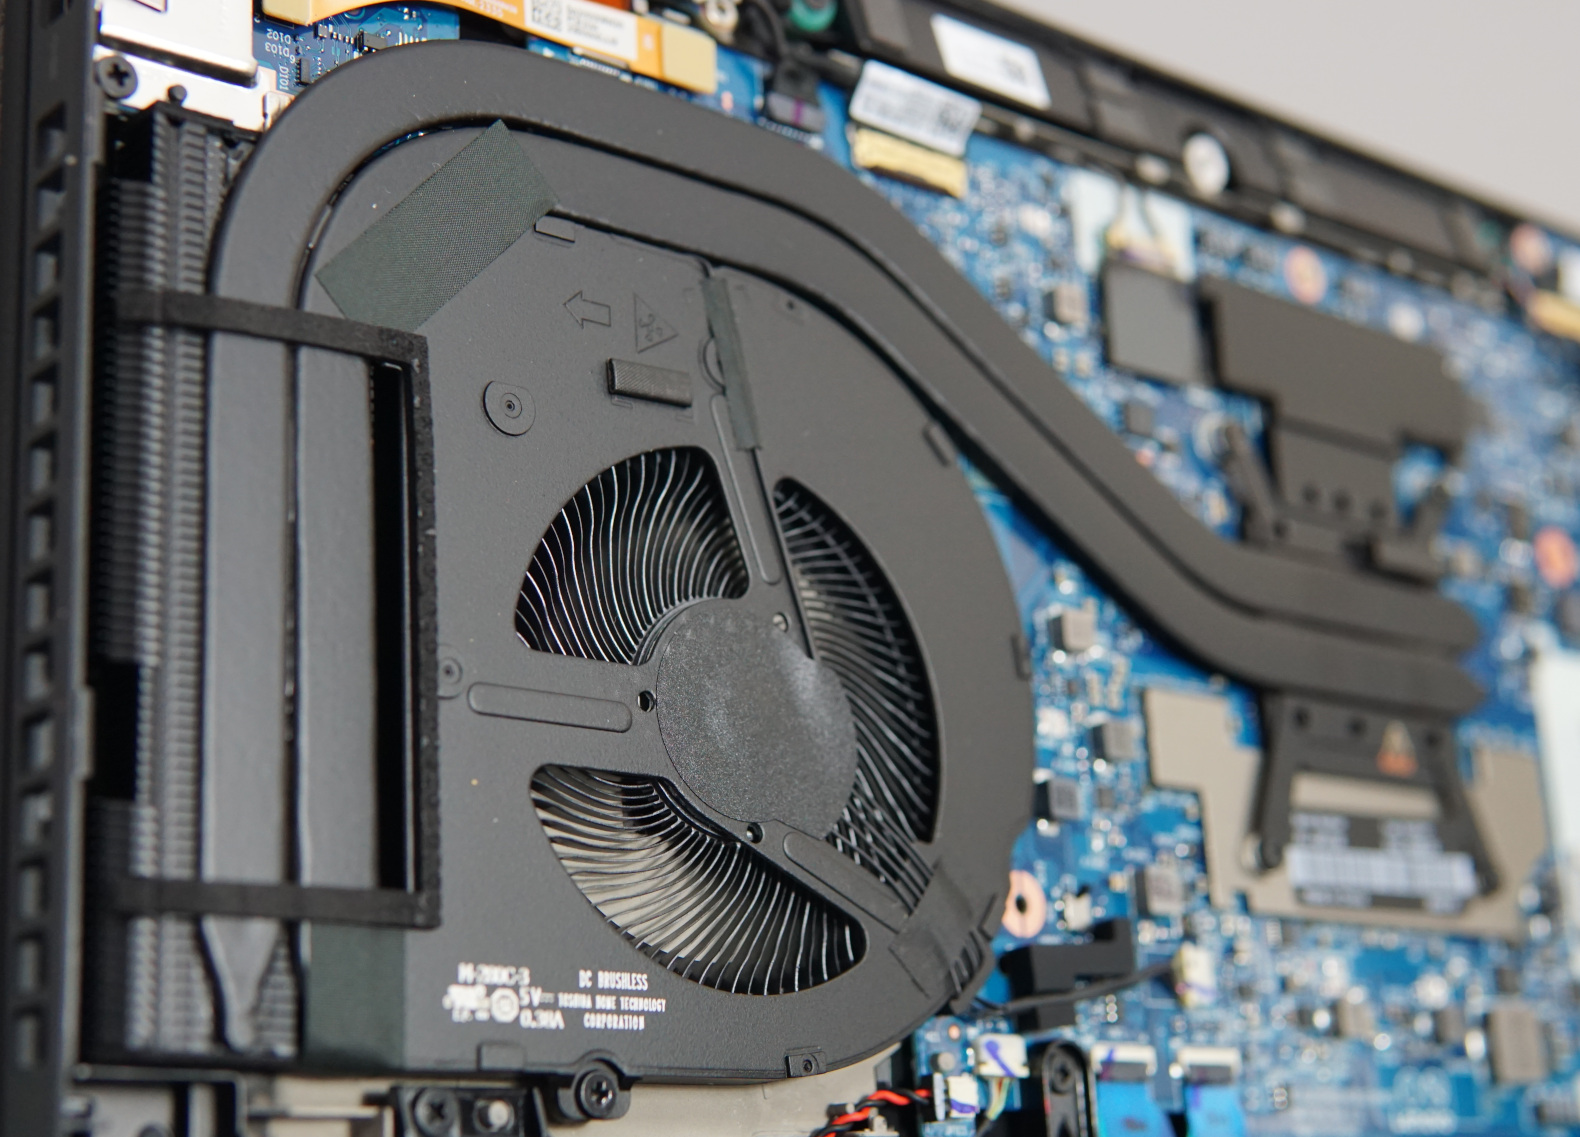
Rispetto al più piccolo ThinkPad P14s G4la ventola delle stesse dimensioni dell'attuale ThinkPad P16s G2 deve affrontare molto più calore. Allo stesso tempo, deve anche superare una piccola distanza verso l'esterno. Questo non è l'ideale, ma molto probabilmente è stato fatto per risparmiare.
Ciò significa che le emissioni acustiche del dispositivo sono un po' più intense durante il carico elevato, stimiamo che siano circa il doppio rispetto al P14s G4. Abbiamo misurato emissioni acustiche massime di 40 dB, che non sono nulla di preoccupante. Inoltre, il P16s offre un po' più di prestazioni rispetto al P14s G4 con la stessa CPU. Una ventola più grande o meglio posizionata avrebbe potuto portare a risultati decisamente migliori.
Un aspetto positivo, invece, è il comportamento durante le attività molto semplici. In questo caso, la ventola rimane completamente silenziosa.
Rumorosità
| Idle |
| 22.6 / 22.6 / 22.6 dB(A) |
| Sotto carico |
| 37.8 / 40.5 dB(A) |
 | ||
30 dB silenzioso 40 dB(A) udibile 50 dB(A) rumoroso |
||
min: | ||
| Lenovo ThinkPad P16s G2 21K9000CGE Radeon 780M, R7 PRO 7840U, SK hynix PC801 HFS001TEJ9X162N | HP EliteBook 845 G10 818N0EA Radeon 780M, R9 PRO 7940HS, SK hynix PC801 HFS001TEJ9X101N | Lenovo ThinkPad P14s G4 21K5000LGE Radeon 780M, R7 PRO 7840U, SK hynix PC801 HFS512GEJ9X162N | Schenker Vision 16 PH6PRX1 Iris Xe G7 96EUs, i7-13700H, Samsung 990 Pro 1 TB | Acer Swift Edge SFE16 Ryzen 7 7840U Radeon 780M, R7 7840U, SK hynix HFS512GEJ9X125N | Lenovo ThinkPad P16v G1 AMD RTX A1000 Laptop GPU, R7 PRO 7840HS, SK hynix PC801 HFS001TEJ9X101N | Microsoft Surface Laptop Studio 2 RTX 4060 GeForce RTX 4060 Laptop GPU, i7-13700H, Kioxia XG8 KXG80ZNV1T02 | |
|---|---|---|---|---|---|---|---|
| Noise | -8% | 4% | -11% | -8% | -8% | -18% | |
| off /ambiente * (dB) | 22.6 | 25.3 -12% | 22.4 1% | 25.5 -13% | 23.4 -4% | 24.3 -8% | 23.9 -6% |
| Idle Minimum * (dB) | 22.6 | 25.3 -12% | 22.4 1% | 25.5 -13% | 24.1 -7% | 24.3 -8% | 23.9 -6% |
| Idle Average * (dB) | 22.6 | 25.3 -12% | 22.4 1% | 28.7 -27% | 24.3 -8% | 24.3 -8% | 24.4 -8% |
| Idle Maximum * (dB) | 22.6 | 25.3 -12% | 22.4 1% | 29.1 -29% | 28 -24% | 24.3 -8% | 26.9 -19% |
| Load Average * (dB) | 37.8 | 34.4 9% | 31.3 17% | 33.8 11% | 41 -8% | 35.7 6% | 48.5 -28% |
| Witcher 3 ultra * (dB) | 40.3 | 43.4 -8% | 39.5 2% | 37.6 7% | 40.9 -1% | 43.7 -8% | 51.8 -29% |
| Load Maximum * (dB) | 40.5 | 43.4 -7% | 39.2 3% | 44.9 -11% | 40.9 -1% | 50.2 -24% | 51.8 -28% |
* ... Meglio usare valori piccoli
Temperatura
Anche senza le ventole attive, il portatile si riscalda solo in minima parte. Questo accade quando si naviga sul web, si trasmette in streaming, si svolge un lavoro d'ufficio o qualcosa di simile. In nessun momento il case raggiunge i 30 °C in questi scenari.
D'altro canto, il case si scalda parecchio quando il calore deve essere dissipato dal processore. Abbiamo misurato oltre 40 °C sulla tastiera e addirittura oltre 47 °C sul fondo. Ciò significa che potrebbe risultare un po' scomodo da usare a pieno carico.
(±) La temperatura massima sul lato superiore è di 42.7 °C / 109 F, rispetto alla media di 38.2 °C / 101 F, che varia da 22.2 a 69.8 °C per questa classe Workstation.
(-) Il lato inferiore si riscalda fino ad un massimo di 47.2 °C / 117 F, rispetto alla media di 41.1 °C / 106 F
(+) In idle, la temperatura media del lato superiore è di 25.7 °C / 78 F, rispetto alla media deld ispositivo di 32 °C / 90 F.
(±) Riproducendo The Witcher 3, la temperatura media per il lato superiore e' di 34.5 °C / 94 F, rispetto alla media del dispositivo di 32 °C / 90 F.
(+) I poggiapolsi e il touchpad raggiungono la temperatura massima della pelle (32.9 °C / 91.2 F) e quindi non sono caldi.
(-) La temperatura media della zona del palmo della mano di dispositivi simili e'stata di 27.8 °C / 82 F (-5.1 °C / -9.2 F).
| Lenovo ThinkPad P16s G2 21K9000CGE AMD Ryzen 7 PRO 7840U, AMD Radeon 780M | HP EliteBook 845 G10 818N0EA AMD Ryzen 9 PRO 7940HS, AMD Radeon 780M | Lenovo ThinkPad P14s G4 21K5000LGE AMD Ryzen 7 PRO 7840U, AMD Radeon 780M | Schenker Vision 16 PH6PRX1 Intel Core i7-13700H, Intel Iris Xe Graphics G7 96EUs | Acer Swift Edge SFE16 Ryzen 7 7840U AMD Ryzen 7 7840U, AMD Radeon 780M | Lenovo ThinkPad P16v G1 AMD AMD Ryzen 7 PRO 7840HS, NVIDIA RTX A1000 Laptop GPU | Microsoft Surface Laptop Studio 2 RTX 4060 Intel Core i7-13700H, NVIDIA GeForce RTX 4060 Laptop GPU | |
|---|---|---|---|---|---|---|---|
| Heat | -2% | 3% | 5% | -4% | 1% | 6% | |
| Maximum Upper Side * (°C) | 42.7 | 45.6 -7% | 41.1 4% | 41.1 4% | 41.6 3% | 40.9 4% | 40.4 5% |
| Maximum Bottom * (°C) | 47.2 | 51.9 -10% | 48.2 -2% | 42 11% | 46.6 1% | 57.9 -23% | 42.2 11% |
| Idle Upper Side * (°C) | 27.8 | 26.5 5% | 26.5 5% | 28.5 -3% | 30.4 -9% | 24.5 12% | 26.6 4% |
| Idle Bottom * (°C) | 28.4 | 27 5% | 26.9 5% | 26.8 6% | 31 -9% | 25.5 10% | 27 5% |
* ... Meglio usare valori piccoli
Test da sforzo
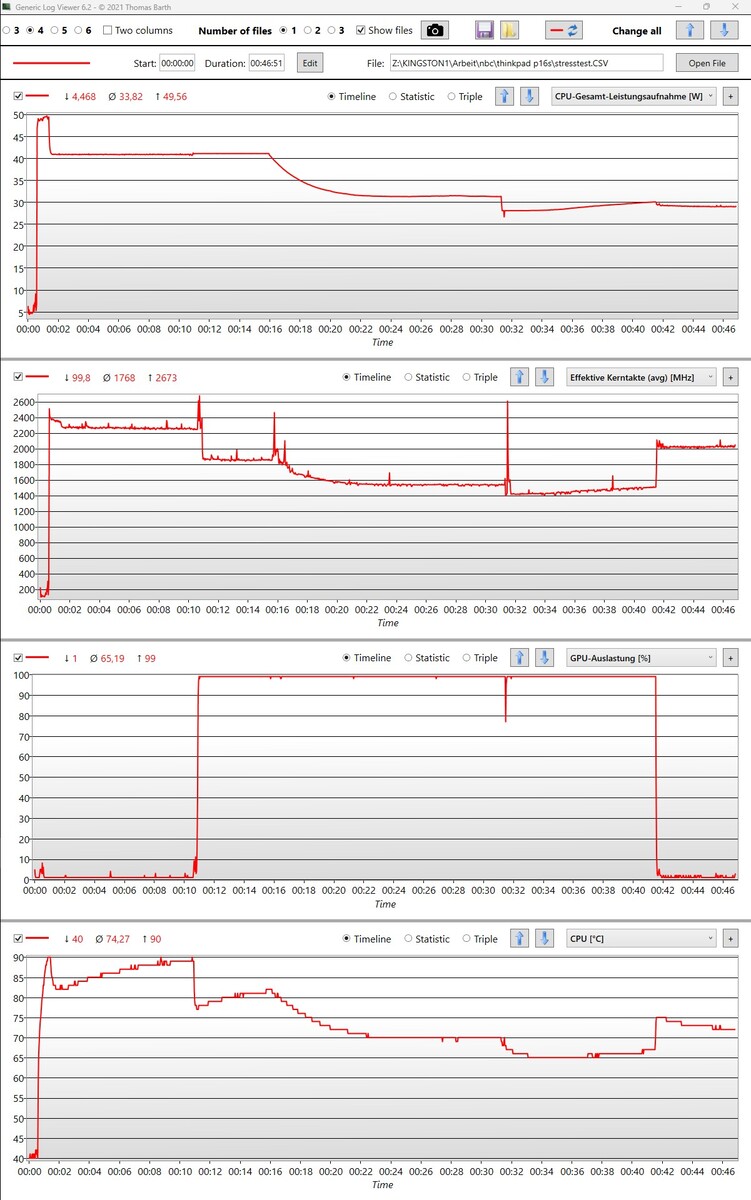
Se la CPU e l'iGPU sono completamente caricate utilizzando Prime95 e FurMark, l'alimentazione rimane stabile, con 41 watt erogati al processore. Quando si passa alla modalità prestazioni, i parametri si adattano senza problemi.
L'unità grafica può essere utilizzata completamente allo stesso tempo, attraverso le diverse impostazioni di potenza. La ventola diventa un po' più silenziosa quanto più si riduce l'alimentazione massima.
La temperatura del processore che abbiamo misurato ha raggiunto i 90 °C solo per un breve periodo a pieno carico. Con il risparmio energetico massimo, le temperature sono rimaste a 65 °C nonostante il volume ridotto della ventola. Nulla ostacola la possibilità di utilizzare il sistema in ogni momento.
Altoparlanti
I diffusori sono deboli: mancano i bassi. Anche i medi bassi sono a malapena in evidenza e il loro volume massimo potrebbe essere più alto. Inoltre, mancano di alcuni dettagli, anche se le voci hanno in genere un buon suono, anche durante le canzoni complesse.
Sono sufficienti per le videochiamate, la musica di sottofondo o lo streaming occasionale. Non ci aspetteremmo nulla di meglio dai semplici altoparlanti di un computer portatile, soprattutto quelli di una workstation.
Lenovo ThinkPad P16s G2 21K9000CGE analisi audio
(±) | potenza degli altiparlanti media ma buona (76.2 dB)
Bassi 100 - 315 Hz
(-) | quasi nessun basso - in media 26.5% inferiori alla media
(±) | la linearità dei bassi è media (12.3% delta rispetto alla precedente frequenza)
Medi 400 - 2000 Hz
(+) | medi bilanciati - solo only 3.9% rispetto alla media
(+) | medi lineari (6.9% delta rispetto alla precedente frequenza)
Alti 2 - 16 kHz
(+) | Alti bilanciati - appena 3.5% dalla media
(+) | alti lineari (4.8% delta rispetto alla precedente frequenza)
Nel complesso 100 - 16.000 Hz
(±) | la linearità complessiva del suono è media (21.3% di differenza rispetto alla media
Rispetto alla stessa classe
» 77% di tutti i dispositivi testati in questa classe è stato migliore, 6% simile, 18% peggiore
» Il migliore ha avuto un delta di 7%, medio di 17%, peggiore di 35%
Rispetto a tutti i dispositivi testati
» 59% di tutti i dispositivi testati in questa classe è stato migliore, 7% similare, 33% peggiore
» Il migliore ha avuto un delta di 4%, medio di 23%, peggiore di 134%
Apple MacBook Pro 16 2021 M1 Pro analisi audio
(+) | gli altoparlanti sono relativamente potenti (84.7 dB)
Bassi 100 - 315 Hz
(+) | bassi buoni - solo 3.8% dalla media
(+) | bassi in lineaa (5.2% delta rispetto alla precedente frequenza)
Medi 400 - 2000 Hz
(+) | medi bilanciati - solo only 1.3% rispetto alla media
(+) | medi lineari (2.1% delta rispetto alla precedente frequenza)
Alti 2 - 16 kHz
(+) | Alti bilanciati - appena 1.9% dalla media
(+) | alti lineari (2.7% delta rispetto alla precedente frequenza)
Nel complesso 100 - 16.000 Hz
(+) | suono nel complesso lineare (4.6% differenza dalla media)
Rispetto alla stessa classe
» 0% di tutti i dispositivi testati in questa classe è stato migliore, 0% simile, 100% peggiore
» Il migliore ha avuto un delta di 5%, medio di 17%, peggiore di 45%
Rispetto a tutti i dispositivi testati
» 0% di tutti i dispositivi testati in questa classe è stato migliore, 0% similare, 100% peggiore
» Il migliore ha avuto un delta di 4%, medio di 23%, peggiore di 134%
Gestione dell'energia - La workstation raggiunge i suoi limiti
Consumo di energia
A causa dell'elevato consumo energetico permanente del sistema, il misero alimentatore da 65 watt potrebbe raggiungere il suo limite quando si richiede il massimo all'hardware. Tuttavia, i 68 watt che abbiamo misurato dovrebbero essere disponibili senza grossi problemi. Tuttavia, non ha un buffer per caricare il portatile. Se ha solo metà carica, rimarrà così fino a quando la CPU e la GPU non richiederanno meno energia. Allo stesso tempo, non abbiamo registrato alcuna scarica indesiderata durante lo stress test.
Una potenza maggiore di 90 watt sarebbe stata sicuramente la scelta migliore per il ThinkPad P16s G2 AMD.
| Off / Standby | |
| Idle | |
| Sotto carico |
|
Leggenda:
min: | |
| Lenovo ThinkPad P16s G2 21K9000CGE R7 PRO 7840U, Radeon 780M, SK hynix PC801 HFS001TEJ9X162N, OLED, 3840x2400, 16" | HP EliteBook 845 G10 818N0EA R9 PRO 7940HS, Radeon 780M, SK hynix PC801 HFS001TEJ9X101N, IPS, 2560x1600, 14" | Lenovo ThinkPad P14s G4 21K5000LGE R7 PRO 7840U, Radeon 780M, SK hynix PC801 HFS512GEJ9X162N, IPS, 1920x1200, 14" | Schenker Vision 16 PH6PRX1 i7-13700H, Iris Xe G7 96EUs, Samsung 990 Pro 1 TB, IPS, 2560x1600, 16" | Acer Swift Edge SFE16 Ryzen 7 7840U R7 7840U, Radeon 780M, SK hynix HFS512GEJ9X125N, OLED, 3200x2000, 16" | Lenovo ThinkPad P16v G1 AMD R7 PRO 7840HS, RTX A1000 Laptop GPU, SK hynix PC801 HFS001TEJ9X101N, IPS, 1920x1200, 16" | Media AMD Radeon 780M | Media della classe Workstation | |
|---|---|---|---|---|---|---|---|---|
| Power Consumption | -16% | 22% | -41% | -27% | -20% | -17% | -110% | |
| Idle Minimum * (Watt) | 6.1 | 4.3 30% | 2.9 52% | 6.3 -3% | 7.1 -16% | 4.1 33% | 6.01 ? 1% | 9.11 ? -49% |
| Idle Average * (Watt) | 6.5 | 10.1 -55% | 5.1 22% | 14.4 -122% | 10.1 -55% | 6.5 -0% | 8.15 ? -25% | 13.8 ? -112% |
| Idle Maximum * (Watt) | 7 | 11.2 -60% | 5.6 20% | 16.2 -131% | 18.6 -166% | 6.7 4% | 10.3 ? -47% | 17.9 ? -156% |
| Load Average * (Watt) | 56.6 | 64.4 -14% | 51.2 10% | 46.2 18% | 45.3 20% | 65.2 -15% | 57.6 ? -2% | 96 ? -70% |
| Witcher 3 ultra * (Watt) | 61.2 | 59.4 3% | 49.9 18% | 49.4 19% | 39.5 35% | 77.2 -26% | ||
| Load Maximum * (Watt) | 68.3 | 66.7 2% | 60.2 12% | 85.2 -25% | 52.9 23% | 147 -115% | 77 ? -13% | 180.3 ? -164% |
* ... Meglio usare valori piccoli
Power consumption Witcher 3 / stress test
Power consumption with external monitor
Tempi di esecuzione
L'elevata efficienza di AMD Ryzen 7 Pro 7840U è un po' smorzata dal display OLED del portatile. I suoi buoni tempi di esecuzione sono in gran parte dovuti all'ampia capacità della batteria di 84 Wh e non perché sia frugale a basso carico.
I tempi di autonomia di oltre 13 ore e 10 ore (test di navigazione web) significano che può utilizzare il portatile in viaggio senza alcun problema. Tuttavia, questo avviene solo quando la luminosità è ridotta. Nel nostro test, questa era impostata a circa il 60 %. Alla massima luminosità, invece, il display OLED richiede molta più energia, e la navigazione sul web esaurisce la batteria in meno di 7 ore.
Con un display diverso, ad esempio quello del similare ThinkPad P14s G4è possibile aprire siti web ininterrottamente per oltre 11 ore, con una batteria significativamente più piccola da 52 Wh. Facendo un'attenta estrapolazione, il P16s G2 con il pannello IPS e la rappresentazione media dei colori dovrebbe poter essere utilizzato per 16 ore di navigazione.
| Lenovo ThinkPad P16s G2 21K9000CGE R7 PRO 7840U, Radeon 780M, 84 Wh | HP EliteBook 845 G10 818N0EA R9 PRO 7940HS, Radeon 780M, 51 Wh | Schenker Vision 16 PH6PRX1 i7-13700H, Iris Xe G7 96EUs, 80 Wh | Acer Swift Edge SFE16 Ryzen 7 7840U R7 7840U, Radeon 780M, 54 Wh | Lenovo ThinkPad P16v G1 AMD R7 PRO 7840HS, RTX A1000 Laptop GPU, 90 Wh | Microsoft Surface Laptop Studio 2 RTX 4060 i7-13700H, GeForce RTX 4060 Laptop GPU, 58 Wh | Media della classe Workstation | |
|---|---|---|---|---|---|---|---|
| Autonomia della batteria | -32% | 24% | -47% | 16% | 3% | -16% | |
| H.264 (h) | 13.3 | 9.3 -30% | 17.8 34% | 11.3 -15% | 10.1 ? -24% | ||
| WiFi v1.3 (h) | 10.6 | 7.9 -25% | 8 -25% | 5.6 -47% | 15 42% | 8.3 -22% | 8.55 ? -19% |
| Load (h) | 1.5 | 0.9 -40% | 2.6 73% | 1.1 -27% | 2.2 47% | 1.441 ? -4% |
Pro
Contro
Verdetto - Prestazioni e immagini sono ottime, tutto il resto è ok


Il ThinkPad P16s G2 AMD presenta una varietà insolitamente ampia di potenziali utilizzi. Le prestazioni elevate della CPU, abbinate alla buona Radeon 780M iGPU consente un uso professionale, anche per le attività più impegnative dal punto di vista grafico. Forse non è così veloce come su un dispositivo con una scheda grafica dedicata, ma il portatile workstation ha altre cose da offrire.
Le ventole sono spesso silenziose o rimangono completamente disattivate e, nonostante la natura affamata di energia del display OLED, offre tempi di esecuzione decenti. Inoltre, il suo prezzo è adeguato se si considerano le sue prestazioni. Tutto questo si traduce in immagini brillanti e ricche di contrasto, che le consentono di utilizzare il portatile per attività creative. D'altra parte, la sua portabilità potrebbe trarre vantaggio da un display un po' meno elaborato.
Tanta potenza, prestazioni grafiche generalmente sufficienti e una discreta connettività rendono il P16s G2 AMD un eccellente laptop per il lavoro, l'università o i lavori creativi.
Inoltre, il dispositivo vanta una pletora di funzioni di sicurezza e la sua funzione di manutenzione remota potrebbe essere molto utile per i dispositivi aziendali. Il suo case robusto e la buona tastiera lo rendono un ottimo computer portatile da lavoro.
A sua volta, le critiche non sono delle più severe. Naturalmente, una seconda porta USB4 sarebbe utile. Le ventole potrebbero essere un po' più efficienti, soprattutto se si considera quanto spazio non viene utilizzato all'interno. Inoltre, l'alimentazione fornita dal suo alimentatore potrebbe essere un po' limitata, ma non dovrebbe causare gravi limitazioni.
Un'alternativa con prestazioni grafiche aggiuntive potrebbe essere il Lenovo ThinkPad P16v G1, ad esempio. Una migliore portabilità e prestazioni leggermente inferiori sono offerte dal molto simile Lenovo ThinkPad P14s G4 AMD-Il suo display da 14 pollici potrebbe renderlo più adatto ad essere utilizzato in viaggio.
Prezzo e disponibilità
La versione del ThinkPad P16s G2 con 64 GB di RAM e un display OLED si trova a 1.599 dollari su Amazon.
Lenovo ThinkPad P16s G2 21K9000CGE
- 01/23/2024 v7 (old)
Mario Petzold
Transparency
La selezione dei dispositivi da recensire viene effettuata dalla nostra redazione. Il campione di prova è stato fornito all'autore come prestito dal produttore o dal rivenditore ai fini di questa recensione. L'istituto di credito non ha avuto alcuna influenza su questa recensione, né il produttore ne ha ricevuto una copia prima della pubblicazione. Non vi era alcun obbligo di pubblicare questa recensione. In quanto società mediatica indipendente, Notebookcheck non è soggetta all'autorità di produttori, rivenditori o editori.
Ecco come Notebookcheck esegue i test
Ogni anno, Notebookcheck esamina in modo indipendente centinaia di laptop e smartphone utilizzando procedure standardizzate per garantire che tutti i risultati siano comparabili. Da circa 20 anni sviluppiamo continuamente i nostri metodi di prova e nel frattempo stabiliamo gli standard di settore. Nei nostri laboratori di prova, tecnici ed editori esperti utilizzano apparecchiature di misurazione di alta qualità. Questi test comportano un processo di validazione in più fasi. Il nostro complesso sistema di valutazione si basa su centinaia di misurazioni e parametri di riferimento ben fondati, che mantengono l'obiettività.Price comparison

