Recensione dello Schenker Vision 16 2023: 16 pollici leggero con molte porte

A parte il Vision 16 Pro, Schenker offre anche il Vision 16. L'ultrabook da 16 pollici, particolarmente leggero, offre il nuovissimo chip Intel Raptor Lake Core i7-13700H. Le GPU dedicate sono riservate ai modelli Pro. Mentre il modello Vision 16 dello scorso anno raggiungeva un peso di 1,45 kg, il nuovo modello pesa 1,5 kg, il che lo rende ancora uno dei portatili da 16 pollici più leggeri del mercato.
Al posto dello schermo a 90 Hz del modello precedente, il nuovo Vision 16 ha il pannello WQXGA a 240 Hz della variante Pro. Il metallo liquido per trasferire il calore del Core i7-13700H è ancora utilizzato, anche se il sistema di raffreddamento è stato rielaborato per rendere il Vision 16 meno rumoroso sotto carico.
Il Vision 16 è disponibile a partire da 1.539 euro. Il modello base ha 16 GB di memoria DDR5-4800 e un'unità SSD M.2 da 500 GB di Samsung. Il nostro modello in prova è dotato di 32 GB di memoria e di un'unità SSD M.2 Samsung 990 Pro da 1 TB. Con Windows, la versione recensita è disponibile a circa 1.660 euro.
Potenziali concorrenti a confronto
Punteggio | Data | Modello | Peso | Altezza | Dimensione | Risoluzione | Prezzo |
|---|---|---|---|---|---|---|---|
| 88.6 % v7 (old) | 08/2023 | Schenker Vision 16 PH6PRX1 i7-13700H, Iris Xe G7 96EUs | 1.5 kg | 17.1 mm | 16.00" | 2560x1600 | |
| 91.8 % v7 (old) | 06/2023 | Apple MacBook Air 15 2023 M2 16 GB M2, M2 10-Core GPU | 1.5 kg | 11.5 mm | 15.30" | 2880x1864 | |
| 86.6 % v7 (old) | 06/2023 | Acer Swift Go SFG16-71 i7-13700H, Iris Xe G7 96EUs | 1.6 kg | 19 mm | 16.00" | 3200x2000 | |
| 85 % v7 (old) | 08/2023 | LG Gram SuperSlim (2023) i7-1360P, Iris Xe G7 96EUs | 990 gr | 10.9 mm | 15.60" | 1920x1080 | |
| 84.3 % v7 (old) | 04/2023 | Microsoft Surface Laptop 5 15, i7-1255U i7-1255U, Iris Xe G7 96EUs | 1.6 kg | 14.7 mm | 15.00" | 2496x1664 | |
| 83.2 % v7 (old) | 02/2023 | Asus VivoBook S15 M3502RA-L1029W R7 6800H, Radeon 680M | 1.9 kg | 18.8 mm | 15.60" | 1920x1080 |
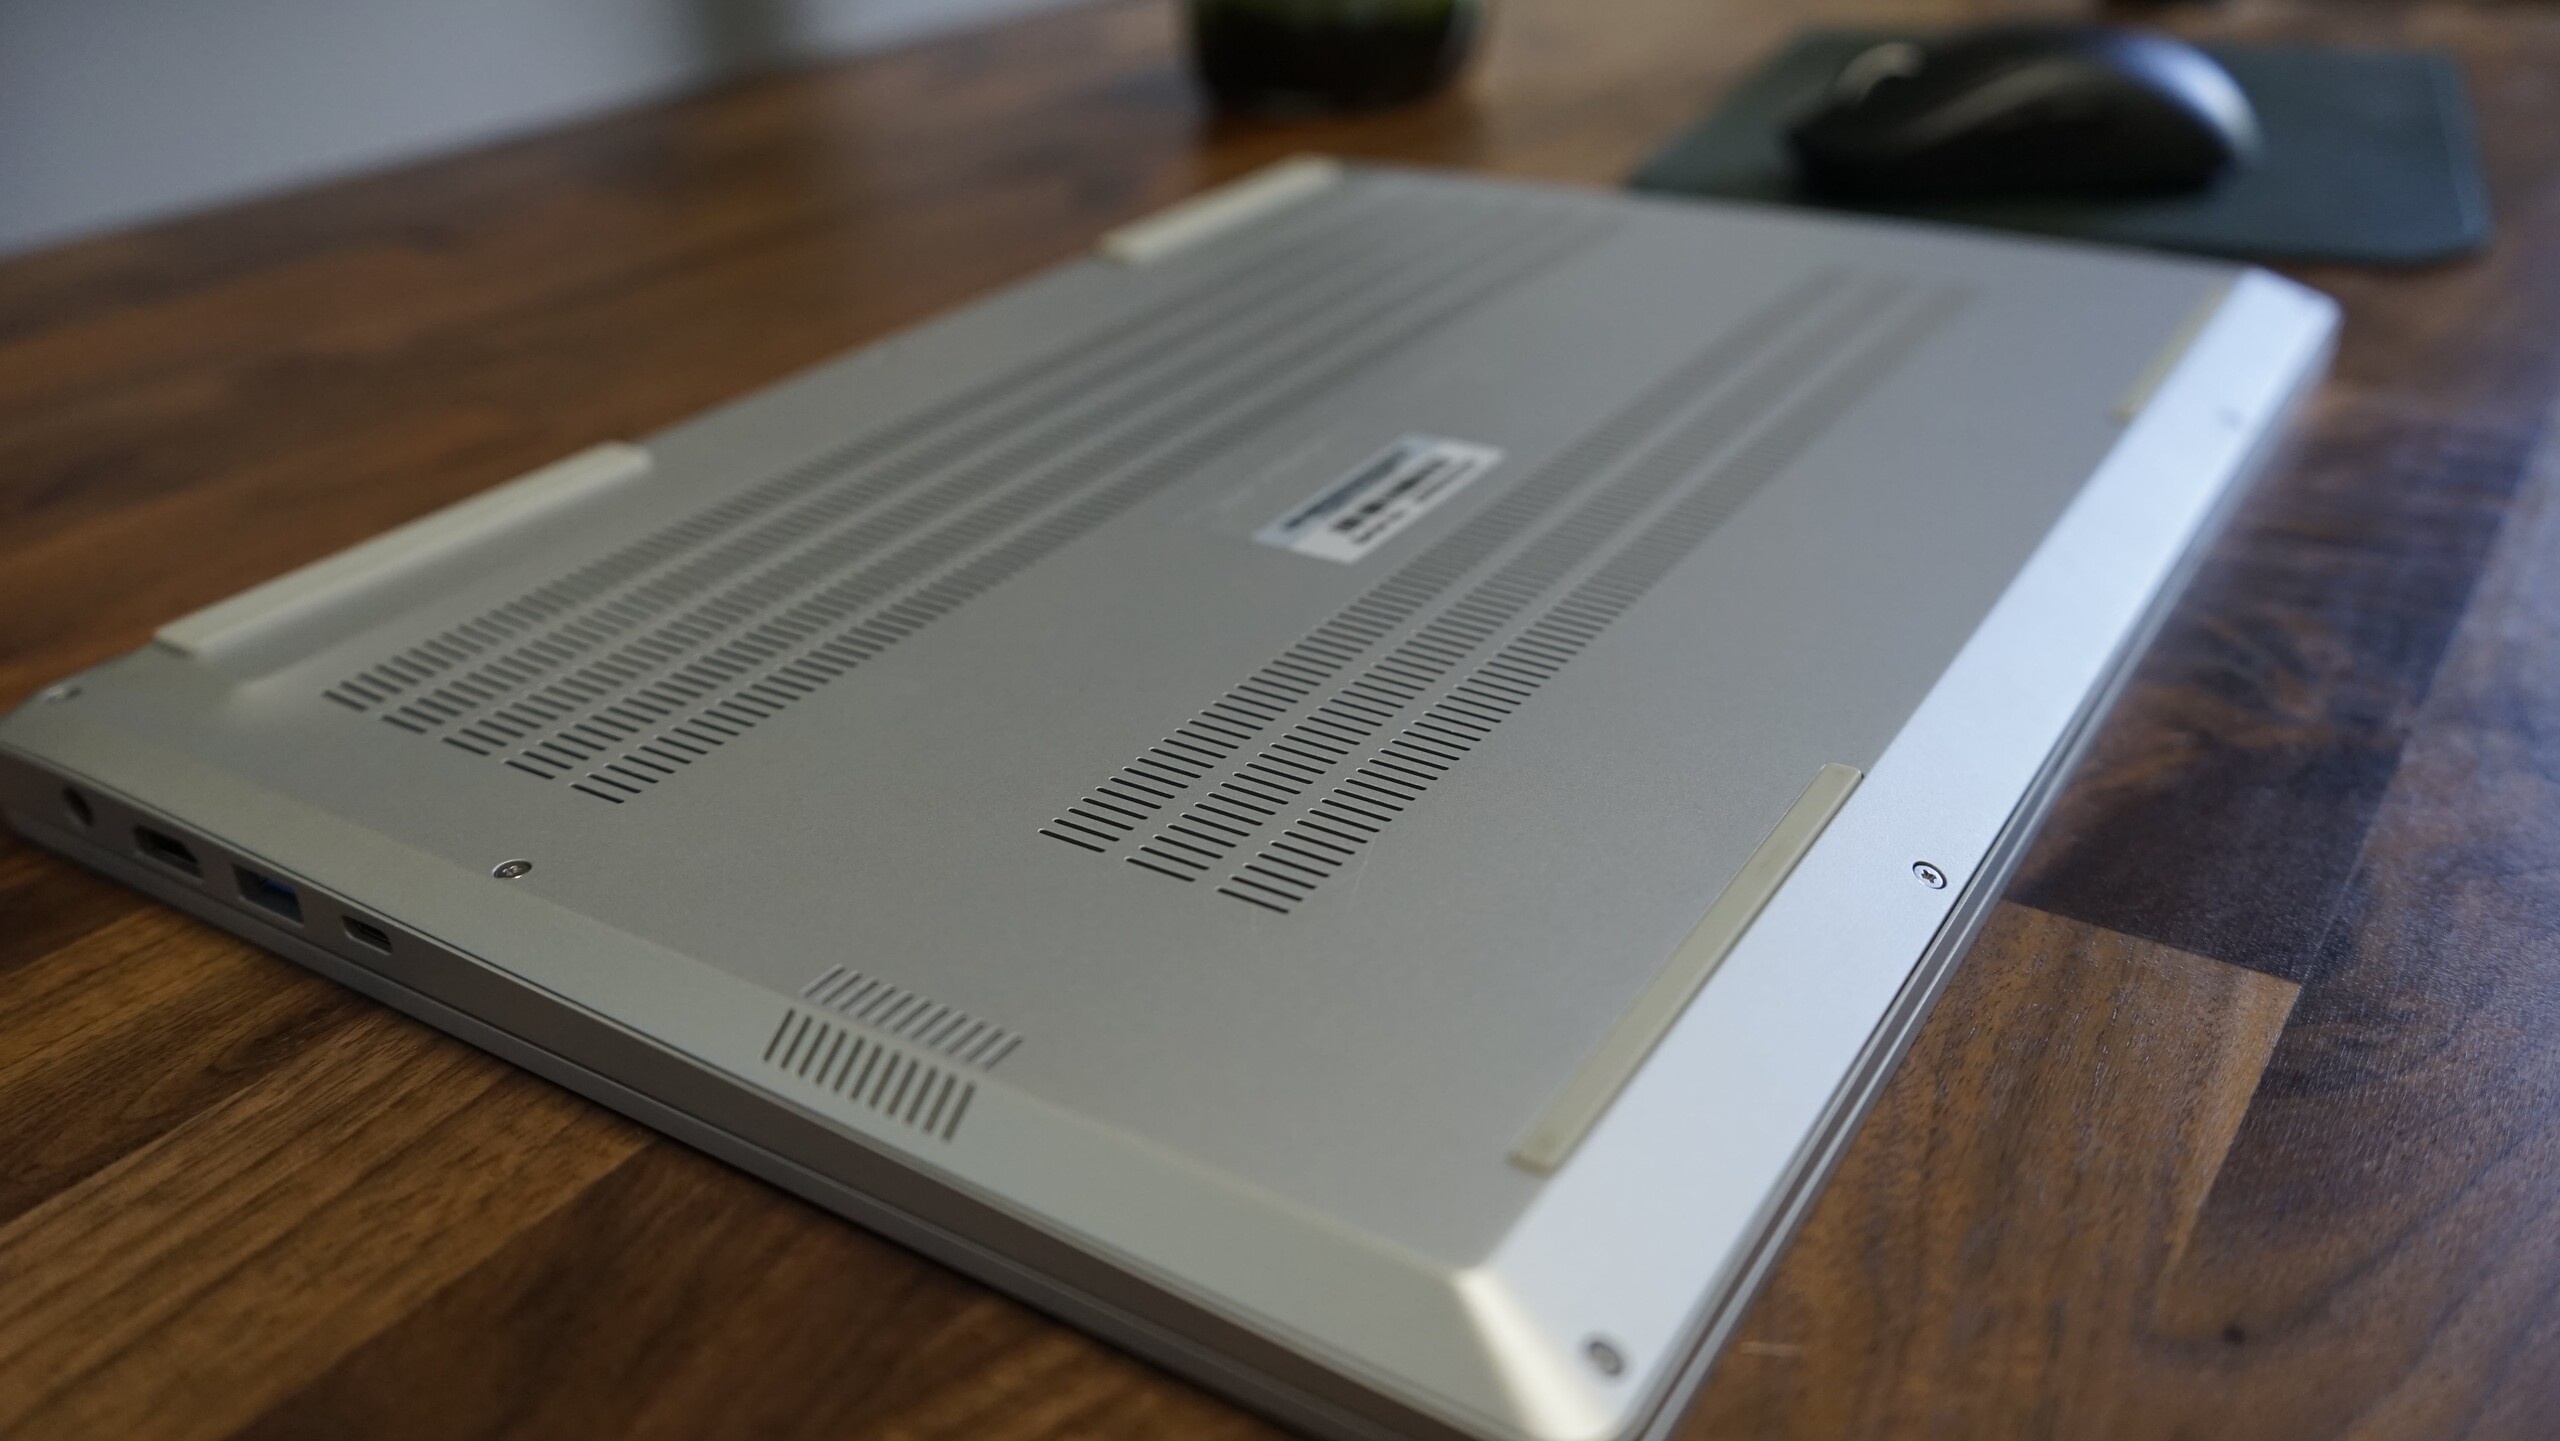
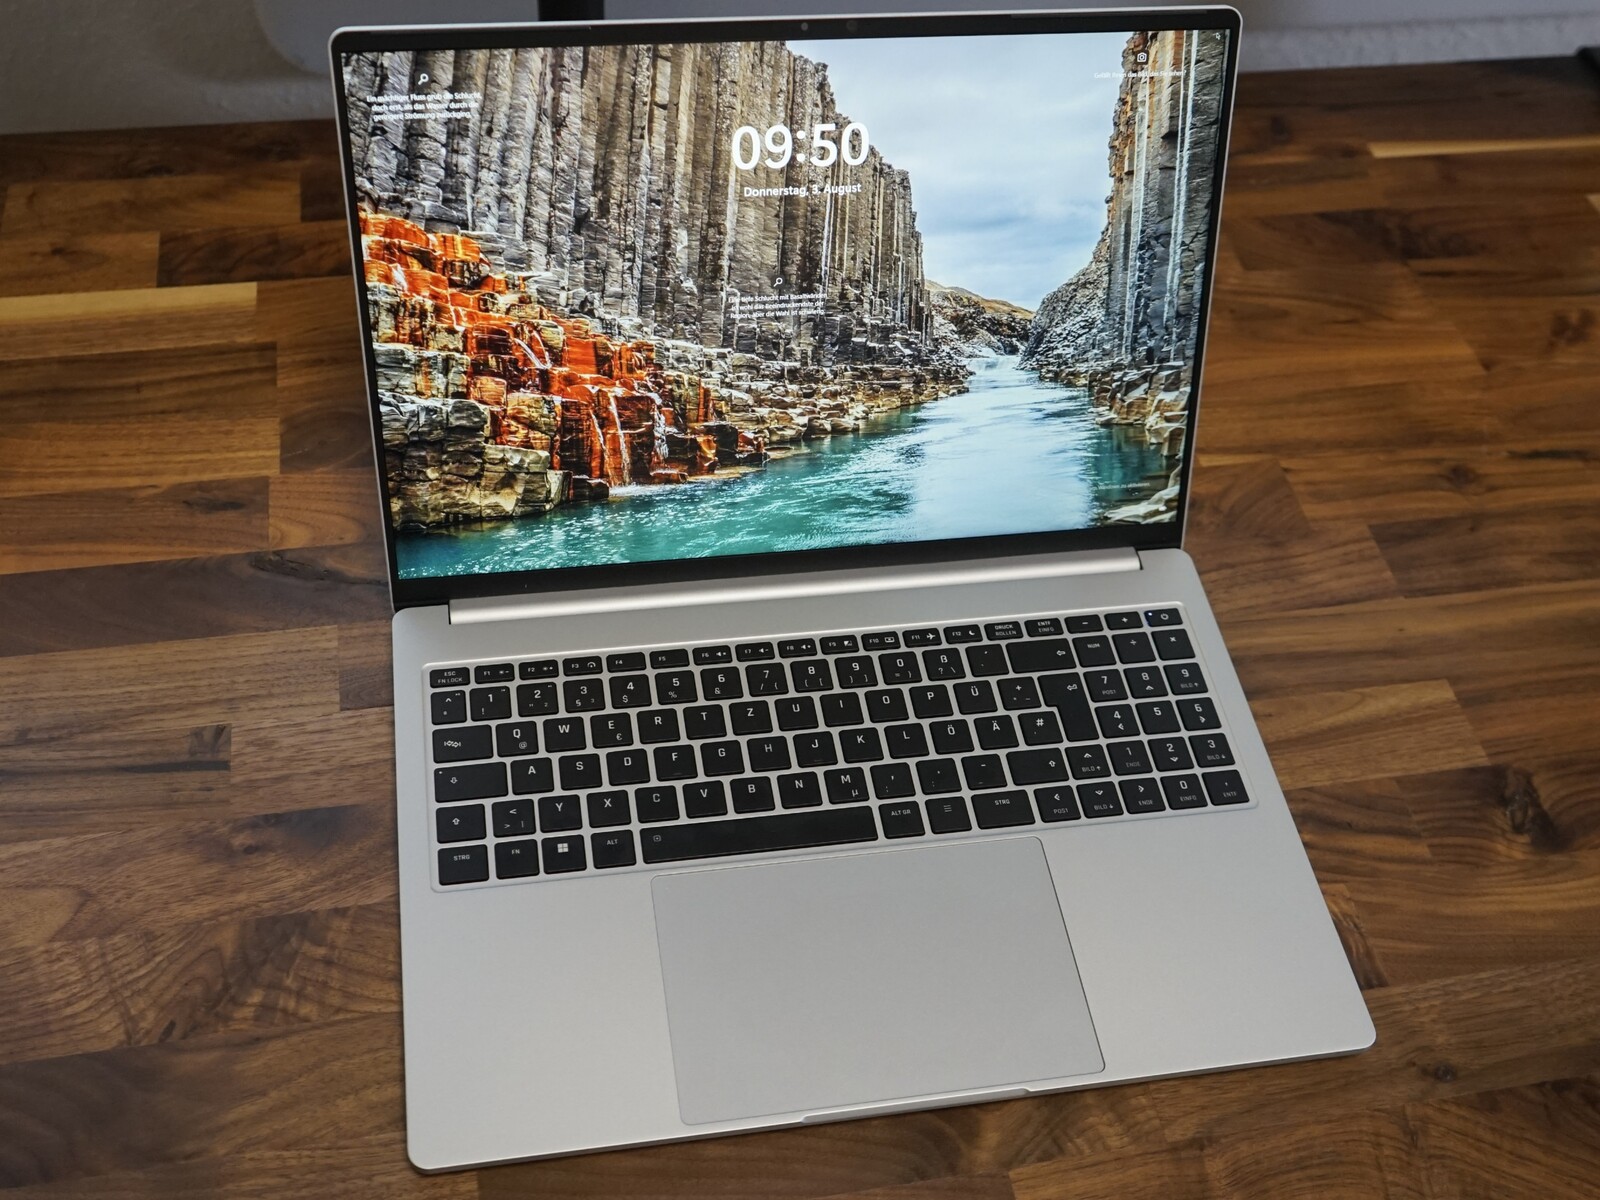
Telaio - laptop in magnesio da 1,5 kg
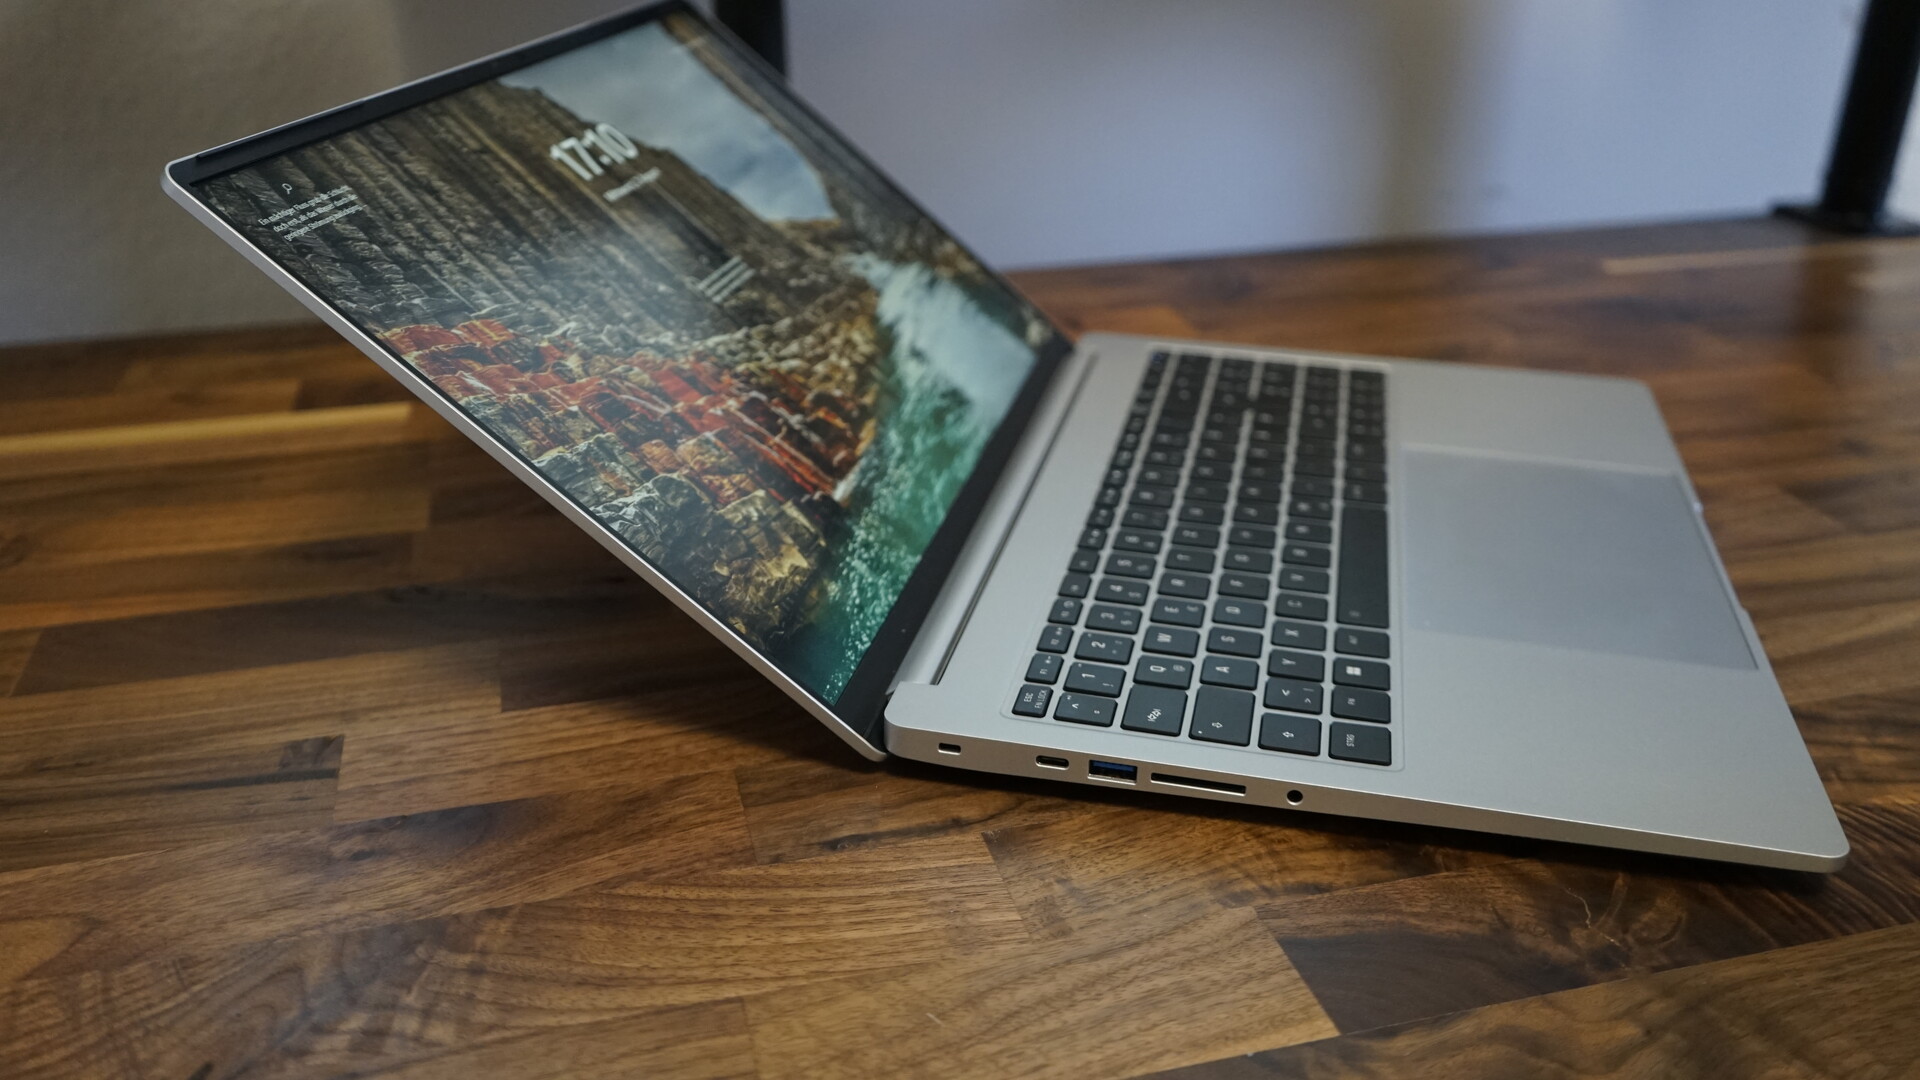
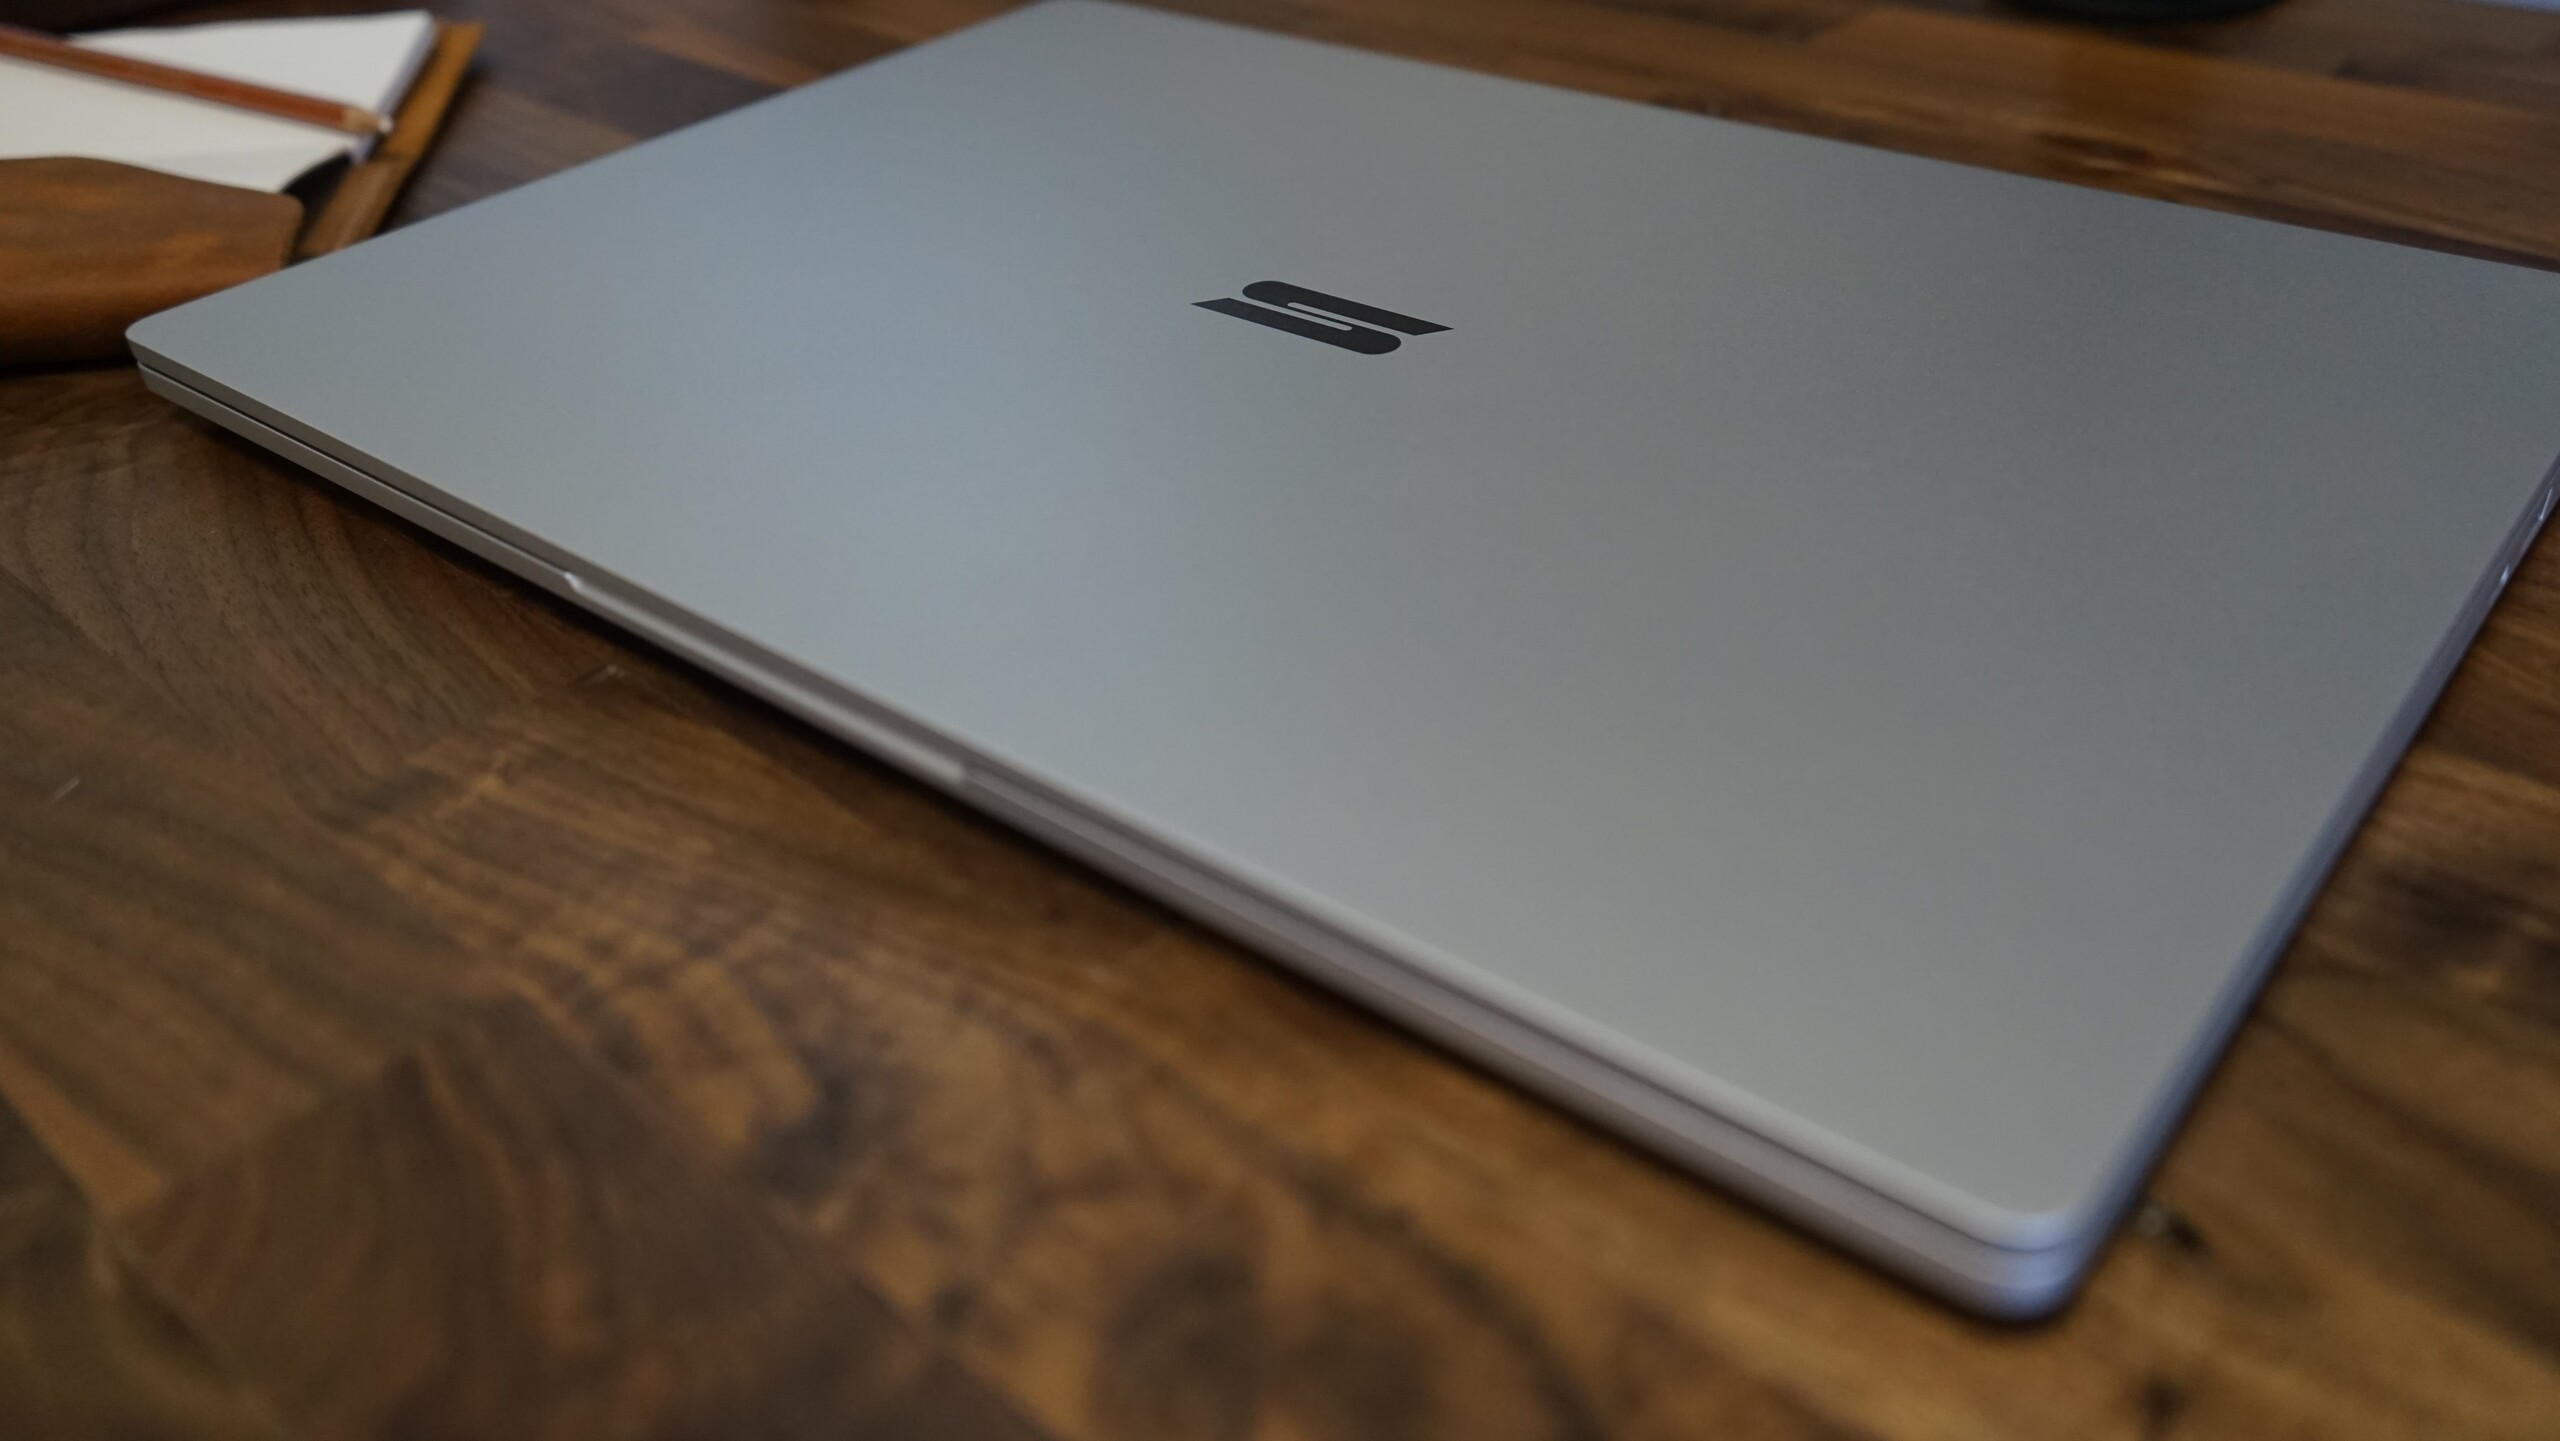
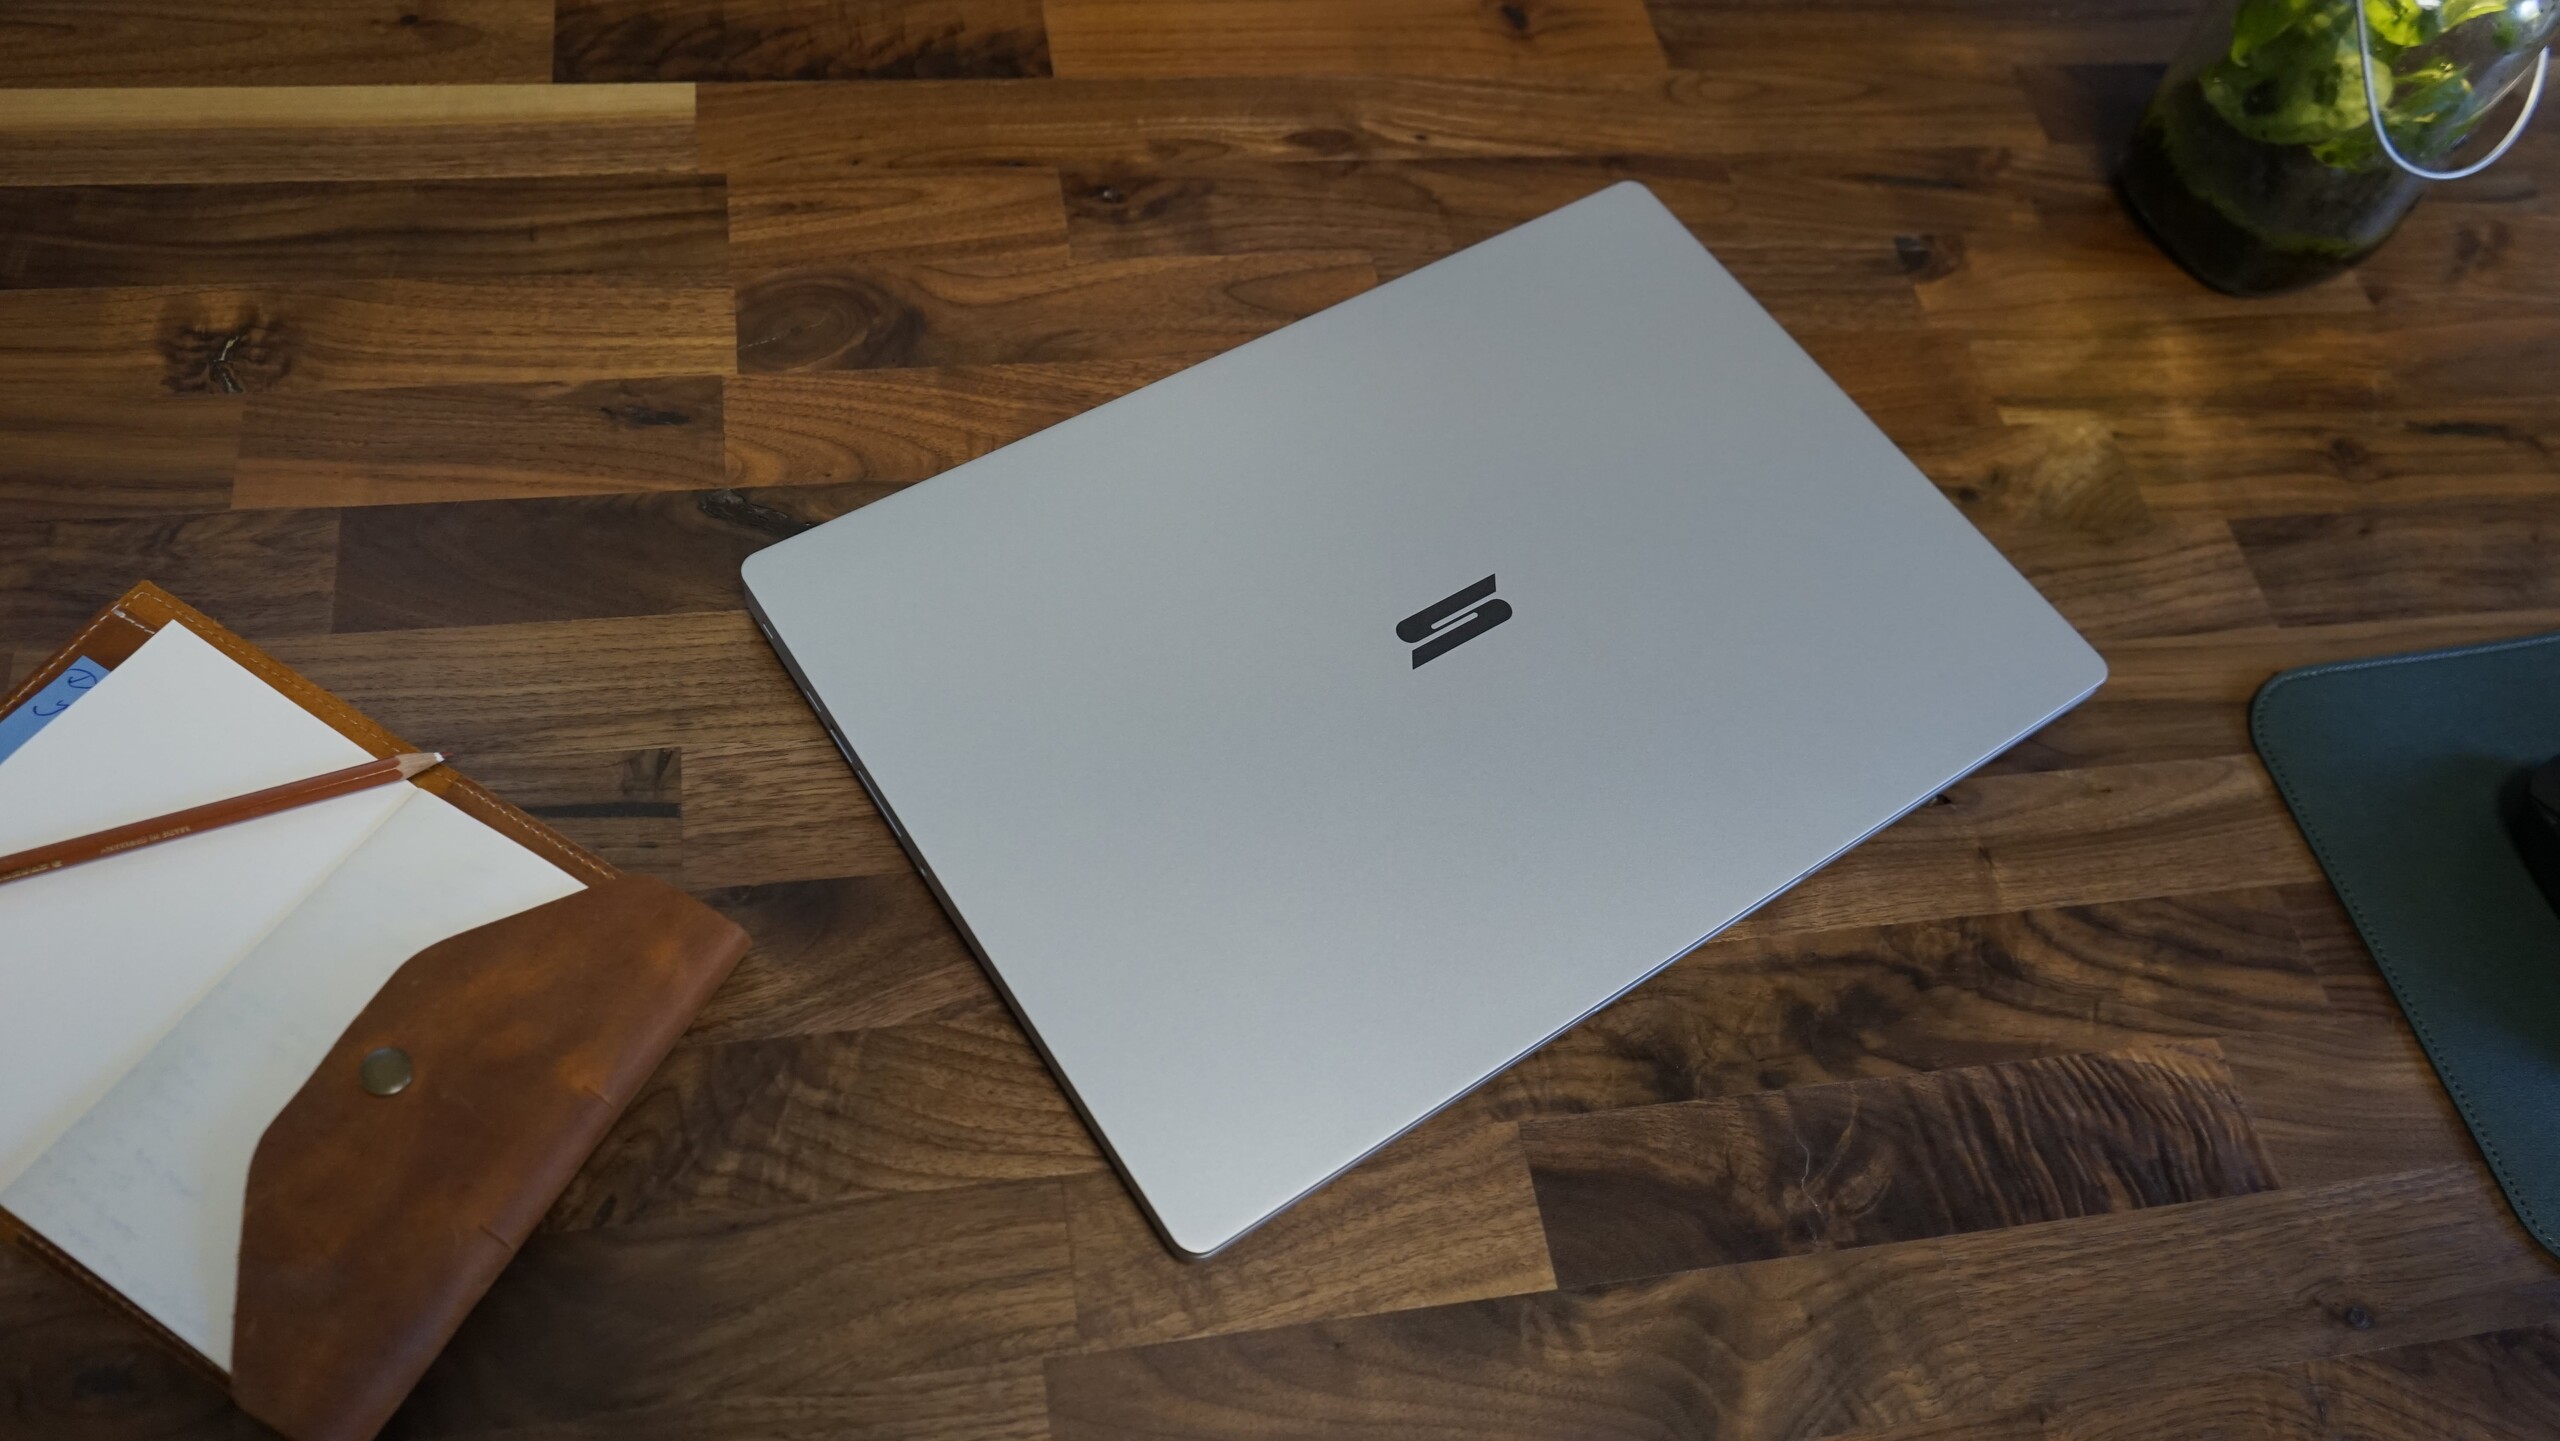
Lo chassis è identico a quello del Vision 16 Pro e praticamente invariato rispetto al modello precedente. Stiamo recensendo la variante argentata, mentre abbiamo recensito il Vision 16 Pro in nero. La versione argentata spicca di più e ci ricorda il MacBook Pro 16a causa del touchpad sovradimensionato. Il telaio in magnesio (base e copertura dello schermo) mantiene il peso basso con soli 1,5 kg. C'è solo un leggero cedimento al centro della tastiera, per il resto lo chassis è rigido. Le cerniere non sono molto robuste e consentono una buona oscillazione dello schermo.
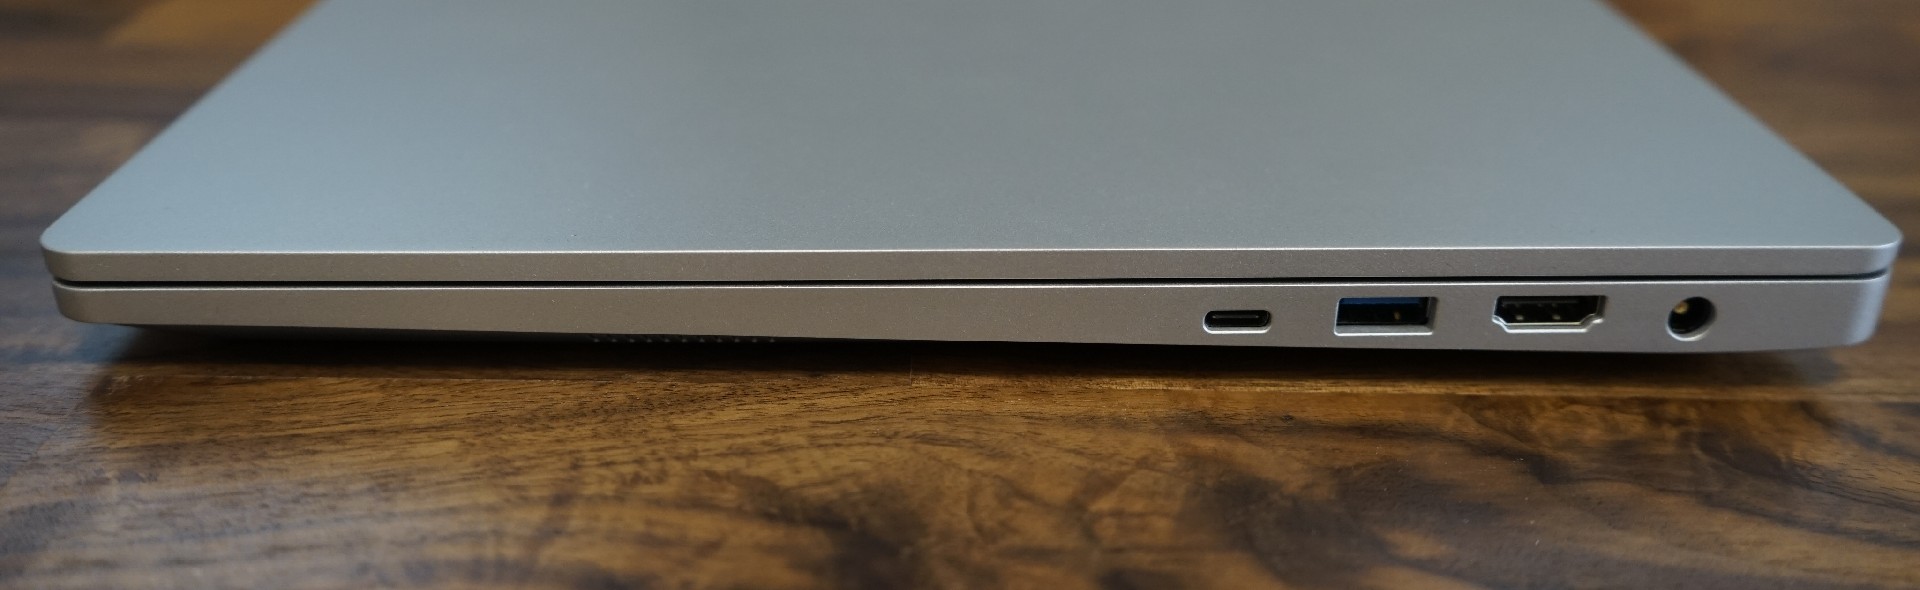
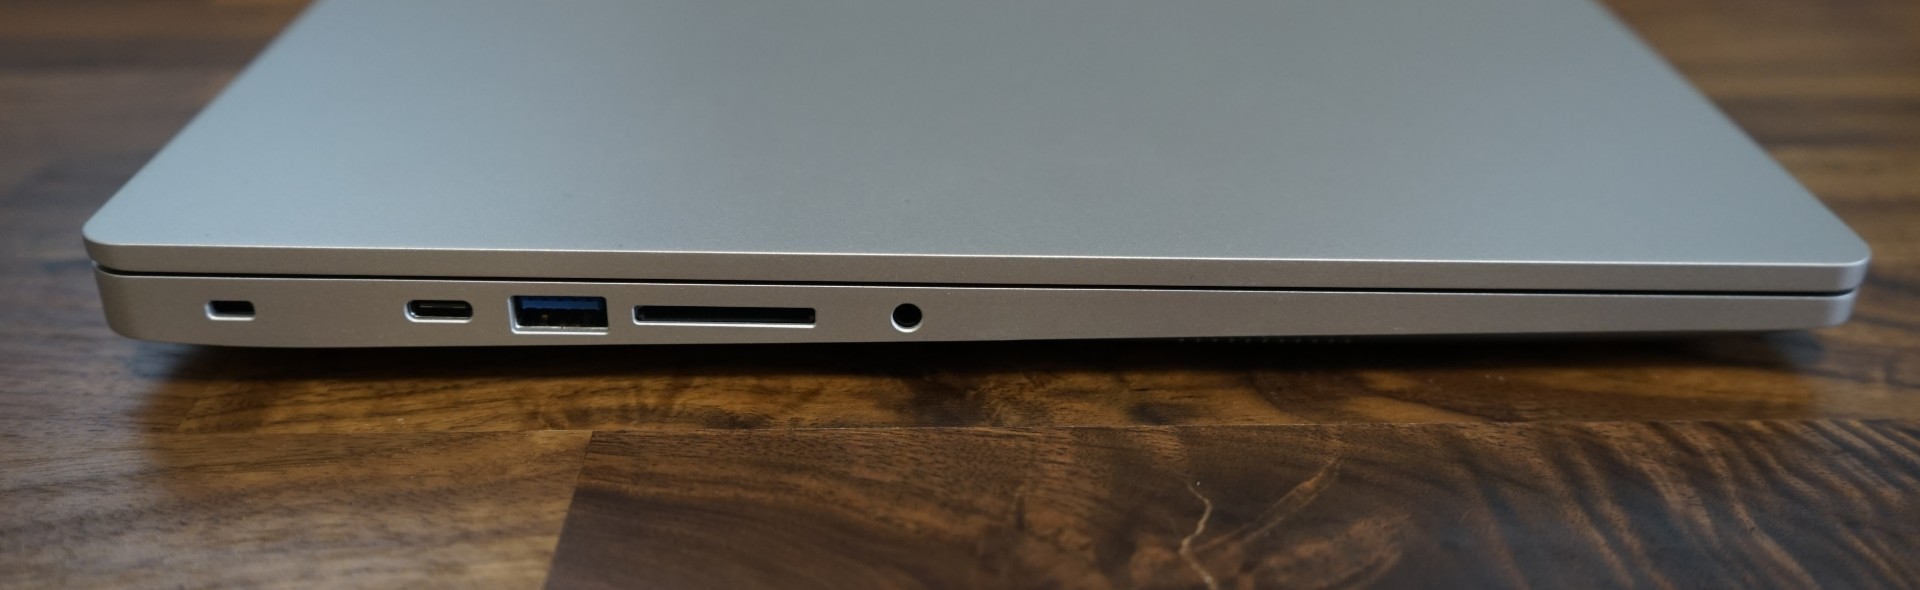
Connettività - Thunderbolt 4, lettore di schede SD full size e numerose porte USB
Anche le porte sono identiche a quelle del Vision 16 Pro. Dongle o adattatori non sono necessari per questo ultrabook, grazie alla buona selezione di porte. Rispetto a un MacBook Air, il Vision 16 ha praticamente tutte le porte di cui la maggior parte delle persone ha bisogno. A sinistra, c'è un jack audio da 3,5 mm e uno slot per schede SD full size. Le due porte USB A 3.2 Gen 1 rendono superflui i dongle per mouse e tastiera. Pratica anche la porta HDMI, anche se si tratta solo di HDMI 2.0b e non di HDMI 2.1. La porta Thunderbolt 4 a sinistra e la porta USB C a destra completano le opzioni di connettività. Grazie alla porta di ricarica proprietaria dedicata, nessuna delle altre porte è occupata durante la ricarica. L'unica cosa che manca è la presa Ethernet.
Lettore di schede SD
Lo Schenker Vision 16 dispone di un lettore di schede SD, ma è piuttosto lento, come testimoniano i 22,7 MB/s di velocità di scrittura e i 27,7 MB/s di velocità di lettura misurati con la nostra scheda di riferimento (Angelbird AV Ori V60). Per gli utenti più esigenti, un lettore di schede esterno potrebbe essere l'opzione migliore. Per un uso occasionale, il lettore di schede dovrebbe essere sufficiente.
| SD Card Reader | |
| average JPG Copy Test (av. of 3 runs) | |
| MSI Stealth 16 Studio A13VG | |
| Dell XPS 15 9530 RTX 4070 (Toshiba Exceria Pro SDXC 64 GB UHS-II) | |
| Media della classe Office (19.8 - 198.5, n=22, ultimi 2 anni) | |
| Schenker Vision 16 PH6PRX1 (AV Pro V60) | |
| Acer Swift Go SFG16-71 | |
| maximum AS SSD Seq Read Test (1GB) | |
| Dell XPS 15 9530 RTX 4070 (Toshiba Exceria Pro SDXC 64 GB UHS-II) | |
| MSI Stealth 16 Studio A13VG | |
| Media della classe Office (27.4 - 249, n=21, ultimi 2 anni) | |
| Schenker Vision 16 PH6PRX1 (AV Pro V60) | |
| Acer Swift Go SFG16-71 | |
Comunicazione
Il modulo AX201 WiFi 6 del Vision 16 ha fornito buoni risultati durante la ricezione dei dati, ma ha mostrato dei punti deboli durante l'invio dei dati. L'esperienza può comunque variare, dato che lo stesso modulo WLAN nel quasi identico Vision 16 Pro di Schenker ha dato risultati migliori.
Webcam
La webcam FHD dello Schenker Vision 16 è in grado di creare immagini accettabili. È sufficiente per le videoconferenze, a patto che le condizioni di illuminazione non siano sfavorevoli. La webcam da 2 megapixel consente il log-in biometrico tramite Windows Hello, grazie al sensore IR integrato.


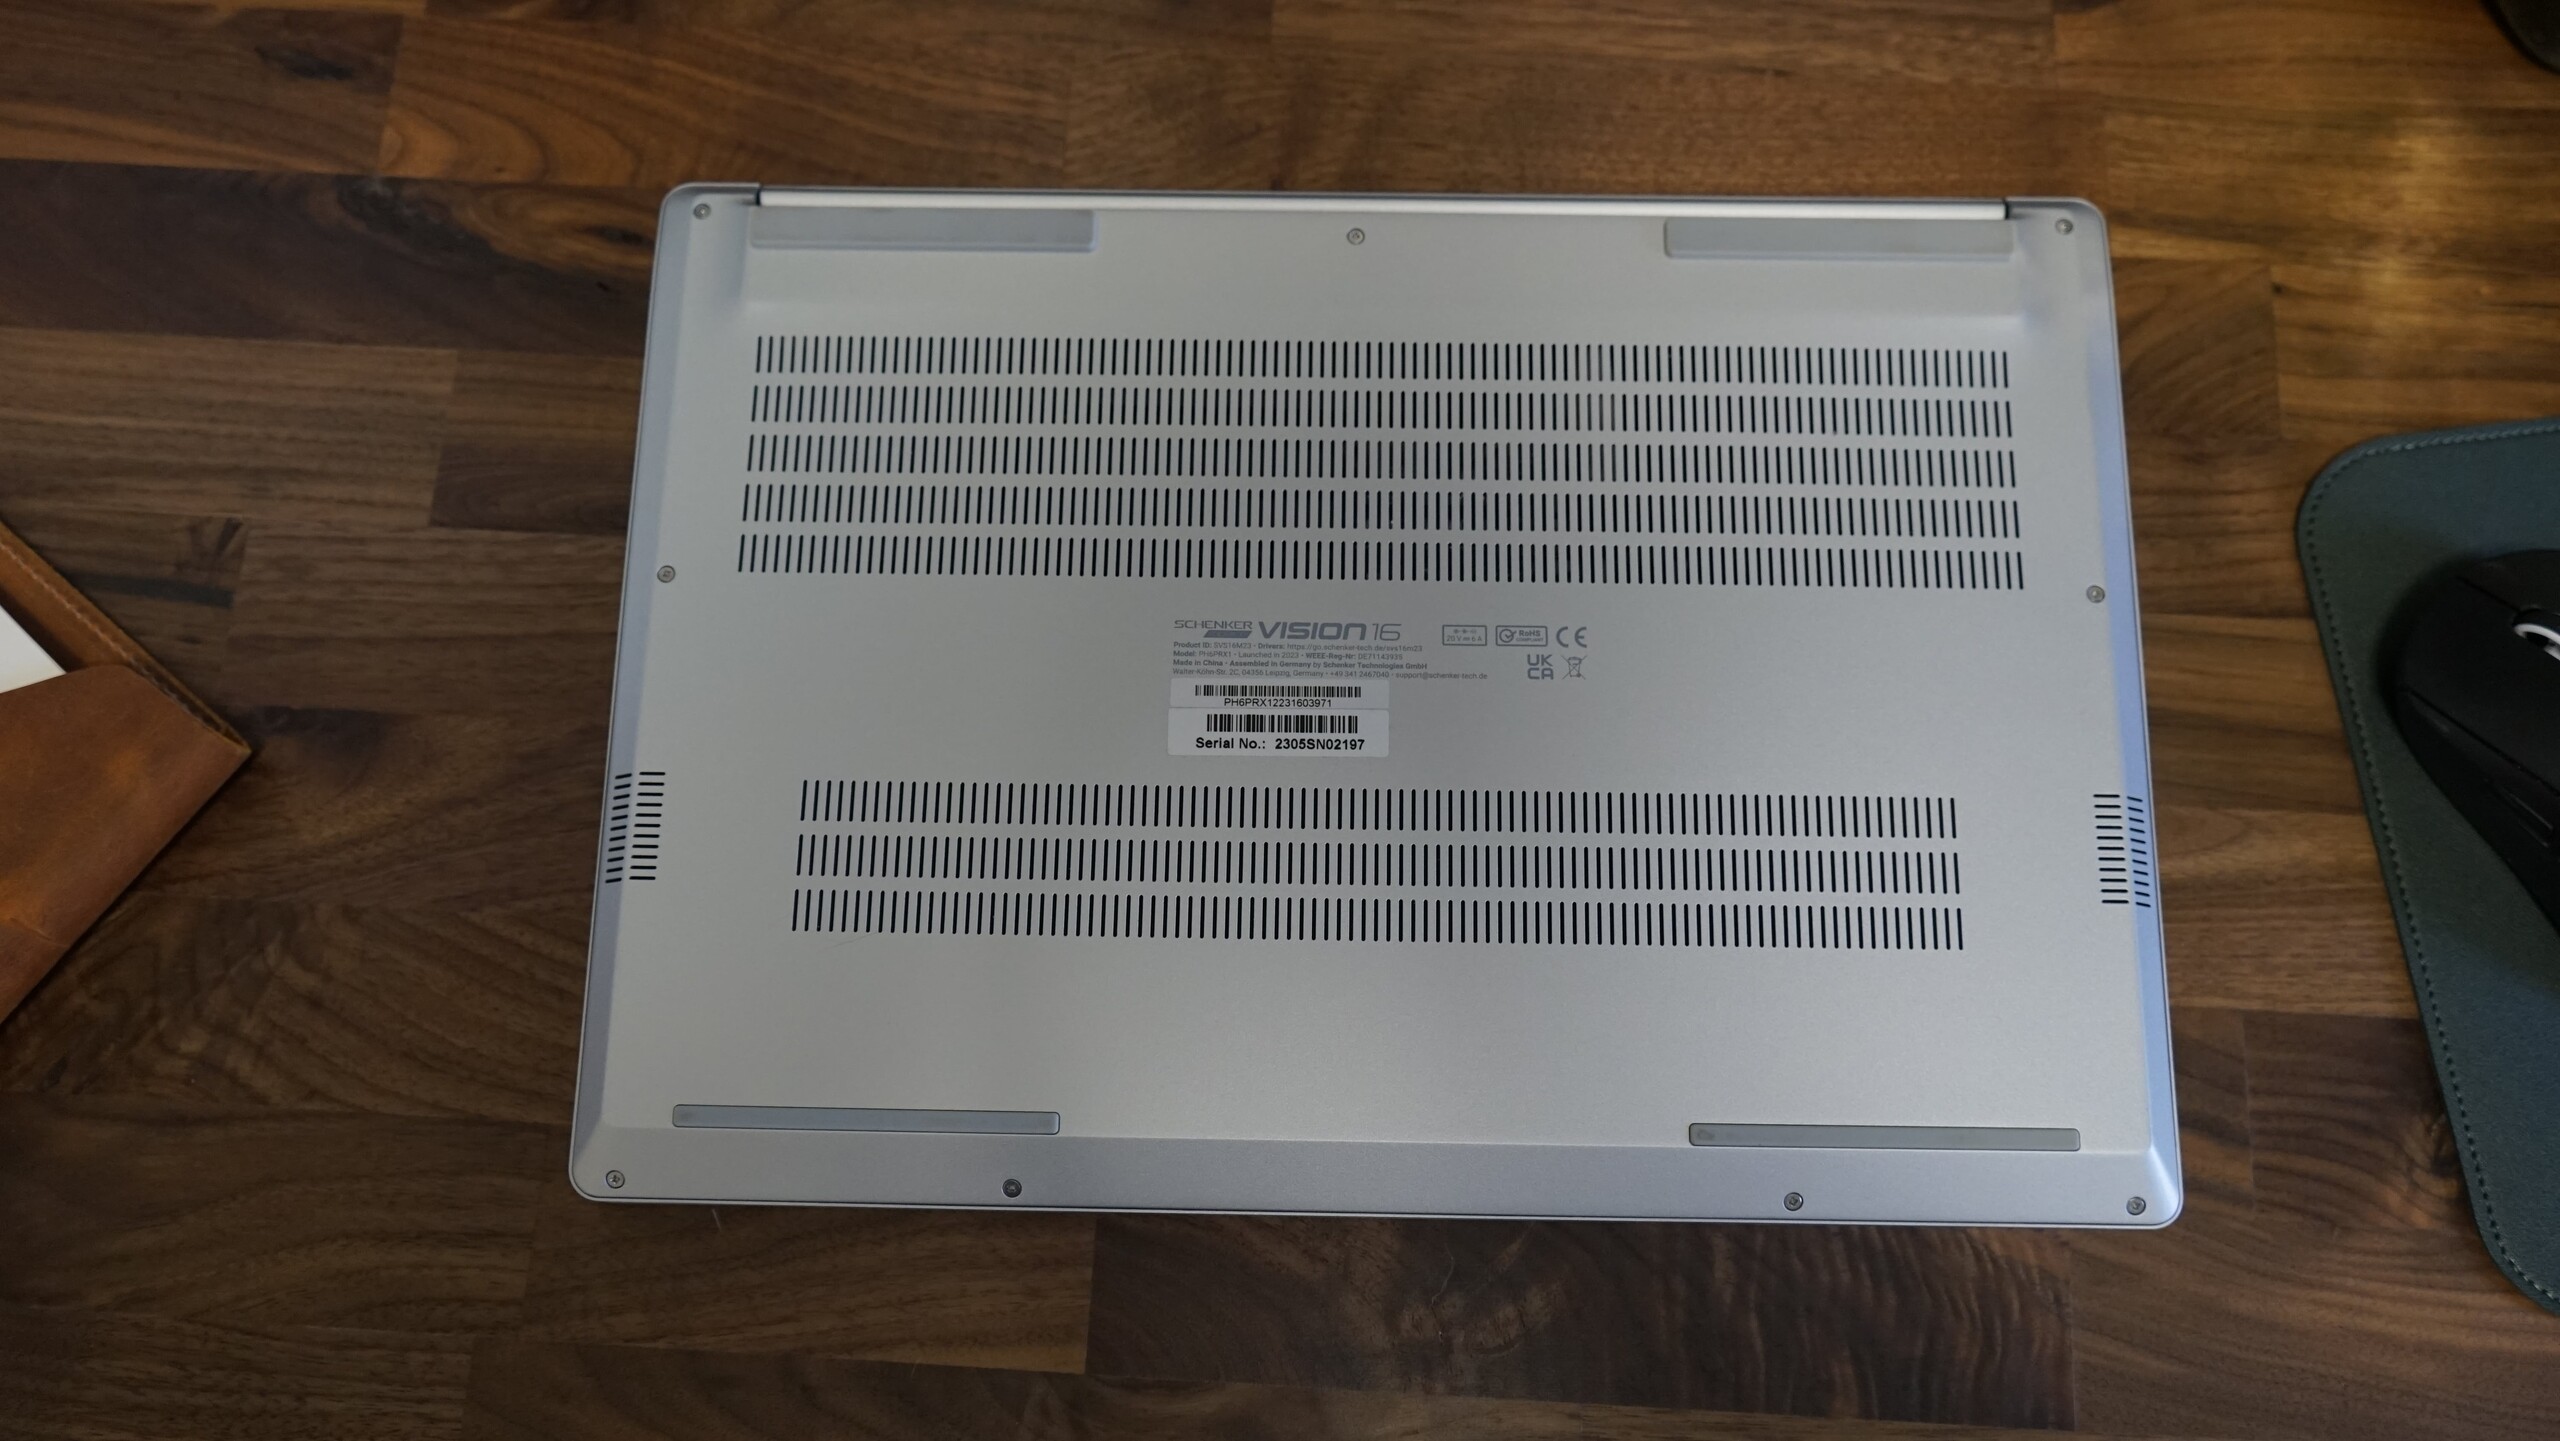
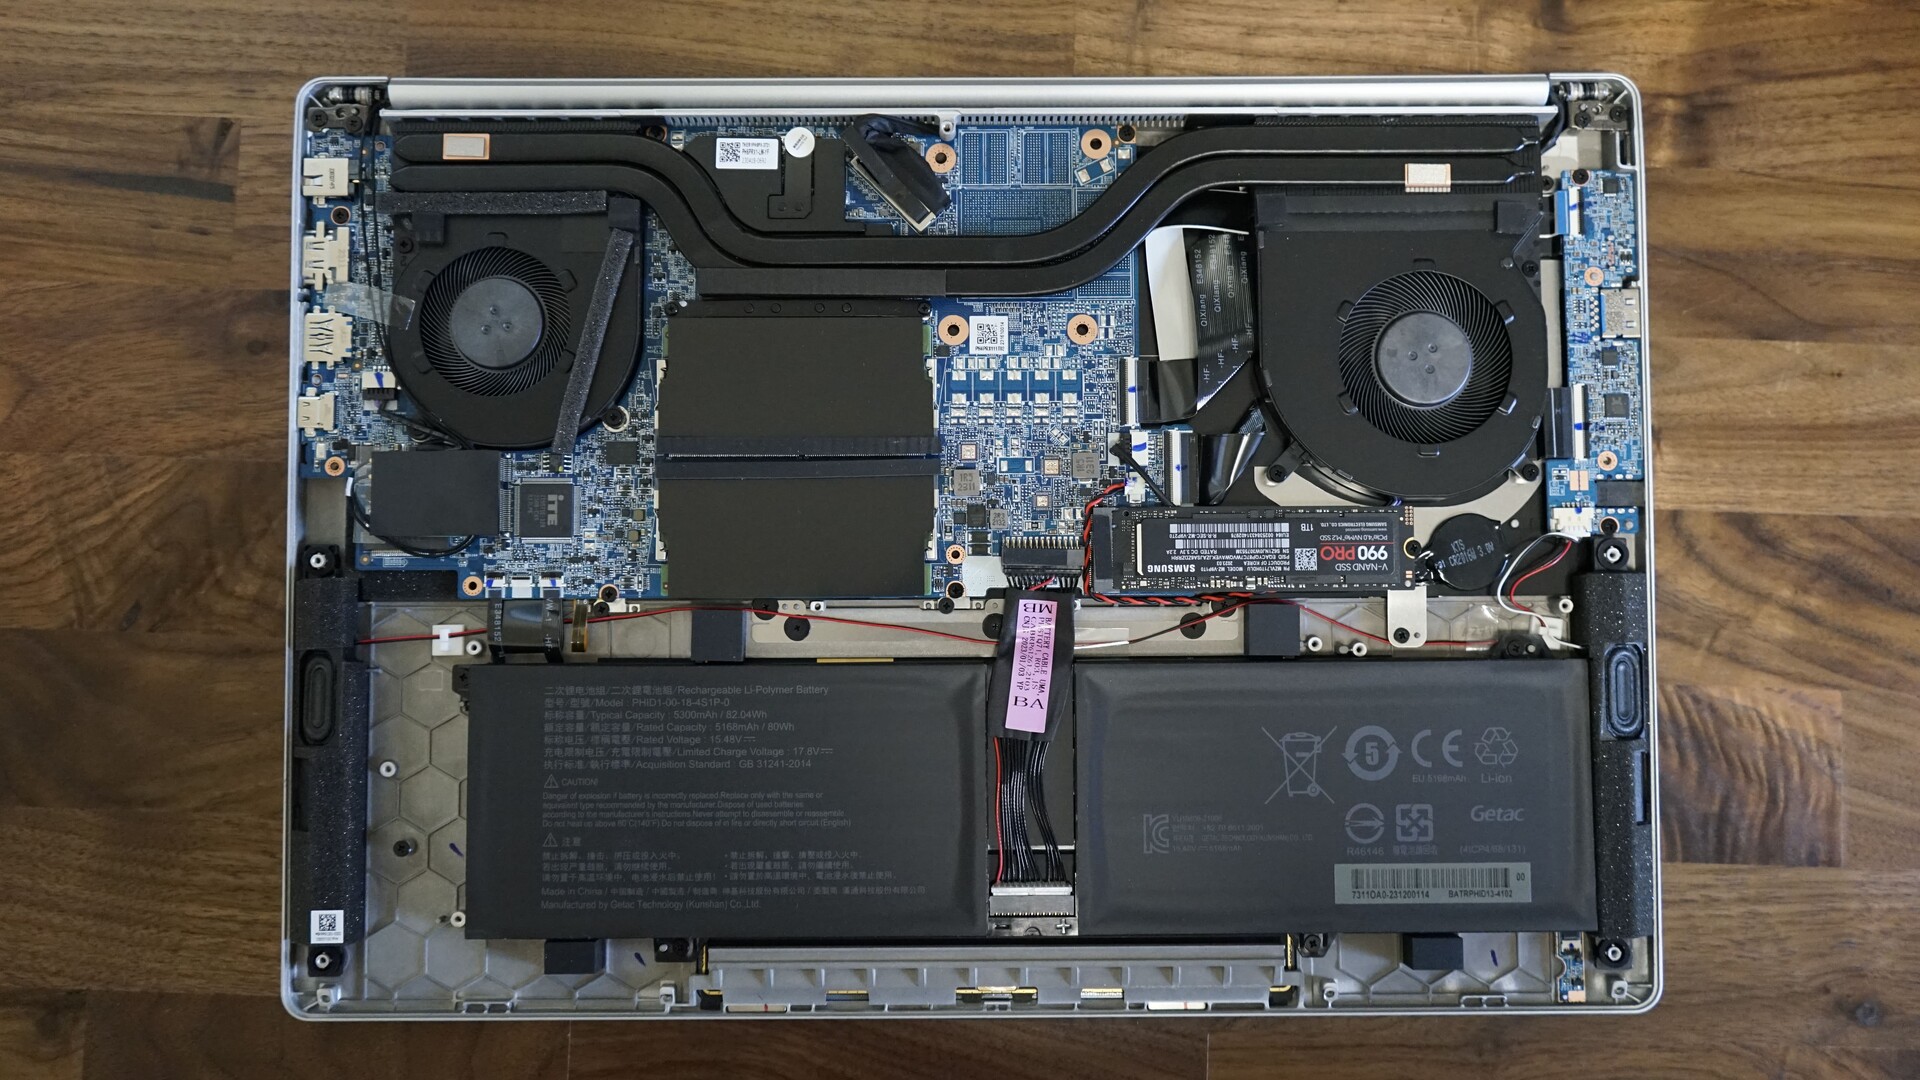
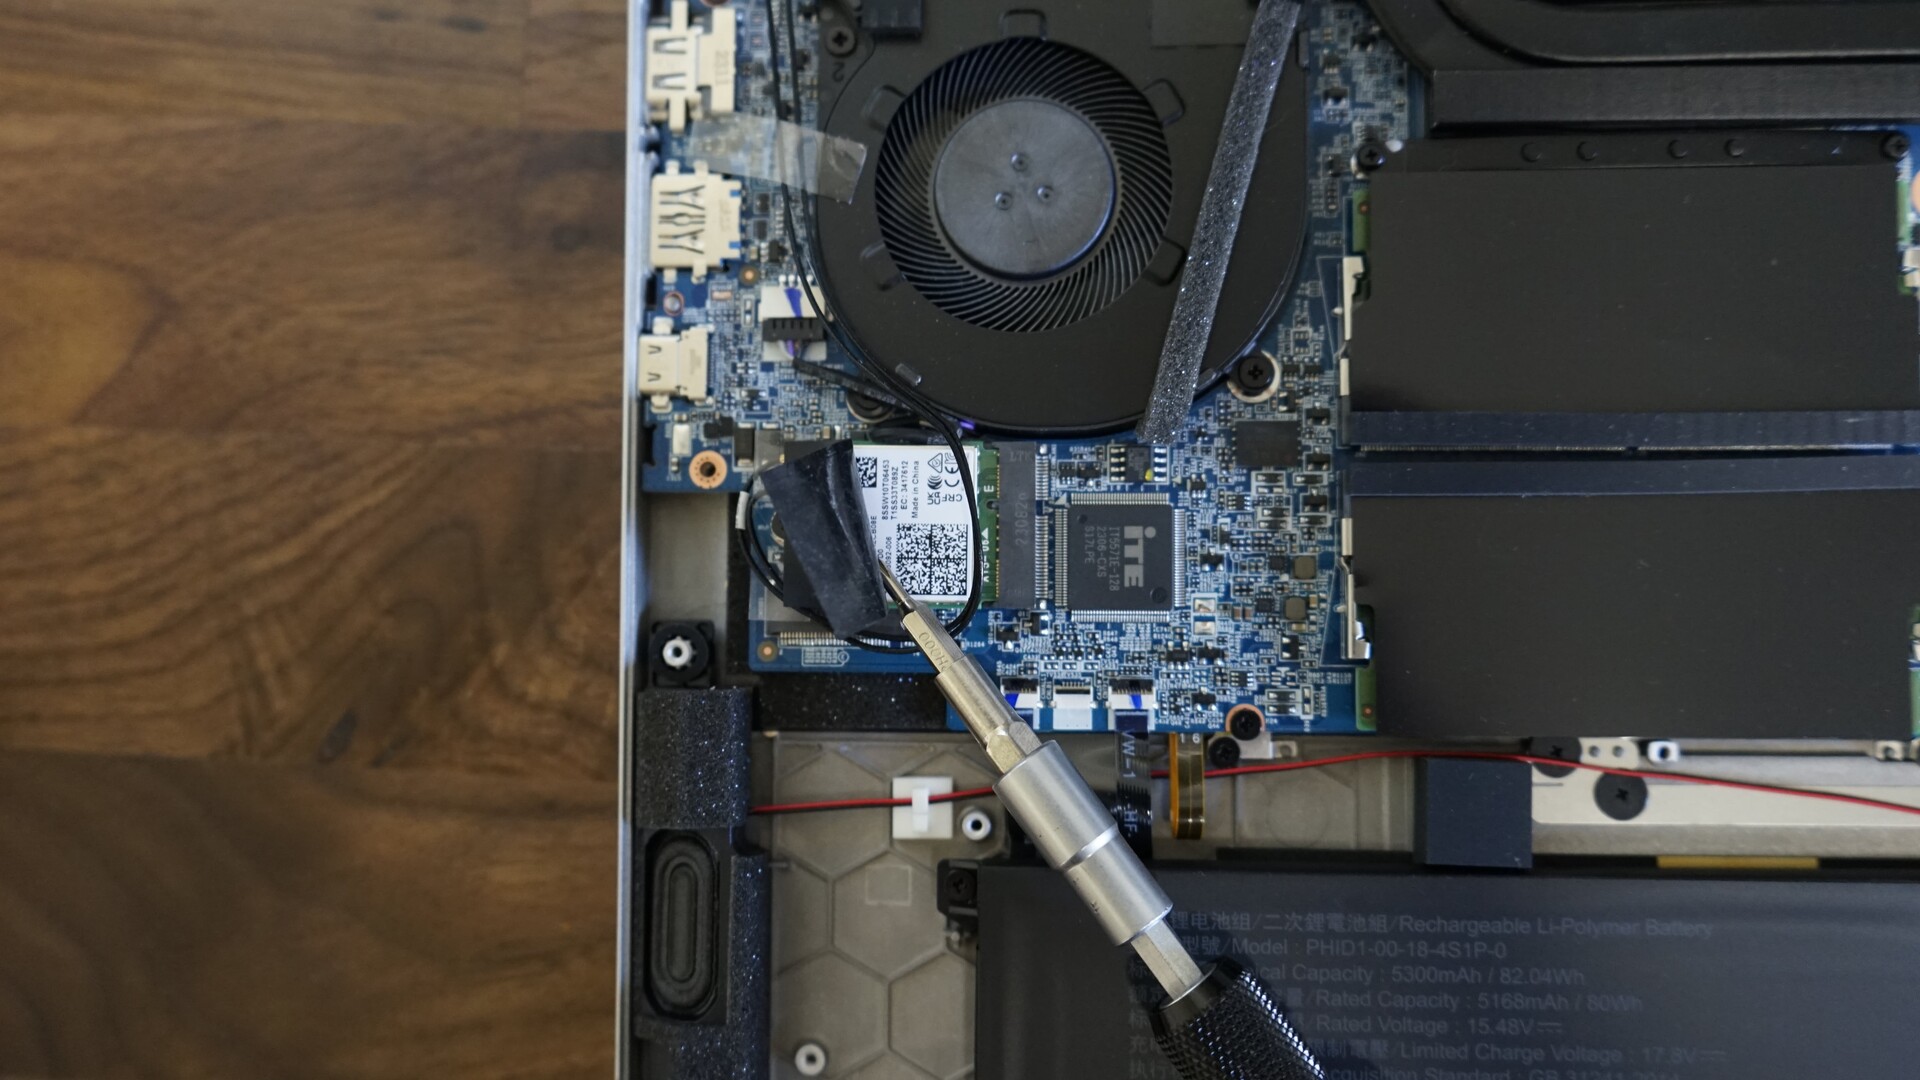
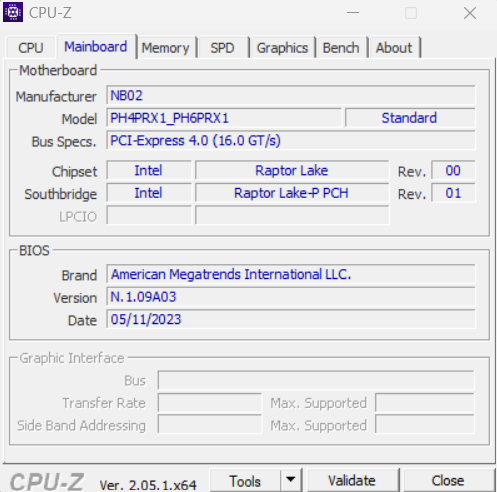
Manutenzione
Il coperchio inferiore dello Schenker Vision 16 è fissato con un totale di nove viti. Le quattro viti sulla parte anteriore e la vite centrale sul retro sono più corte delle altre. Lo spazio interno è molto simile a quello del Vision 16 Pro, tranne che per la mancanza della GPU, la minore quantità di heatpipes e la ventola destra più piccola. Quest'ultimo aspetto sarà rilevante per le nostre misurazioni delle prestazioni.
Gli utenti del Vision 16 possono cambiare entrambi i moduli RAM, i moduli WiFi, l'unità SSD M.2 e la batteria. È inoltre disponibile un secondo slot per SSD M.2.
Garanzia
Schenker offre una garanzia base di 24 mesi, che comprende il servizio di ritiro e riconsegna e una riparazione rapida nei primi sei mesi. A scelta, è possibile scegliere una garanzia di 36 mesi e ampliarla con vari pacchetti di garanzia, come la riparazione rapida per l'intero periodo di garanzia.
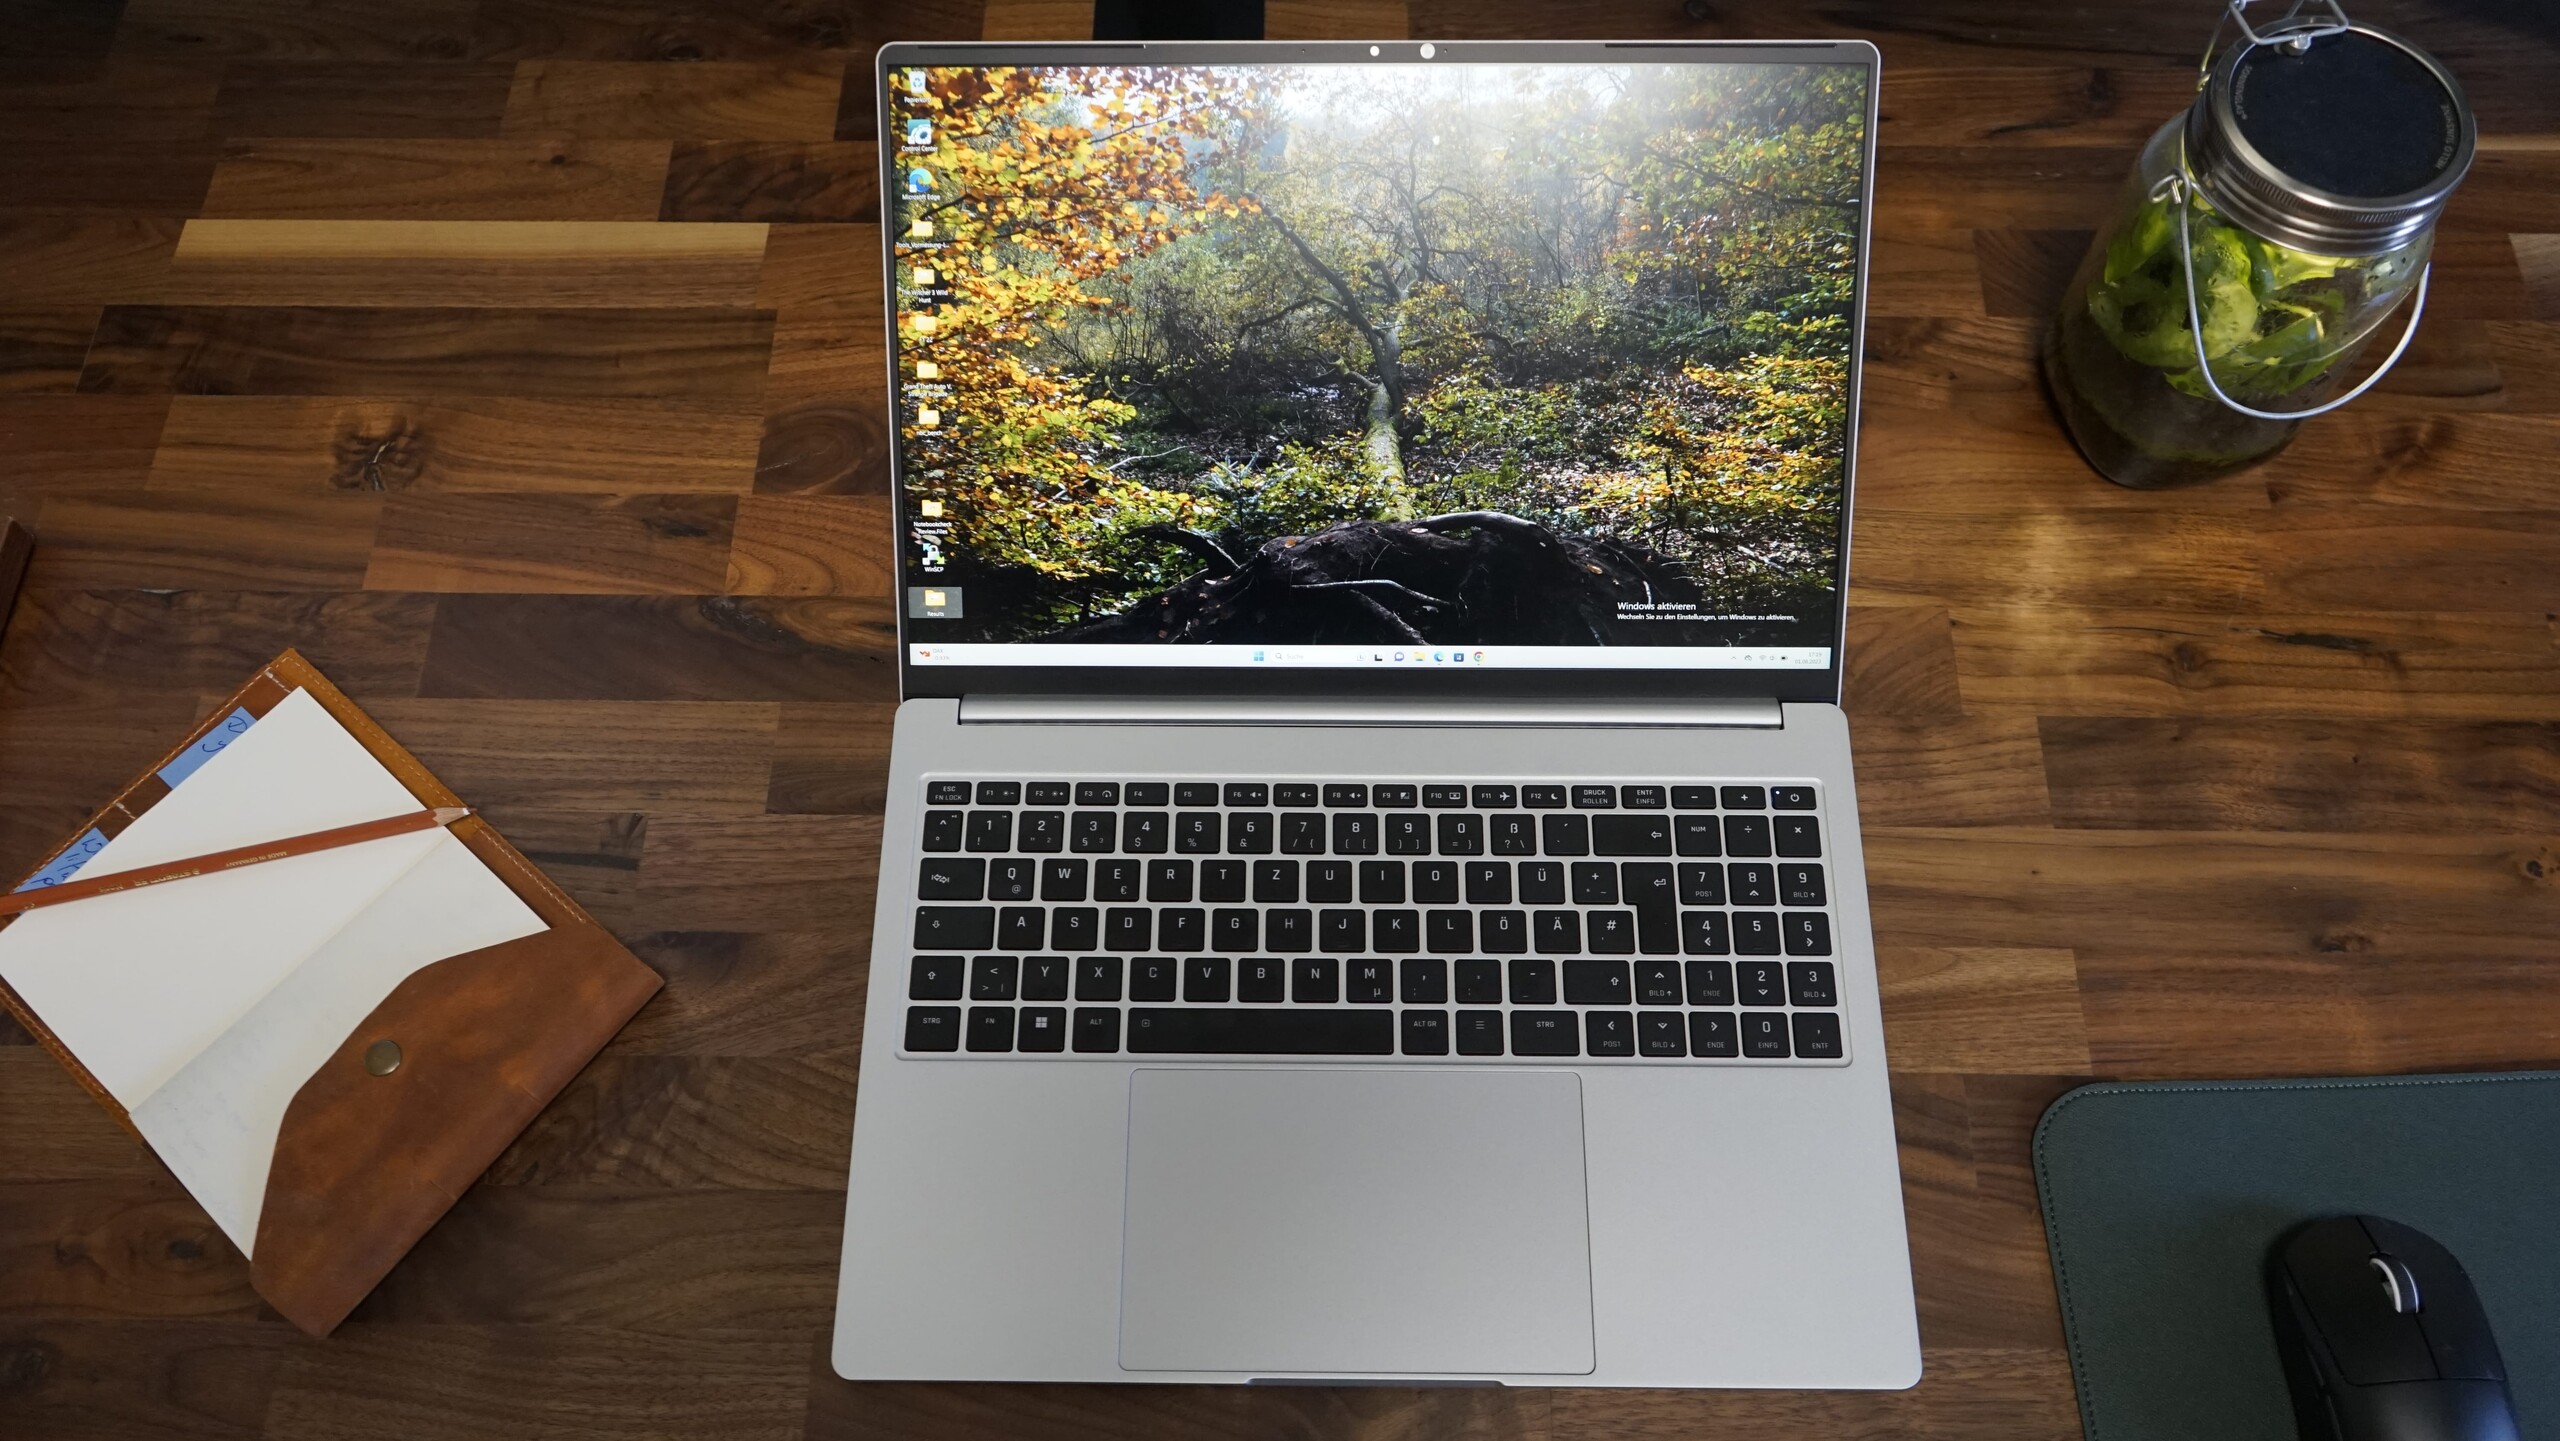
Dispositivi di input - enorme clickpad in vetro, ma layout della tastiera non proprio ideale.
I dispositivi di input del Vision 16 sono solidi. Il touchpad è molto grande e preciso, ma ci sono alcuni punti deboli per quanto riguarda la tastiera.
Tastiera
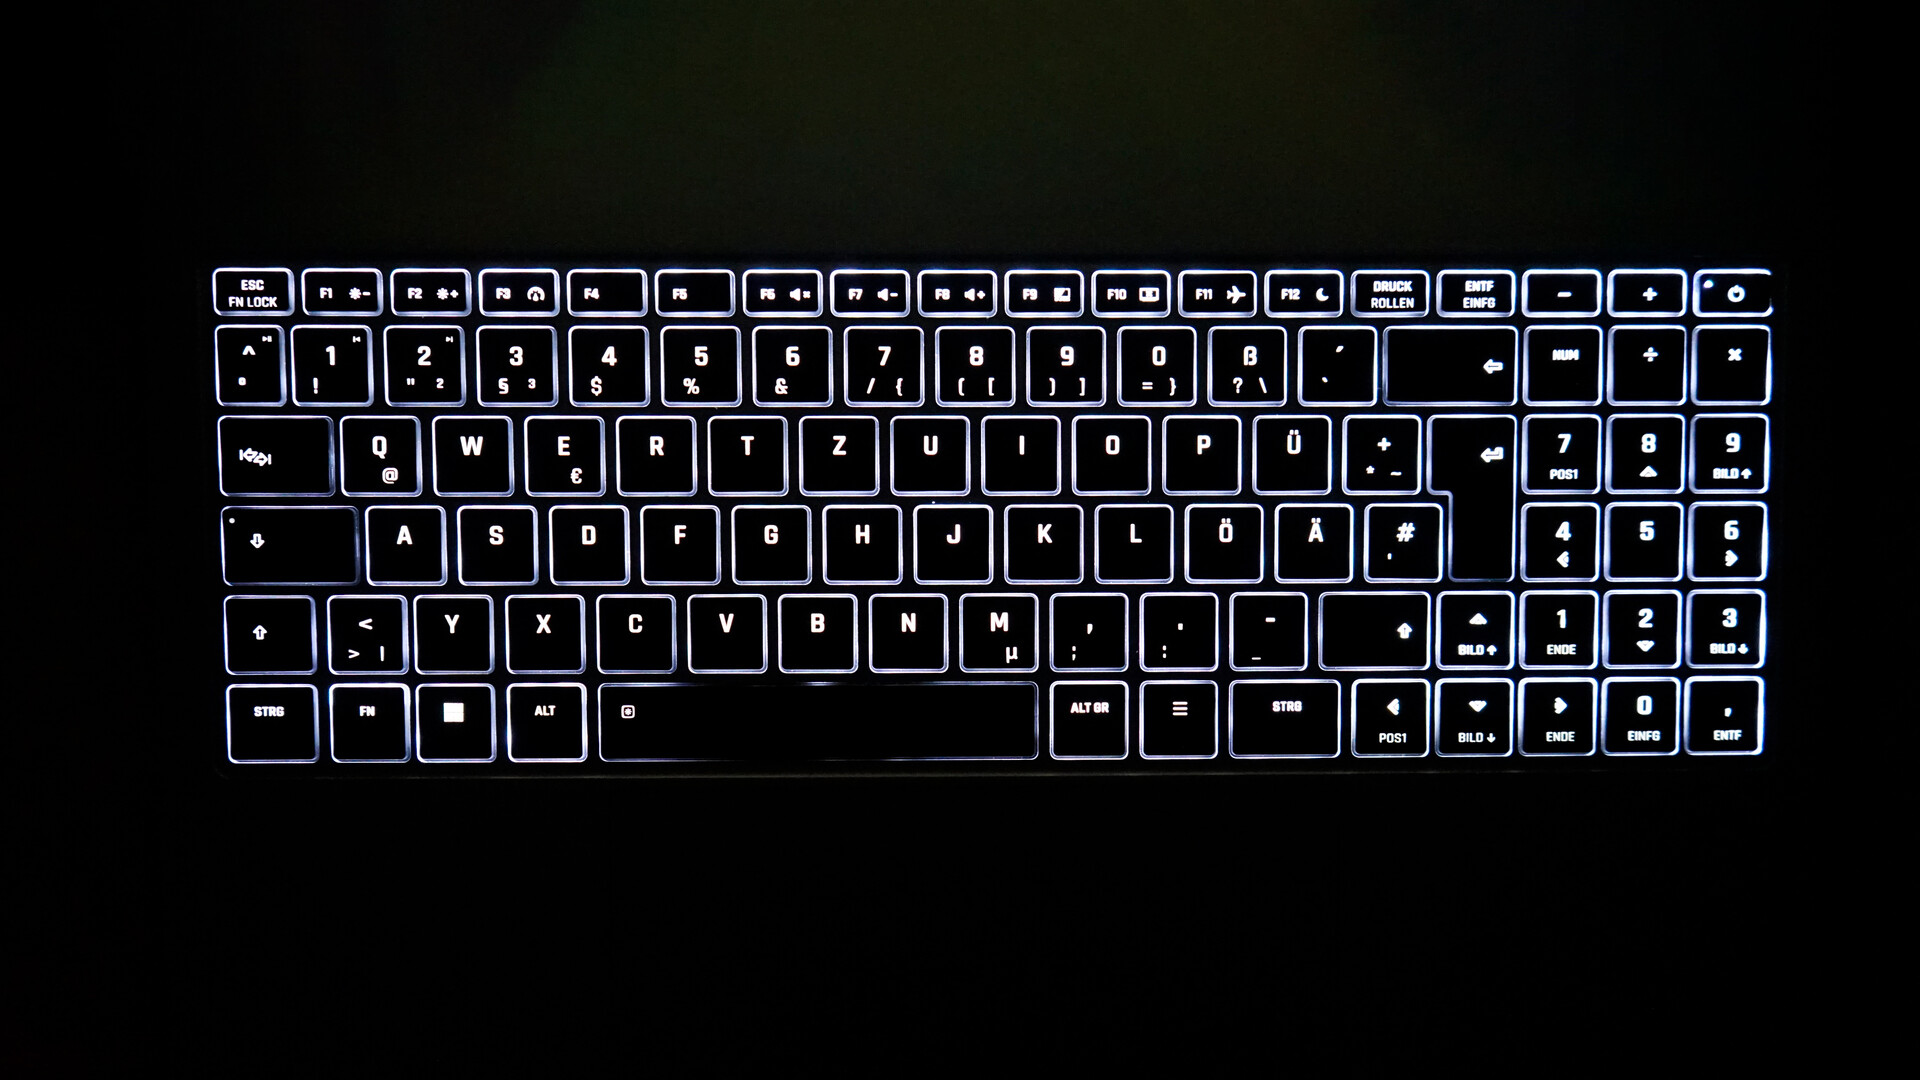
La tastiera ha un blocco numerico dedicato con tasti freccia a grandezza naturale, accorciando il tasto Shift destro e spostando il tasto di invio aggiuntivo del blocco numerico. Il blocco numerico è una versione piuttosto compressa e non molto utilizzabile per l'inserimento rapido dei numeri. Viene da chiedersi perché Schenker abbia incluso il blocco numerico, visto che l'intera tastiera è spostata a sinistra. A causa della tastiera spostata e del tasto Shift destro più corto, la digitazione ha un impatto negativo e la tastiera richiede più tempo per abituarsi.
Per quanto riguarda i tasti, essi offrono una sensazione di digitazione molto buona e precisa, con un rumore di battitura solido e non troppo forte. La tastiera è retroilluminata con due livelli di luminosità e tutti i tasti sono illuminati in modo uniforme.

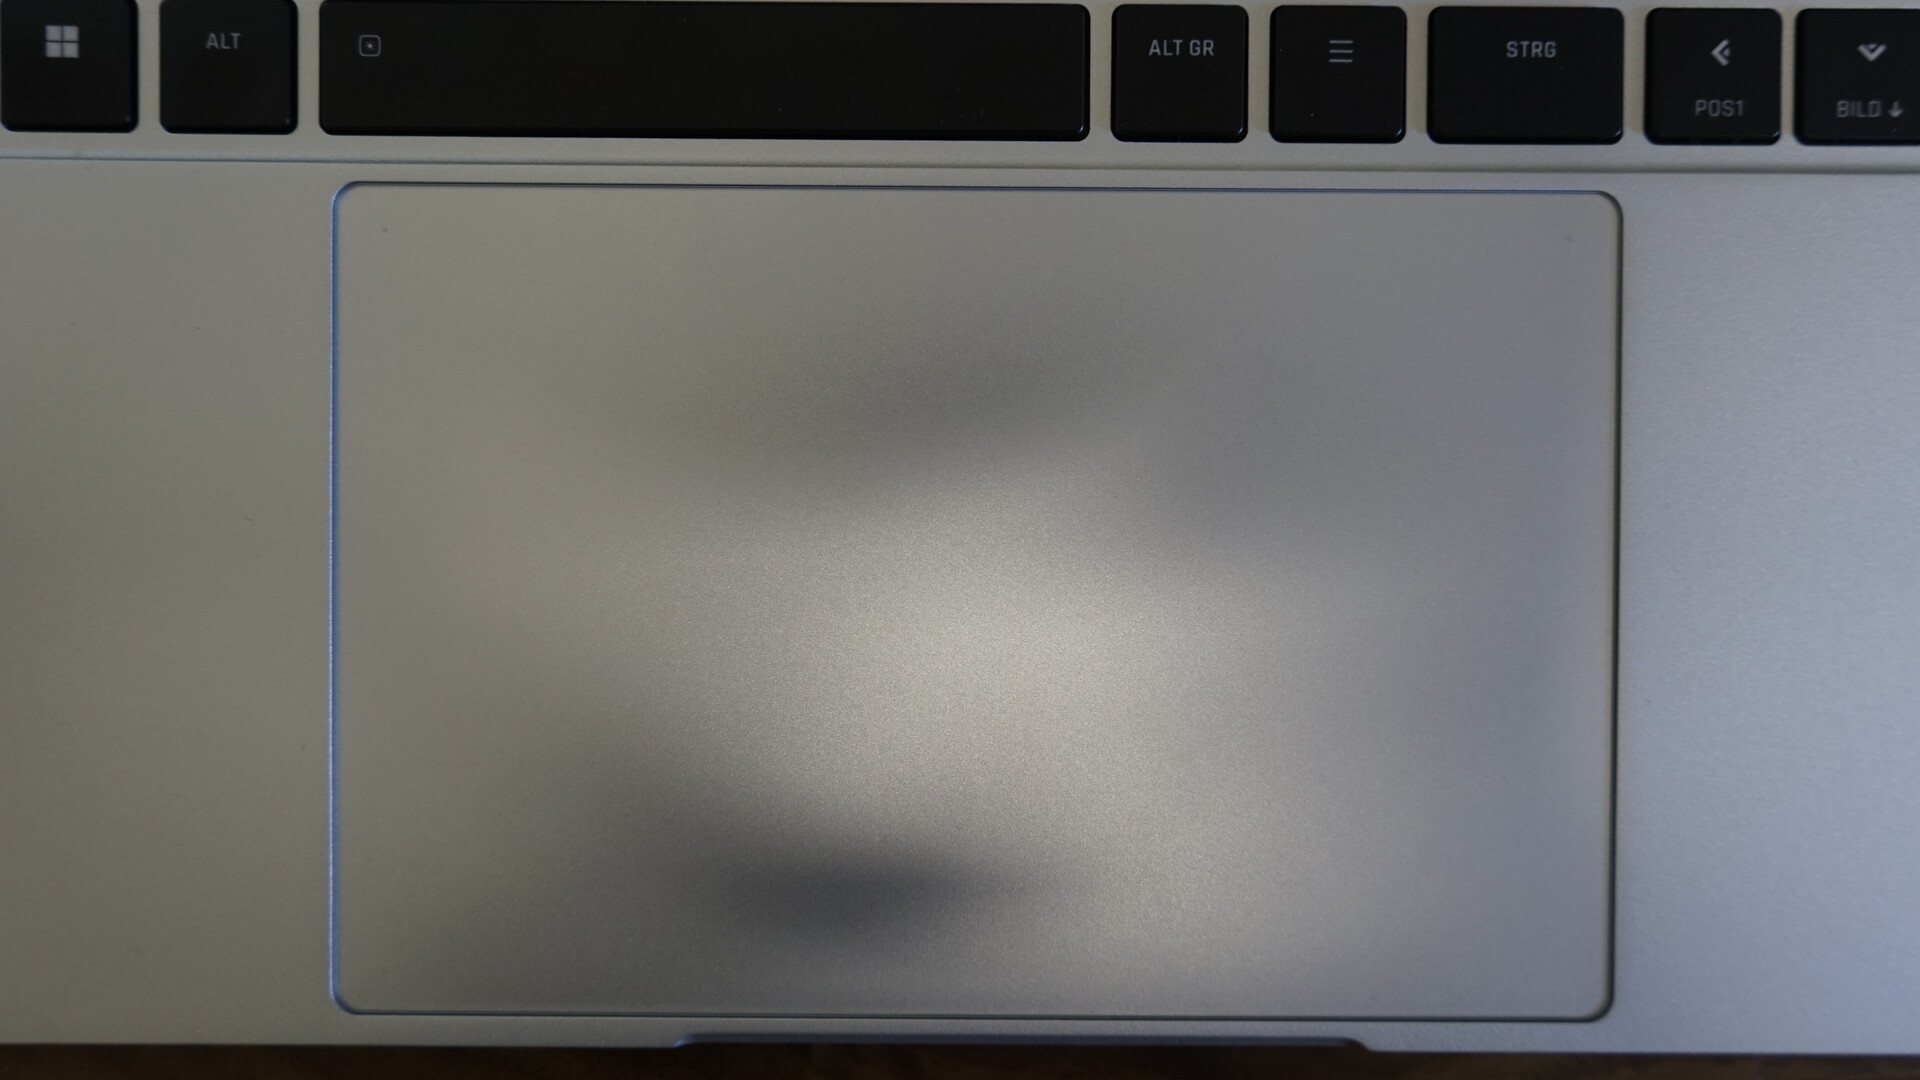
Touchpad
Un punto di forza del Vision 16 e della versione Pro è il grande clickpad in vetro (15,4 x 10 cm). L'utilizzo del trackpad è semplice e, grazie all'ampia superficie, i gesti e il movimento del cursore sono fluidi. La precisione del touchpad è molto buona. Tuttavia, potrebbe essere leggermente meno rumoroso quando si tratta del meccanismo di clic, e colpire l'area del clic destro può essere difficile.
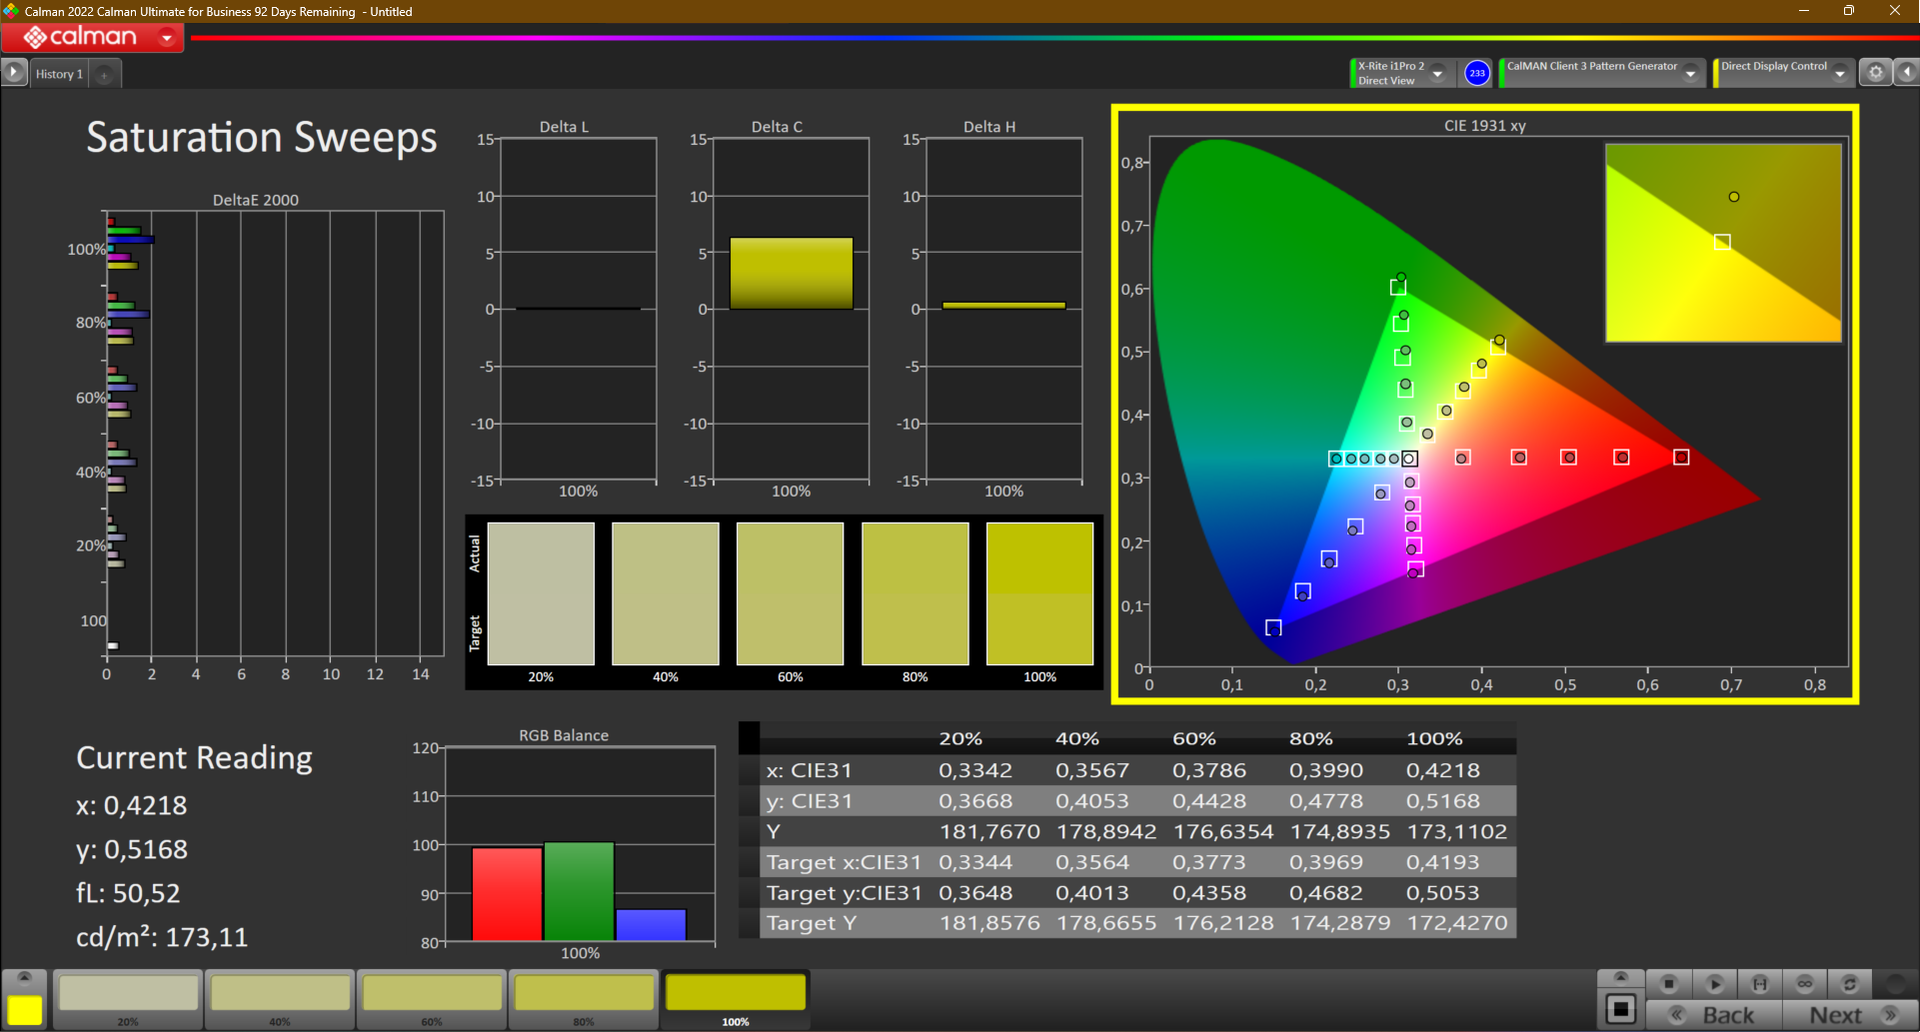
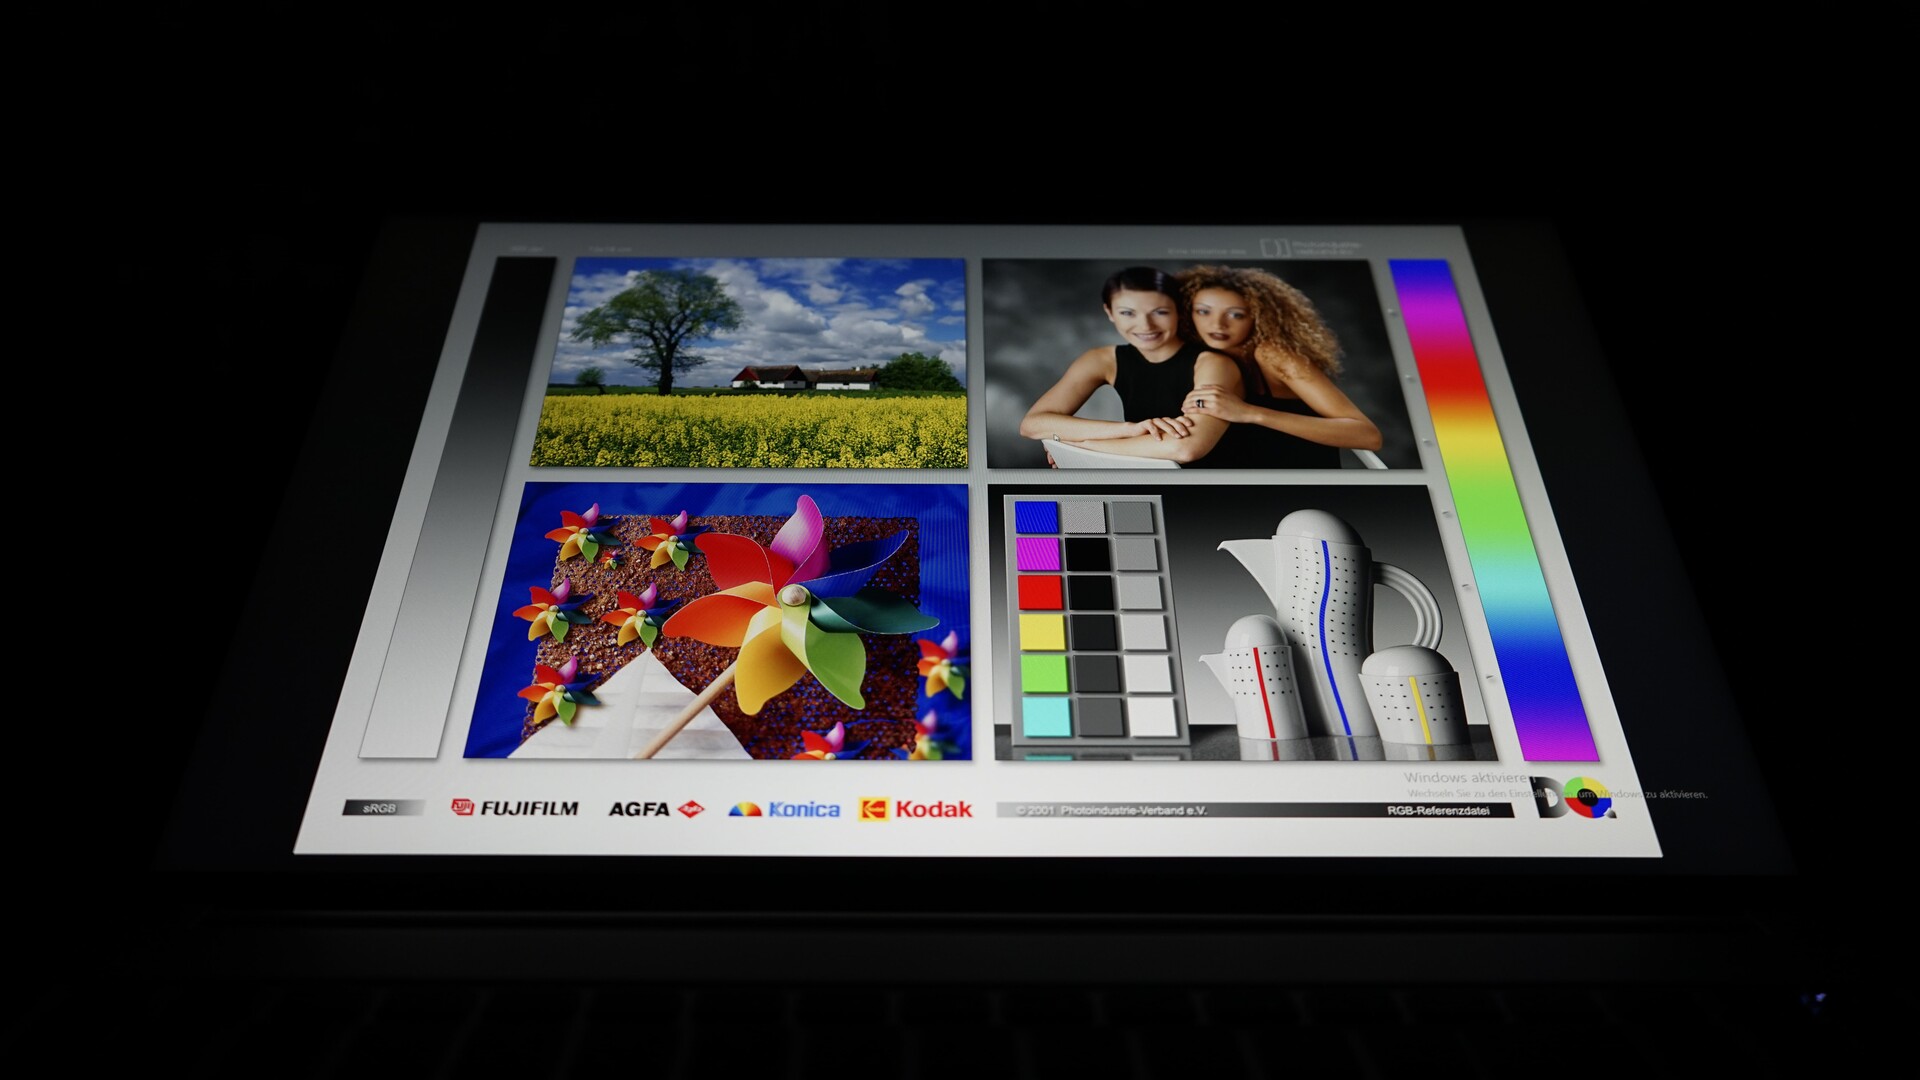
Display - schermo IPS da 240 Hz in formato 16:10
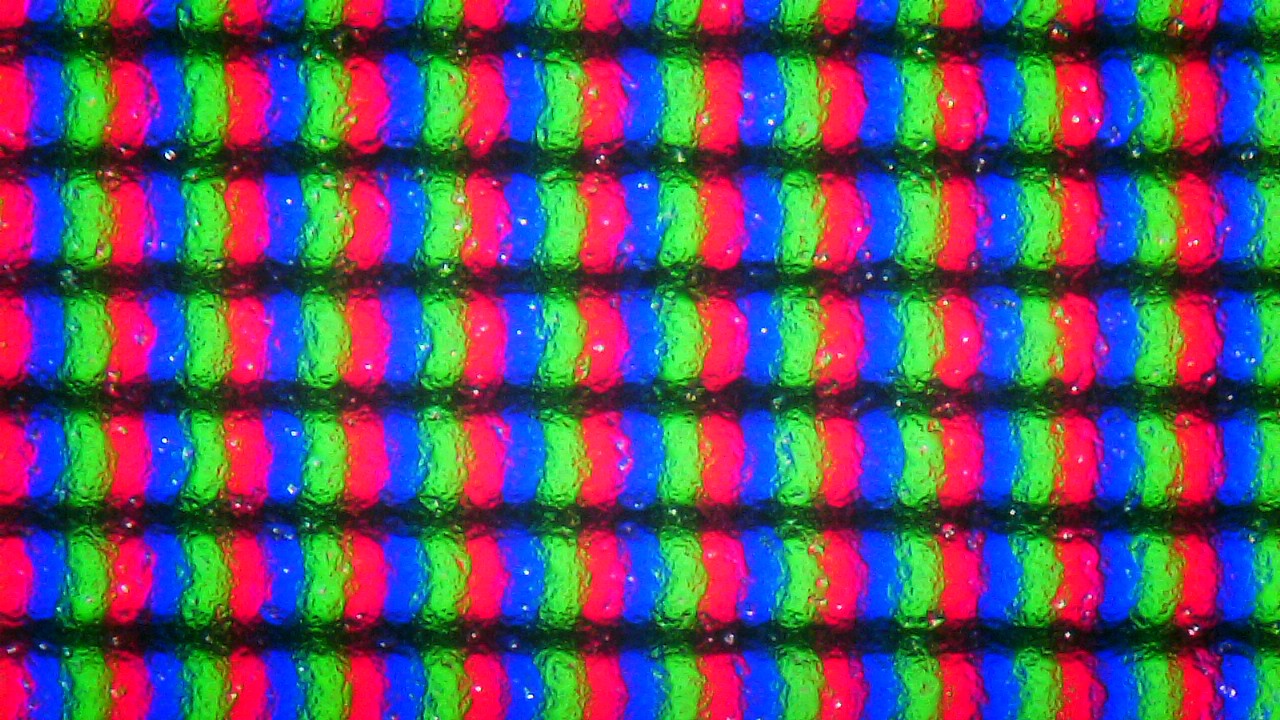

Uno dei punti di forza dell'ultrabook Vision 16 2023 è il nuovo pannello WQXGA (2.560 x 1.600), che lo scorso anno era esclusivo della versione Pro. Invece di 90 Hz, il modello Vision 16 di quest'anno offre una frequenza di aggiornamento di 240 Hz, insolita per i portatili da ufficio.
Nonostante entrambe le versioni del Vision 16 utilizzino lo stesso schermo, quest'anno il Vision 16 ha superato leggermente il Vision 16 Pro nella nostra recensione. Attribuiamo queste differenze alle normali variazioni di qualità tra i pannelli. Secondo Schenker, la luminosità dello schermo dovrebbe raggiungere i 350 cd/m², come confermato dalle nostre misurazioni.
L'alta frequenza di 240 Hz crea un'esperienza d'uso fluida. I vantaggi reali di questa fluidità durante i giochi sono però sprecati dal Vision 16, a meno che non venga abbinato a una GPU Thunderbolt esterna.
| |||||||||||||||||||||||||
Distribuzione della luminosità: 93 %
Al centro con la batteria: 356 cd/m²
Contrasto: 1271:1 (Nero: 0.28 cd/m²)
ΔE ColorChecker Calman: 1.7 | ∀{0.5-29.43 Ø4.71}
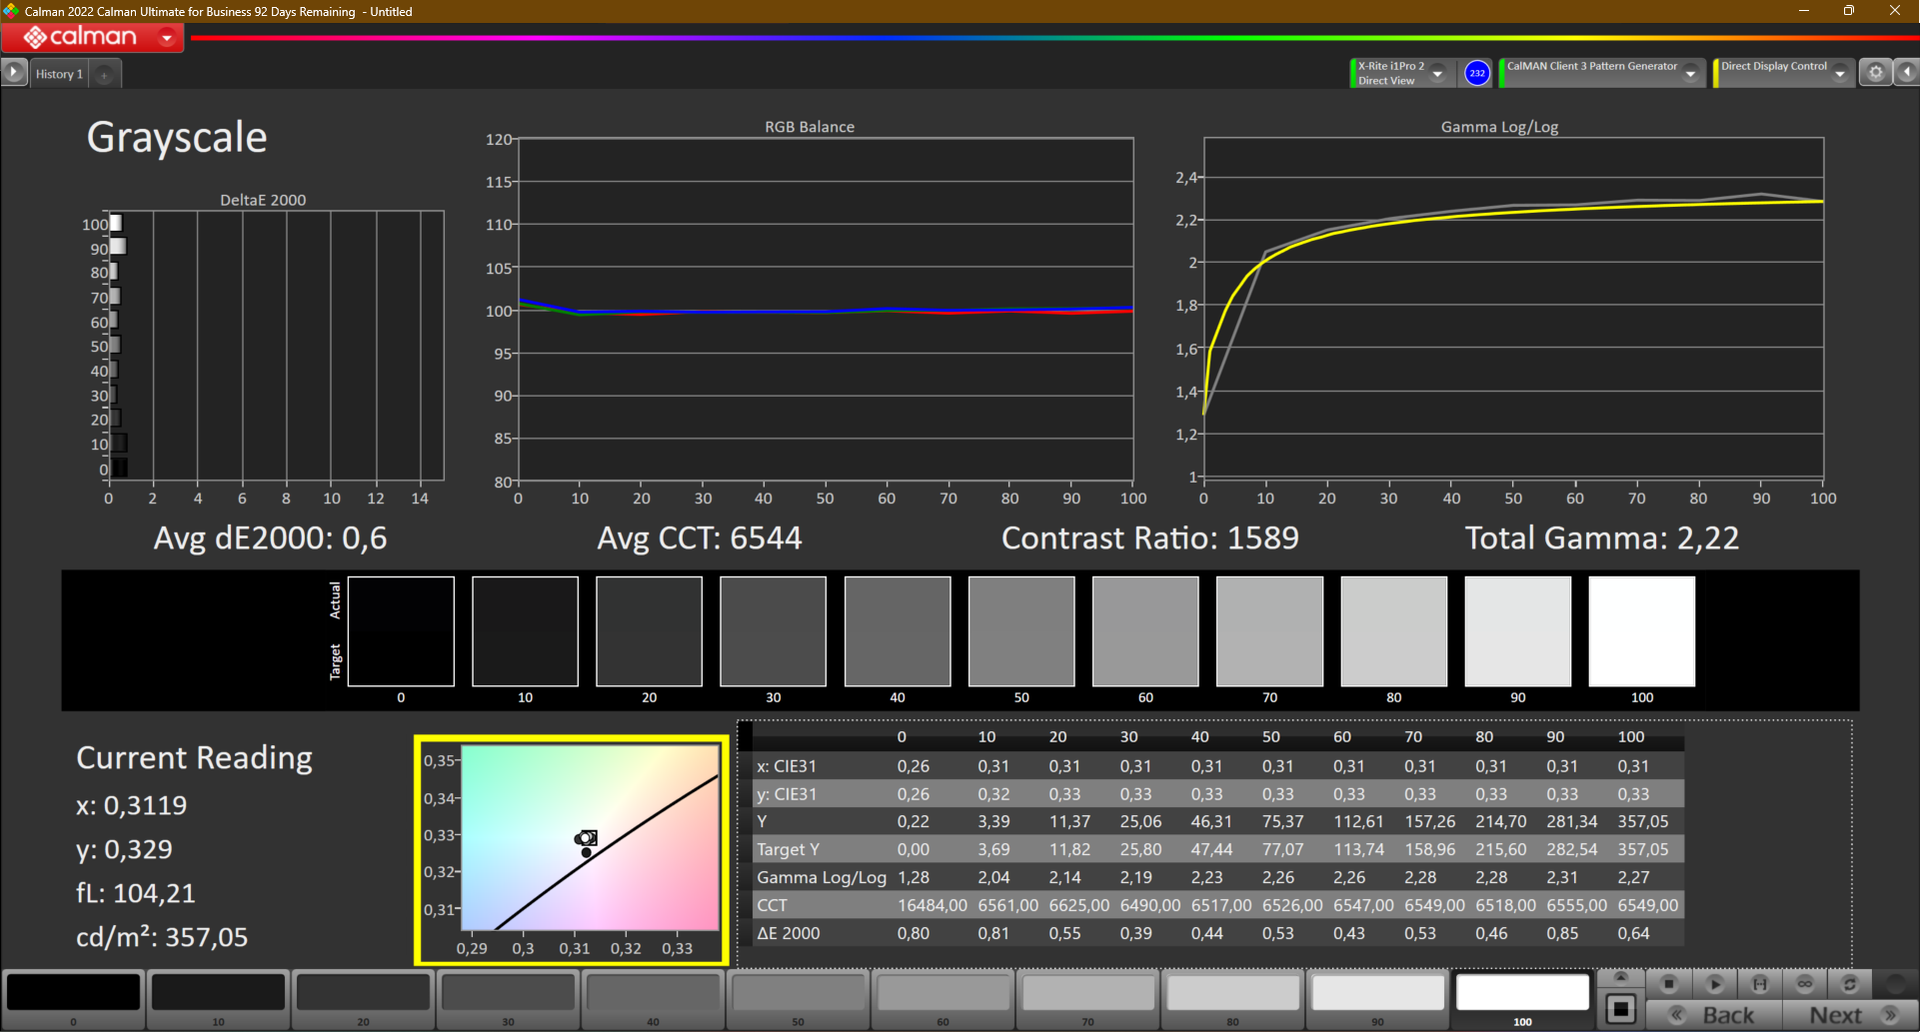
calibrated: 1
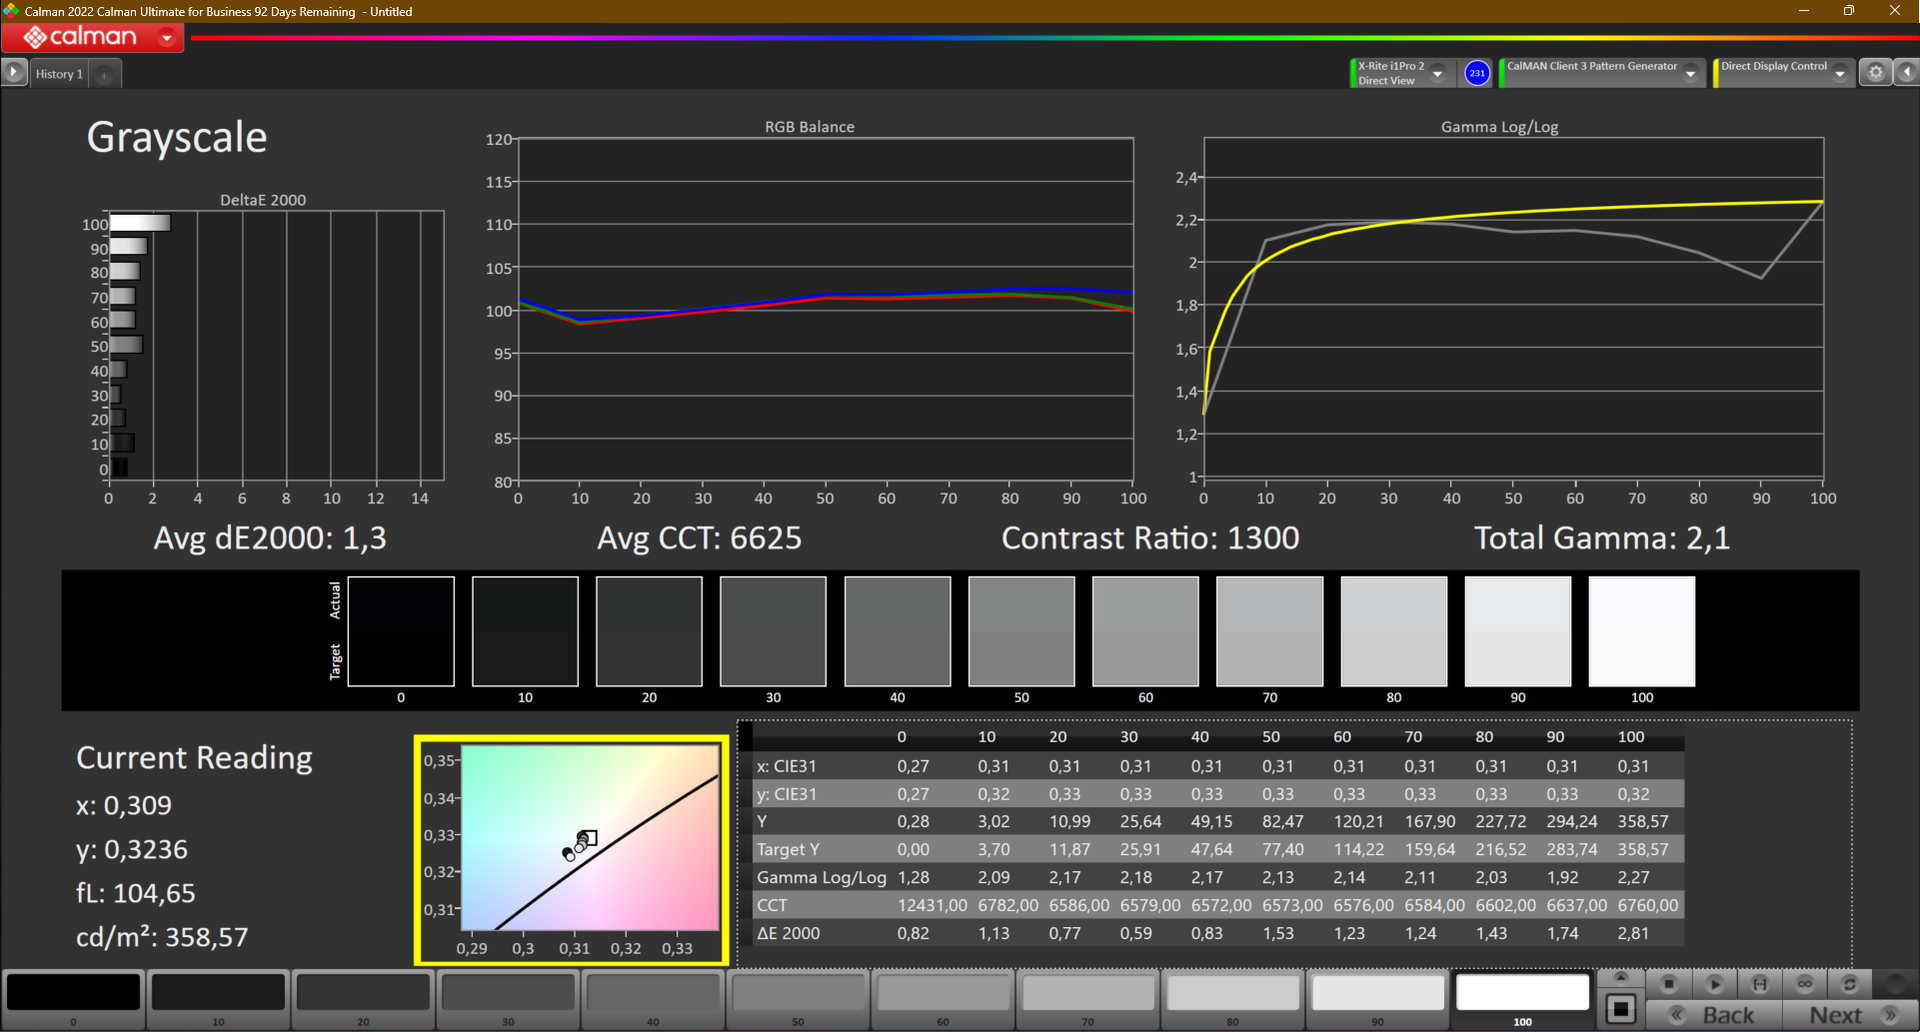
ΔE Greyscale Calman: 1.3 | ∀{0.09-98 Ø4.96}
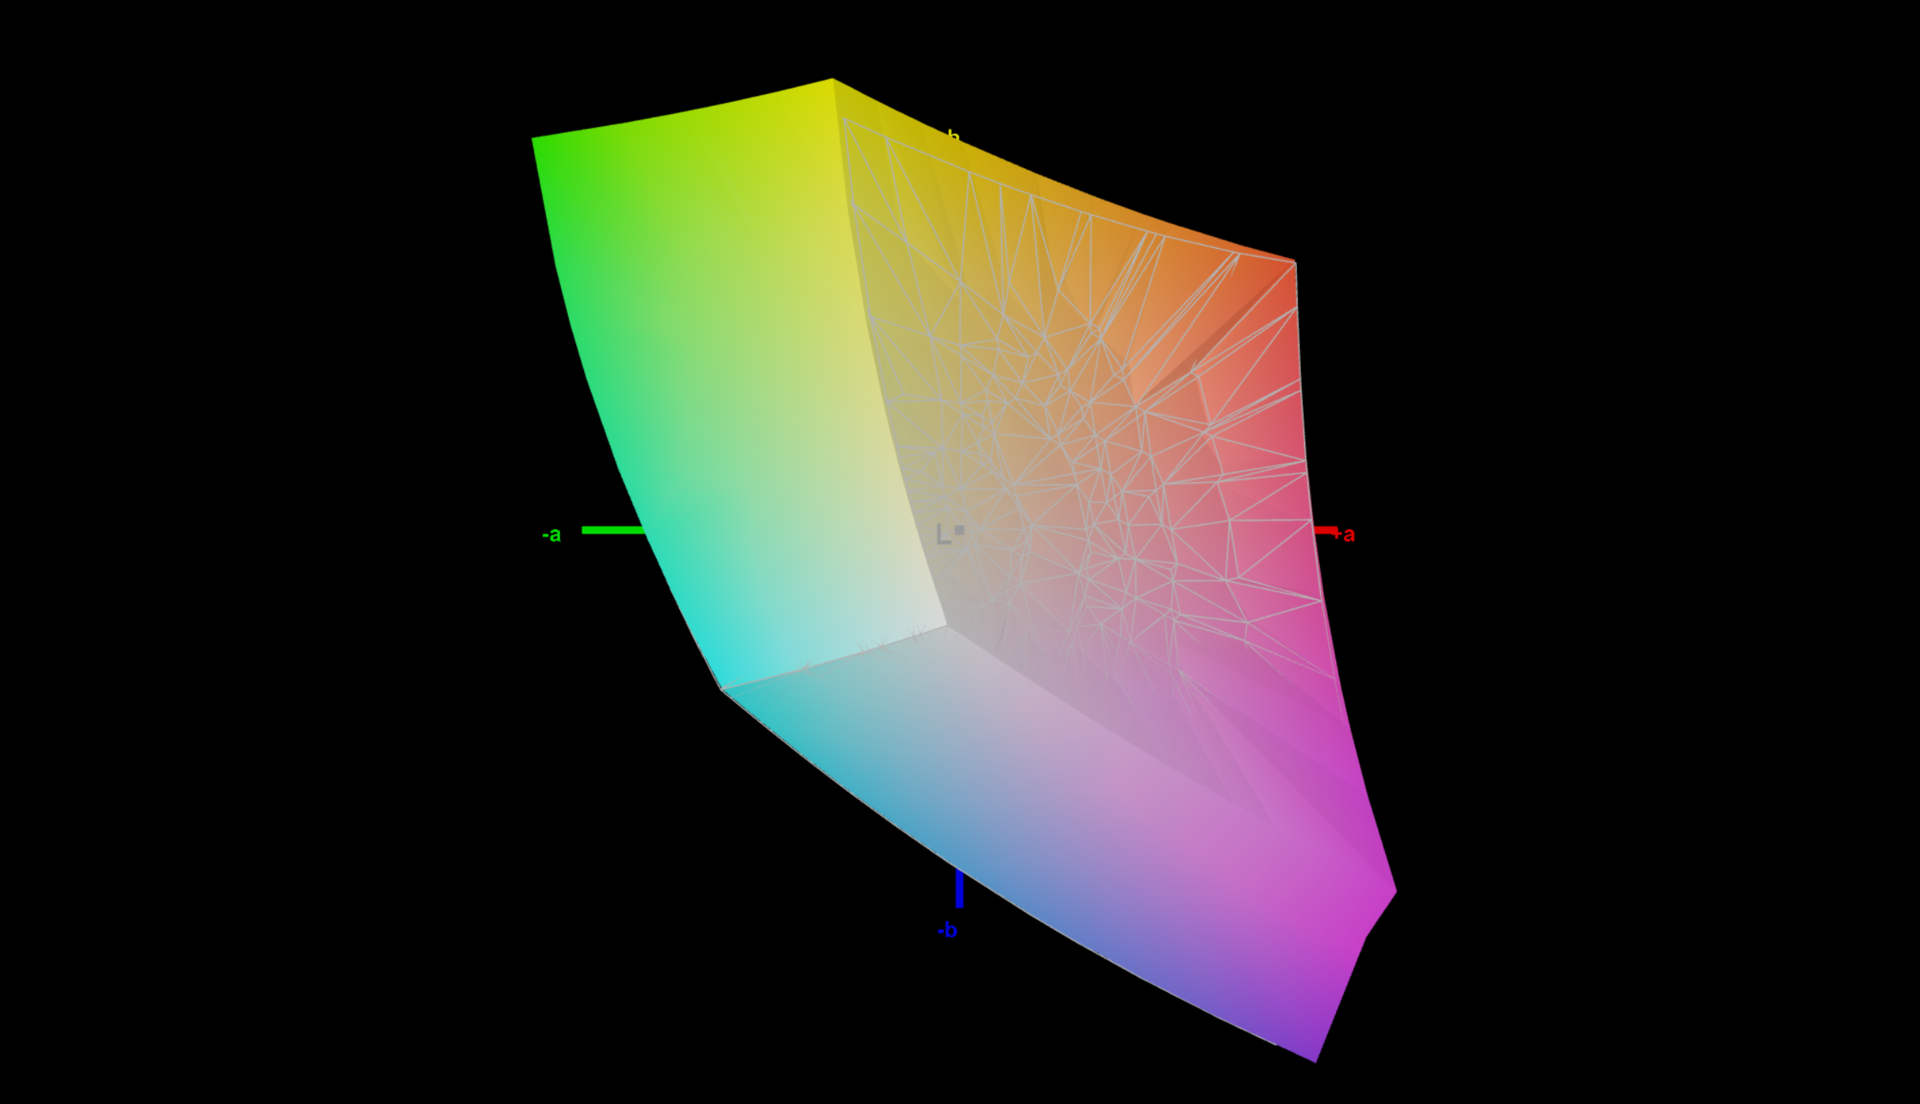
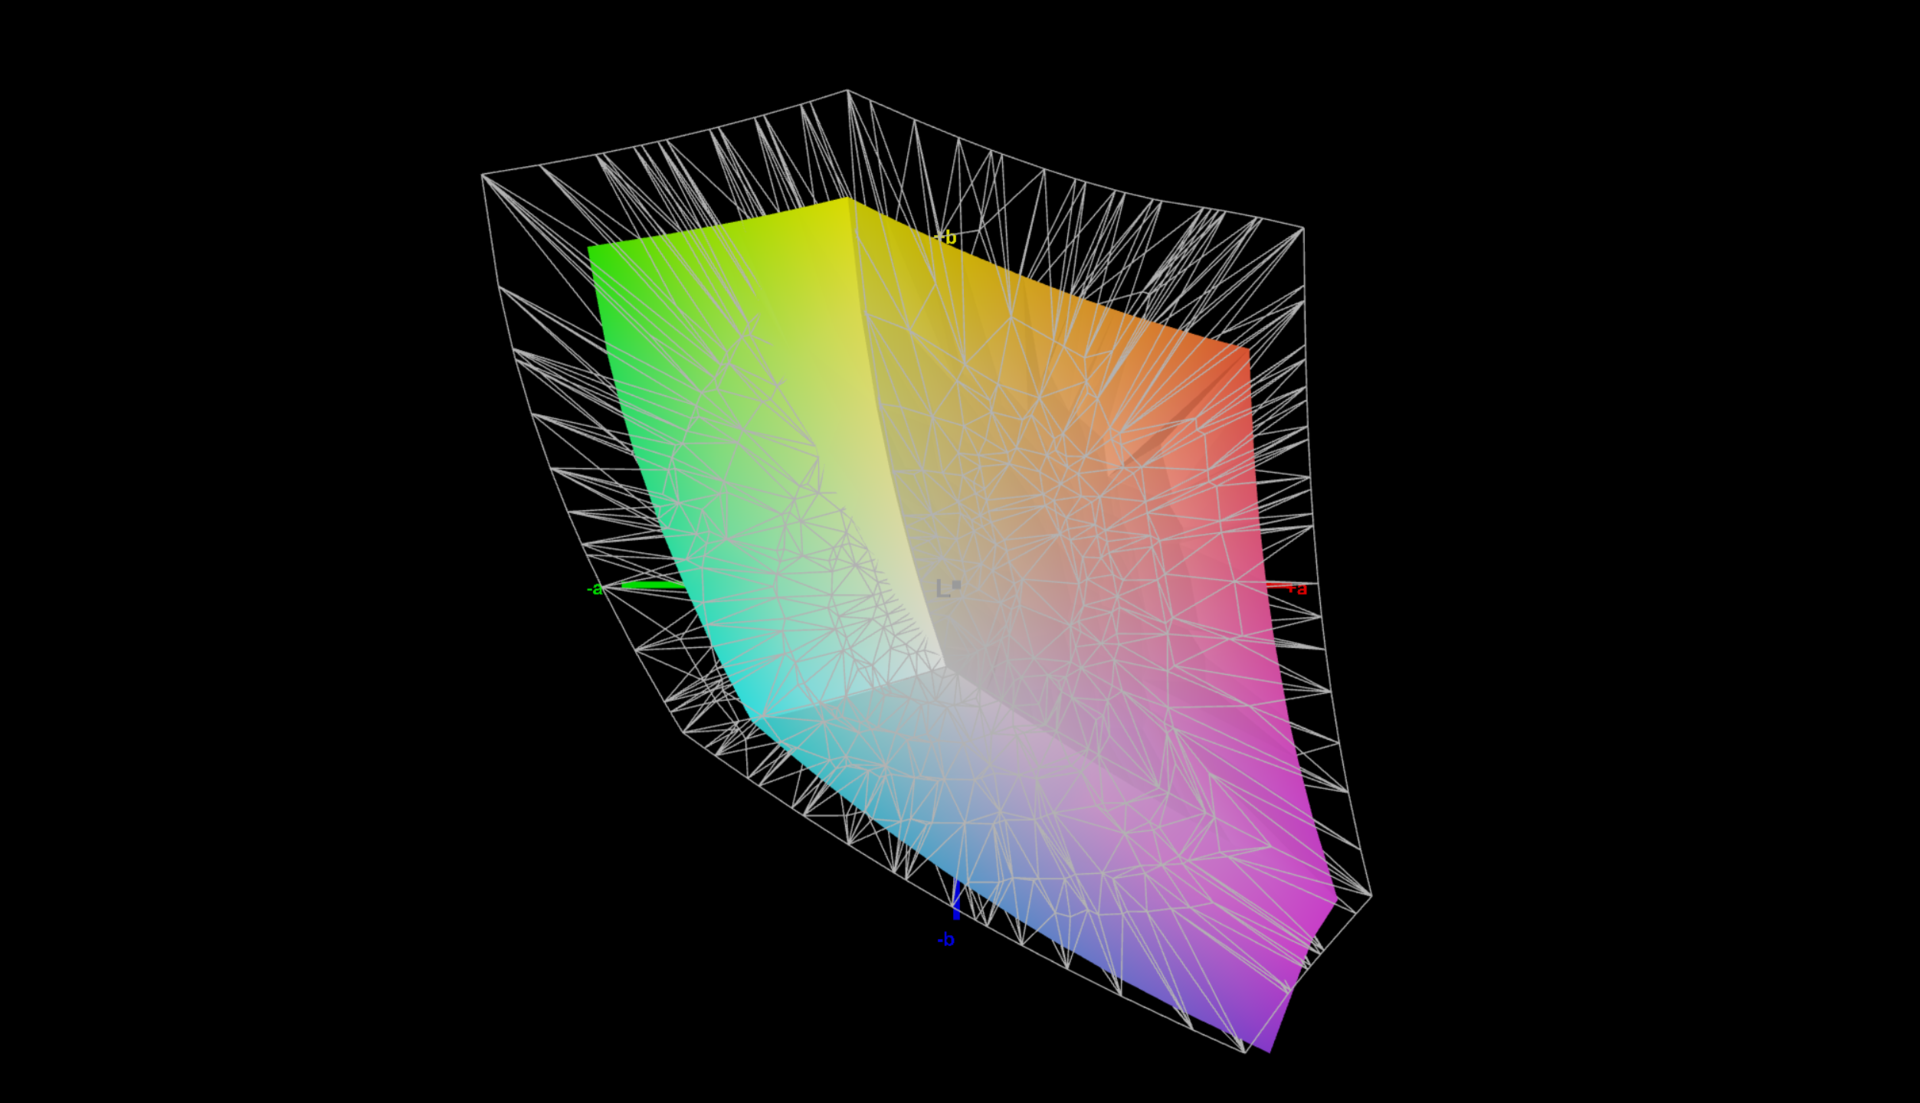
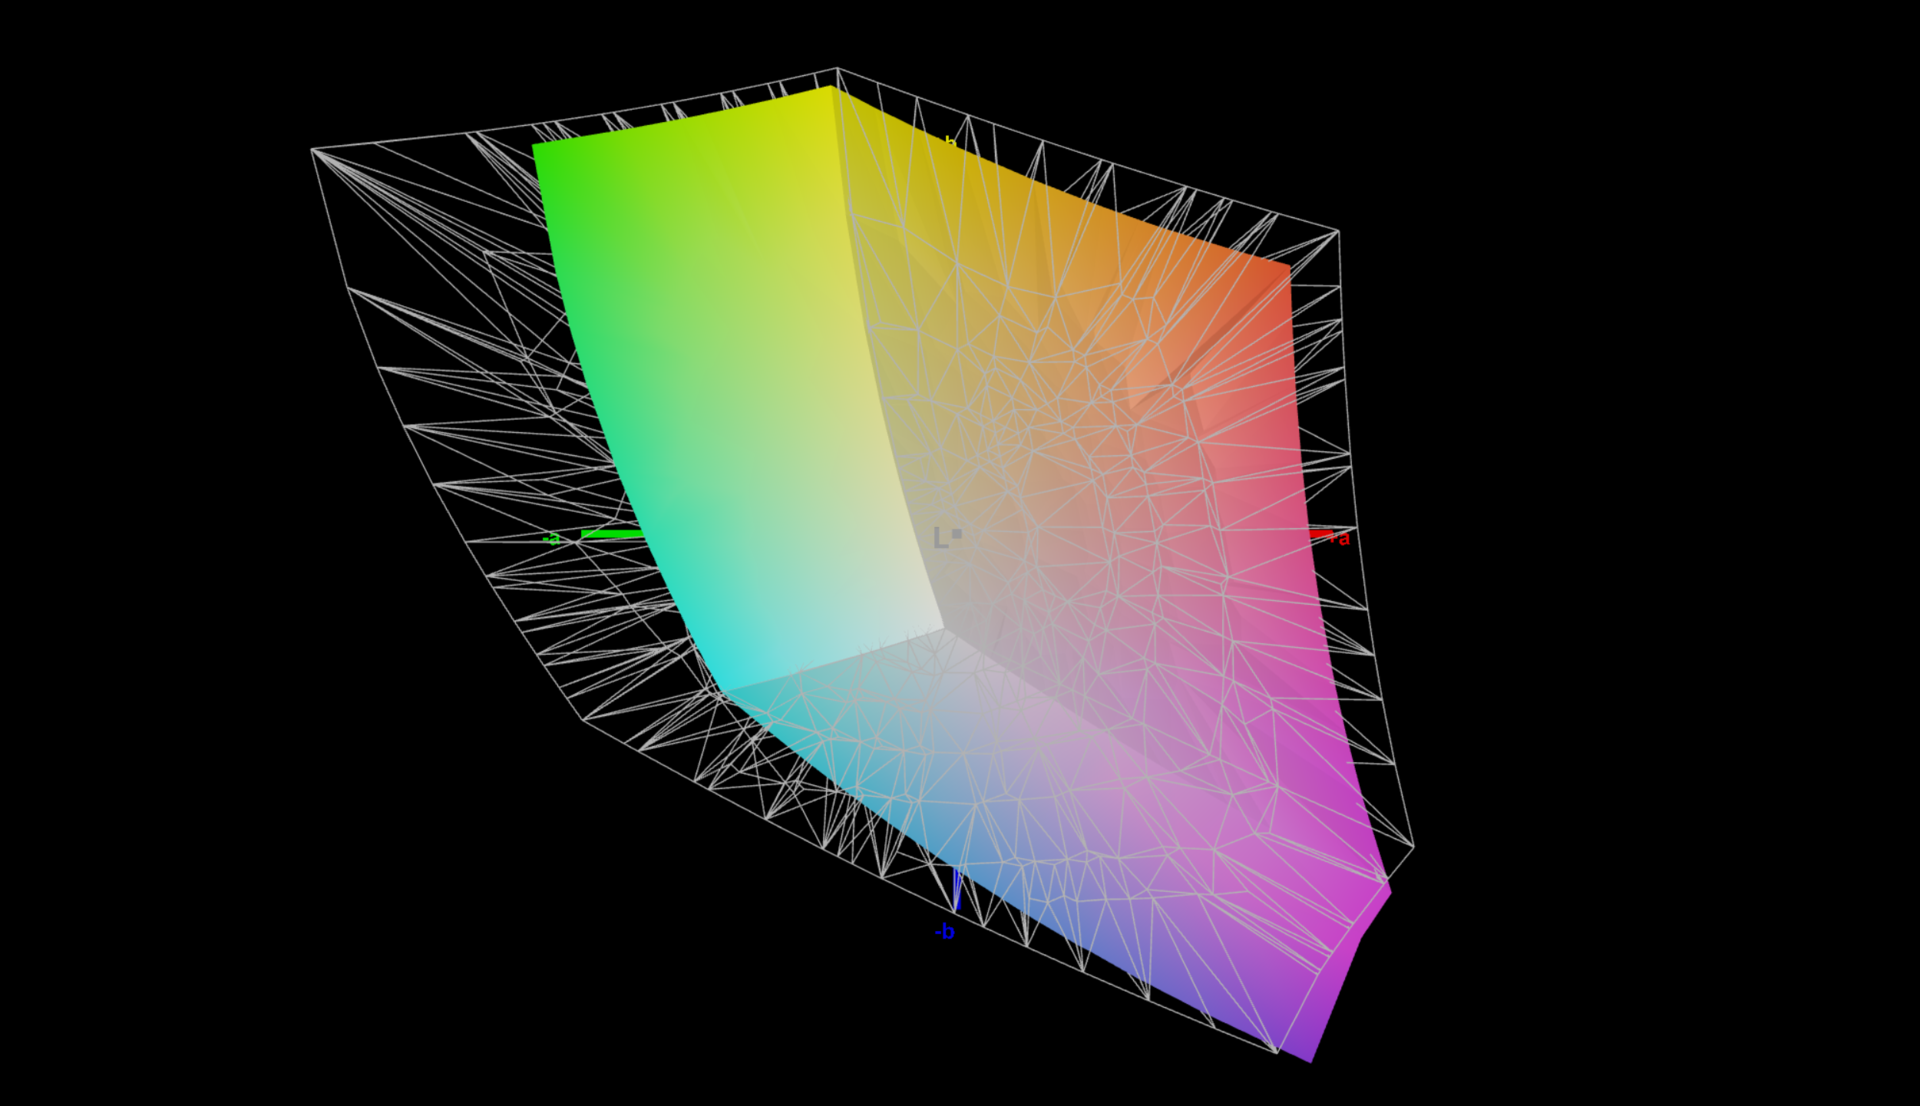
71.2% AdobeRGB 1998 (Argyll 3D)
99.3% sRGB (Argyll 3D)
70% Display P3 (Argyll 3D)
Gamma: 2.1
CCT: 6625 K
| Schenker Vision 16 PH6PRX1 BOE CQ NE160QDM-NZ1 , IPS, 2560x1600, 16" | Apple MacBook Air 15 2023 M2 16 GB IPS, 2880x1864, 15.3" | Acer Swift Go SFG16-71 Samsung SDC418D ATNA60BC03-0, OLED, 3200x2000, 16" | LG Gram SuperSlim (2023) Samsung ATNA56YX08-0, OLED, 1920x1080, 15.6" | Microsoft Surface Laptop 5 15, i7-1255U LQ150P1JX51, IPS, 2496x1664, 15" | Asus VivoBook S15 M3502RA-L1029W Samsung SDC4161, OLED, 1920x1080, 15.6" | |
|---|---|---|---|---|---|---|
| Display | 22% | 28% | 27% | -2% | 27% | |
| Display P3 Coverage (%) | 70 | 98.7 41% | 99.91 43% | 99.8 43% | 68.1 -3% | 99.9 43% |
| sRGB Coverage (%) | 99.3 | 99.9 1% | 100 1% | 100 1% | 97.3 -2% | 100 1% |
| AdobeRGB 1998 Coverage (%) | 71.2 | 87.9 23% | 98.87 39% | 98.09 38% | 70.3 -1% | 98.6 38% |
| Response Times | -149% | 79% | 79% | -318% | 84% | |
| Response Time Grey 50% / Grey 80% * (ms) | 11 ? | 28.8 ? -162% | 2 ? 82% | 2 ? 82% | 52.4 ? -376% | 0.74 93% |
| Response Time Black / White * (ms) | 8 ? | 18.9 ? -136% | 2 ? 75% | 2 ? 75% | 28.7 ? -259% | 2 ? 75% |
| PWM Frequency (Hz) | 227 ? | 22000 ? | 59 ? | |||
| Screen | 9% | -52% | -20% | 18% | -36% | |
| Brightness middle (cd/m²) | 356 | 517 45% | 370 4% | 395 11% | 397 12% | 378 6% |
| Brightness (cd/m²) | 349 | 501 44% | 371 6% | 392 12% | 399 14% | 378 8% |
| Brightness Distribution (%) | 93 | 93 0% | 98 5% | 97 4% | 85 -9% | 98 5% |
| Black Level * (cd/m²) | 0.28 | 0.39 -39% | 0.1 64% | 0.29 -4% | ||
| Contrast (:1) | 1271 | 1326 4% | 3950 211% | 1369 8% | ||
| Colorchecker dE 2000 * | 1.7 | 1.2 29% | 2.77 -63% | 2.2 -29% | 0.8 53% | 2.2 -29% |
| Colorchecker dE 2000 max. * | 3 | 2.5 17% | 4.08 -36% | 4.43 -48% | 1.4 53% | 4.87 -62% |
| Colorchecker dE 2000 calibrated * | 1 | 0.8 20% | 2.83 -183% | 4.65 -365% | 2.68 -168% | |
| Greyscale dE 2000 * | 1.3 | 1.8 -38% | 2.58 -98% | 1.78 -37% | 1.1 15% | 1.43 -10% |
| Gamma | 2.1 105% | 2.24 98% | 2.46 89% | 2.39 92% | 2.18 101% | 2.47 89% |
| CCT | 6625 98% | 6241 104% | 6284 103% | 6705 97% | 6464 101% | |
| Media totale (Programma / Settaggio) | -39% /
-11% | 18% /
-10% | 29% /
4% | -101% /
-38% | 25% /
0% |
* ... Meglio usare valori piccoli
Le misurazioni del valore del nero sono risultate pari a un solido 0,28 cd/m², che si traduce in un rapporto di contrasto dello schermo superiore a 1.200:1. Tuttavia, il display IPS non può competere con i valori di nero profondo dei pannelli OLED. Tuttavia, il display IPS non può competere con i valori di nero profondo dei pannelli OLED.
Il valore deltaE dello schermo prima della calibrazione si attesta su un buon 1,7 e siamo riusciti a migliorarlo fino a 1,0. In confronto, il display del Vision 16 Pro aveva un deltaE di 3,4 prima della calibrazione. La differenza è particolarmente evidente in termini di scala di grigi. La versione Pro aveva un deltaE della scala dei grigi di 4,9, mentre il Vision 16 in prova aveva un deltaE della scala dei grigi molto più basso, pari a 1,3.
Non abbiamo rilevato alcuna tonalità di blu come nello schermo del Vision 16 Pro. Data la buona calibrazione di fabbrica, non abbiamo utilizzato il profilo colore Schenker nel centro di controllo. La differenza di misurazioni tra il Vision 16 e il Vision 16 Pro dimostra che la qualità dello schermo è fortunata. Come sempre, il profilo colore che abbiamo creato per lo Schenker Vision 16 è disponibile per il download gratuito nel riquadro grigio in alto.
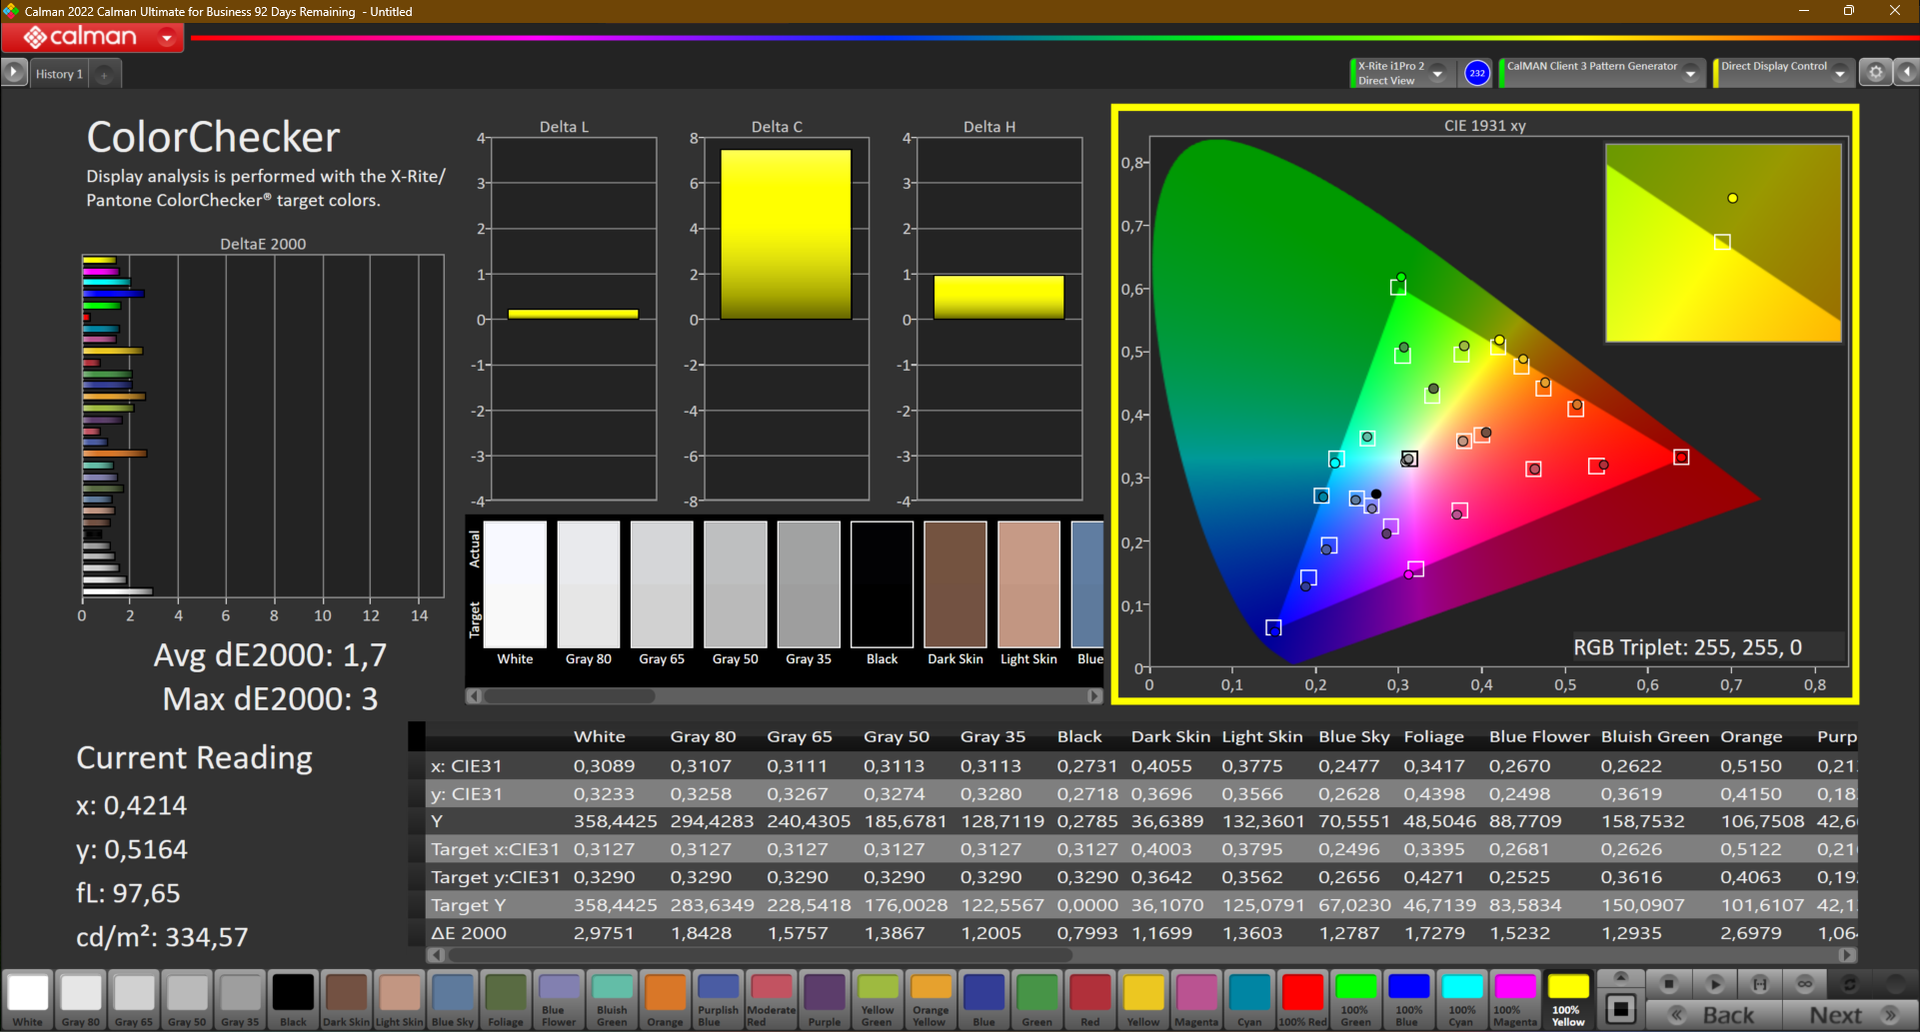


Poiché lo schermo copre quasi completamente il gamut sRGB, il Vision 16 2023 è adatto per il semplice editing fotografico. Per i fotografi e i videografi professionisti, lo schermo non è sufficiente, in quanto i gamut AdobeRGB e DCI P3 non sono sufficientemente coperti.
Tempi di risposta del Display
| ↔ Tempi di risposta dal Nero al Bianco | ||
|---|---|---|
| 8 ms ... aumenta ↗ e diminuisce ↘ combinato | ↗ 4 ms Incremento | 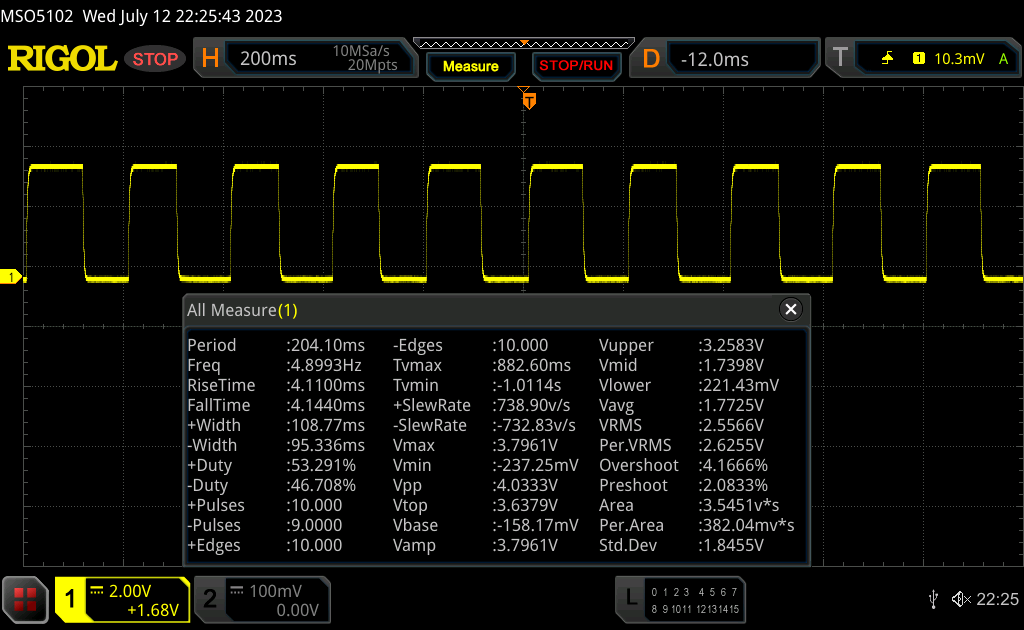 |
| ↘ 4 ms Calo | ||
| Lo schermo mostra veloci tempi di risposta durante i nostri tests e dovrebbe esere adatto al gaming In confronto, tutti i dispositivi di test variano da 0.1 (minimo) a 240 (massimo) ms. » 22 % di tutti i dispositivi è migliore. Questo significa che i tempi di risposta rilevati sono migliori rispettto alla media di tutti i dispositivi testati (19.8 ms). | ||
| ↔ Tempo di risposta dal 50% Grigio all'80% Grigio | ||
| 11 ms ... aumenta ↗ e diminuisce ↘ combinato | ↗ 5 ms Incremento | 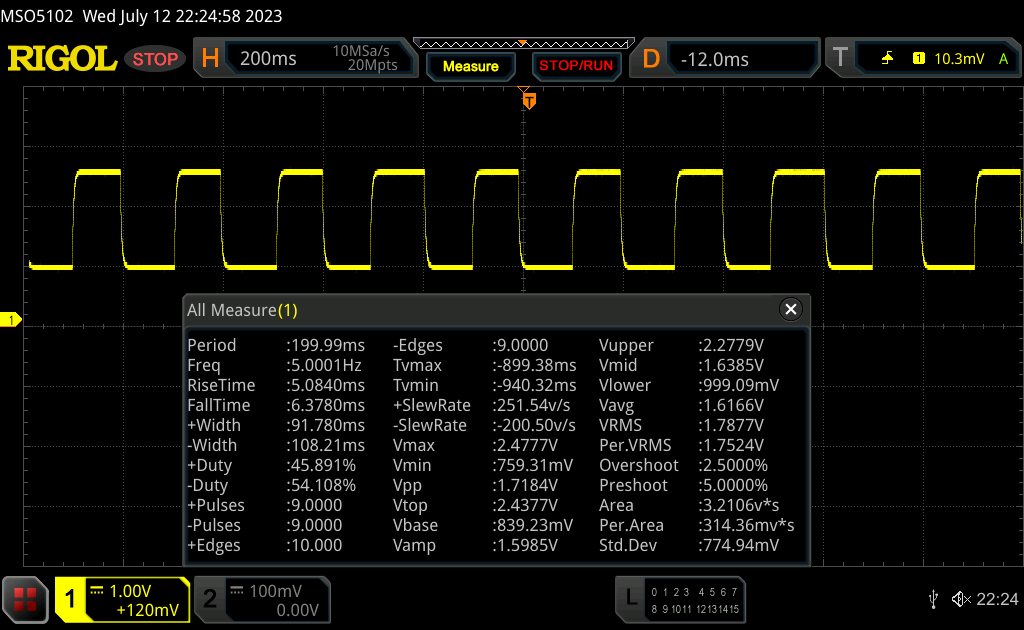 |
| ↘ 6 ms Calo | ||
| Lo schermo mostra buoni tempi di risposta durante i nostri tests, ma potrebbe essere troppo lento per i gamers competitivi. In confronto, tutti i dispositivi di test variano da 0.165 (minimo) a 636 (massimo) ms. » 25 % di tutti i dispositivi è migliore. Questo significa che i tempi di risposta rilevati sono migliori rispettto alla media di tutti i dispositivi testati (30.9 ms). | ||
Sfarfallio dello schermo / PWM (Pulse-Width Modulation)
| flickering dello schermo / PWM non rilevato |  | ||
In confronto: 52 % di tutti i dispositivi testati non utilizza PWM per ridurre la luminosita' del display. Se è rilevato PWM, una media di 7748 (minimo: 5 - massimo: 343500) Hz è stata rilevata. | |||
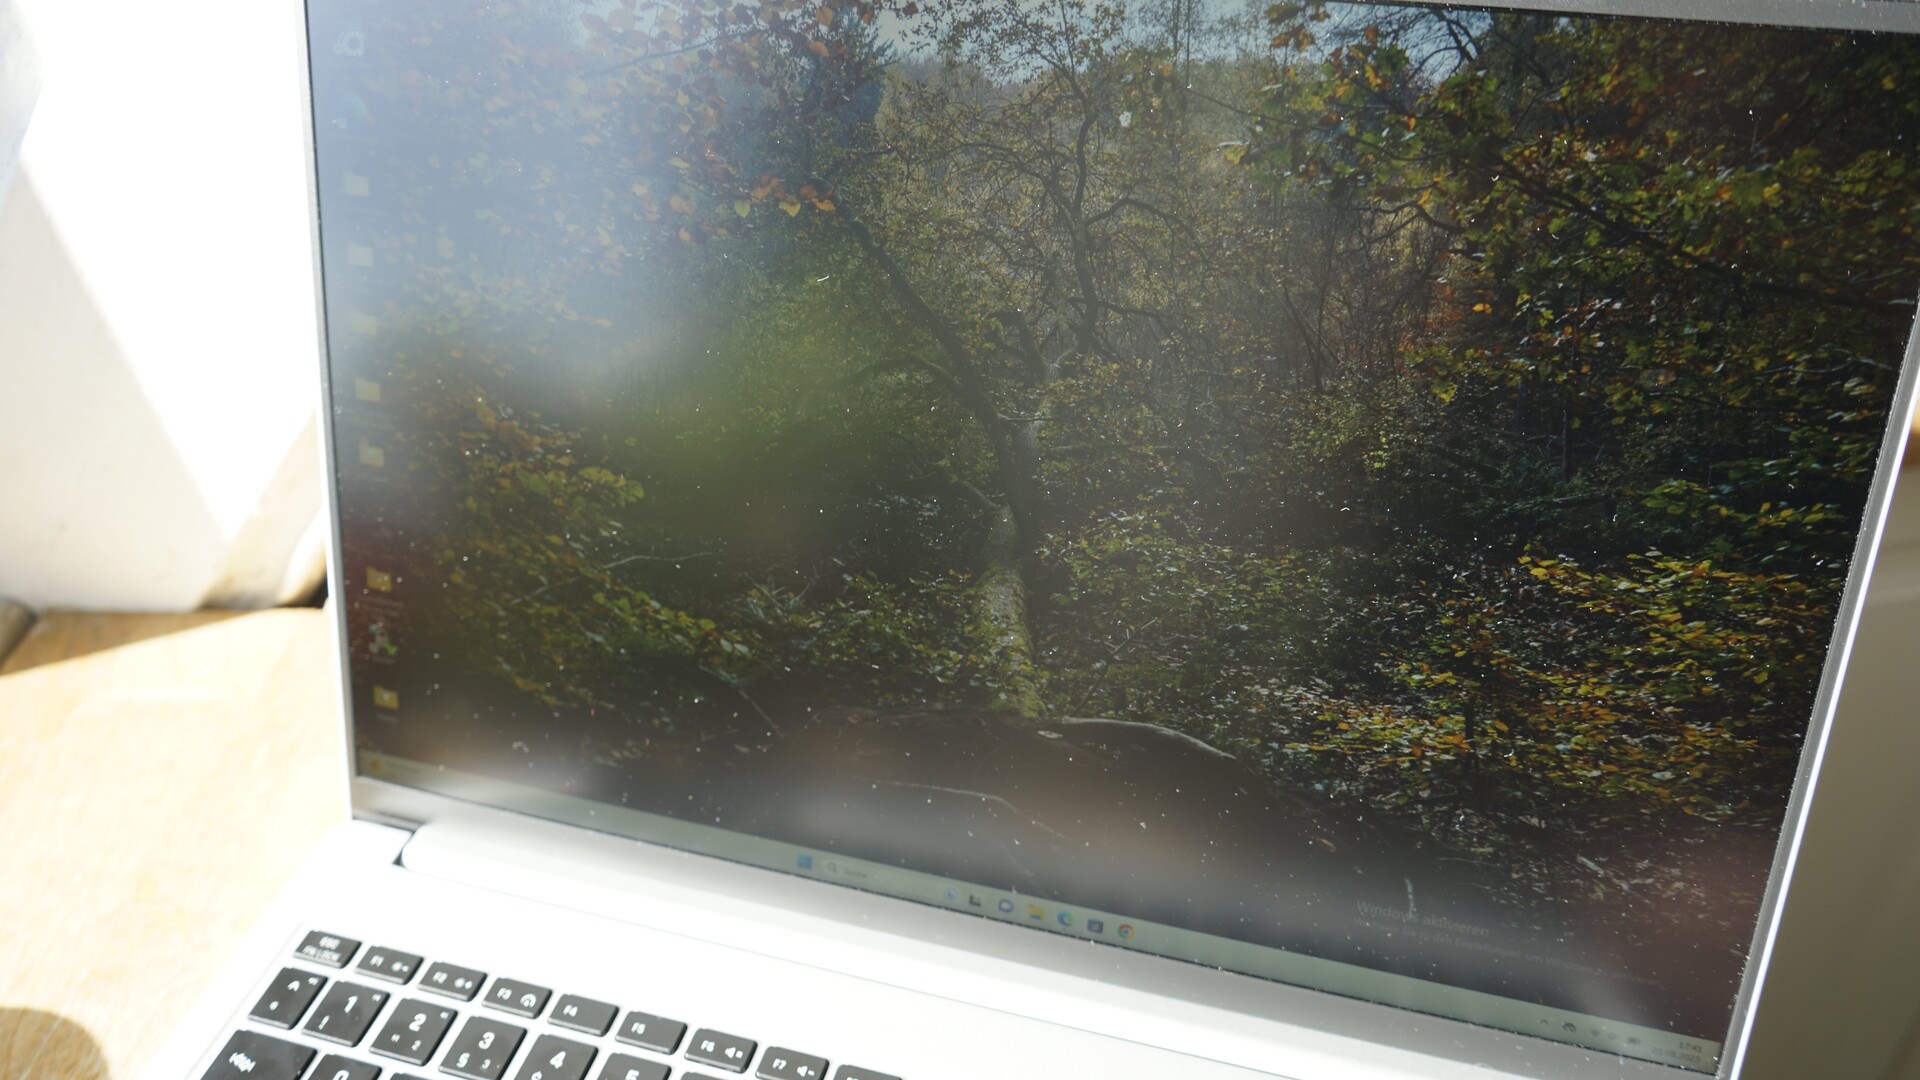
Grazie allo schermo opaco, il Vision 16 è utilizzabile in ambienti esterni. È tuttavia opportuno evitare la luce diretta del sole, che rende il lavoro piuttosto difficile.
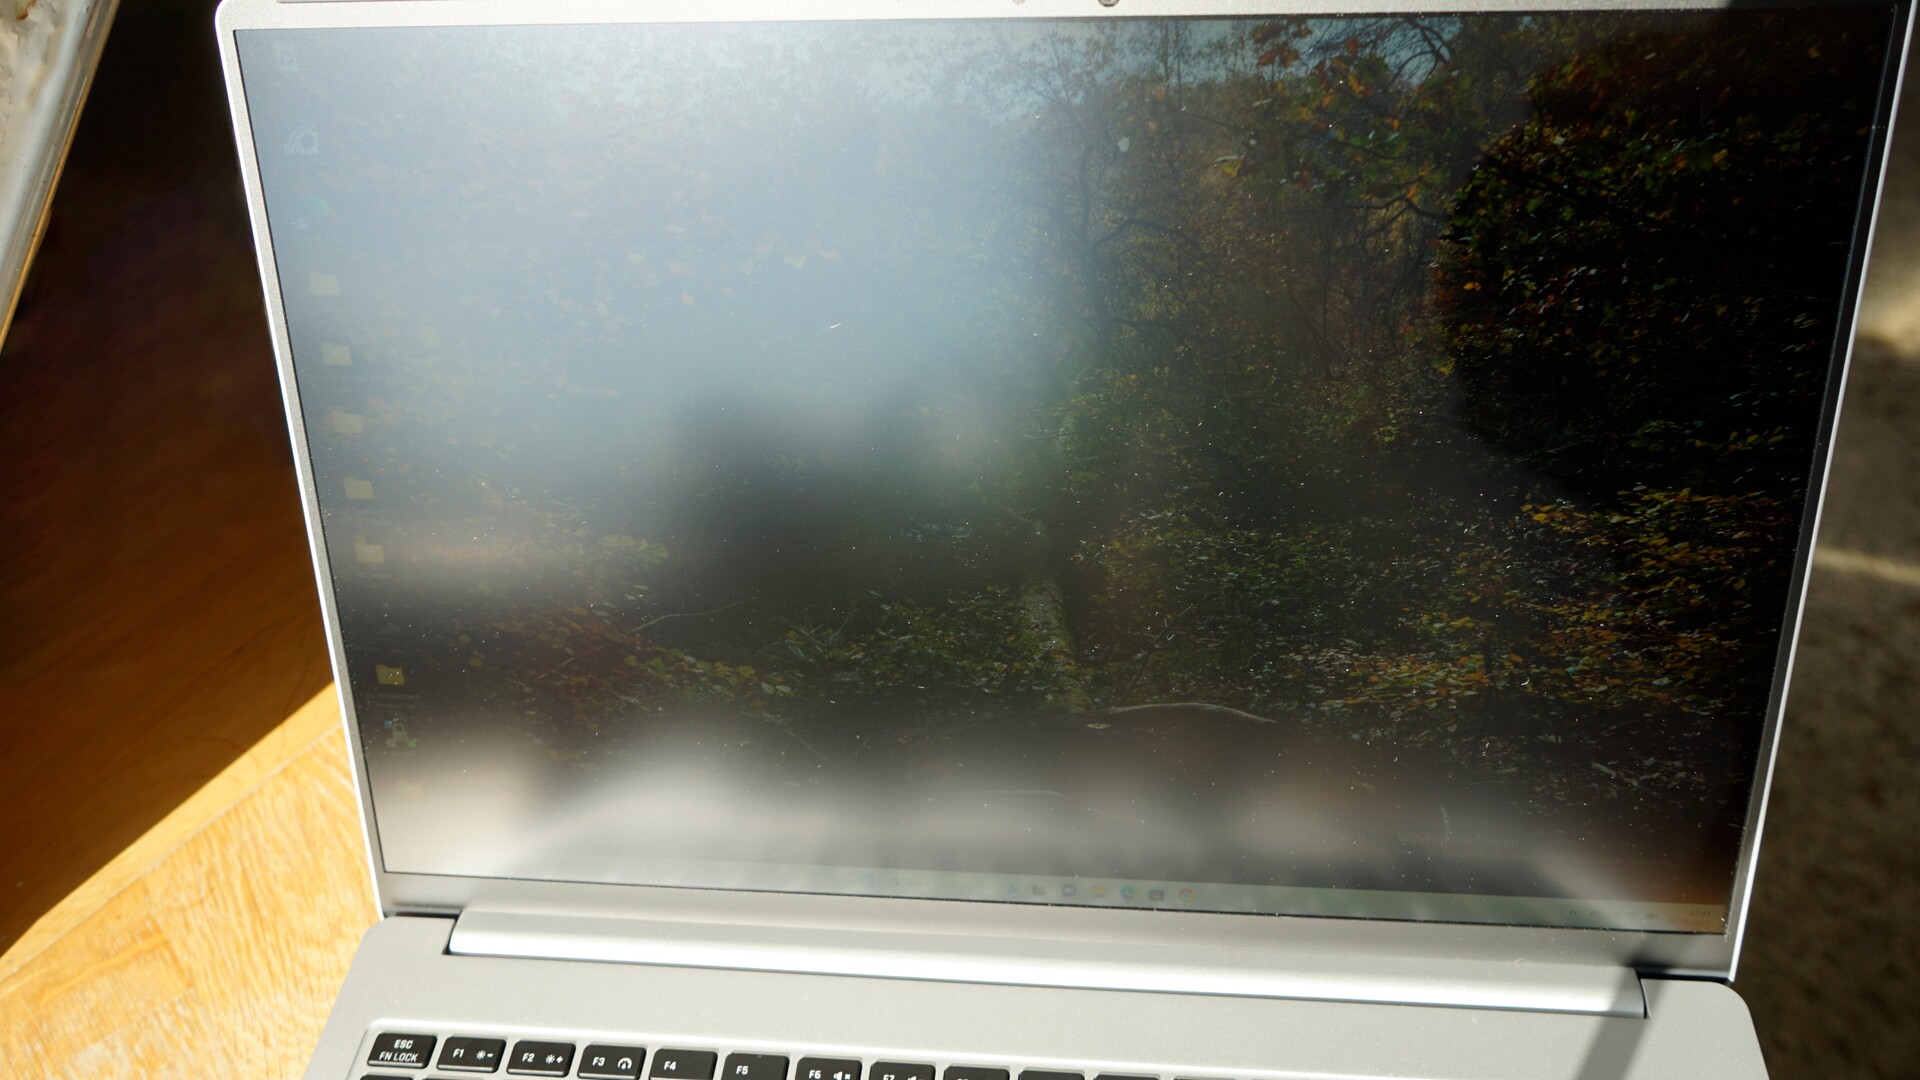
La stabilità dell'angolo di visione è buona, ma non al livello degli schermi OLED. Il display perde contrasto se visto da angolazioni estreme.


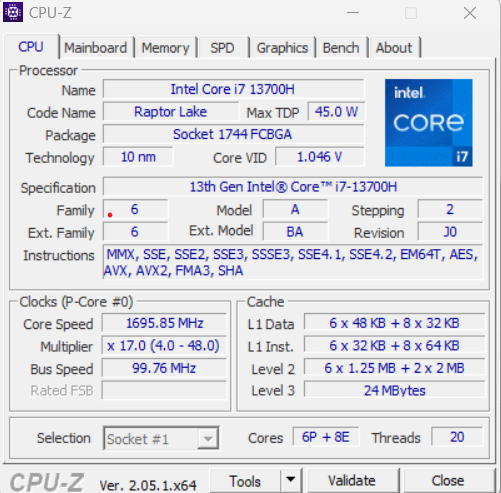
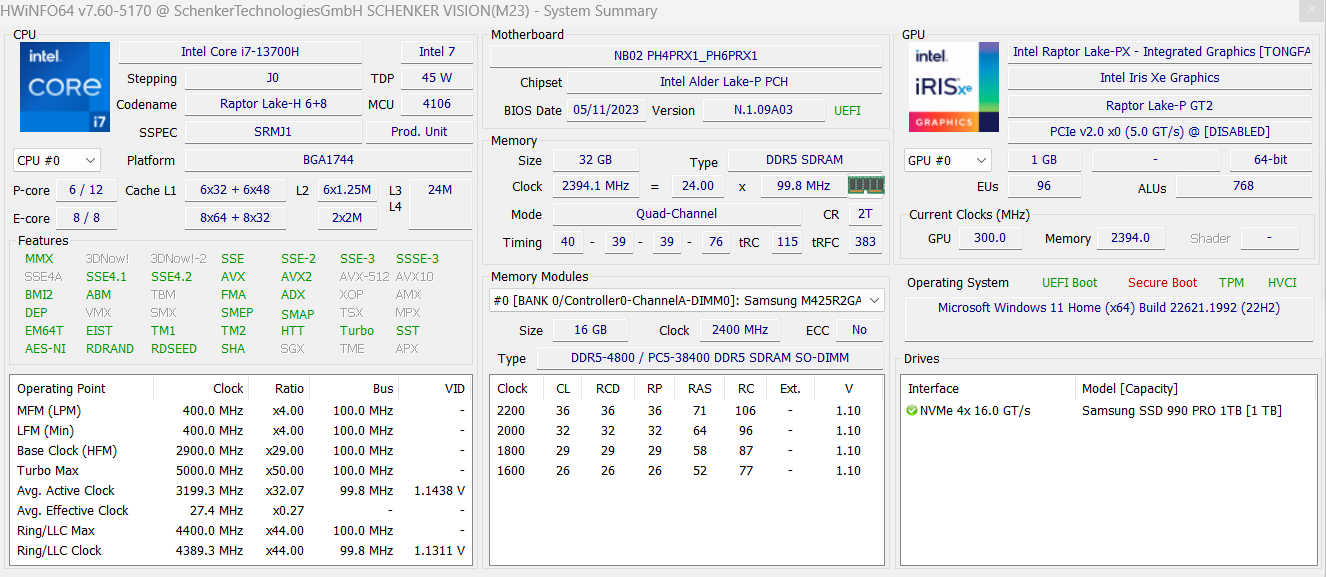
Prestazioni - Il Core i7-13700H non può funzionare a pieno regime
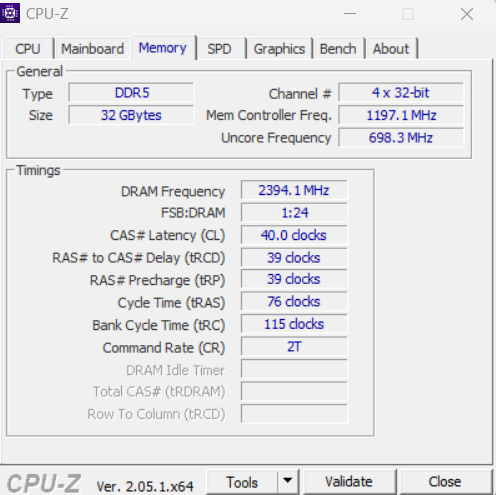
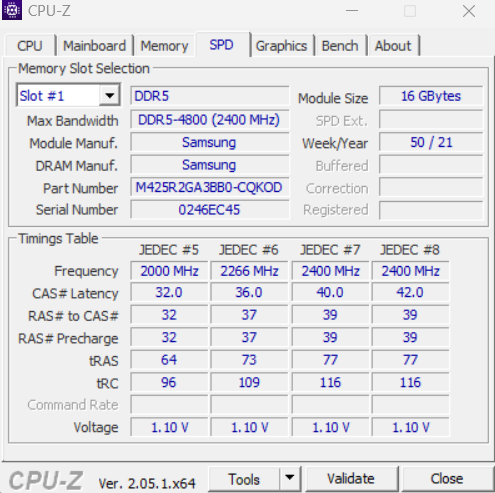
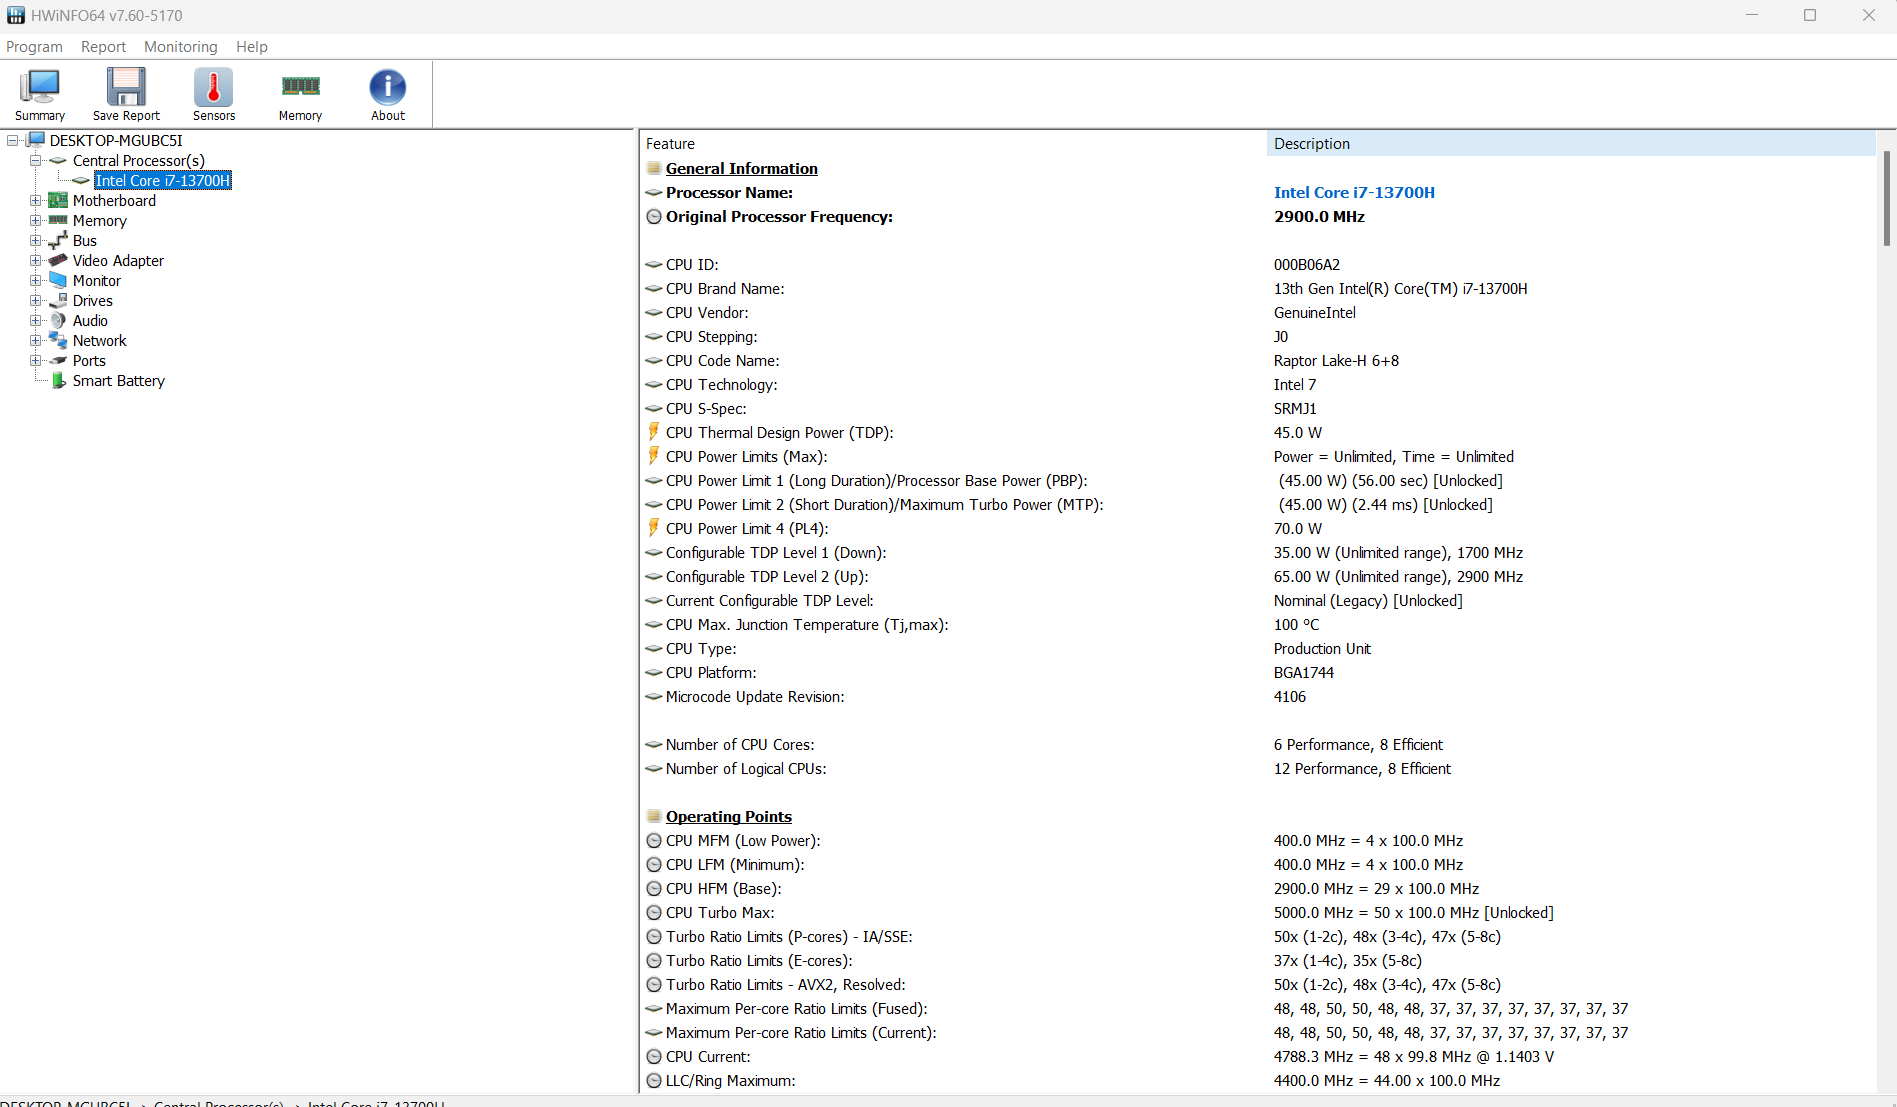
Al posto dello scorso anno Intel Core i7-12700H. il nuovo modello del Vision 16 offre il più recenteIntel Core i7-13700H. Mentre il predecessore offriva una RTX 3050 Ti, il modello di quest'anno contiene solo la GPU integrata del processore Intel. Fanno parte del pacchetto anche 32 GB di RAM DDR5 e un'unità SSD M.2 NVMe PCIe da 1 TB.
Condizioni di test
Schenker offre diversi profili nell'applicazione Control center, ma il profilo manuale non è più disponibile come il precedente. Le soglie di TDP del processore non sono quindi modificabili dall'utente. Tutti i benchmark delle prestazioni sono stati eseguiti in modalità "Enthusiast", con un TDP di 45 W. Nella modalità "Quiet" dell'applicazione Control Center di Schenker, il TDP è fissato a 15 W. Per il test della batteria, utilizziamo la modalità "Balanced", che ha anch'essa un limite di TDP di 45 W.
| Enthusiast | Bilanciato | Silenzioso | |
|---|---|---|---|
| CPU PL1 (HWInfo) | 45 Watt | 45 Watt | 15 Watt |
| CPU PL2 (HWInfo) | 45 Watt | 45 Watt | 15 Watt |
Processore
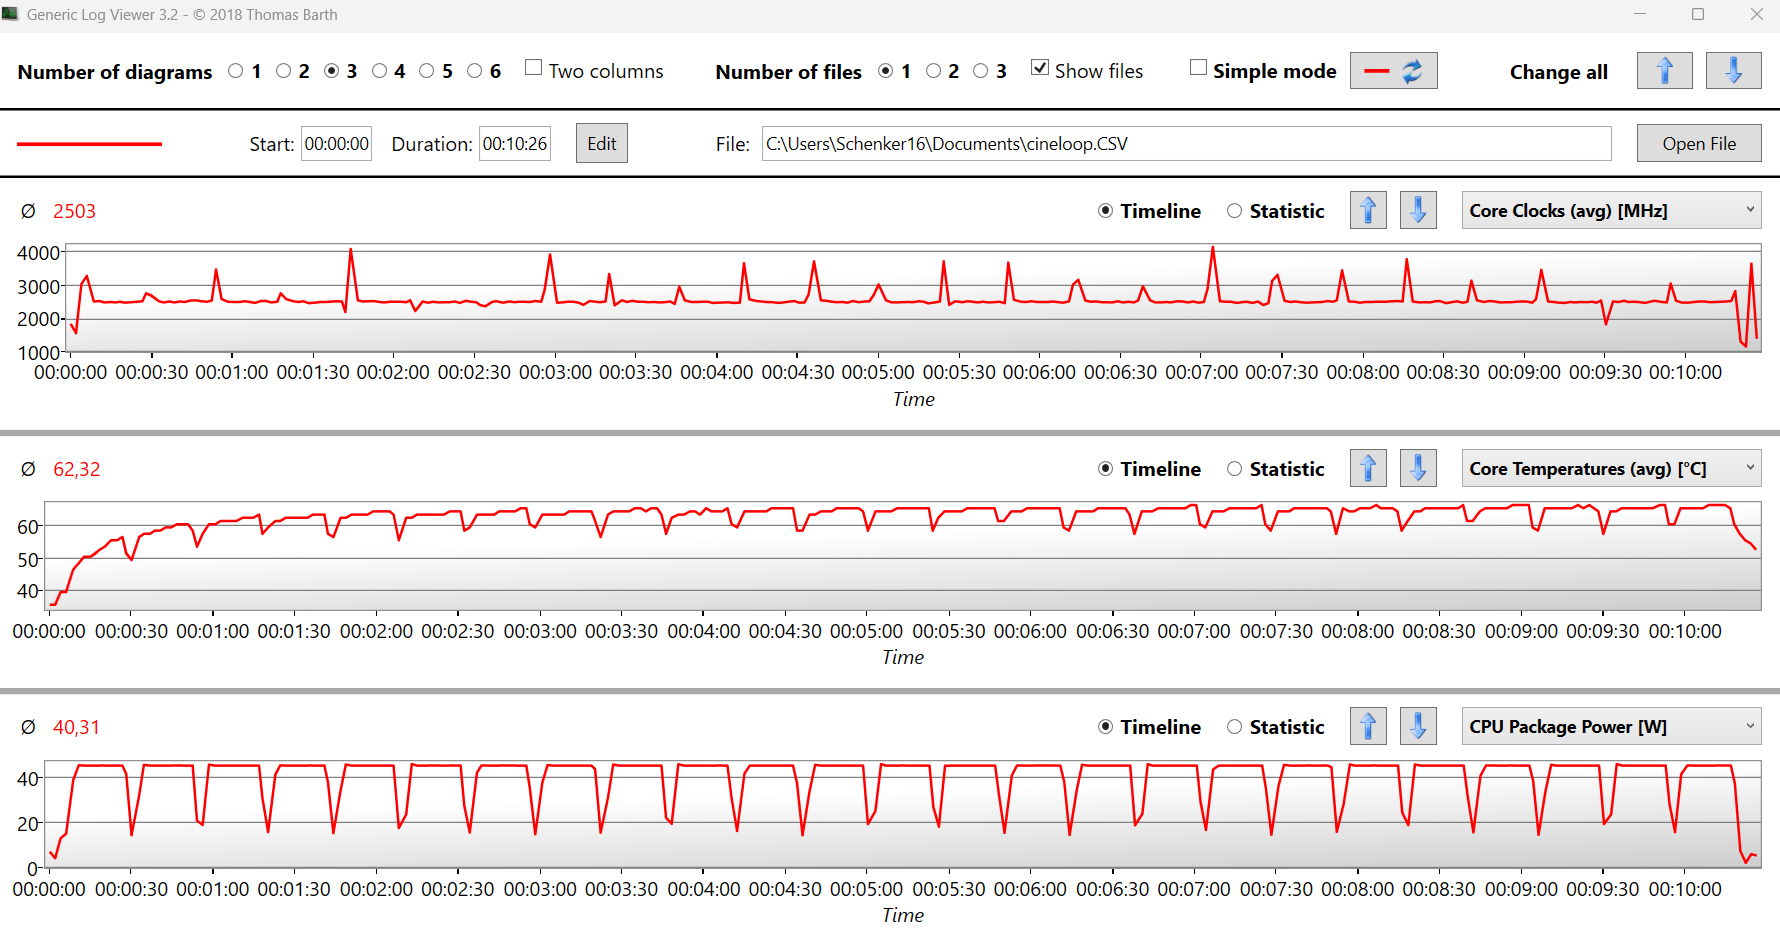
Nel Vision 16, lo stesso Core i7-13700Hdella generazione Raptor Lake di Intel è utilizzato come nel Vision 16 Pro. Poiché il limite di potenza è piuttosto limitato, le temperature rimangono basse, ma le prestazioni ne risentono e il processore è più lento rispetto al Vision 16 Pro Vision 16 Pro. Le prestazioni multi core nel ciclo Cinebench R15 del Vision 16 sono peggiori di circa il 15% rispetto al Vision 16 Pro. Attribuiamo questo risultato inferiore al peggiore sistema di raffreddamento del Vision 16. Poiché abbiamo misurato una temperatura piuttosto bassa di 62 gradi durante il ciclo di Cinebench, il processore ha spazio per ottenere prestazioni migliori. In modalità batteria, la CPU è limitata a 35 W, il che riduce le prestazioni del Multi core del 20%.
Cinebench R15 Multi sustained loop
Cinebench R23: Multi Core | Single Core
Cinebench R20: CPU (Multi Core) | CPU (Single Core)
Cinebench R15: CPU Multi 64Bit | CPU Single 64Bit
Blender: v2.79 BMW27 CPU
7-Zip 18.03: 7z b 4 | 7z b 4 -mmt1
Geekbench 5.5: Multi-Core | Single-Core
HWBOT x265 Benchmark v2.2: 4k Preset
LibreOffice : 20 Documents To PDF
R Benchmark 2.5: Overall mean
| CPU Performance rating | |
| Schenker VISION 16 Pro (M23) | |
| Media Intel Core i7-13700H | |
| Acer Swift Go SFG16-71 | |
| Schenker Vision 16 PH6PRX1 | |
| Asus VivoBook S15 M3502RA-L1029W | |
| Media della classe Office | |
| LG Gram SuperSlim (2023) | |
| Microsoft Surface Laptop 5 15, i7-1255U | |
| Apple MacBook Air 15 2023 M2 16 GB -5! | |
| Cinebench R23 / Multi Core | |
| Media Intel Core i7-13700H (5890 - 20034, n=29) | |
| Schenker VISION 16 Pro (M23) | |
| Acer Swift Go SFG16-71 | |
| Asus VivoBook S15 M3502RA-L1029W | |
| Schenker Vision 16 PH6PRX1 | |
| Media della classe Office (1673 - 22808, n=76, ultimi 2 anni) | |
| LG Gram SuperSlim (2023) | |
| Microsoft Surface Laptop 5 15, i7-1255U | |
| Apple MacBook Air 15 2023 M2 16 GB | |
| Cinebench R23 / Single Core | |
| Acer Swift Go SFG16-71 | |
| Schenker VISION 16 Pro (M23) | |
| Schenker Vision 16 PH6PRX1 | |
| Media Intel Core i7-13700H (1323 - 1914, n=29) | |
| LG Gram SuperSlim (2023) | |
| Media della classe Office (708 - 2130, n=76, ultimi 2 anni) | |
| Microsoft Surface Laptop 5 15, i7-1255U | |
| Apple MacBook Air 15 2023 M2 16 GB | |
| Asus VivoBook S15 M3502RA-L1029W | |
| Cinebench R20 / CPU (Multi Core) | |
| Media Intel Core i7-13700H (2322 - 7674, n=29) | |
| Schenker VISION 16 Pro (M23) | |
| Acer Swift Go SFG16-71 | |
| Asus VivoBook S15 M3502RA-L1029W | |
| Schenker Vision 16 PH6PRX1 | |
| Media della classe Office (648 - 8840, n=75, ultimi 2 anni) | |
| LG Gram SuperSlim (2023) | |
| Microsoft Surface Laptop 5 15, i7-1255U | |
| Apple MacBook Air 15 2023 M2 16 GB | |
| Cinebench R20 / CPU (Single Core) | |
| Schenker VISION 16 Pro (M23) | |
| Acer Swift Go SFG16-71 | |
| Schenker Vision 16 PH6PRX1 | |
| Media Intel Core i7-13700H (508 - 741, n=29) | |
| LG Gram SuperSlim (2023) | |
| Media della classe Office (345 - 816, n=75, ultimi 2 anni) | |
| Microsoft Surface Laptop 5 15, i7-1255U | |
| Asus VivoBook S15 M3502RA-L1029W | |
| Apple MacBook Air 15 2023 M2 16 GB | |
| Cinebench R15 / CPU Multi 64Bit | |
| Media Intel Core i7-13700H (905 - 2982, n=29) | |
| Acer Swift Go SFG16-71 | |
| Schenker VISION 16 Pro (M23) | |
| Asus VivoBook S15 M3502RA-L1029W | |
| Schenker Vision 16 PH6PRX1 | |
| Media della classe Office (250 - 3380, n=77, ultimi 2 anni) | |
| LG Gram SuperSlim (2023) | |
| Microsoft Surface Laptop 5 15, i7-1255U | |
| Apple MacBook Air 15 2023 M2 16 GB | |
| Cinebench R15 / CPU Single 64Bit | |
| Schenker VISION 16 Pro (M23) | |
| Schenker Vision 16 PH6PRX1 | |
| Media Intel Core i7-13700H (213 - 278, n=29) | |
| Acer Swift Go SFG16-71 | |
| Media della classe Office (99.5 - 316, n=77, ultimi 2 anni) | |
| LG Gram SuperSlim (2023) | |
| Asus VivoBook S15 M3502RA-L1029W | |
| Microsoft Surface Laptop 5 15, i7-1255U | |
| Apple MacBook Air 15 2023 M2 16 GB | |
| Blender / v2.79 BMW27 CPU | |
| Apple MacBook Air 15 2023 M2 16 GB | |
| Microsoft Surface Laptop 5 15, i7-1255U | |
| Media della classe Office (158 - 1940, n=76, ultimi 2 anni) | |
| LG Gram SuperSlim (2023) | |
| Acer Swift Go SFG16-71 | |
| Asus VivoBook S15 M3502RA-L1029W | |
| Schenker Vision 16 PH6PRX1 | |
| Media Intel Core i7-13700H (169 - 555, n=29) | |
| Schenker VISION 16 Pro (M23) | |
| 7-Zip 18.03 / 7z b 4 | |
| Schenker VISION 16 Pro (M23) | |
| Media Intel Core i7-13700H (27322 - 76344, n=29) | |
| Asus VivoBook S15 M3502RA-L1029W | |
| Acer Swift Go SFG16-71 | |
| Schenker Vision 16 PH6PRX1 | |
| Media della classe Office (7098 - 76886, n=77, ultimi 2 anni) | |
| LG Gram SuperSlim (2023) | |
| Microsoft Surface Laptop 5 15, i7-1255U | |
| 7-Zip 18.03 / 7z b 4 -mmt1 | |
| Schenker VISION 16 Pro (M23) | |
| Acer Swift Go SFG16-71 | |
| Schenker Vision 16 PH6PRX1 | |
| Media Intel Core i7-13700H (4825 - 6238, n=29) | |
| Asus VivoBook S15 M3502RA-L1029W | |
| Media della classe Office (3387 - 6469, n=77, ultimi 2 anni) | |
| LG Gram SuperSlim (2023) | |
| Microsoft Surface Laptop 5 15, i7-1255U | |
| Geekbench 5.5 / Multi-Core | |
| Acer Swift Go SFG16-71 | |
| Schenker VISION 16 Pro (M23) | |
| Media Intel Core i7-13700H (6165 - 14215, n=29) | |
| LG Gram SuperSlim (2023) | |
| Media della classe Office (1483 - 16999, n=73, ultimi 2 anni) | |
| Asus VivoBook S15 M3502RA-L1029W | |
| Schenker Vision 16 PH6PRX1 | |
| Apple MacBook Air 15 2023 M2 16 GB | |
| Microsoft Surface Laptop 5 15, i7-1255U | |
| Geekbench 5.5 / Single-Core | |
| Apple MacBook Air 15 2023 M2 16 GB | |
| Schenker VISION 16 Pro (M23) | |
| Acer Swift Go SFG16-71 | |
| LG Gram SuperSlim (2023) | |
| Schenker Vision 16 PH6PRX1 | |
| Media della classe Office (811 - 2175, n=73, ultimi 2 anni) | |
| Media Intel Core i7-13700H (1362 - 1919, n=29) | |
| Microsoft Surface Laptop 5 15, i7-1255U | |
| Asus VivoBook S15 M3502RA-L1029W | |
| HWBOT x265 Benchmark v2.2 / 4k Preset | |
| Schenker VISION 16 Pro (M23) | |
| Media Intel Core i7-13700H (6.72 - 21.2, n=29) | |
| Acer Swift Go SFG16-71 | |
| Asus VivoBook S15 M3502RA-L1029W | |
| Schenker Vision 16 PH6PRX1 | |
| Media della classe Office (2.21 - 26, n=76, ultimi 2 anni) | |
| LG Gram SuperSlim (2023) | |
| Microsoft Surface Laptop 5 15, i7-1255U | |
| LibreOffice / 20 Documents To PDF | |
| Media della classe Office (39.9 - 102.3, n=76, ultimi 2 anni) | |
| Asus VivoBook S15 M3502RA-L1029W | |
| Media Intel Core i7-13700H (31.3 - 62.4, n=29) | |
| Schenker VISION 16 Pro (M23) | |
| Microsoft Surface Laptop 5 15, i7-1255U | |
| LG Gram SuperSlim (2023) | |
| Acer Swift Go SFG16-71 | |
| Schenker Vision 16 PH6PRX1 | |
| R Benchmark 2.5 / Overall mean | |
| Media della classe Office (0.393 - 0.888, n=76, ultimi 2 anni) | |
| Microsoft Surface Laptop 5 15, i7-1255U | |
| Asus VivoBook S15 M3502RA-L1029W | |
| LG Gram SuperSlim (2023) | |
| Media Intel Core i7-13700H (0.4308 - 0.607, n=29) | |
| Schenker Vision 16 PH6PRX1 | |
| Acer Swift Go SFG16-71 | |
| Schenker VISION 16 Pro (M23) | |
* ... Meglio usare valori piccoli
AIDA64: FP32 Ray-Trace | FPU Julia | CPU SHA3 | CPU Queen | FPU SinJulia | FPU Mandel | CPU AES | CPU ZLib | FP64 Ray-Trace | CPU PhotoWorxx
| Performance rating | |
| Asus VivoBook S15 M3502RA-L1029W | |
| Media Intel Core i7-13700H | |
| Acer Swift Go SFG16-71 | |
| Media della classe Office | |
| Schenker Vision 16 PH6PRX1 | |
| Microsoft Surface Laptop 5 15, i7-1255U | |
| LG Gram SuperSlim (2023) | |
| AIDA64 / FP32 Ray-Trace | |
| Asus VivoBook S15 M3502RA-L1029W | |
| Media della classe Office (2083 - 31245, n=83, ultimi 2 anni) | |
| Media Intel Core i7-13700H (4986 - 18908, n=29) | |
| Acer Swift Go SFG16-71 | |
| Schenker Vision 16 PH6PRX1 | |
| LG Gram SuperSlim (2023) | |
| Microsoft Surface Laptop 5 15, i7-1255U | |
| AIDA64 / FPU Julia | |
| Asus VivoBook S15 M3502RA-L1029W | |
| Media Intel Core i7-13700H (25360 - 92359, n=29) | |
| Acer Swift Go SFG16-71 | |
| Media della classe Office (8191 - 125394, n=83, ultimi 2 anni) | |
| Schenker Vision 16 PH6PRX1 | |
| Microsoft Surface Laptop 5 15, i7-1255U | |
| LG Gram SuperSlim (2023) | |
| AIDA64 / CPU SHA3 | |
| Media Intel Core i7-13700H (1339 - 4224, n=29) | |
| Asus VivoBook S15 M3502RA-L1029W | |
| Acer Swift Go SFG16-71 | |
| Media della classe Office (433 - 5755, n=83, ultimi 2 anni) | |
| Schenker Vision 16 PH6PRX1 | |
| Microsoft Surface Laptop 5 15, i7-1255U | |
| LG Gram SuperSlim (2023) | |
| AIDA64 / CPU Queen | |
| Asus VivoBook S15 M3502RA-L1029W | |
| Acer Swift Go SFG16-71 | |
| Media Intel Core i7-13700H (59324 - 107159, n=29) | |
| Schenker Vision 16 PH6PRX1 | |
| LG Gram SuperSlim (2023) | |
| Media della classe Office (22784 - 115197, n=67, ultimi 2 anni) | |
| Microsoft Surface Laptop 5 15, i7-1255U | |
| AIDA64 / FPU SinJulia | |
| Asus VivoBook S15 M3502RA-L1029W | |
| Media Intel Core i7-13700H (4800 - 11050, n=29) | |
| Acer Swift Go SFG16-71 | |
| Media della classe Office (1378 - 18321, n=83, ultimi 2 anni) | |
| Schenker Vision 16 PH6PRX1 | |
| LG Gram SuperSlim (2023) | |
| Microsoft Surface Laptop 5 15, i7-1255U | |
| AIDA64 / FPU Mandel | |
| Asus VivoBook S15 M3502RA-L1029W | |
| Media Intel Core i7-13700H (12321 - 45118, n=29) | |
| Acer Swift Go SFG16-71 | |
| Media della classe Office (4601 - 66922, n=83, ultimi 2 anni) | |
| Schenker Vision 16 PH6PRX1 | |
| Microsoft Surface Laptop 5 15, i7-1255U | |
| LG Gram SuperSlim (2023) | |
| AIDA64 / CPU AES | |
| Asus VivoBook S15 M3502RA-L1029W | |
| Media Intel Core i7-13700H (28769 - 151254, n=29) | |
| Acer Swift Go SFG16-71 | |
| Schenker Vision 16 PH6PRX1 | |
| Media della classe Office (4854 - 155900, n=83, ultimi 2 anni) | |
| Microsoft Surface Laptop 5 15, i7-1255U | |
| LG Gram SuperSlim (2023) | |
| AIDA64 / CPU ZLib | |
| Media Intel Core i7-13700H (389 - 1215, n=29) | |
| Acer Swift Go SFG16-71 | |
| Schenker Vision 16 PH6PRX1 | |
| Asus VivoBook S15 M3502RA-L1029W | |
| Media della classe Office (114.6 - 1366, n=83, ultimi 2 anni) | |
| Microsoft Surface Laptop 5 15, i7-1255U | |
| LG Gram SuperSlim (2023) | |
| AIDA64 / FP64 Ray-Trace | |
| Media della classe Office (1109 - 17834, n=83, ultimi 2 anni) | |
| Asus VivoBook S15 M3502RA-L1029W | |
| Media Intel Core i7-13700H (2540 - 10135, n=29) | |
| Acer Swift Go SFG16-71 | |
| Schenker Vision 16 PH6PRX1 | |
| Microsoft Surface Laptop 5 15, i7-1255U | |
| LG Gram SuperSlim (2023) | |
| AIDA64 / CPU PhotoWorxx | |
| Schenker Vision 16 PH6PRX1 | |
| Microsoft Surface Laptop 5 15, i7-1255U | |
| Acer Swift Go SFG16-71 | |
| Media Intel Core i7-13700H (12872 - 52727, n=29) | |
| LG Gram SuperSlim (2023) | |
| Media della classe Office (11090 - 65229, n=83, ultimi 2 anni) | |
| Asus VivoBook S15 M3502RA-L1029W | |
Prestazioni del sistema
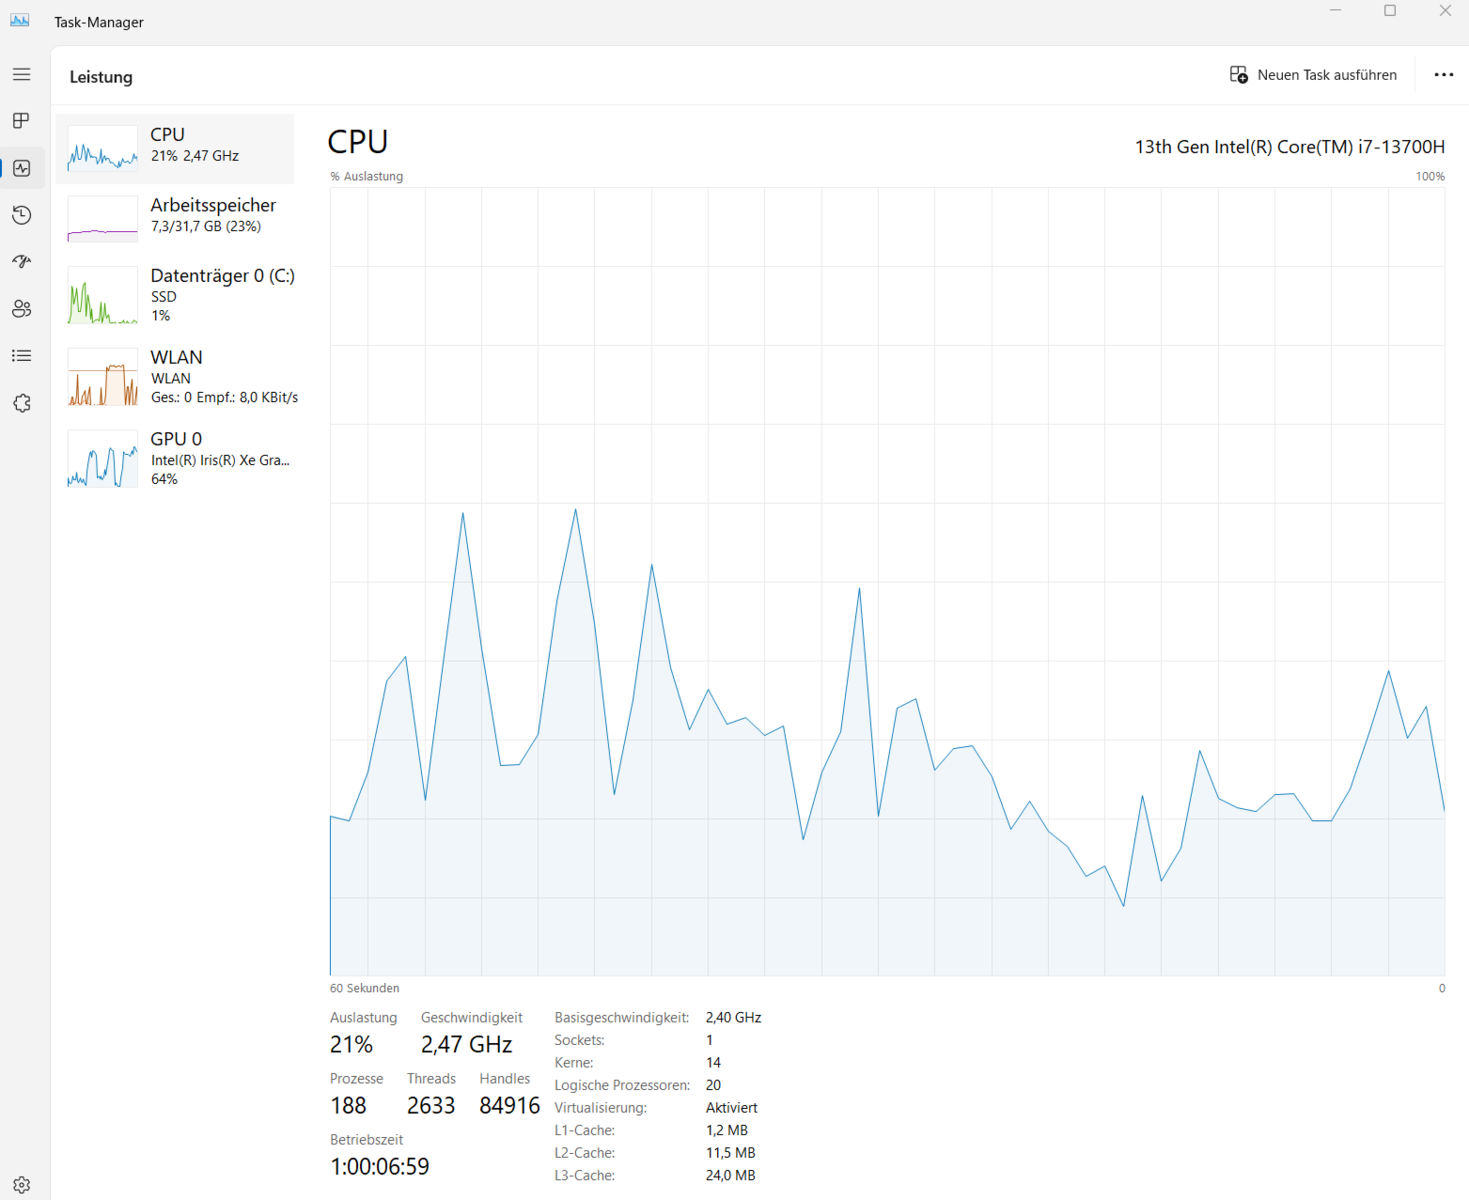
Il confronto diretto con ilAcer Swift Go SFG16-71mostra ancora una volta che il Core i7-13700H del Vision 16 è limitato dal basso TDP. Le prestazioni del processore nei benchmark sintetici sono leggermente inferiori alla media, anche se le prestazioni soggettive dell'ultrabook sono molto buone. Durante la navigazione sul web, i video Youtube in 4K o il multitasking con i programmi Office e la navigazione allo stesso tempo, il Vision 16 non ha mostrato segni di rallentamento.
CrossMark: Overall | Productivity | Creativity | Responsiveness
| PCMark 10 / Score | |
| Asus VivoBook S15 M3502RA-L1029W | |
| Media della classe Office (2601 - 9298, n=68, ultimi 2 anni) | |
| Acer Swift Go SFG16-71 | |
| Media Intel Core i7-13700H, Intel Iris Xe Graphics G7 96EUs (5531 - 6247, n=5) | |
| LG Gram SuperSlim (2023) | |
| Schenker Vision 16 PH6PRX1 | |
| Microsoft Surface Laptop 5 15, i7-1255U | |
| PCMark 10 / Essentials | |
| LG Gram SuperSlim (2023) | |
| Acer Swift Go SFG16-71 | |
| Media Intel Core i7-13700H, Intel Iris Xe Graphics G7 96EUs (9648 - 11401, n=5) | |
| Asus VivoBook S15 M3502RA-L1029W | |
| Microsoft Surface Laptop 5 15, i7-1255U | |
| Media della classe Office (3245 - 11594, n=68, ultimi 2 anni) | |
| Schenker Vision 16 PH6PRX1 | |
| PCMark 10 / Productivity | |
| Media della classe Office (5336 - 17243, n=68, ultimi 2 anni) | |
| Asus VivoBook S15 M3502RA-L1029W | |
| Acer Swift Go SFG16-71 | |
| Media Intel Core i7-13700H, Intel Iris Xe Graphics G7 96EUs (7072 - 7691, n=5) | |
| Microsoft Surface Laptop 5 15, i7-1255U | |
| Schenker Vision 16 PH6PRX1 | |
| LG Gram SuperSlim (2023) | |
| PCMark 10 / Digital Content Creation | |
| Asus VivoBook S15 M3502RA-L1029W | |
| Media della classe Office (2049 - 13541, n=68, ultimi 2 anni) | |
| Acer Swift Go SFG16-71 | |
| Media Intel Core i7-13700H, Intel Iris Xe Graphics G7 96EUs (6413 - 7727, n=5) | |
| LG Gram SuperSlim (2023) | |
| Schenker Vision 16 PH6PRX1 | |
| Microsoft Surface Laptop 5 15, i7-1255U | |
| CrossMark / Overall | |
| Acer Swift Go SFG16-71 | |
| Schenker Vision 16 PH6PRX1 | |
| Media Intel Core i7-13700H, Intel Iris Xe Graphics G7 96EUs (1548 - 1868, n=5) | |
| LG Gram SuperSlim (2023) | |
| Asus VivoBook S15 M3502RA-L1029W | |
| Apple MacBook Air 15 2023 M2 16 GB | |
| Media della classe Office (381 - 2010, n=75, ultimi 2 anni) | |
| Microsoft Surface Laptop 5 15, i7-1255U | |
| CrossMark / Productivity | |
| Acer Swift Go SFG16-71 | |
| Schenker Vision 16 PH6PRX1 | |
| Media Intel Core i7-13700H, Intel Iris Xe Graphics G7 96EUs (1500 - 1787, n=5) | |
| LG Gram SuperSlim (2023) | |
| Asus VivoBook S15 M3502RA-L1029W | |
| Microsoft Surface Laptop 5 15, i7-1255U | |
| Media della classe Office (464 - 1880, n=75, ultimi 2 anni) | |
| Apple MacBook Air 15 2023 M2 16 GB | |
| CrossMark / Creativity | |
| Acer Swift Go SFG16-71 | |
| Apple MacBook Air 15 2023 M2 16 GB | |
| Media Intel Core i7-13700H, Intel Iris Xe Graphics G7 96EUs (1620 - 2009, n=5) | |
| Asus VivoBook S15 M3502RA-L1029W | |
| LG Gram SuperSlim (2023) | |
| Schenker Vision 16 PH6PRX1 | |
| Media della classe Office (319 - 2361, n=75, ultimi 2 anni) | |
| Microsoft Surface Laptop 5 15, i7-1255U | |
| CrossMark / Responsiveness | |
| Acer Swift Go SFG16-71 | |
| LG Gram SuperSlim (2023) | |
| Schenker Vision 16 PH6PRX1 | |
| Media Intel Core i7-13700H, Intel Iris Xe Graphics G7 96EUs (1439 - 1715, n=5) | |
| Asus VivoBook S15 M3502RA-L1029W | |
| Media della classe Office (360 - 1820, n=75, ultimi 2 anni) | |
| Microsoft Surface Laptop 5 15, i7-1255U | |
| Apple MacBook Air 15 2023 M2 16 GB | |
| PCMark 10 Score | 5531 punti | |
Aiuto | ||
| AIDA64 / Memory Copy | |
| Media della classe Office (20075 - 110930, n=80, ultimi 2 anni) | |
| Schenker Vision 16 PH6PRX1 | |
| Media Intel Core i7-13700H (24334 - 78081, n=29) | |
| AIDA64 / Memory Read | |
| Schenker Vision 16 PH6PRX1 | |
| Media della classe Office (10084 - 128030, n=81, ultimi 2 anni) | |
| Media Intel Core i7-13700H (23681 - 79656, n=29) | |
| AIDA64 / Memory Write | |
| Media della classe Office (20073 - 119858, n=81, ultimi 2 anni) | |
| Media Intel Core i7-13700H (22986 - 99898, n=29) | |
| Schenker Vision 16 PH6PRX1 | |
| AIDA64 / Memory Latency | |
| Media della classe Office (7.6 - 162.9, n=76, ultimi 2 anni) | |
| Media Intel Core i7-13700H (82.4 - 136.8, n=29) | |
| Schenker Vision 16 PH6PRX1 | |
* ... Meglio usare valori piccoli
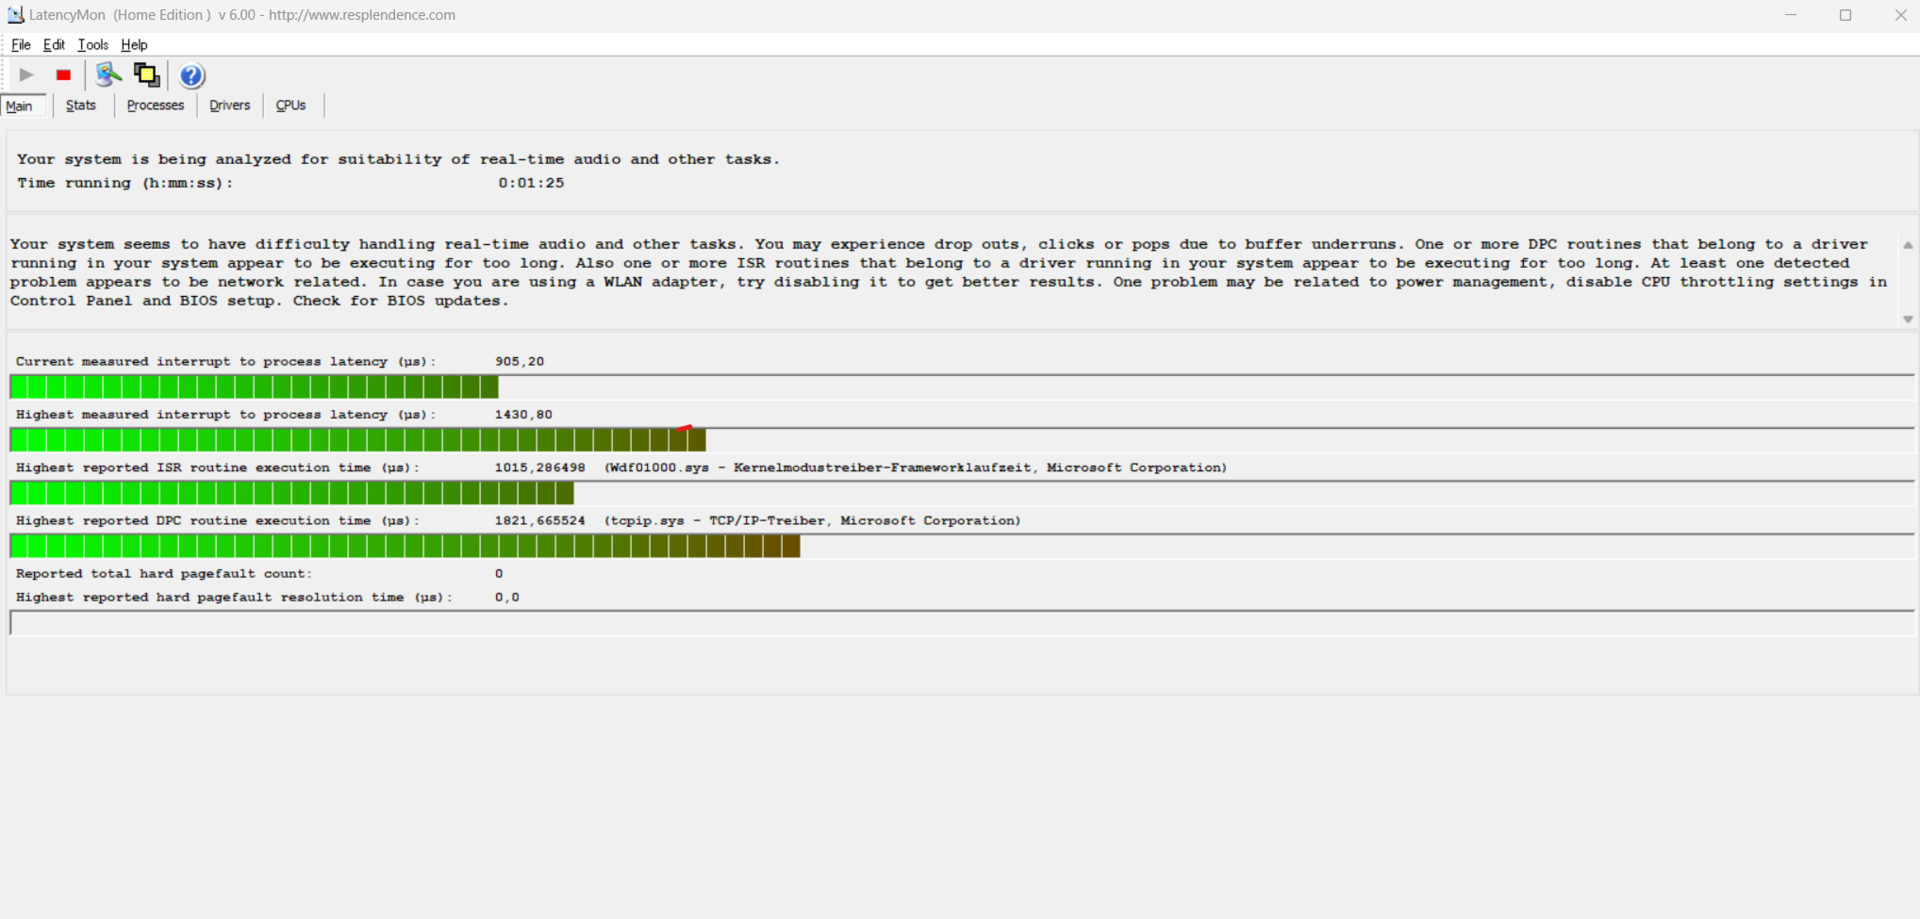
Latenza DPC
Il nostro test di latenza standardizzato (navigazione web, Youtube 4K, carico della CPU) ha evidenziato alcuni problemi di latenza DPC. Il Vision 16 non è completamente utilizzabile per l'audio in tempo reale nello stato in cui è stato testato, ma gli aggiornamenti del BIOS potrebbero risolvere questo problema.
| DPC Latencies / LatencyMon - interrupt to process latency (max), Web, Youtube, Prime95 | |
| Acer Swift Go SFG16-71 | |
| LG Gram SuperSlim (2023) | |
| Schenker Vision 16 PH6PRX1 | |
| Microsoft Surface Laptop 5 15, i7-1255U | |
| Asus VivoBook S15 M3502RA-L1029W | |
* ... Meglio usare valori piccoli
Memoria di massa
Nello Schenker Vision 16 sono presenti due slot PCIe 4.0 per le unità SSD. L'esemplare oggetto della nostra recensione è un'unità SSD M.2 Samsung 990 Pro da 1 TB. I risultati del benchmark con DiskSpd mostrano chiari punti deboli in termini di velocità di lettura e scrittura dell'SSD. Le misurazioni di AS SSD dipingono un quadro migliore, con velocità più adatte a un'unità SSD ad alte prestazioni. La stessa unità SSD Samsung 990 Pro è stata utilizzata nell'esemplare in prova del Vision 16 Pro e ha fornito risultati migliori.

* ... Meglio usare valori piccoli
Sustained load Read: DiskSpd Read Loop, Queue Depth 8
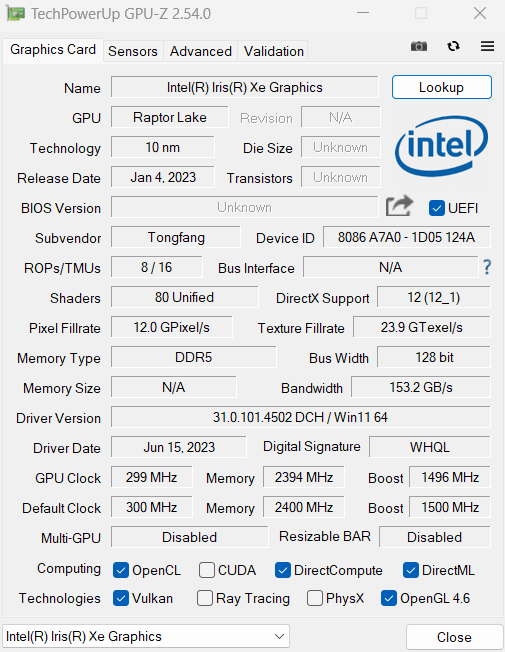
Scheda grafica
Il Vision 16 del 2022 è stato offerto con la RTX 3050. Questo modello ha solo la grafica integrata Intel Iris Xe G7 con 96 EU. Le attività quotidiane non sono un problema, ma non è adatta al gioco. L'iGPU almeno si comporta meglio della media di Intel Iris Xe Graphics G7 dell'11% nei benchmark sintetici.
| 3DMark 11 Performance | 7613 punti | |
| 3DMark Cloud Gate Standard Score | 21964 punti | |
| 3DMark Fire Strike Score | 5433 punti | |
| 3DMark Time Spy Score | 1953 punti | |
Aiuto | ||
| Blender - v3.3 Classroom CPU | |
| Media Intel Iris Xe Graphics G7 96EUs (336 - 1259, n=109) | |
| Media della classe Office (245 - 3219, n=75, ultimi 2 anni) | |
| Schenker Vision 16 PH6PRX1 | |
* ... Meglio usare valori piccoli
Prestazioni di gioco
L'Iris Xe Graphics G7 è la più potente iGPU di Intel, ma le prestazioni di gioco sono piuttosto basse. Le iGPU AMD come laRadeon 680Mo la Radeon 780Msono più potenti. Finché la risoluzione e le impostazioni grafiche vengono mantenute basse, i giochi più vecchi sono ancora giocabili. Lo schermo a 240 Hz è ancora sprecato senza una GPU esterna, che può essere collegata tramite Thunderbolt 4.
| The Witcher 3 - 1920x1080 Ultra Graphics & Postprocessing (HBAO+) | |
| Apple MacBook Air 15 2023 M2 16 GB | |
| Asus VivoBook S15 M3502RA-L1029W | |
| Media della classe Office (14.8 - 28.1, n=3, ultimi 2 anni) | |
| Schenker Vision 16 PH6PRX1 | |
| Acer Swift Go SFG16-71 | |
| LG Gram SuperSlim (2023) | |
| Microsoft Surface Laptop 5 15, i7-1255U | |
| GTA V - 1920x1080 Highest AA:4xMSAA + FX AF:16x | |
| Asus VivoBook S15 M3502RA-L1029W | |
| Media della classe Office (5.77 - 45.3, n=69, ultimi 2 anni) | |
| Acer Swift Go SFG16-71 | |
| Schenker Vision 16 PH6PRX1 | |
| Microsoft Surface Laptop 5 15, i7-1255U | |
| Final Fantasy XV Benchmark - 1920x1080 High Quality | |
| Media della classe Office (8.09 - 79.5, n=71, ultimi 2 anni) | |
| Asus VivoBook S15 M3502RA-L1029W | |
| Schenker Vision 16 PH6PRX1 | |
| Acer Swift Go SFG16-71 | |
| LG Gram SuperSlim (2023) | |
| Microsoft Surface Laptop 5 15, i7-1255U | |
| Strange Brigade - 1920x1080 ultra AA:ultra AF:16 | |
| Asus VivoBook S15 M3502RA-L1029W | |
| Media della classe Office (12.9 - 142.1, n=53, ultimi 2 anni) | |
| Acer Swift Go SFG16-71 | |
| Schenker Vision 16 PH6PRX1 | |
| Microsoft Surface Laptop 5 15, i7-1255U | |
| LG Gram SuperSlim (2023) | |
Witcher 3 FPS diagramm
| basso | medio | alto | ultra | QHD | 4K | |
|---|---|---|---|---|---|---|
| GTA V (2015) | 117.4 | 104.3 | 24.8 | 10.4 | 6.7 | |
| The Witcher 3 (2015) | 45 | 35 | 23 | 19 | ||
| Dota 2 Reborn (2015) | 95.5 | 70.8 | 61.3 | 52.4 | ||
| Final Fantasy XV Benchmark (2018) | 44 | 24 | 18 | 12 | 7 | |
| X-Plane 11.11 (2018) | 35 | 33 | 32 | 27 | ||
| Far Cry 5 (2018) | 52 | 28 | 26 | 24 | 17 | |
| Strange Brigade (2018) | 81.7 | 39.7 | 31.7 | 25.1 | ||
| F1 23 (2023) | 39.4 | 35.5 | 24.8 | 18.4 |
Emissioni
Rumore
Le emissioni del Vision 16 sono accettabili. Al minimo, le ventole funzionano quasi sempre e sono udibili in condizioni di silenzio. Sotto carico massimo abbiamo misurato 45 dB(a), che non saranno raggiunti nella maggior parte delle applicazioni. Nell'uso quotidiano, la ventola funzionerà più probabilmente a 33,8 dB(a), un valore piuttosto silenzioso. Nel normale utilizzo in ufficio, l'ultrabook non è quasi mai silenzioso, ma il rumore della ventola ha una frequenza bassa e non disturba. Gli utenti più sensibili possono comunque esserne infastiditi.
Rumorosità
| Idle |
| 25.5 / 28.7 / 29.1 dB(A) |
| Sotto carico |
| 33.8 / 44.9 dB(A) |
 | ||
30 dB silenzioso 40 dB(A) udibile 50 dB(A) rumoroso |
||
min: | ||
| Schenker Vision 16 PH6PRX1 Iris Xe G7 96EUs, i7-13700H, Samsung 990 Pro 1 TB | Apple MacBook Air 15 2023 M2 16 GB M2 10-Core GPU, M2, Apple SSD AP1024Z | Acer Swift Go SFG16-71 Iris Xe G7 96EUs, i7-13700H, Micron 2400 MTFDKBA1T0QFM | LG Gram SuperSlim (2023) Iris Xe G7 96EUs, i7-1360P, SK hynix PC801 HFS001TEJ9X101N | Microsoft Surface Laptop 5 15, i7-1255U Iris Xe G7 96EUs, i7-1255U, SK Hynix BC711 512GB HFM512GD3GX013N | Asus VivoBook S15 M3502RA-L1029W Radeon 680M, R7 6800H, WD PC SN735 SDBPNHH-512G | |
|---|---|---|---|---|---|---|
| Noise | -4% | 1% | 10% | -17% | ||
| off /ambiente * (dB) | 25.5 | 25.7 -1% | 25.2 1% | 23.3 9% | 26 -2% | |
| Idle Minimum * (dB) | 25.5 | 26.1 -2% | 25.2 1% | 23.3 9% | 26 -2% | |
| Idle Average * (dB) | 28.7 | 26.1 9% | 25.2 12% | 23.3 19% | 26 9% | |
| Idle Maximum * (dB) | 29.1 | 27.2 7% | 25.2 13% | 23.3 20% | 28.1 3% | |
| Load Average * (dB) | 33.8 | 44.2 -31% | 43.1 -28% | 35 -4% | 56.9 -68% | |
| Witcher 3 ultra * (dB) | 37.6 | 38.1 -1% | ||||
| Load Maximum * (dB) | 44.9 | 47.5 -6% | 43.3 4% | 38.1 15% | 62.6 -39% |
* ... Meglio usare valori piccoli
Il calore
Nonostante le ventole piuttosto silenziose, il Vision 16 rimane relativamente fresco. Le temperature del palmrest sotto carico raggiungono i 28,5 gradi Celsius / 83 F nel punto caldo sopra la tastiera. Sotto carico, il punto caldo si trova al centro della tastiera, dove le temperature raggiungono i 42 gradi Celsius / 108 F, una temperatura scomoda. Tuttavia, questa temperatura massima di carico non viene solitamente raggiunta durante l'uso quotidiano.
Le due ventole aspirano l'aria dal basso e la espellono dal retro.
(±) La temperatura massima sul lato superiore è di 41.1 °C / 106 F, rispetto alla media di 34.3 °C / 94 F, che varia da 21.2 a 62.5 °C per questa classe Office.
(±) Il lato inferiore si riscalda fino ad un massimo di 42 °C / 108 F, rispetto alla media di 36.8 °C / 98 F
(+) In idle, la temperatura media del lato superiore è di 25.7 °C / 78 F, rispetto alla media deld ispositivo di 29.5 °C / 85 F.
(+) Riproducendo The Witcher 3, la temperatura media per il lato superiore e' di 28.8 °C / 84 F, rispetto alla media del dispositivo di 29.5 °C / 85 F.
(+) I poggiapolsi e il touchpad sono piu' freddi della temperatura della pelle con un massimo di 28.2 °C / 82.8 F e sono quindi freddi al tatto.
(±) La temperatura media della zona del palmo della mano di dispositivi simili e'stata di 27.5 °C / 81.5 F (-0.7 °C / -1.3 F).
| Schenker Vision 16 PH6PRX1 Intel Core i7-13700H, Intel Iris Xe Graphics G7 96EUs | Apple MacBook Air 15 2023 M2 16 GB Apple M2, Apple M2 10-Core GPU | Acer Swift Go SFG16-71 Intel Core i7-13700H, Intel Iris Xe Graphics G7 96EUs | LG Gram SuperSlim (2023) Intel Core i7-1360P, Intel Iris Xe Graphics G7 96EUs | Microsoft Surface Laptop 5 15, i7-1255U Intel Core i7-1255U, Intel Iris Xe Graphics G7 96EUs | Asus VivoBook S15 M3502RA-L1029W AMD Ryzen 7 6800H, AMD Radeon 680M | |
|---|---|---|---|---|---|---|
| Heat | 1% | -13% | -23% | 3% | -21% | |
| Maximum Upper Side * (°C) | 41.1 | 45.1 -10% | 44.4 -8% | 43.9 -7% | 44.6 -9% | 50.2 -22% |
| Maximum Bottom * (°C) | 42 | 42.5 -1% | 48 -14% | 50.4 -20% | 47.4 -13% | 50.2 -20% |
| Idle Upper Side * (°C) | 28.5 | 25.9 9% | 31.9 -12% | 35.8 -26% | 22.6 21% | 32.1 -13% |
| Idle Bottom * (°C) | 26.8 | 25.8 4% | 31.9 -19% | 37.5 -40% | 23.3 13% | 34.6 -29% |
* ... Meglio usare valori piccoli
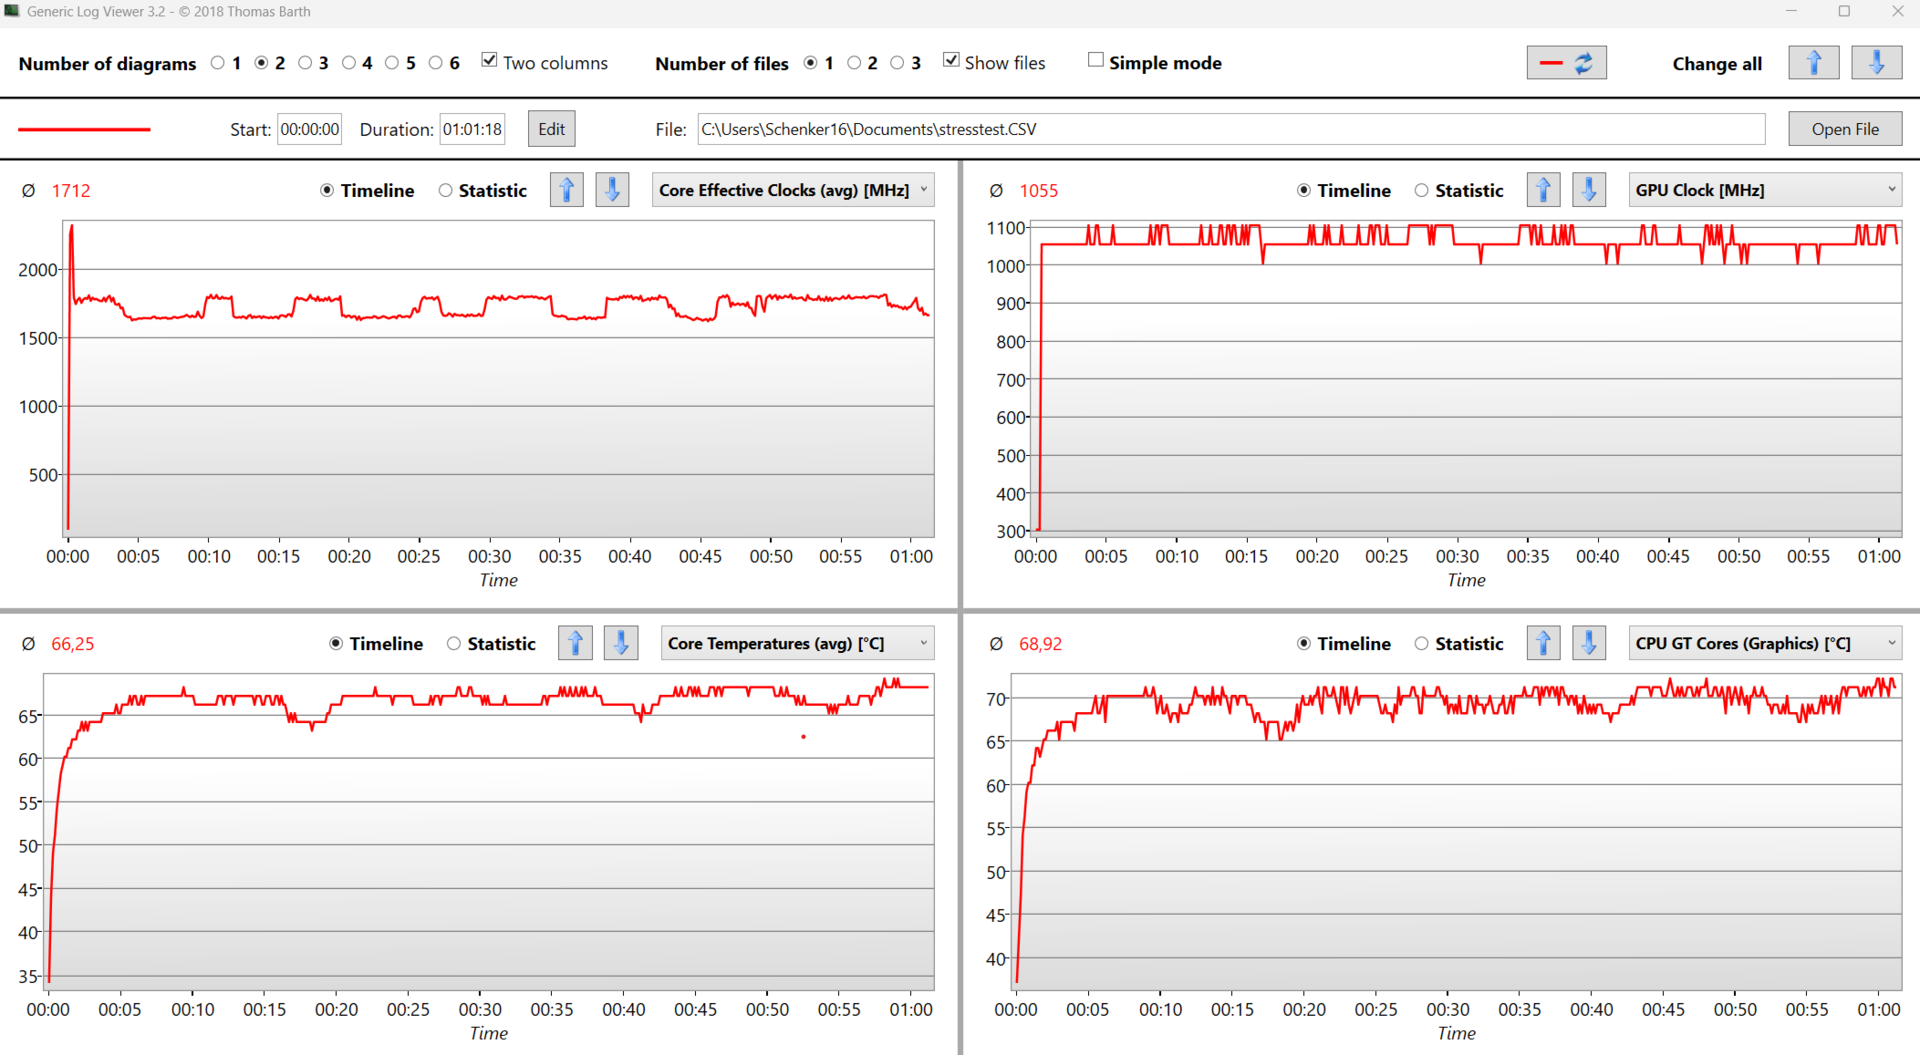
Test da sforzo
All'inizio dello stress test (Prime95 e Furmark) la CPU raggiunge i 2,5 GHz, ma si stabilizza rapidamente tra 1,6 e 1,7 GHz. Come nel test Witcher loop, le prestazioni si stabilizzano successivamente durante lo stress test e rimangono a 1,7 GHz. Le temperature della CPU rimangono basse, con una temperatura media di 66 gradi Celsius / 150 F, probabilmente a causa del basso TDP.
Altoparlanti
Il sistema di diffusori è identico al Vision 16 Pro e invariato rispetto al predecessore. Gli alti sono precisi, ma manca la base.
Schenker Vision 16 PH6PRX1 analisi audio
(±) | potenza degli altiparlanti media ma buona (78.4 dB)
Bassi 100 - 315 Hz
(-) | quasi nessun basso - in media 15.5% inferiori alla media
(±) | la linearità dei bassi è media (11.9% delta rispetto alla precedente frequenza)
Medi 400 - 2000 Hz
(+) | medi bilanciati - solo only 3.6% rispetto alla media
(+) | medi lineari (3.2% delta rispetto alla precedente frequenza)
Alti 2 - 16 kHz
(+) | Alti bilanciati - appena 2.9% dalla media
(+) | alti lineari (3.9% delta rispetto alla precedente frequenza)
Nel complesso 100 - 16.000 Hz
(+) | suono nel complesso lineare (14.7% differenza dalla media)
Rispetto alla stessa classe
» 13% di tutti i dispositivi testati in questa classe è stato migliore, 4% simile, 83% peggiore
» Il migliore ha avuto un delta di 7%, medio di 21%, peggiore di 53%
Rispetto a tutti i dispositivi testati
» 19% di tutti i dispositivi testati in questa classe è stato migliore, 4% similare, 77% peggiore
» Il migliore ha avuto un delta di 4%, medio di 23%, peggiore di 134%
Acer Swift Go SFG16-71 analisi audio
(±) | potenza degli altiparlanti media ma buona (81.6 dB)
Bassi 100 - 315 Hz
(-) | quasi nessun basso - in media 18.1% inferiori alla media
(±) | la linearità dei bassi è media (10% delta rispetto alla precedente frequenza)
Medi 400 - 2000 Hz
(+) | medi bilanciati - solo only 1% rispetto alla media
(+) | medi lineari (4.9% delta rispetto alla precedente frequenza)
Alti 2 - 16 kHz
(+) | Alti bilanciati - appena 2.4% dalla media
(+) | alti lineari (6.6% delta rispetto alla precedente frequenza)
Nel complesso 100 - 16.000 Hz
(+) | suono nel complesso lineare (13% differenza dalla media)
Rispetto alla stessa classe
» 26% di tutti i dispositivi testati in questa classe è stato migliore, 5% simile, 70% peggiore
» Il migliore ha avuto un delta di 5%, medio di 17%, peggiore di 45%
Rispetto a tutti i dispositivi testati
» 13% di tutti i dispositivi testati in questa classe è stato migliore, 2% similare, 85% peggiore
» Il migliore ha avuto un delta di 4%, medio di 23%, peggiore di 134%
Gestione dell'energia - troppo affamato di energia per un portatile da ufficio
Consumo di energia
Per un ultrabook senza GPU dedicata, il consumo di energia durante il funzionamento al minimo è significativamente più alto rispetto a dispositivi simili. Il consumo più elevato è probabilmente dovuto al processore H di Intel, in quanto i portatili da ufficio utilizzano solitamente CPU U/P. I processori AMD sono in vantaggio da questo punto di vista. IlAsus VivoBook S15 è più efficiente grazie al processore meno affamato di energia, nonostante il display OLED. Sotto carico, il consumo si normalizza ed è talvolta inferiore rispetto agli altri portatili.
| Off / Standby | |
| Idle | |
| Sotto carico |
|
Leggenda:
min: | |
| Schenker Vision 16 PH6PRX1 i7-13700H, Iris Xe G7 96EUs, Samsung 990 Pro 1 TB, IPS, 2560x1600, 16" | Apple MacBook Air 15 2023 M2 16 GB M2, M2 10-Core GPU, Apple SSD AP1024Z, IPS, 2880x1864, 15.3" | Acer Swift Go SFG16-71 i7-13700H, Iris Xe G7 96EUs, Micron 2400 MTFDKBA1T0QFM, OLED, 3200x2000, 16" | LG Gram SuperSlim (2023) i7-1360P, Iris Xe G7 96EUs, SK hynix PC801 HFS001TEJ9X101N, OLED, 1920x1080, 15.6" | Microsoft Surface Laptop 5 15, i7-1255U i7-1255U, Iris Xe G7 96EUs, SK Hynix BC711 512GB HFM512GD3GX013N, IPS, 2496x1664, 15" | Asus VivoBook S15 M3502RA-L1029W R7 6800H, Radeon 680M, WD PC SN735 SDBPNHH-512G, OLED, 1920x1080, 15.6" | Media Intel Iris Xe Graphics G7 96EUs | Media della classe Office | |
|---|---|---|---|---|---|---|---|---|
| Power Consumption | 44% | 11% | 26% | 27% | 8% | 21% | 31% | |
| Idle Minimum * (Watt) | 6.3 | 2.2 65% | 5.8 8% | 4.2 33% | 3.8 40% | 4.4 30% | 5.51 ? 13% | 4.26 ? 32% |
| Idle Average * (Watt) | 14.4 | 10 31% | 6 58% | 8.9 38% | 8.2 43% | 5.1 65% | 8.66 ? 40% | 7.31 ? 49% |
| Idle Maximum * (Watt) | 16.2 | 10.1 38% | 6.9 57% | 10.3 36% | 8.4 48% | 9.3 43% | 10.9 ? 33% | 8.55 ? 47% |
| Load Average * (Watt) | 46.2 | 33.6 27% | 59 -28% | 47 -2% | 50.1 -8% | 67 -45% | 45.6 ? 1% | 43.8 ? 5% |
| Witcher 3 ultra * (Watt) | 49.4 | 27.8 44% | 61.1 -24% | 43.8 11% | 38.8 21% | 66.4 -34% | ||
| Load Maximum * (Watt) | 85.2 | 37.2 56% | 92 -8% | 49 42% | 69.6 18% | 93.5 -10% | 67.8 ? 20% | 64.5 ? 24% |
* ... Meglio usare valori piccoli
Power consumption Witcher 3 / stress test
Power consumption external monitor
Durata della batteria
L'autonomia del Vision 16 non è buona, nonostante la batteria da 80 Wh. Con il nostro test WiFi e una luminosità dello schermo di 150 cd/m², il portatile funziona per quasi otto ore esatte. Il processore H è troppo assetato di energia per un portatile da ufficio. Rispetto al Vision 16 pro con RTX 4070, la rimozione della GPU dedicata non offre al Vision 16 alcun vantaggio in termini di durata della batteria.
Con la massima luminosità durante lo script WiFi, la durata della batteria del Vision 16 si riduce ulteriormente a sei ore e trenta minuti.
| Schenker Vision 16 PH6PRX1 i7-13700H, Iris Xe G7 96EUs, 80 Wh | Apple MacBook Air 15 2023 M2 16 GB M2, M2 10-Core GPU, 66.5 Wh | Acer Swift Go SFG16-71 i7-13700H, Iris Xe G7 96EUs, 65 Wh | LG Gram SuperSlim (2023) i7-1360P, Iris Xe G7 96EUs, 60 Wh | Microsoft Surface Laptop 5 15, i7-1255U i7-1255U, Iris Xe G7 96EUs, 47.4 Wh | Asus VivoBook S15 M3502RA-L1029W R7 6800H, Radeon 680M, 70 Wh | Schenker VISION 16 Pro (M23) i7-13700H, GeForce RTX 4070 Laptop GPU, 80 Wh | Media della classe Office | |
|---|---|---|---|---|---|---|---|---|
| Autonomia della batteria | 68% | -13% | 40% | -2% | -9% | -26% | 18% | |
| WiFi v1.3 (h) | 8 | 16.6 108% | 7.8 -2% | 12.5 56% | 8.6 8% | 11.5 44% | 7.8 -2% | 13.2 ? 65% |
| Load (h) | 2.6 | 3.3 27% | 2 -23% | 3.2 23% | 2.3 -12% | 1 -62% | 1.3 -50% | 1.808 ? -30% |
| H.264 (h) | 16.8 | 14.7 | 9.7 | 12.8 | 7.8 | 15.5 ? | ||
| Reader / Idle (h) | 27.5 | 24.5 ? |
Pro
Contro
Verdetto - Vision 16 ha una solida selezione di porte, ma prestazioni limitate del processore
La versione di quest'anno del Vision 16 contiene le più recenti CPU Intel Raptor Lake, un sistema di raffreddamento migliorato e uno schermo più veloce da 240 Hz. Il TDP del processore è limitato a 45 W, per mantenere basse le temperature. Tuttavia, questo limita anche le prestazioni del processore H di Intel. Lo chassis del Vision 16 è realizzato in magnesio ed è di qualità superiore. Questo permette al portatile da 16 pollici di raggiungere un peso ridotto di 1,5 kg, rendendolo un peso leggero nella sua categoria.
A differenza dei modelli precedenti, il TDP non è più controllabile dall'utente nel Centro di Controllo Schenker. Poiché la CPU raggiunge solo i 70 gradi Celsius durante gli stress test (Prime95 e FurMark), il dispositivo potrebbe potenzialmente avere prestazioni migliori. Un TDP personalizzabile avrebbe potuto consentire prestazioni migliori.
Il Vision 16 rimane piuttosto fresco, ad eccezione dell'area centrale della tastiera. Anche sotto carico, il rumore della ventola è sopportabile. Tuttavia, le ventole non sono quasi mai veramente silenziose, ma funzionano sempre con un basso livello di rumore, anche quando sono al minimo. Considerando che il basso TDP limita molto il chip Intel H, una CPU della serie P/U sarebbe stata più adatta al Vision 16. Il Core i7-13700H ha degli svantaggi per quanto riguarda il consumo energetico, quindi lo Schenker 16 consuma di più rispetto ai concorrenti.
Nella nostra recensione abbiamo riscontrato problemi anche con l'SSD M.2 interno e il lettore di schede SD. Entrambi sono penalizzati nella loro velocità.
Lo Schenker Vision 16 offre un buon livello di prestazioni, una buona selezione di porte e la possibilità di aggiornamento nonostante il telaio leggero e sottile.
Il nuovo display IPS opaco è un netto miglioramento e ben calibrato, anche prima della nostra calibrazione, e ben si adatta al semplice editing fotografico. Per un portatile da ufficio, la frequenza di aggiornamento di 240 Hz è insolita. Crea un'esperienza d'uso fluida, ma il portatile non è abbastanza potente per i giochi, sprecando parte del potenziale del pannello. Il pannello non copre una gamma di colori più ampia e manca del supporto HDR, ma non è presente il PWM.
In alternativa allo Schenker Vision 16, il Vision 16 Pro è una variante più potente con velocità della CPU più elevate, nonostante lo stesso processore, e una CPU RTX 4070 opzionale. Acer Swift Go 16 utilizza lo stesso processore, ma ha un TDP più elevato di 80 W. Inoltre, Acer utilizza uno schermo OLED. Nessuno dei due, però, offre il peso ridotto del Vision 16.
Prezzi e disponibilità
Il nuovo Vision 16 2023 è disponibile in Germania a partire da 1.424 euro presso Bestware. La nostra configurazione di prova con 32 GB di RAM e un'unità SSD M.2 Samsung 990 Pro da 1 TB costa 1.661 euro.
Schenker Vision 16 PH6PRX1
- 08/30/2023 v7 (old)
Philip Macdonald
Transparency
La selezione dei dispositivi da recensire viene effettuata dalla nostra redazione. Il campione di prova è stato fornito all'autore come prestito dal produttore o dal rivenditore ai fini di questa recensione. L'istituto di credito non ha avuto alcuna influenza su questa recensione, né il produttore ne ha ricevuto una copia prima della pubblicazione. Non vi era alcun obbligo di pubblicare questa recensione. In quanto società mediatica indipendente, Notebookcheck non è soggetta all'autorità di produttori, rivenditori o editori.
Ecco come Notebookcheck esegue i test
Ogni anno, Notebookcheck esamina in modo indipendente centinaia di laptop e smartphone utilizzando procedure standardizzate per garantire che tutti i risultati siano comparabili. Da circa 20 anni sviluppiamo continuamente i nostri metodi di prova e nel frattempo stabiliamo gli standard di settore. Nei nostri laboratori di prova, tecnici ed editori esperti utilizzano apparecchiature di misurazione di alta qualità. Questi test comportano un processo di validazione in più fasi. Il nostro complesso sistema di valutazione si basa su centinaia di misurazioni e parametri di riferimento ben fondati, che mantengono l'obiettività.Price comparison

