Recensione del portatile Dell Inspiron 15 3000 3511: più economico
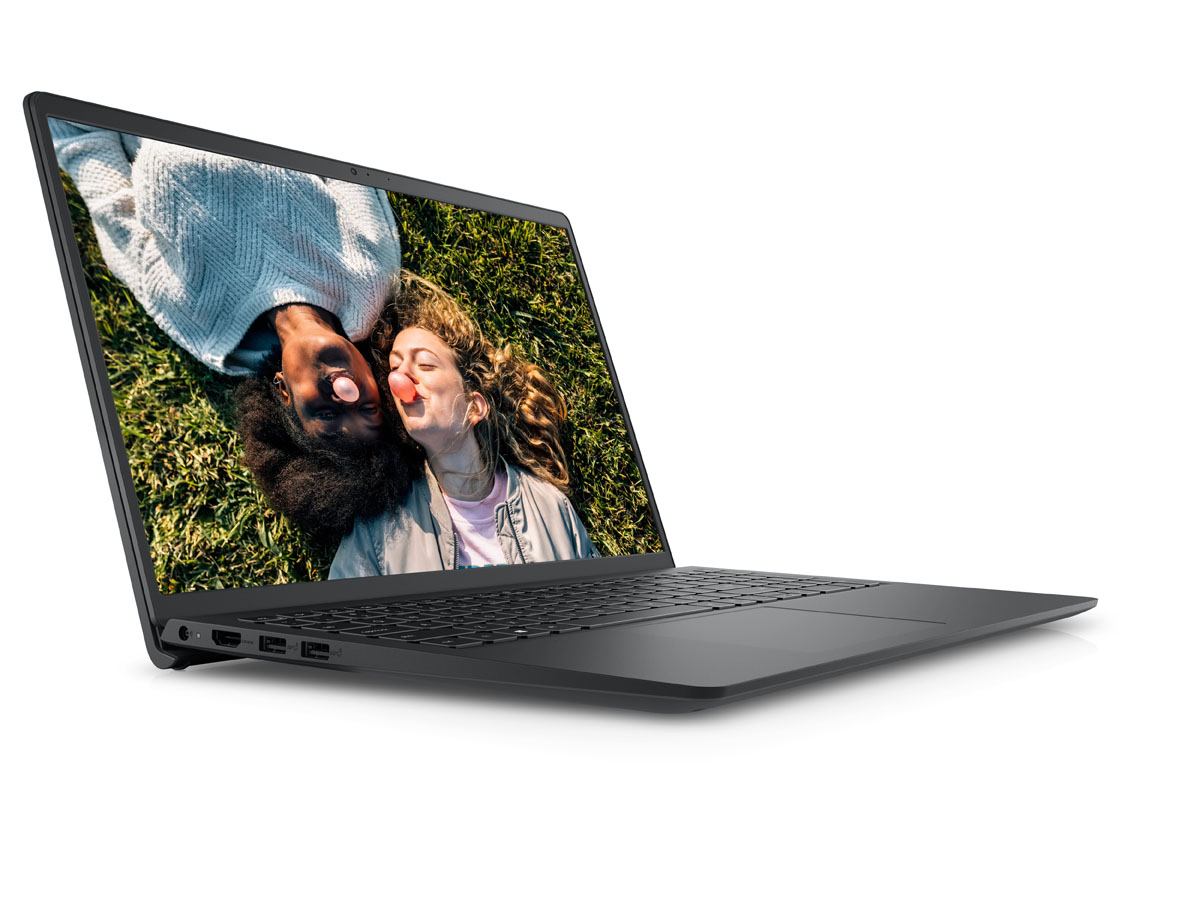
L'Inspiron 15 3511 è il successore diretto del Inspiron 15 3501. Introduce un nuovo design dello chassis che è sia più sottile che più leggero per una maggiore portabilità. Ci sono anche alcune altre sorprese che aiutano l'Inspiron 15 3511 a superare molti altri modelli nella sua fascia di prezzo.
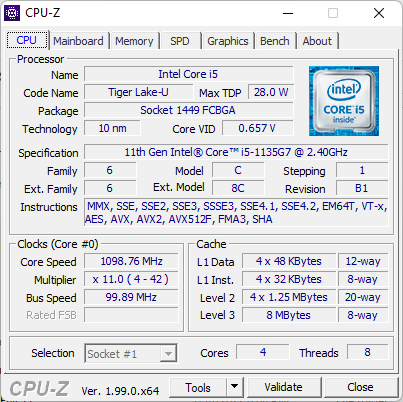
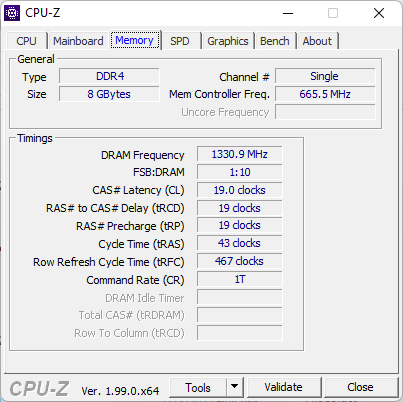
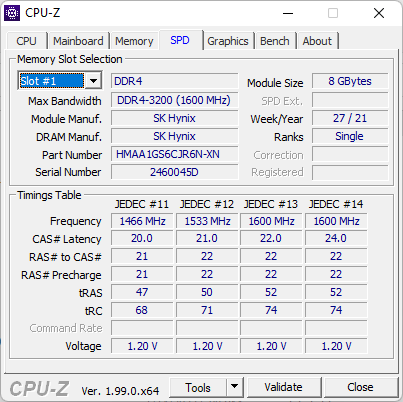
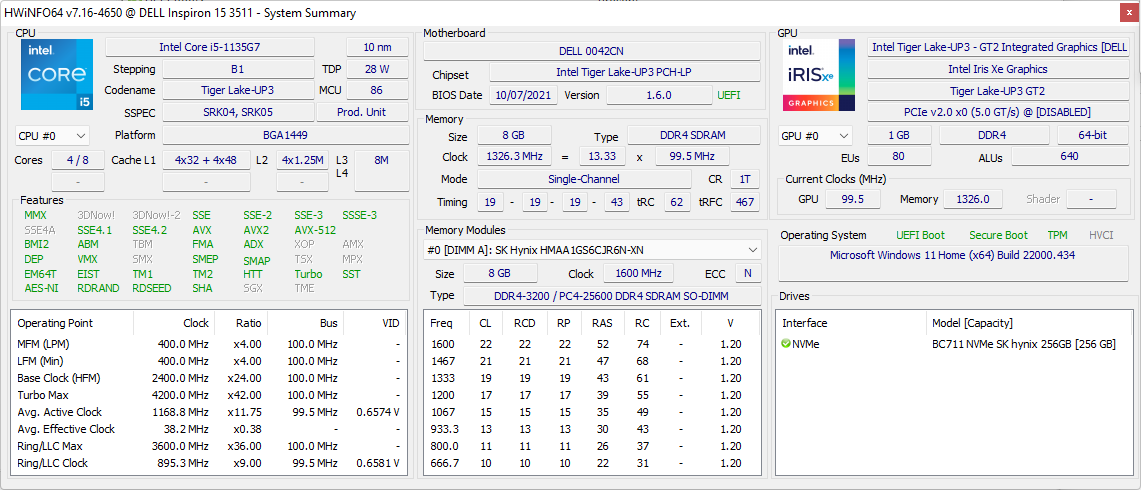
Le SKU vanno dal Core i3-1115G4 fino al Core i7-1165G7 con UHD Graphics o Iris Xe, da 4 GB a 12 GB di RAM, e da 128 GB a 512 GB di storage PCIe NVMe. Un display IPS 1080p è di serie con touch opzionale. La nostra specifica unità di recensione è una configurazione di fascia media con una CPU Core i5, 8 GB di RAM a canale singolo, 256 GB di SSD e touchscreen 1080p per circa 550 dollari al dettaglio.
I concorrenti in questo spazio includono altri portatili economici da 15.6 pollici per multimedia/ufficio come HP Pavilion 15, Lenovo IdeaPad 3 15, Asus VivoBook S15, o la serie Acer Aspire
Altre recensioni di Dell:
Potential Competitors in Comparison
Punteggio | Data | Modello | Peso | Altezza | Dimensione | Risoluzione | Prezzo |
|---|---|---|---|---|---|---|---|
| 79.9 % v7 (old) | 01/2022 | Dell Inspiron 15 3000 3511 i5-1135G7, Iris Xe G7 80EUs | 1.7 kg | 18.99 mm | 15.60" | 1920x1080 | |
| 84.2 % v7 (old) | 10/2021 | Dell XPS 15 9510 i5 11400H FHD i5-11400H, UHD Graphics Xe 16EUs | 1.8 kg | 18 mm | 15.60" | 1920x1200 | |
| 82.1 % v7 (old) | 07/2021 | Asus VivoBook S15 D533UA R7 5700U, Vega 8 | 1.8 kg | 16.1 mm | 15.60" | 1920x1080 | |
| 80.5 % v7 (old) | 10/2021 | Dell Inspiron 15 3501 i7-1165G7, Iris Xe G7 96EUs | 2 kg | 19.9 mm | 15.60" | 1920x1080 | |
| 80.4 % v7 (old) | 12/2021 | Lenovo IdeaPad 3 15ALC6 R3 5300U, Vega 6 | 1.7 kg | 19.9 mm | 15.60" | 1920x1080 | |
| 81.2 % v7 (old) | 06/2021 | HP Pavilion 15-eg i7-1165G7, GeForce MX450 | 1.7 kg | 17.9 mm | 15.60" | 1920x1080 |
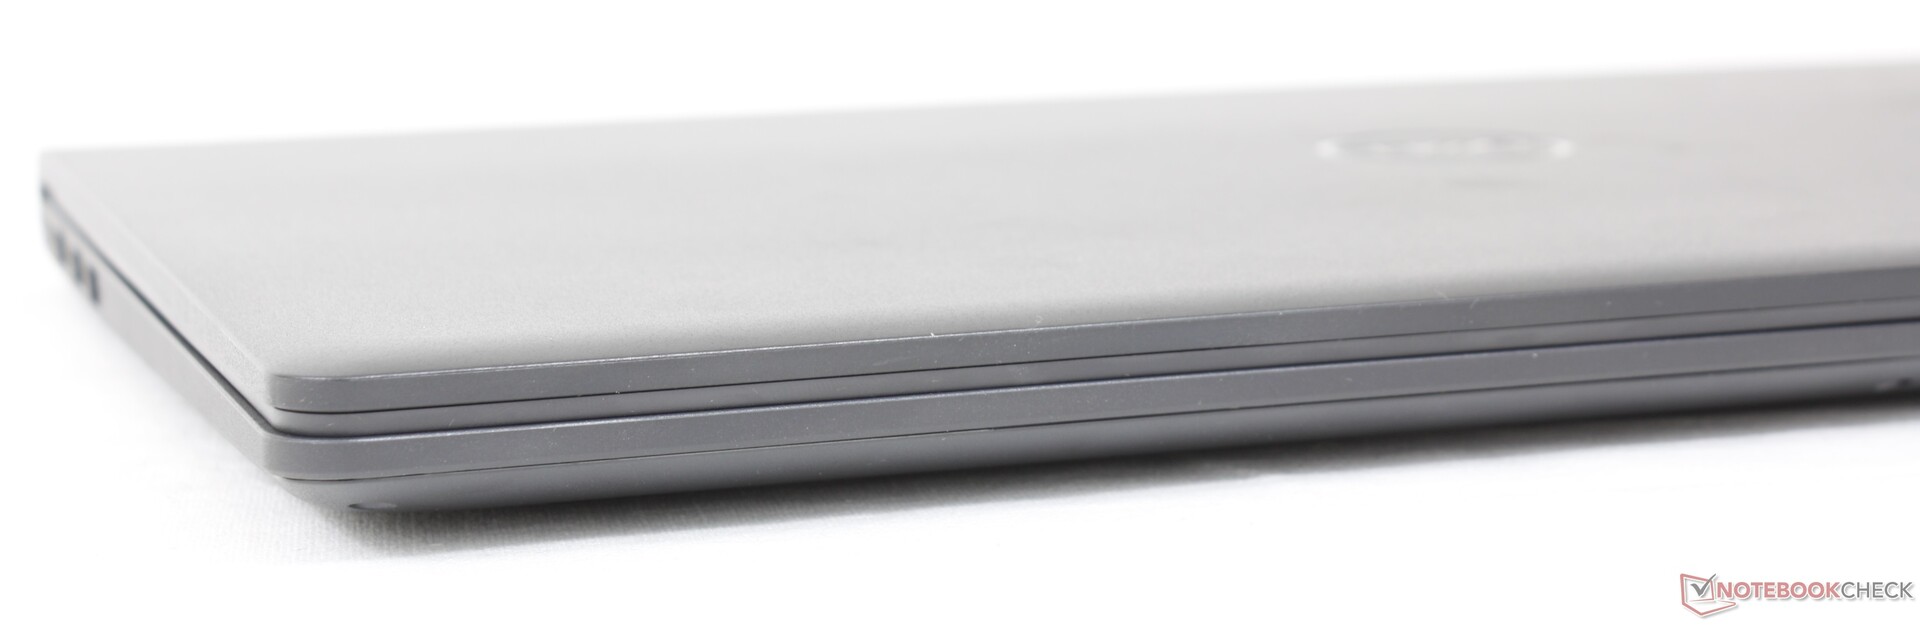
Caso
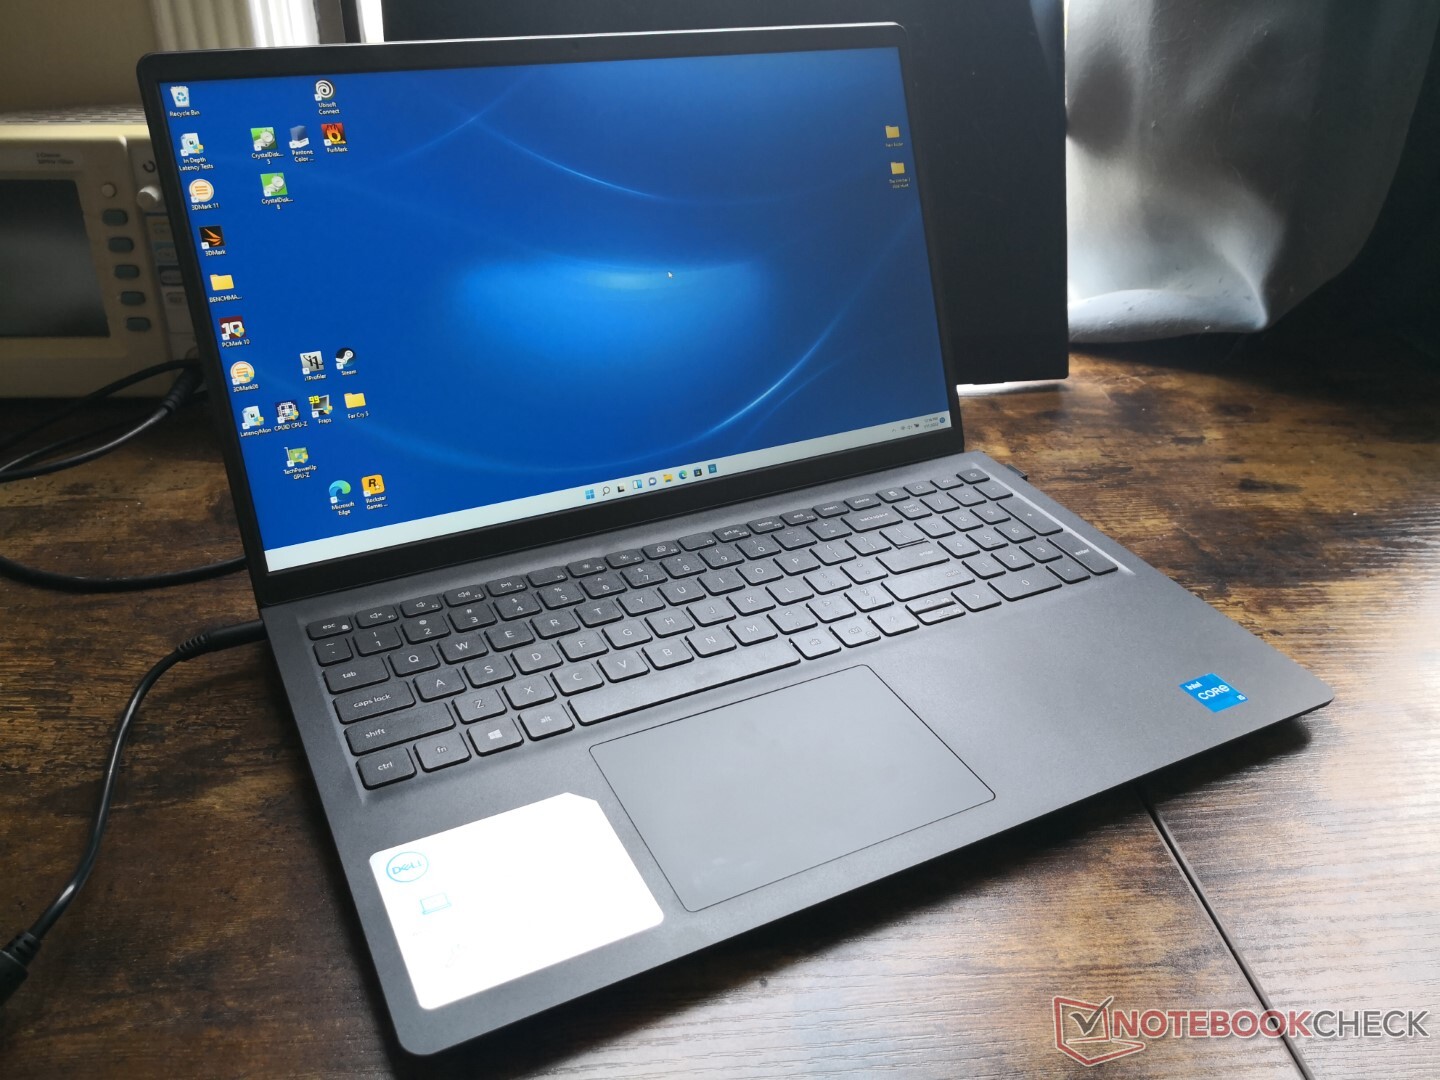
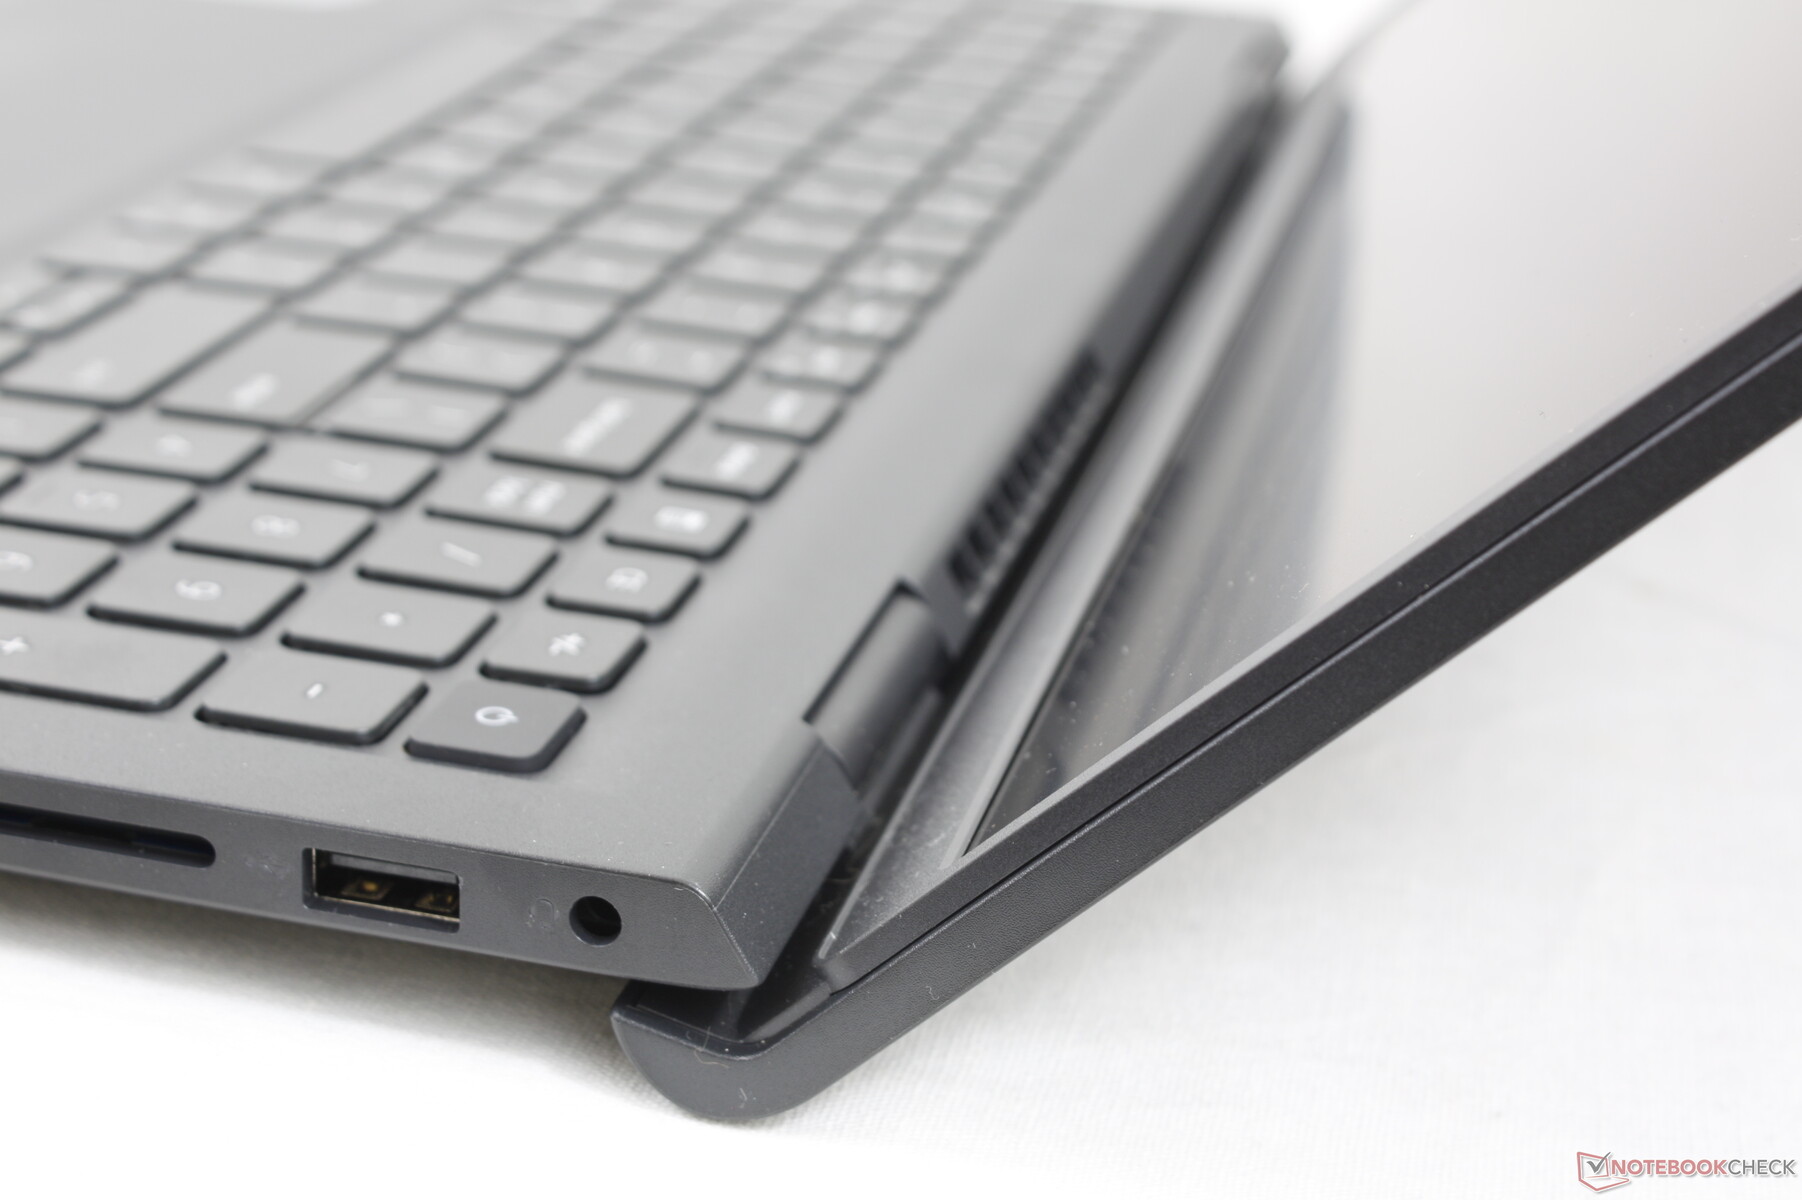
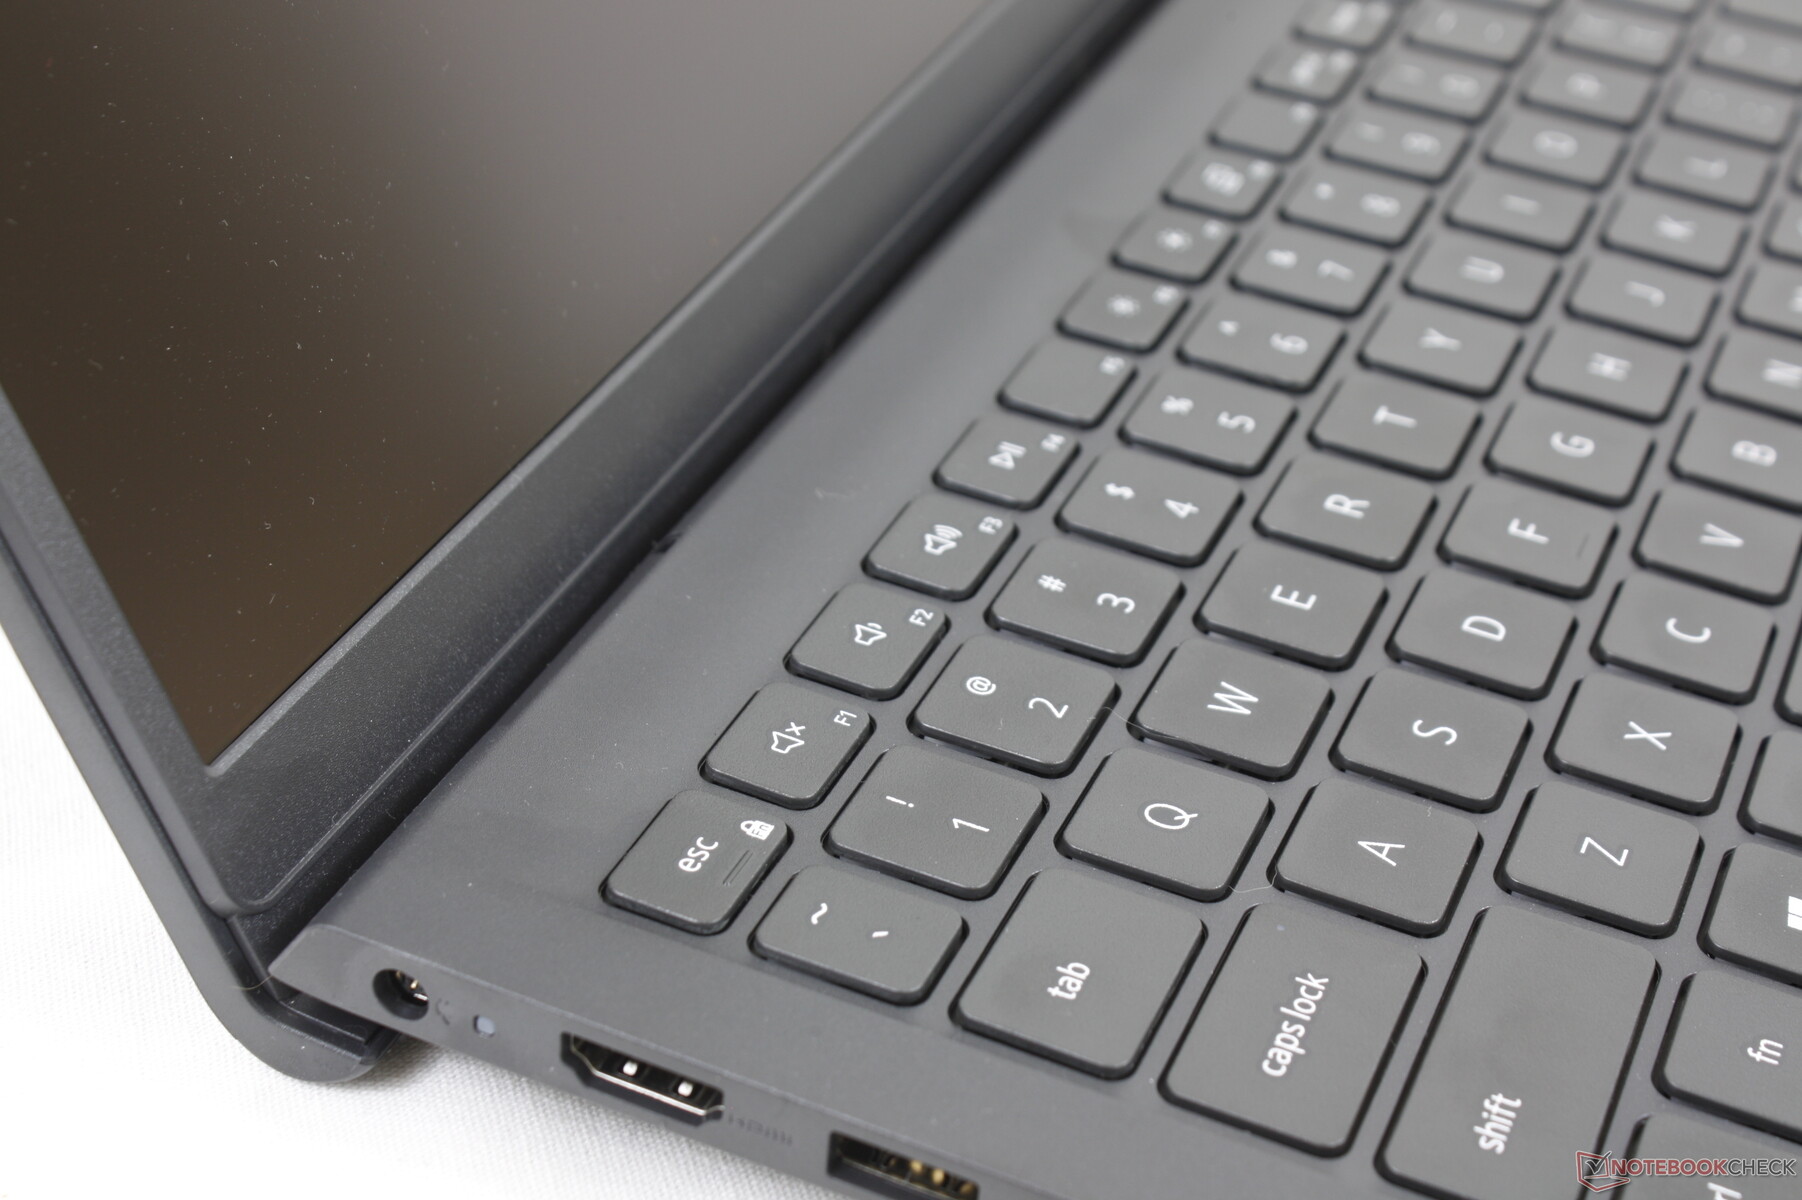
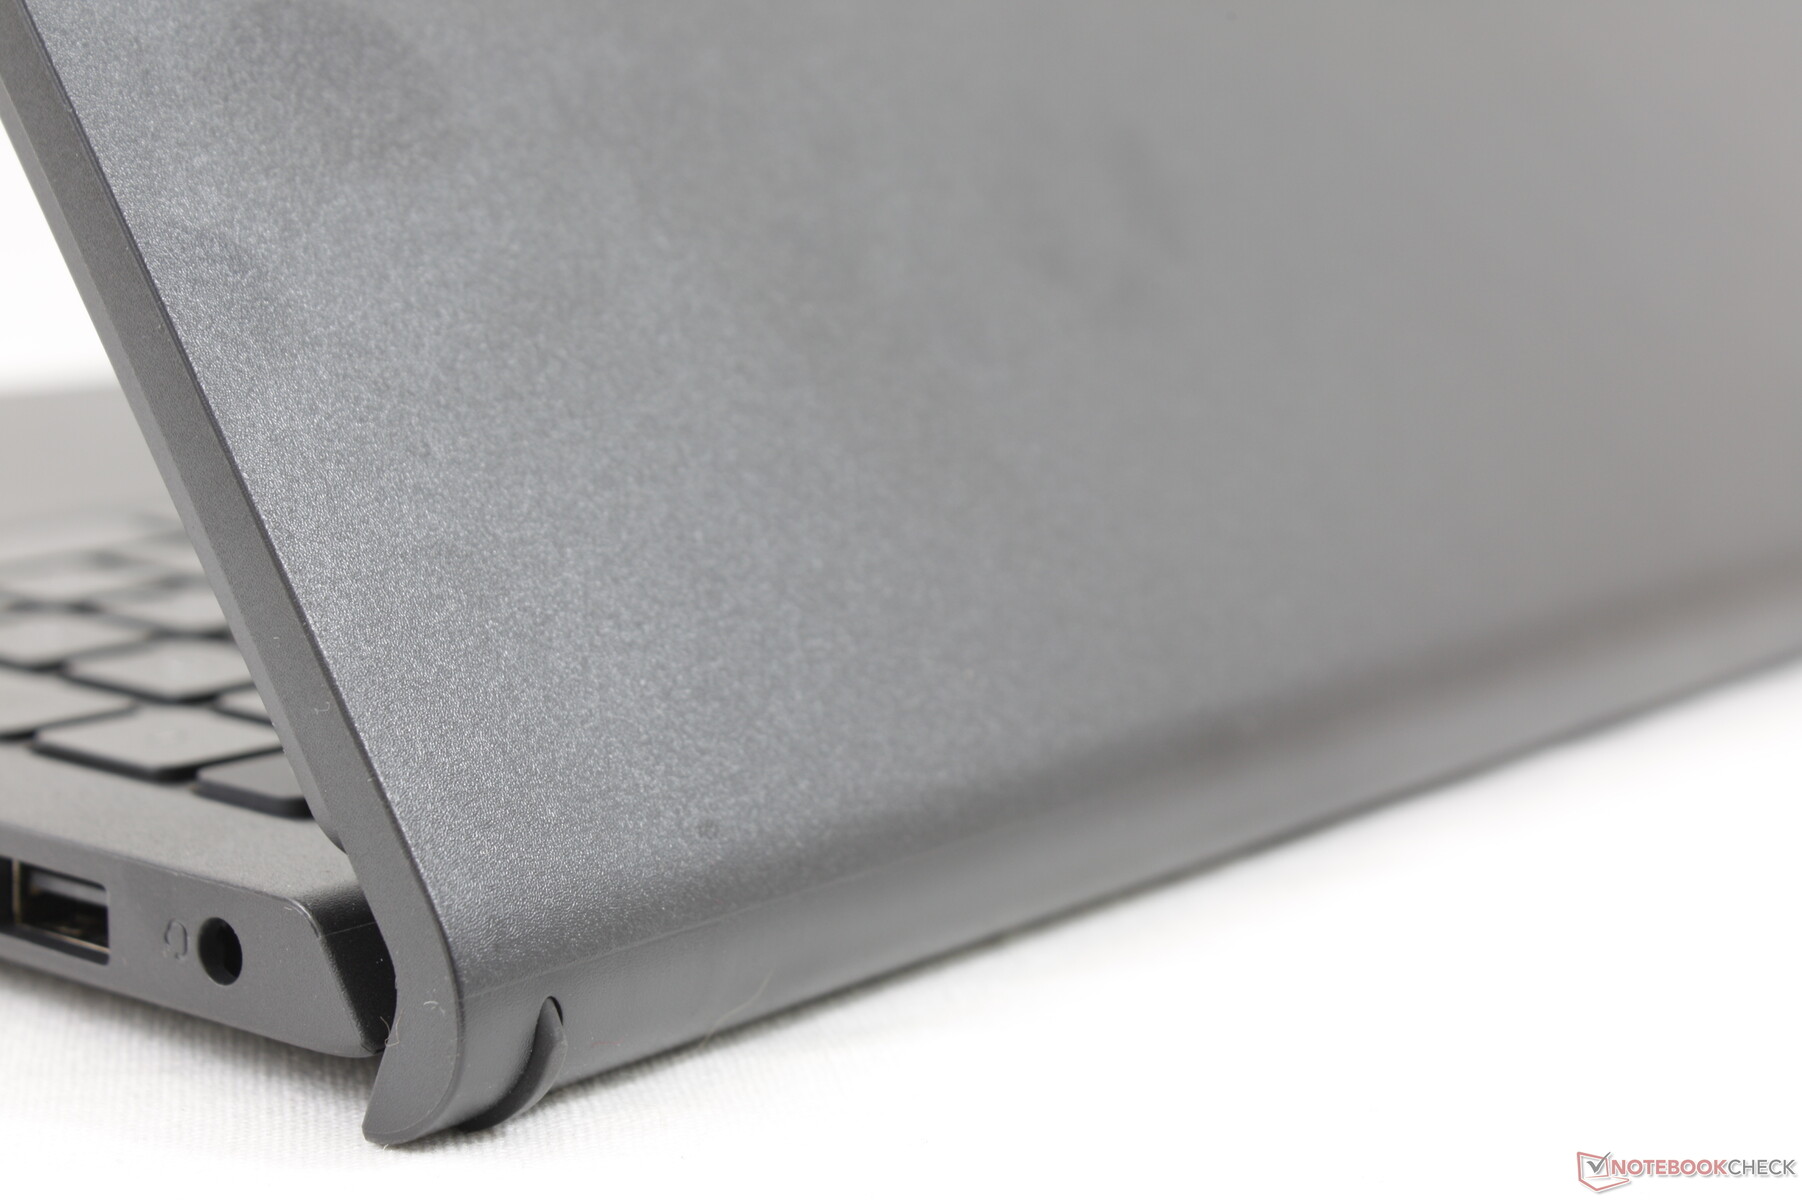
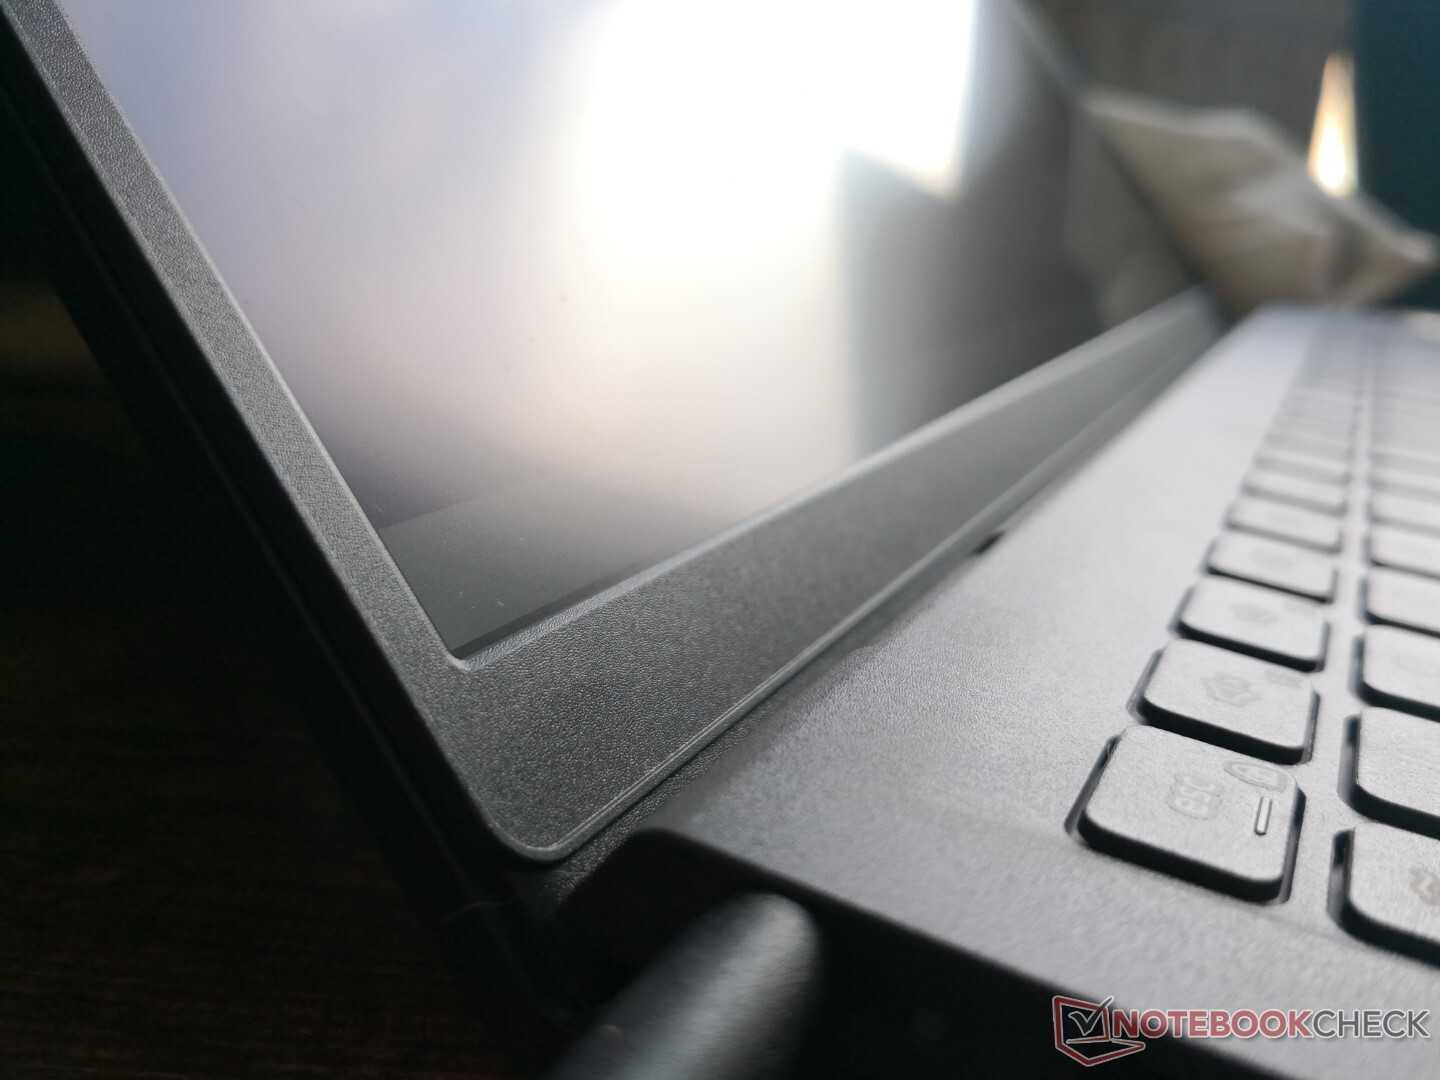
Il design rinnovato dell'Inspiron 15 3511 riduce significativamente la lunetta inferiore del 3501 per un maggiore rapporto schermo-corpo. Il sistema ora utilizza anche cerniere simili a quelle del VivoBook, MSI Prestigeo HP Pavilion per sollevare la base con un leggero angolo per migliorare l'ergonomia e il flusso d'aria. La maggior parte del telaio continua ad essere di plastica, tuttavia, e così il sistema non si sente più rigido o di qualità superiore rispetto al vecchio Inspiron 15 3501 nonostante la riprogettazione completa. Il centro della tastiera, il coperchio esterno e i bordi della base possono torcersi e deformarsi abbastanza facilmente con abbastanza pressione.
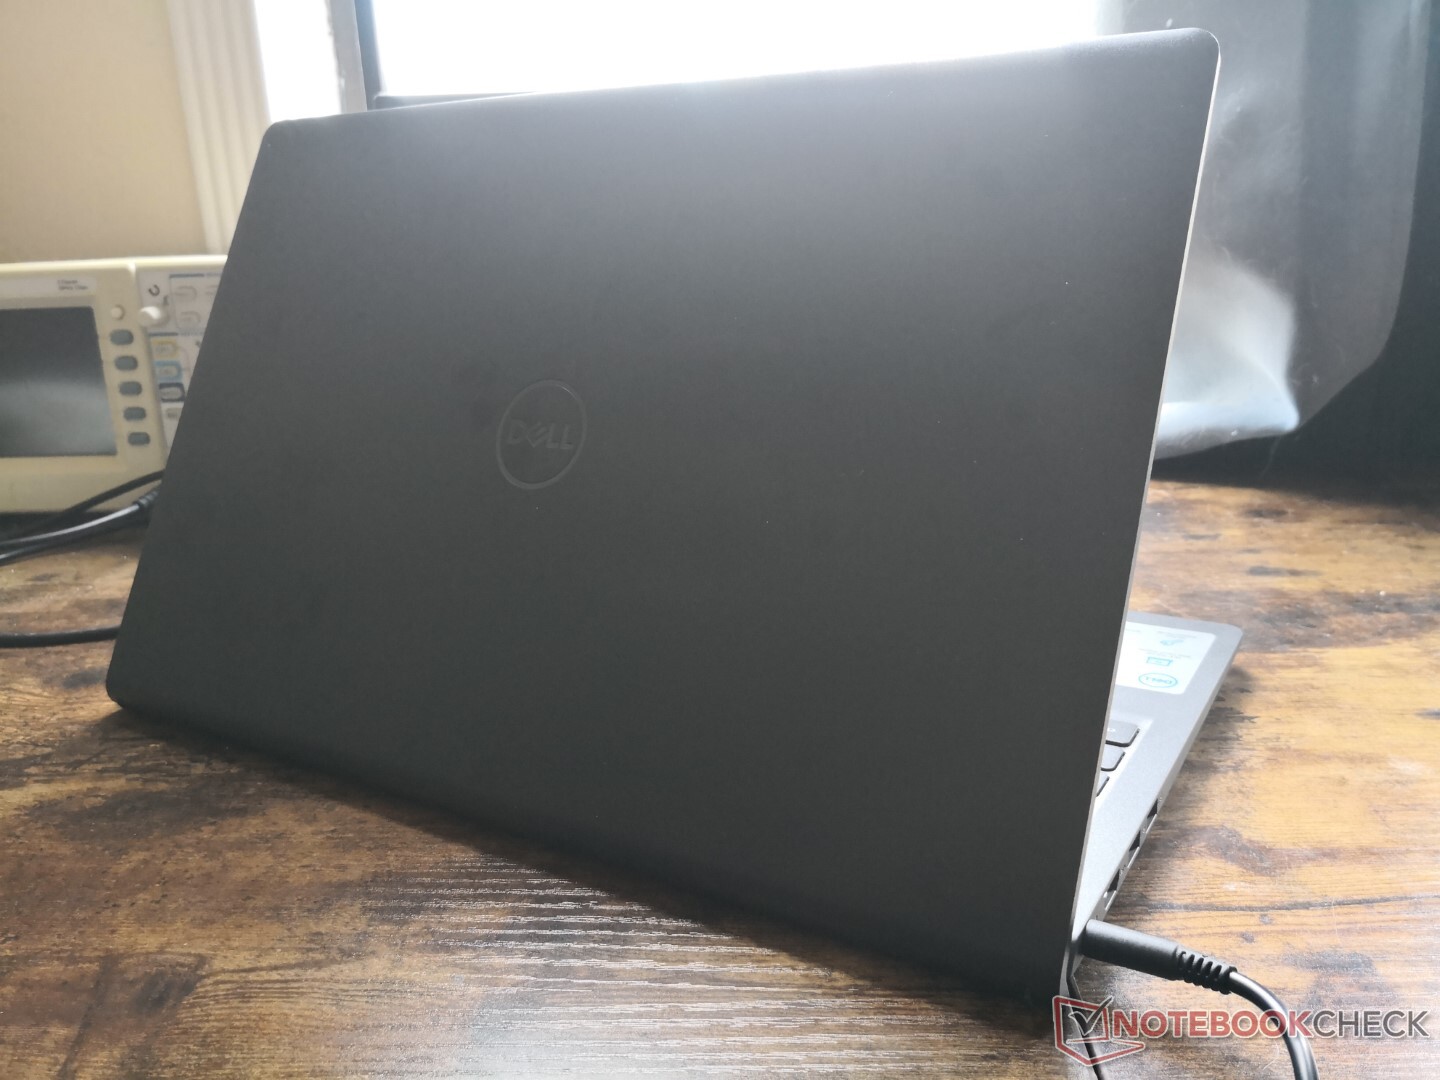
Il nuovo modello è circa l'11% più piccolo e il 15% più leggero del suo predecessore. Tuttavia, il design 3501 era in realtà abbastanza grande, il che significa che il design 3511 è più paragonabile al Pavilion, VivoBook, o IdeaPad 3 in termini di dimensioni e peso.
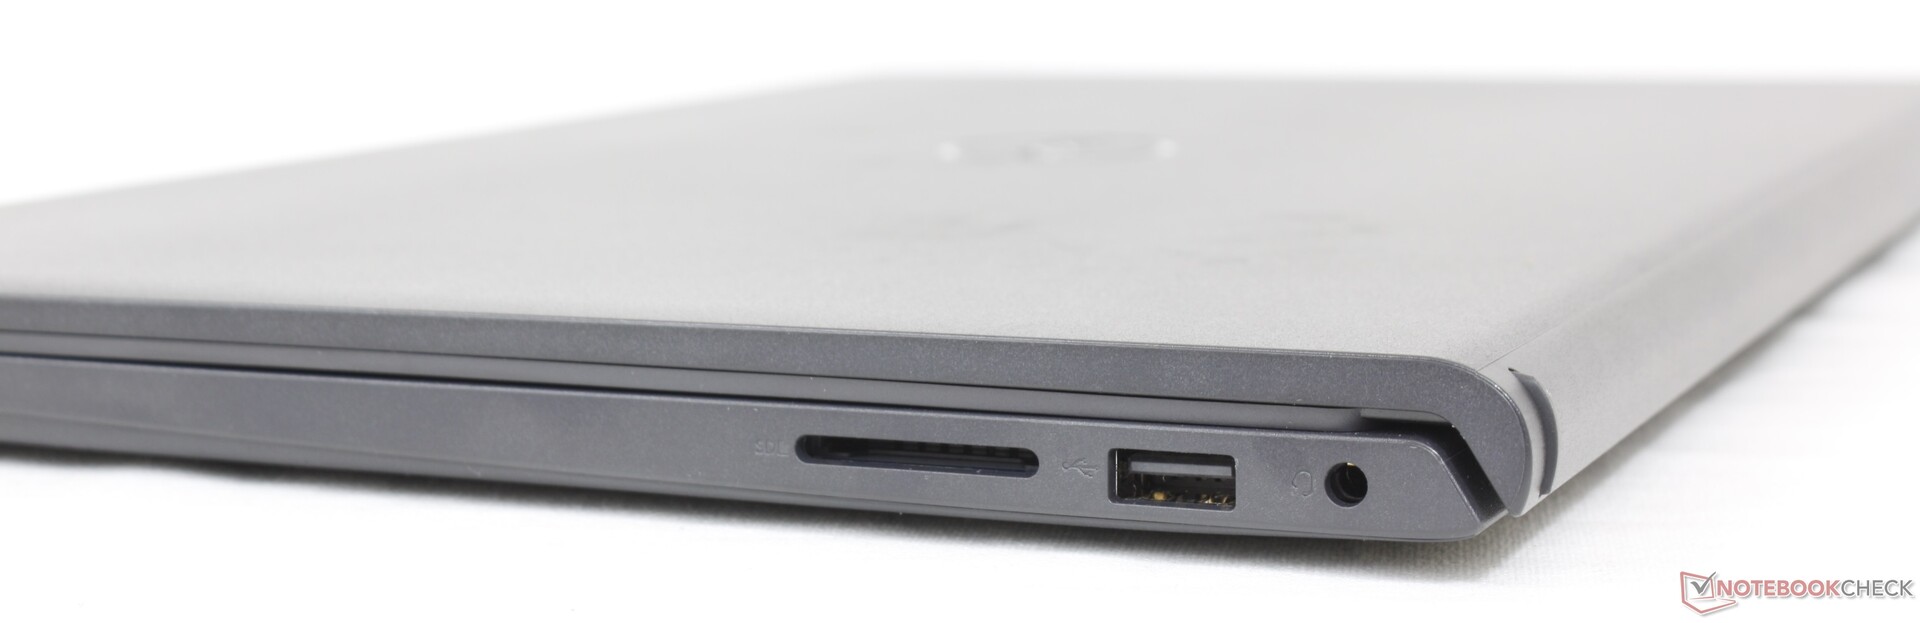
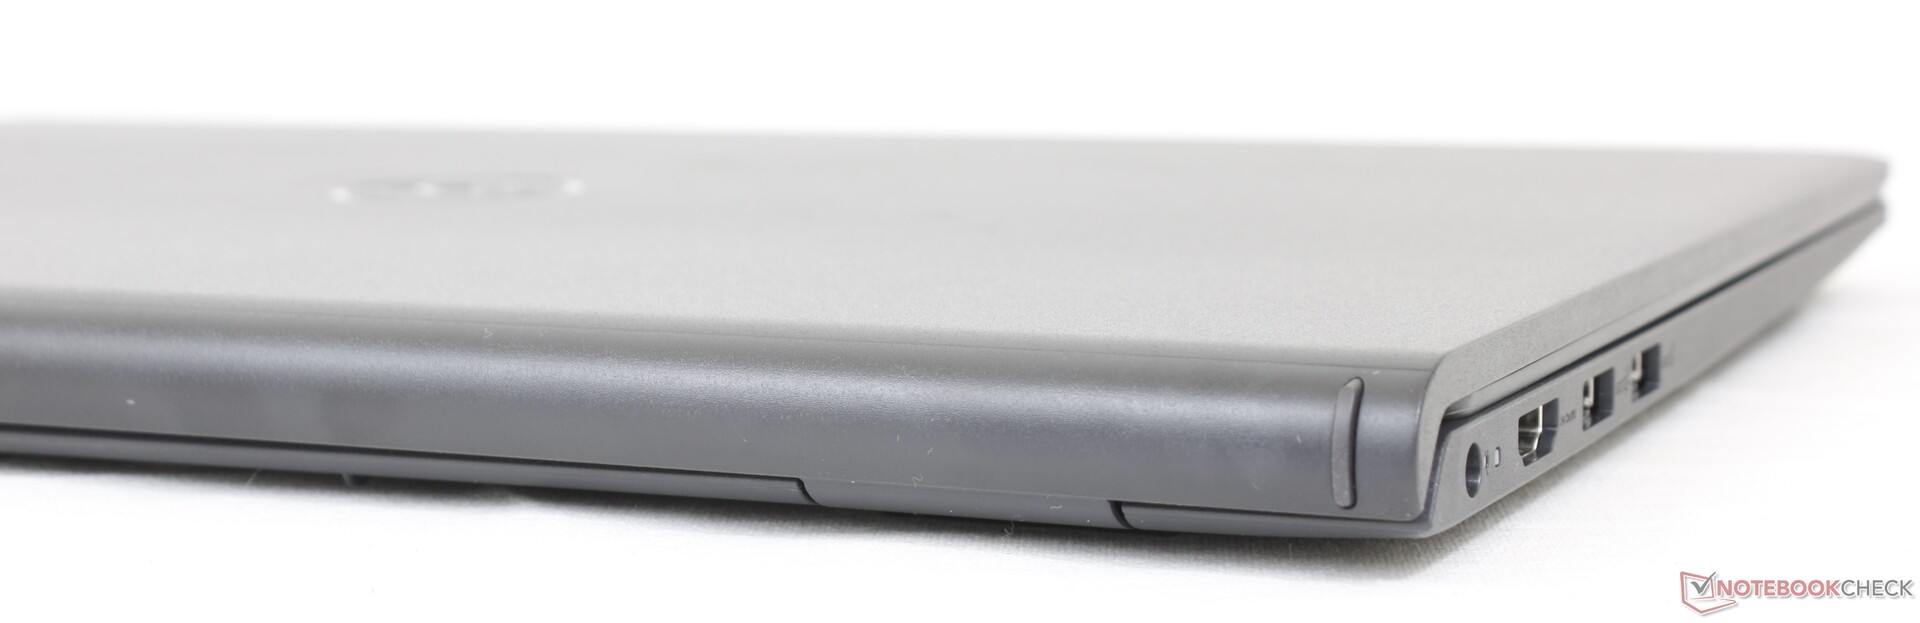
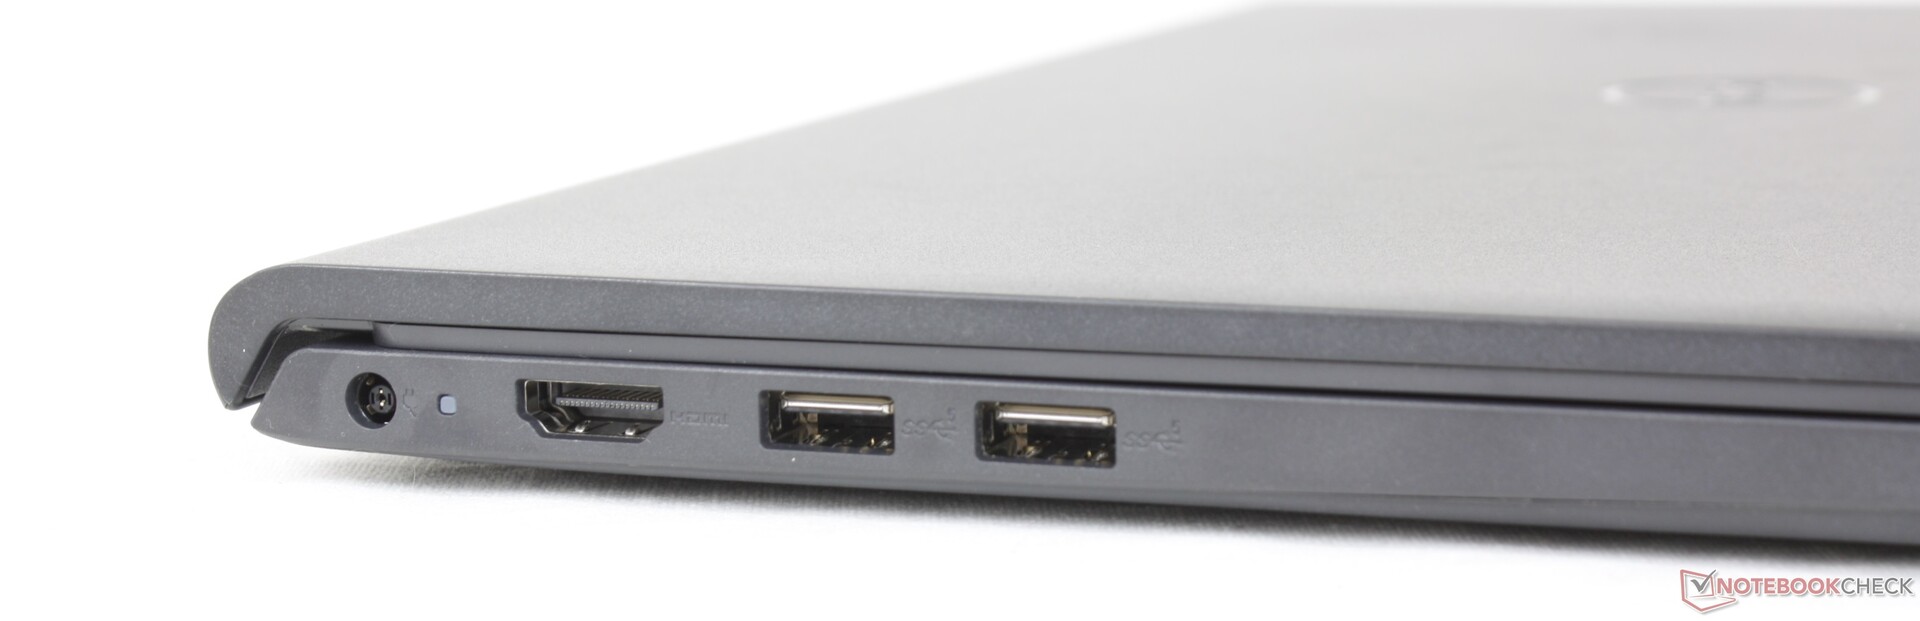
Connettività
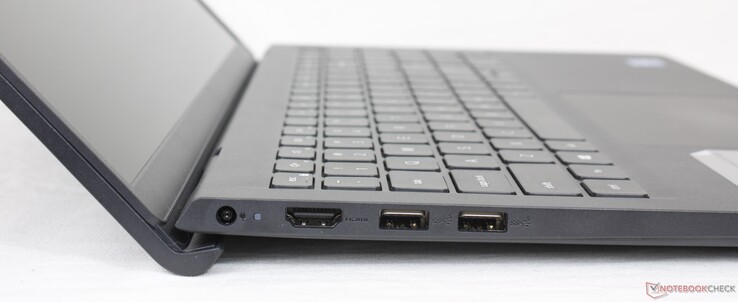
Ci sono meno porte sul nuovo Inspiron 15 3511 rispetto al vecchio Inspiron 15 3501. Lo slot Cable lock e la porta RJ-45, per esempio, sono completamente spariti. Dell non si è nemmeno preoccupata di includere un'opzione USB-C.
È interessante notare che la porta HDMI qui può supportare solo fino a 1080p60 e senza opzioni 2K o 4K secondo la pagina del prodotto di Dell.
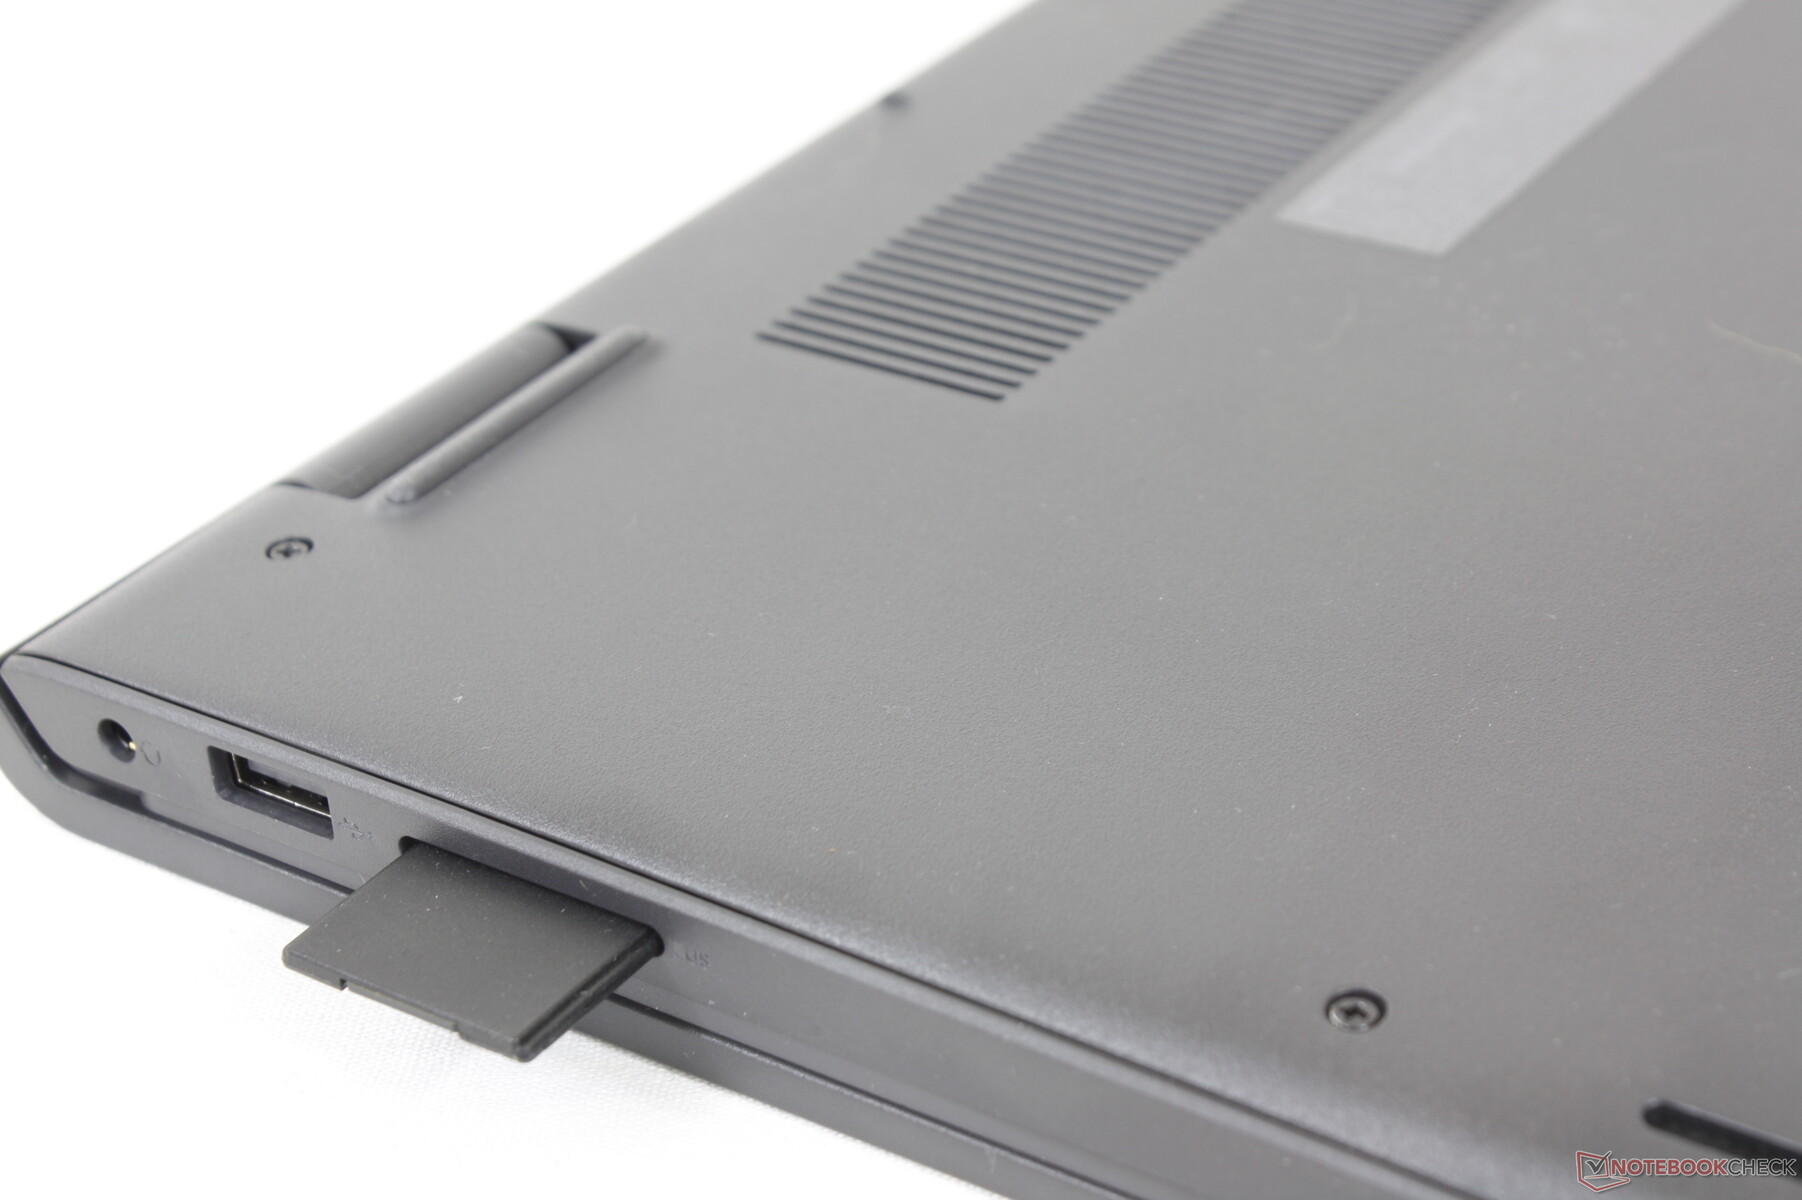
Lettore di schede SD
Il lettore di schede SD integrato è lento. Il trasferimento di 1 GB di immagini dalla nostra scheda di test UHS-II al desktop richiede più di 50 secondi rispetto ai soli 14 secondi dell'HP Pavilion 15-eg.
| SD Card Reader | |
| average JPG Copy Test (av. of 3 runs) | |
| Dell XPS 15 9510 i5 11400H FHD (AV Pro V60) | |
| HP Pavilion 15-eg (AV PRO microSD 128 GB V60) | |
| Asus VivoBook S15 D533UA (AV PRO microSD 128 GB V60) | |
| Lenovo IdeaPad 3 15ALC6 (AV PRO microSD 128 GB V60) | |
| Dell Inspiron 15 3501 (AV Pro SD 128 GB V60) | |
| Dell Inspiron 15 3000 3511 (AV Pro V60) | |
| maximum AS SSD Seq Read Test (1GB) | |
| Dell XPS 15 9510 i5 11400H FHD (AV Pro V60) | |
| HP Pavilion 15-eg (AV PRO microSD 128 GB V60) | |
| Lenovo IdeaPad 3 15ALC6 (AV PRO microSD 128 GB V60) | |
| Asus VivoBook S15 D533UA (AV PRO microSD 128 GB V60) | |
| Dell Inspiron 15 3501 (AV Pro SD microSD 128 GB V60) | |
| Dell Inspiron 15 3000 3511 (AV Pro V60) | |
Comunicazione
Un modulo Wi-Fi 5 1x1 è incluso invece del solito modulo Wi-Fi 6 2x2 probabilmente per risparmiare sui costi. Anche se le velocità di trasferimento nel mondo reale sono mediocri, sono almeno abbastanza stabili e affidabili per lo streaming.
Webcam
Non sembrano esserci miglioramenti alla qualità della fotocamera rispetto all'Inspiron 3501 dell'anno scorso. Non c'è nemmeno l'otturatore della webcam o il supporto di Windows Hello.


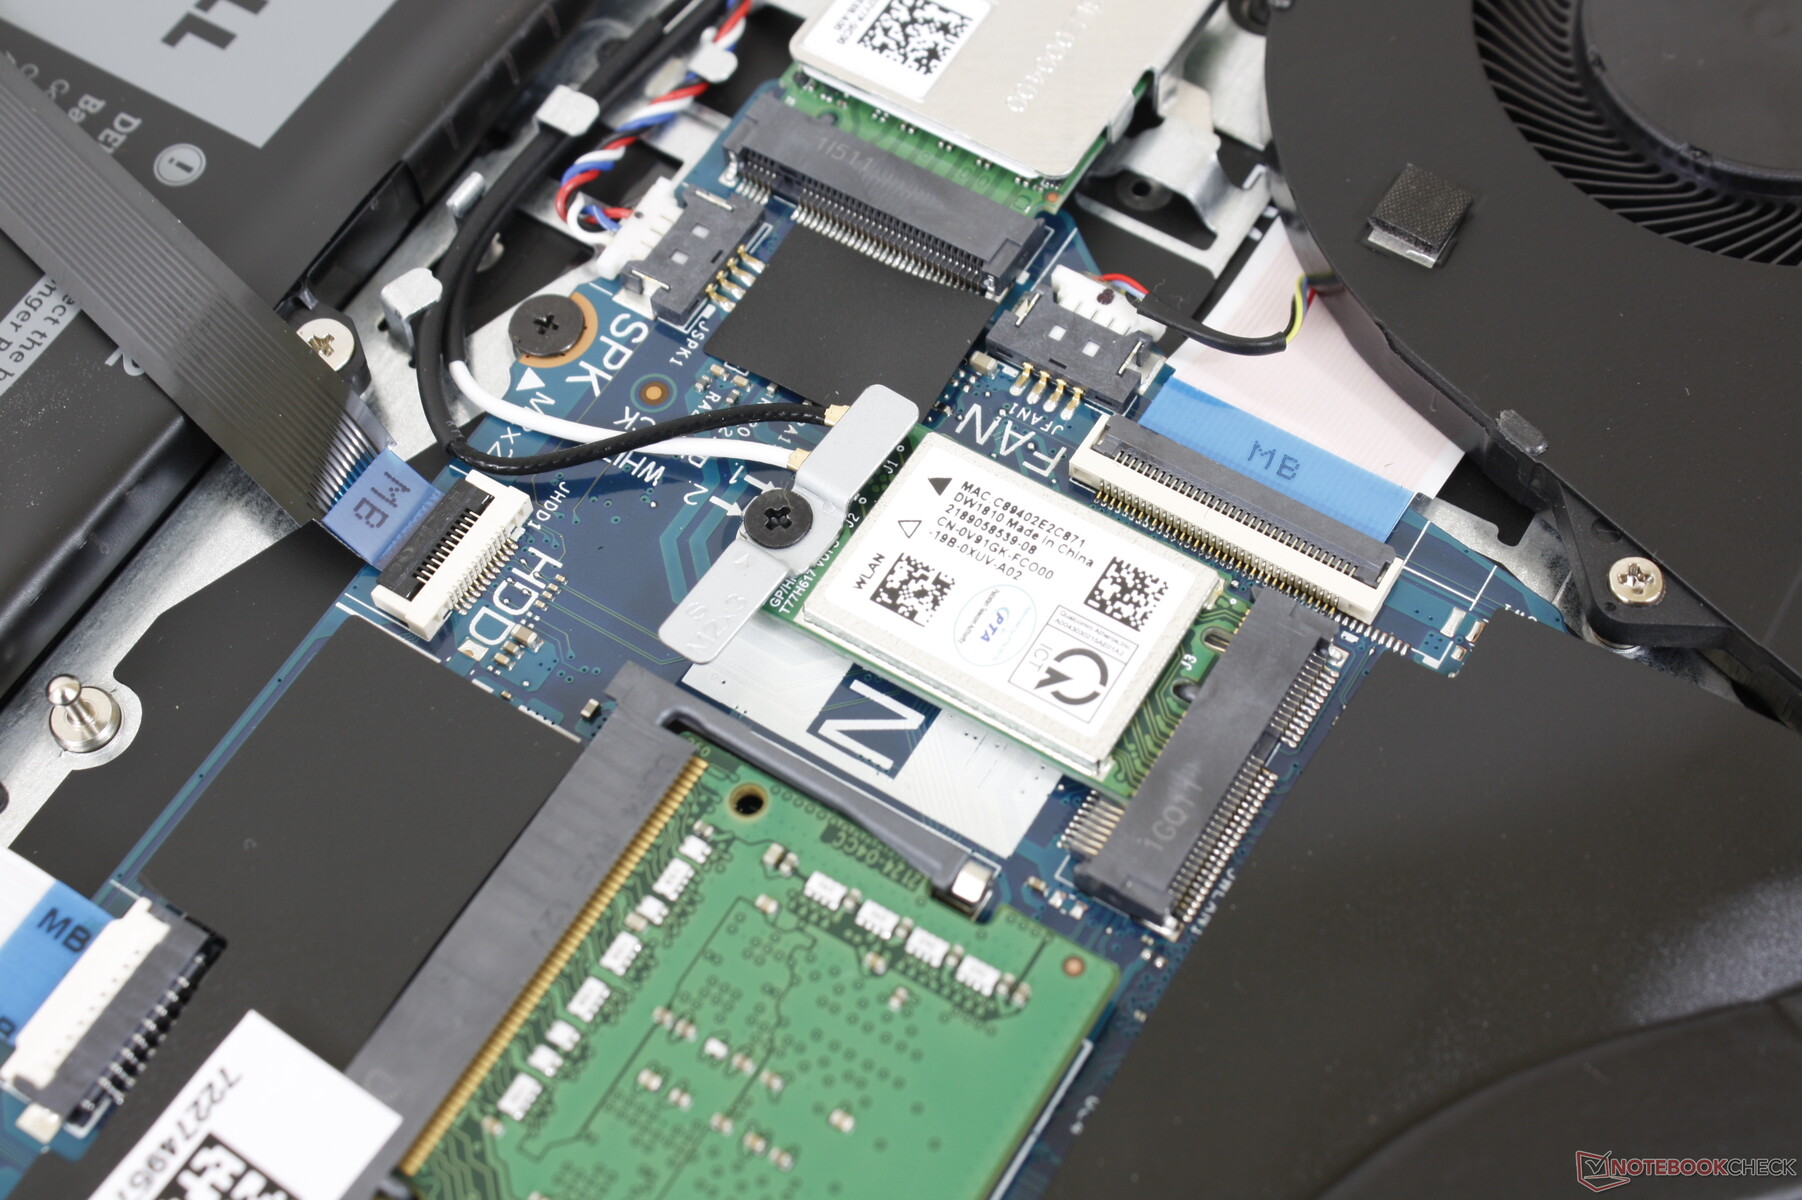
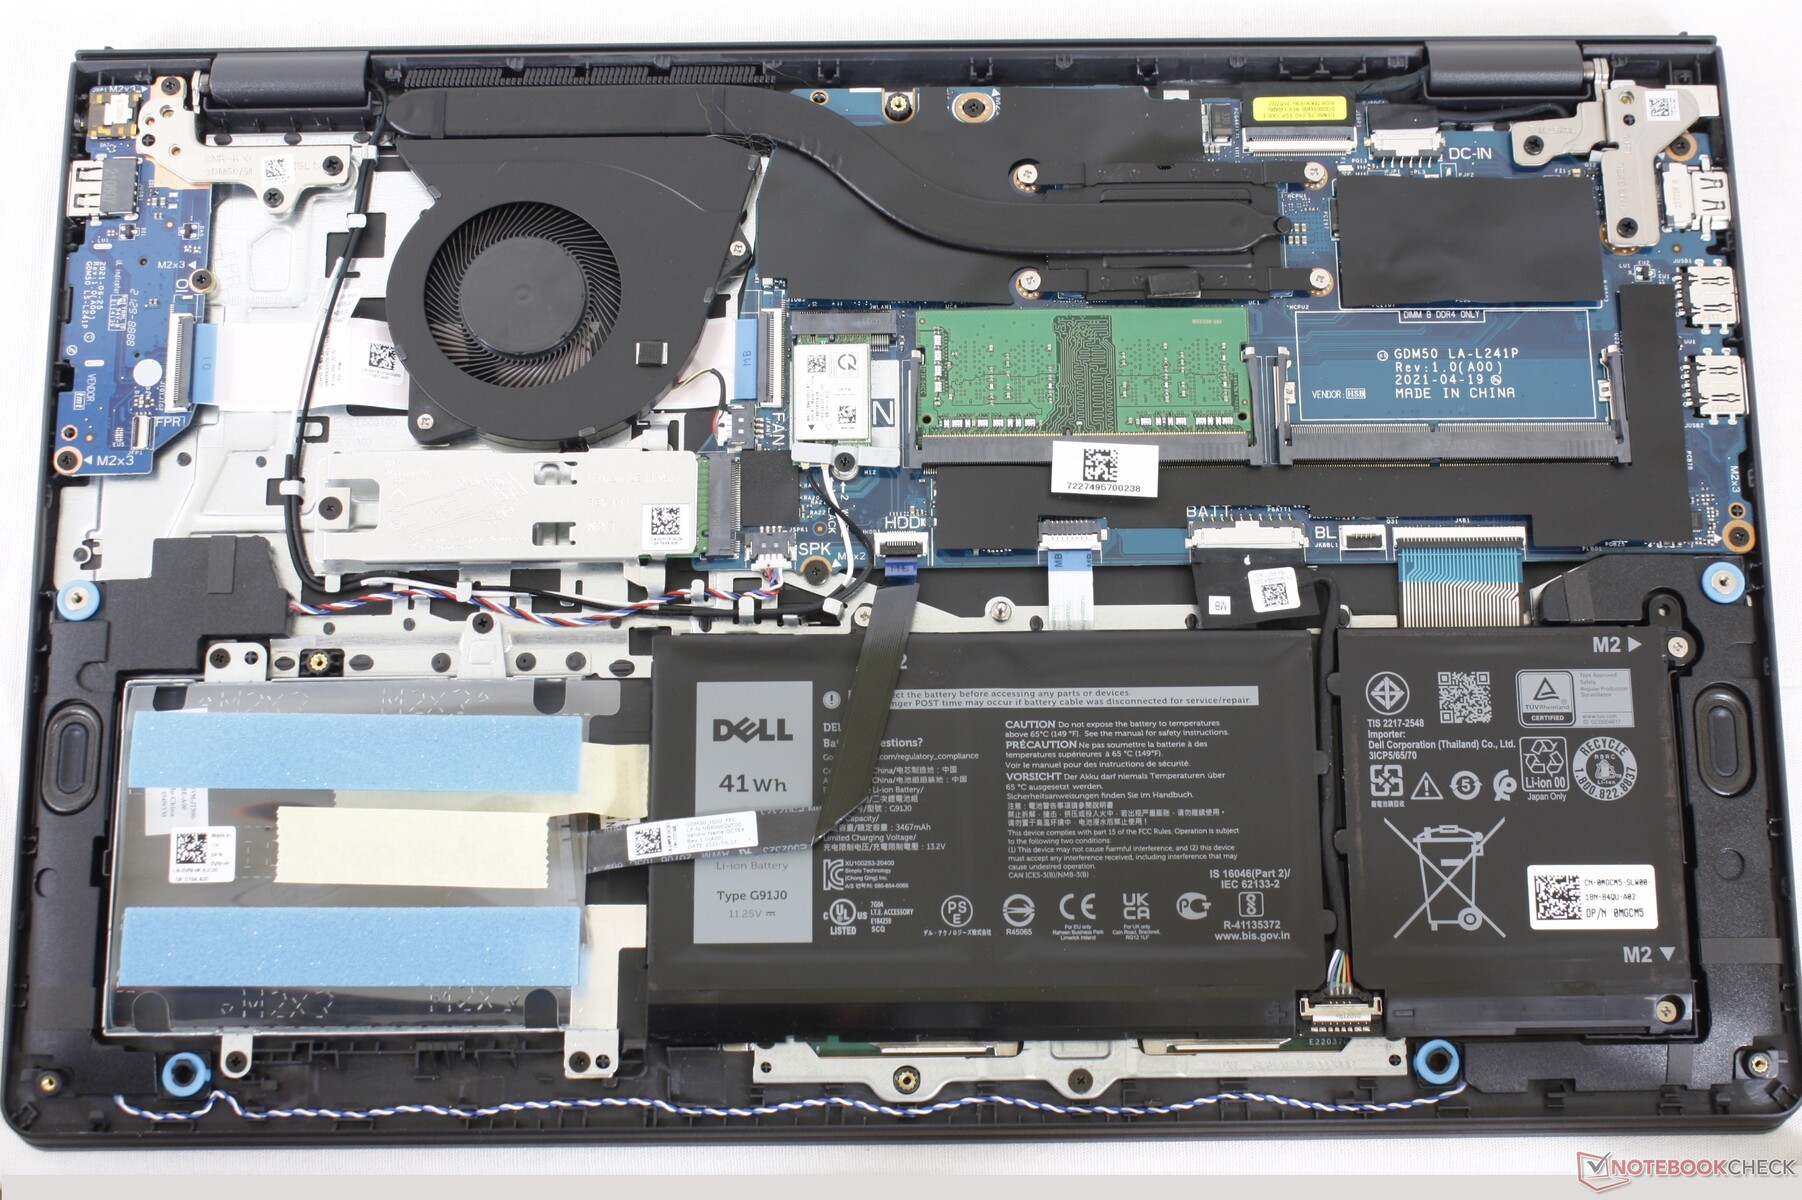
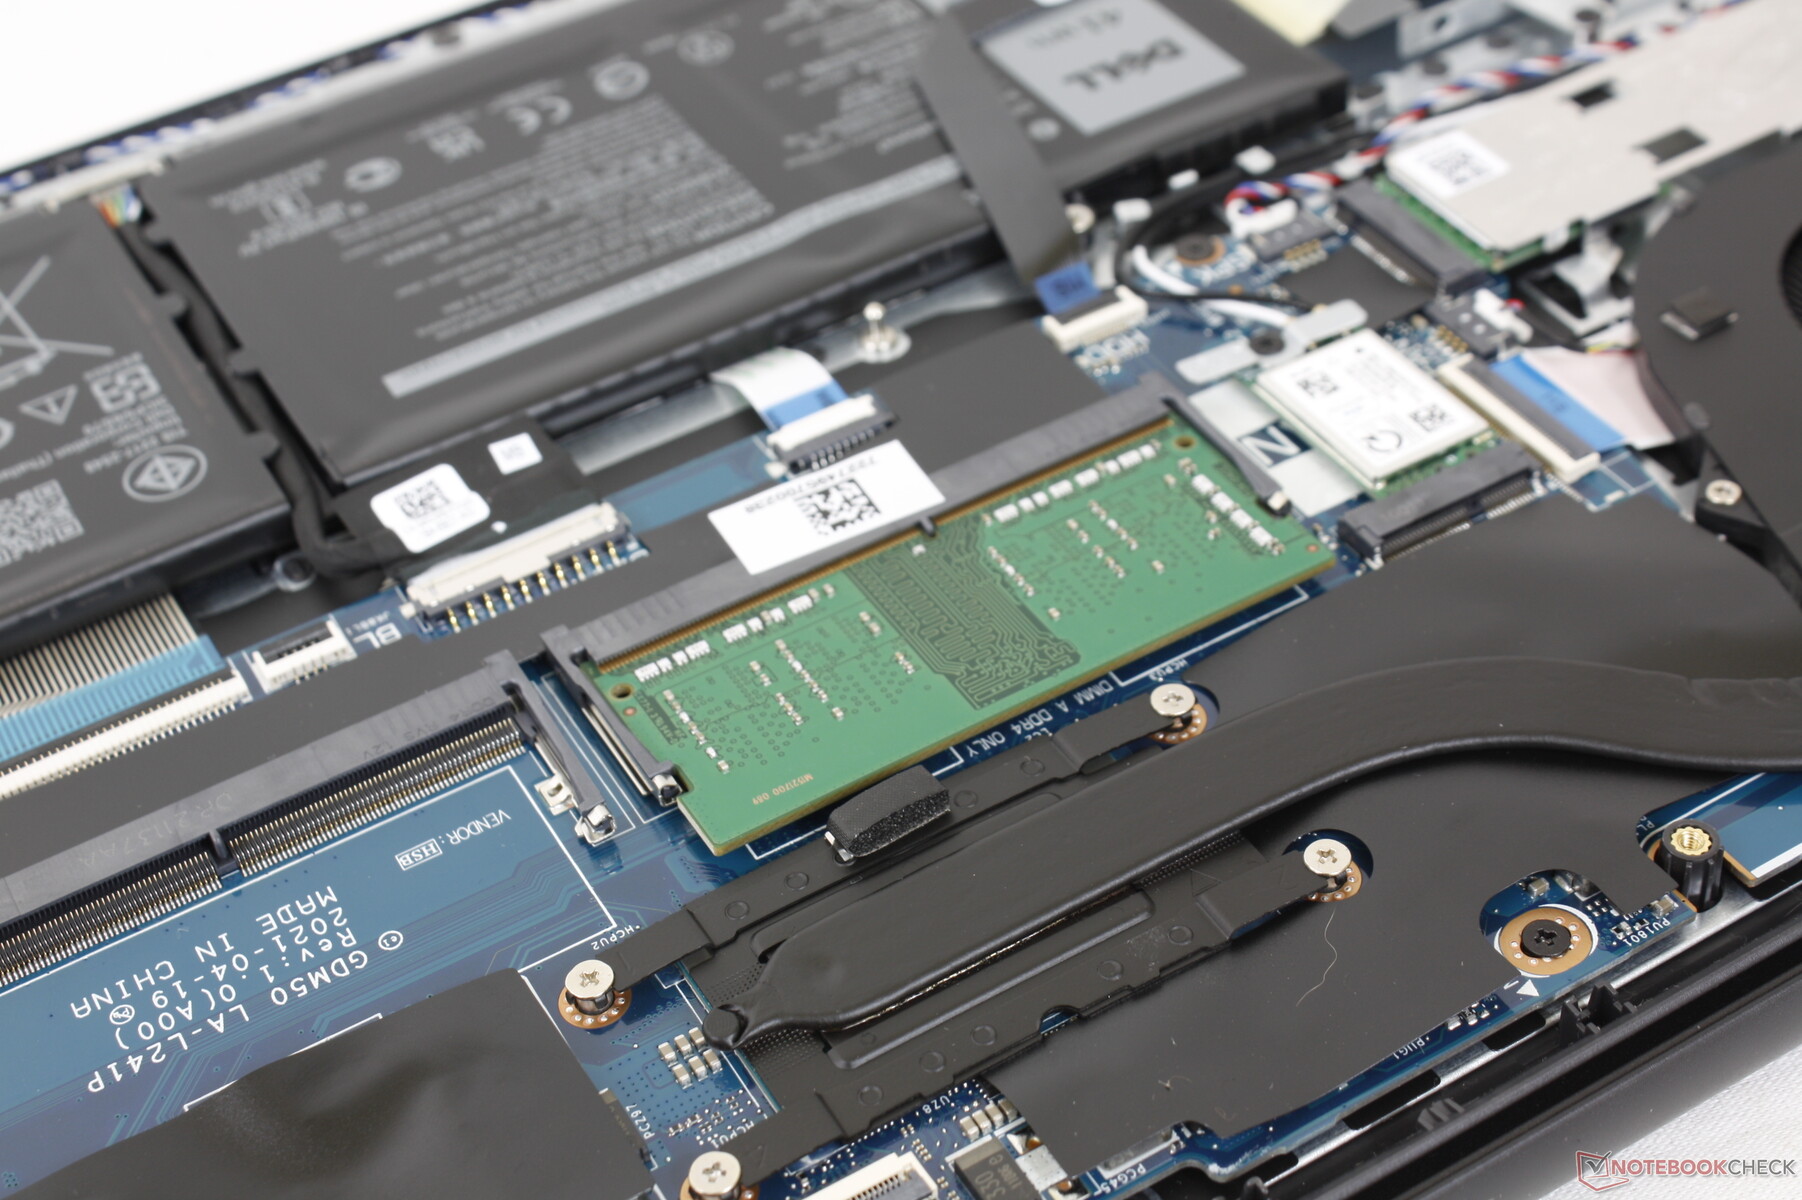
Manutenzione
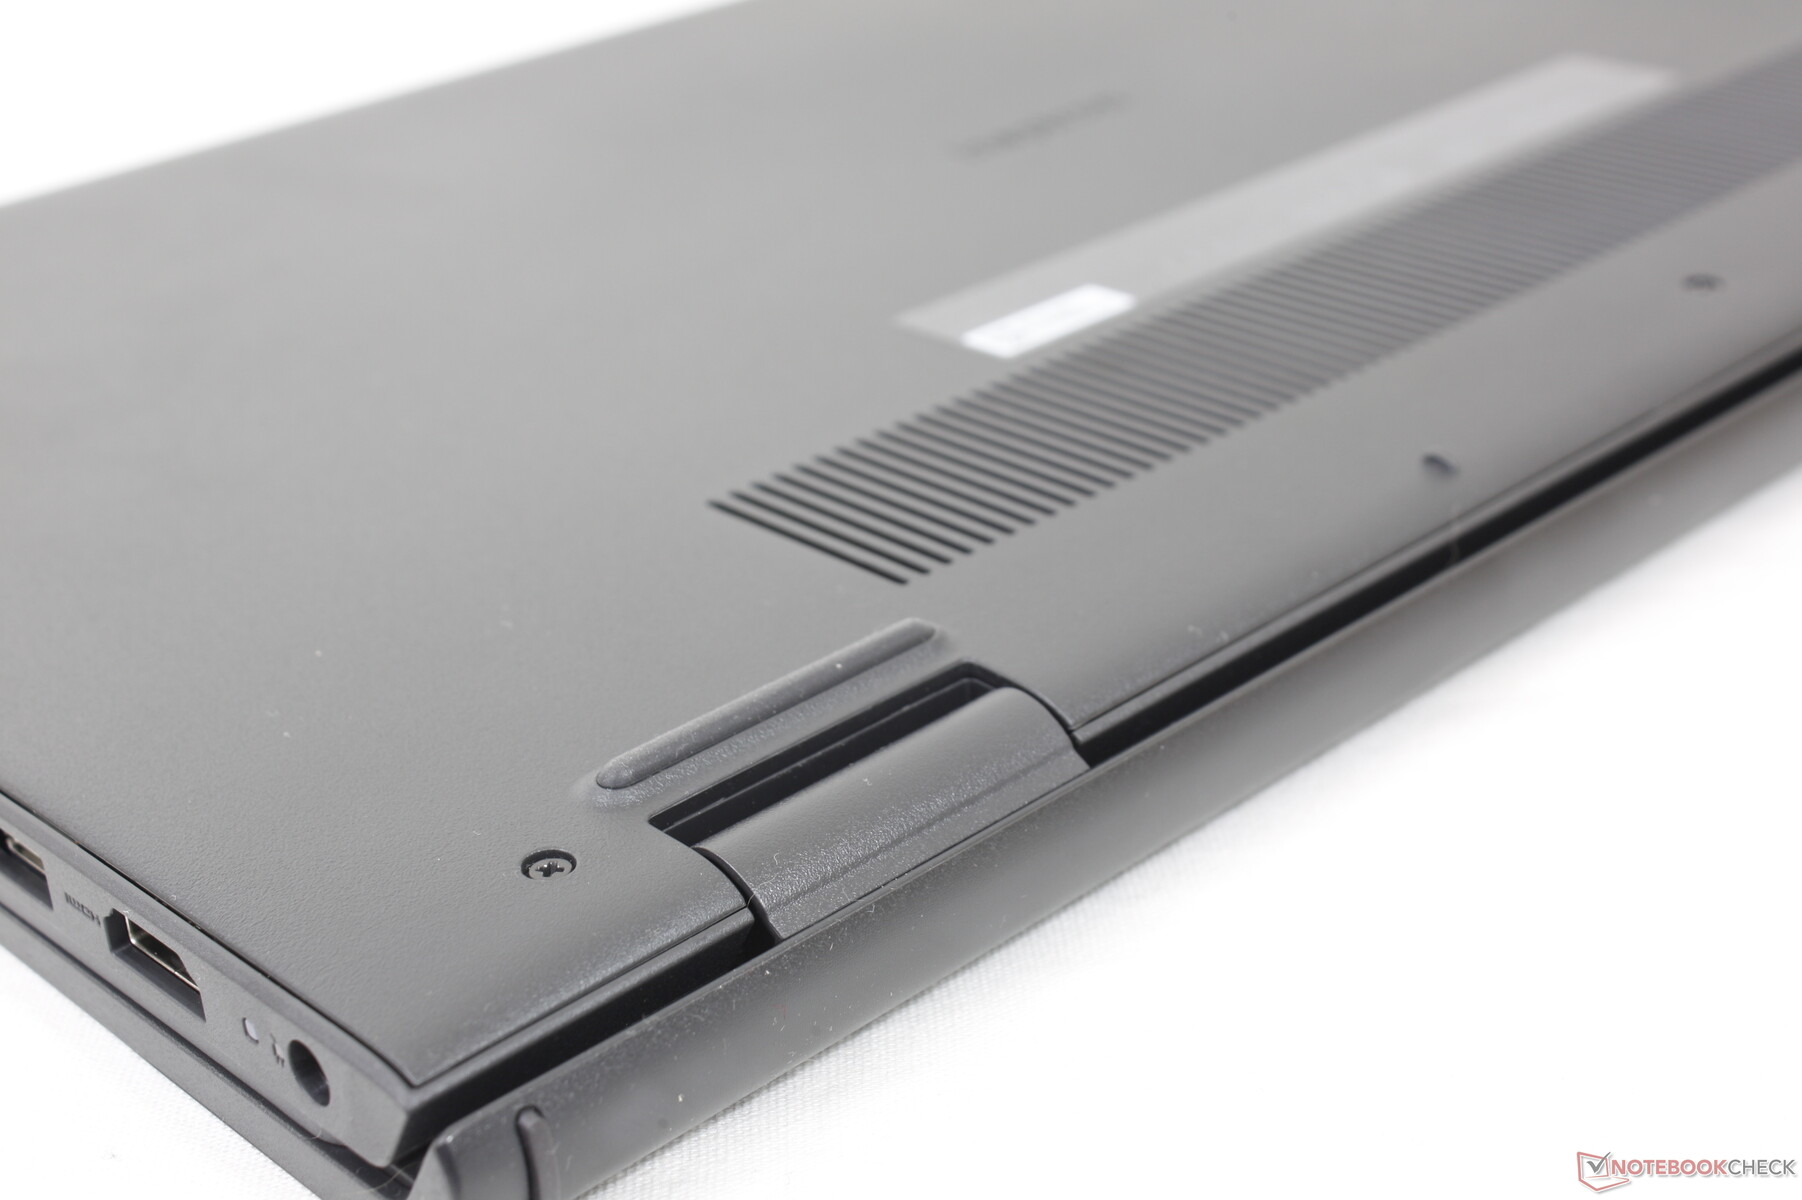
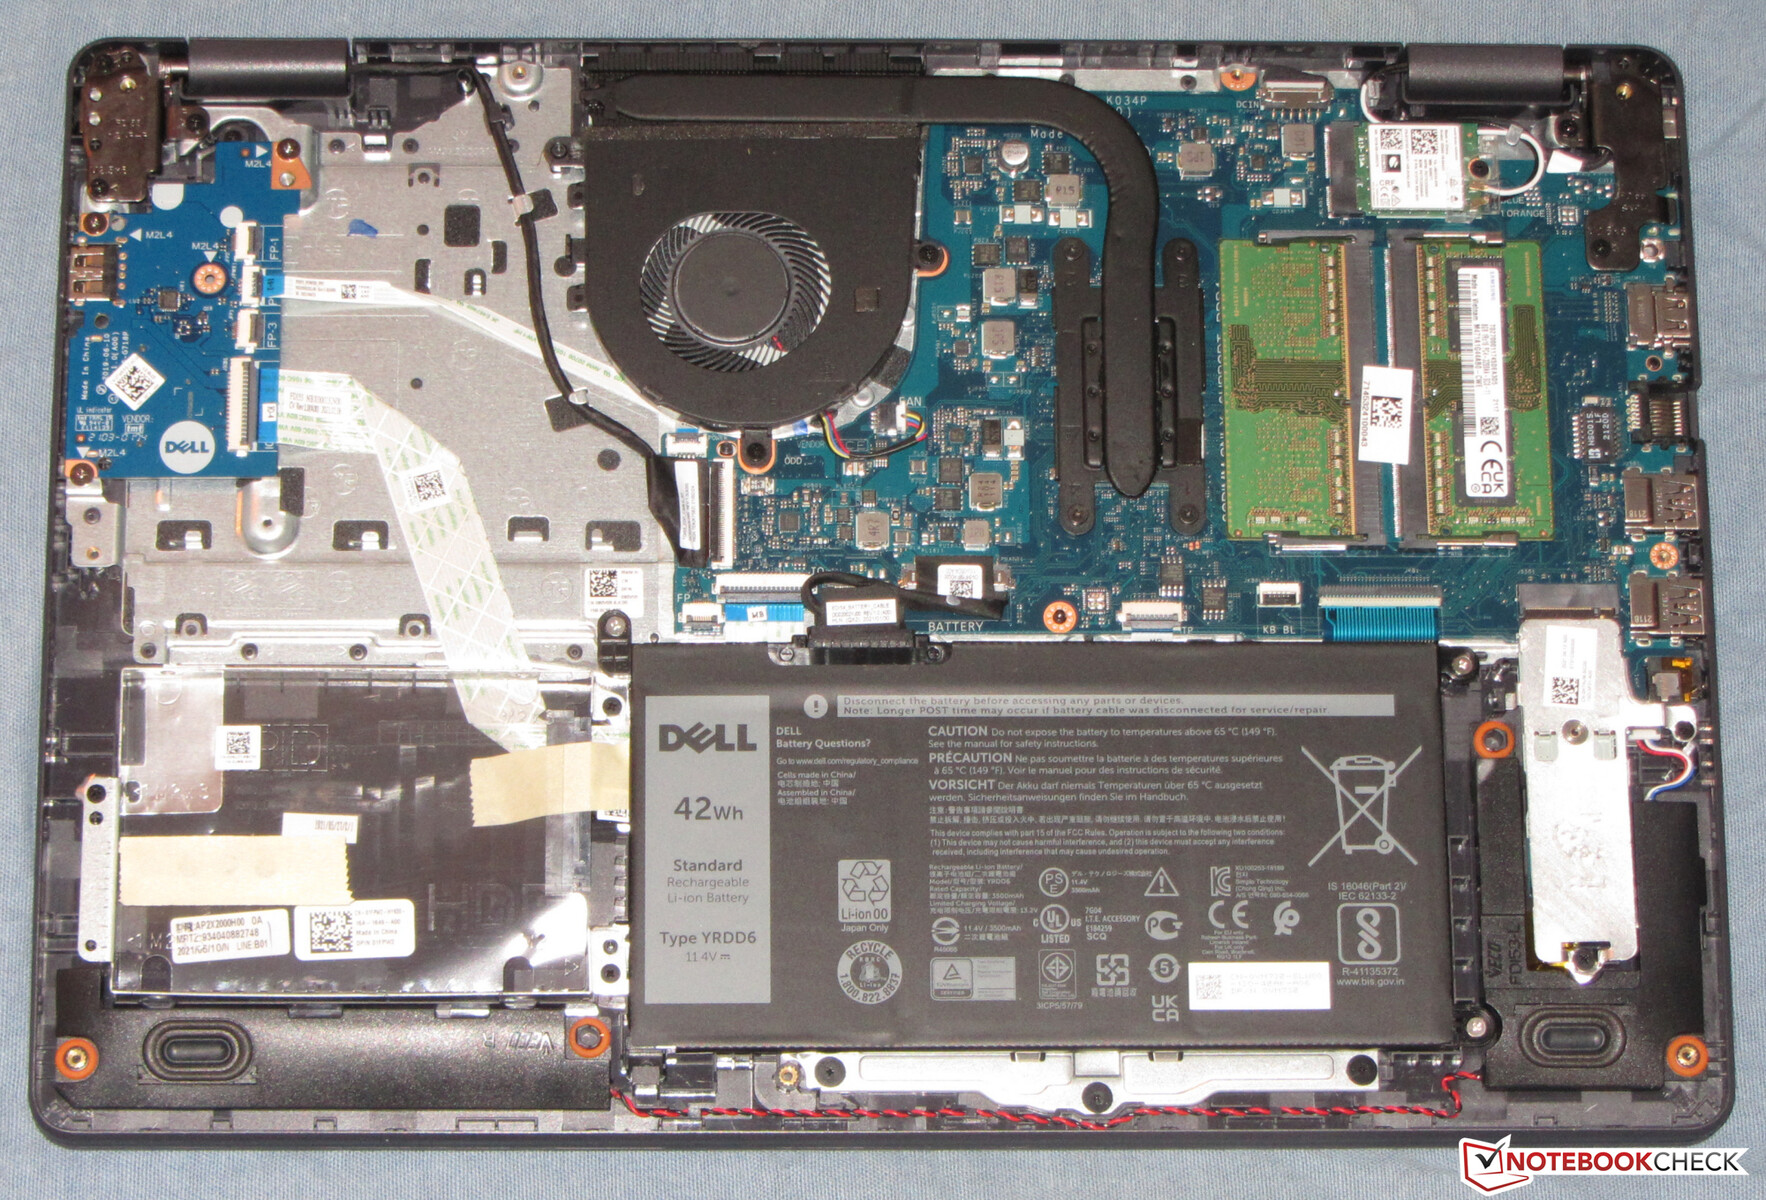
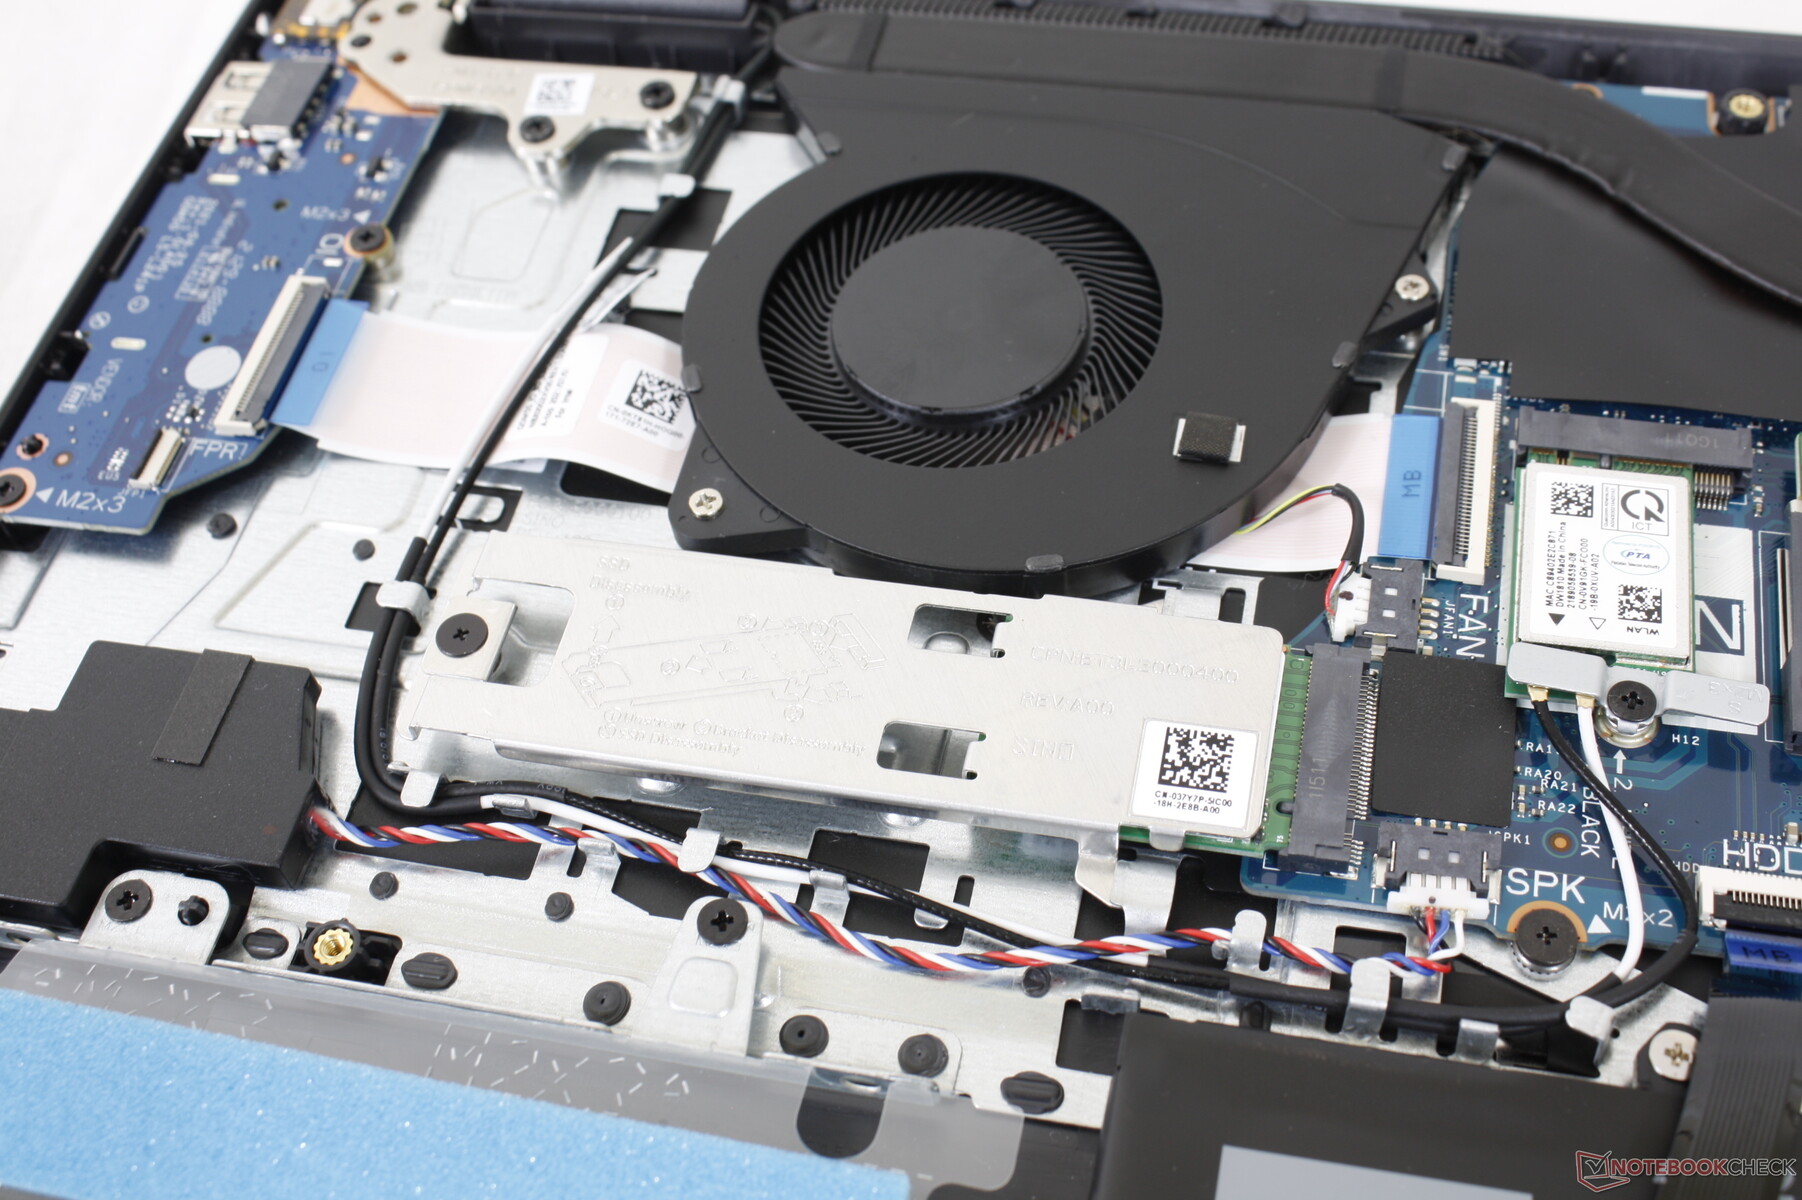
Il pannello inferiore si stacca più facilmente del previsto, specialmente per un modello così economico. Gli utenti hanno accesso diretto ai due alloggiamenti per lo storage, due slot SODIMM, il modulo WLAN e la maggior parte dei componenti principali.
Accessori e garanzia
Non ci sono extra nella scatola, a parte l'adattatore AC e la documentazione. Si applica la garanzia limitata standard di un anno del produttore
Dispositivi di input
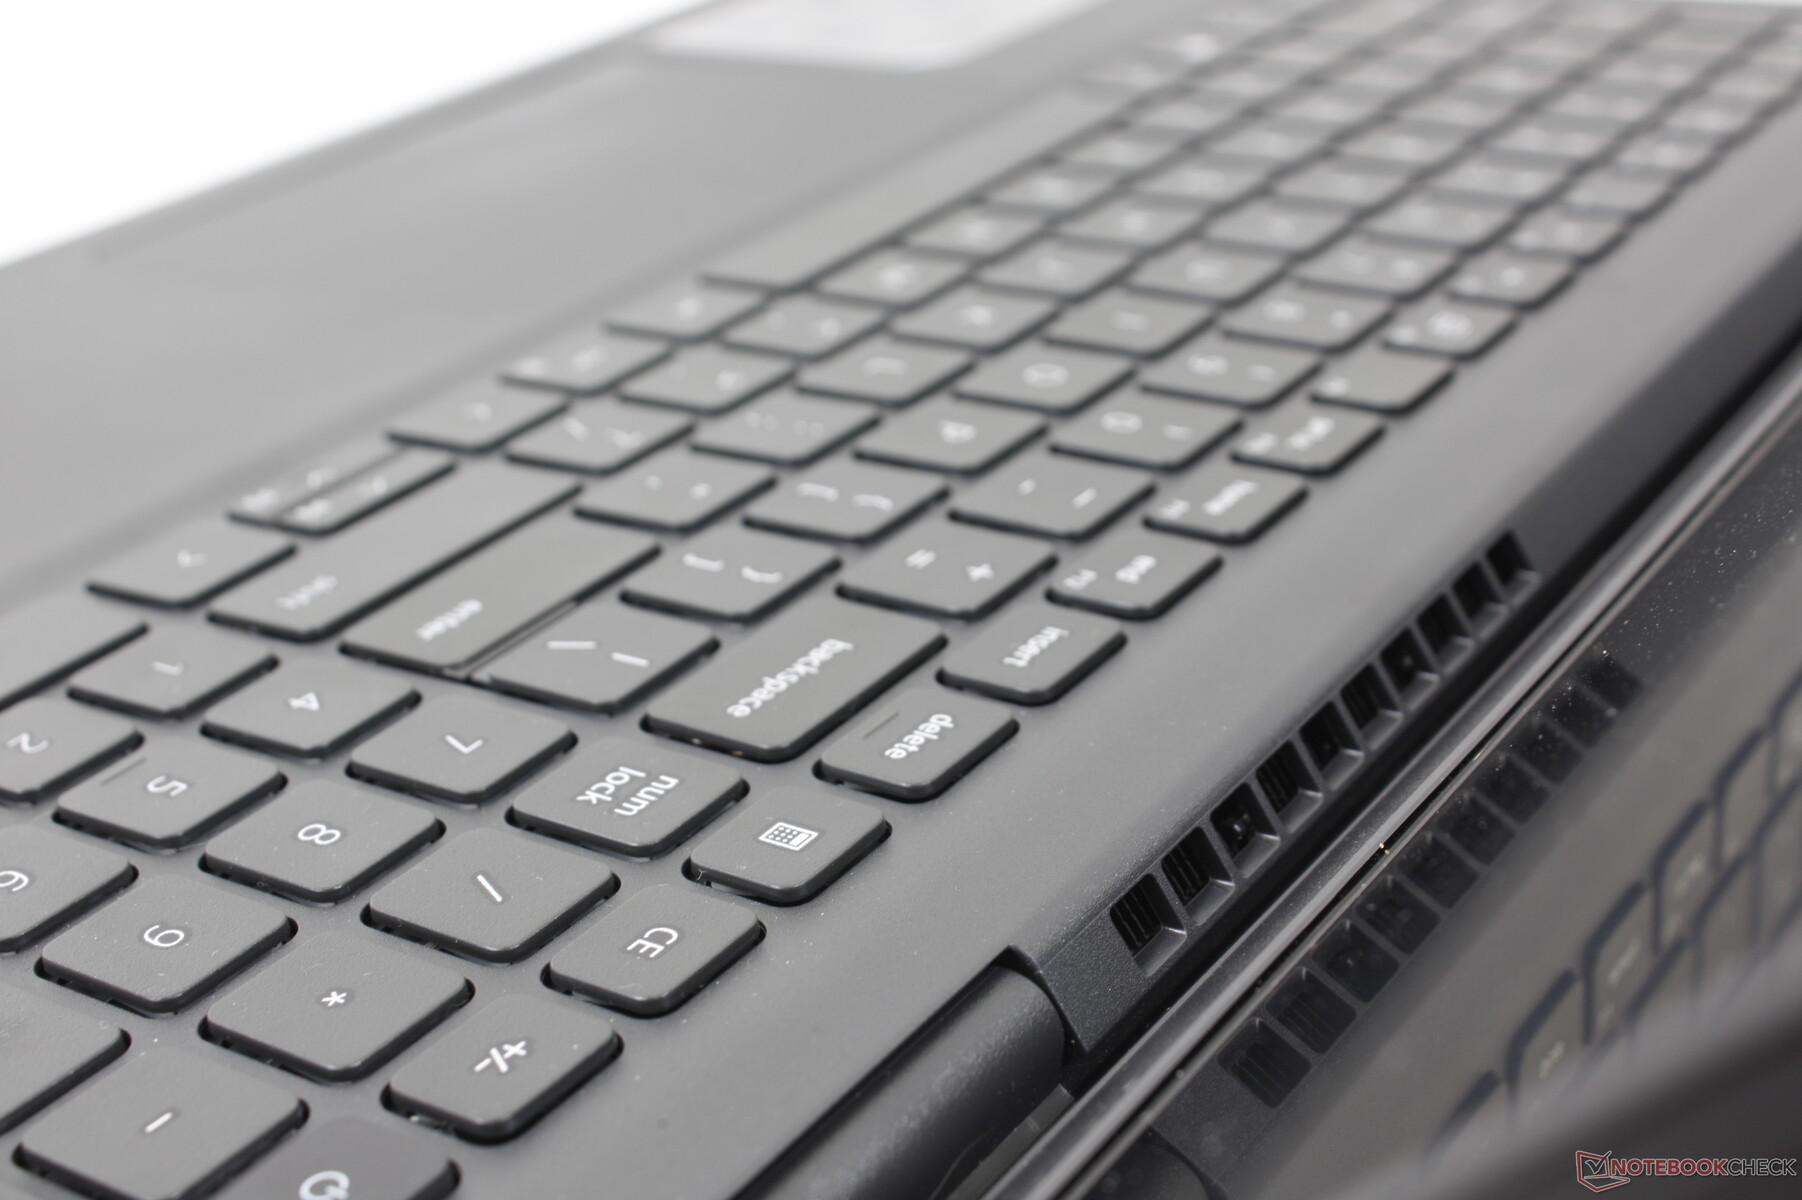
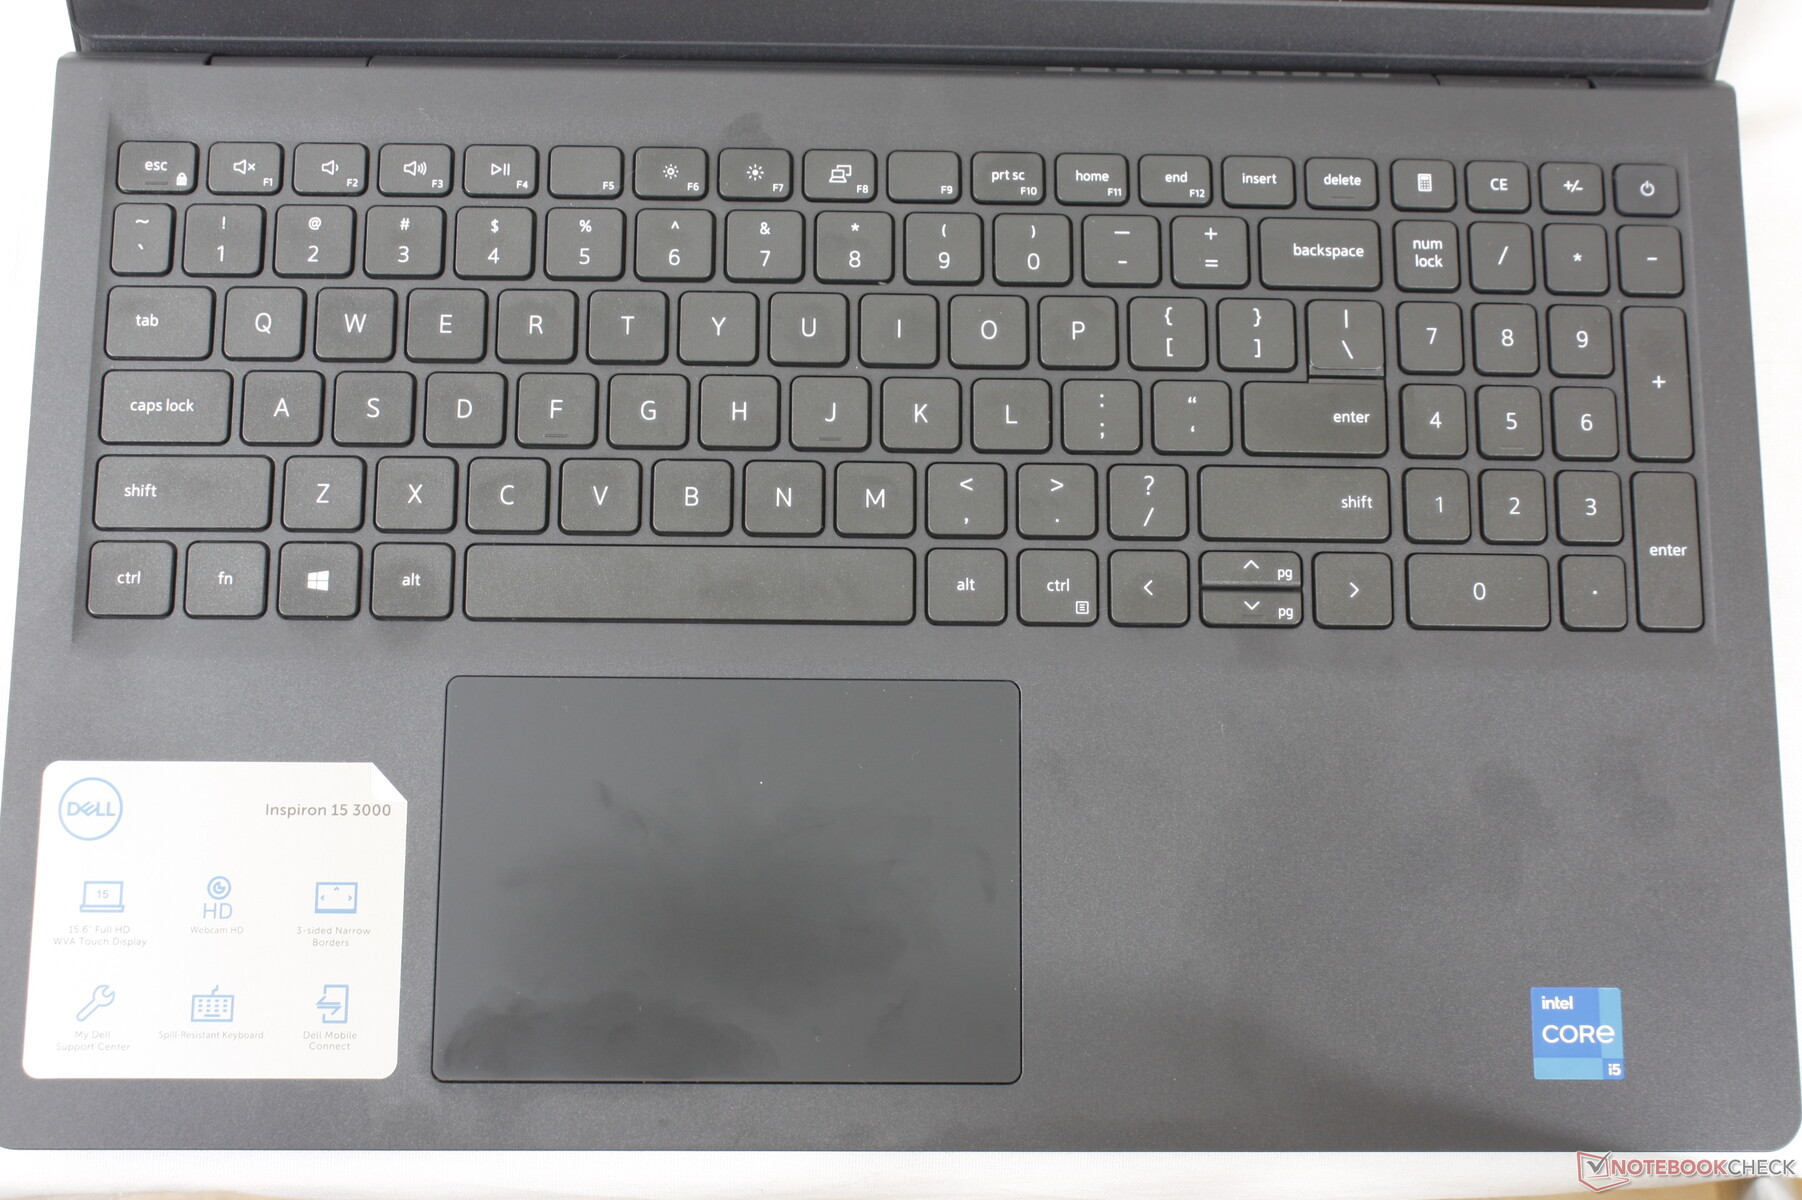
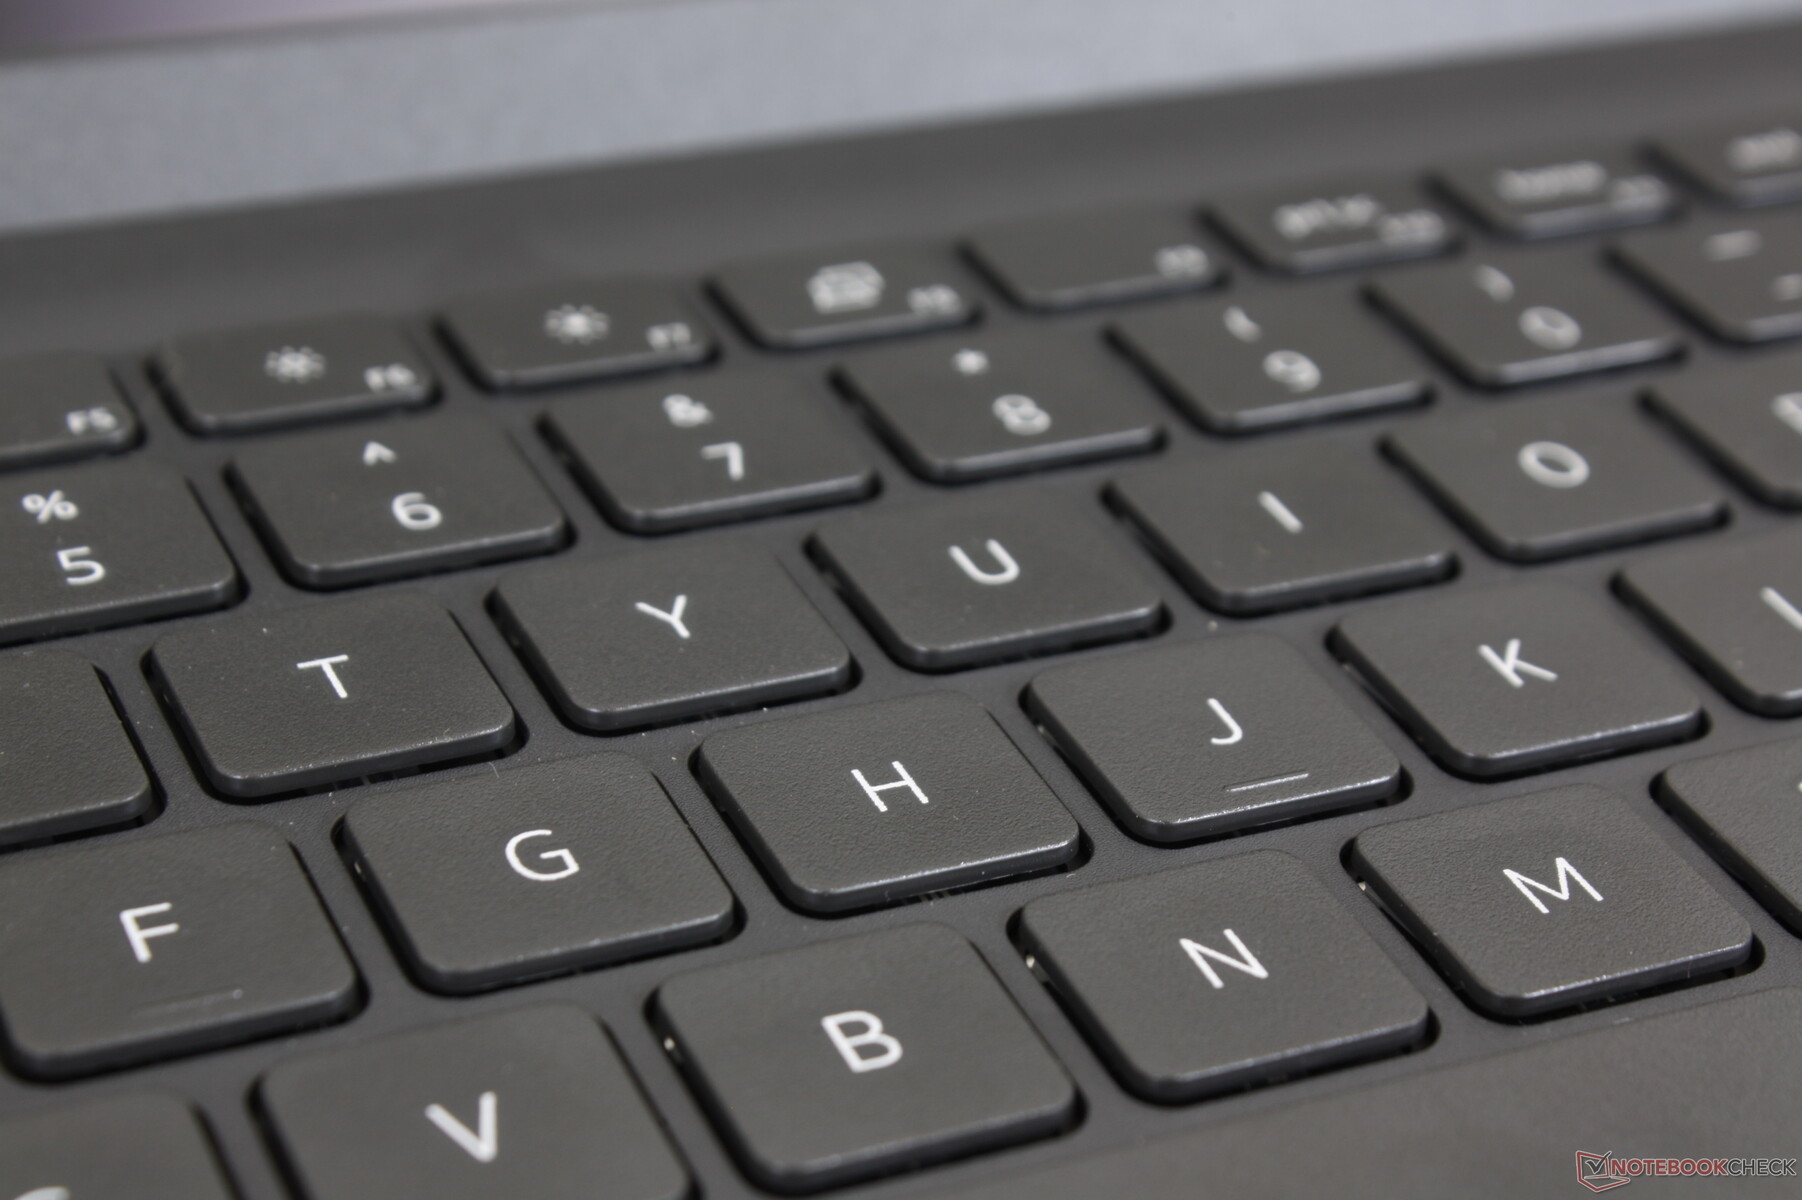
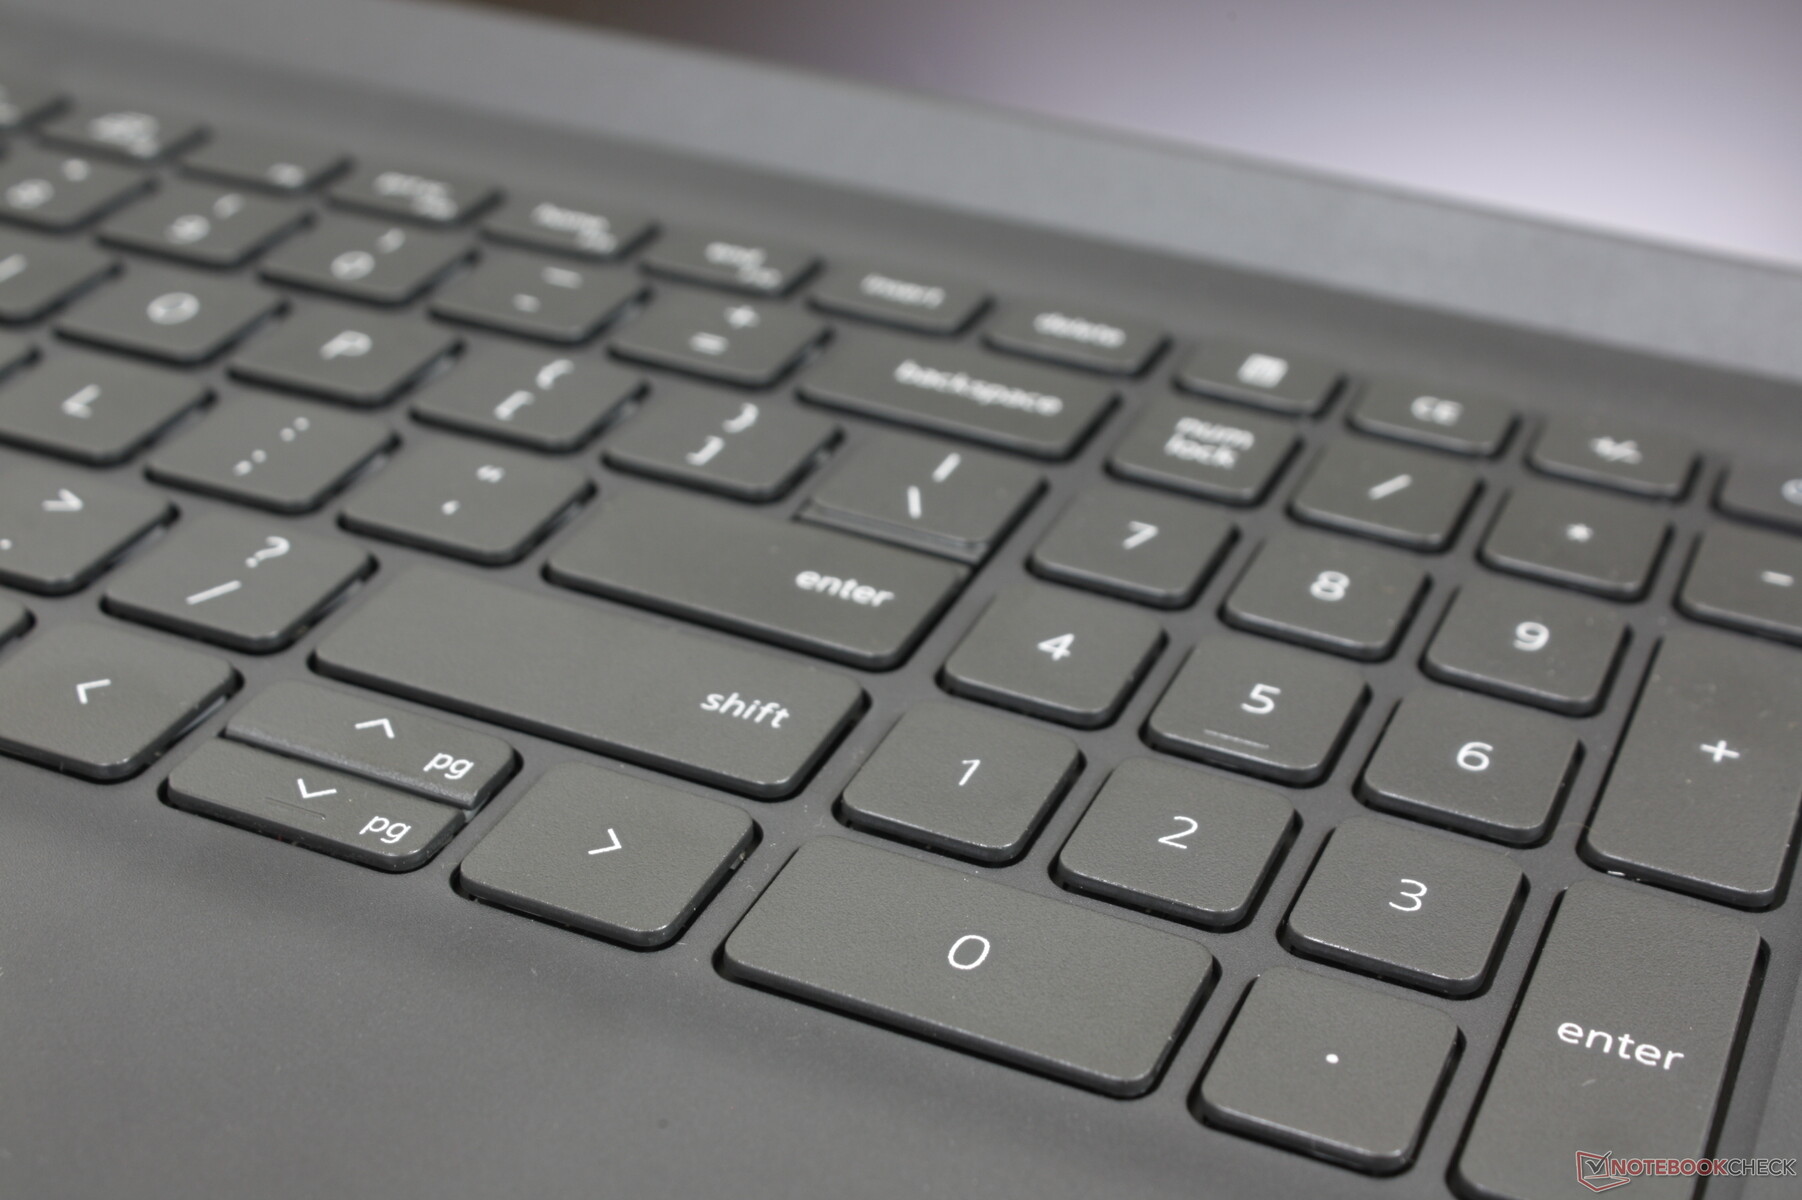
Tastiera
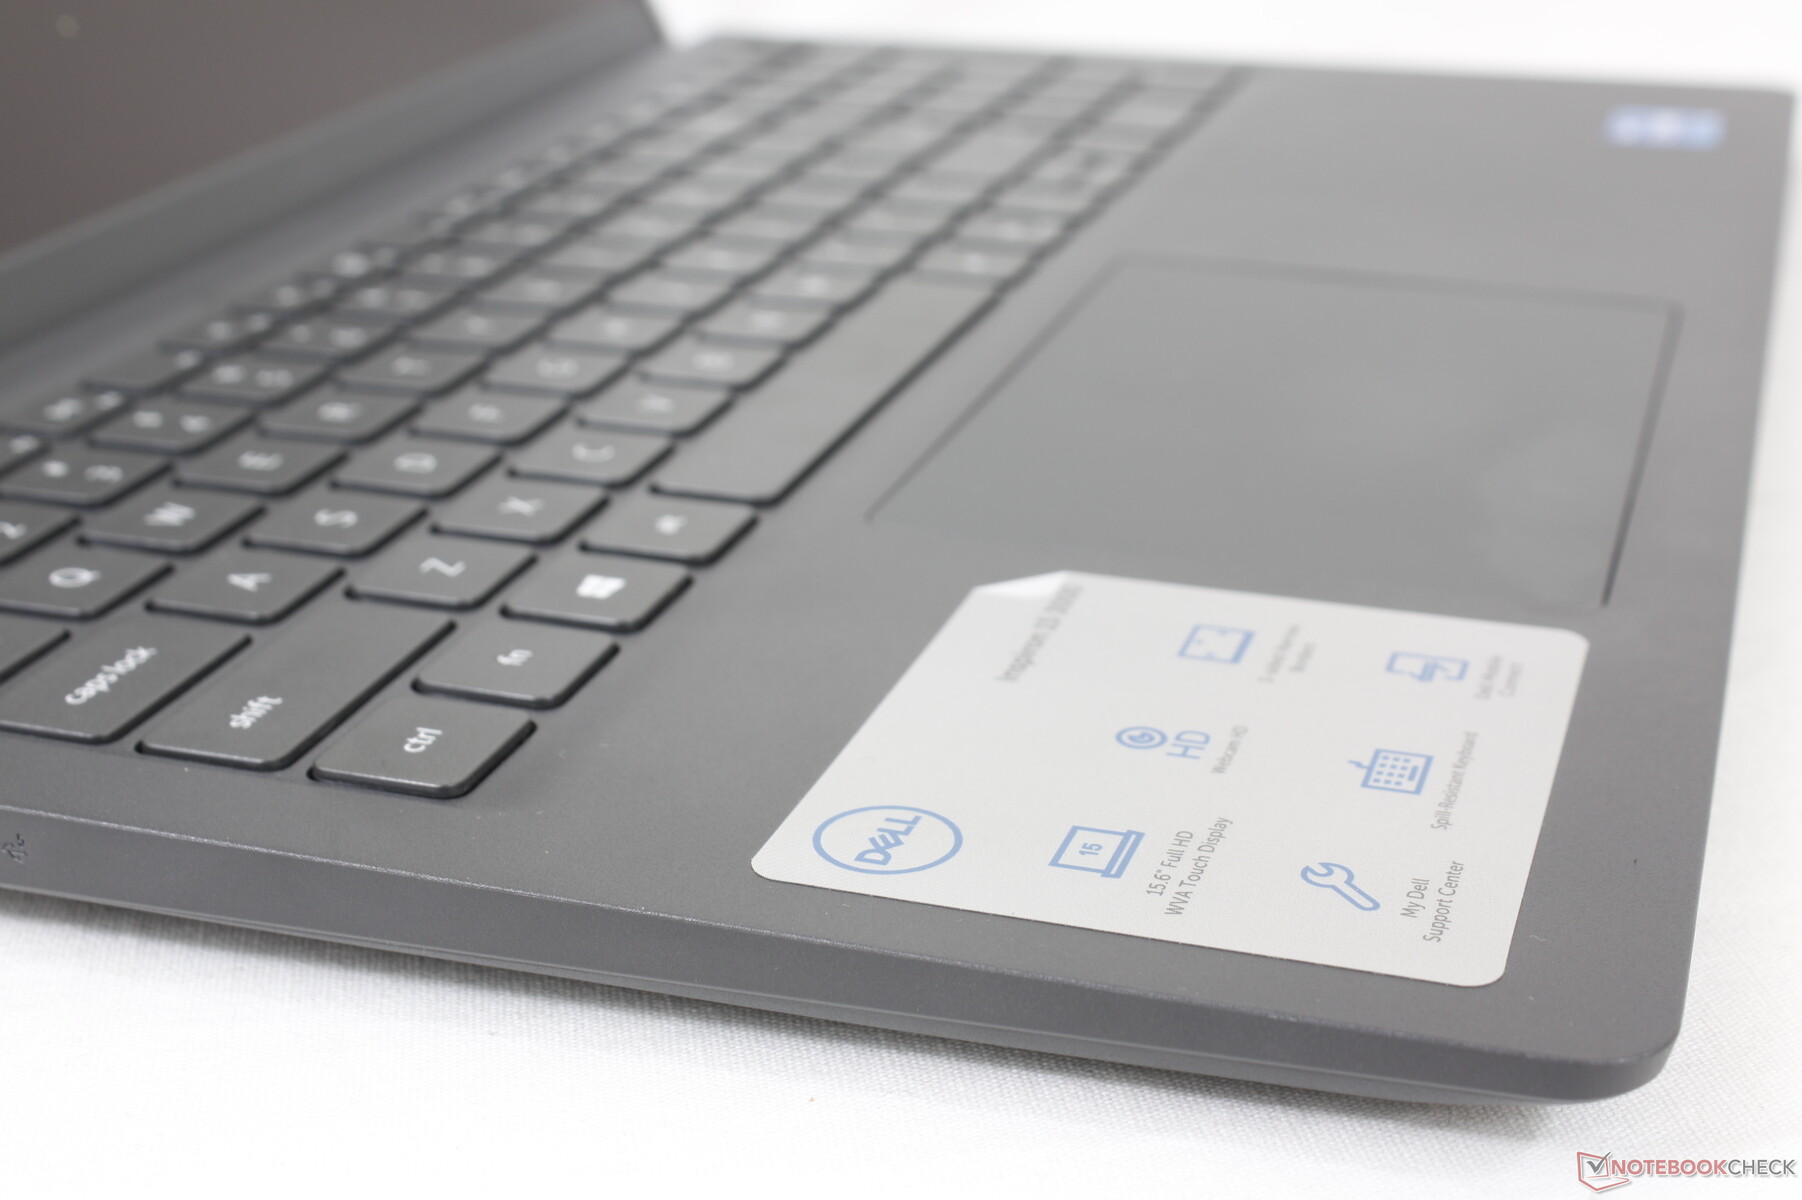
Il feedback dei tasti è un po' più leggero e morbido del previsto per una sensazione spugnosa. I tasti Spazio e Invio in particolare si sentono più deboli di quanto dovrebbero essere se paragonati agli stessi tasti su un HP Pavilion, Lenovo IdeaPad, o Asus VivoBook.
La retroilluminazione della tastiera non è disponibile.
Touchpad
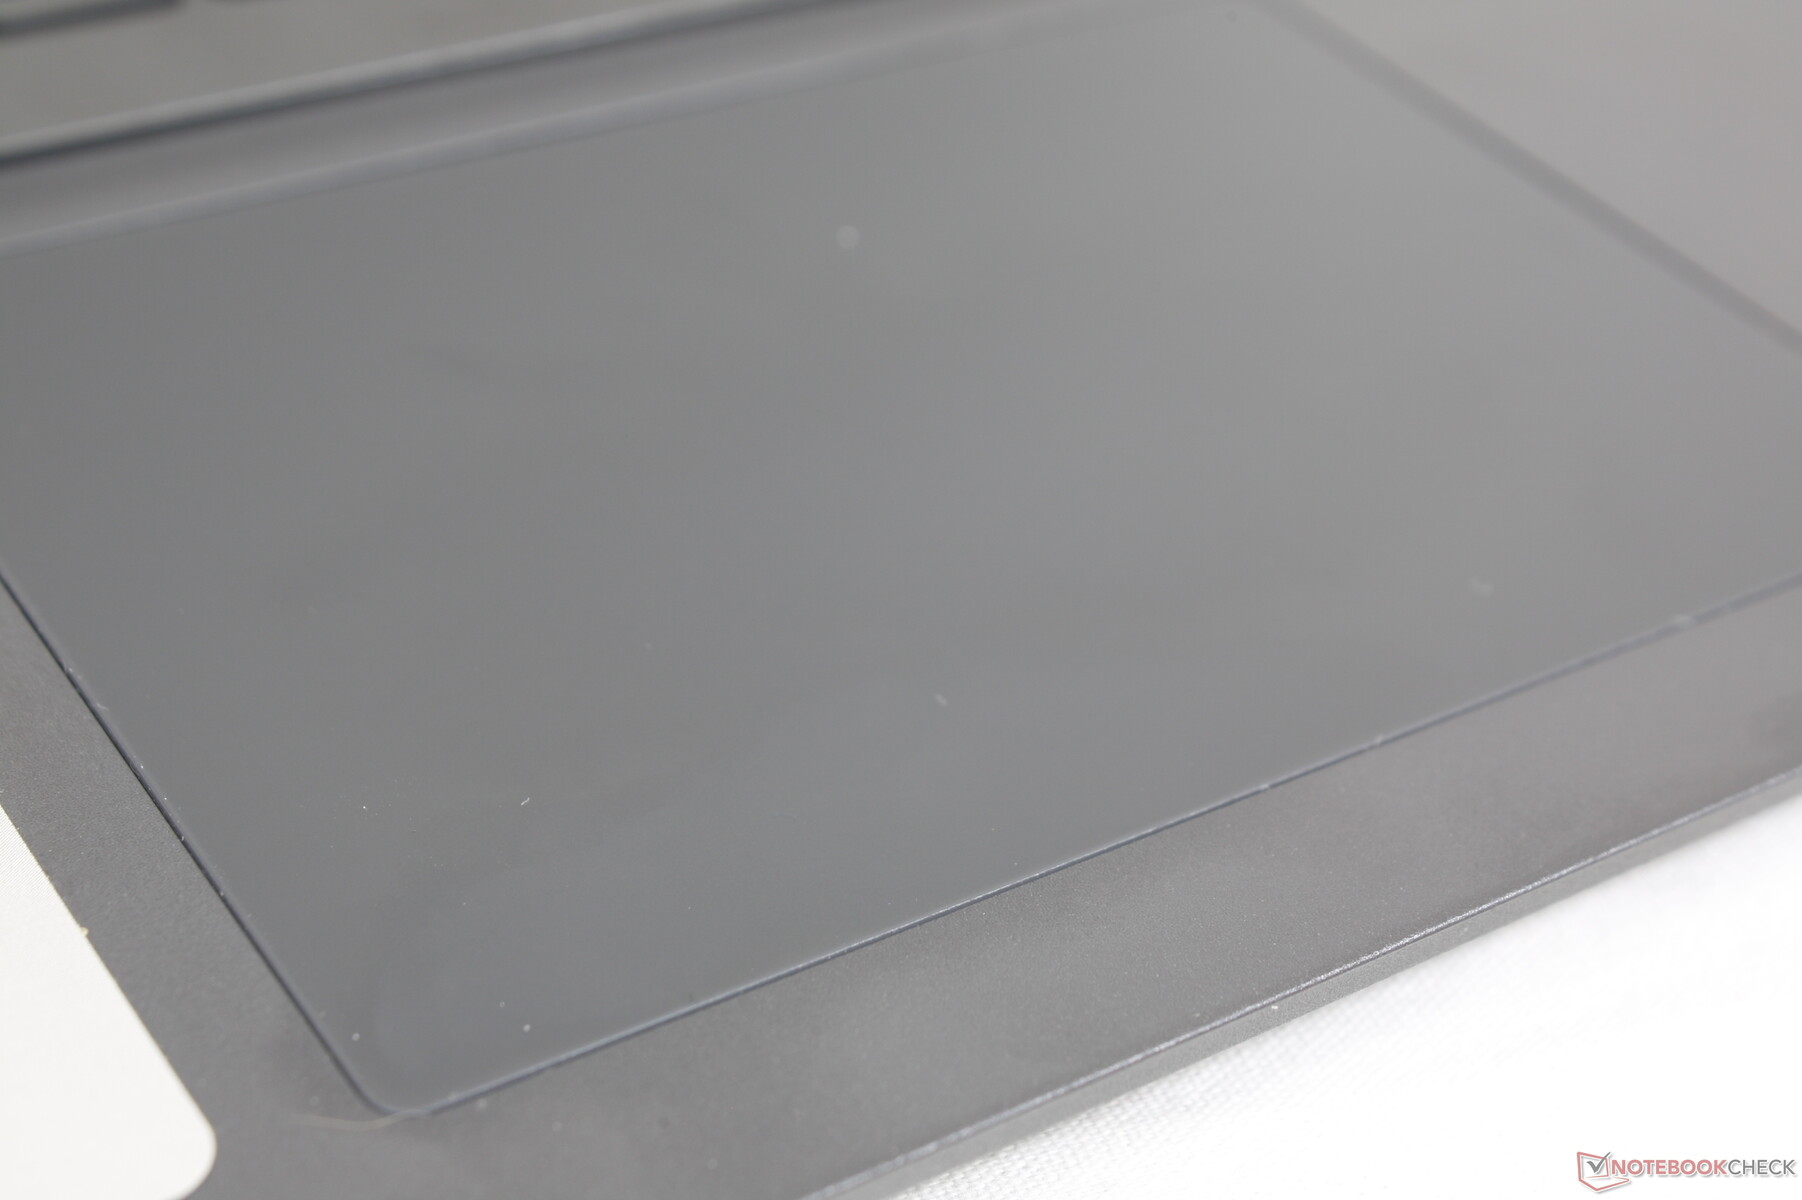
Il clickpad è relativamente grande a 11,5 x 8 cm rispetto a 10,5 x 7,3 cm sul Asus Vivobook 15 K513EQ o 11,5 x 7,4 cm sull'HP Pavilion 15 del 2021. La sua superficie è più appiccicosa che su molti altri clickpads, in particolare quando si scivola a velocità lente o medio-lente. È abbastanza affidabile per il controllo regolare del cursore, ma altre azioni come cliccare o trascinare e rilasciare possono essere faticose senza pulsanti reali o un mouse USB.
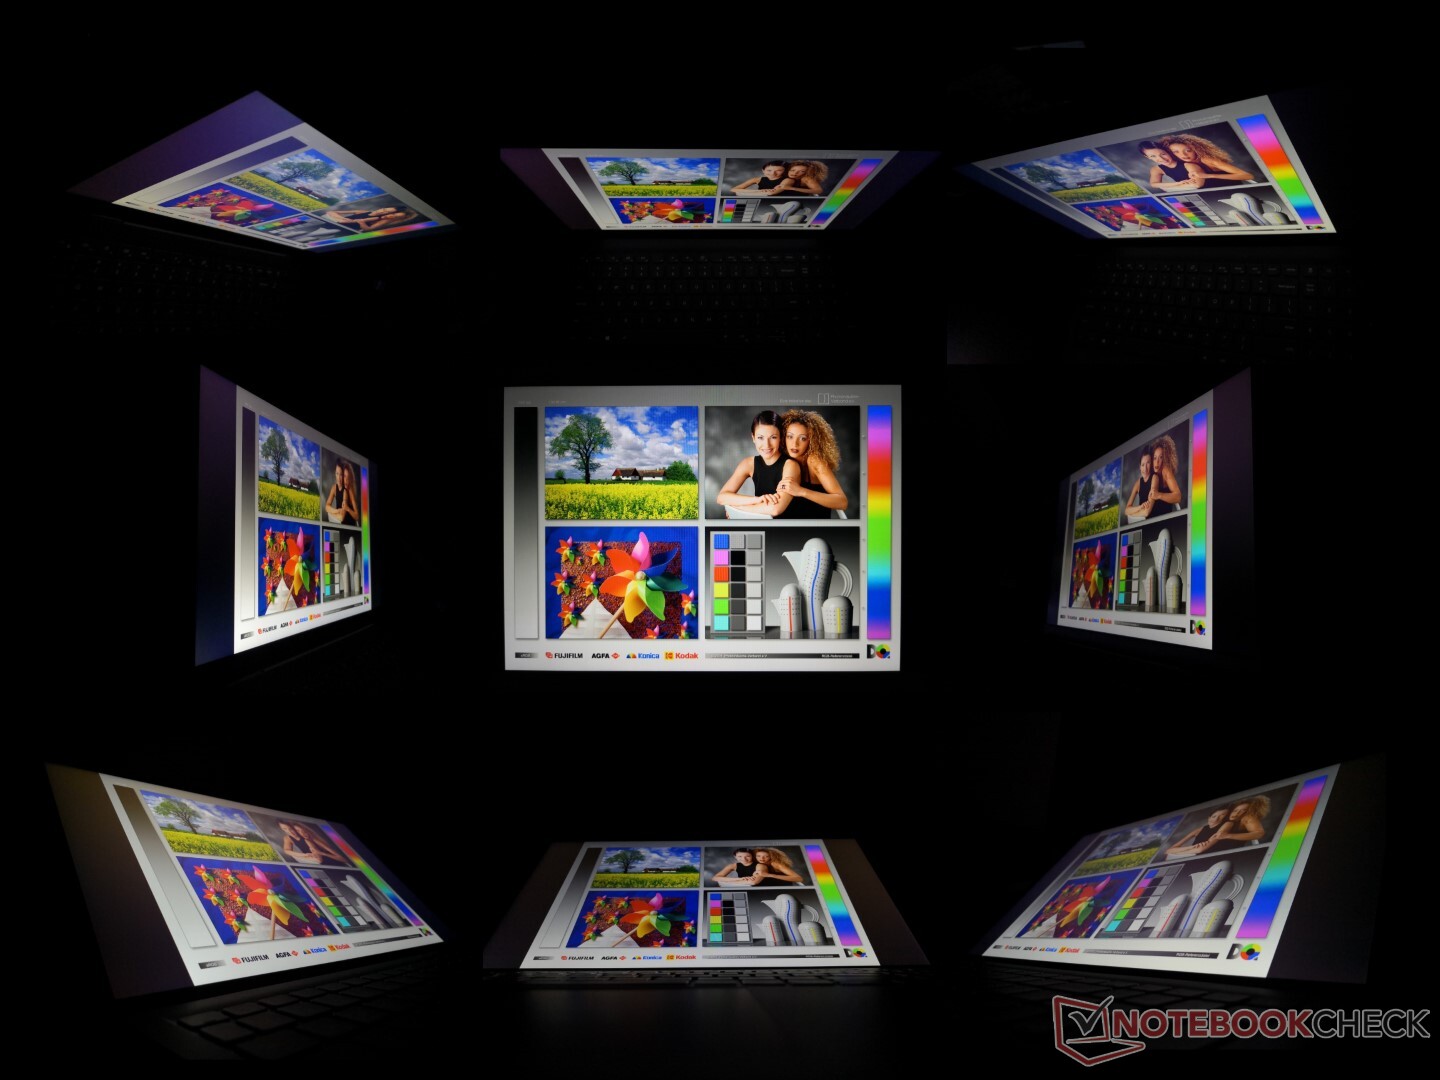
Visualizza
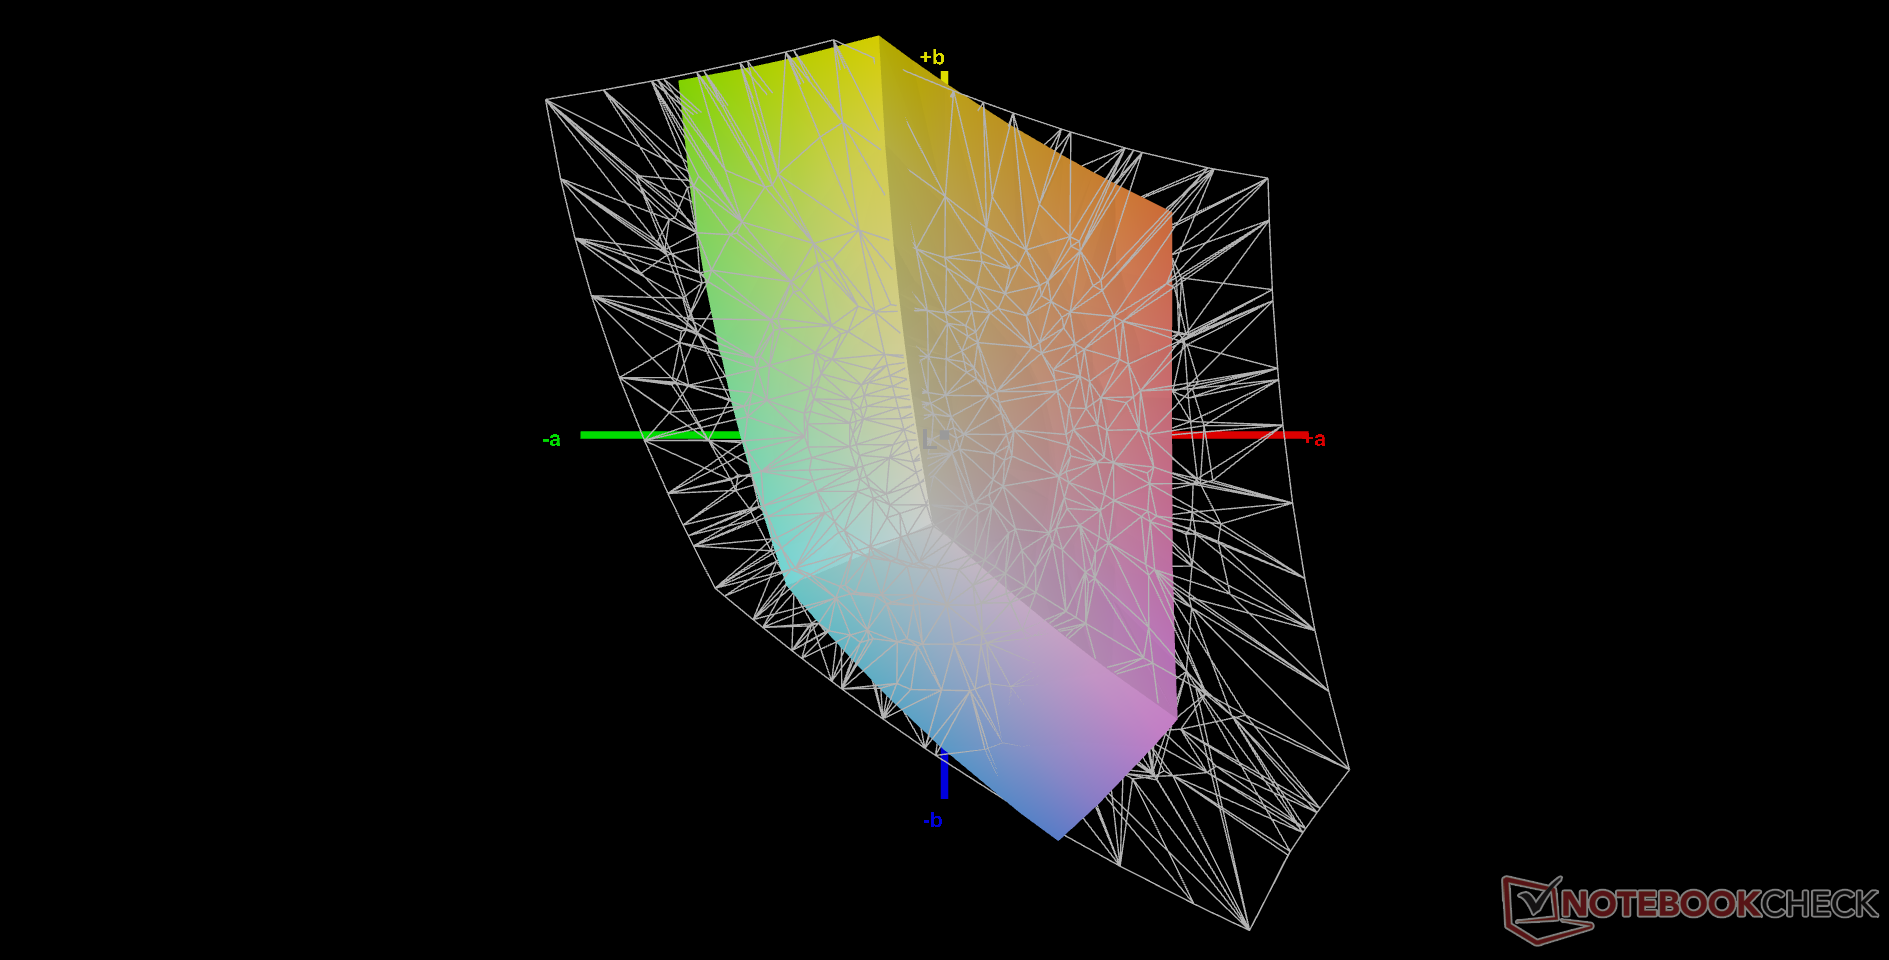
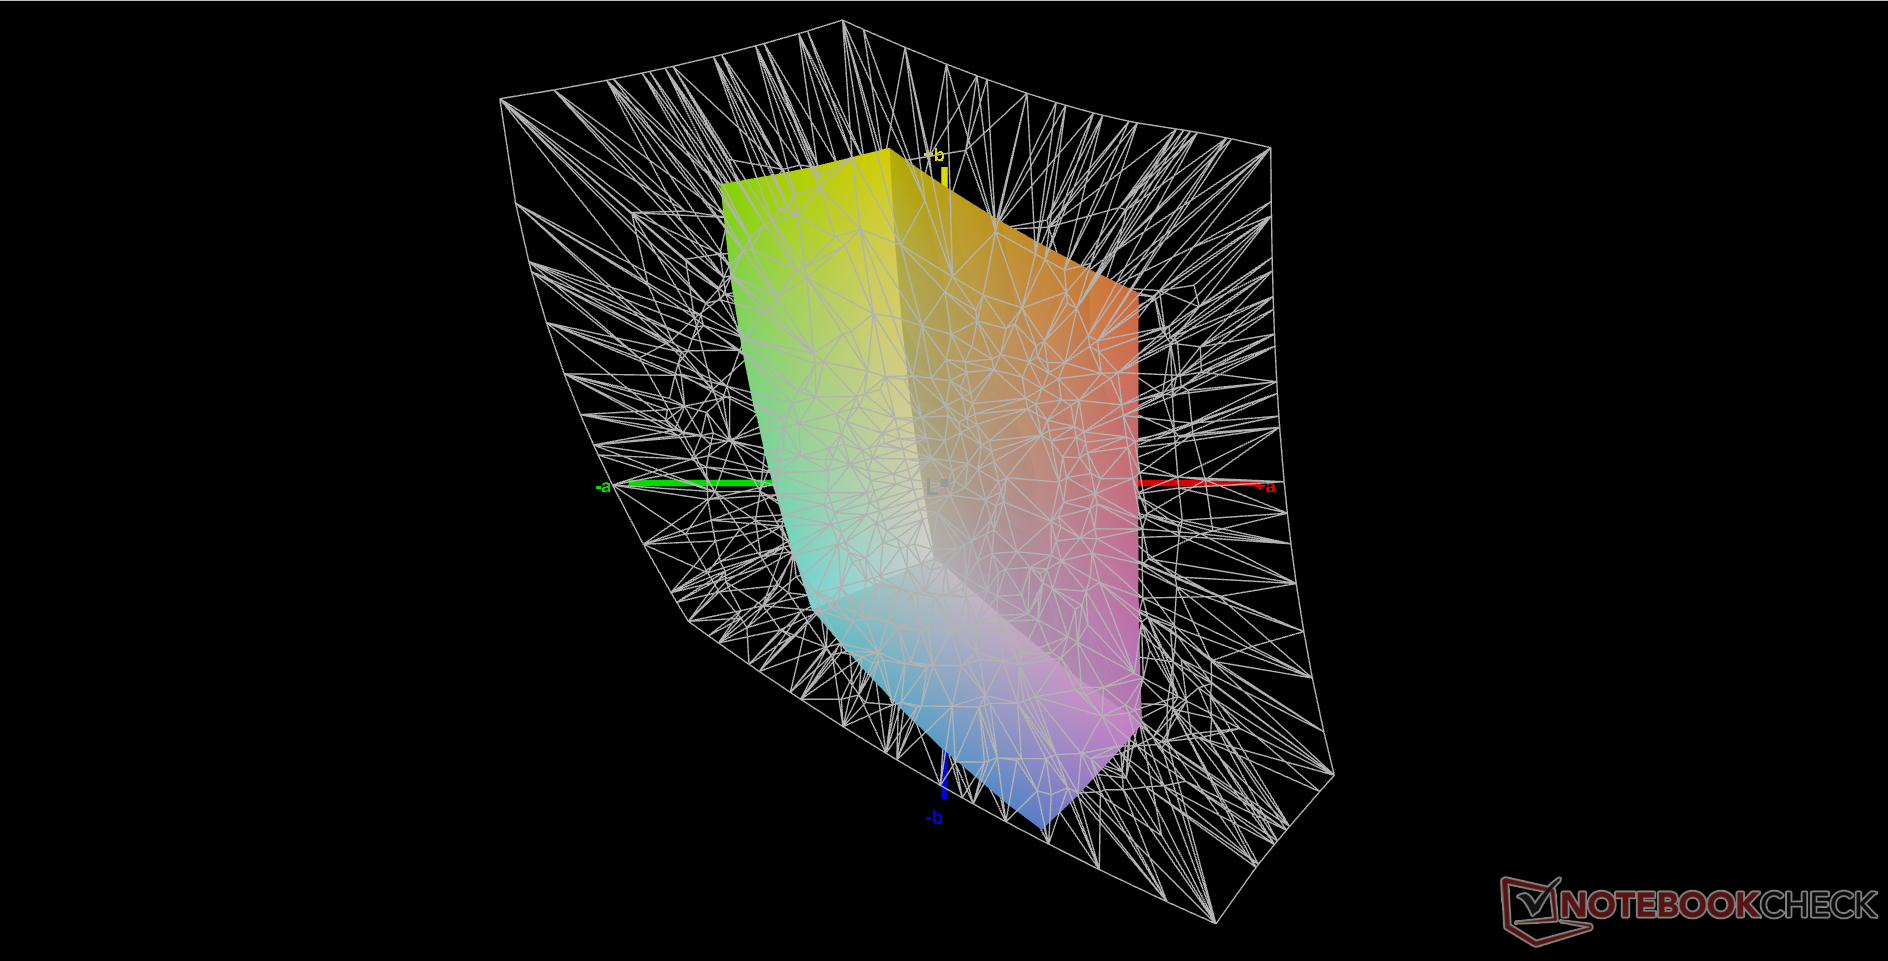
L'Inspiron 15 3511 utilizza un pannello BOE diverso da quello che si trova sul vecchio Inspiron 15 3501 (BOE NV15T06 contro BOE NV15N3D). Nonostante questo, gli attributi di base sono in gran parte invariati, compreso lo spazio colore molto stretto. Il rapporto di contrasto e i tempi di risposta sono in realtà abbastanza decenti per un portatile economico, ma la limitata riproduzione sRGB in particolare è ciò che in definitiva separa questo display Inspiron da un più costoso XPS, Spectre o ZenBook. I colori appaiono meno profondi e non così vividi, il che è normale per la maggior parte dei portatili economici.


| |||||||||||||||||||||||||
Distribuzione della luminosità: 87 %
Al centro con la batteria: 206.8 cd/m²
Contrasto: 1142:1 (Nero: 0.21 cd/m²)
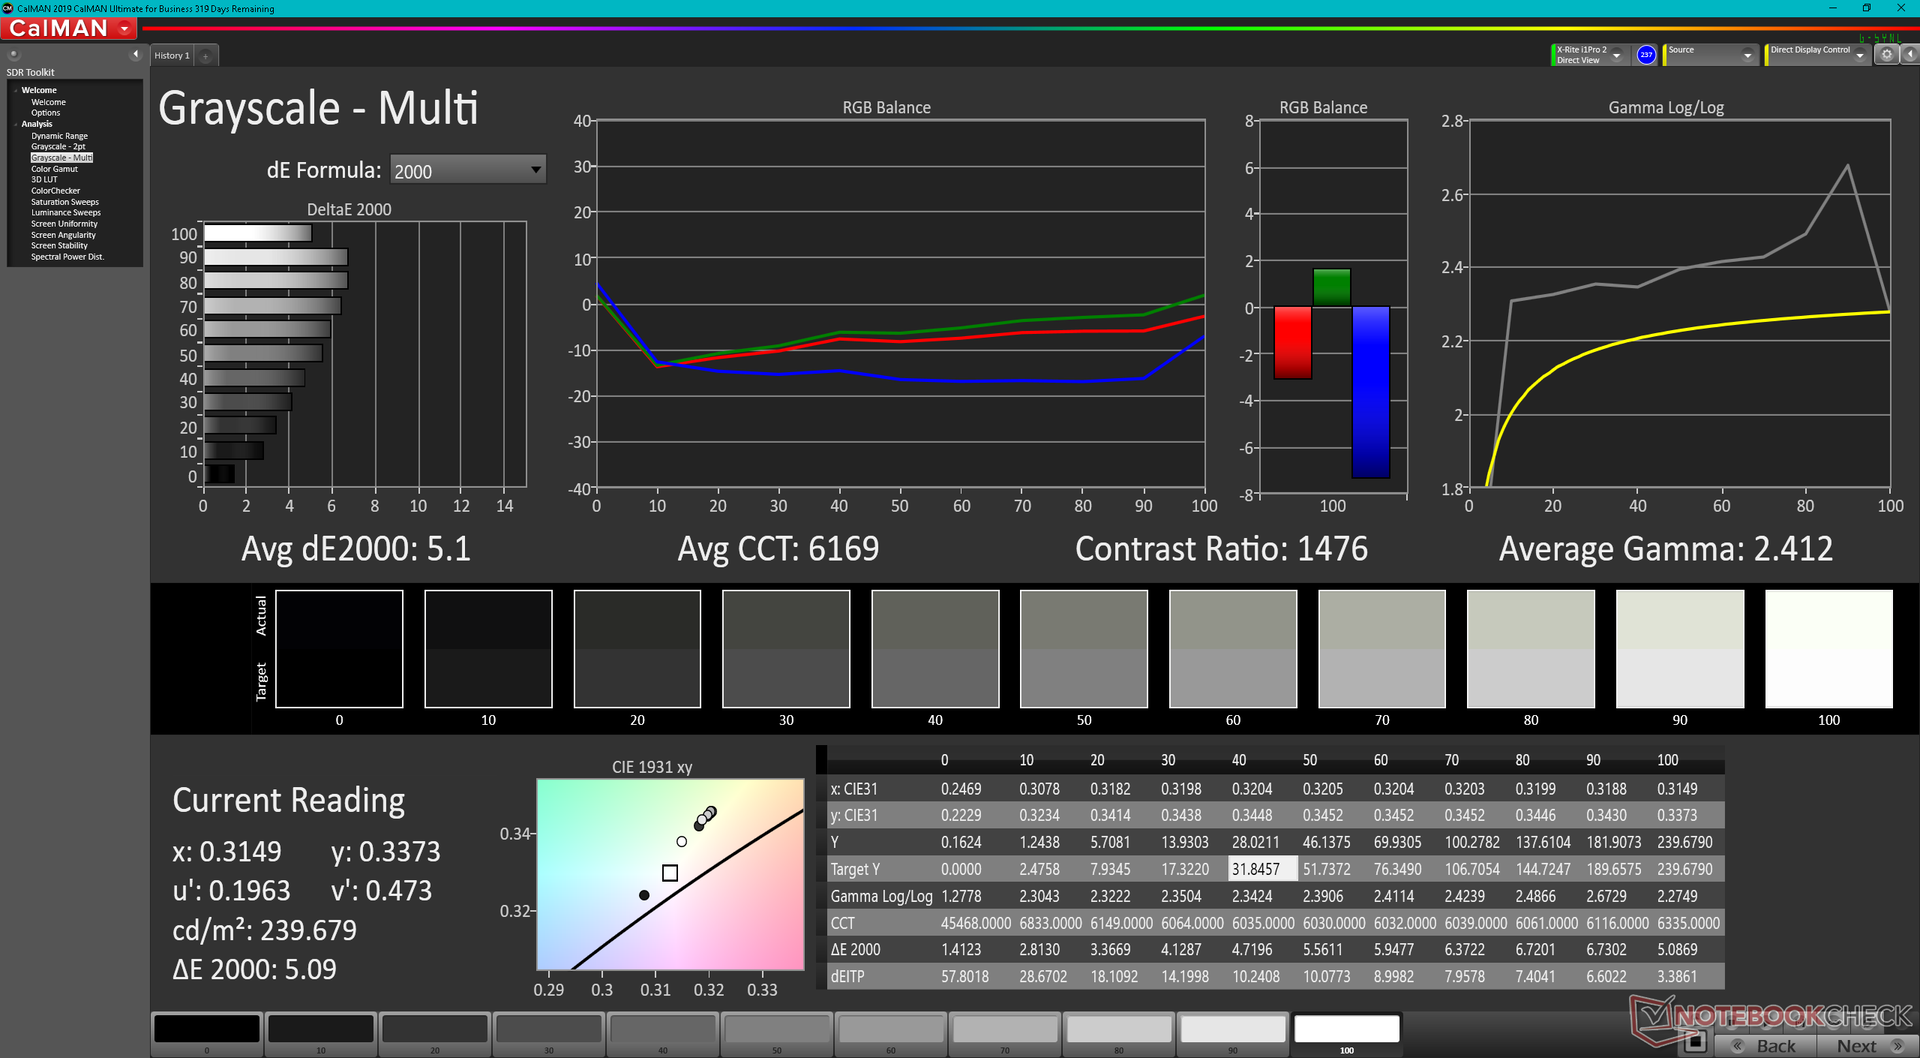
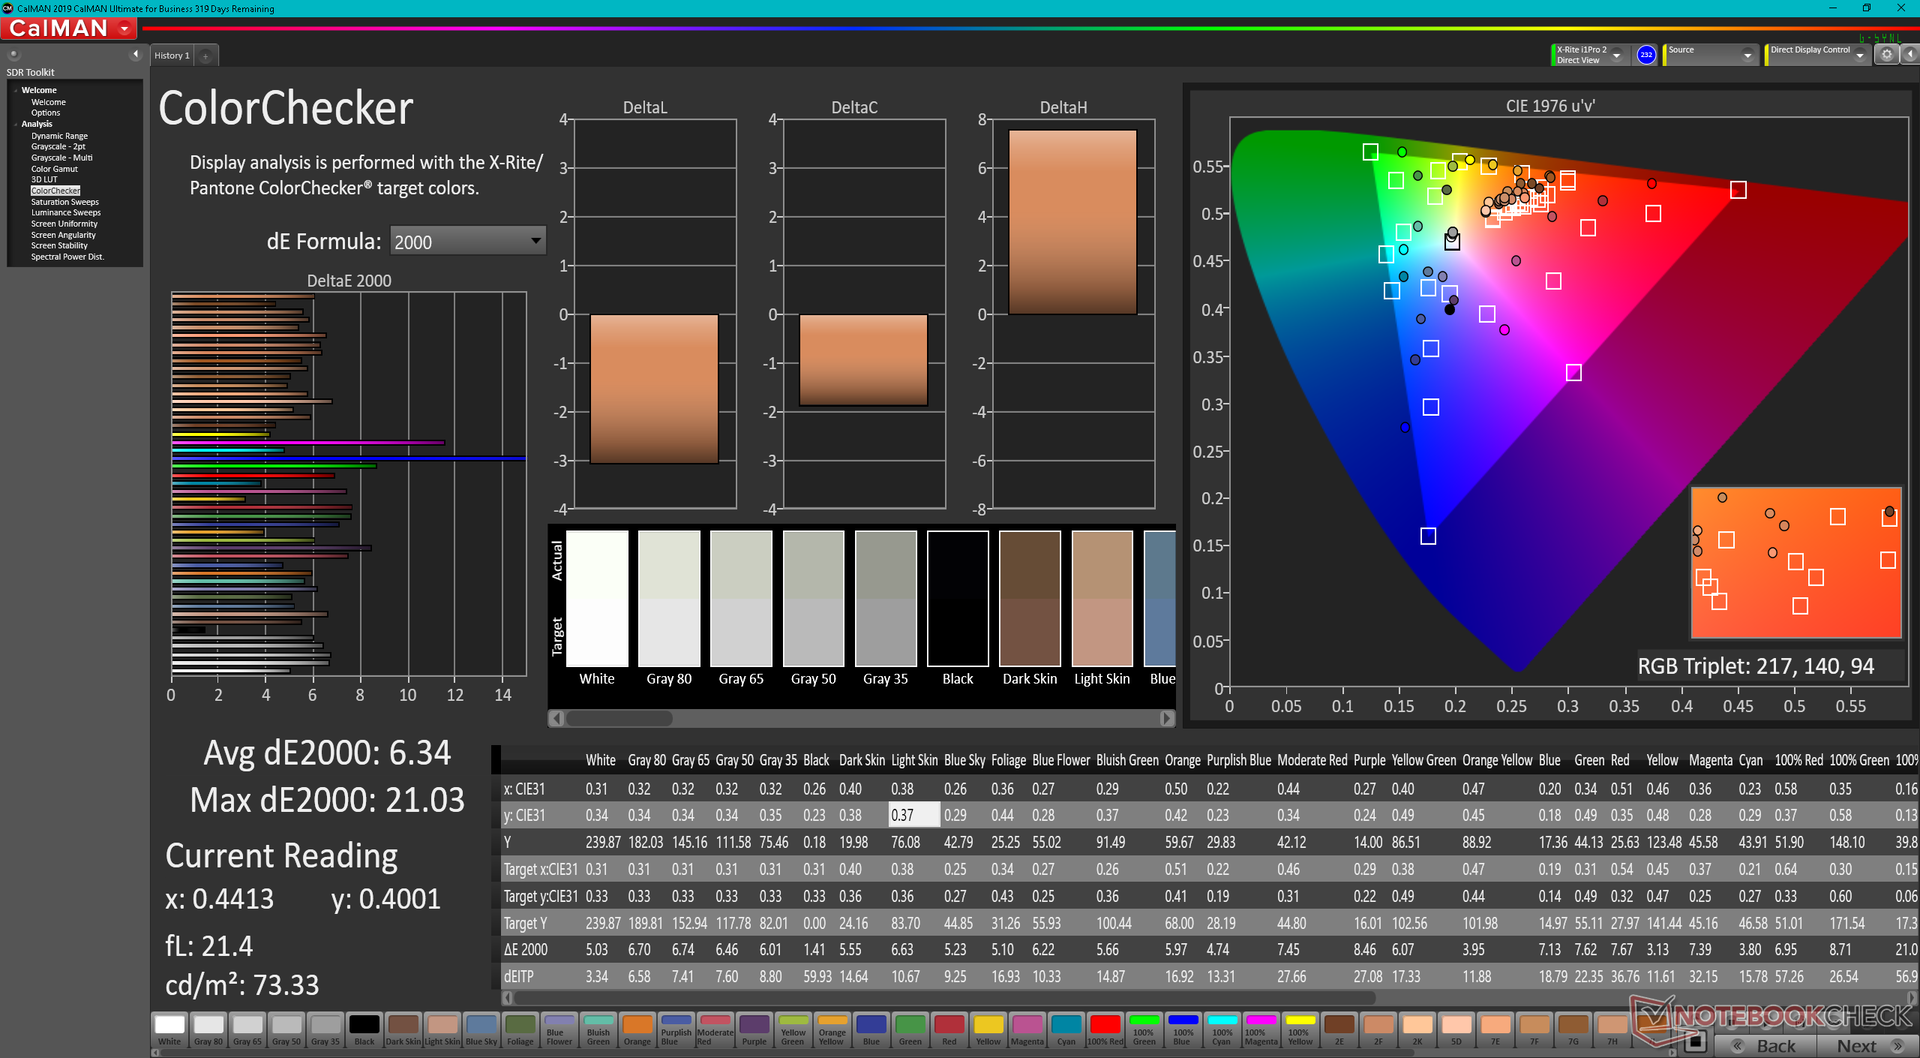
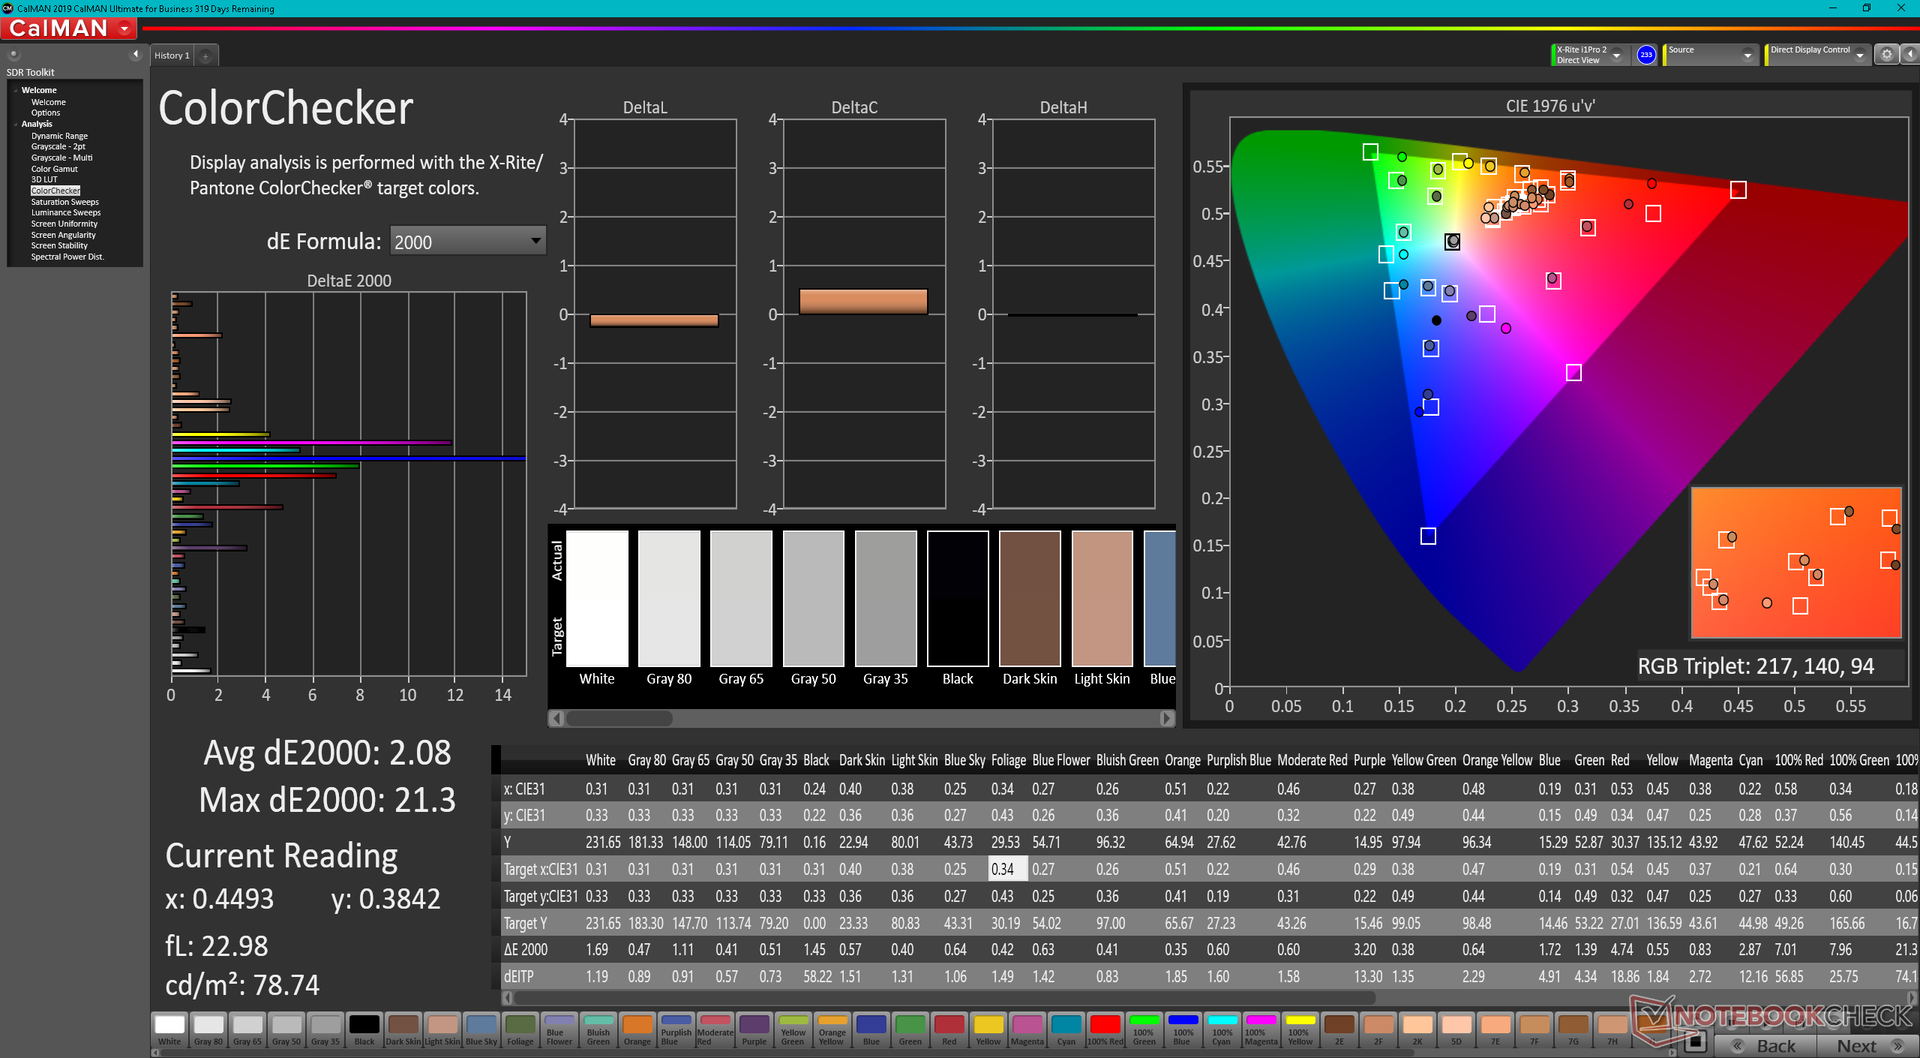
ΔE ColorChecker Calman: 6.34 | ∀{0.5-29.43 Ø4.71}
calibrated: 2.08
ΔE Greyscale Calman: 5.1 | ∀{0.09-98 Ø4.96}
41.5% AdobeRGB 1998 (Argyll 3D)
58.8% sRGB (Argyll 3D)
40.1% Display P3 (Argyll 3D)
Gamma: 2.41
CCT: 6169 K
| Dell Inspiron 15 3000 3511 BOE NV15T06, IPS, 1920x1080, 15.6" | Dell XPS 15 9510 i5 11400H FHD Sharp LQ156N1, IPS, 1920x1200, 15.6" | Asus VivoBook S15 D533UA Chi Mei N156HCA-EAB, IPS, 1920x1080, 15.6" | Dell Inspiron 15 3501 BOE NV15N3D (Dell P/N: N39X1), IPS, 1920x1080, 15.6" | Lenovo IdeaPad 3 15ALC6 BOE CQ NV156FHM-T07, IPS, 1920x1080, 15.6" | HP Pavilion 15-eg Chi Mei CMN1523, IPS, 1920x1080, 15.6" | |
|---|---|---|---|---|---|---|
| Display | 88% | 9% | -1% | -1% | 8% | |
| Display P3 Coverage (%) | 40.1 | 80.9 102% | 43.6 9% | 39.4 -2% | 40 0% | 42.9 7% |
| sRGB Coverage (%) | 58.8 | 100 70% | 65.2 11% | 58.7 0% | 57.7 -2% | 64 9% |
| AdobeRGB 1998 Coverage (%) | 41.5 | 79.1 91% | 45 8% | 40.7 -2% | 41.2 -1% | 44.4 7% |
| Response Times | -80% | 32% | -35% | 2% | 15% | |
| Response Time Grey 50% / Grey 80% * (ms) | 31.6 ? | 62.4 ? -97% | 18 ? 43% | 43 ? -36% | 24.8 ? 22% | 22.8 ? 28% |
| Response Time Black / White * (ms) | 24 ? | 38.8 ? -62% | 19 ? 21% | 32 ? -33% | 28.4 ? -18% | 23.6 ? 2% |
| PWM Frequency (Hz) | 1000 ? | 26320 ? | ||||
| Screen | 56% | -6% | 31% | 9% | 0% | |
| Brightness middle (cd/m²) | 239.9 | 632 163% | 289 20% | 271 13% | 336.4 40% | 294.3 23% |
| Brightness (cd/m²) | 230 | 606 163% | 267 16% | 263 14% | 318 38% | 251 9% |
| Brightness Distribution (%) | 87 | 91 5% | 85 -2% | 92 6% | 84 -3% | 76 -13% |
| Black Level * (cd/m²) | 0.21 | 0.29 -38% | 0.56 -167% | 0.15 29% | 0.24 -14% | 0.26 -24% |
| Contrast (:1) | 1142 | 2179 91% | 516 -55% | 1807 58% | 1402 23% | 1132 -1% |
| Colorchecker dE 2000 * | 6.34 | 3.5 45% | 3.96 38% | 4.83 24% | 6.46 -2% | 4.08 36% |
| Colorchecker dE 2000 max. * | 21.03 | 6.4 70% | 6.76 68% | 7 67% | 19.75 6% | 19.49 7% |
| Colorchecker dE 2000 calibrated * | 2.08 | 2 4% | 2.09 -0% | 3.7 -78% | ||
| Greyscale dE 2000 * | 5.1 | 5 2% | 3.43 33% | 3.36 34% | 5.6 -10% | 3 41% |
| Gamma | 2.41 91% | 2.26 97% | 2.28 96% | 2.56 86% | 2.25 98% | 2.21 100% |
| CCT | 6169 105% | 7033 92% | 7191 90% | 6764 96% | 5934 110% | 6616 98% |
| Color Space (Percent of AdobeRGB 1998) (%) | 42 | |||||
| Color Space (Percent of sRGB) (%) | 65 | |||||
| Media totale (Programma / Settaggio) | 21% /
44% | 12% /
3% | -2% /
13% | 3% /
6% | 8% /
4% |
* ... Meglio usare valori piccoli
Lo spazio colore è limitato a solo il 59% di sRGB rispetto al >90% su alternative più costose come l XPS 15. La gamma ristretta è da aspettarsi sui portatili economici come il nostro Inspiron 15
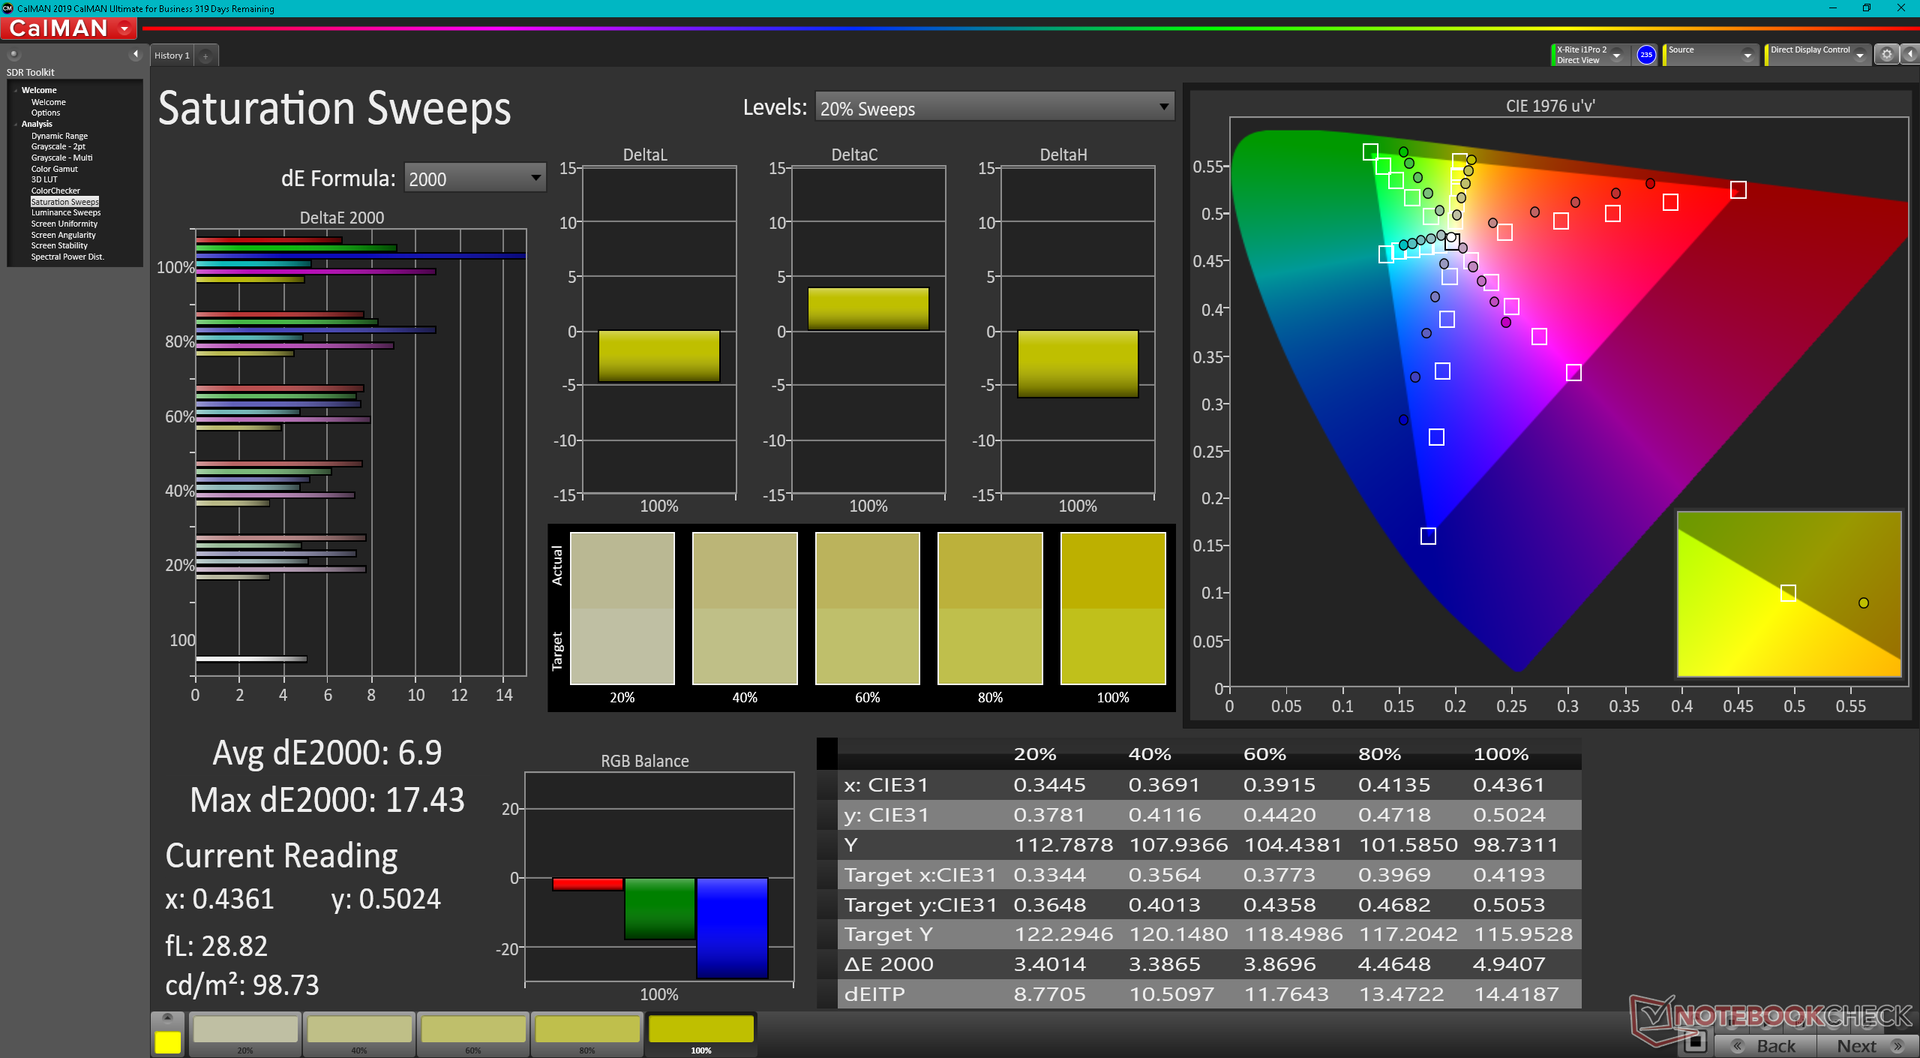
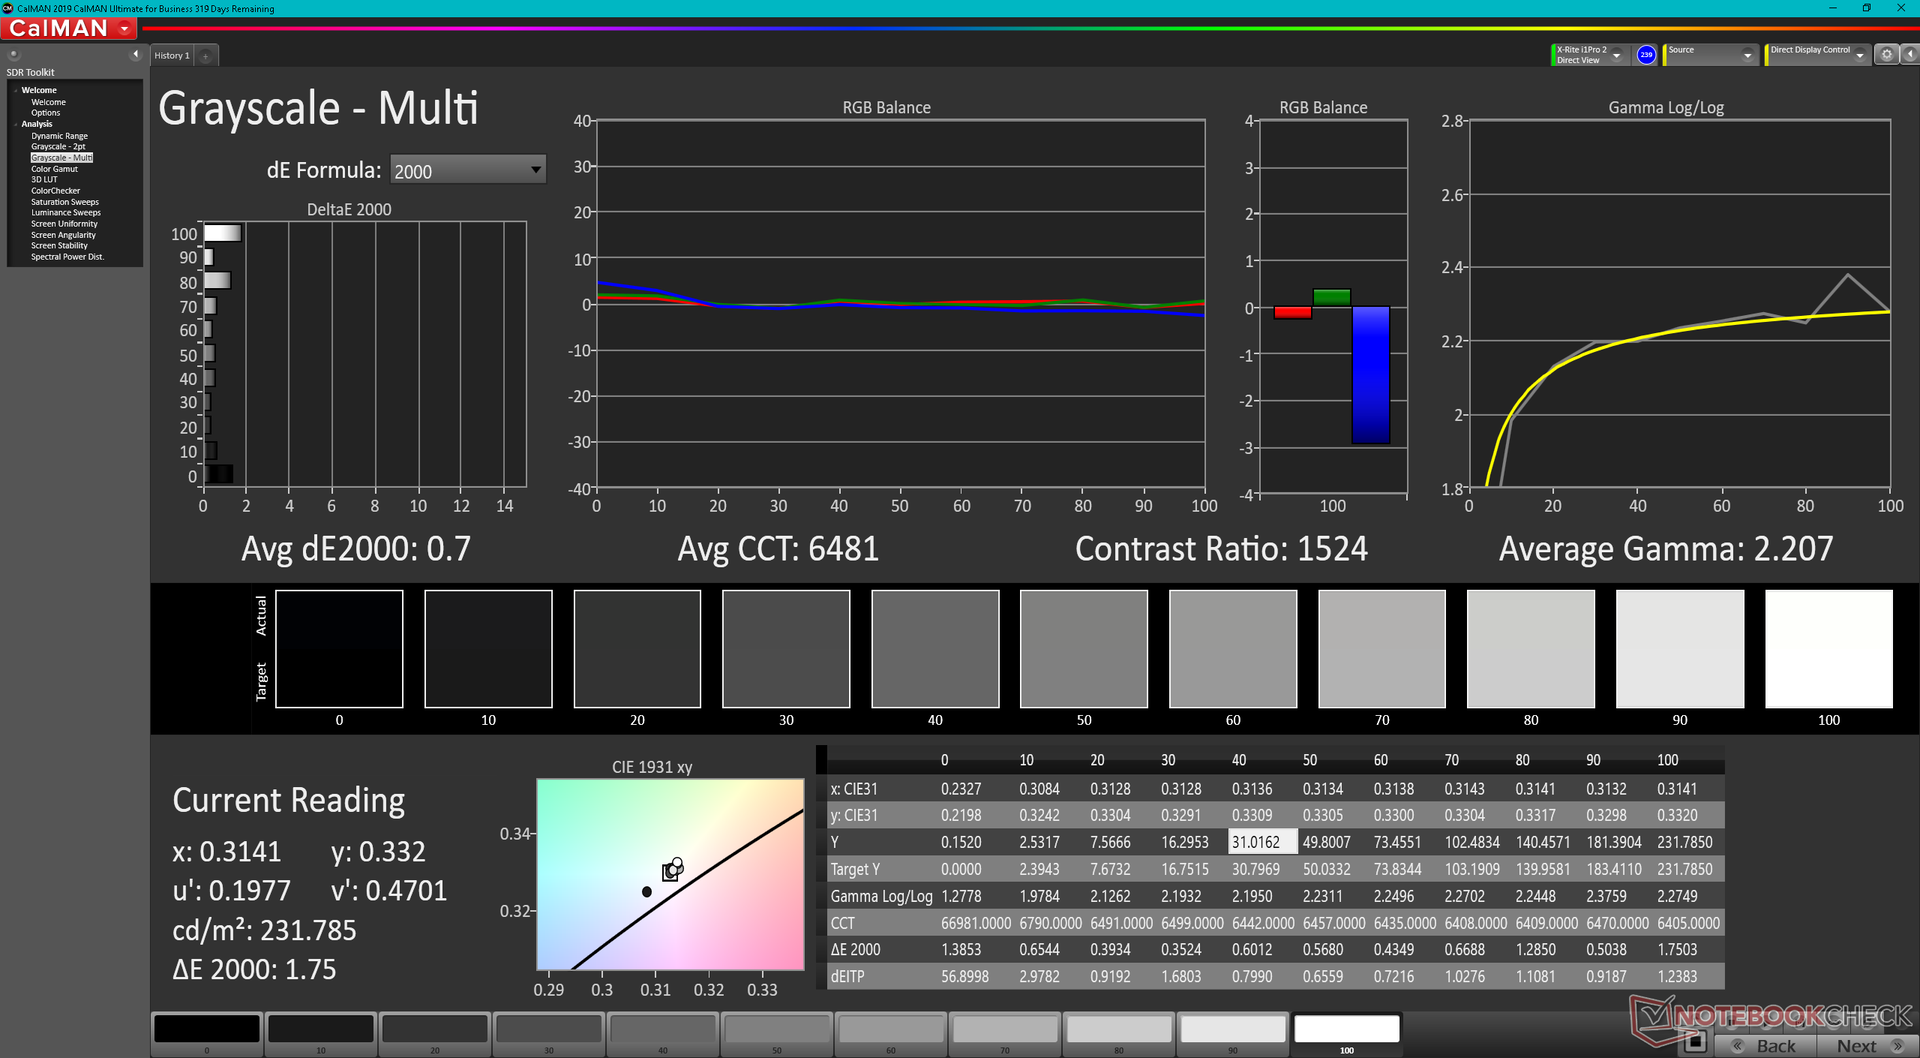
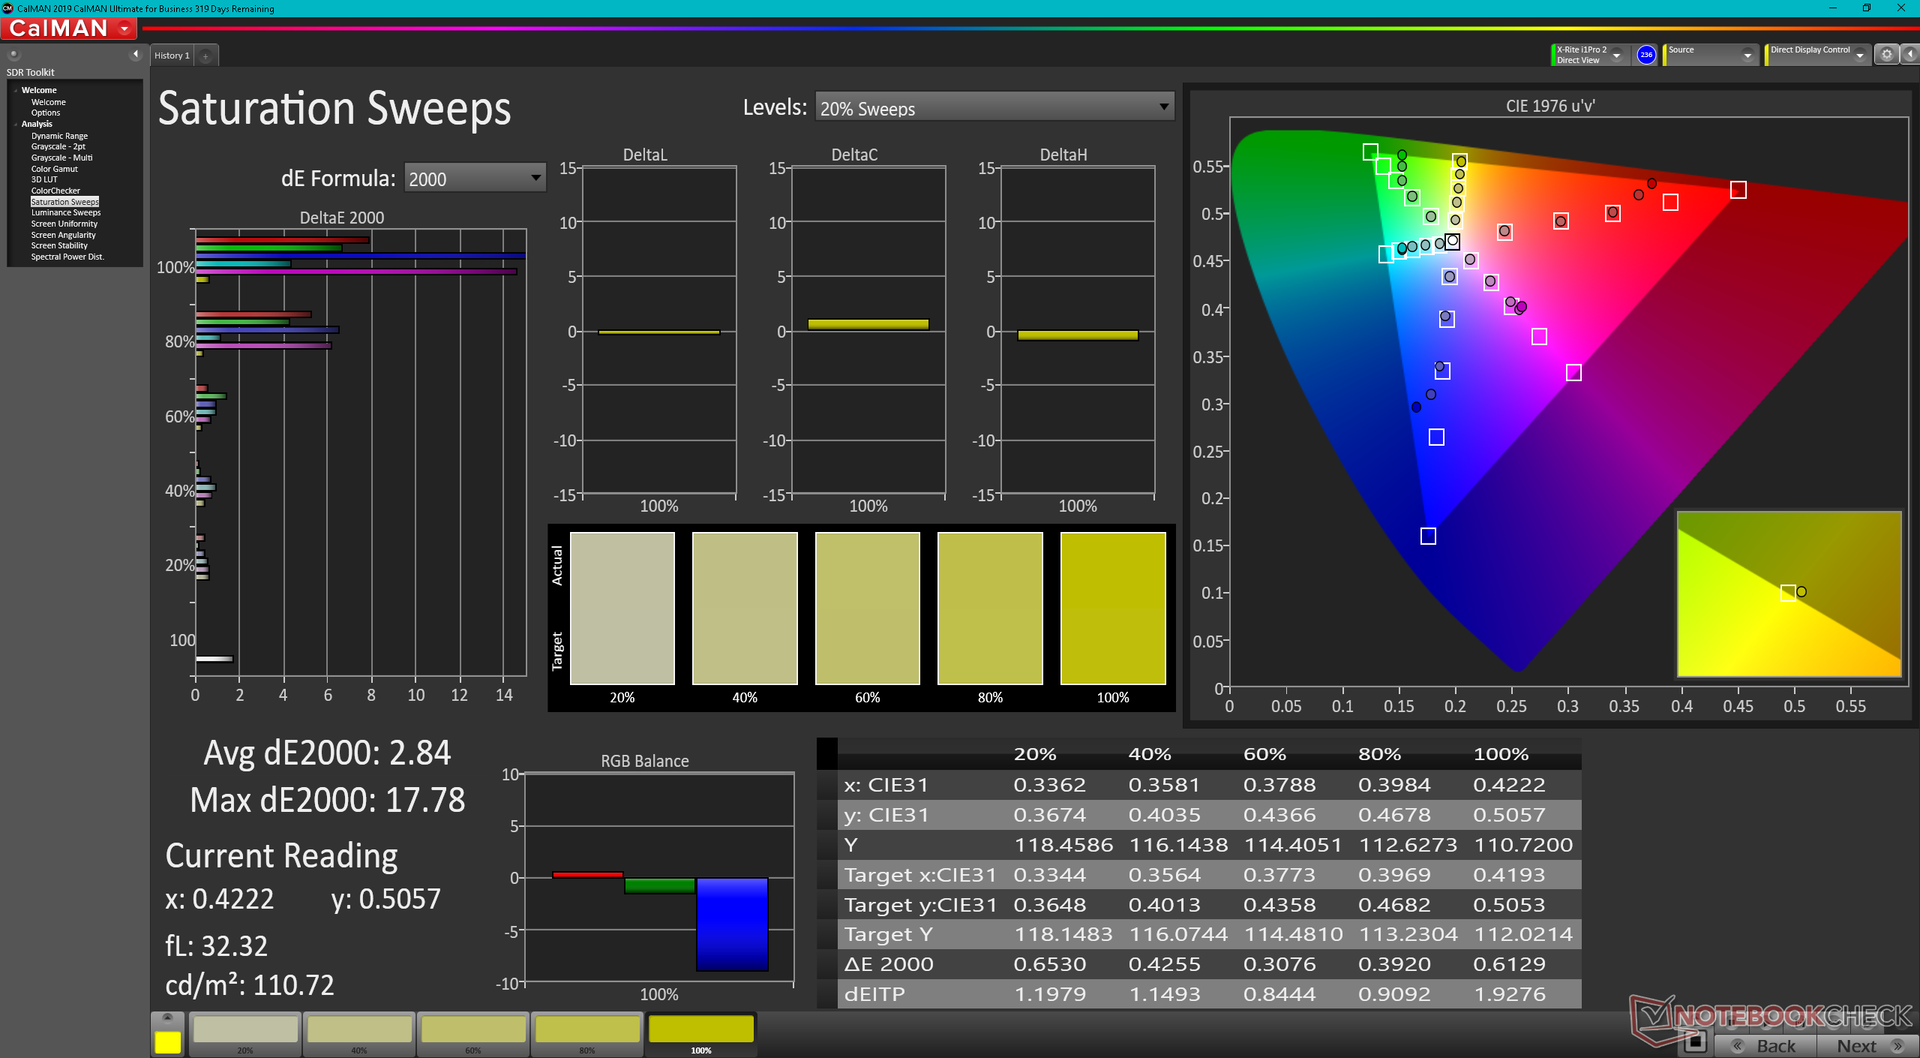
La temperatura del colore è leggermente troppo calda fuori dalla scatola, cosa che il nostro colorimetro X-Rite è in grado di risolvere. Una volta calibrato, i valori DeltaE medi della scala di grigi e del colore scendono da 5,1 e 6,34 a soli 0,7 e 2,08, rispettivamente. Tuttavia, la scarsa riproduzione del colore menzionata sopra significa che il deltaE aumenterà inevitabilmente in modo significativo a livelli di saturazione più alti
Tempi di risposta del Display
| ↔ Tempi di risposta dal Nero al Bianco | ||
|---|---|---|
| 24 ms ... aumenta ↗ e diminuisce ↘ combinato | ↗ 14 ms Incremento | 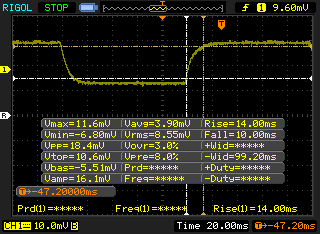 |
| ↘ 10 ms Calo | ||
| Lo schermo mostra buoni tempi di risposta durante i nostri tests, ma potrebbe essere troppo lento per i gamers competitivi. In confronto, tutti i dispositivi di test variano da 0.1 (minimo) a 240 (massimo) ms. » 54 % di tutti i dispositivi è migliore. Questo significa che i tempi di risposta rilevati sono peggiori rispetto alla media di tutti i dispositivi testati (19.8 ms). | ||
| ↔ Tempo di risposta dal 50% Grigio all'80% Grigio | ||
| 31.6 ms ... aumenta ↗ e diminuisce ↘ combinato | ↗ 17.2 ms Incremento | 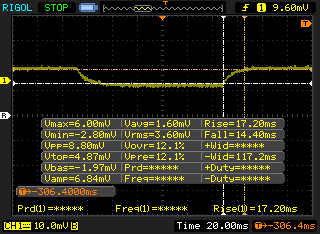 |
| ↘ 14.4 ms Calo | ||
| Lo schermo mostra tempi di risposta lenti nei nostri tests e sarà insoddisfacente per i gamers. In confronto, tutti i dispositivi di test variano da 0.165 (minimo) a 636 (massimo) ms. » 43 % di tutti i dispositivi è migliore. Questo significa che i tempi di risposta rilevati sono simili alla media di tutti i dispositivi testati (31 ms). | ||
Sfarfallio dello schermo / PWM (Pulse-Width Modulation)
| flickering dello schermo / PWM non rilevato | 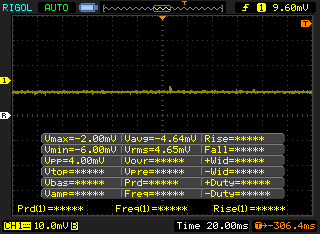 | ||
In confronto: 52 % di tutti i dispositivi testati non utilizza PWM per ridurre la luminosita' del display. Se è rilevato PWM, una media di 7747 (minimo: 5 - massimo: 343500) Hz è stata rilevata. | |||
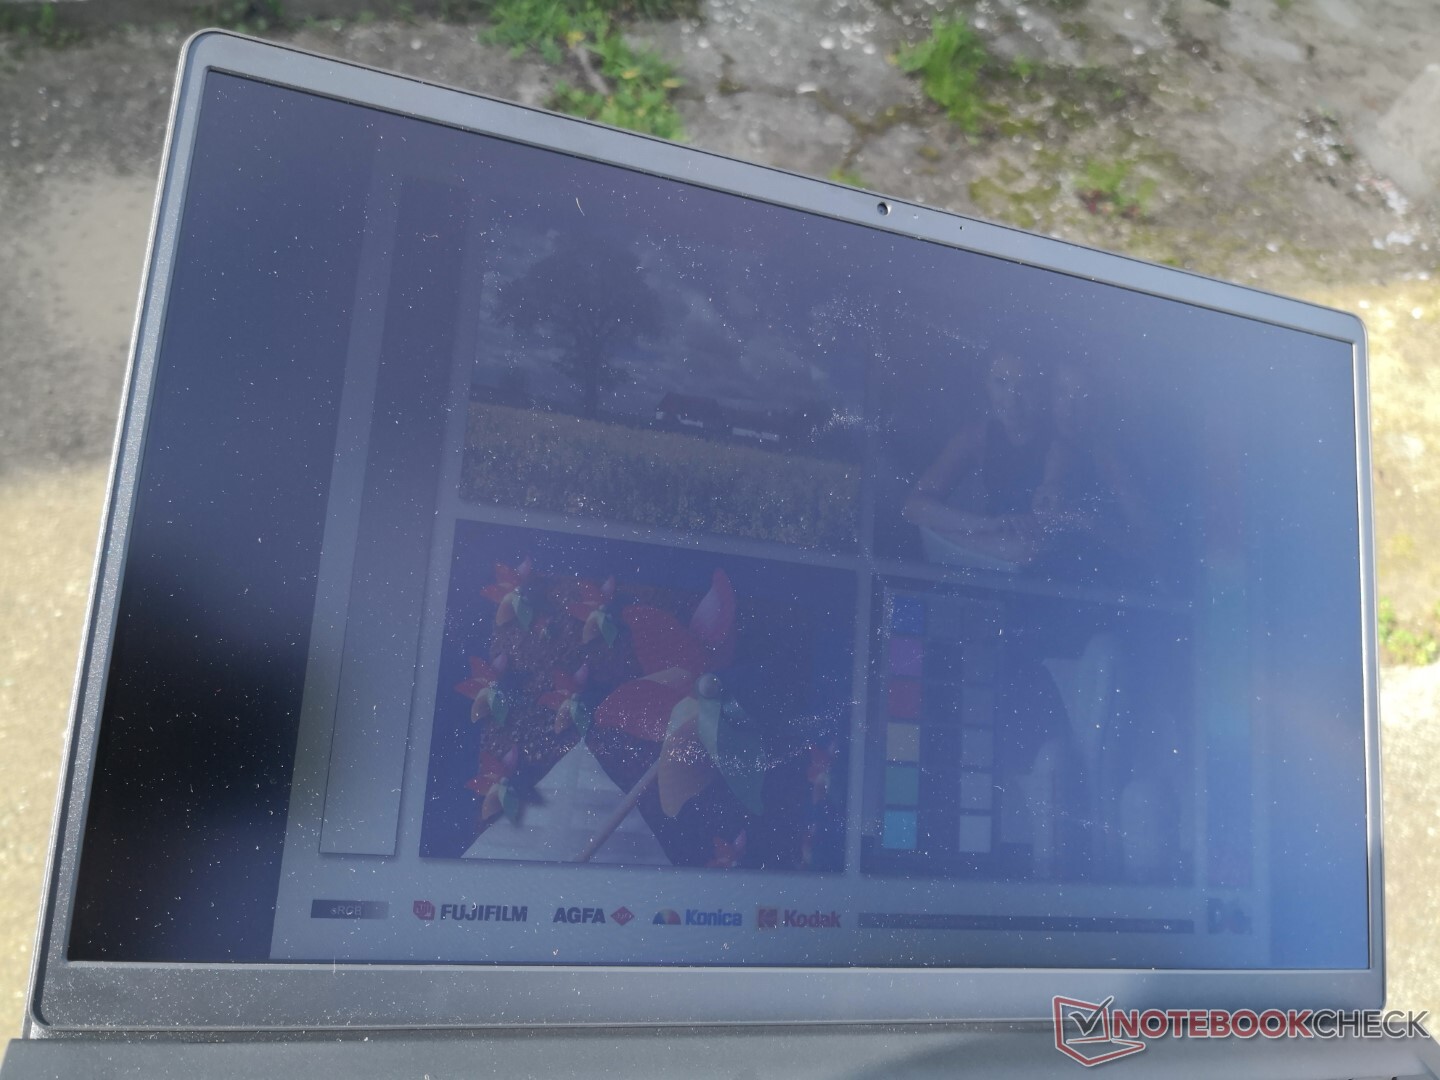
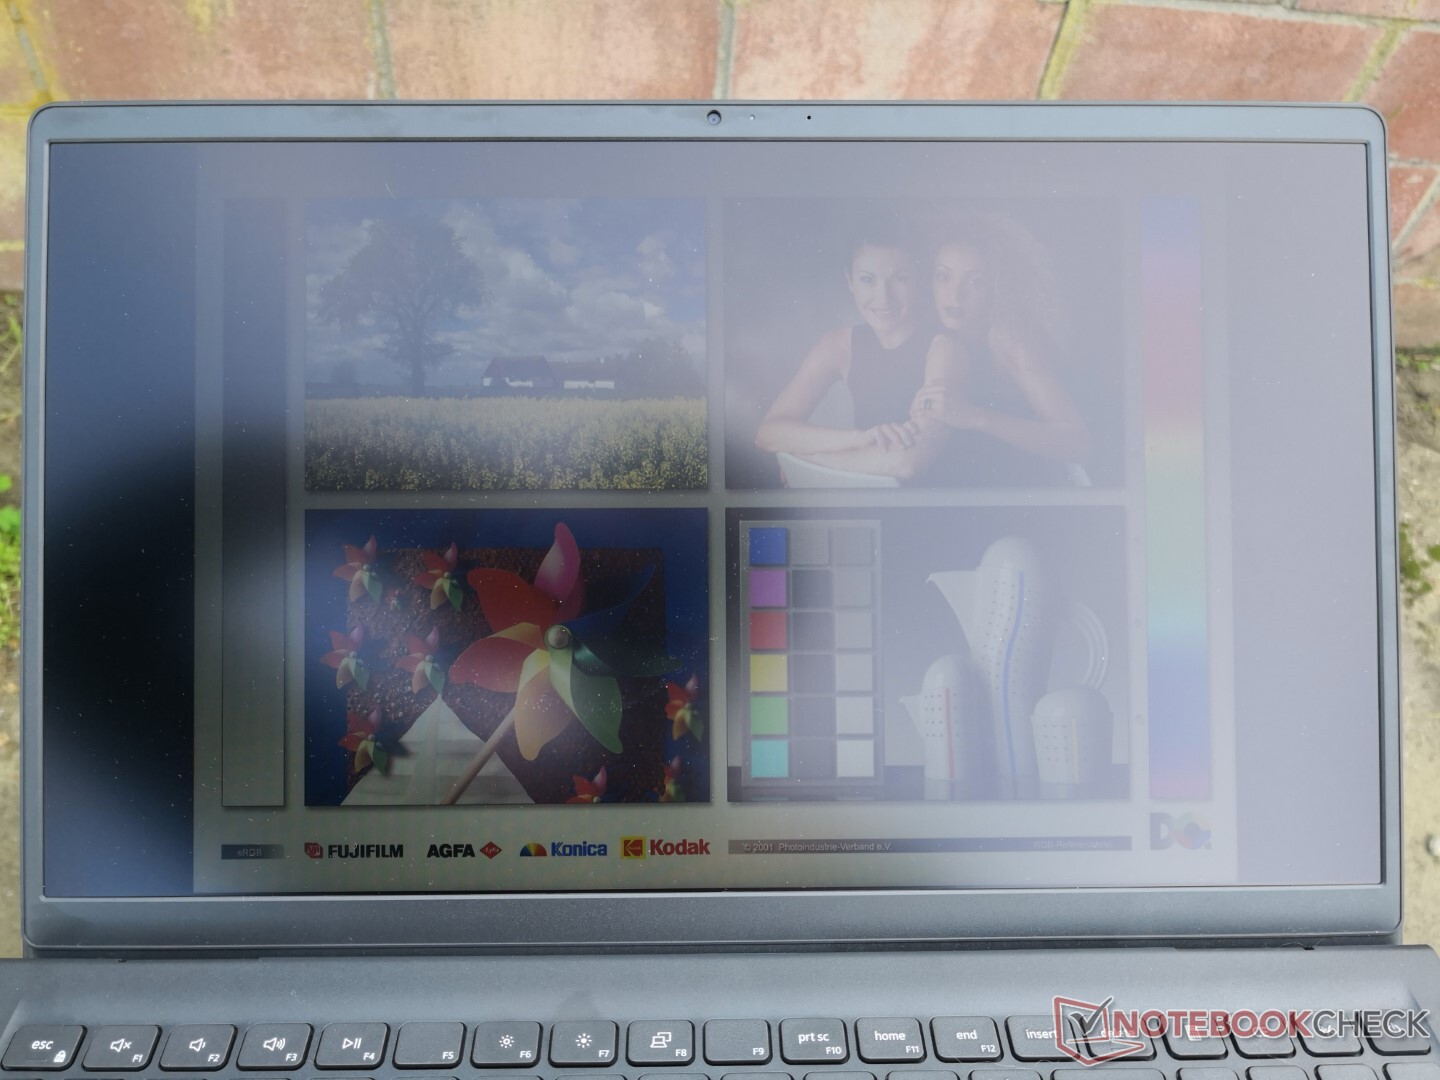
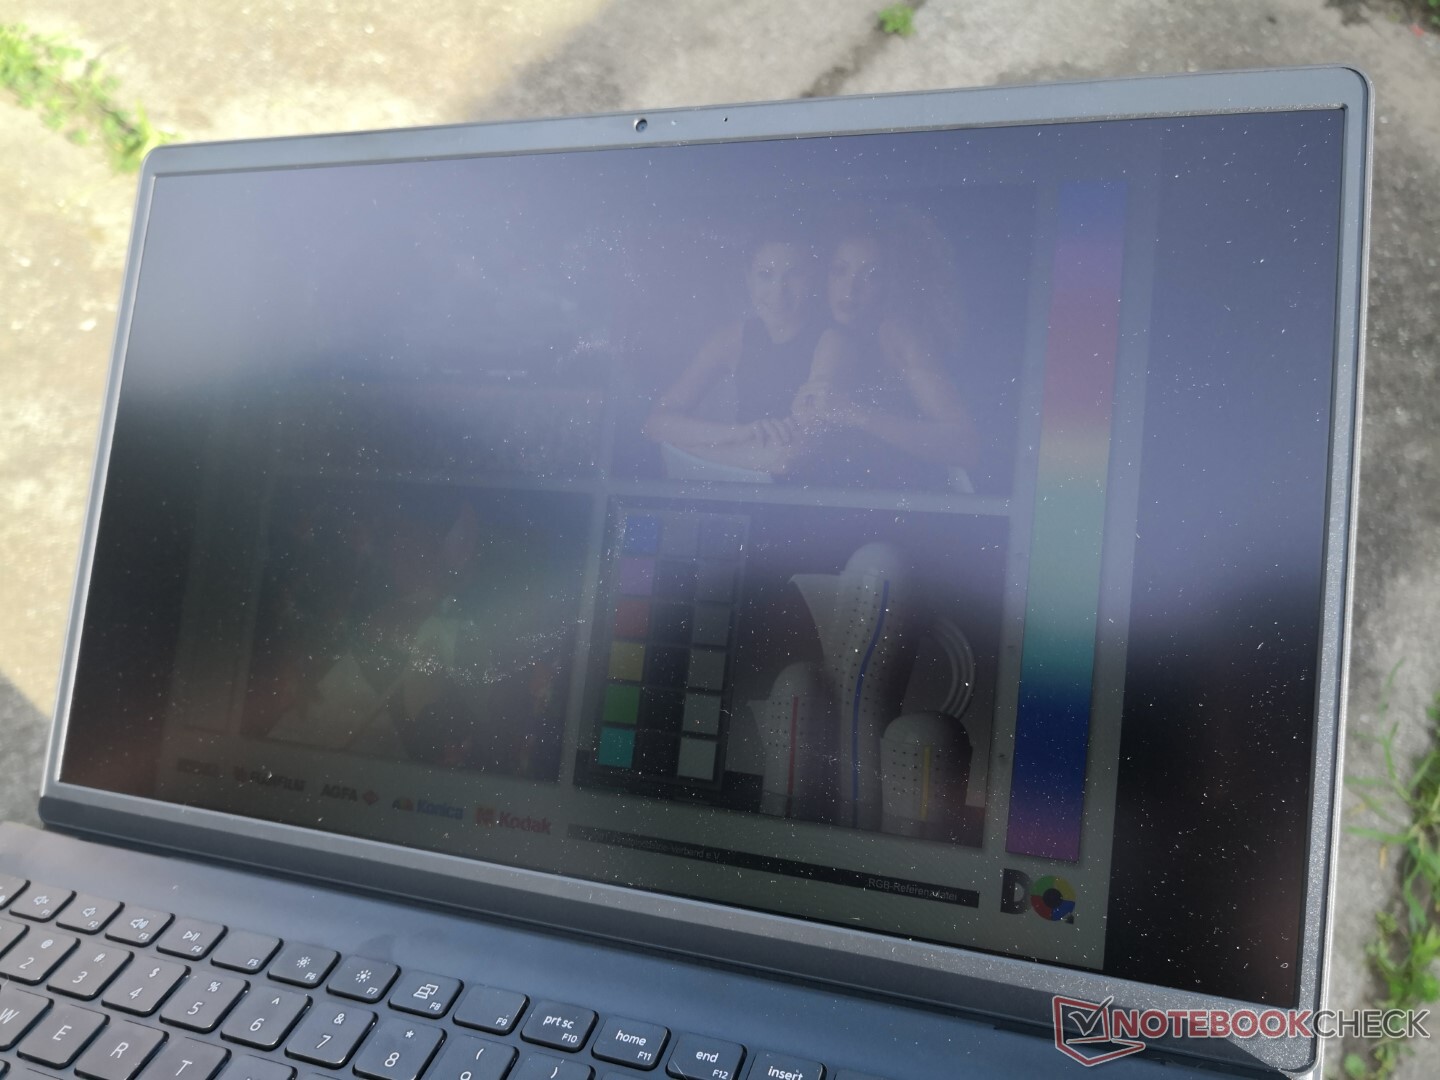
La visibilità esterna è scarsa anche se si lavora all'ombra. La luminosità massima scende automaticamente da 240 nits a soli 207 nits quando si utilizza l'alimentazione a batteria, rendendo un display già debole ancora più debole se non c'è una presa AC nelle vicinanze. Non riusciamo a trovare l'impostazione appropriata Dell, Windows o Intel che è responsabile del controllo automatico della luminosità della batteria
Performance
Condizioni di test
La nostra unità è stata impostata su Migliori prestazioni tramite Windows prima di eseguire qualsiasi benchmark di prestazioni qui sotto per ottenere i punteggi più alti possibili.
Processore
Le prestazioni complessive della CPU sono entro pochi punti percentuali del computer portatile medio nel nostro database equipaggiato con lo stesso Core i5-1135G7 processore. La sostenibilità delle prestazioni è anche buona, anche se i benefici iniziali del Turbo Boost sono molto più piccoli rispetto alle alternative più costose come lAsus ExpertBook B1 B1500CEAE oHonor MagicBook 15 come mostrato dai nostri risultati del ciclo CineBench R15 xT qui sotto
L'aggiornamento al Core i7-1165G7 dovrebbe aumentare le prestazioni single-thread e multi-thread solo del 5 e 15 per cento, rispettivamente. Nel frattempo, il downgrade al Core i3-1115G4 dovrebbe diminuire le prestazioni multi-thread di quasi il 30 per cento.
Cinebench R15 Multi Loop
Cinebench R23: Multi Core | Single Core
Cinebench R15: CPU Multi 64Bit | CPU Single 64Bit
Blender: v2.79 BMW27 CPU
7-Zip 18.03: 7z b 4 | 7z b 4 -mmt1
Geekbench 5.5: Multi-Core | Single-Core
HWBOT x265 Benchmark v2.2: 4k Preset
LibreOffice : 20 Documents To PDF
R Benchmark 2.5: Overall mean
| Cinebench R23 / Multi Core | |
| Asus VivoBook S15 D533UA | |
| Lenovo ThinkPad L15 G2 AMD | |
| Lenovo IdeaPad 5 15ALC05 | |
| Samsung Galaxy Book Pro 15 NP950XDB-KC5US | |
| Media Intel Core i5-1135G7 (2786 - 6136, n=55) | |
| Dell Inspiron 15 3000 3511 | |
| Cinebench R23 / Single Core | |
| Samsung Galaxy Book Pro 15 NP950XDB-KC5US | |
| Lenovo ThinkPad L15 G2 AMD | |
| Dell Inspiron 15 3000 3511 | |
| Media Intel Core i5-1135G7 (1062 - 1373, n=53) | |
| Asus VivoBook S15 D533UA | |
| Lenovo IdeaPad 5 15ALC05 | |
| HWBOT x265 Benchmark v2.2 / 4k Preset | |
| Asus VivoBook S15 D533UA | |
| Lenovo ThinkPad L15 G2 AMD | |
| Lenovo IdeaPad 5 15ALC05 | |
| HP ProBook 455 G7-175W8EA | |
| Samsung Galaxy Book Pro 15 NP950XDB-KC5US | |
| Media Intel Core i5-1135G7 (3.57 - 7.6, n=57) | |
| Samsung Galaxy Book Flex 15-NP950 | |
| HP Envy x360 15-ee0257ng | |
| Dell Inspiron 15 3000 3511 | |
| HP 250 G7-15S40ES | |
* ... Meglio usare valori piccoli
AIDA64: FP32 Ray-Trace | FPU Julia | CPU SHA3 | CPU Queen | FPU SinJulia | FPU Mandel | CPU AES | CPU ZLib | FP64 Ray-Trace | CPU PhotoWorxx
| Performance rating | |
| Asus VivoBook S15 D533UA | |
| HP Pavilion 15-eg | |
| Media Intel Core i5-1135G7 | |
| Lenovo IdeaPad 3 15ALC6 | |
| Dell Inspiron 15 3501 | |
| Dell Inspiron 15 3000 3511 | |
| Dell XPS 15 9510 i5 11400H FHD -9! | |
| AIDA64 / FP32 Ray-Trace | |
| Asus VivoBook S15 D533UA | |
| Lenovo IdeaPad 3 15ALC6 | |
| Media Intel Core i5-1135G7 (4313 - 7952, n=45) | |
| HP Pavilion 15-eg | |
| Dell Inspiron 15 3501 | |
| Dell Inspiron 15 3000 3511 | |
| AIDA64 / FPU Julia | |
| Asus VivoBook S15 D533UA | |
| Lenovo IdeaPad 3 15ALC6 | |
| HP Pavilion 15-eg | |
| Media Intel Core i5-1135G7 (19402 - 32283, n=45) | |
| Dell Inspiron 15 3501 | |
| Dell Inspiron 15 3000 3511 | |
| AIDA64 / CPU SHA3 | |
| Asus VivoBook S15 D533UA | |
| HP Pavilion 15-eg | |
| Media Intel Core i5-1135G7 (1316 - 2172, n=45) | |
| Dell Inspiron 15 3000 3511 | |
| Dell Inspiron 15 3501 | |
| Lenovo IdeaPad 3 15ALC6 | |
| AIDA64 / CPU Queen | |
| Asus VivoBook S15 D533UA | |
| Lenovo IdeaPad 3 15ALC6 | |
| HP Pavilion 15-eg | |
| Dell Inspiron 15 3501 | |
| Dell Inspiron 15 3000 3511 | |
| Media Intel Core i5-1135G7 (39000 - 46951, n=45) | |
| AIDA64 / FPU SinJulia | |
| Asus VivoBook S15 D533UA | |
| Lenovo IdeaPad 3 15ALC6 | |
| HP Pavilion 15-eg | |
| Dell Inspiron 15 3501 | |
| Media Intel Core i5-1135G7 (3497 - 4445, n=45) | |
| Dell Inspiron 15 3000 3511 | |
| AIDA64 / FPU Mandel | |
| Asus VivoBook S15 D533UA | |
| Lenovo IdeaPad 3 15ALC6 | |
| HP Pavilion 15-eg | |
| Media Intel Core i5-1135G7 (12569 - 19635, n=45) | |
| Dell Inspiron 15 3501 | |
| Dell Inspiron 15 3000 3511 | |
| AIDA64 / CPU AES | |
| HP Pavilion 15-eg | |
| Dell Inspiron 15 3501 | |
| Asus VivoBook S15 D533UA | |
| Dell Inspiron 15 3000 3511 | |
| Media Intel Core i5-1135G7 (28988 - 67977, n=45) | |
| Lenovo IdeaPad 3 15ALC6 | |
| AIDA64 / CPU ZLib | |
| Asus VivoBook S15 D533UA | |
| Lenovo IdeaPad 3 15ALC6 | |
| Dell Inspiron 15 3000 3511 | |
| Dell Inspiron 15 3501 | |
| HP Pavilion 15-eg | |
| Media Intel Core i5-1135G7 (265 - 373, n=51) | |
| Dell XPS 15 9510 i5 11400H FHD | |
| AIDA64 / FP64 Ray-Trace | |
| Asus VivoBook S15 D533UA | |
| Lenovo IdeaPad 3 15ALC6 | |
| Dell Inspiron 15 3501 | |
| HP Pavilion 15-eg | |
| Media Intel Core i5-1135G7 (2226 - 4291, n=45) | |
| Dell Inspiron 15 3000 3511 | |
| AIDA64 / CPU PhotoWorxx | |
| HP Pavilion 15-eg | |
| Media Intel Core i5-1135G7 (9004 - 45366, n=45) | |
| Lenovo IdeaPad 3 15ALC6 | |
| Dell Inspiron 15 3501 | |
| Asus VivoBook S15 D533UA | |
| Dell Inspiron 15 3000 3511 | |
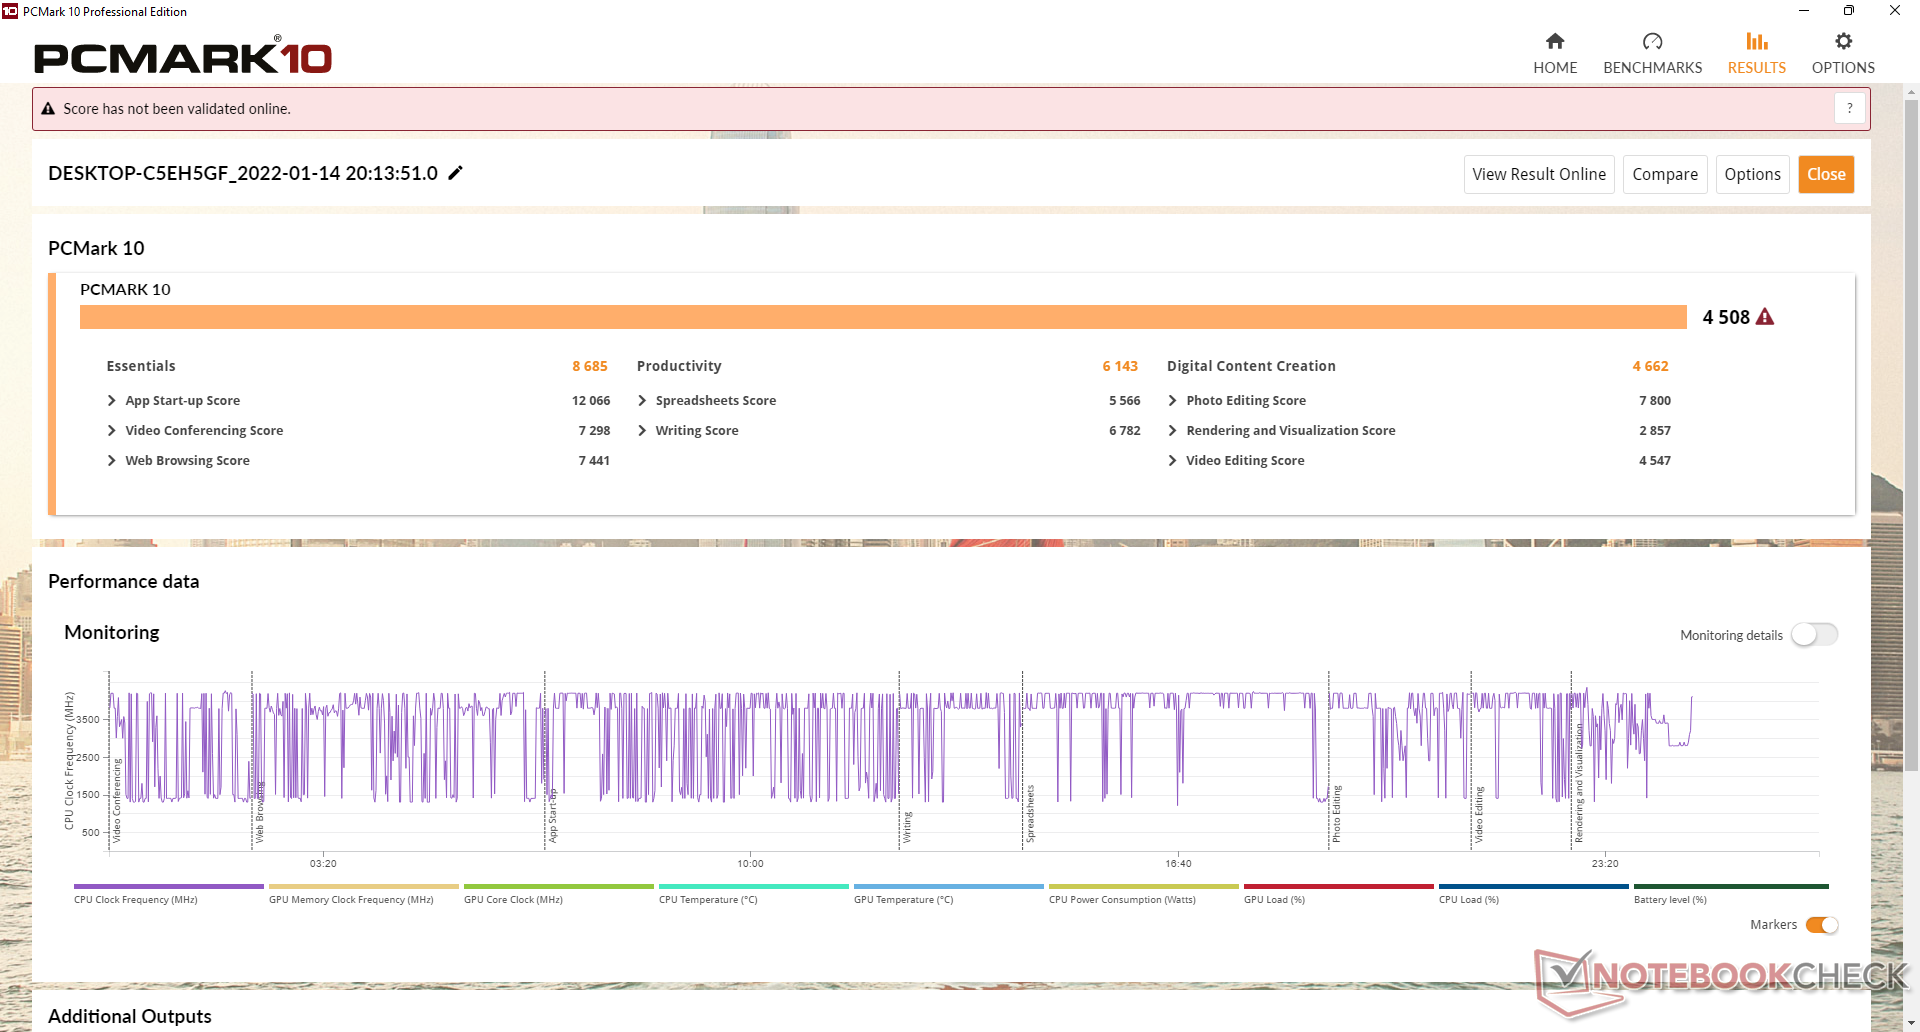
Prestazioni del sistema
I risultati di PCMark sono dove ci aspettiamo che siano rispetto ad altri portatili con lo stesso processore e la stessa grafica, nonostante i risultati deludenti della GPU menzionati sotto. Così, il sistema si sente ancora scattante come qualsiasi altro Ultrabook Core-U di 11a generazione per carichi di lavoro quotidiani poco impegnativi di tipo office.
| PCMark 10 / Score | |
| HP Pavilion 15-eg | |
| Asus VivoBook S15 D533UA | |
| Lenovo IdeaPad 3 15ALC6 | |
| Dell Inspiron 15 3501 | |
| Media Intel Core i5-1135G7, Intel Iris Xe Graphics G7 80EUs (4026 - 4952, n=53) | |
| Dell Inspiron 15 3000 3511 | |
| Dell XPS 15 9510 i5 11400H FHD | |
| PCMark 10 / Essentials | |
| HP Pavilion 15-eg | |
| Dell Inspiron 15 3501 | |
| Dell XPS 15 9510 i5 11400H FHD | |
| Media Intel Core i5-1135G7, Intel Iris Xe Graphics G7 80EUs (8149 - 9917, n=53) | |
| Asus VivoBook S15 D533UA | |
| Lenovo IdeaPad 3 15ALC6 | |
| Dell Inspiron 15 3000 3511 | |
| PCMark 10 / Productivity | |
| HP Pavilion 15-eg | |
| Asus VivoBook S15 D533UA | |
| Lenovo IdeaPad 3 15ALC6 | |
| Dell Inspiron 15 3501 | |
| Dell XPS 15 9510 i5 11400H FHD | |
| Media Intel Core i5-1135G7, Intel Iris Xe Graphics G7 80EUs (5040 - 6619, n=53) | |
| Dell Inspiron 15 3000 3511 | |
| PCMark 10 / Digital Content Creation | |
| HP Pavilion 15-eg | |
| Asus VivoBook S15 D533UA | |
| Dell Inspiron 15 3501 | |
| Lenovo IdeaPad 3 15ALC6 | |
| Dell Inspiron 15 3000 3511 | |
| Media Intel Core i5-1135G7, Intel Iris Xe Graphics G7 80EUs (3548 - 5255, n=53) | |
| Dell XPS 15 9510 i5 11400H FHD | |
| PCMark 10 Score | 4508 punti | |
Aiuto | ||
| AIDA64 / Memory Copy | |
| HP Pavilion 15-eg | |
| Media Intel Core i5-1135G7 (17443 - 63889, n=45) | |
| Asus VivoBook S15 D533UA | |
| Lenovo IdeaPad 3 15ALC6 | |
| Dell Inspiron 15 3501 | |
| Dell Inspiron 15 3000 3511 | |
| AIDA64 / Memory Read | |
| HP Pavilion 15-eg | |
| Asus VivoBook S15 D533UA | |
| Media Intel Core i5-1135G7 (19716 - 63705, n=45) | |
| Dell Inspiron 15 3501 | |
| Lenovo IdeaPad 3 15ALC6 | |
| Dell Inspiron 15 3000 3511 | |
| AIDA64 / Memory Write | |
| HP Pavilion 15-eg | |
| Media Intel Core i5-1135G7 (18722 - 66778, n=45) | |
| Asus VivoBook S15 D533UA | |
| Lenovo IdeaPad 3 15ALC6 | |
| Dell Inspiron 15 3501 | |
| Dell Inspiron 15 3000 3511 | |
| AIDA64 / Memory Latency | |
| Dell Inspiron 15 3000 3511 | |
| Lenovo IdeaPad 3 15ALC6 | |
| Asus VivoBook S15 D533UA | |
| Dell Inspiron 15 3501 | |
| Media Intel Core i5-1135G7 (68.3 - 107, n=51) | |
| HP Pavilion 15-eg | |
| Dell XPS 15 9510 i5 11400H FHD | |
* ... Meglio usare valori piccoli
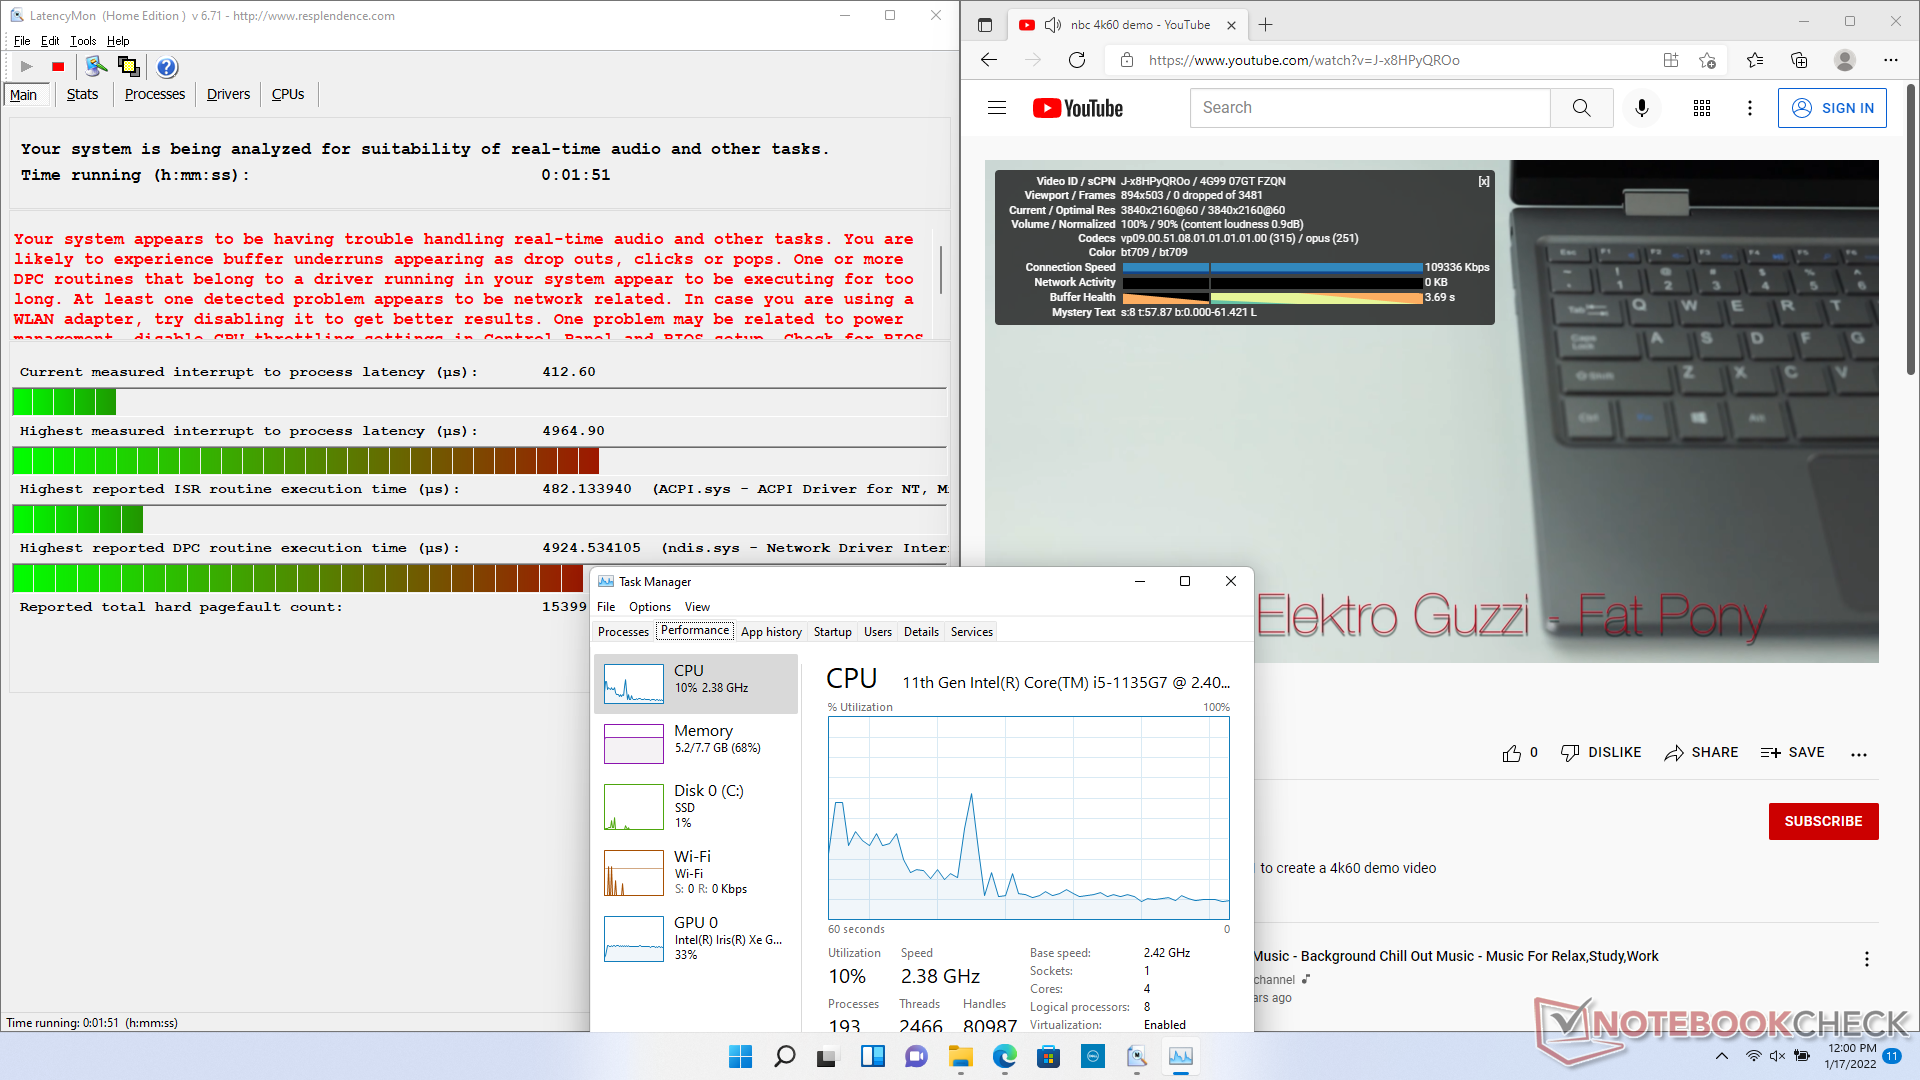
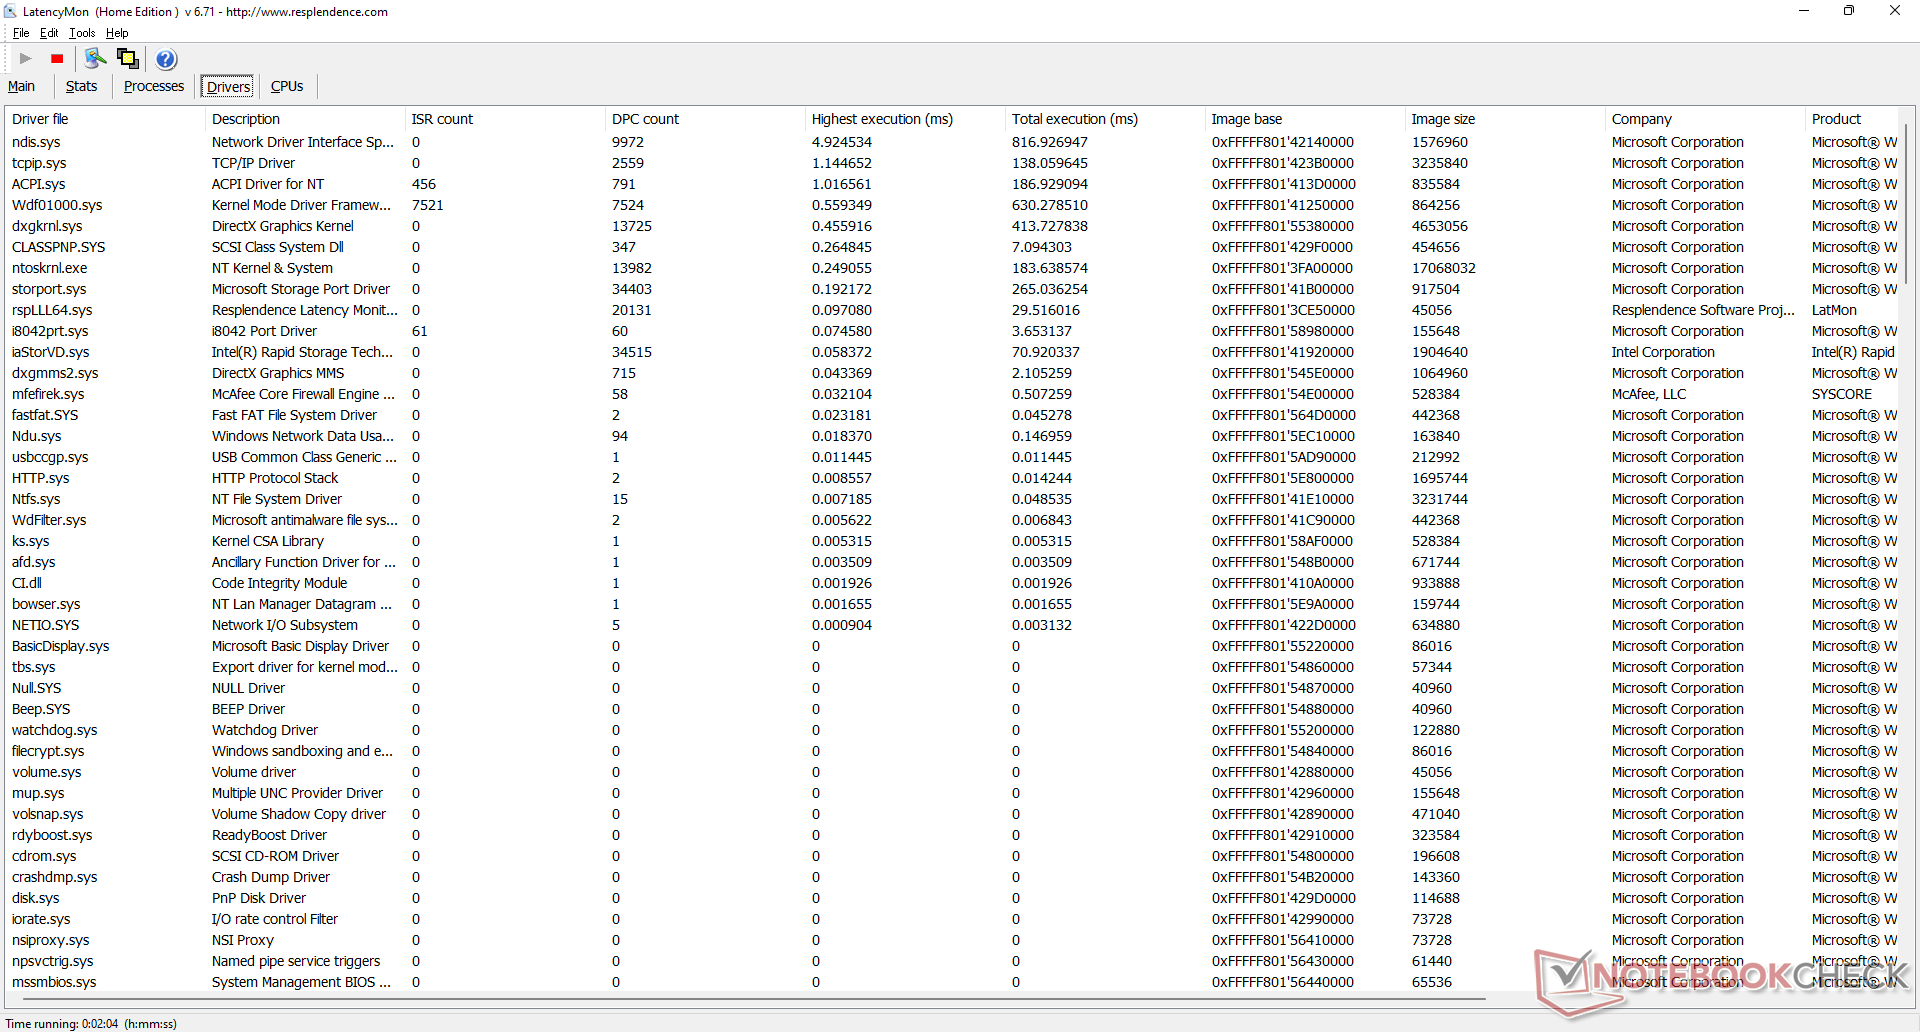
Latenza DPC
LatencyMon mostra problemi di DPC quando si aprono più schede del browser sulla nostra homepage. la riproduzione di video 4K a 60 FPS è altrimenti fluida e senza alcun calo di frame.
| DPC Latencies / LatencyMon - interrupt to process latency (max), Web, Youtube, Prime95 | |
| Dell Inspiron 15 3000 3511 | |
| HP Pavilion 15-eg | |
| Dell XPS 15 9510 i5 11400H FHD | |
| Dell Inspiron 15 3501 | |
| Lenovo IdeaPad 3 15ALC6 | |
| Asus VivoBook S15 D533UA | |
* ... Meglio usare valori piccoli
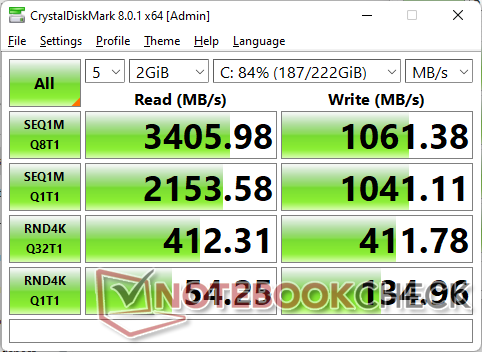
Dispositivi di archiviazione
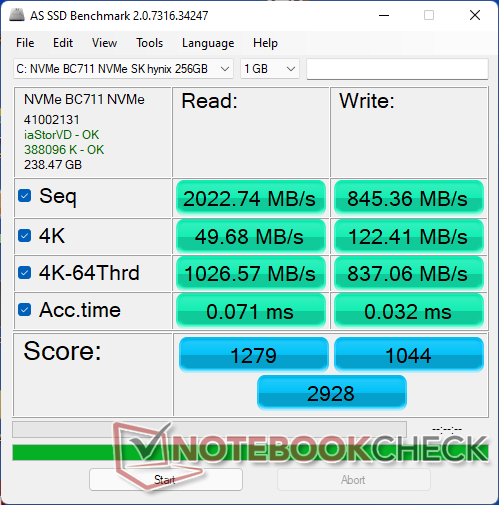
Il sistema può ospitare fino a due unità interne. La nostra configurazione specifica è dotata di un PCIe3 x4 da 256 GB SK Hynix SK BC711 M.2 2242 NVMe SSD che offre velocità di lettura e scrittura sequenziale fino a ~3300 MB/s e ~1000 MB/s, rispettivamente, per essere molto veloce per un portatile economico. L'unità è in grado di mantenere la sua massima velocità di trasferimento per lunghi periodi senza pad di calore o raffreddamento aggiuntivo.

* ... Meglio usare valori piccoli
Disk Throttling: DiskSpd Read Loop, Queue Depth 8
Prestazioni della GPU
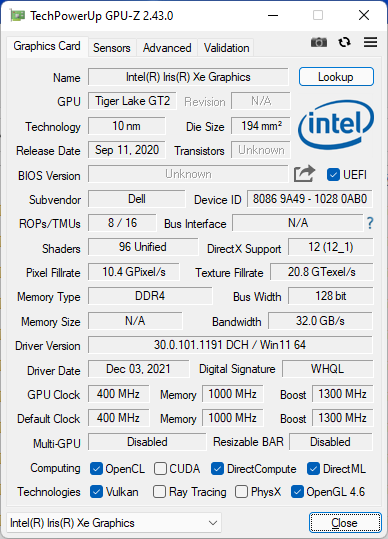
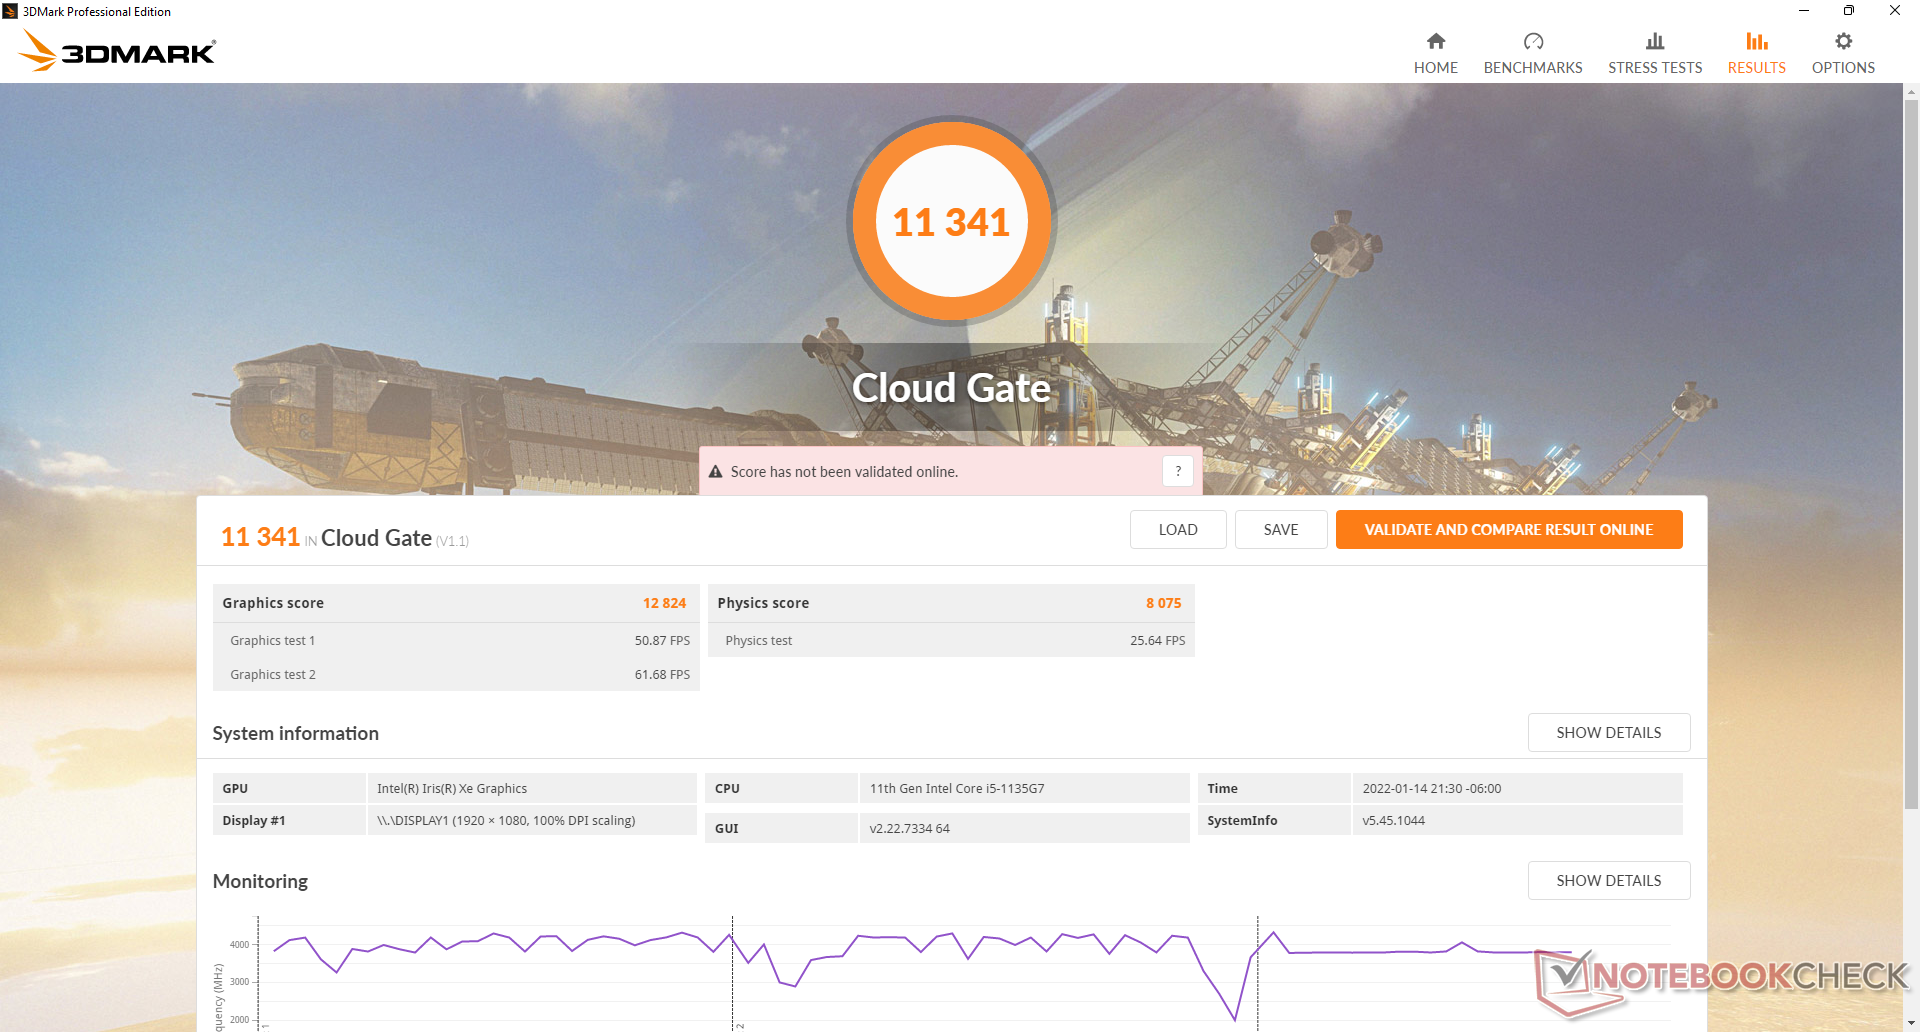
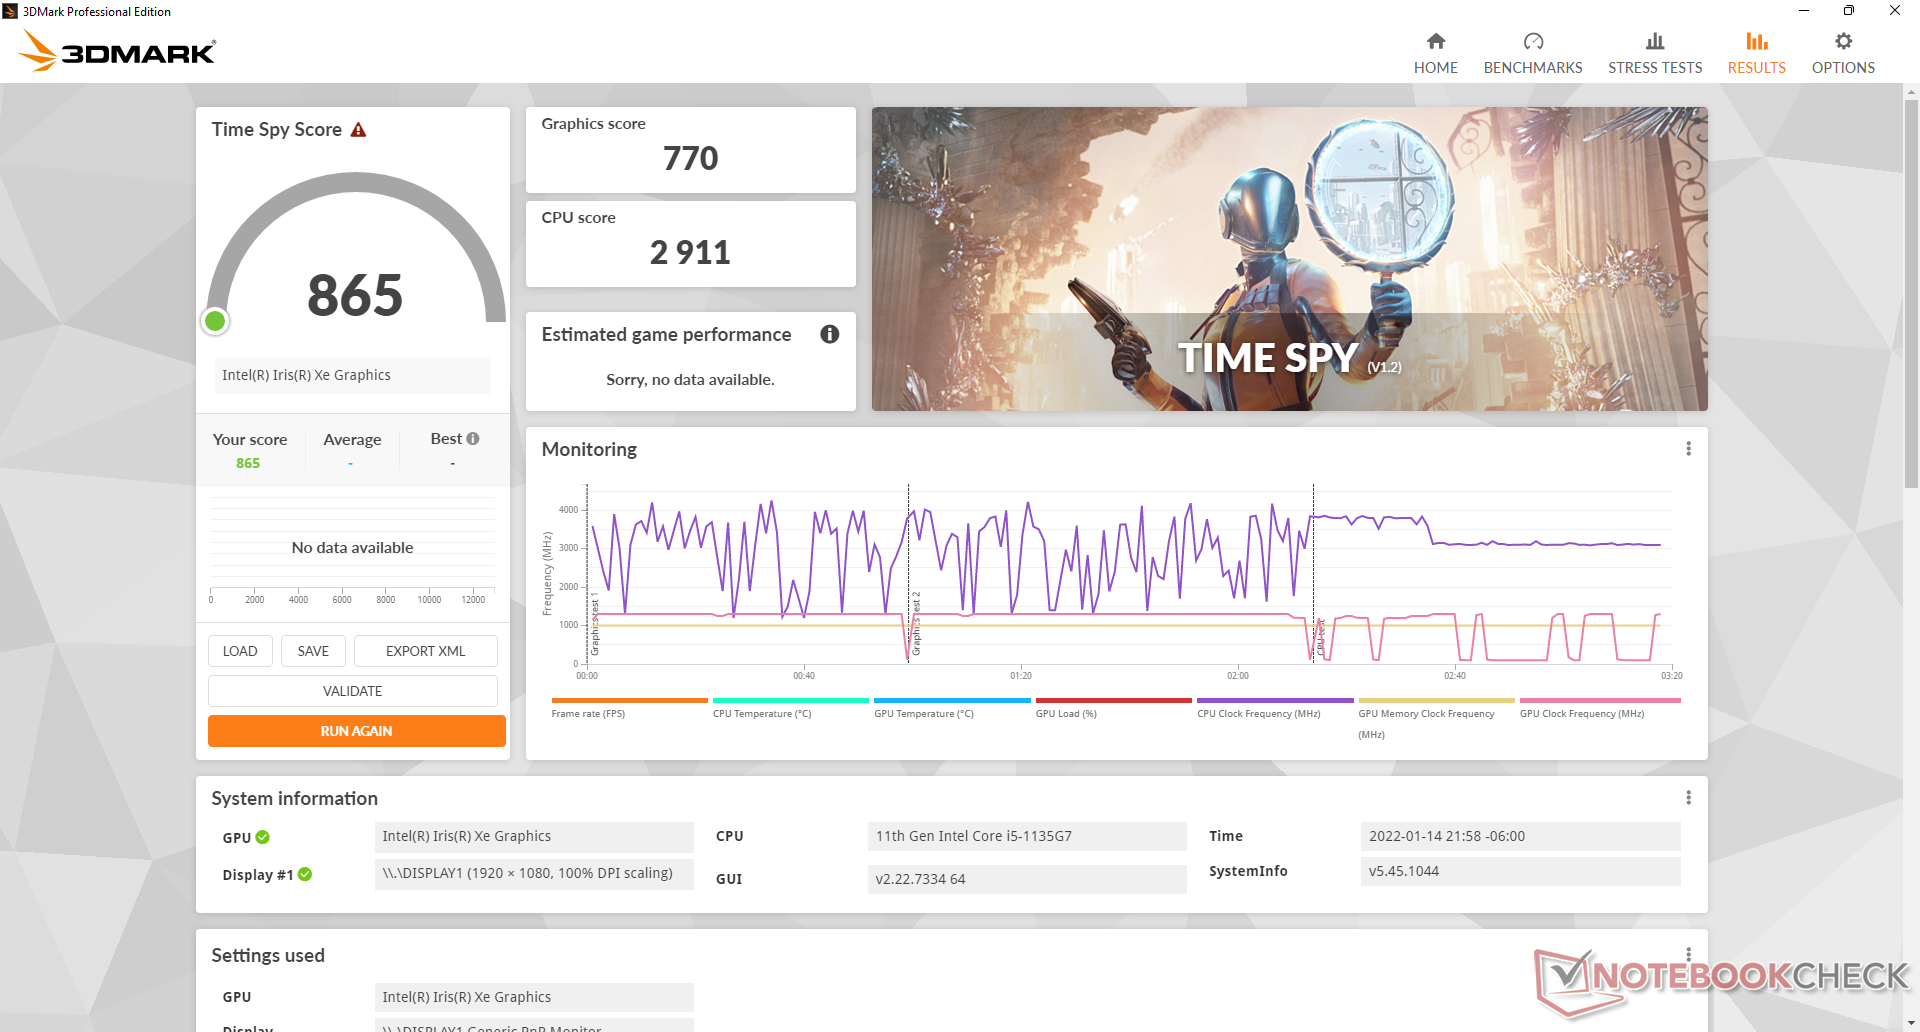
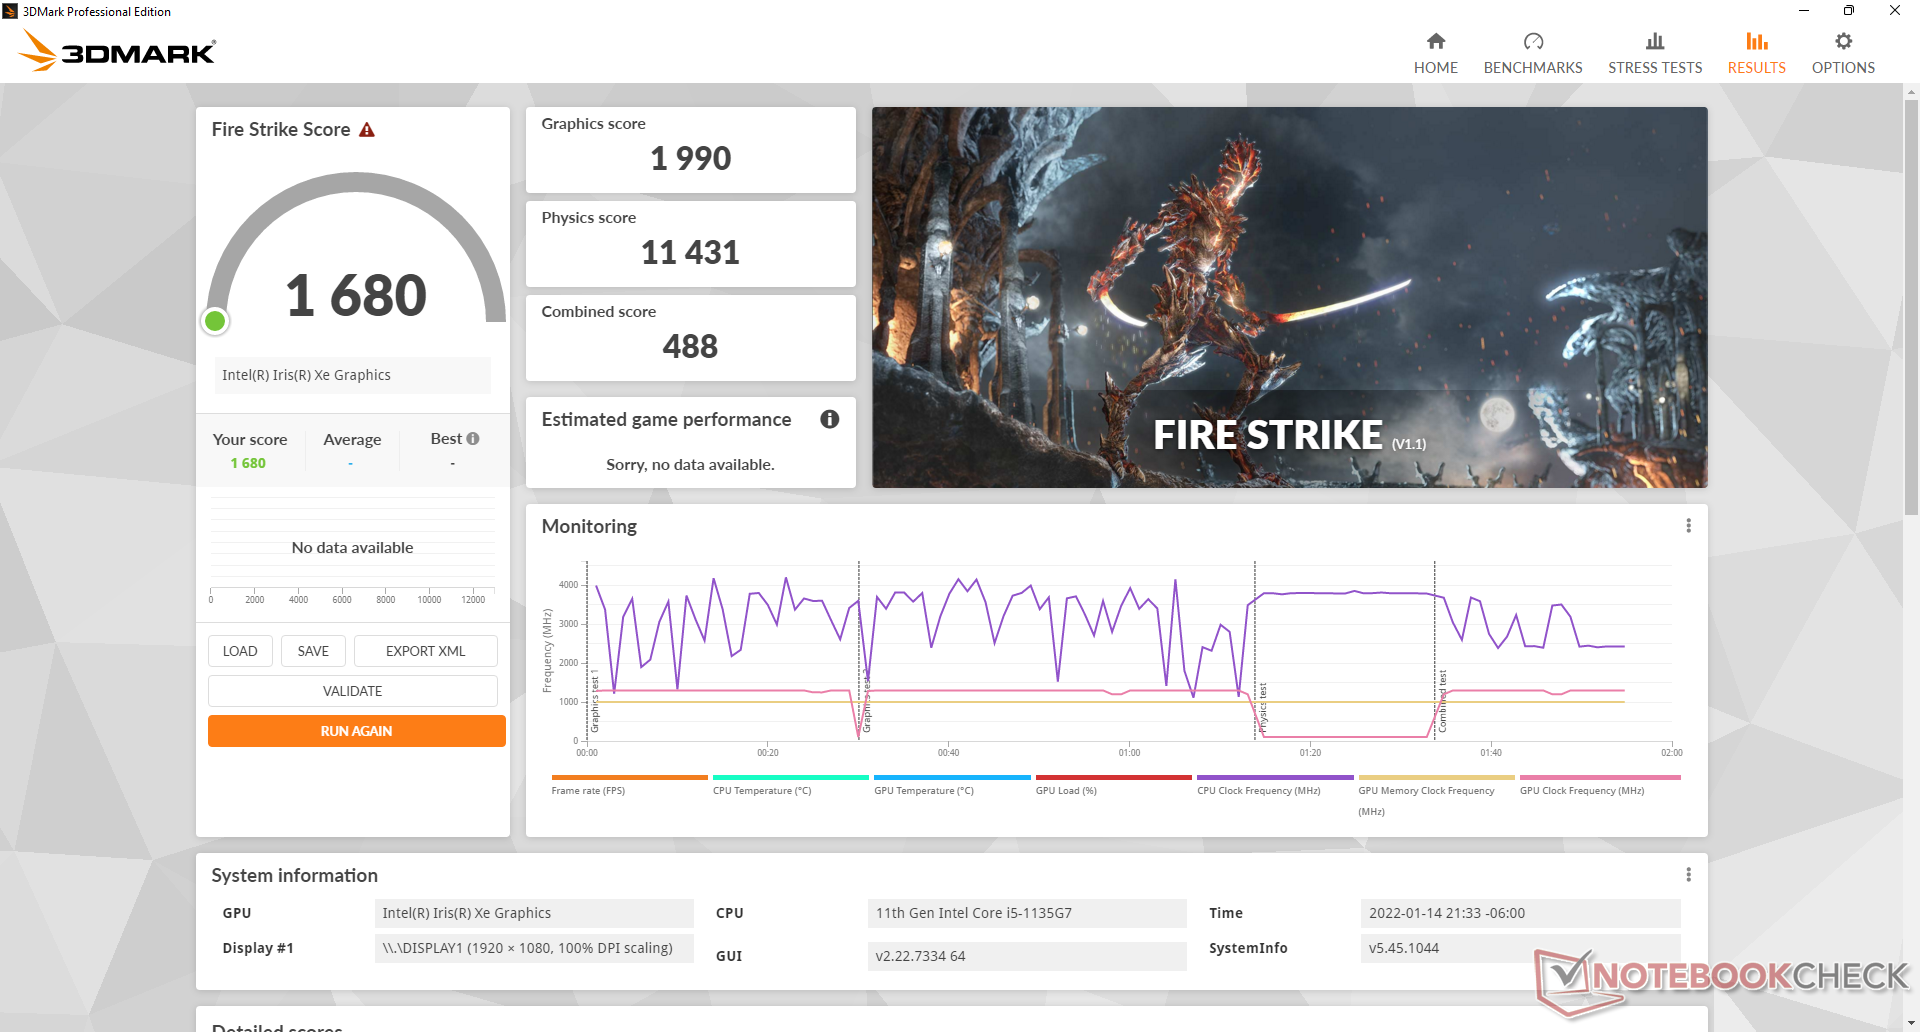
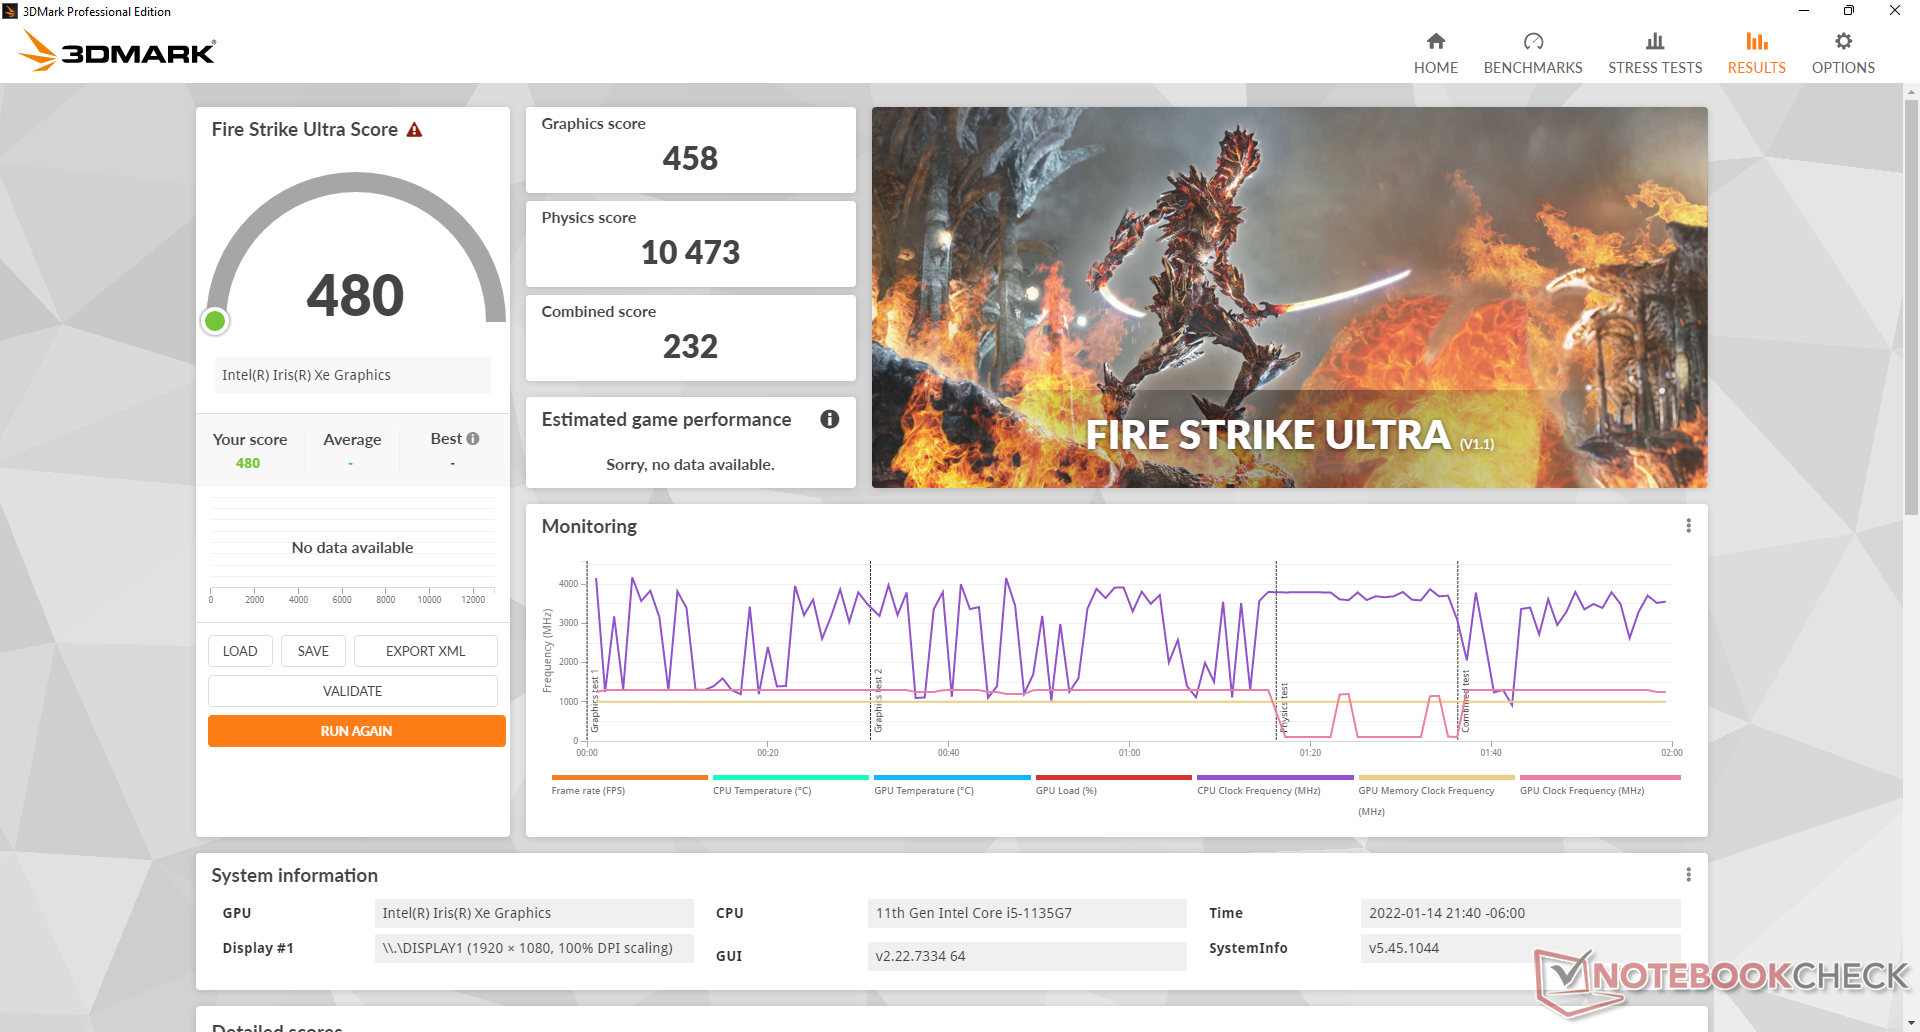
Le prestazioni grafiche sono dal 30 al 45 per cento più lente rispetto alla media dei laptop del nostro database equipaggiati con lo stessa Iris Xe 80 EUs integrata GPU. I risultati deludenti possono essere in gran parte dovuti ai miseri 8 GB di memoria a canale singolo rispetto ai 16 GB o più di memoria a doppio canale della stragrande maggioranza dei modelli più costosi. Si consiglia vivamente di installare un altro stick di RAM se massimizzare le prestazioni della GPU è una priorità.
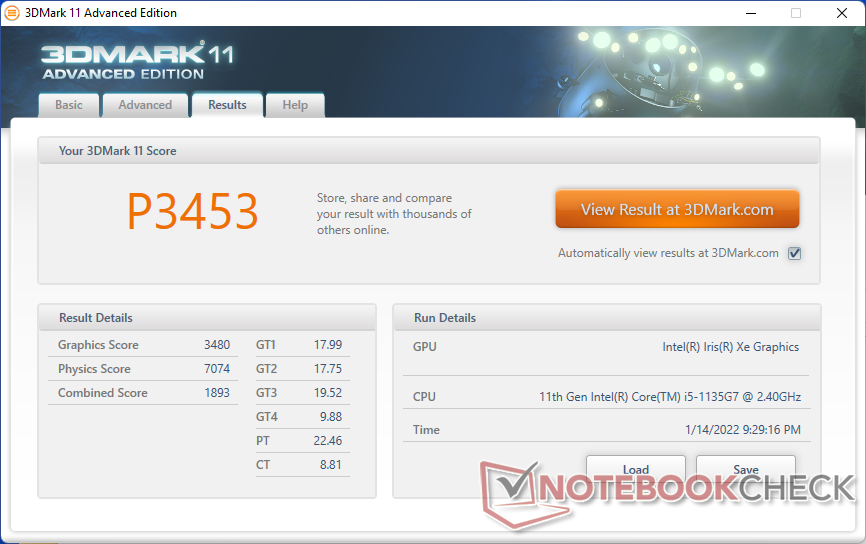
| 3DMark 11 Performance | 3453 punti | |
| 3DMark Cloud Gate Standard Score | 11341 punti | |
| 3DMark Fire Strike Score | 1680 punti | |
| 3DMark Time Spy Score | 865 punti | |
Aiuto | ||
Witcher 3 FPS Chart
| basso | medio | alto | ultra | |
|---|---|---|---|---|
| GTA V (2015) | 37.2 | 28.9 | 7.81 | 3.07 |
| The Witcher 3 (2015) | 33.5 | 22.6 | 10.9 | 6.8 |
| Dota 2 Reborn (2015) | 74.7 | 49.2 | 23.5 | 22.2 |
| Final Fantasy XV Benchmark (2018) | 16.7 | 8.11 | 6.38 | |
| X-Plane 11.11 (2018) | 18.4 | 15.8 | 15.4 | |
| Far Cry 5 (2018) | 17 | 9 | 8 | 8 |
| Strange Brigade (2018) | 36.7 | 13.6 | 11.9 |
Emissioni
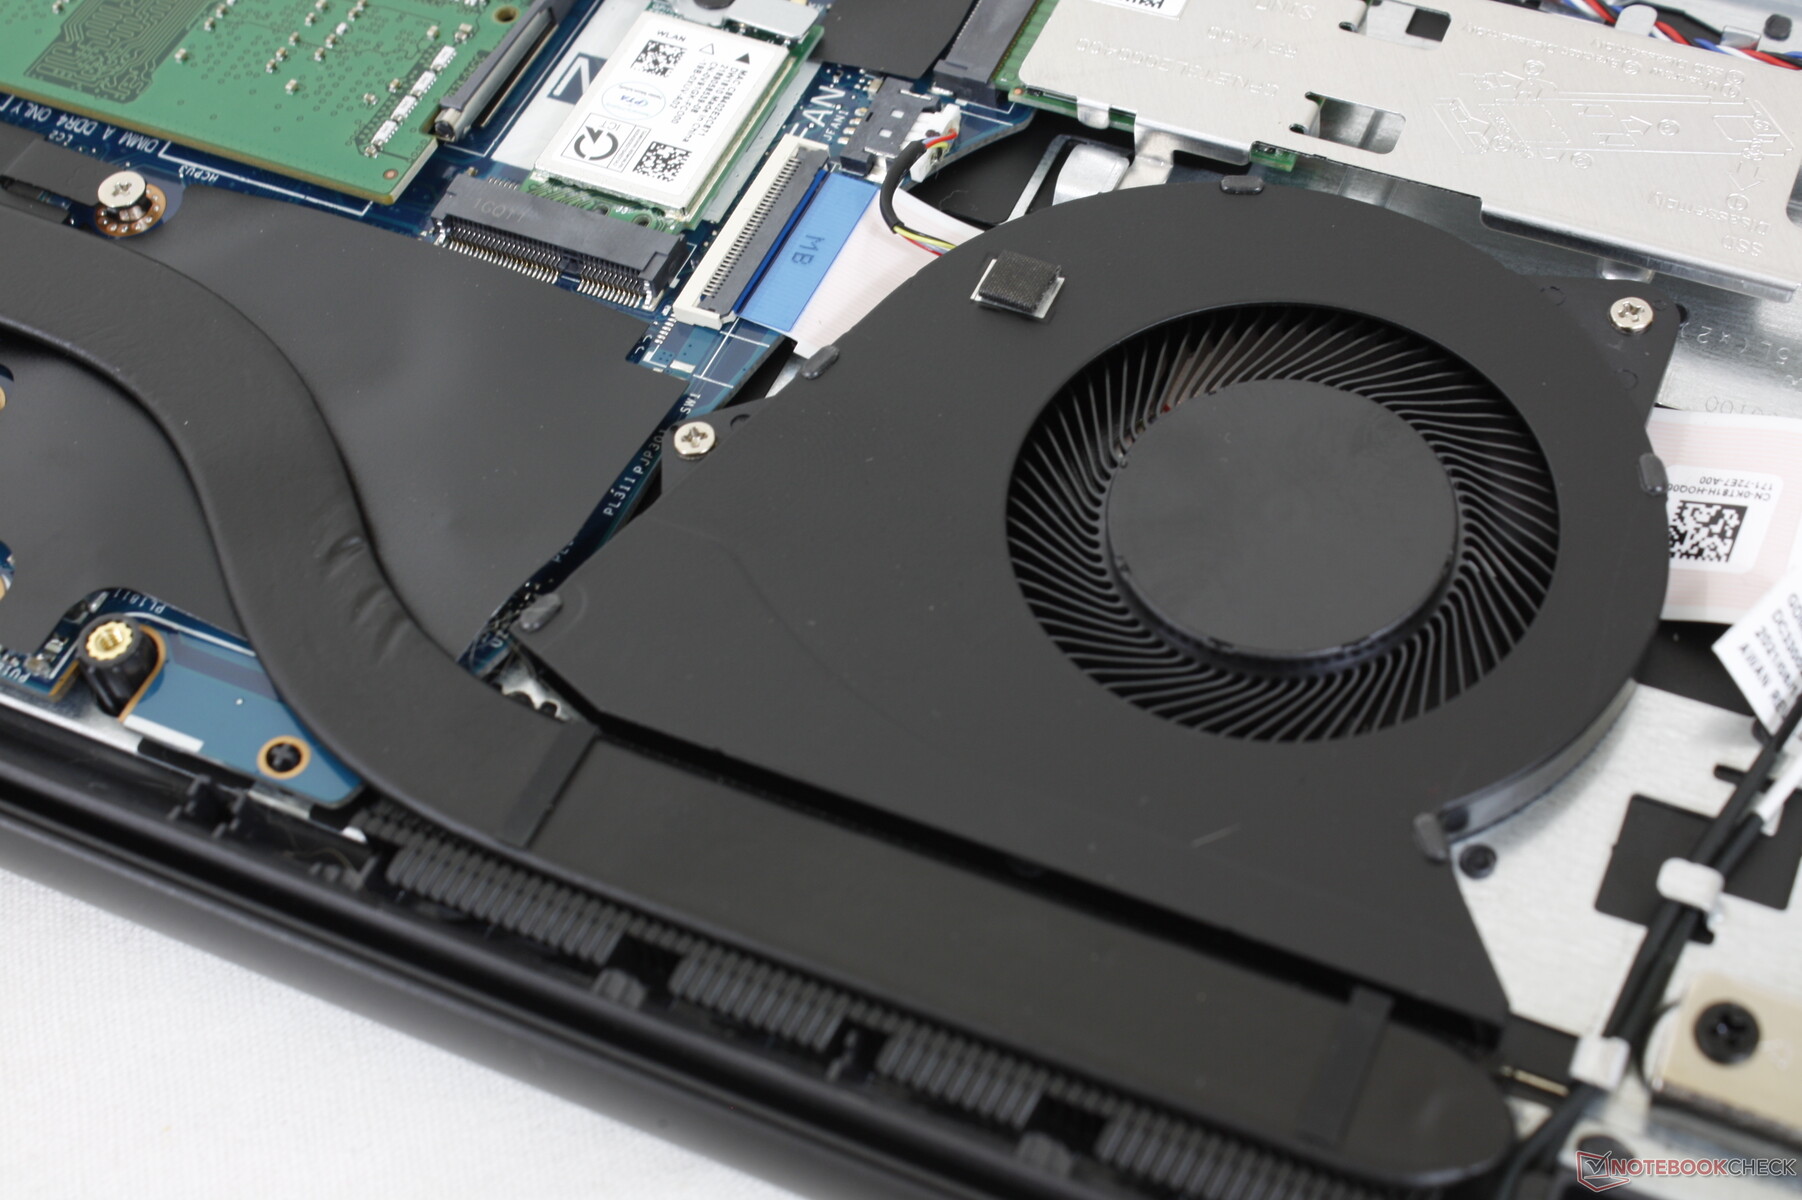
Rumore di sistema
Il sistema è molto silenzioso sotto la maggior parte dei carichi quotidiani come la navigazione web o lo streaming video. Infatti, è in grado di rimanere quasi silenzioso per molto più tempo del previsto. La ventola interna rimarrebbe inattiva anche dopo aver eseguito la prima scena di benchmark di 3DMark 06, cosa che non accade molto spesso nella maggior parte degli altri portatili.
L'esecuzione di giochi per periodi prolungati causerebbe alla fine la stabilizzazione della ventola a 31,5 dB(A). Se la CPU viene sollecitata ulteriormente, il rumore della ventola arriva a quasi 40 dB(A), che sarebbe comunque più silenzioso della maggior parte delle alternative come l'Asus VivoBook S15 o ilLenovo IdeaPad 3 15.
Rumorosità
| Idle |
| 23.3 / 23.3 / 23.3 dB(A) |
| Sotto carico |
| 23.3 / 39.2 dB(A) |
 | ||
30 dB silenzioso 40 dB(A) udibile 50 dB(A) rumoroso |
||
min: | ||
| Dell Inspiron 15 3000 3511 Iris Xe G7 80EUs, i5-1135G7, SK Hynix BC711 HFM256GD3GX013N | Dell XPS 15 9510 i5 11400H FHD UHD Graphics Xe 16EUs, i5-11400H, Micron 2300 512GB MTFDHBA512TDV | Asus VivoBook S15 D533UA Vega 8, R7 5700U, WDC PC SN530 SDBPNPZ-1T00 | Dell Inspiron 15 3501 Iris Xe G7 96EUs, i7-1165G7, Samsung PM991a MZ9LQ512HBLU-00BD1 | Lenovo IdeaPad 3 15ALC6 Vega 6, R3 5300U, Samsung PM991a MZALQ512HBLU | HP Pavilion 15-eg GeForce MX450, i7-1165G7, Samsung PM991 MZVLQ1T0HALB | |
|---|---|---|---|---|---|---|
| Noise | -5% | -28% | -16% | -14% | -20% | |
| off /ambiente * (dB) | 23.2 | 24.4 -5% | 26 -12% | 26 -12% | 25.2 -9% | 25.4 -9% |
| Idle Minimum * (dB) | 23.3 | 24.4 -5% | 26 -12% | 26 -12% | 25.8 -11% | 25.6 -10% |
| Idle Average * (dB) | 23.3 | 24.4 -5% | 26 -12% | 26 -12% | 25.8 -11% | 25.6 -10% |
| Idle Maximum * (dB) | 23.3 | 24.4 -5% | 28.8 -24% | 26 -12% | 25.8 -11% | 25.6 -10% |
| Load Average * (dB) | 23.3 | 26.1 -12% | 45 -93% | 35.9 -54% | 32.3 -39% | 39.2 -68% |
| Witcher 3 ultra * (dB) | 31.5 | 33.2 -5% | 32 -2% | 39.1 -24% | ||
| Load Maximum * (dB) | 39.2 | 37.7 4% | 45 -15% | 35.8 9% | 44 -12% | 41.5 -6% |
* ... Meglio usare valori piccoli
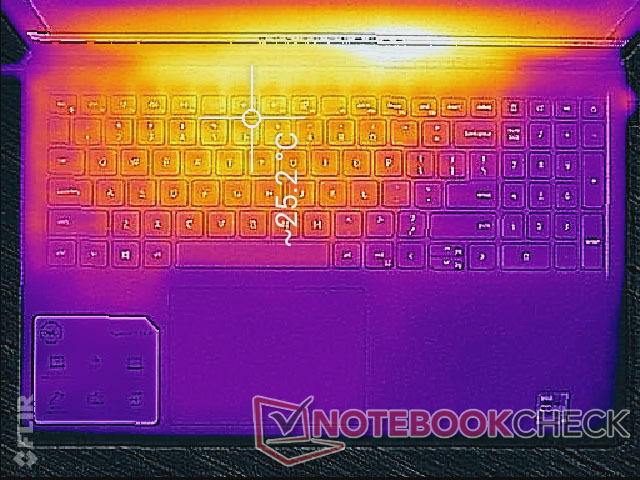
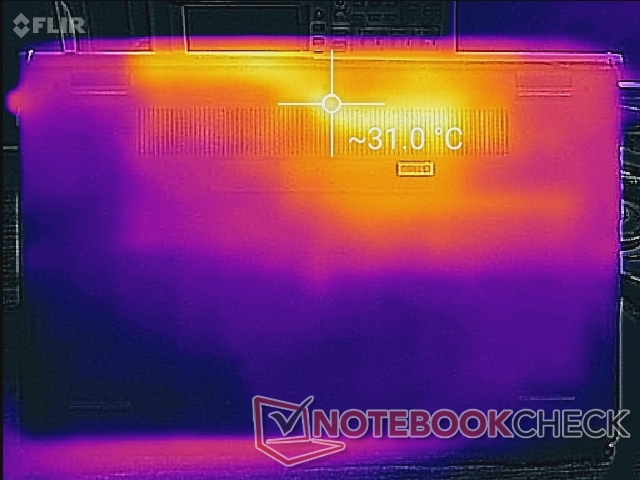
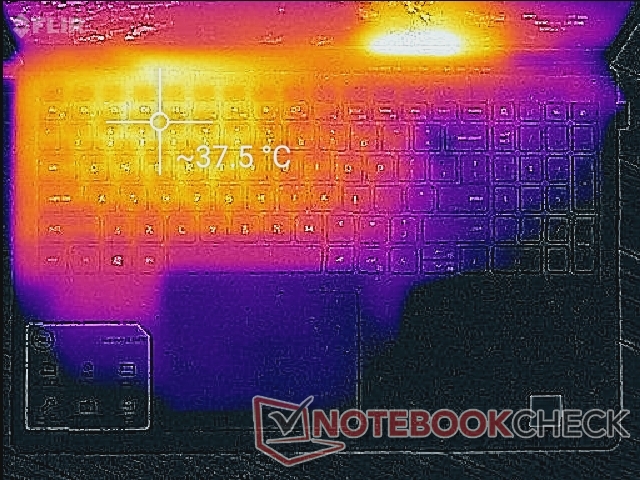
Temperatura
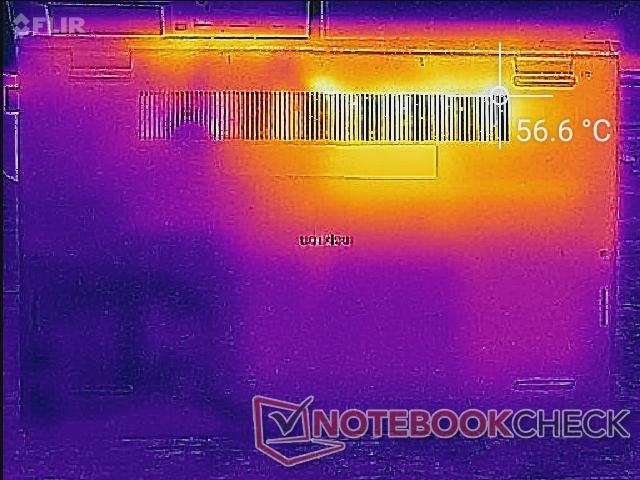
I punti caldi sono concentrati verso la parte posteriore del sistema dove sono posizionati il processore e la sua soluzione di raffreddamento. Le temperature possono raggiungere fino a 38 C e 57 C sulla parte superiore e inferiore del portatile, rispettivamente, rispetto ai soli 31 C e 43 C del Lenovo IdeaPad 3 15. Il poggiapolsi e la maggior parte della tastiera saranno sempre molto più freschi per un uso confortevole a prescindere dal carico.
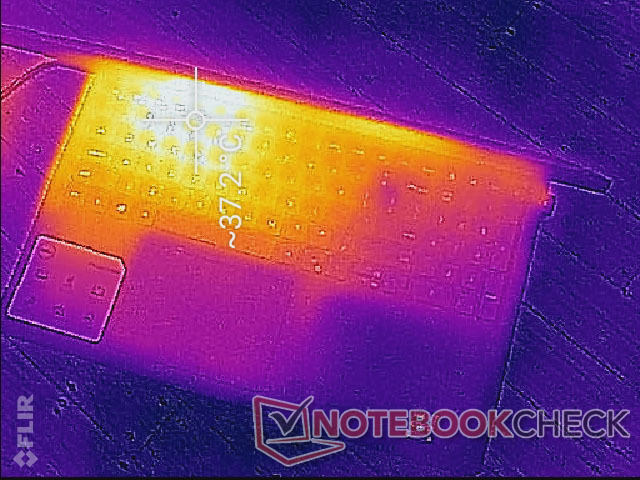
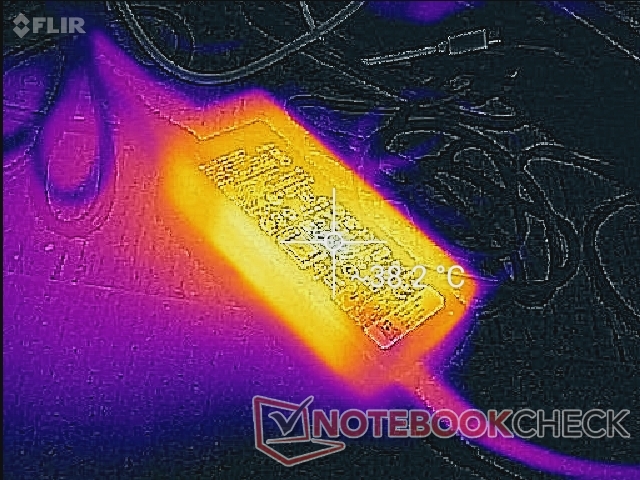
(+) La temperatura massima sul lato superiore è di 37.8 °C / 100 F, rispetto alla media di 34.3 °C / 94 F, che varia da 21.2 a 62.5 °C per questa classe Office.
(-) Il lato inferiore si riscalda fino ad un massimo di 55.6 °C / 132 F, rispetto alla media di 36.8 °C / 98 F
(+) In idle, la temperatura media del lato superiore è di 21.8 °C / 71 F, rispetto alla media deld ispositivo di 29.5 °C / 85 F.
(+) I poggiapolsi e il touchpad sono piu' freddi della temperatura della pelle con un massimo di 20.6 °C / 69.1 F e sono quindi freddi al tatto.
(+) La temperatura media della zona del palmo della mano di dispositivi simili e'stata di 27.5 °C / 81.5 F (+6.9 °C / 12.4 F).
| Dell Inspiron 15 3000 3511 Intel Core i5-1135G7, Intel Iris Xe Graphics G7 80EUs | Dell XPS 15 9510 i5 11400H FHD Intel Core i5-11400H, Intel UHD Graphics Xe 16EUs | Asus VivoBook S15 D533UA AMD Ryzen 7 5700U, AMD Radeon RX Vega 8 (Ryzen 4000/5000) | Dell Inspiron 15 3501 Intel Core i7-1165G7, Intel Iris Xe Graphics G7 96EUs | Lenovo IdeaPad 3 15ALC6 AMD Ryzen 3 5300U, AMD Radeon RX Vega 6 (Ryzen 4000/5000) | HP Pavilion 15-eg Intel Core i7-1165G7, NVIDIA GeForce MX450 | |
|---|---|---|---|---|---|---|
| Heat | 8% | 0% | 2% | 14% | -2% | |
| Maximum Upper Side * (°C) | 37.8 | 42.8 -13% | 46.1 -22% | 45.6 -21% | 31.2 17% | 44 -16% |
| Maximum Bottom * (°C) | 55.6 | 41.2 26% | 46.6 16% | 41 26% | 43 23% | 53.4 4% |
| Idle Upper Side * (°C) | 26.2 | 25.8 2% | 27.4 -5% | 28.2 -8% | 24.8 5% | 27.4 -5% |
| Idle Bottom * (°C) | 32 | 26.2 18% | 28.2 12% | 29.1 9% | 28.2 12% | 28.8 10% |
* ... Meglio usare valori piccoli
Test di stress
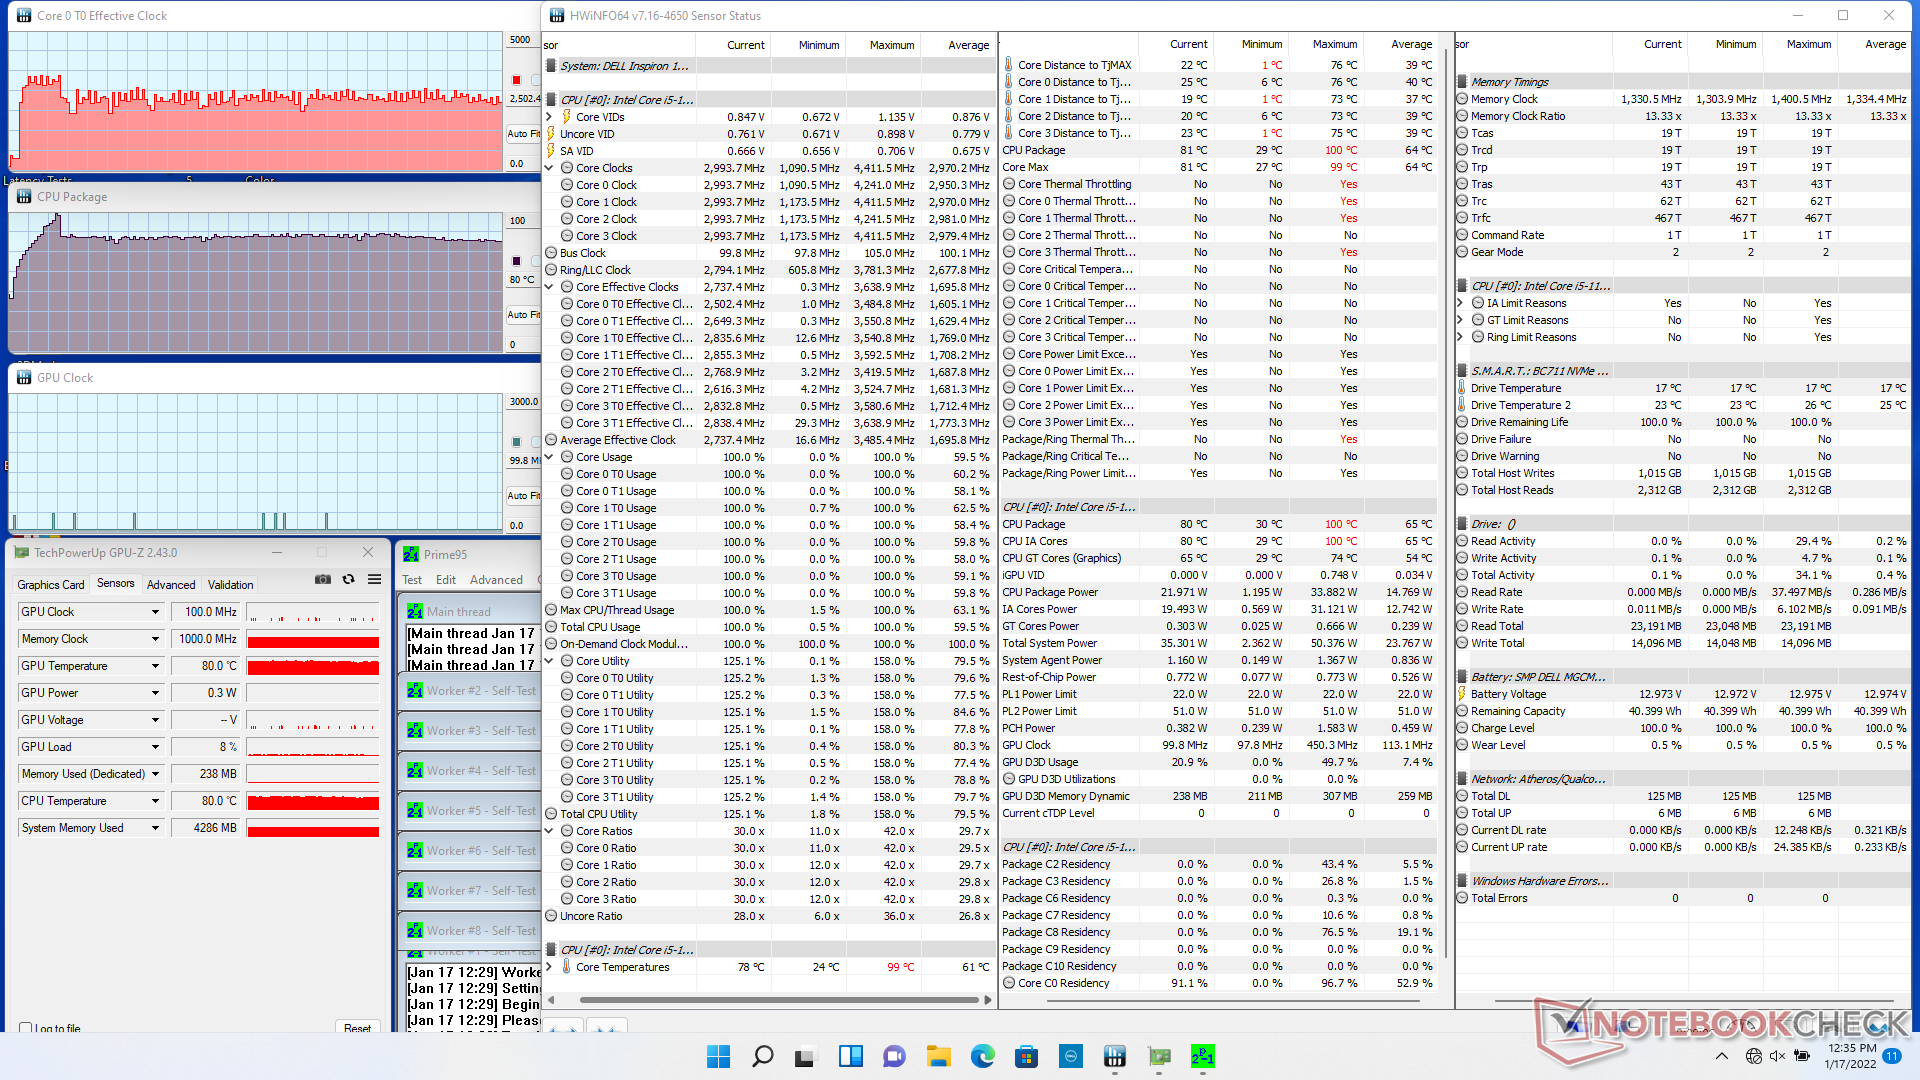
L'esecuzione di Prime95 provoca un picco della CPU a 3,5 GHz per i primi secondi fino a quando la sua temperatura interna raggiunge i 100 C. Le frequenze di clock scendono rapidamente a 2,5-2,8 GHz per mantenere una temperatura più fredda di 80 C. La potenza del pacchetto CPU raggiunge un picco di circa 34 W durante l'inizio del test prima di stabilizzarsi a 22 W. L'esecuzione dello stesso test sul Core i7 Asus Vivobook 15 K513EQ risulterebbe invece in una frequenza di clock costante più alta di 3,1 GHz.
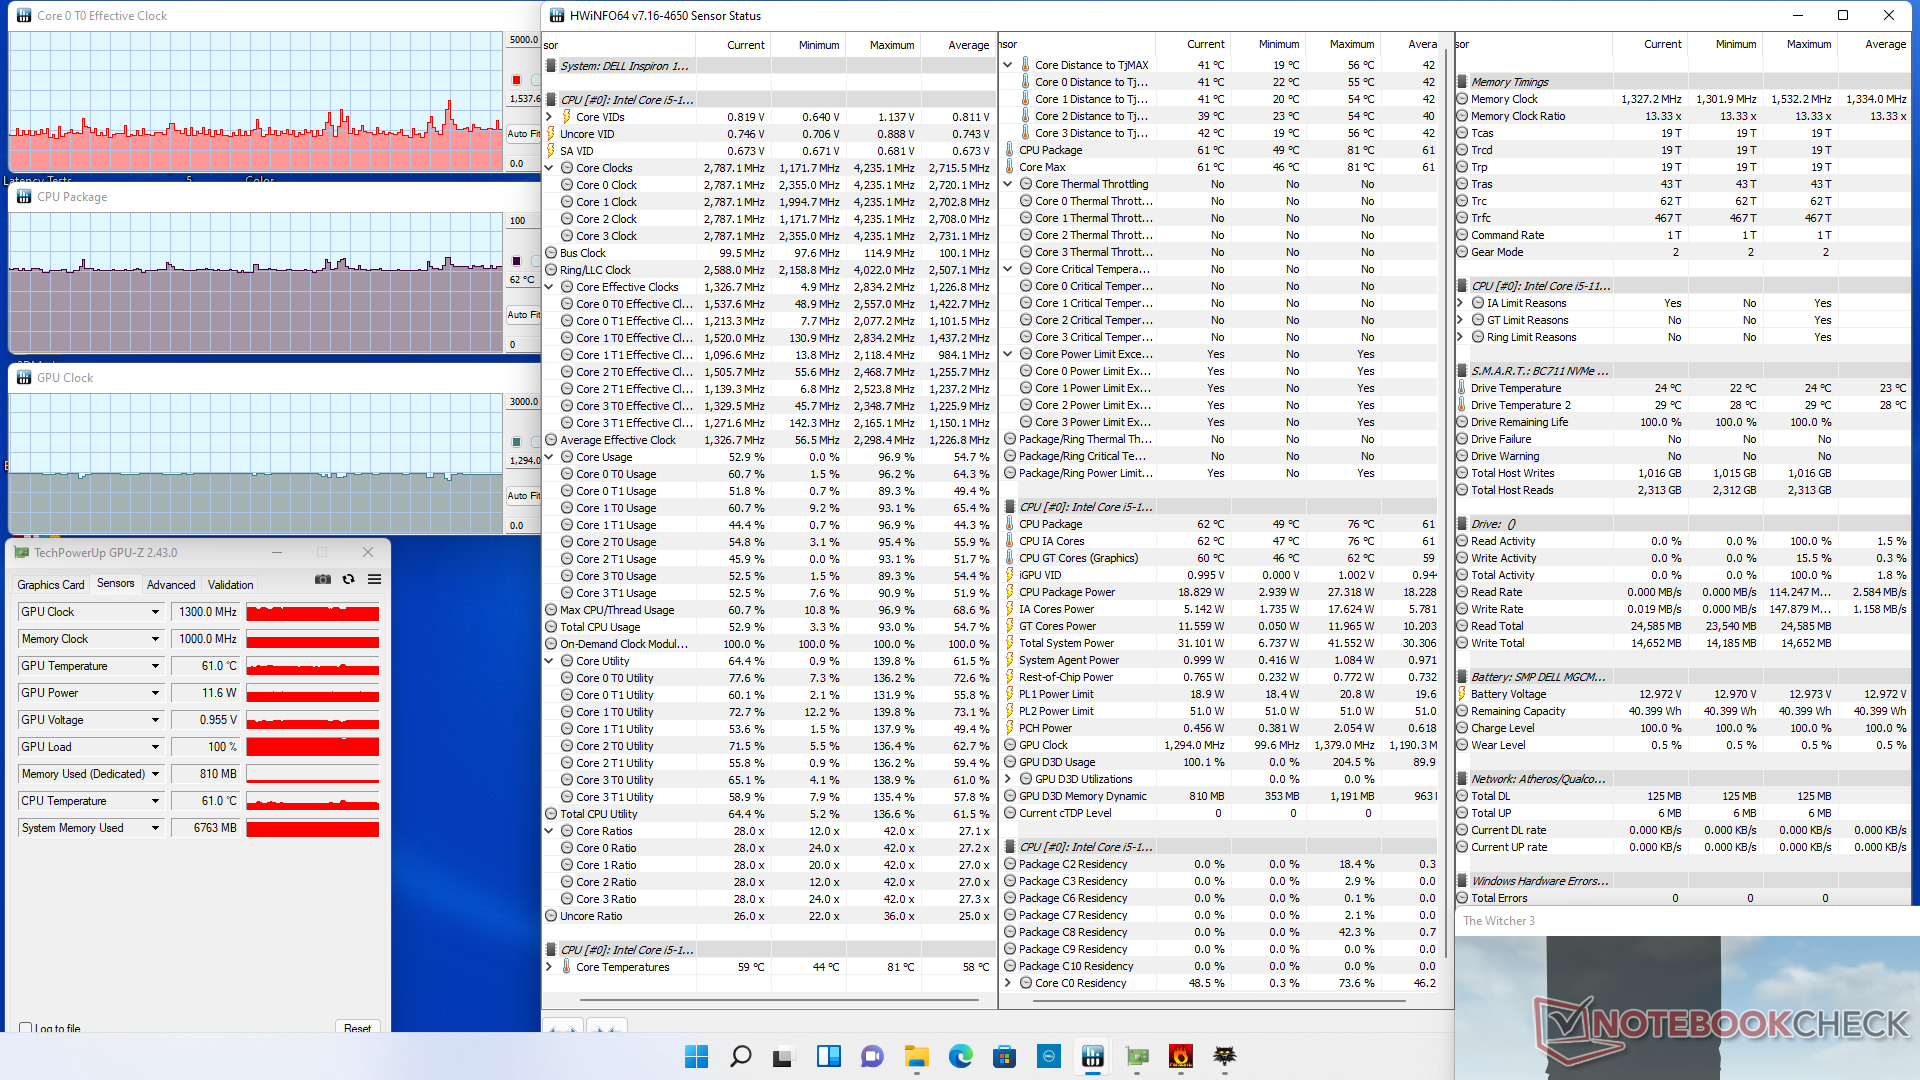
La CPU si stabilizzerebbe a 62 C quando funziona Witcher 3 a rappresentare carichi pesanti rispetto ai 57 C del Lenovo IdeaPad 3 15ALC6 alimentato da AMD.
L'alimentazione a batteria non limita le prestazioni. i punteggi di 3DMark 11 rimarrebbero essenzialmente identici tra l'alimentazione a batteria e quella con adattatore CA.
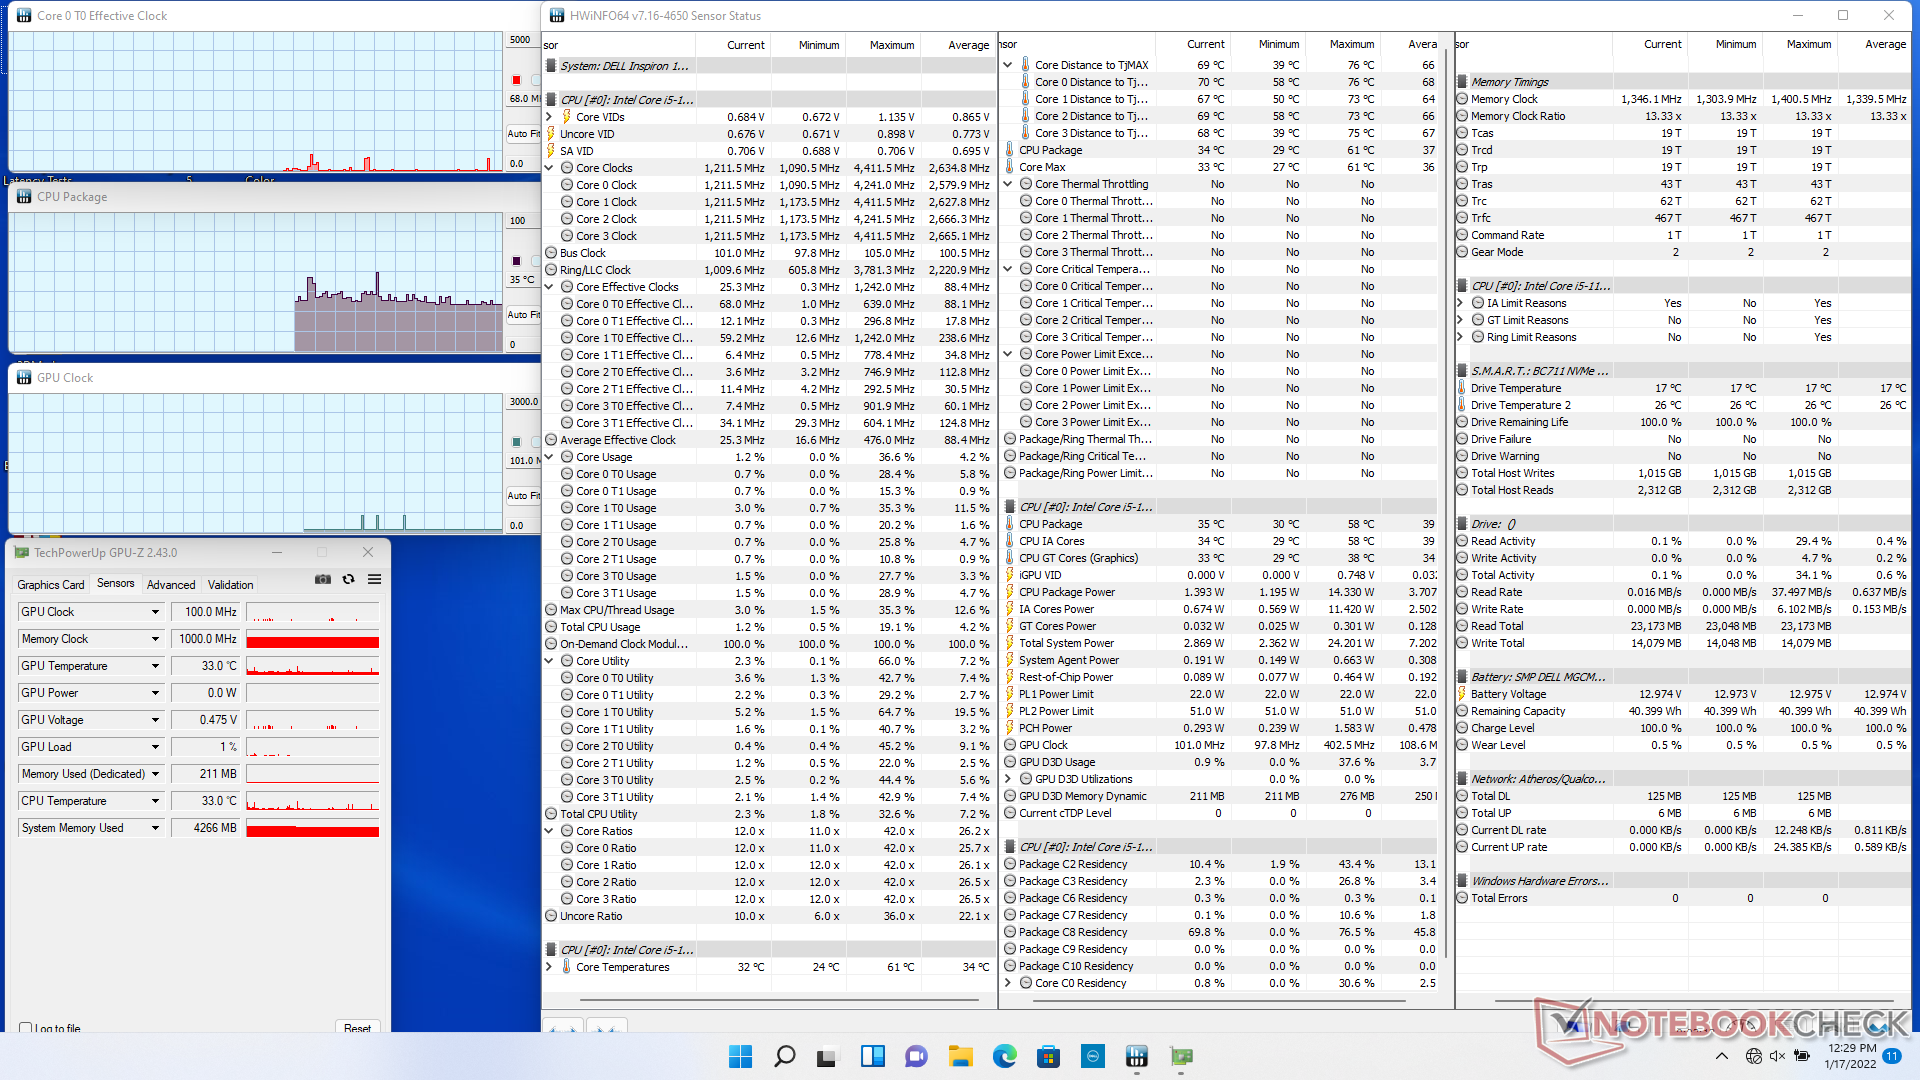
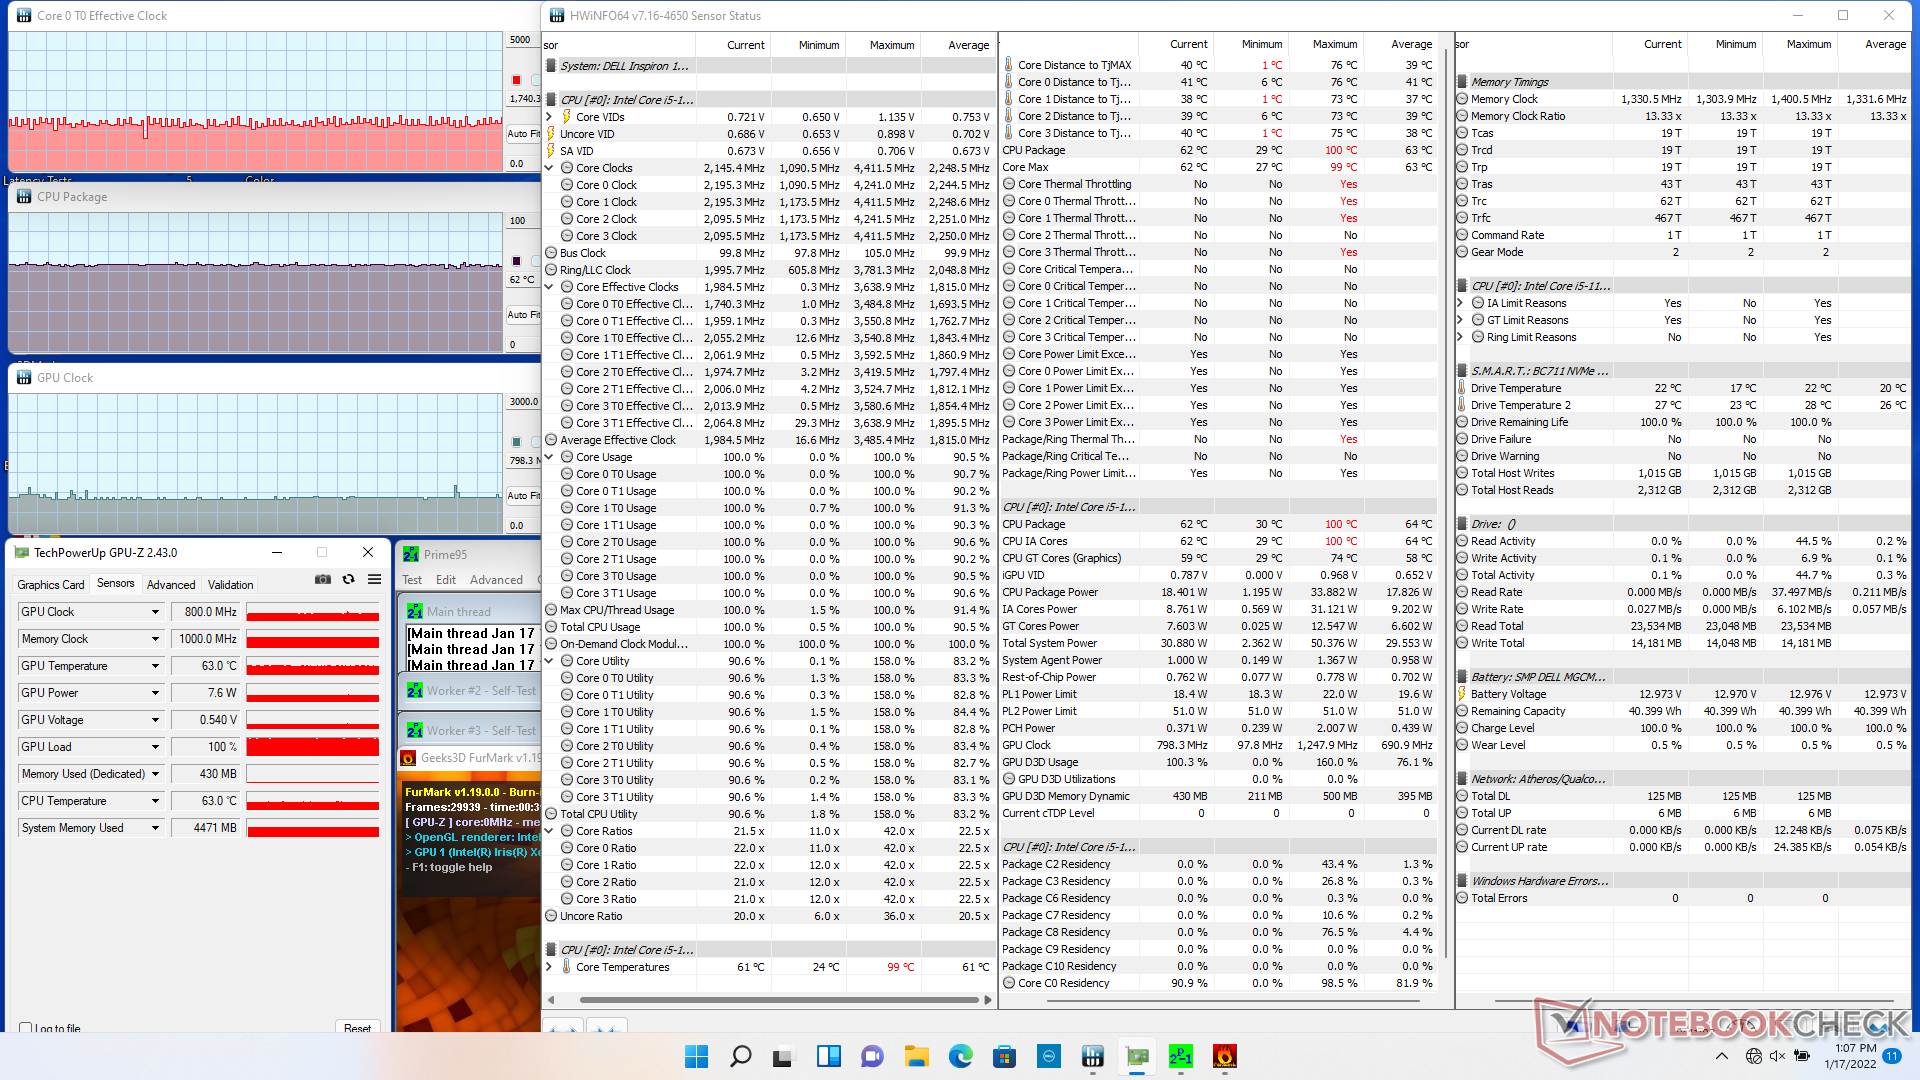
| Clock della CPU (GHz) | Clock della GPU (MHz) | Temperatura media della CPU (°C) | |
| Sistema inattivo | -- | -- | 35 |
| Prime95 Stress | 2.5 - 2.8 | -- | 80 |
| Prime95 + FurMark Stress | 1.4 - 1.7 | 800 | 62 |
| Witcher 3 Stress | ~1.5 | 1300 | 62 |
Altoparlanti
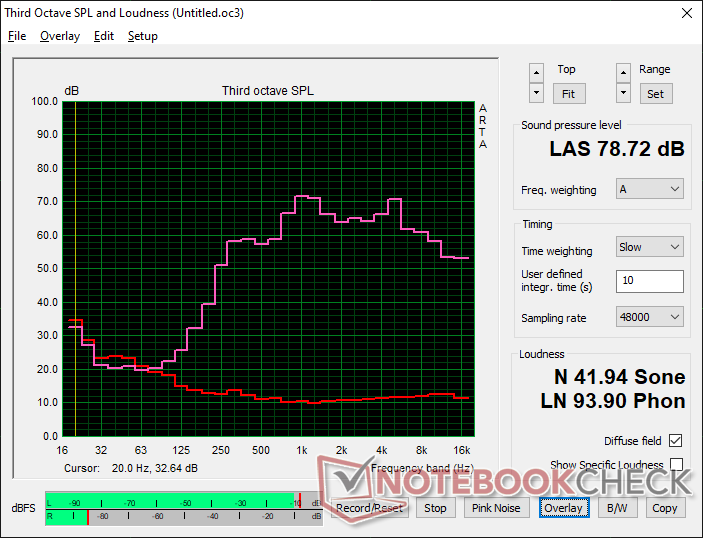
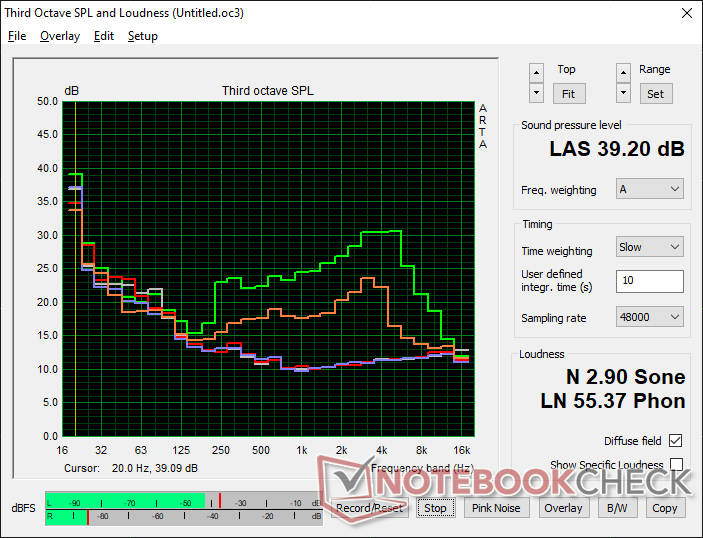
Dell Inspiron 15 3000 3511 analisi audio
(±) | potenza degli altiparlanti media ma buona (78.7 dB)
Bassi 100 - 315 Hz
(-) | quasi nessun basso - in media 20.8% inferiori alla media
(±) | la linearità dei bassi è media (13.3% delta rispetto alla precedente frequenza)
Medi 400 - 2000 Hz
(±) | medi elevati - circa 5.8% superiore alla media
(+) | medi lineari (6.4% delta rispetto alla precedente frequenza)
Alti 2 - 16 kHz
(±) | alti elevati - circa 5.2% superiori alla media
(+) | alti lineari (6.4% delta rispetto alla precedente frequenza)
Nel complesso 100 - 16.000 Hz
(±) | la linearità complessiva del suono è media (21.6% di differenza rispetto alla media
Rispetto alla stessa classe
» 54% di tutti i dispositivi testati in questa classe è stato migliore, 9% simile, 37% peggiore
» Il migliore ha avuto un delta di 7%, medio di 21%, peggiore di 53%
Rispetto a tutti i dispositivi testati
» 61% di tutti i dispositivi testati in questa classe è stato migliore, 7% similare, 32% peggiore
» Il migliore ha avuto un delta di 4%, medio di 23%, peggiore di 134%
Apple MacBook Pro 16 2021 M1 Pro analisi audio
(+) | gli altoparlanti sono relativamente potenti (84.7 dB)
Bassi 100 - 315 Hz
(+) | bassi buoni - solo 3.8% dalla media
(+) | bassi in lineaa (5.2% delta rispetto alla precedente frequenza)
Medi 400 - 2000 Hz
(+) | medi bilanciati - solo only 1.3% rispetto alla media
(+) | medi lineari (2.1% delta rispetto alla precedente frequenza)
Alti 2 - 16 kHz
(+) | Alti bilanciati - appena 1.9% dalla media
(+) | alti lineari (2.7% delta rispetto alla precedente frequenza)
Nel complesso 100 - 16.000 Hz
(+) | suono nel complesso lineare (4.6% differenza dalla media)
Rispetto alla stessa classe
» 0% di tutti i dispositivi testati in questa classe è stato migliore, 0% simile, 100% peggiore
» Il migliore ha avuto un delta di 5%, medio di 17%, peggiore di 45%
Rispetto a tutti i dispositivi testati
» 0% di tutti i dispositivi testati in questa classe è stato migliore, 0% similare, 100% peggiore
» Il migliore ha avuto un delta di 4%, medio di 23%, peggiore di 134%
Gestione dell'energia
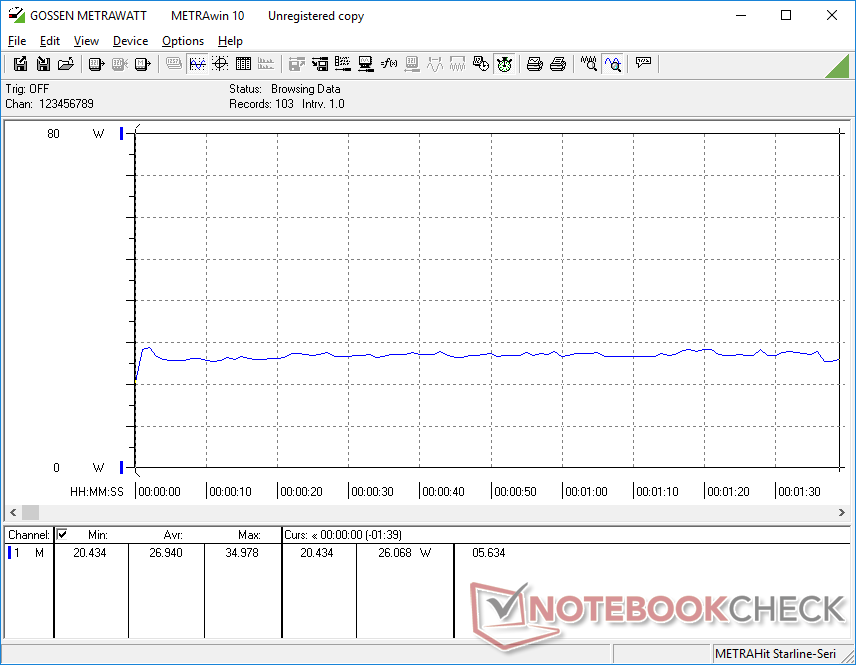
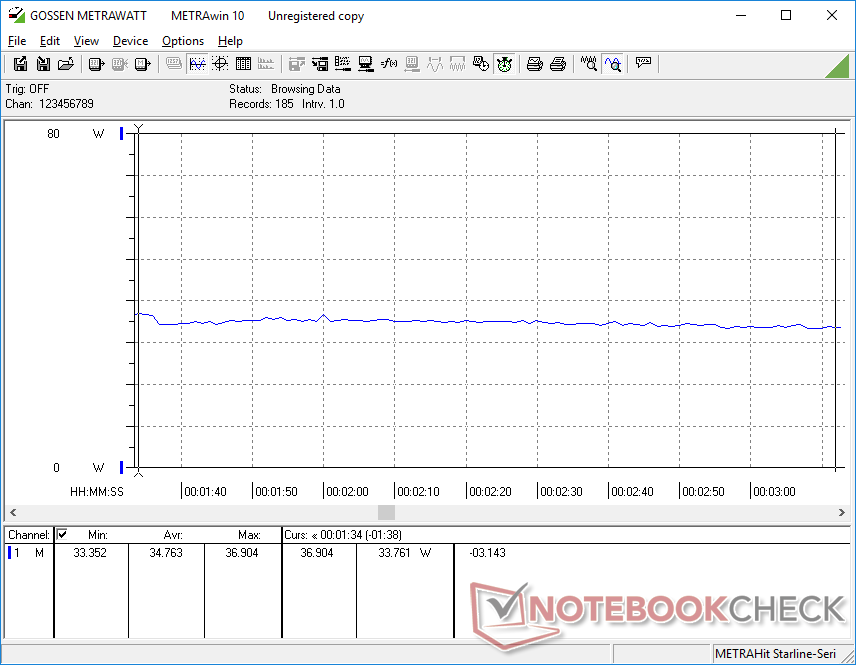
Consumo di energia
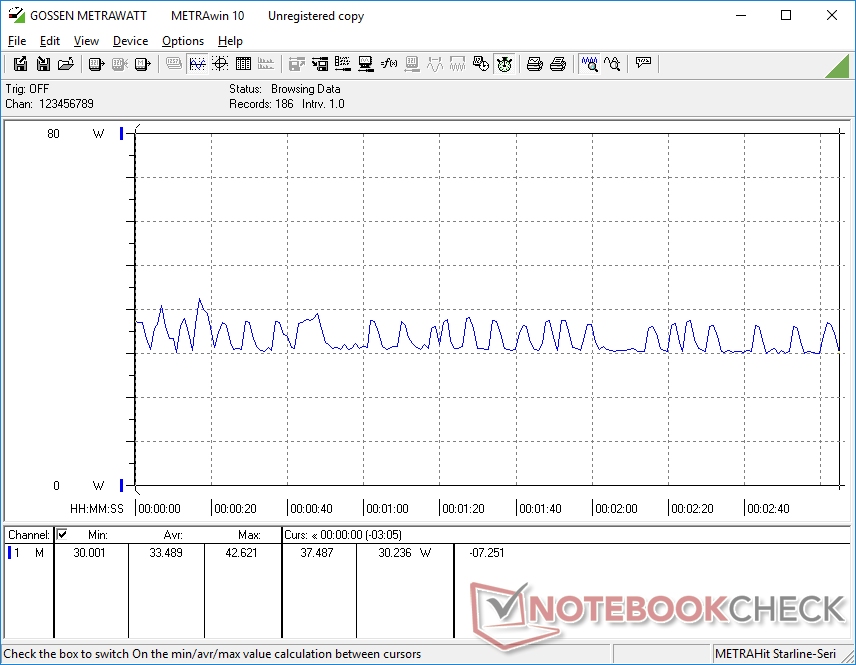
L'inattività sul desktop disegna tra i 3 W e i 7 W per essere più efficiente del previsto rispetto ad altri portatili da 15.6 pollici che girano con CPU della serie U. È interessante notare che il consumo di energia non è costante quando si esegue Witcher 3il sistema si muove tra i 30 W e i 42 W anche se i frame rate sembrano essere costanti
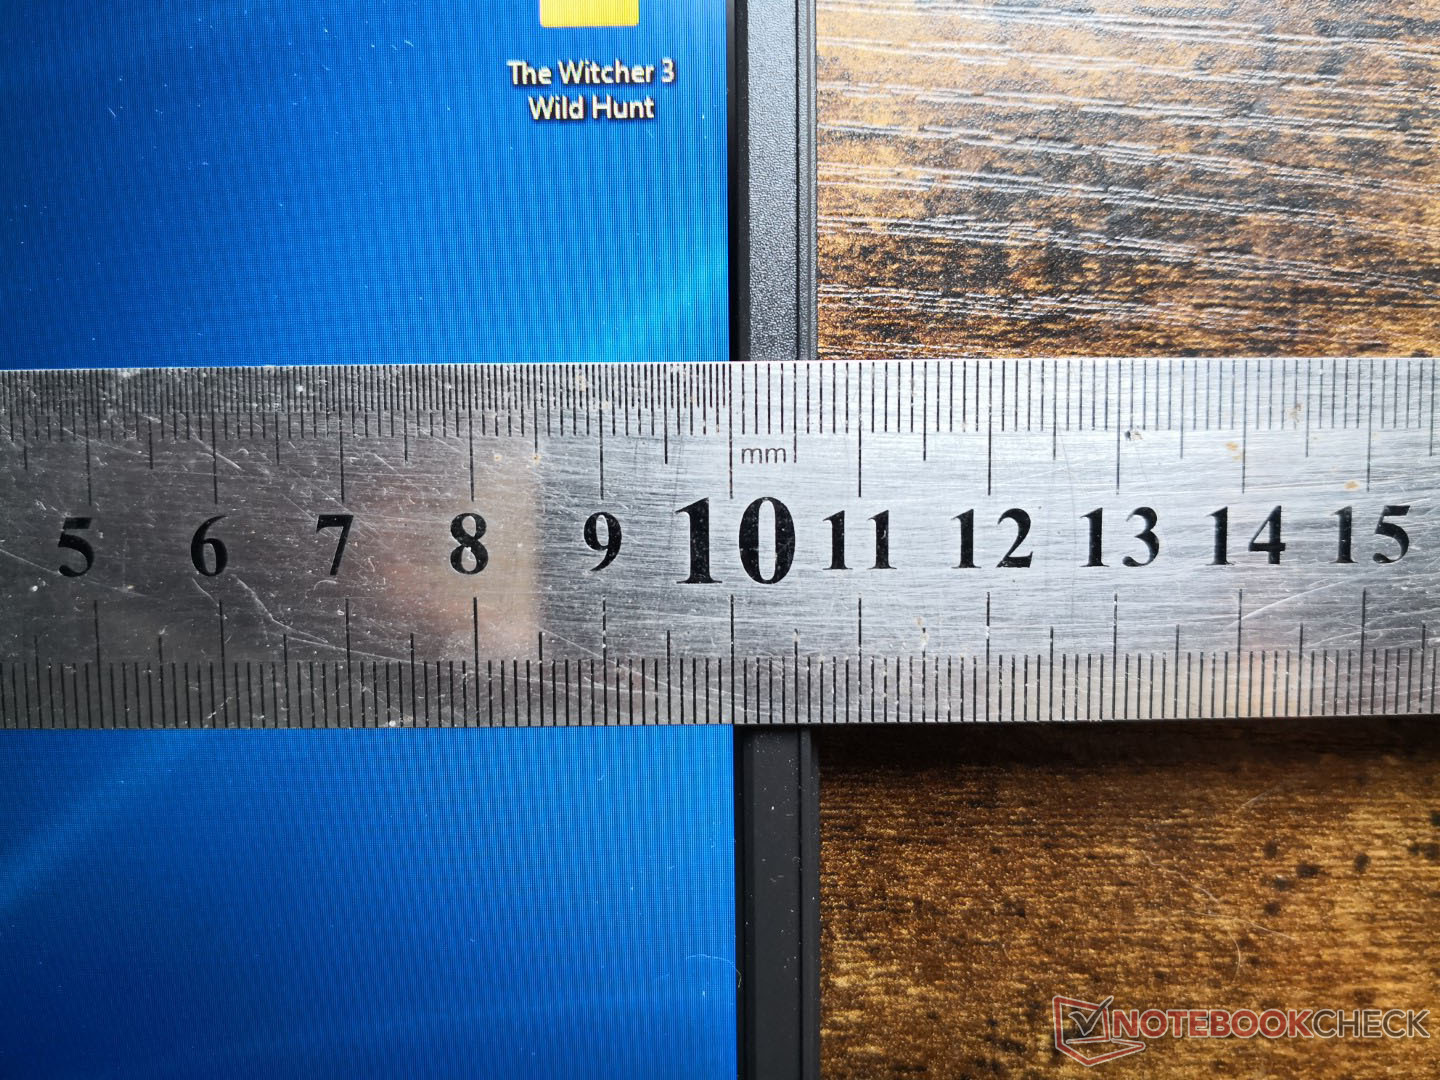
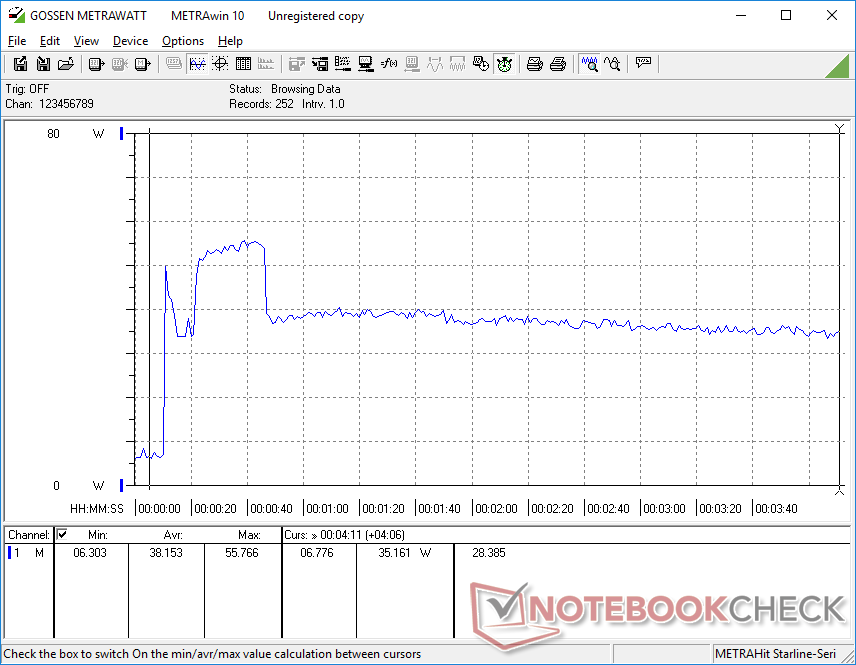
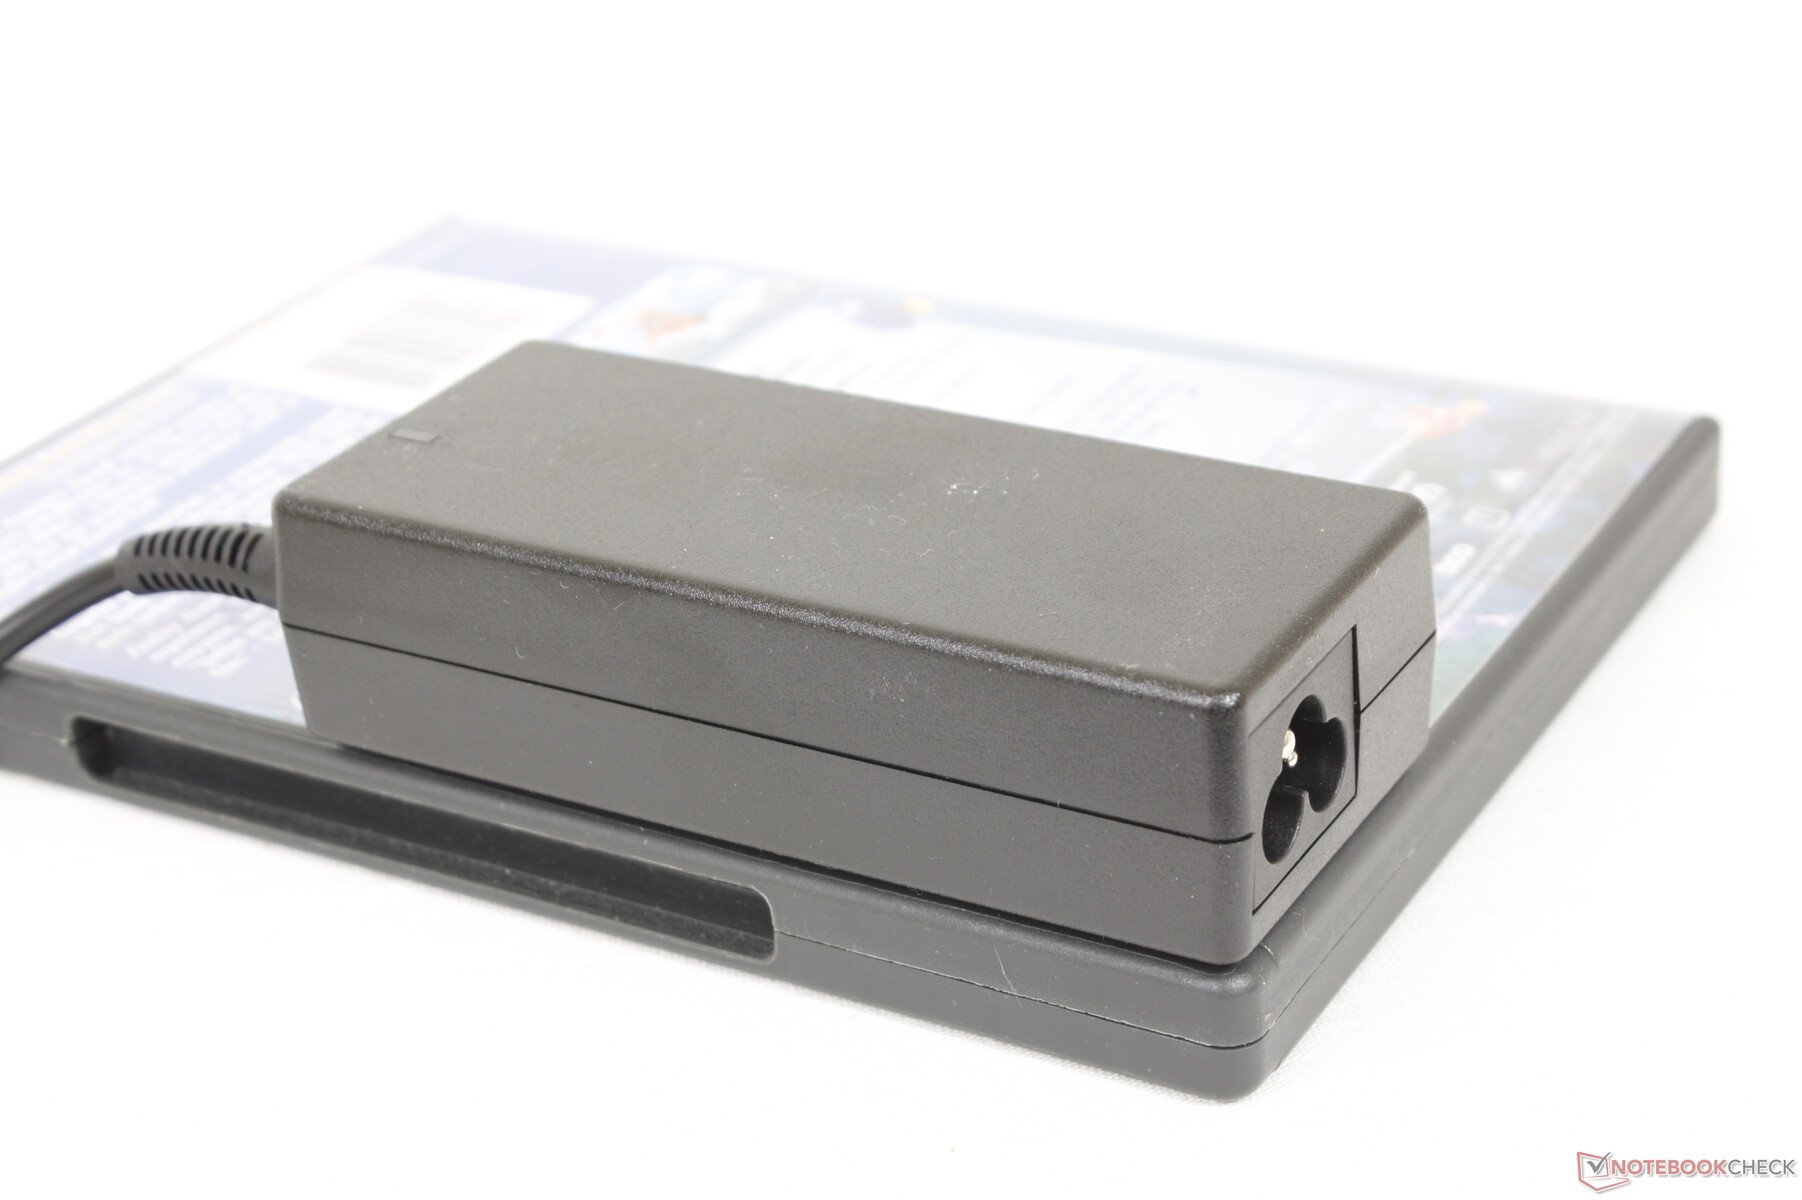
Siamo in grado di registrare un massimo di 56 W dal piccolo (~10,6 x 4,5 x 2,8 cm) adattatore AC da 65 W quando si eseguono carichi estremi dove la CPU raggiunge il 100% di utilizzo. Questo prelievo è solo temporaneo, come mostrato dal nostro grafico qui sotto.
| Off / Standby | |
| Idle | |
| Sotto carico |
|
Leggenda:
min: | |
| Dell Inspiron 15 3000 3511 i5-1135G7, Iris Xe G7 80EUs, SK Hynix BC711 HFM256GD3GX013N, IPS, 1920x1080, 15.6" | Dell XPS 15 9510 i5 11400H FHD i5-11400H, UHD Graphics Xe 16EUs, Micron 2300 512GB MTFDHBA512TDV, IPS, 1920x1200, 15.6" | Asus VivoBook S15 D533UA R7 5700U, Vega 8, WDC PC SN530 SDBPNPZ-1T00, IPS, 1920x1080, 15.6" | Dell Inspiron 15 3501 i7-1165G7, Iris Xe G7 96EUs, Samsung PM991a MZ9LQ512HBLU-00BD1, IPS, 1920x1080, 15.6" | Lenovo IdeaPad 3 15ALC6 R3 5300U, Vega 6, Samsung PM991a MZALQ512HBLU, IPS, 1920x1080, 15.6" | HP Pavilion 15-eg i7-1165G7, GeForce MX450, Samsung PM991 MZVLQ1T0HALB, IPS, 1920x1080, 15.6" | |
|---|---|---|---|---|---|---|
| Power Consumption | -38% | -48% | -14% | -20% | -74% | |
| Idle Minimum * (Watt) | 3.1 | 5.3 -71% | 5 -61% | 3.6 -16% | 5.6 -81% | 4.9 -58% |
| Idle Average * (Watt) | 5.6 | 9 -61% | 7.7 -38% | 6.4 -14% | 6 -7% | 7.9 -41% |
| Idle Maximum * (Watt) | 6.4 | 9.7 -52% | 12.2 -91% | 7.9 -23% | 7 -9% | 14.2 -122% |
| Load Average * (Watt) | 26.9 | 30.3 -13% | 41 -52% | 39 -45% | 34.9 -30% | 64.3 -139% |
| Witcher 3 ultra * (Watt) | 33.5 | 30.6 9% | 43 -28% | 37.6 -12% | 32.5 3% | 55.6 -66% |
| Load Maximum * (Watt) | 55.8 | 76.2 -37% | 65 -16% | 41.8 25% | 52.1 7% | 65.4 -17% |
* ... Meglio usare valori piccoli
Power Consumption Witcher 3 / Stresstest
Power Consumption external Monitor
Durata della batteria
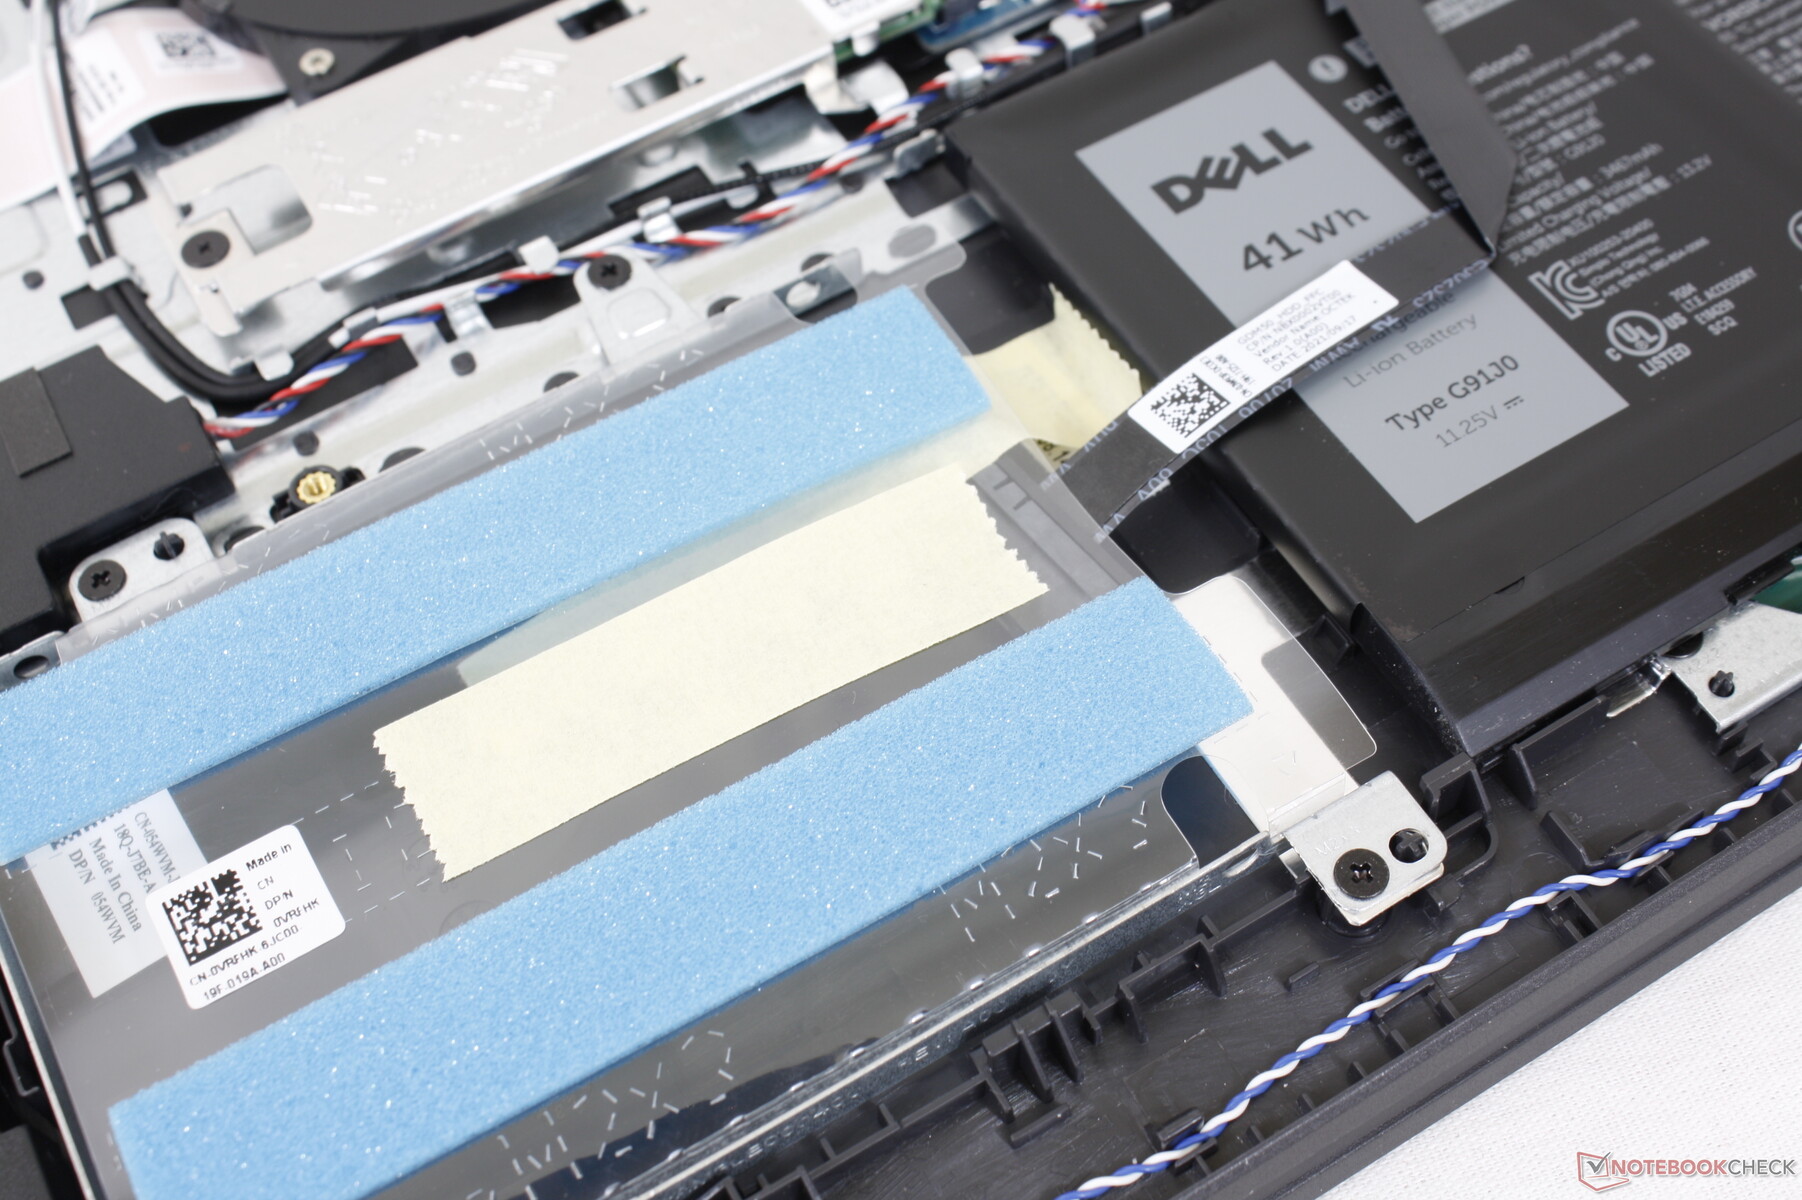
Aspettatevi circa 6,5 ore di uso reale della WLAN prima di dover ricaricare la batteria interna da 40 Wh. I risultati sono in qualche modo paragonabili a quelli dell'HP Pavilion 15-eg che è anche dotato di una batteria di dimensioni simili.
La ricarica da vuoto a pieno richiede circa 2 ore con l'adattatore AC incluso.
| Dell Inspiron 15 3000 3511 i5-1135G7, Iris Xe G7 80EUs, 40 Wh | Dell XPS 15 9510 i5 11400H FHD i5-11400H, UHD Graphics Xe 16EUs, 56 Wh | Asus VivoBook S15 D533UA R7 5700U, Vega 8, 50 Wh | Dell Inspiron 15 3501 i7-1165G7, Iris Xe G7 96EUs, 42 Wh | Lenovo IdeaPad 3 15ALC6 R3 5300U, Vega 6, 45 Wh | HP Pavilion 15-eg i7-1165G7, GeForce MX450, 41 Wh | |
|---|---|---|---|---|---|---|
| Autonomia della batteria | 16% | 41% | 6% | 48% | 4% | |
| Reader / Idle (h) | 12.8 | 20.1 57% | 15 17% | |||
| WiFi v1.3 (h) | 6.4 | 7.4 16% | 9 41% | 6.8 6% | 10.5 64% | 6.6 3% |
| Load (h) | 1.3 | 1.6 23% | 1.2 -8% |
Pro
Contro
Verdetto
Il nostro aspetto preferito dell'Inspiron 15 3511 è quanto sia facilmente riparabile. I modelli economici tendono a dissuadere gli aggiornamenti degli utenti finali rendendo i loro pannelli inferiori difficili da rimuovere o nascondendo le viti sotto i piedi di gomma. Il fatto che il nostro Inspiron ospita 2 slot SODIMM e 2 alloggiamenti per lo storage significa che i proprietari possono semplicemente comprare una configurazione di fascia bassa e poi aggiungere più RAM o storage per risparmiare sui costi. La RAM a singolo canale sulla nostra unità di test in particolare ha un impatto significativo sulle prestazioni grafiche di Iris Xe e quindi è altamente raccomandato aggiungere un altro modulo per aumentare le prestazioni della GPU.
Il rumore della ventola, o la sua mancanza, è un altro aspetto degno di lode. Il sistema è in grado di rimanere più silenzioso della maggior parte degli altri Ultrabook anche quando si eseguono carichi più esigenti. Ricordate che il modello utilizza le stesse CPU Core i5 e Core i7 dell'undicesima generazione della serie XPS 13 che costa il doppio.
L'Inspiron 15 3511 è forse uno dei portatili economici più facili da riparare e aggiornare. Le prestazioni per dollaro sono alte, ma dovrete superare il design dello chassis non proprio stellare.
Quasi tutto il resto del sistema è mediocre dai colori poco profondi, i tasti della tastiera spugnosi, e la sensazione economica dello chassis. Tali inconvenienti sono generalmente giustificabili per un modello di bilancio, ma troviamo ancora incredibilmente strano non vedere una porta USB-C quando quasi tutti gli altri computer portatili di consumo sono inclusi uno in questi giorni.
Prezzo e disponibilità
Dell Inspiron 15 3000 3511
- 01/20/2022 v7 (old)
Allen Ngo
Price comparison

